

Submitted:
28 July 2026
Posted:
30 July 2026
You are already at the latest version
Abstract
Glucagon-like peptide-1 receptor agonists (GLP-1RAs) are increasingly used for type 2 diabetes and obesity, but emerging evidence from randomized trials and real-world anecdotes suggest that neurosensory adverse events merit systematic investigation. We analyzed 670,422 initiators of semaglutide or tirzepatide across a large-scale federated EHR network and ascertained 14 new-onset neurosensory phenotypes over 12 months using AI-assisted clinical-note curation harmonized with ICD-10-CM codes. Among 128,377 at-risk GLP-1RA initiators — new users with at least two prescriptions within 12 months and complete 12-month follow-up, free of any studied phenotype at baseline — 29,519 (23.0%) had at least one newly documented phenotype, most commonly hypoesthesia/numbness in 16,143 patients (12.6%) and paresthesia in 15,415 patients (12.0%). Outcome ascertainment was validated by physician-led curation, with the review of 223 AI-identified events yielding a positive predictive value of 88.8% (95% CI, 84.0–92.3). In propensity-score–matched analyses, GLP-1RA initiators were associated with a 23% lower risk than initiators of the antidiabetic medications metformin, dipeptidyl-peptidase-4 (DPP-4) inhibitors, or sodium-glucose co-transporter-2 (SGLT2) inhibitors (19.7% versus 25.6%; RR, 0.77; 95% CI, 0.75–0.79; q<0.001), with significantly lower risks of hypoesthesia, paresthesia, radiculopathy or sciatica, polyneuropathy, mononeuropathy and painful dysesthesia. GLP-1RA initiators also had a 22% lower associated risk than bariatric-surgery recipients who were additionally matched on achieved weight loss (21.1% versus 27.0%; RR, 0.78; 95% CI, 0.75–0.82; q<0.001). Within GLP-1RA initiators, neurosensory event incidence increased (P for trend<0.001) from 19.3% at a normal HbA1c baseline (<5.7%) to 32.0% for severe hyperglycemics at HbA1c >12%, but showed no ordered association with achieved weight loss (P=0.867), baseline body-mass index (BMI, P=0.784) or BMI reduction (P=0.740). Maximum attained semaglutide/tirzepatide dose was also not enriched among neurosensory event developers in the matched cohort. Taken together, this observational study suggests the hallmark of neurosensory risk after GLP-1RA initiation may be glycemic burden, not the magnitude of achieved weight loss, and emphasizes that population-level neurosensory risk after GLP-1RA initiation was consistently lower than among matched antidiabetic-medication and bariatric-surgery recipients.
Keywords:
semaglutide
; tirzepatide
; GLP-1 receptor agonists
; neurosensory adverse events
; peripheral neuropathy
; paresthesia
; glycemic burden
; real-world evidence
Introduction
Glucagon-like peptide-1 (GLP-1) receptor agonists, including semaglutide and tirzepatide, a dual glucose-dependent insulinotropic (GIP) polypeptide and GLP-1 receptor agonist (GLP-1RA), have become central therapies for type 2 diabetes mellitus and obesity. Their prescription volume has expanded accordingly: among patients with both type 2 diabetes and obesity, GLP-1RA use rose from 2.4% to 34.3% between 2010 and 2024, with semaglutide and tirzepatide driving most of the recent growth[1]. This rapid expansion has transformed uncommon post-treatment observations into potentially consequential population-level safety questions.
Although uncommon, emerging evidence from both randomized trials and real-world safety surveillance suggests that neurosensory adverse events merit systematic investigation rather than consideration as isolated observations[2]. In the placebo-controlled trial OASIS 1 of oral semaglutide 50 mg daily, individual altered-sensation events included dysesthesia, hyperesthesia, neuralgia, skin pain, paresthesia, sensitive skin, and burning sensations, each reported in approximately 1% to 3% of semaglutide recipients[3,4]. A randomized phase 2 trial of subcutaneous semaglutide showed an apparent dose gradient in grouped dysesthesia, occurring in 0%, 8%, and 18% of participants receiving 2, 8, and 16 mg weekly, respectively, as compared with 2% receiving placebo. 19 events occurred in 17 participants, all were mild or moderate, and two prompted treatment withdrawal[5]. The phase 3b of the trial STEP UP subsequently reported dysesthesia in 22.9% of participants receiving semaglutide 7.2 mg, 6.0% receiving 2.4 mg, and 0.5% receiving placebo; the corresponding rates in STEP UP T2D were 18.9%, 4.9%, and 0%, respectively[6,7]. A related placebo-controlled trial of the investigational GIP, GLP-1, and glucagon receptor agonist, retatrutide, reported cutaneous hyperesthesia or skin sensitivity in 7% of treated participants and 1% of placebo recipients[8]. Taken together, these randomized trials provide controlled evidence of a dose-associated altered-sensation signal that is associated with GLP-1RA efficacy in a way that is mechanistically opaque[5].
Pharmacovigilance and case-level evidence has broadened the signal but has not resolved its frequency or mechanism[2,9]. An analysis of the FDA Adverse Event Reporting System identified 28,953 neurological adverse-event reports across exenatide, liraglutide, lixisenatide, dulaglutide, semaglutide, and tirzepatide, with 19 disproportionality signals, including allodynia; the median reported onset was 32 days, and 45.3% of events occurred within 30 days[10]. A complementary VigiBase analysis[2] found signals for hypoesthesia or oral paresthesia with exenatide, hyperesthesia with semaglutide and tirzepatide, and dysesthesia or burning sensation with semaglutide; narrative review suggested dose dependence, improvement after discontinuation, and occasional recurrence after rechallenge[2]. These reporting systems use other submitted reports as the statistical background and do not provide clinically matched control cohorts or incidence estimates[10].
Case reports and case series without unaffected comparator groups have described four patients with allodynia after escalation to semaglutide 2.4 mg, with improvement after discontinuation in two patients and spontaneous resolution despite continuation in one patient[9], semaglutide-associated dysesthesia and recurrent whole-body burning allodynia with tirzepatide[11], and two cases of moderate-to-severe static or dynamic allodynia during higher-dose tirzepatide therapy that resolved after treatment cessation[12]. These observations support temporal and dose-response associations but, without unaffected controls, cannot distinguish a direct drug effect from the metabolic consequences of treatment or the background occurrence of sensory symptoms. As with some reports regarding GLP-1RA use and risk of nonarteritic anterior ischemic optic neuropathy (NAION), case reports have entered clinical awareness before population-level epidemiologic evidence has shed light on the association[9,13].
The focal-neuropathy literature raises a different mechanistic possibility. In the only matched case-control study, 26 patients developed 27 episodes of diabetic lumbosacral radiculoplexus neuropathy after GLP-1RA exposure, with a median onset of 6 months, a median HbA1c reduction of 2.4 percentage points, and median weight loss of 13.9%; 77 patients developed 82 common fibular-neuropathy episodes after a median HbA1c reduction of 1.2 percentage points and weight loss of 15.7%. Relative to controls matched on age, sex, body-mass index, and diabetes status, GLP-1RA exposure was associated with diabetic lumbosacral radiculoplexus neuropathy (OR, 1.5; 95% CI, 1.2 to 1.9; P=0.0008) and common fibular neuropathy (OR, 1.3; 95% CI, 1.0 to 1.5; P=0.018)[14]. A separate uncontrolled series described six patients with diabetic lumbosacral radiculoplexus neuropathy, five with bilateral involvement, after weight losses of 35 to 52 lb and, in most patients, HbA1c reductions exceeding 5 percentage points[15].
Compressive mononeuropathy after rapid pharmacologic weight loss has also emerged repeatedly. Two patients developed bilateral foot drop within 6 to 8 months of tirzepatide initiation[16], two nondiabetic patients developed acute common peroneal neuropathy after losing 14% of body weight with semaglutide and 18% with tirzepatide[17], and additional reports have described common peroneal neuropathy after tirzepatide-associated weight loss, including cases precipitated by habitual leg crossing after loss of protective adipose tissue[18,19,20]. An electrodiagnostic cohort identified five temporally associated cases spanning femoral and fibular neuropathies, median and ulnar entrapments, and sensory polyneuropathy among users of GLP-1RAs or other weight-reducing antihyperglycemic drugs, but did not include an unaffected comparator group or provide drug-specific incidence estimates[21]. Isolated semaglutide reports have additionally described recurrent bilateral brachial plexus neuritis after rapid weight loss[22] and severe axonal polyneuropathy accompanied by thiamine deficiency, Wernicke encephalopathy, and rapid glycemic improvement[23]. Collectively, these reports suggest that direct altered-sensation reactions, rapid glycemic improvement, nutritional deficiency, and weight-loss–associated nerve compression may represent distinct, potentially overlapping contributors to emergence of neurosensory phenotypes[16].
Yet a post-treatment neurosensory event is not necessarily a direct drug effect. Diabetic peripheral neuropathy affects up to half of patients with long-standing diabetes[24], and its onset is not confined to poor glycemic control. Rapid improvement in glycemia can itself precipitate an acute, painful small-fiber and autonomic neuropathy, termed treatment-induced neuropathy of diabetes. In a retrospective cohort, 10.9% of patients referred for diabetic neuropathy met criteria for this iatrogenic syndrome, with risk rising steeply with the magnitude of glycemic improvement, from approximately 20% with a 2-to-3-percentage-point reduction in glycated hemoglobin over three months to more than 80% with a reduction exceeding 4 percentage points[25]. Rapid, large-magnitude weight loss carries an independent neuropathy risk: in a controlled cohort, peripheral polyneuropathy developed in 16% of patients within a year after bariatric surgery and was concentrated among those with the fastest weight-loss trajectories[26]. This creates a causal paradox. The same therapies suspected of provoking sensory symptoms rapidly modify chronic hyperglycemia and body weight, two variables that can independently shape neuropathy risk. Because semaglutide and tirzepatide both lower HbA1c and produce substantial weight loss, glycemic and weight-related pathways each offer a plausible, nonexclusive route to emergent sensory symptoms, independent of any direct neuronal effect of treatment.
Current evidence for GLP-1RA–associated neurosensory adverse events remains fragmented, with uncertain population-level risk and an incompletely characterized phenotypic spectrum. To address these gaps, we undertook a comprehensive population-level evaluation of the incidence, determinants, comparative risk, and ascertainment of neurosensory outcomes following GLP-1–based therapy, we conducted an observational study using a large-scale U.S. federated electronic health record network to quantify the 12-month incidence of 14 new-onset neurosensory phenotypes after semaglutide or tirzepatide initiation (Figure 1).
Methods
Cohort Definition
The study used de-identified electronic health record (EHR) data accessed through the nference network, which spans more than 30 million patients across United States health systems. Eligible patients were new (incident) users of tirzepatide or semaglutide, with the index date defined as the date of the first recorded GLP-1RA fill. To enforce an incident-user design, patients were required to have no prior order or clinical-note mention of either incretin before index. Patients were further required to have at least two distinct index-drug prescriptions during the 12-month post-index window and at least 12 months of post-index follow-up, the latter established by one or more verified encounters recorded in the patient's EHR at or beyond 12 months after index (for any reason). Tirzepatide and semaglutide initiators meeting these criteria were combined to form the unmatched base cohort.
Baseline was defined as the period on or before index. Baseline body weight, body-mass index (BMI), and glycated hemoglobin (HbA1c) were each taken as the most recent qualifying measurement within 365 days before index; baseline type 2 diabetes status and comorbidities were defined as any corresponding ICD-10-CM diagnosis at any time on or before index or a matching AI-curated clinical-note mention before index. Achieved (maximum) weight loss was defined as (baseline weight − nadir weight)/baseline weight × 100, where nadir weight was the minimum weight recorded during the 12-month post-index observation window.
To ensure that ascertained events represented new-onset (incident) disease, we applied a five-year pre-index washout: any patient with three or more distinct encounter-days recording any of the studied neurosensory phenotypes during the five years before index was excluded. Applying this exclusion to the base cohort yielded a single analytic at-risk cohort in which every remaining patient was free of the studied phenotypes at baseline and therefore at risk for an incident event. Of all tirzepatide or semaglutide initiators, sequential application of the two-prescription and 12-month-follow-up requirements and the baseline-negative exclusion produced an analytic at-risk cohort of 128,377 patients (Figure 1).
Comparators and Propensity Matching
For matched analyses, GLP-1 initiators were compared against two active comparators: (i) initiators of other glucose-lowering agents (metformin, dipeptidyl-peptidase-4 [DPP-4] inhibitors, or sodium-glucose co-transporter-2 [SGLT2] inhibitors) and (ii) patients undergoing bariatric surgery. Comparator eligibility followed the same incident-user and follow-up requirements, with the index date defined as the first qualifying medication fill or the surgery date, respectively. Matched analyses were restricted to index dates on or after January 1, 2019, and applied a ±12-month cross-cohort exposure exclusion so that patients contributing to one arm had no qualifying exposure to the comparator within 12 months of index.
Propensity scores were estimated by logistic regression, with categorical covariates one-hot encoded (first level dropped) and matching restricted to patients with complete covariate data. The GLP-1-versus-other-antidiabetic comparison used a five-covariate model ('PS-5') balancing age at index, sex, race, baseline BMI, and baseline type 2 diabetes status. The GLP-1-versus-bariatric-surgery comparison added post-index weight-loss as a 6th covariate for matching (PS-6). Because achieved weight loss is measured after index and can be affected by treatment, persistence, measurement frequency and intervening events, it is a post-treatment variable; this comparison is therefore presented as a mechanistic sensitivity analysis rather than a conventional propensity-score design, and conditioning on this post-index mediator can introduce selection bias[37]. Importantly, persistence of the association after weight-loss balancing does not exclude weight loss as a mediator.
Patients were matched 1:1 by greedy nearest-neighbor matching on the logit of the propensity score within a caliper of 0.2 standard deviations of the logit. Post-matching balance was assessed by the standardized mean difference (SMD), with an absolute SMD greater than 0.1 indicating residual imbalance; comorbidities not included in the propensity-score model were additionally examined for residual imbalance after matching[34,35,36,37]. Matching yielded 42,093 GLP-1/other-antidiabetic pairs and 15,727 GLP-1/bariatric-surgery pairs (Figure 1), post-matching baseline characteristics are summarized in A and 1B. Matched cohorts were used for the risk-ratio, time-to-event, and matched developer-feature analyses; all other analyses used the pooled, unmatched at-risk cohort.

Table 1A.
Baseline characteristics after matching: GLP-1 vs Anti-diabetic. Standardized mean difference (SMD); |SMD| > 0.1 indicates imbalance.
Table 1A.
Baseline characteristics after matching: GLP-1 vs Anti-diabetic. Standardized mean difference (SMD); |SMD| > 0.1 indicates imbalance.
| Characteristic | GLP-1 | Anti-diabetic | SMD |
| Age, years — mean (SD) | 51.8 (13.9) | 52.9 (17.9) | -0.072 |
| Baseline BMI, kg/m² — mean (SD) | 36.0 (5.9) | 35.7 (6.3) | +0.052 |
| Maximum weight loss, % — mean (SD) | 13.2 (10.4) | 9.6 (10.4) | +0.347 |
| Type 2 diabetes | 9,661 (23.0%) | 10,901 (25.9%) | -0.069 |
| Hypertension | 21,963 (52.2%) | 22,009 (52.3%) | -0.002 |
| Hyperlipidemia | 22,193 (52.7%) | 20,214 (48.0%) | +0.094 |
| ASCVD / ischemic heart disease | 5,817 (13.8%) | 7,953 (18.9%) | -0.138 |
| Heart failure | 1,932 (4.6%) | 7,263 (17.3%) | -0.415 |
| Atrial fibrillation | 2,099 (5.0%) | 4,172 (9.9%) | -0.188 |
| Chronic kidney disease | 4,487 (10.7%) | 4,901 (11.6%) | -0.031 |
| Chronic liver disease | 4,697 (11.2%) | 3,557 (8.5%) | +0.091 |
| Obesity | 31,940 (75.9%) | 21,172 (50.3%) | +0.550 |
| Hypothyroidism | 7,930 (18.8%) | 6,596 (15.7%) | +0.084 |
| Depression | 10,120 (24.0%) | 7,544 (17.9%) | +0.151 |
| Anxiety disorder | 16,797 (39.9%) | 11,918 (28.3%) | +0.246 |
| GERD | 14,241 (33.8%) | 11,207 (26.6%) | +0.157 |
| COPD | 1,761 (4.2%) | 3,153 (7.5%) | -0.141 |
| Obstructive sleep apnea | 11,447 (27.2%) | 8,839 (21.0%) | +0.145 |
| Osteoarthritis | 10,936 (26.0%) | 8,908 (21.2%) | +0.114 |
| Iron-deficiency anemia | 4,349 (10.3%) | 3,208 (7.6%) | +0.095 |
| Polycystic ovary syndrome | 1,481 (3.5%) | 3,183 (7.6%) | -0.177 |
| Cancer history | 4,574 (10.9%) | 4,610 (11.0%) | -0.003 |
| Female sex | 30,456 (72.4%) | 29,724 (70.6%) | +0.039 |
Table 1B.
Baseline characteristics after matching: GLP-1 vs Bariatric surgery. Standardized mean difference (SMD); |SMD| > 0.1 indicates imbalance.
Table 1B.
Baseline characteristics after matching: GLP-1 vs Bariatric surgery. Standardized mean difference (SMD); |SMD| > 0.1 indicates imbalance.
| Characteristic | GLP-1 | Bariatric surgery | SMD |
| Age, years — mean (SD) | 53.6 (13.6) | 54.4 (14.0) | -0.057 |
| Baseline BMI, kg/m² — mean (SD) | 34.2 (4.6) | 33.4 (4.5) | +0.171 |
| Maximum weight loss, % — mean (SD) | 13.1 (10.1) | 12.8 (13.3) | +0.027 |
| Type 2 diabetes | 3,464 (22.0%) | 3,511 (22.3%) | -0.007 |
| Hypertension | 8,271 (52.6%) | 8,464 (53.8%) | -0.025 |
| Hyperlipidemia | 8,461 (53.8%) | 6,516 (41.4%) | +0.250 |
| ASCVD / ischemic heart disease | 2,558 (16.3%) | 2,697 (17.1%) | -0.024 |
| Heart failure | 854 (5.4%) | 1,091 (6.9%) | -0.063 |
| Atrial fibrillation | 893 (5.7%) | 1,238 (7.9%) | -0.087 |
| Chronic kidney disease | 1,862 (11.8%) | 2,041 (13.0%) | -0.035 |
| Chronic liver disease | 1,988 (12.6%) | 2,914 (18.5%) | -0.163 |
| Obesity | 11,045 (70.2%) | 9,112 (57.9%) | +0.258 |
| Hypothyroidism | 2,674 (17.0%) | 2,622 (16.7%) | +0.009 |
| Depression | 3,246 (20.6%) | 2,930 (18.6%) | +0.051 |
| Anxiety disorder | 5,640 (35.9%) | 5,145 (32.7%) | +0.066 |
| GERD | 5,027 (32.0%) | 6,702 (42.6%) | -0.222 |
| COPD | 532 (3.4%) | 742 (4.7%) | -0.068 |
| Obstructive sleep apnea | 4,227 (26.9%) | 4,680 (29.8%) | -0.064 |
| Osteoarthritis | 4,374 (27.8%) | 3,998 (25.4%) | +0.054 |
| Iron-deficiency anemia | 1,315 (8.4%) | 2,588 (16.5%) | -0.247 |
| Polycystic ovary syndrome | 416 (2.6%) | 483 (3.1%) | -0.026 |
| Cancer history | 2,326 (14.8%) | 3,960 (25.2%) | -0.262 |
| Female sex | 10,940 (69.6%) | 10,921 (69.4%) | +0.003 |
Outcomes
The outcomes were a prespecified set of clustered neurosensory phenotypes: numbness (hypoesthesia), paresthesia, radiculopathy or sciatica, peripheral polyneuropathy, focal mononeuropathy, painful dysesthesia, allodynia, unspecified dysesthesia (altered skin sensation), postherpetic neuralgia, hyperesthesia, causalgia, erythromelalgia, neuropathic itch (sensory pruritus), and thermal dysesthesia (Figure 2 and Table 3). Each phenotype was considered present if, during the 12-month post-index period, a patient had a qualifying ICD-10-CM diagnosis code or an affirmed AI-curated clinical-note concept. The composite outcome, "any neurosensory phenotype", denoted development of at least one of these phenotypes.
Table 2.
Patient counts across therapeutic brands in this study whose ingredients are analyzed.
| Ingredient or exposure | Target / pharmacologic class | Brand(s) | Company(s), U.S. brand/reference | Patient count pre-matching | Patient count post-matching (PS5) | Patient count post-matching (PS6) | Neurosensory incidence, PS5 | Neurosensory incidence, PS6 |
| Semaglutide | GLP-1 receptor agonist | Ozempic | Novo Nordisk | 113,292 | 14,761 | 5,869 | 23.0% | 23.6% |
| Semaglutide | GLP-1 receptor agonist | Rybelsus | Novo Nordisk | 16,080 | 1,469 | 613 | 23.3% | 20.6% |
| Semaglutide | GLP-1 receptor agonist | Wegovy | Novo Nordisk | 47,504 | 13,304 | 6,029 | 17.7% | 19.4% |
| Tirzepatide | Dual GIP and GLP-1 receptor agonist | Mounjaro | Eli Lilly | 76,641 | 8,398 | 2,369 | 19.1% | 22.6% |
| Tirzepatide | Dual GIP and GLP-1 receptor agonist | Zepbound | Eli Lilly | 41,157 | 9,281 | 3,361 | 16.9% | 19.2% |
| Metformin | Biguanide | Glucophage; Fortamet; Glumetza; Riomet; generic metformin | Multiple manufacturers (originator Bristol Myers Squibb) | 461,926 | 33,246 | — | 24.8% | — |
| Empagliflozin | SGLT2 inhibitor | Jardiance; Synjardy; Glyxambi | Boehringer Ingelheim / Eli Lilly alliance | 128,807 | 6,821 | — | 29.6% | — |
| Dapagliflozin | SGLT2 inhibitor | Farxiga; Xigduo XR; Qtern | AstraZeneca | 63,703 | 4,350 | — | 29.5% | — |
| Canagliflozin | SGLT2 inhibitor | Invokana; Invokamet | Janssen (Johnson & Johnson) | 21,731 | 106 | — | 36.1% | — |
| Sitagliptin | DPP-4 inhibitor; prolongs endogenous GLP-1 and GIP activity | Januvia; Zituvio | Merck; Zydus Pharmaceuticals | 92,200 | 713 | — | 36.9% | — |
| Saxagliptin | DPP-4 inhibitor; prolongs endogenous GLP-1 and GIP activity | Onglyza | AstraZeneca | 10,307 | 29 | — | 34.8% | — |
| Linagliptin | DPP-4 inhibitor; prolongs endogenous GLP-1 and GIP activity | Tradjenta | Boehringer Ingelheim / Eli Lilly alliance | 20,525 | 199 | — | 39.5% | — |
| Alogliptin | DPP-4 inhibitor; prolongs endogenous GLP-1 and GIP activity | Nesina; generic alogliptin | Takeda; multiple generic manufacturers | 3,199 | 47 | — | 22.9% | — |
| Sitagliptin + metformin | DPP-4 inhibitor + biguanide | Janumet; Janumet XR; Zituvimet; Zituvimet XR | Merck; Zydus Pharmaceuticals | — | — | — | — | — |
| Saxagliptin + metformin | DPP-4 inhibitor + biguanide | Kombiglyze XR | AstraZeneca | — | — | — | — | — |
| Linagliptin + metformin | DPP-4 inhibitor + biguanide | Jentadueto; Jentadueto XR | Boehringer Ingelheim / Eli Lilly alliance | — | — | — | — | — |
| Alogliptin + metformin | DPP-4 inhibitor + biguanide | Kazano; generic combinations | Takeda; multiple generic manufacturers | — | — | — | — | — |
| Alogliptin + pioglitazone | DPP-4 inhibitor + PPARγ agonist | Oseni; generic combinations | Takeda; multiple generic manufacturers | — | — | — | — | — |
| Sitagliptin + simvastatin | DPP-4 inhibitor + HMG-CoA reductase inhibitor | Juvisync, legacy product | Merck | — | — | — | — | — |
Patient counts are distinct patients with a fill of each brand/ingredient. GLP-1 receptor agonists are shown per brand (semaglutide: Ozempic/Rybelsus/Wegovy; tirzepatide: Mounjaro/Zepbound). Pre-matching = the GLP-1 analytic cohort (GLP-1 agents) or the anti-diabetic comparator cohort with complete 12-month follow-up (comparators). Post-matching PS5 = GLP-1 vs anti-diabetic matched arm; PS6 = GLP-1 vs bariatric-surgery matched arm. Anti-diabetic comparators appear only in PS5 (the PS6 comparator is bariatric surgery, which involves no study drug), so their PS6 cells are shown as —. Neurosensory incidence is the 12-month cumulative incidence of any of the 14 phenotypes among each brand's at-risk (baseline-phenotype-free) patients within that matched arm, computed with the same washout and new-onset definition as the risk-ratio analyses; it enables comparison across brands despite brands not being matched to one another. Some comparator subsets are small (see post-matching N), so those rates are imprecise. Combination products are counted under their single ingredient (e.g., Janumet within sitagliptin); DPP-4 combination rows subsumed this way are shown as —. Because a patient may receive more than one agent, counts are not mutually exclusive and are not summed.
Table 3.
New-onset 12-month incidence per phenotype in the pooled unmatched GLP-1 cohort.
| Phenotype | At risk (n) | New-onset (n) | Incidence % (95% CI) |
| Any neurosensory phenotype | 128,377 | 29,519 | 22.99 (22.76–23.22) |
| Numbness / hypoesthesia / sensory loss | 128,377 | 16,143 | 12.57 (12.39–12.76) |
| Paresthesia / positive nonpainful sensory phenomena | 128,377 | 15,415 | 12.01 (11.83–12.19) |
| Radiculopathy / sciatica | 128,377 | 8,534 | 6.65 (6.51–6.79) |
| Peripheral sensory, small-fiber or generalized polyneuropathy | 128,377 | 4,656 | 3.63 (3.53–3.73) |
| Focal mononeuropathy / entrapment neuropathy | 128,377 | 3,321 | 2.59 (2.50–2.68) |
| Painful dysesthesia / burning, stinging or electric neuropathic pain | 128,377 | 2,060 | 1.60 (1.54–1.67) |
| Allodynia / hyperalgesia / cutaneous tenderness | 128,377 | 263 | 0.20 (0.18–0.23) |
| Dysesthesia / unspecified altered skin sensation | 128,377 | 742 | 0.58 (0.54–0.62) |
| Postherpetic neuralgia / zoster-associated neuropathy | 128,377 | 201 | 0.16 (0.14–0.18) |
| Hyperesthesia / skin hypersensitivity | 128,377 | 95 | 0.07 (0.06–0.09) |
| Complex regional pain syndrome / causalgia | 128,377 | 82 | 0.06 (0.05–0.08) |
| Erythromelalgia | 128,377 | <11 | 0.01 (0.00–0.01) |
| Neuropathic itch / sensory pruritus | 128,377 | <11 | 0.01 (0.00–0.01) |
| Thermal dysesthesia / altered temperature perception | 128,377 | <11 | 0.00 (0.00–0.00) |
As negative-control outcomes, we prespecified a set of conditions with no established mechanistic link to GLP-1RA exposure, glycemic burden, or weight loss (including deviated nasal septum, allergic rhinitis, age-related cataract, sebaceous or epidermoid cyst, and benign melanocytic nevus), each ascertained using the same structured-diagnosis and clinical-note approach as the primary phenotypes. These outcomes were intended to assess whether a generalized excess-detection process, rather than a phenotype-specific effect, could account for between-cohort differences.
Clinical-note phenotypes were ascertained with a previously described augmented-curation model: a text-sentiment neural network that takes as input a clinical-text snippet mentioning a specified phenotype and returns, for that mention, a classification of whether the phenotype is affirmed (present), negated, or uncertain, together with a probability. Mention-level classifications derived from the unstructured clinical text were harmonized into a patient-level disease-presence probability, and a patient was counted as having the note-based phenotype when the augmented-curation classifier assigned a patient-level disease-presence probability of 0.80 or higher. This threshold restricts ascertainment to high-confidence assertions of present disease and reduces false positives from negated, uncertain, or historical mentions. The performance of this model and the 0.80 threshold for the specific phenotypes studied here was validated by physician review of the corresponding clinical notes[27].
Two physicians independently reviewed 223 sampled pipeline-positive incident phenotype captures, comprising up to 20 randomly selected patients per phenotype, with one qualifying post-index occurrence per patient and all available patients included when fewer than 20 were eligible. Of these, 198 were classified as valid and 25 as not valid, yielding an overall positive predictive value of 88.8% (95% CI, 84.0% - 92.3%), consistent with performance from previous publications[27]. Inter-rater reliability was assessed using the same binary classification of valid versus not valid; reviewers agreed on 213 of 223 captures (95.5%), with a nominal Krippendorff’s alpha of 0.767. Phenotype-specific PPV ranged from 70.0% to 100.0%, with wider confidence intervals for phenotypes with fewer available cases. (See Table 7)
Within the matched cohorts, the cumulative incidence of the composite any-neurosensory-phenotype outcome and of the more common individual phenotypes was tracked as the percentage of baseline at-risk patients affected by each month after index, to compare the timing and magnitude of event accrual between arms (Figure 8).
To relate phenotype incidence to treatment exposure and metabolic response, incidence was compared across prespecified strata computed over the 12-month observation window: maximum achieved weight-loss band (≤5%, 5–10%, 10–20%, 20–30%, ≥30%); baseline BMI; change in BMI; baseline HbA1c (<5.7%, 5.7–6.5%, 6.5–7.0%, 7.0–8.0%, 8.0–9.0%, 9.0–10.0%, 10.0–11.0%, 11.0–12.0%, ≥12%); magnitude of HbA1c reduction (increase or no change, 0–0.5%, 0.5–1.0%, and ≥1.0% reduction, defined as baseline minus the minimum post-index value); and prescription count (2–3, 4–6, 7–9, ≥10). Baseline HbA1c and HbA1c reduction were prespecified as a positive-control axis, testing the established, comparator-independent expectation that neurosensory phenotype incidence rises with glycemic burden (Figure 3, Figure 4 and Figure 5).
As a secondary, descriptive analysis, baseline and treatment-associated features were compared between patients who did ("developers") and did not ("non-developers") develop any neurosensory phenotype, within the overall at-risk cohort and within the matched cohorts. Associations were summarized as odds ratios with Benjamini–Hochberg-adjusted q-values and ranked by magnitude, evaluating treatment-associated features (maximum achieved dose and achieved weight loss) alongside baseline demographic, anthropometric, cardiometabolic, endocrine, and renal features (Figure 11 and Figure 12, Table 5 and Table 6). Because these comparisons condition on a post-index event, they were interpreted as descriptive rather than causal.
Table 4A.
New-onset risk ratios, GLP-1 vs anti-diabetic initiators (PS-5 matched).
| Phenotype | GLP-1 events/at-risk | Comparator events/at-risk | Risk ratio (95% CI) |
| Any of the 14 phenotypes | 5,591/28,399 | 8,274/32,359 | 0.77 (0.75–0.79) |
| Numbness / hypoesthesia / sensory loss | 3,082/28,399 | 4,958/32,359 | 0.71 (0.68–0.74) |
| Paresthesia / positive nonpainful sensory phenomena | 2,840/28,399 | 4,291/32,359 | 0.75 (0.72–0.79) |
| Radiculopathy / sciatica | 1,738/28,399 | 2,301/32,359 | 0.86 (0.81–0.91) |
| Peripheral sensory, small-fiber or generalized polyneuropathy | 588/28,399 | 1,272/32,359 | 0.53 (0.48–0.58) |
| Focal mononeuropathy / entrapment neuropathy | 649/28,399 | 850/32,359 | 0.87 (0.79–0.96) |
| Painful dysesthesia / burning, stinging or electric neuropathic pain | 383/28,399 | 619/32,359 | 0.71 (0.62–0.80) |
| Allodynia / hyperalgesia / cutaneous tenderness | 61/28,399 | 60/32,359 | 1.16 (0.81–1.65) |
| Dysesthesia / unspecified altered skin sensation | 190/28,399 | 208/32,359 | 1.04 (0.86–1.27) |
| Postherpetic neuralgia / zoster-associated neuropathy | 42/28,399 | 45/32,359 | 1.06 (0.70–1.62) |
| Hyperesthesia / skin hypersensitivity | 19/28,399 | 35/32,359 | 0.62 (0.35–1.08) |
| Complex regional pain syndrome / causalgia | 16/28,399 | 30/32,359 | 0.61 (0.33–1.11) |
| Erythromelalgia | 3/28,399 | 1/32,359 | 3.42 (0.36–32.86) |
| Neuropathic itch / sensory pruritus | <11/28,399 | <11/32,359 | — |
| Thermal dysesthesia / altered temperature perception | <11/28,399 | <11/32,359 | — |
Table 4B.
New-onset risk ratios, GLP-1 initiators vs bariatric surgery recipients (PS-6 matched).
| Phenotype | GLP-1 events/at-risk | Comparator events/at-risk | Risk ratio (95% CI) |
| Any of the 14 phenotypes | 2,245/10,619 | 2,988/11,081 | 0.78 (0.75–0.82) |
| Numbness / hypoesthesia / sensory loss | 1,204/10,619 | 1,949/11,081 | 0.64 (0.60–0.69) |
| Paresthesia / positive nonpainful sensory phenomena | 1,100/10,619 | 1,407/11,081 | 0.82 (0.76–0.88) |
| Radiculopathy / sciatica | 656/10,619 | 648/11,081 | 1.06 (0.95–1.17) |
| Peripheral sensory, small-fiber or generalized polyneuropathy | 278/10,619 | 530/11,081 | 0.55 (0.47–0.63) |
| Focal mononeuropathy / entrapment neuropathy | 257/10,619 | 275/11,081 | 0.98 (0.82–1.15) |
| Painful dysesthesia / burning, stinging or electric neuropathic pain | 171/10,619 | 260/11,081 | 0.69 (0.57–0.83) |
| Allodynia / hyperalgesia / cutaneous tenderness | 40/10,619 | 58/11,081 | 0.72 (0.48–1.08) |
| Dysesthesia / unspecified altered skin sensation | 129/10,619 | 80/11,081 | 1.68 (1.27–2.22) |
| Postherpetic neuralgia / zoster-associated neuropathy | 16/10,619 | 12/11,081 | 1.39 (0.66–2.94) |
| Hyperesthesia / skin hypersensitivity | 14/10,619 | 13/11,081 | 1.12 (0.53–2.39) |
| Complex regional pain syndrome / causalgia | 10/10,619 | 10/11,081 | 1.04 (0.43–2.51) |
| Erythromelalgia | <11/10,619 | <11/11.081 | 7.17 (0.37–138.80) |
| Neuropathic itch / sensory pruritus | <11/10,619 | <11/11,081 | — |
| Thermal dysesthesia / altered temperature perception | <11/10,619 | <11/11,081 | — |
Table 5.
Baseline and treatment features among developers versus non-developers of any neurosensory phenotype (pooled GLP-1 cohort). Odds ratio of each feature among developers versus non-developers of any neurosensory phenotype, with 95% confidence interval; p by chi-square test; q by the Benjamini–Hochberg false-discovery-rate procedure. Features with q<0.05 are shown in bold. Percentages are the prevalence of each feature within developers and within non-developers.
Table 5.
Baseline and treatment features among developers versus non-developers of any neurosensory phenotype (pooled GLP-1 cohort). Odds ratio of each feature among developers versus non-developers of any neurosensory phenotype, with 95% confidence interval; p by chi-square test; q by the Benjamini–Hochberg false-discovery-rate procedure. Features with q<0.05 are shown in bold. Percentages are the prevalence of each feature within developers and within non-developers.
| Feature | Odds ratio (95% CI) | Developers, n/N (%) | Non-developers, n/N (%) | p value | q value |
| COPD | 1.63 (1.42–1.87) | 309/29,519 (1.0%) | 637/98,858 (0.6%) | <0.001 | <0.001 |
| Baseline HbA1c ≥12% | 1.53 (1.39–1.68) | 636/17,312 (3.7%) | 1,361/55,874 (2.4%) | <0.001 | <0.001 |
| Heart failure | 1.52 (1.35–1.70) | 412/29,519 (1.4%) | 915/98,858 (0.9%) | <0.001 | <0.001 |
| Age ≥ 65 years | 1.46 (1.42–1.51) | 6,885/29,519 (23.3%) | 17,026/98,858 (17.2%) | <0.001 | <0.001 |
| Baseline HbA1c ≥5.7% (any dysglycemia) | 1.43 (1.37–1.49) | 13,963/17,312 (80.7%) | 41,590/55,874 (74.4%) | <0.001 | <0.001 |
| Baseline HbA1c 11-12% | 1.36 (1.23–1.50) | 560/17,312 (3.2%) | 1,339/55,874 (2.4%) | <0.001 | <0.001 |
| Type 2 diabetes | 1.35 (1.29–1.42) | 2,767/29,519 (9.4%) | 7,012/98,858 (7.1%) | <0.001 | <0.001 |
| ASCVD / ischemic heart disease | 1.35 (1.26–1.45) | 1,075/29,519 (3.6%) | 2,685/98,858 (2.7%) | <0.001 | <0.001 |
| Chronic kidney disease | 1.35 (1.24–1.46) | 839/29,519 (2.8%) | 2,100/98,858 (2.1%) | <0.001 | <0.001 |
| Baseline HbA1c ≥6.5% (diabetic range) | 1.34 (1.29–1.38) | 10,158/17,312 (58.7%) | 28,774/55,874 (51.5%) | <0.001 | <0.001 |
| Osteoarthritis | 1.33 (1.26–1.40) | 2,138/29,519 (7.2%) | 5,484/98,858 (5.5%) | <0.001 | <0.001 |
| Cancer history | 1.29 (1.19–1.39) | 937/29,519 (3.2%) | 2,452/98,858 (2.5%) | <0.001 | <0.001 |
| Atrial fibrillation | 1.27 (1.14–1.43) | 416/29,519 (1.4%) | 1,097/98,858 (1.1%) | <0.001 | <0.001 |
| Baseline HbA1c 9-10% | 1.26 (1.18–1.35) | 1,321/17,312 (7.6%) | 3,429/55,874 (6.1%) | <0.001 | <0.001 |
| Baseline HbA1c 10-11% | 1.23 (1.13–1.33) | 823/17,312 (4.8%) | 2,185/55,874 (3.9%) | <0.001 | <0.001 |
| Baseline HbA1c 8-9% | 1.17 (1.11–1.24) | 2,129/17,312 (12.3%) | 5,970/55,874 (10.7%) | <0.001 | <0.001 |
| Chronic liver disease | 1.16 (1.08–1.25) | 982/29,519 (3.3%) | 2,850/98,858 (2.9%) | <0.001 | <0.001 |
| Black or African American race | 1.15 (1.11–1.19) | 5,300/29,519 (18.0%) | 15,828/98,856 (16.0%) | <0.001 | <0.001 |
| GERD | 1.07 (1.03–1.12) | 2,816/29,519 (9.5%) | 8,834/98,858 (8.9%) | 0.002 | 0.002 |
| Depression | 1.07 (1.02–1.13) | 2,007/29,519 (6.8%) | 6,289/98,858 (6.4%) | 0.008 | 0.011 |
| Baseline HbA1c 6.5-7% | 1.07 (1.01–1.13) | 1,832/17,312 (10.6%) | 5,575/55,874 (10.0%) | 0.022 | 0.028 |
| High incretin dose (tirzepatide ≥10 mg or semaglutide ≥1 mg) | 1.05 (1.02–1.08) | 18,758/29,238 (64.2%) | 61,320/97,359 (63.0%) | <0.001 | <0.001 |
| Obstructive sleep apnea | 1.04 (0.99–1.09) | 2,331/29,519 (7.9%) | 7,507/98,858 (7.6%) | 0.088 | 0.105 |
| Baseline HbA1c 7-8% | 1.04 (0.99–1.09) | 2,857/17,312 (16.5%) | 8,915/55,874 (16.0%) | 0.089 | 0.105 |
| Hypertension | 1.04 (1.00–1.07) | 4,690/29,519 (15.9%) | 15,242/98,858 (15.4%) | 0.051 | 0.064 |
| Weight loss ≥ 20% | 1.03 (0.97–1.10) | 1,504/6,662 (22.6%) | 5,820/26,410 (22.0%) | 0.352 | 0.371 |
| BMI reduction ≥ 5 points | 0.99 (0.94–1.05) | 2,129/6,345 (33.6%) | 8,281/24,598 (33.7%) | 0.879 | 0.879 |
| Female sex | 0.99 (0.96–1.02) | 19,020/29,220 (65.1%) | 63,723/97,512 (65.3%) | 0.423 | 0.434 |
| Weight loss ≥ 10% | 0.97 (0.92–1.02) | 3,592/6,662 (53.9%) | 14,431/26,410 (54.6%) | 0.295 | 0.319 |
| Hypothyroidism | 0.96 (0.91–1.02) | 1,523/29,519 (5.2%) | 5,278/98,858 (5.3%) | 0.232 | 0.266 |
| Iron-deficiency anemia | 0.96 (0.89–1.03) | 900/29,519 (3.0%) | 3,137/98,858 (3.2%) | 0.291 | 0.319 |
| White race | 0.96 (0.93–0.99) | 22,008/29,519 (74.6%) | 74,490/98,856 (75.4%) | 0.006 | 0.008 |
| Baseline HbA1c 5.7-6.5% | 0.95 (0.91–0.99) | 3,805/17,312 (22.0%) | 12,816/55,874 (22.9%) | 0.009 | 0.012 |
| Hyperlipidemia | 0.94 (0.91–0.98) | 4,208/29,519 (14.3%) | 14,858/98,858 (15.0%) | 0.001 | 0.002 |
| Anxiety disorder | 0.92 (0.88–0.95) | 3,114/29,519 (10.5%) | 11,286/98,858 (11.4%) | <0.001 | <0.001 |
| ≥ 4 prescriptions | 0.87 (0.85–0.89) | 16,783/29,519 (56.9%) | 59,551/98,858 (60.2%) | <0.001 | <0.001 |
| Polycystic ovary syndrome | 0.84 (0.75–0.95) | 382/29,519 (1.3%) | 1,512/98,858 (1.5%) | 0.004 | 0.005 |
| Asian race | 0.82 (0.74–0.91) | 485/29,519 (1.6%) | 1,969/98,856 (2.0%) | <0.001 | <0.001 |
| Obesity | 0.81 (0.79–0.84) | 6,194/29,519 (21.0%) | 24,357/98,858 (24.6%) | <0.001 | <0.001 |
| ≥ 7 prescriptions | 0.81 (0.78–0.83) | 7,365/29,519 (25.0%) | 28,882/98,858 (29.2%) | <0.001 | <0.001 |
Table 6.
Baseline and treatment features among developers versus non-developers of any neurosensory phenotype (propensity-score-matched GLP-1 versus anti-diabetic cohort). Odds ratio of each feature among developers versus non-developers of any neurosensory phenotype, with 95% confidence interval; p by chi-square test; q by the Benjamini–Hochberg false-discovery-rate procedure. Features with q<0.05 are shown in bold. Percentages are the prevalence of each feature within developers and within non-developers.
Table 6.
Baseline and treatment features among developers versus non-developers of any neurosensory phenotype (propensity-score-matched GLP-1 versus anti-diabetic cohort). Odds ratio of each feature among developers versus non-developers of any neurosensory phenotype, with 95% confidence interval; p by chi-square test; q by the Benjamini–Hochberg false-discovery-rate procedure. Features with q<0.05 are shown in bold. Percentages are the prevalence of each feature within developers and within non-developers.
| Feature | Odds ratio (95% CI) | Developers, n/N (%) | Non-developers, n/N (%) | p value | q value |
| Baseline HbA1c ≥12% | 2.93 (1.94–4.43) | 39/2,388 (1.6%) | 55/9,763 (0.6%) | <0.001 | <0.001 |
| Baseline HbA1c 10-11% | 2.41 (1.72–3.37) | 54/2,388 (2.3%) | 93/9,763 (1.0%) | <0.001 | <0.001 |
| COPD | 1.86 (1.57–2.20) | 197/5,591 (3.5%) | 440/22,808 (1.9%) | <0.001 | <0.001 |
| Baseline HbA1c 9-10% | 1.76 (1.31–2.37) | 64/2,388 (2.7%) | 150/9,763 (1.5%) | <0.001 | <0.001 |
| Heart failure | 1.74 (1.49–2.03) | 235/5,591 (4.2%) | 562/22,808 (2.5%) | <0.001 | <0.001 |
| Baseline HbA1c 8-9% | 1.72 (1.37–2.16) | 111/2,388 (4.6%) | 269/9,763 (2.8%) | <0.001 | <0.001 |
| Type 2 diabetes | 1.72 (1.60–1.84) | 1,478/5,591 (26.4%) | 3,944/22,808 (17.3%) | <0.001 | <0.001 |
| Osteoarthritis | 1.65 (1.53–1.77) | 1,325/5,591 (23.7%) | 3,617/22,808 (15.9%) | <0.001 | <0.001 |
| Age ≥ 65 years | 1.64 (1.52–1.77) | 1,157/5,591 (20.7%) | 3,133/22,808 (13.7%) | <0.001 | <0.001 |
| ASCVD / ischemic heart disease | 1.63 (1.49–1.79) | 717/5,591 (12.8%) | 1,883/22,808 (8.3%) | <0.001 | <0.001 |
| Baseline HbA1c 11-12% | 1.61 (0.96–2.70) | 20/2,388 (0.8%) | 51/9,763 (0.5%) | 0.097 | 0.117 |
| Baseline HbA1c ≥6.5% (diabetic range) | 1.57 (1.42–1.74) | 667/2,388 (27.9%) | 1,928/9,763 (19.7%) | <0.001 | <0.001 |
| Chronic kidney disease | 1.57 (1.42–1.74) | 547/5,591 (9.8%) | 1,475/22,808 (6.5%) | <0.001 | <0.001 |
| Atrial fibrillation | 1.50 (1.30–1.72) | 268/5,591 (4.8%) | 743/22,808 (3.3%) | <0.001 | <0.001 |
| Cancer history | 1.49 (1.35–1.64) | 597/5,591 (10.7%) | 1,694/22,808 (7.4%) | <0.001 | <0.001 |
| Chronic liver disease | 1.36 (1.24–1.50) | 603/5,591 (10.8%) | 1,856/22,808 (8.1%) | <0.001 | <0.001 |
| Hypertension | 1.31 (1.23–1.39) | 2,869/5,591 (51.3%) | 10,177/22,808 (44.6%) | <0.001 | <0.001 |
| GERD | 1.31 (1.22–1.39) | 1,744/5,591 (31.2%) | 5,880/22,808 (25.8%) | <0.001 | <0.001 |
| Baseline HbA1c ≥5.7% (any dysglycemia) | 1.27 (1.16–1.39) | 1,332/2,388 (55.8%) | 4,856/9,763 (49.7%) | <0.001 | <0.001 |
| Depression | 1.21 (1.12–1.30) | 1,231/5,591 (22.0%) | 4,327/22,808 (19.0%) | <0.001 | <0.001 |
| Baseline HbA1c 7-8% | 1.20 (1.01–1.43) | 175/2,388 (7.3%) | 604/9,763 (6.2%) | 0.046 | 0.061 |
| Baseline HbA1c 6.5-7% | 1.20 (1.02–1.41) | 204/2,388 (8.5%) | 706/9,763 (7.2%) | 0.032 | 0.048 |
| Obstructive sleep apnea | 1.19 (1.11–1.28) | 1,328/5,591 (23.8%) | 4,730/22,808 (20.7%) | <0.001 | <0.001 |
| Black or African American race | 1.15 (1.06–1.25) | 851/5,591 (15.2%) | 3,081/22,808 (13.5%) | <0.001 | 0.002 |
| Hyperlipidemia | 1.13 (1.06–1.19) | 2,740/5,591 (49.0%) | 10,506/22,808 (46.1%) | <0.001 | <0.001 |
| Female sex | 1.07 (1.00–1.15) | 4,086/5,536 (73.8%) | 16,355/22,579 (72.4%) | 0.041 | 0.058 |
| Hypothyroidism | 1.07 (0.99–1.16) | 949/5,591 (17.0%) | 3,652/22,808 (16.0%) | 0.084 | 0.105 |
| Anxiety disorder | 1.04 (0.98–1.11) | 2,022/5,591 (36.2%) | 8,026/22,808 (35.2%) | 0.176 | 0.202 |
| Iron-deficiency anemia | 1.03 (0.93–1.15) | 463/5,591 (8.3%) | 1,838/22,808 (8.1%) | 0.604 | 0.635 |
| High incretin dose (tirzepatide ≥10 mg or semaglutide ≥1 mg) | 1.01 (0.95–1.07) | 3,232/5,580 (57.9%) | 13,142/22,788 (57.7%) | 0.746 | 0.765 |
| Weight loss ≥ 20% | 1.00 (0.94–1.08) | 1,258/5,559 (22.6%) | 5,043/22,368 (22.5%) | 0.907 | 0.907 |
| BMI reduction ≥ 5 points | 0.98 (0.92–1.04) | 1,852/5,489 (33.7%) | 7,437/21,719 (34.2%) | 0.494 | 0.534 |
| White race | 0.95 (0.89–1.02) | 4,374/5,591 (78.2%) | 18,035/22,808 (79.1%) | 0.173 | 0.202 |
| Weight loss ≥ 10% | 0.95 (0.89–1.00) | 3,022/5,559 (54.4%) | 12,460/22,368 (55.7%) | 0.074 | 0.095 |
| Polycystic ovary syndrome | 0.91 (0.77–1.07) | 190/5,591 (3.4%) | 850/22,808 (3.7%) | 0.258 | 0.286 |
| Baseline HbA1c 5.7-6.5% | 0.90 (0.82–1.00) | 665/2,388 (27.8%) | 2,928/9,763 (30.0%) | 0.042 | 0.058 |
| Obesity | 0.79 (0.74–0.84) | 3,880/5,591 (69.4%) | 16,928/22,808 (74.2%) | <0.001 | <0.001 |
| ≥ 7 prescriptions | 0.76 (0.71–0.82) | 1,391/5,591 (24.9%) | 6,904/22,808 (30.3%) | <0.001 | <0.001 |
| ≥ 4 prescriptions | 0.76 (0.72–0.81) | 2,759/5,591 (49.3%) | 12,804/22,808 (56.1%) | <0.001 | <0.001 |
| Asian race | 0.74 (0.56–0.96) | 65/5,591 (1.2%) | 359/22,808 (1.6%) | 0.027 | 0.042 |
Table 7.
Physician validation via manual curation of AI-augmented incident phenotype capture from de-identified EHR clinical notes.
Table 7.
Physician validation via manual curation of AI-augmented incident phenotype capture from de-identified EHR clinical notes.
| Phenotype | Reviewed, n | Valid, n | Not valid, n | PPV % (95% CI) |
| Signs and Symptoms | ||||
| Allodynia | 20 | 17 | 3 | 85 (64.0 - 94.8) |
| Dysesthesia | 20 | 18 | 2 | 90 (69.9 - 97.2) |
| Hyperesthesia | 20 | 19 | 1 | 95 (76.4 - 99.1) |
| Neuropathic itch | 2 | 2 | 0 | 100 (34.2 - 100.0) |
| Hypoesthesia | 20 | 20 | 0 | 100 (83.9 - 100.0) |
| Painful dysesthesia | 20 | 19 | 1 | 95 (76.4 - 99.1) |
| Paresthesia | 20 | 20 | 0 | 100 (83.9 - 100.0) |
| Diagnosis and Syndromes | ||||
| Complex regional pain syndrome | 14 | 12 | 2 | 85.7 (60.1 - 96.0) |
| Erythromelalgia | 7 | 6 | 1 | 85.7 (48.7 - 97.4) |
| Mononeuropathy | 20 | 18 | 2 | 90 (69.9 - 97.2) |
| Polyneuropathy | 20 | 18 | 2 | 90 (69.9 - 97.2) |
| Postherpetic neuralgia | 20 | 14 | 6 | 70 (48.1 - 85.5) |
| Radiculopathy | 20 | 15 | 5 | 75 (53.1 - 88.8) |
| Overall | 223 | 198 | 25 | 88.8 (84.0 - 92.3) |
| Not valid combined invalid, uncertain, and not-reviewable assessments. PPV was calculated as the number of valid captures divided by all reviewed pipeline-positive captures. Confidence intervals were calculated using the Wilson method. Inter-rater reliability was assessed using the same binary classification of valid versus not valid; raw agreement was 95.5% and nominal Krippendorff’s alpha was 0.767. | ||||
Figure 2.
New-onset incidence of the neurosensory phenotypes in the pooled unmatched GLP-1 cohort. Bars show Wilson 95% confidence intervals; labels give the rate, 95% confidence interval, and events/at-risk denominator. Of the 14 new-onset neurosensory phenotypes being tracked, erythromelalgia, neuropathic itch and thermal dysesthesia are omitted from this figure (fewer than 11 pooled new-onset events; unstable rates). The associated data for this figure is summarized in Table 3.
Figure 2.
New-onset incidence of the neurosensory phenotypes in the pooled unmatched GLP-1 cohort. Bars show Wilson 95% confidence intervals; labels give the rate, 95% confidence interval, and events/at-risk denominator. Of the 14 new-onset neurosensory phenotypes being tracked, erythromelalgia, neuropathic itch and thermal dysesthesia are omitted from this figure (fewer than 11 pooled new-onset events; unstable rates). The associated data for this figure is summarized in Table 3.
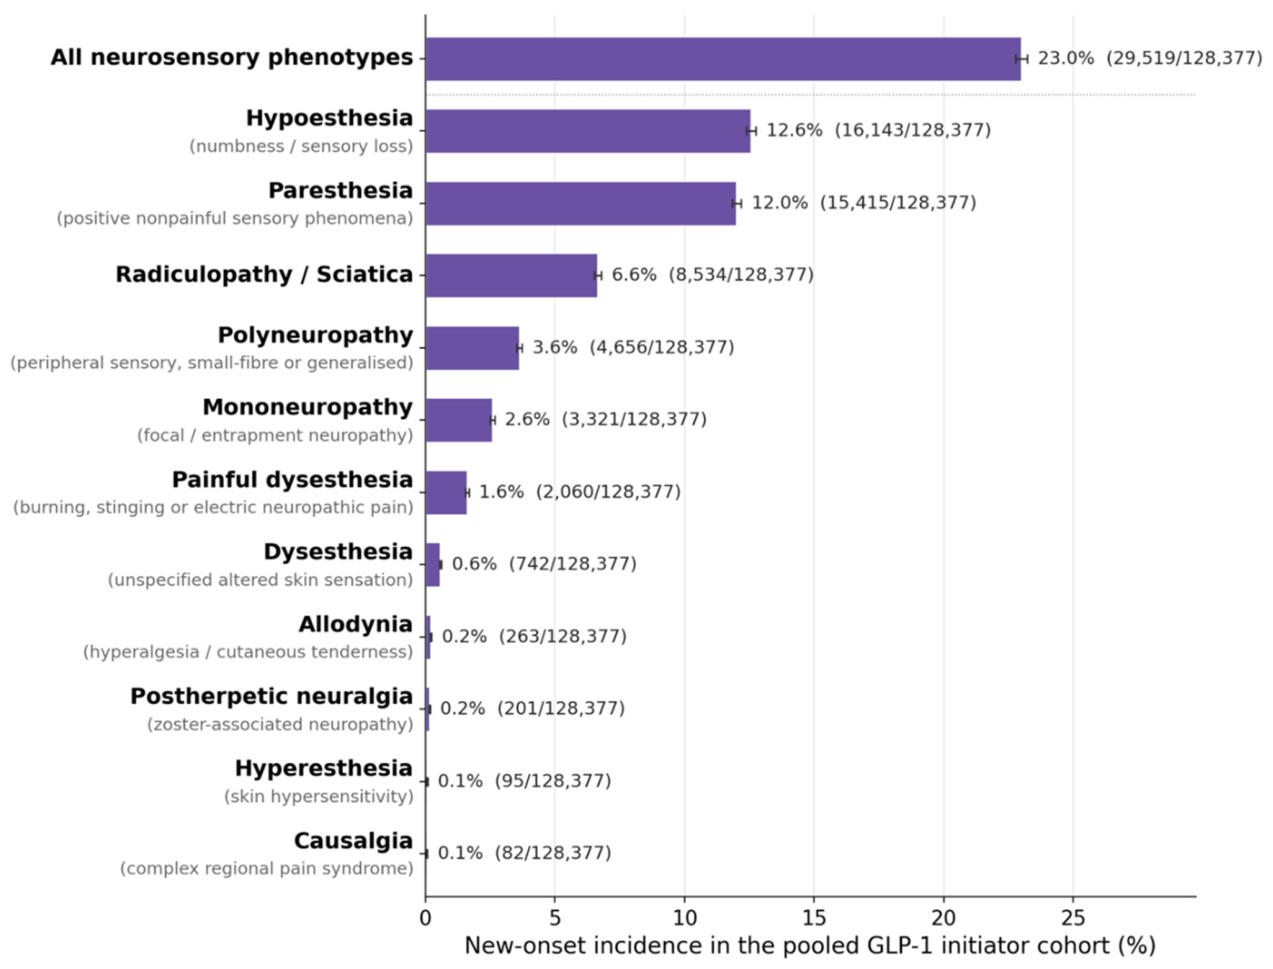
Figure 3.
New-onset incidence of any of the neurosensory phenotypes, stratified by maximum achieved weight loss (A), baseline body-mass index - BMI (B), reduction in BMI (C), baseline hemoglobin A1c - HbA1c (D), reduction in HbA1c (E), and number of prescriptions (F). Points show Wilson 95% confidence intervals; labels give events/at-risk; P for trend from the Cochran–Armitage test.
Figure 3.
New-onset incidence of any of the neurosensory phenotypes, stratified by maximum achieved weight loss (A), baseline body-mass index - BMI (B), reduction in BMI (C), baseline hemoglobin A1c - HbA1c (D), reduction in HbA1c (E), and number of prescriptions (F). Points show Wilson 95% confidence intervals; labels give events/at-risk; P for trend from the Cochran–Armitage test.
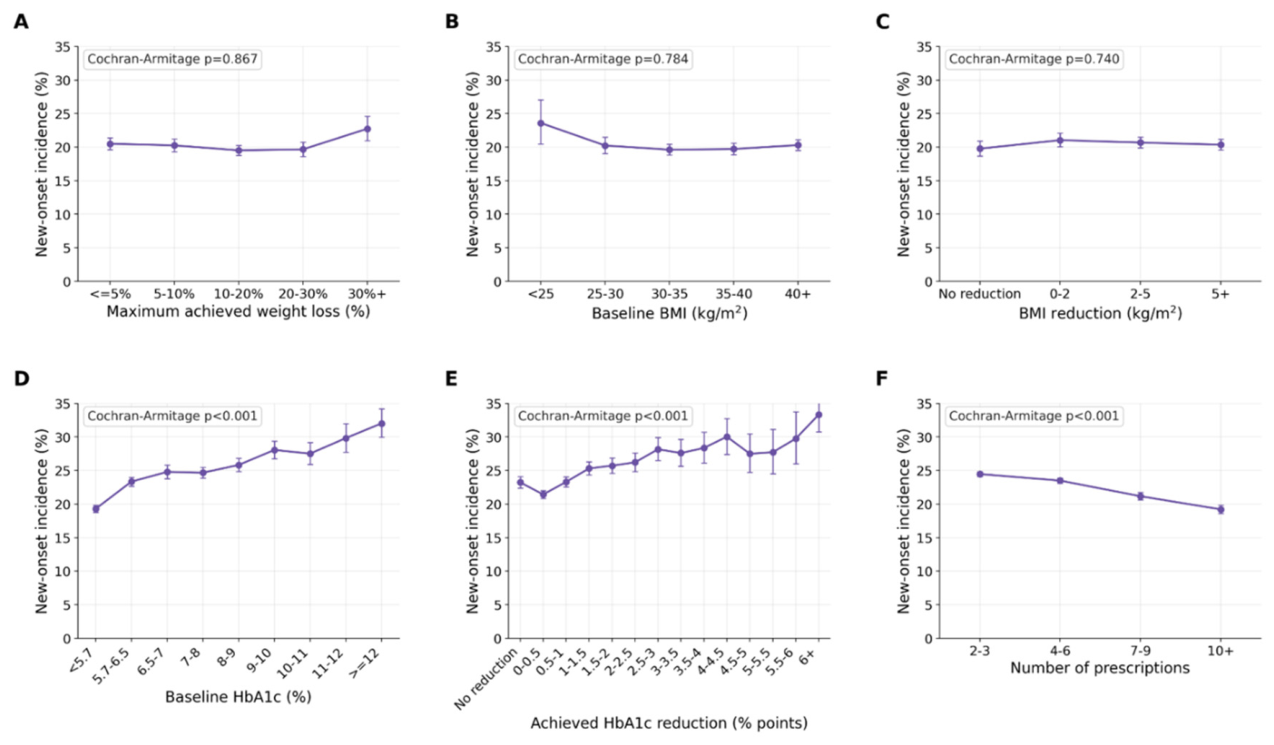
Figure 4.
New-onset incidence of the more common neurosensory phenotypes, stratified similar to Figure 3. Points show Wilson 95% confidence intervals; labels give events/at-risk; P for trend from the Cochran–Armitage test.
Figure 4.
New-onset incidence of the more common neurosensory phenotypes, stratified similar to Figure 3. Points show Wilson 95% confidence intervals; labels give events/at-risk; P for trend from the Cochran–Armitage test.
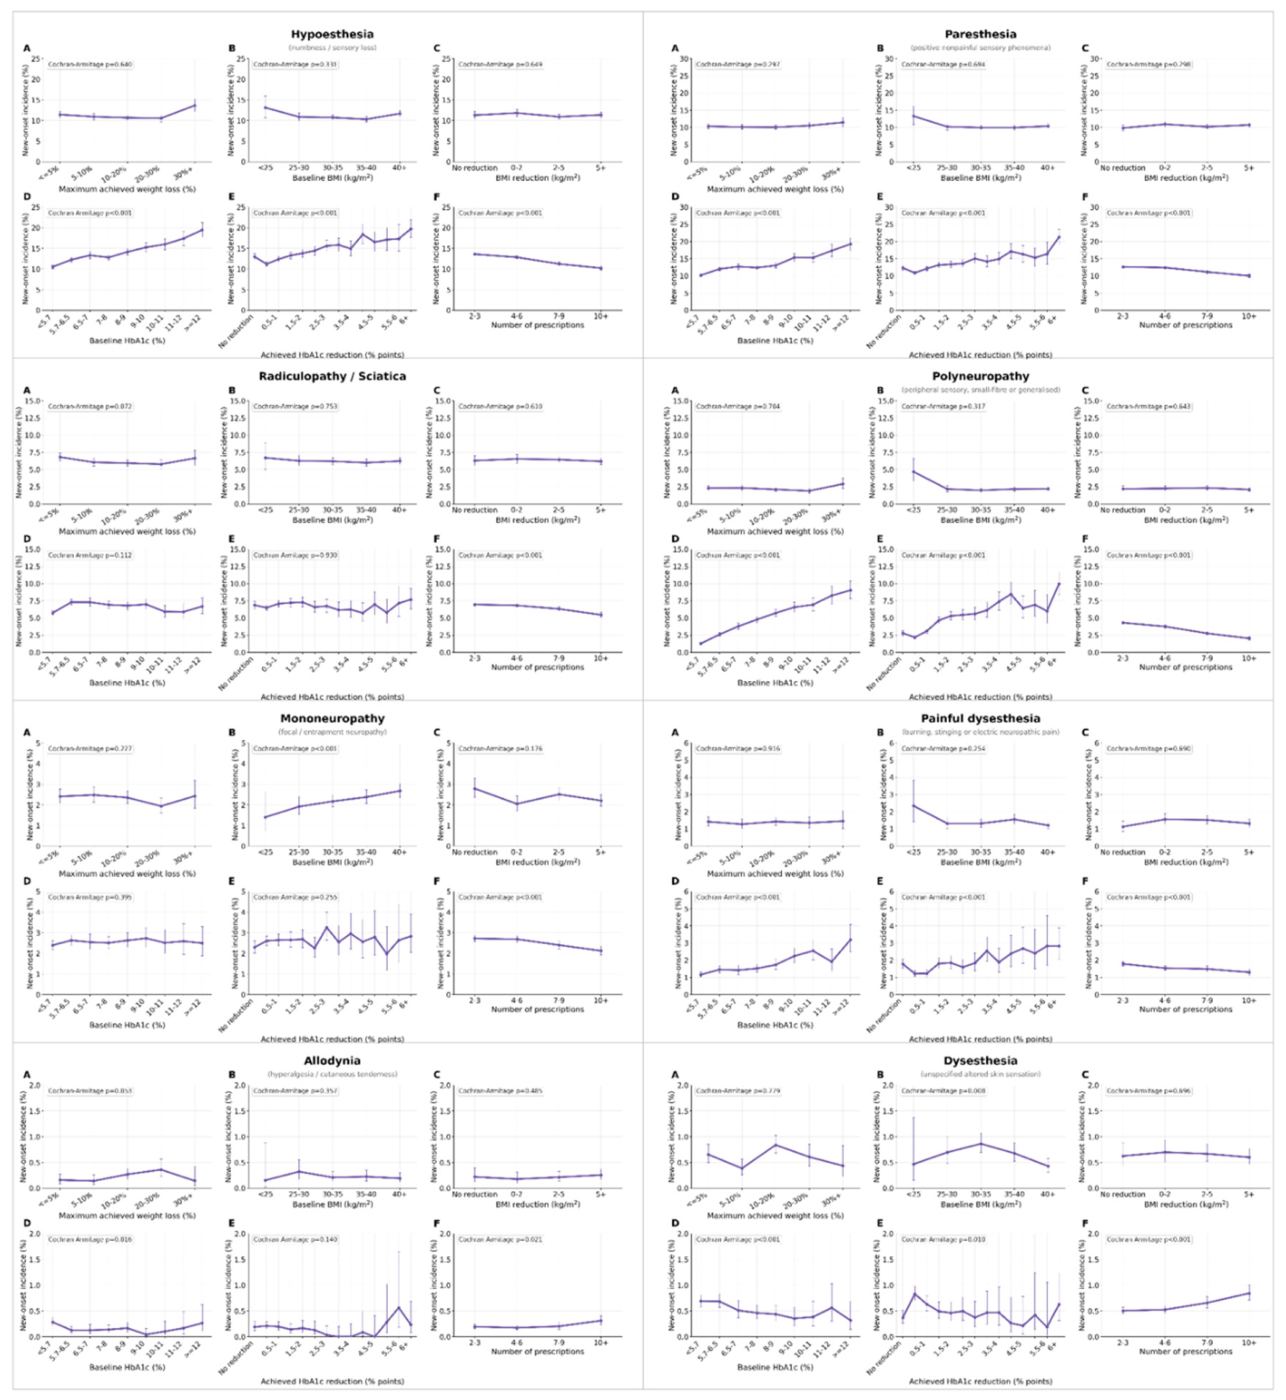
Figure 5.
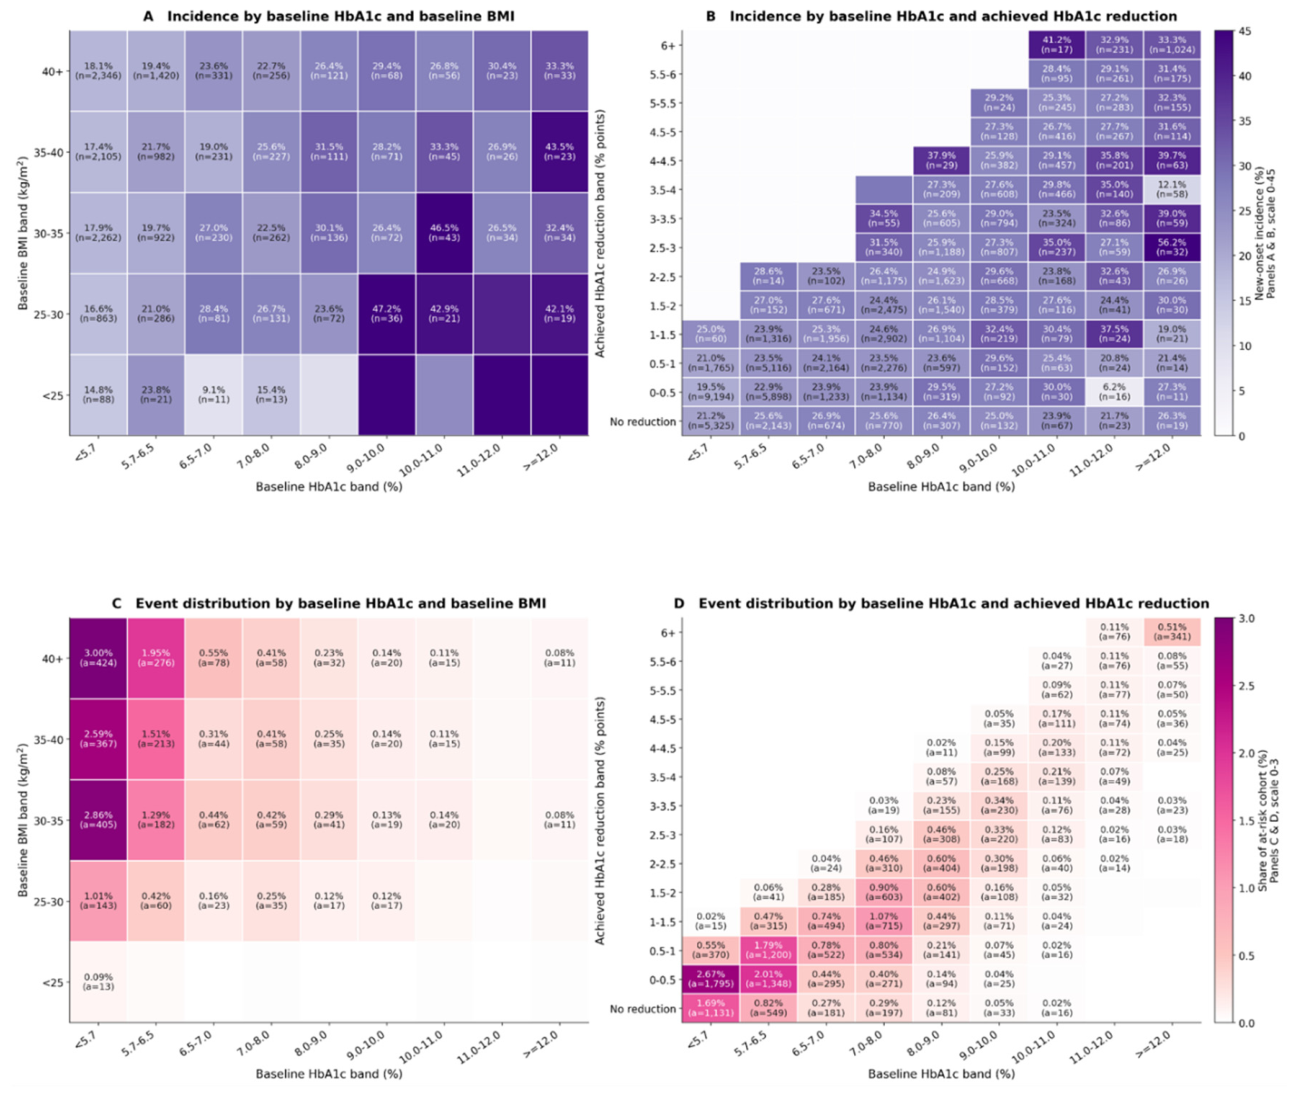
Incidence and distribution of new-onset neurosensory phenotypes according to baseline glycated hemoglobin level, body-mass index, and achieved glycated hemoglobin reduction. Panel A shows the within-cell incidence of any new-onset neurosensory phenotype according to baseline glycated hemoglobin (HbA1c) level and baseline body-mass index (BMI). Panel B shows the corresponding within-cell incidence according to baseline HbA1c level and achieved HbA1c reduction; the lowest reduction band, labeled “No reduction,” denotes no reduction or an increase in HbA1c. In Panels A and B, each cell reports the percentage of at-risk patients within that cell who developed at least one new-onset phenotype, together with the number of at-risk patients (n). These panels therefore display cell-specific risk, with darker shading indicating a higher incidence within that stratum. Panel C shows the distribution of incident events across the full pooled at-risk cohort according to baseline HbA1c level and baseline BMI, and Panel D shows the corresponding distribution of incident events according to baseline HbA1c level and achieved HbA1c reduction. In Panels C and D, each percentage represents the number of patients with a new-onset phenotype in that cell divided by the entire pooled at-risk cohort, and “a” denotes the number of affected patients in that cell. These panels therefore reflect the absolute burden or population distribution of documented events, which depends both on the incidence within a stratum and on the number of patients occupying that stratum. Accordingly, a cell may show high incidence in Panels A or B but contribute a smaller share of total events in Panels C or D if relatively few patients are in that stratum. Darker shading indicates higher within-cell incidence in Panels A and B, but a larger share of all cohort events in Panels C and D. Cells with fewer than 11 patients at risk are colored according to value but are not labeled because rates are unstable. BMI is the weight in kilograms divided by the square of the height in meters.
Figure 5.
Incidence and distribution of new-onset neurosensory phenotypes according to baseline glycated hemoglobin level, body-mass index, and achieved glycated hemoglobin reduction. Panel A shows the within-cell incidence of any new-onset neurosensory phenotype according to baseline glycated hemoglobin (HbA1c) level and baseline body-mass index (BMI). Panel B shows the corresponding within-cell incidence according to baseline HbA1c level and achieved HbA1c reduction; the lowest reduction band, labeled “No reduction,” denotes no reduction or an increase in HbA1c. In Panels A and B, each cell reports the percentage of at-risk patients within that cell who developed at least one new-onset phenotype, together with the number of at-risk patients (n). These panels therefore display cell-specific risk, with darker shading indicating a higher incidence within that stratum. Panel C shows the distribution of incident events across the full pooled at-risk cohort according to baseline HbA1c level and baseline BMI, and Panel D shows the corresponding distribution of incident events according to baseline HbA1c level and achieved HbA1c reduction. In Panels C and D, each percentage represents the number of patients with a new-onset phenotype in that cell divided by the entire pooled at-risk cohort, and “a” denotes the number of affected patients in that cell. These panels therefore reflect the absolute burden or population distribution of documented events, which depends both on the incidence within a stratum and on the number of patients occupying that stratum. Accordingly, a cell may show high incidence in Panels A or B but contribute a smaller share of total events in Panels C or D if relatively few patients are in that stratum. Darker shading indicates higher within-cell incidence in Panels A and B, but a larger share of all cohort events in Panels C and D. Cells with fewer than 11 patients at risk are colored according to value but are not labeled because rates are unstable. BMI is the weight in kilograms divided by the square of the height in meters.
Statistical Analysis
New-onset (incident) incidence proportions were summarized with Wilson score 95% confidence intervals[38]. Between-cohort relative risks (RRs) were estimated as the ratio of incidence proportions, with 95% confidence intervals from the Katz log-normal method and two-sided p-values from the Pearson chi-square test[39]; across the family of neurosensory phenotypes, p-values were corrected for multiplicity by Benjamini–Hochberg false-discovery-rate control and reported as q-values[40]. Trend in incidence across ordered exposure and metabolic-response strata was assessed with the Cochran–Armitage test for trend[41,42], which was also used to evaluate the prespecified positive control, in which neurosensory phenotype incidence, and peripheral polyneuropathy in particular, was expected to rise monotonically with glycemic burden across baseline-HbA1c and HbA1c-reduction strata. Covariate balance in the matched cohorts was quantified by the standardized mean difference (absolute value > 0.1 indicating residual imbalance), and developer-versus-non-developer comparisons were summarized as odds ratios with Benjamini–Hochberg q-values, interpreted descriptively because they condition on a post-index event[34,35,36,37]. The 12-month RR of the any-neurosensory-phenotype outcome was the prespecified primary contrast, and stratified, subgroup, and small-count comparisons were interpreted as exploratory. As a sensitivity analysis to the complete-follow-up requirement, we additionally evaluated all eligible patients with at least two index-drug prescriptions regardless of follow-up completeness, using the structured-diagnosis endpoint only, with patients censored at their last observed EHR activity; 12-month cumulative incidence in this censored cohort was estimated by the Kaplan–Meier method and compared descriptively with the fixed-window estimate. To comply with data-use privacy requirements, any condition with fewer than 11 patients or events is suppressed and reported as "<11."
Statistical Analysis Plan for Study Advancement
The analytic approach followed established pharmacoepidemiologic and biostatistical conventions throughout. The study was implemented as a distributed, federated analysis in which each academic medical center executed identical code locally and only aggregate statistics were exported and pooled, the standard privacy-preserving architecture for multi-site real-world-evidence research, and it was reported in accordance with the STROBE and RECORD frameworks[28,29,30]. The incident-user (new-user), active-comparator cohort design is the standard paradigm for drug-effect estimation from routinely-collected EHR data[31,32], and the use of two active comparators drawn from clinically adjacent treatment pathways: initiators of other glucose-lowering agents (metformin, dipeptidyl-peptidase-4 inhibitors, or sodium-glucose co-transporter-2 inhibitors) and patients undergoing bariatric surgery, was chosen to limit confounding by indication rather than relying on an untreated reference group[33].
Incident events were counted only among at-risk, phenotype-free patients, operationalized through a five-year pre-index washout that excluded any patient with three or more distinct encounter-days recording a studied phenotype, so that immortal-time and reverse-causation concerns were addressed through incident-event restriction and baseline exclusion of prevalent disease, mirroring recognized corrections for time-related bias[43]. As a prespecified positive control, we verified that event ascertainment reproduced the established, comparator-independent relationship between glycemic burden and peripheral neuropathy, anchored by the demonstration that intensive glycemic control reduces long-term neuropathy risk, so that faithful reproduction of this known biological gradient supports unbiased ascertainment[44]. The pooled relative risk, obtained by summing the contributing 2×2 tables across centers before estimation, was the prespecified primary contrast, whereas stratified, subgroup, and small-count comparisons were interpreted as exploratory and presented without further multiplicity adjustment beyond the phenotype-family false-discovery-rate control[40].
Institutional Review Board (IRB) Statement, Informed Consent Statement, De-identification and HIPAA Compliance Certification
Prior to analysis, all EHR data were de-identified under an expert determination consistent with the Health Insurance Portability and Accountability Act (HIPAA) Privacy Rule (45 CFR §164.514(b)(1)). The de-identification methodology[45,46] employed a multi-layered transformation approach to both structured and unstructured data fields. In structured data, direct identifiers including patient names and precise geographic locations were excluded entirely, while indirect identifiers underwent specific transformations: patient identifiers, medical record numbers, and accession numbers were replaced with one-way cryptographic hashes using confidential salts to preserve linkage across patient encounters; all dates were shifted backward by patient-specific random offsets (1 to 31 days) to preserve temporal relationships while obscuring exact event timing; ZIP codes were truncated to two-digit state-level resolution; and continuous variables including age, height, weight, and body mass index were thresholded to prevent identification of extreme values (for example, ages 89 years or older transformed to '89+' and BMI over 40 transformed to '40+'). In clinical text, an ensemble de-identification system that combines attention-based deep learning with rule-based methods achieved an estimated >99% recall for personally identifiable information (PII) detection, with detected identifiers replaced by plausible fictional surrogates. Institutional Review Board Statement and Informed Consent Statement are not applicable.
Data Harmonization
To address heterogeneity in EHR data, we harmonized clinical variables including medications, anthropometric measurements, and diagnoses to standardized concepts. For medications, we first constructed a standardized drug concept database combining the nference knowledge graph with RxNorm hierarchies to capture ingredient, brand, and dose-specific information. Medication records were matched using a hierarchical approach prioritizing RxNorm codes when available, followed by ingredient-level matching, and finally natural language processing and pattern matching on free-text medication orders when structured codes were absent. For anthropometric measurements (height, weight, body mass index), we created a unified vocabulary from SNOMED and LOINC and matched EHR measurement descriptions using standardized text matching algorithms with abbreviation expansion and synonym resolution; ambiguous mappings were resolved using OpenAI GPT-4o with summary statistics as context, followed by manual verification. For diagnoses, we developed a hierarchical disease concept database from the knowledge graph and matched EHR diagnosis records by identifying the most specific common child concept in the hierarchy.
Code Availability
The analysis code is not publicly available. The corresponding author should be contacted for additional details.
Results
Cohort Construction and Follow-Up Sensitivity
Across the U.S. federated data network, 670,422 either tirzepatide or semaglutide initiators were ascertained with initiation dates between January 2018 and March 2025; 339,763 had at least two prescriptions within 12 months, of whom 198,576 had complete 12-month follow-up. The primary fixed-window analysis required complete follow-up to provide a common 12-month observation period across patients. After excluding patients with documentation of at least one neurosensory phenotype during the baseline period, the analytic at-risk cohort comprised 128,377 patients (Figure 1). Propensity-score matching yielded 42,093 GLP-1 and antidiabetic patients per arm and 15,727 GLP-1 and bariatric-surgery patients per arm. These matched counts preceded the baseline neurosensory-phenotype exclusion; after excluding patients with a baseline phenotype, the at-risk cohorts used for the risk-ratio analyses comprised 28,399 GLP-1 versus 32,359 antidiabetic patients and 10,619 GLP-1 versus 11,081 bariatric-surgery patients (A and 4B). Baseline characteristics before and after matching are shown in A-1B and in Figure 9.
Because requiring at least two prescriptions and complete follow-up preferentially retains patients who remained observable within the health system, we performed a new-user, intention-to-treat sensitivity analysis that included all first-fill initiators without a second-prescription or complete-follow-up requirement, censored each patient at the last observed activity, and propensity-matched the arms (Figure 14). The lower risk associated with GLP-1 initiation persisted: the 12-month cumulative incidence of any neurosensory phenotype was 16.8% versus 20.8% for anti-diabetic initiators and 20.0% versus 29.0% for bariatric-surgery recipients, consistent with the primary matched estimates and indicating the post-index eligibility criteria did not drive the findings.
Incidence of Neurosensory Phenotypes in the Pooled GLP-1 Cohort
Within 12 months of initiation, 23.0% of at-risk GLP-1 users developed at least one of the new-onset neurosensory phenotypes (Figure 2). The cumulative incidence was driven predominantly by nonpainful sensory manifestations, with the highest being numbness or hypoesthesia (12.6%, 95% CI 12.4-12.8, N=16,143) and paresthesia (12.0%, 11.8-12.2, N=15,415). These were followed by radiculopathy or sciatica (6.6%, 6.5-6.8, N=8,534), polyneuropathy (3.6%, 3.5-3.7, N=4,656), focal mononeuropathy (2.6%, 2.5-2.7, N=3,321), and painful dysesthesia (1.6%, 1.5-1.7, N=2,060). Lower rates were observed for dysesthesia/altered skin sensation (0.6%, N=742), allodynia (0.2%, N=263), postherpetic neuralgia (0.2%, N=201), hyperesthesia (0.1%, N=95), and causalgia (0.1%, N=82). Erythromelalgia, neuropathic itch, and thermal dysesthesia were all observed in less than 11 patients (Figure 2, Table 3).
Baseline Glycemic Burden Was the Strongest and Most Reproducible Positive Correlate of Neurosensory Events, with an Inverse Gradient Across Prescription Count, Whereas No Ordered Association Was Observed with the Magnitude of Documented Weight Loss
Incidence of any neurosensory phenotype showed no ordered association with maximum achieved weight loss (P=0.867; Figure 3A), baseline BMI (P=0.784; Figure 3B), or change in BMI (P=0.740; Figure 3C). In contrast, incidence increased across baseline HbA1c strata (P<0.001; Figure 3D) and across achieved HbA1c-reduction strata (P<0.001; Figure 3E), with incidence lowest at a 0–0.5-point reduction (21.4%) and highest among patients with a reduction of at least 1 percentage point (26.9%). Incidence also declined with increasing prescription count (P<0.001; Figure 3F).
Phenotype-Specific Incidence Patterns
Hypoesthesia incidence showed no ordered association with maximum achieved weight loss, baseline BMI, or BMI reduction (P=0.640, P=0.331, and P=0.649, respectively; Figure 4 - Hypoesthesia A through C). Incidence increased across baseline HbA1c strata and showed a nonmonotonic association with achieved HbA1c reduction, with the highest incidence among patients with a reduction of at least 1 percentage point (P<0.001 for both; Figure 4 - Hypoesthesia D and E). Incidence declined with increasing prescription count (P<0.001; Figure 4 - Hypoesthesia F).
Similarly, paresthesia incidence showed no ordered association with maximum achieved weight loss, baseline BMI, or BMI reduction (P=0.297, P=0.694, and P=0.298, respectively; Figure 4 - Paresthesia A through C). Incidence increased across higher baseline HbA1c strata and was highest among patients with an HbA1c reduction of at least 1 percentage point, although the latter pattern was nonmonotonic (P<0.001 for both; Figure 4 - Paresthesia D and E). Incidence decreased across increasing prescription-count strata (P<0.001; Figure 4 - Paresthesia F).
Radiculopathy or sciatica incidence showed no ordered association with maximum achieved weight loss, baseline BMI, or BMI reduction (P=0.072, P=0.753, and P=0.610, respectively; Figure 4 - Radiculopathy A through C). No significant trends were observed across baseline HbA1c or achieved HbA1c-reduction strata (P=0.112 and P=0.930, respectively; Figure 4 - Radiculopathy D and E). Incidence declined with increasing prescription count (P<0.001; Figure 4 - Radiculopathy F).
Likewise, polyneuropathy incidence showed no ordered association with maximum achieved weight loss, baseline BMI, or BMI reduction (P=0.704, P=0.317, and P=0.642, respectively; Figure 4 - Polyneuropathy A through C). In contrast, incidence increased markedly across higher baseline HbA1c strata (P<0.001; Figure 4 - Polyneuropathy D). Incidence also varied nonmonotonically with achieved HbA1c reduction and was highest among patients with a reduction of at least 1 percentage point (P<0.001; Figure 4 - Polyneuropathy E). Incidence decreased progressively with increasing prescription count (P<0.001; Figure 4 - Polyneuropathy F).
Mononeuropathy incidence showed no ordered association with maximum achieved weight loss or BMI reduction (P=0.227 and P=0.177, respectively; Figure 4, Mononeuropathy A and C). In contrast to the other major phenotypes, incidence increased across baseline BMI strata (P<0.001; Figure 4 - Mononeuropathy B). Neither baseline HbA1c nor achieved HbA1c reduction showed an ordered association with incidence (P=0.395 and P=0.255, respectively; Figure 4 - Mononeuropathy D and E), whereas incidence declined with increasing prescription count (P<0.001; Figure 4- Mononeuropathy F).
Painful dysesthesia incidence showed no ordered association with maximum achieved weight loss, baseline BMI, or BMI reduction (P=0.916, P=0.254, and P=0.690, respectively; Figure 4 - Painful Dysesthesia A through C). Incidence increased across baseline HbA1c strata and showed a nonmonotonic association with HbA1c reduction, with the highest incidence among patients with a reduction of at least 1 percentage point (P<0.001 for both; Figure 4 - Painful Dysesthesia D and E). Incidence decreased with increasing prescription count (P<0.001; Figure 4 - Painful Dysesthesia F).
Allodynia was uncommon, and estimates within several strata were imprecise. No significant trend was observed across maximum achieved weight-loss strata (P=0.053), although incidence was numerically highest in the 20-to-30% weight-loss stratum (Figure 4 - Allodynia A). No ordered trends were observed across baseline BMI or BMI-reduction strata (P=0.357 and P=0.485, respectively; Figure 4 - Allodynia B and C). Incidence varied nonmonotonically across baseline HbA1c strata (P=0.016), whereas the trend across HbA1c-reduction strata was not significant (P=0.140; Figure 4 - Allodynia D and E). Unlike the more common phenotypes, allodynia incidence increased across prescription-count strata (P=0.021; Figure 4 - Allodynia F).
Dysesthesia incidence remained low. It showed no ordered association with maximum achieved weight loss or BMI reduction (P=0.779 and P=0.696, respectively; Figure 4 - Dysesthesia A and C) but varied nonmonotonically across baseline BMI strata (P=0.008; Figure 4 - Dysesthesia B). In contrast to the more common phenotypes, incidence decreased across higher baseline HbA1c strata (P<0.001; Figure 4 - Dysesthesia D), varied nonmonotonically with achieved HbA1c reduction (P=0.010; Figure 4 - Dysesthesia E), and increased with increasing prescription count (P<0.001; Figure 4 - Dysesthesia F).
Joint stratification Distinguished Individual Incidence from Cohort-Level Event Burden
Joint stratification reinforced the association between neurosensory phenotype incidence and baseline glycemic burden. Within each baseline-BMI stratum, incidence increased with higher baseline HbA1c (Cochran–Armitage P for trend <0.001 in every stratum with BMI ≥25; P=0.05 in the sparse <25 kg/m2 stratum), whereas no consistent gradient was evident across BMI categories within the same HbA1c band, consistent with the flat marginal baseline-BMI association (Figure 5A; Figure 3B, P=0.784). Among patients who achieved an HbA1c reduction of at least 1 percentage point, incidence increased from 24.6% at a baseline HbA1c below 5.7% to 32.7% at a baseline HbA1c of at least 12% (P for trend <0.001; Figure 5B). Thus, the joint-stratified analyses were consistent with the baseline HbA1c gradient and nonmonotonic association with achieved HbA1c reduction shown in Figure 3, without revealing a consistent additional BMI gradient. Estimates from sparsely populated cells should be interpreted cautiously.
The distribution of events across the cohort differed from the within-cell incidence pattern. Although incidence was highest in several strata characterized by severe baseline hyperglycemia, a large proportion of events accrued among patients with a baseline HbA1c below 6.5% and a BMI of 30 or higher, reflecting the larger number of at-risk patients in these strata (Figure 5C). Similarly, events were distributed between patients with lower baseline HbA1c and little or no HbA1c reduction and patients with higher baseline HbA1c who achieved reductions of at least 1 percentage point (Figure 5D). These findings distinguish higher individual incidence associated with greater baseline glycemic burden from the broader cohort-level burden arising in more prevalent, lower HbA1c strata.
GLP-1 Initiation Was Associated with Lower 12-Month Risk of New-Onset Neurosensory Phenotypes Than Matched Anti-Diabetic and Bariatric-Surgery Comparators
In the matched comparison with initiators of non–GLP-1 antidiabetic medications (PS-5), GLP-1 initiators had a lower 12-month risk of developing at least one neurosensory phenotype (5,591 of 28,399 patients [19.7%] for GLP-1 initiators vs. 8,274 of 32,359 [25.6%] for antidiabetic initiators; RR, 0.77; 95% CI, 0.75 to 0.79; P<0.001; q<0.001) (Figure 6 and Table 4A). After correction for multiple comparisons, lower risks were observed for hypoesthesia (RR, 0.71; 95% CI, 0.68 to 0.74), paresthesia (RR, 0.75; 95% CI, 0.72 to 0.79), radiculopathy or sciatica (RR, 0.86; 95% CI, 0.81 to 0.91), polyneuropathy (RR, 0.53; 95% CI, 0.48 to 0.58), mononeuropathy (RR, 0.87; 95% CI, 0.79 to 0.96), and painful dysesthesia (RR, 0.71; 95% CI, 0.62 to 0.80) (q<0.05 for all). No significant between-group differences were observed for unspecified dysesthesia, allodynia, postherpetic neuralgia, hyperesthesia, or causalgia, and estimates for the remaining rare phenotypes were limited by sparse events.
In the matched comparison with bariatric-surgery recipients (PS-6), which additionally balanced achieved weight loss, GLP-1 initiators also had a lower 12-month risk of developing at least one neurosensory phenotype (2,245 of 10,619 patients [21.1%] for GLP-1 initiators vs. 2,988 of 11,081 [27.0%] for bariatric-surgery recipients; RR, 0.78; 95% CI, 0.75 to 0.82; P<0.001; q<0.001) (Figure 7 and Table 4B). Lower risks after multiplicity correction were observed for hypoesthesia (RR, 0.64; 95% CI, 0.60 to 0.69), paresthesia (RR, 0.82; 95% CI, 0.76 to 0.88), polyneuropathy (RR, 0.55; 95% CI, 0.47 to 0.63), and painful dysesthesia (RR, 0.69; 95% CI, 0.57 to 0.83). Radiculopathy or sciatica and focal mononeuropathy did not differ significantly between groups (RR, 1.06 and 0.98). Unspecified dysesthesia was more frequent among GLP-1 initiators in this comparison (RR, 1.68; 95% CI, 1.27 to 2.22). The persistence of the composite association after matching on achieved weight loss was consistent with the absence of a weight-loss gradient within the GLP-1 cohort (Figure 3A-3C), indicating that achieved weight loss did not account for the lower risk observed relative to bariatric surgery, and that neurosensory risk tracked glycemic burden rather than the magnitude of weight loss.
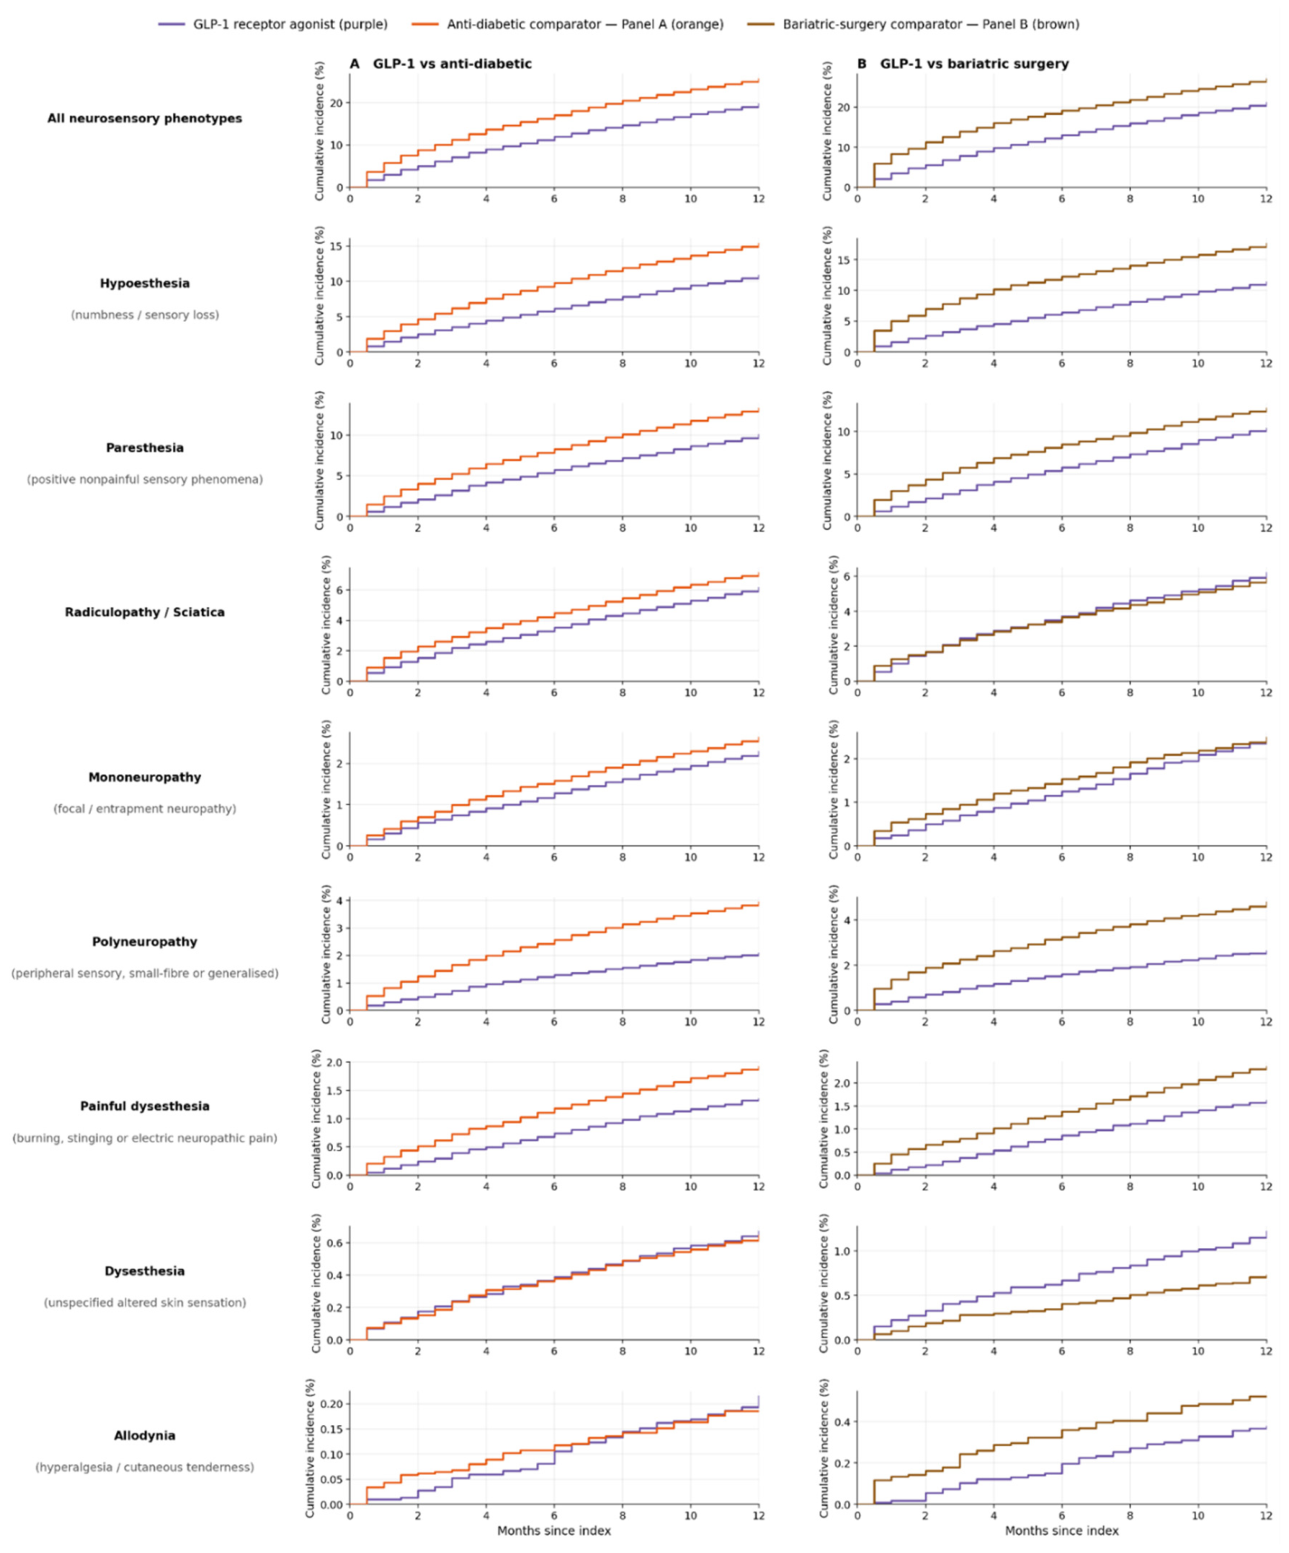
Cumulative-incidence curves showed that neurosensory events accrued throughout the 12-month follow-up period (Figure 8). In the comparison with non–GLP-1 antidiabetic medications, the curves separated early and remained lower among GLP-1 initiators through month 12 for the composite outcome and most common individual phenotypes (Figure 8A). Similar early and sustained separation was observed in the comparison with bariatric-surgery recipients, particularly for hypoesthesia, paresthesia, polyneuropathy, and painful dysesthesia (Figure 8B). Curves were more closely aligned for radiculopathy or sciatica, mononeuropathy, allodynia, and unspecified dysesthesia, consistent with the smaller or nonsignificant risk ratios for these outcomes in Figure 6 and Figure 7. Together with the within-cohort analyses in Figure 3, Figure 4 and Figure 5, these findings indicate that greater baseline glycemic burden was associated with higher absolute neurosensory phenotype incidence among GLP-1 initiators, whereas their risk remained lower than that of either the matched antidiabetic or bariatric surgery comparators.
Figure 6.
New-onset risk ratios by phenotype for (A) PS-5-matched GLP-1 versus anti-diabetic comparator (age, sex, race, baseline BMI, type-2 diabetes). Katz 95% confidence intervals; chi-square p; Benjamini–Hochberg false-discovery-rate q; events/at-risk shown per arm. The associated data for this figure is summarized in Table 4A. Estimates are associations, not causal effects. Figure S1 adds further residual imbalances identified in Table S3 as additional covariates in a more stringent propensity matching.
Figure 6.
New-onset risk ratios by phenotype for (A) PS-5-matched GLP-1 versus anti-diabetic comparator (age, sex, race, baseline BMI, type-2 diabetes). Katz 95% confidence intervals; chi-square p; Benjamini–Hochberg false-discovery-rate q; events/at-risk shown per arm. The associated data for this figure is summarized in Table 4A. Estimates are associations, not causal effects. Figure S1 adds further residual imbalances identified in Table S3 as additional covariates in a more stringent propensity matching.
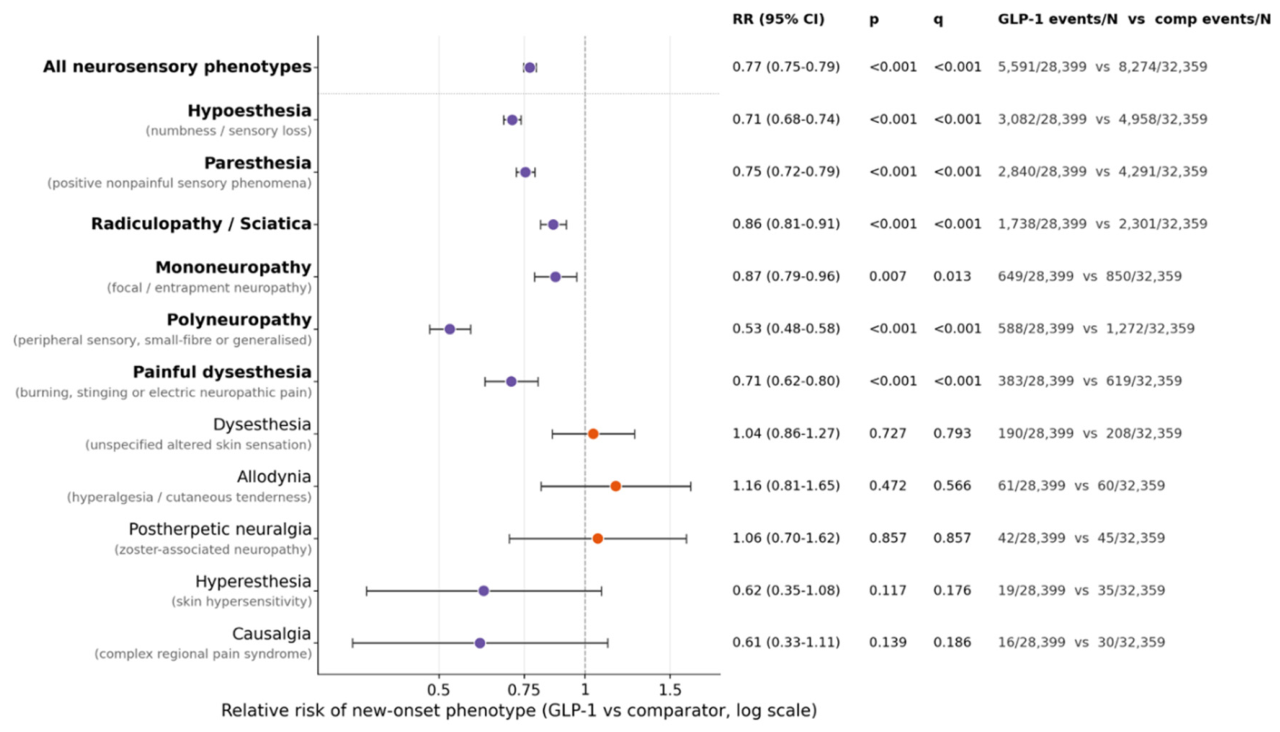
Figure 7.
New-onset risk ratios by phenotype for PS-6 matched GLP-1 versus bariatric-surgery comparator (additionally balanced on achieved weight loss). The associated data for this figure is summarized in Table 4B. Estimates are associations, not causal effects. Figure S2 adds further residual imbalances identified in Table S3 as additional covariates in a more stringent propensity matching.
Figure 7.
New-onset risk ratios by phenotype for PS-6 matched GLP-1 versus bariatric-surgery comparator (additionally balanced on achieved weight loss). The associated data for this figure is summarized in Table 4B. Estimates are associations, not causal effects. Figure S2 adds further residual imbalances identified in Table S3 as additional covariates in a more stringent propensity matching.
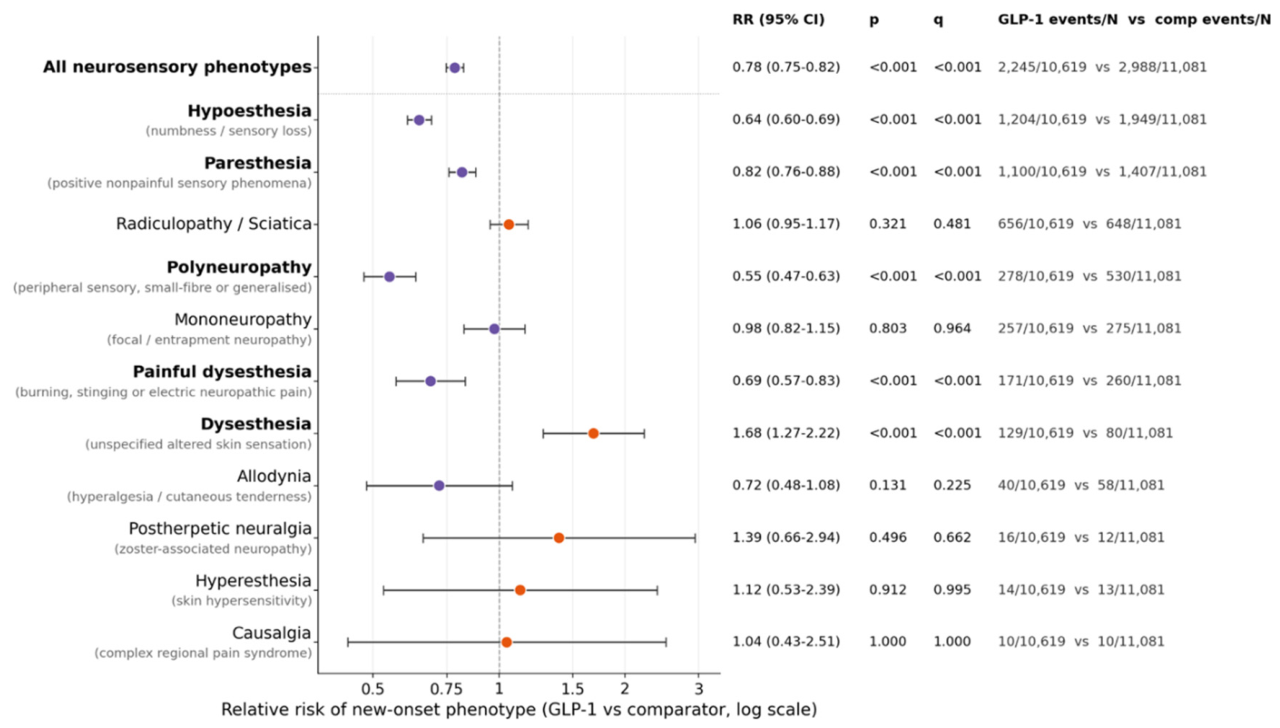
Figure 8.
Cumulative Incidence of New-Onset Neurosensory Phenotypes over 12 Months in the Propensity-Score–Matched Cohorts. Panel A shows GLP-1 receptor agonist initiators and matched initiators of non–GLP-1 antidiabetic medications in the PS-5 analysis. Panel B shows GLP-1 receptor agonist initiators and matched bariatric-surgery recipients in the PS-6 analysis, which additionally balanced achieved weight loss. Each curve represents the cumulative percentage of baseline at-risk patients who had developed the indicated phenotype by each month after the index date; 12-month RRs and 95% CIs are in Figure 6 and Figure 7 and Table 4A and Table 4B.
Figure 8.
Cumulative Incidence of New-Onset Neurosensory Phenotypes over 12 Months in the Propensity-Score–Matched Cohorts. Panel A shows GLP-1 receptor agonist initiators and matched initiators of non–GLP-1 antidiabetic medications in the PS-5 analysis. Panel B shows GLP-1 receptor agonist initiators and matched bariatric-surgery recipients in the PS-6 analysis, which additionally balanced achieved weight loss. Each curve represents the cumulative percentage of baseline at-risk patients who had developed the indicated phenotype by each month after the index date; 12-month RRs and 95% CIs are in Figure 6 and Figure 7 and Table 4A and Table 4B.
Residual Covariate Balance After Propensity-Score Matching
After matching, most prespecified matching variables met the conventional balance threshold of an absolute standardized mean difference (SMD) of 0.10 or less, although clinically relevant residual imbalances remained (Figure 9 and Tables 1A and 1B). In the matched analysis against initiators of other antidiabetic medications, the magnitude of achieved weight loss, which was not included in the PS-5 matching model, remained greater among GLP-1 initiators (SMD, +0.347). The largest additional imbalances included more obesity (SMD, +0.550), anxiety disorder (+0.246), gastroesophageal reflux disease (+0.157), and depression (+0.151) among GLP-1 initiators, and more heart failure (−0.415), atrial fibrillation (−0.188), polycystic ovary syndrome (−0.177), and atherosclerotic cardiovascular or ischemic heart disease (−0.138) among antidiabetic comparators (Table 1A).
Figure 9.
Balance of Baseline Characteristics and Achieved Weight Loss Before and After Matching. Panel A shows the comparison between GLP-1 receptor agonist initiators and initiators of non–GLP-1 antidiabetic medications in the PS-5 analysis, with 42,093 patients per arm. The propensity-score model included age at index, sex, race, baseline body-mass index (BMI), and baseline type 2 diabetes. Panel B shows the comparison between GLP-1 receptor agonist initiators and bariatric-surgery recipients in the PS-6 weight-loss–balanced analysis, with 15,727 patients per arm; this model included the same five variables and additionally incorporated maximum achieved weight loss. Open circles indicate standardized mean differences (SMDs) before matching, and filled circles indicate SMDs after matching; horizontal lines connect the before- and after-matching estimates for each characteristic. SMDs are signed and calculated as the value in the GLP-1 group minus that in the comparator group, such that positive values indicate a higher mean or prevalence in the GLP-1 group and negative values indicate a higher mean or prevalence in the comparator group. Filled markers are gray when the absolute SMD is 0.10 or less, purple when the SMD is greater than 0.10, and orange when the SMD is less than −0.10. Dashed vertical lines mark SMDs of −0.10, 0, and 0.10. Triangles at the plot boundaries denote SMDs outside the displayed range, with the corresponding value shown. Maximum achieved weight loss is a post-index measure and was included in matching only in Panel B. Characteristics below the horizontal divider were evaluated as additional balance diagnostics and were not included in either matching model. Data are summarized in Table 1A and Table 1B. ASCVD denotes atherosclerotic cardiovascular disease; COPD, chronic obstructive pulmonary disease; and GERD, gastroesophageal reflux disease.
Figure 9.
Balance of Baseline Characteristics and Achieved Weight Loss Before and After Matching. Panel A shows the comparison between GLP-1 receptor agonist initiators and initiators of non–GLP-1 antidiabetic medications in the PS-5 analysis, with 42,093 patients per arm. The propensity-score model included age at index, sex, race, baseline body-mass index (BMI), and baseline type 2 diabetes. Panel B shows the comparison between GLP-1 receptor agonist initiators and bariatric-surgery recipients in the PS-6 weight-loss–balanced analysis, with 15,727 patients per arm; this model included the same five variables and additionally incorporated maximum achieved weight loss. Open circles indicate standardized mean differences (SMDs) before matching, and filled circles indicate SMDs after matching; horizontal lines connect the before- and after-matching estimates for each characteristic. SMDs are signed and calculated as the value in the GLP-1 group minus that in the comparator group, such that positive values indicate a higher mean or prevalence in the GLP-1 group and negative values indicate a higher mean or prevalence in the comparator group. Filled markers are gray when the absolute SMD is 0.10 or less, purple when the SMD is greater than 0.10, and orange when the SMD is less than −0.10. Dashed vertical lines mark SMDs of −0.10, 0, and 0.10. Triangles at the plot boundaries denote SMDs outside the displayed range, with the corresponding value shown. Maximum achieved weight loss is a post-index measure and was included in matching only in Panel B. Characteristics below the horizontal divider were evaluated as additional balance diagnostics and were not included in either matching model. Data are summarized in Table 1A and Table 1B. ASCVD denotes atherosclerotic cardiovascular disease; COPD, chronic obstructive pulmonary disease; and GERD, gastroesophageal reflux disease.
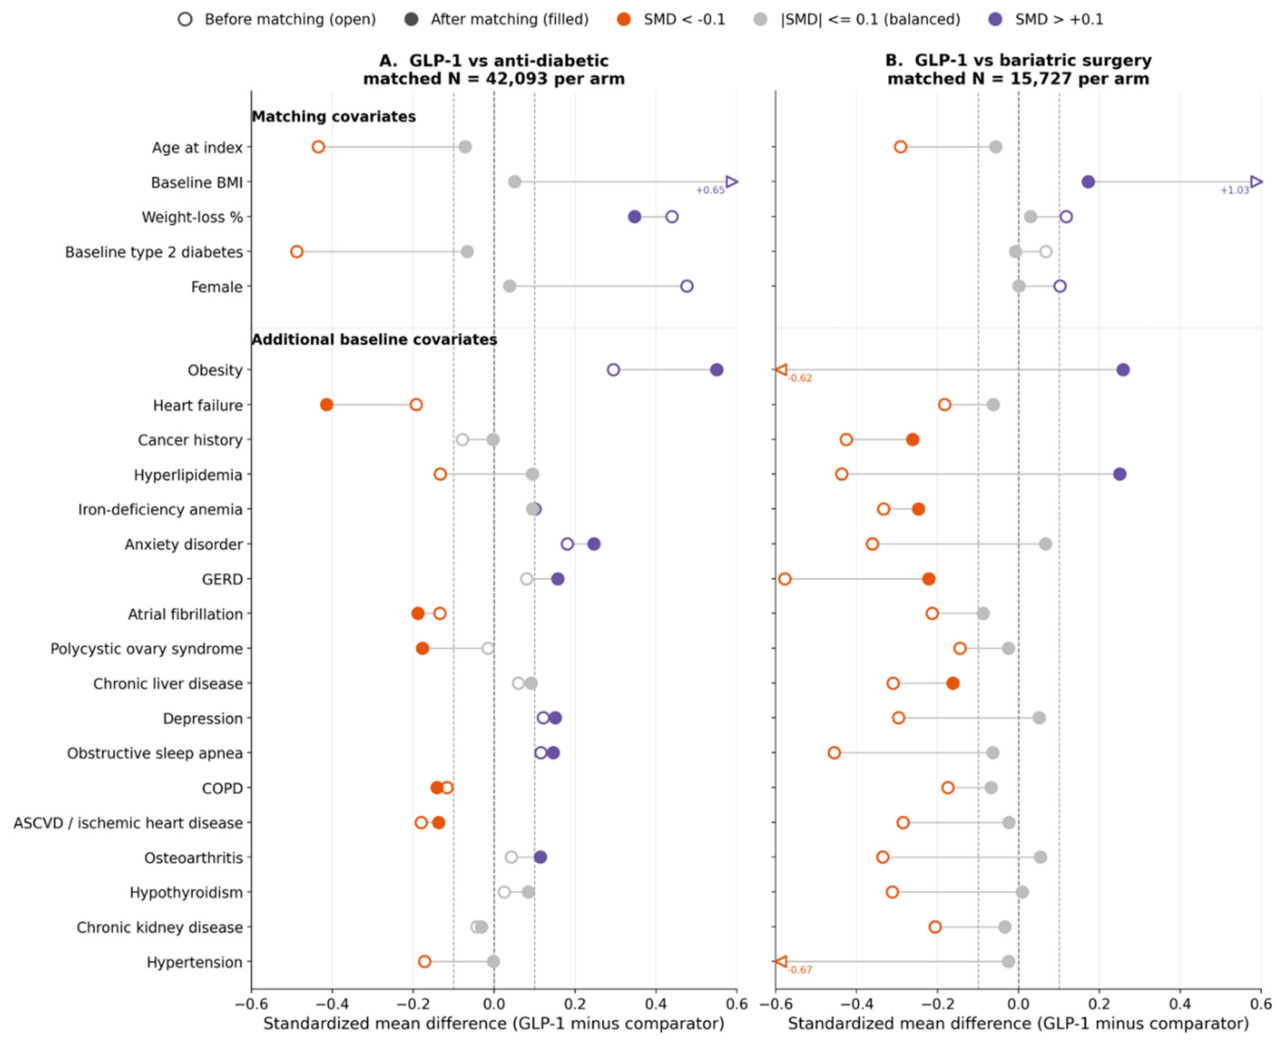
In the matched analysis against bariatric-surgery recipients, the magnitude of achieved weight loss was balanced (SMD, +0.027), but baseline BMI remained higher among GLP-1 initiators (SMD, +0.171). GLP-1 initiators also had more obesity (+0.258) and hyperlipidemia (+0.250), whereas bariatric-surgery recipients had more cancer history (−0.262), iron-deficiency anemia (−0.247), gastroesophageal reflux disease (−0.222), and chronic liver disease (−0.163) (Table 1B). The persistence of lower neurosensory risk in the PS-6 analysis after balancing achieved weight loss was consistent with the absence of a weight-loss gradient in Figure 3, Figure 4 and Figure 5, but residual imbalance in baseline BMI and comorbidities in this observational study precluded any causal attribution.
Comparator-Dependent Gastrointestinal Control Outcomes
Gastrointestinal control outcomes varied according to the comparator (Figure 10). In the comparison with other antidiabetic medications, nausea (RR, 1.05; 95% CI, 1.02 to 1.09) and constipation (RR, 1.11; 95% CI, 1.07 to 1.16) were more frequent among GLP-1 initiators, whereas vomiting (RR, 0.91; 95% CI, 0.88 to 0.95) and diarrhea (RR, 0.69; 95% CI, 0.66 to 0.72) were less frequent (q<0.01 for all) (Figure 10A). In the comparison with bariatric surgery, GLP-1 initiators had lower risks of nausea (RR, 0.88; 95% CI, 0.83 to 0.93), constipation (RR, 0.76; 95% CI, 0.72 to 0.80), vomiting (RR, 0.65; 95% CI, 0.61 to 0.69), and diarrhea (RR, 0.62; 95% CI, 0.58 to 0.66) (q<0.001 for all) (Figure 10B).
Figure 10.
Gastrointestinal-symptom risk ratios in the matched cohorts. Shown are positive-control gastrointestinal outcomes in the propensity-score–matched comparisons of GLP-1 receptor agonist (GLP-1RA) initiators versus matched initiators of non–GLP-1 antidiabetic medications (Panel A) and versus matched bariatric-surgery recipients (Panel B). Panel A compares GLP-1RA initiators with initiators of metformin, dipeptidyl-peptidase-4 (DPP-4) inhibitors, or sodium-glucose cotransporter-2 (SGLT2) inhibitors. Panel B compares GLP-1RA initiators with bariatric-surgery recipients. For each outcome, dots indicate the risk ratio (RR), horizontal lines indicate the 95% confidence interval, p values are from the chi-square test, and q values are from the Benjamini–Hochberg false-discovery-rate procedure. The counts shown are events divided by the number at risk in each arm after exclusion of patients with that outcome present at baseline; therefore, the at-risk denominator differs by outcome. An RR greater than 1 indicates a higher 12-month risk in the GLP-1RA arm, whereas an RR less than 1 indicates a higher risk in the comparator arm.
Figure 10.
Gastrointestinal-symptom risk ratios in the matched cohorts. Shown are positive-control gastrointestinal outcomes in the propensity-score–matched comparisons of GLP-1 receptor agonist (GLP-1RA) initiators versus matched initiators of non–GLP-1 antidiabetic medications (Panel A) and versus matched bariatric-surgery recipients (Panel B). Panel A compares GLP-1RA initiators with initiators of metformin, dipeptidyl-peptidase-4 (DPP-4) inhibitors, or sodium-glucose cotransporter-2 (SGLT2) inhibitors. Panel B compares GLP-1RA initiators with bariatric-surgery recipients. For each outcome, dots indicate the risk ratio (RR), horizontal lines indicate the 95% confidence interval, p values are from the chi-square test, and q values are from the Benjamini–Hochberg false-discovery-rate procedure. The counts shown are events divided by the number at risk in each arm after exclusion of patients with that outcome present at baseline; therefore, the at-risk denominator differs by outcome. An RR greater than 1 indicates a higher 12-month risk in the GLP-1RA arm, whereas an RR less than 1 indicates a higher risk in the comparator arm.
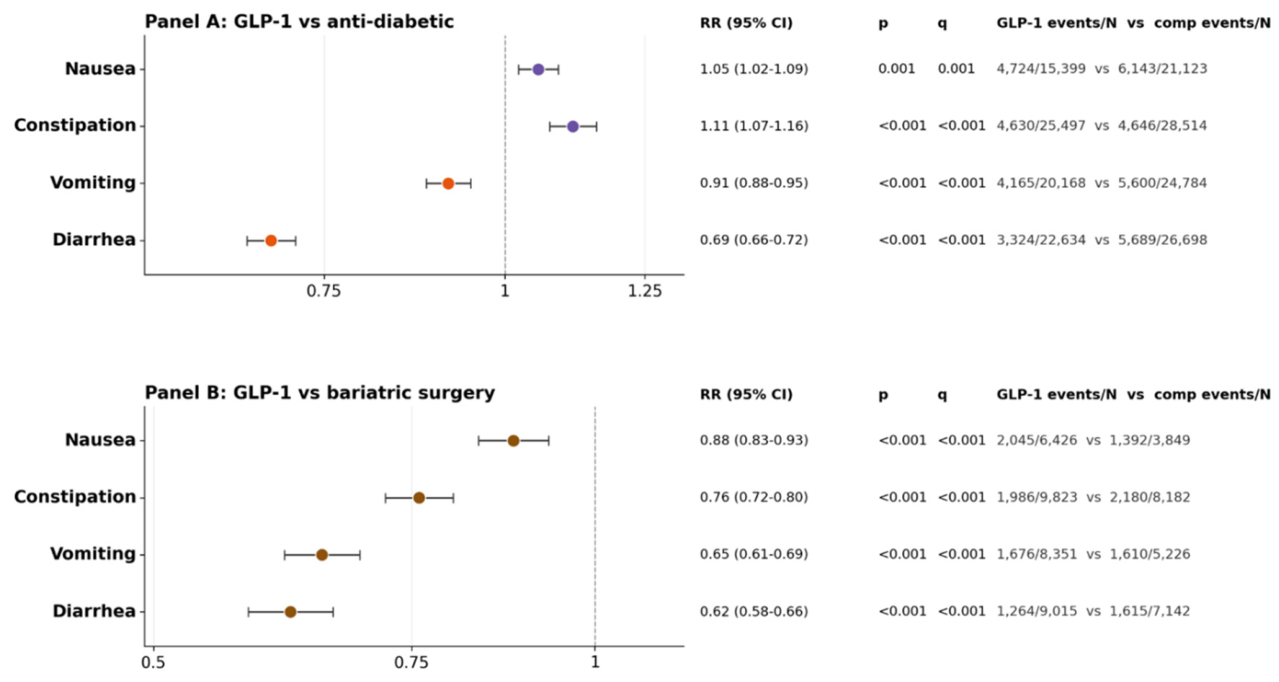
Because non–GLP-1 antidiabetic treatments and bariatric surgery are themselves gastrointestinally active, these analyses did not provide a positive control with a uniform expected direction. The comparator-dependent gastrointestinal pattern contrasted with the directionally consistent lower neurosensory risk observed across both matched comparisons in Figure 6 and Figure 7. Nevertheless, the gastrointestinal findings should be interpreted only as relative comparisons with active treatment groups and not as evidence that GLP-1 initiation reduces absolute gastrointestinal risk.
Baseline Glycemic and Cardiopulmonary Burden Was Enriched Among Phenotype Developers
Among 29,519 patients who developed at least one neurosensory phenotype and 98,858 nondevelopers, the strongest baseline enrichment was observed for chronic obstructive pulmonary disease (OR, 1.63; 95% CI, 1.42 to 1.87; q<0.001) (Figure 11 and Table 5). Developers were also more likely to have a baseline HbA1c of at least 12% (OR, 1.53; 95% CI, 1.39 to 1.68), heart failure (OR, 1.52; 95% CI, 1.35 to 1.70), age of at least 65 years (OR, 1.46; 95% CI, 1.42 to 1.51), baseline dysglycemia defined by an HbA1c of at least 5.7% (OR, 1.43; 95% CI, 1.37 to 1.49), type 2 diabetes (OR, 1.35; 95% CI, 1.29 to 1.42), chronic kidney disease (OR, 1.35; 95% CI, 1.24 to 1.46), and atherosclerotic cardiovascular or ischemic heart disease (OR, 1.35; 95% CI, 1.26 to 1.45) (q<0.001 for all). Increasing baseline HbA1c bands were generally enriched among developers, consistent with the glycemic gradient observed in Figure 3, Figure 4 and Figure 5.
Figure 11.
Baseline and treatment features enriched among developers versus non-developers of any neurosensory phenotype in the pooled unmatched GLP-1 initiator cohort. Odds ratio of each feature among developers vs non-developers with 95% confidence interval; chi-square p; Benjamini–Hochberg q; feature prevalence (developers vs non-developers) reported at right. The associated data for this figure is summarized in Table 5.
Figure 11.
Baseline and treatment features enriched among developers versus non-developers of any neurosensory phenotype in the pooled unmatched GLP-1 initiator cohort. Odds ratio of each feature among developers vs non-developers with 95% confidence interval; chi-square p; Benjamini–Hochberg q; feature prevalence (developers vs non-developers) reported at right. The associated data for this figure is summarized in Table 5.
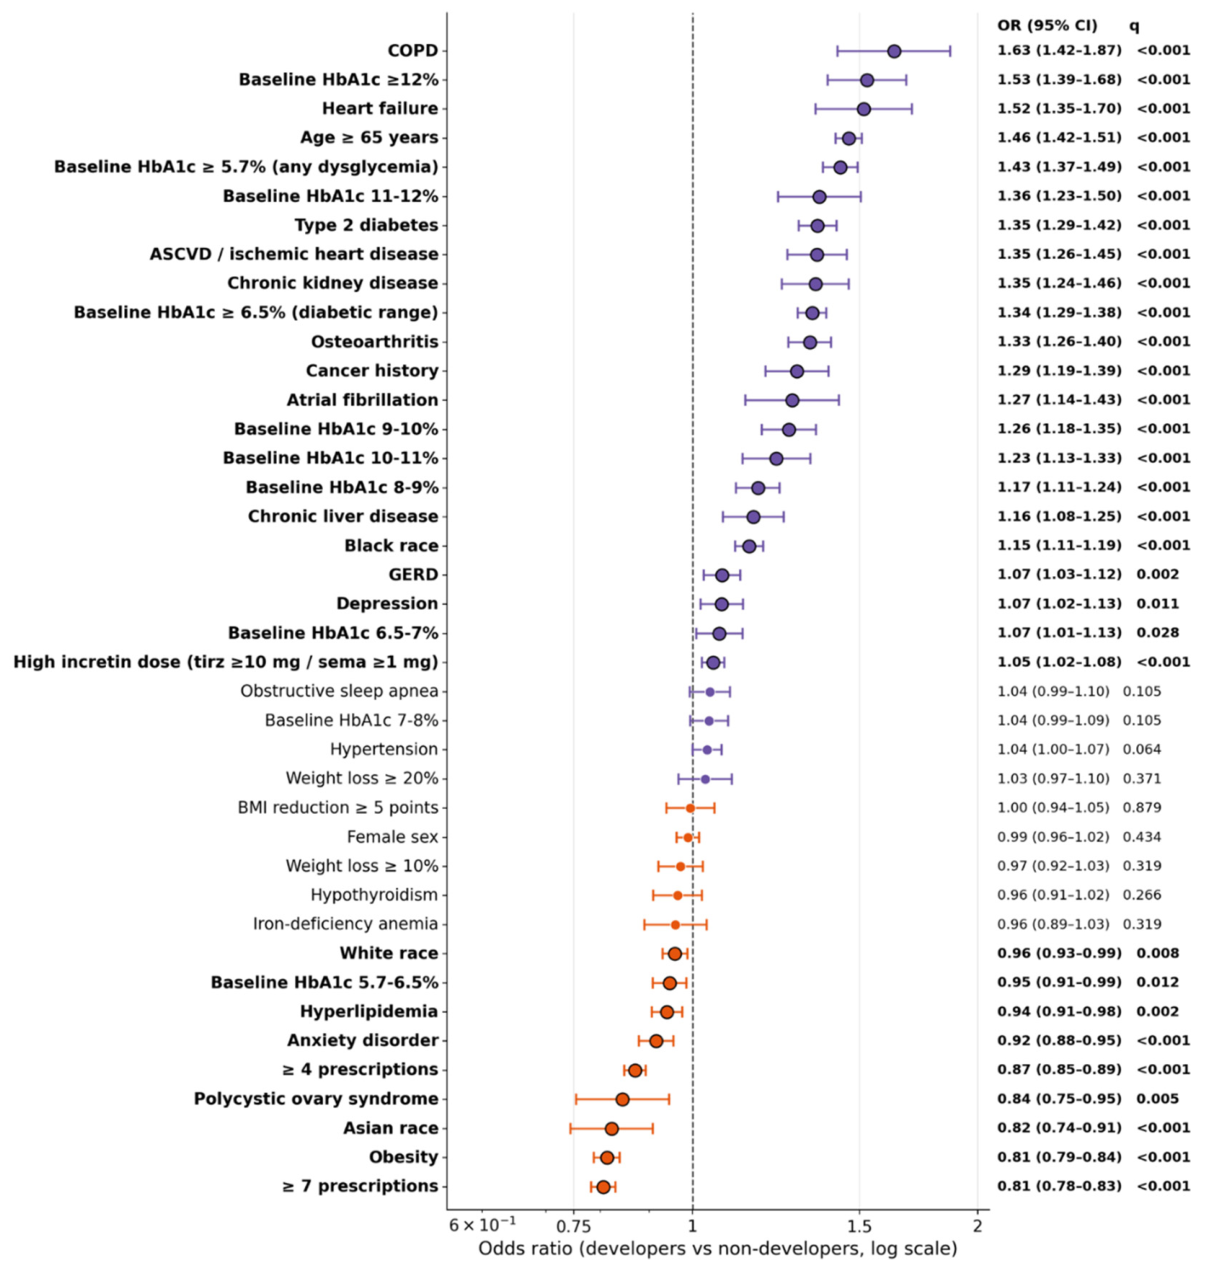
High attained incretin dose was only modestly enriched among developers (OR, 1.05; 95% CI, 1.02 to 1.08; q<0.001). In contrast, weight loss of at least 10%, weight loss of at least 20%, and a BMI reduction of at least 5 points were not enriched (OR, 0.97, 1.03, and 0.99, respectively; q>0.10 for all), reinforcing the absence of an association with weight-loss magnitude in Figure 3. Having at least 4 prescriptions (OR, 0.87; 95% CI, 0.85 to 0.89) or at least 7 prescriptions (OR, 0.81; 95% CI, 0.78 to 0.83) was less common among developers (q<0.001 for both), consistent with the inverse prescription-count gradient. Obesity and Asian race were also less prevalent among developers; these unadjusted enrichment comparisons describe baseline feature distributions and do not establish independent protective or risk effects.
Matched-Cohort Enrichment Reinforced the Association with Baseline Glycemic and Cardiometabolic Burden
Within the PS-5–matched GLP-1 versus antidiabetic cohort, developers of at least one neurosensory phenotype were substantially more likely than nondevelopers to have severe baseline hyperglycemia (Figure 12 and Table 6). The strongest enrichments were observed for a baseline HbA1c of at least 12% (OR, 2.93; 95% CI, 1.94 to 4.43), an HbA1c of 10 to 11% (OR, 2.41; 95% CI, 1.72 to 3.37), chronic obstructive pulmonary disease (OR, 1.86; 95% CI, 1.57 to 2.20), type 2 diabetes (OR, 1.72; 95% CI, 1.60 to 1.84), heart failure (OR, 1.74; 95% CI, 1.49 to 2.03), osteoarthritis (OR, 1.65; 95% CI, 1.53 to 1.77), and age of at least 65 years (OR, 1.64; 95% CI, 1.52 to 1.77) (q<0.001 for all). Cardiovascular, renal, hepatic, and metabolic comorbidities were also enriched among developers. The association across HbA1c strata was generally graded, although the estimate for the sparsely represented 11-to-12% stratum was imprecise and did not remain significant after false-discovery-rate correction (q=0.117).
Figure 12.
Baseline and treatment features enriched among developers versus non-developers of any neurosensory phenotype in the PS-5 matched cohort. Odds ratio of each feature among developers vs non-developers with 95% confidence interval; chi-square p; Benjamini–Hochberg q; feature prevalence (developers vs non-developers) reported at right. The associated data for this figure is summarized in Table 6.
Figure 12.
Baseline and treatment features enriched among developers versus non-developers of any neurosensory phenotype in the PS-5 matched cohort. Odds ratio of each feature among developers vs non-developers with 95% confidence interval; chi-square p; Benjamini–Hochberg q; feature prevalence (developers vs non-developers) reported at right. The associated data for this figure is summarized in Table 6.
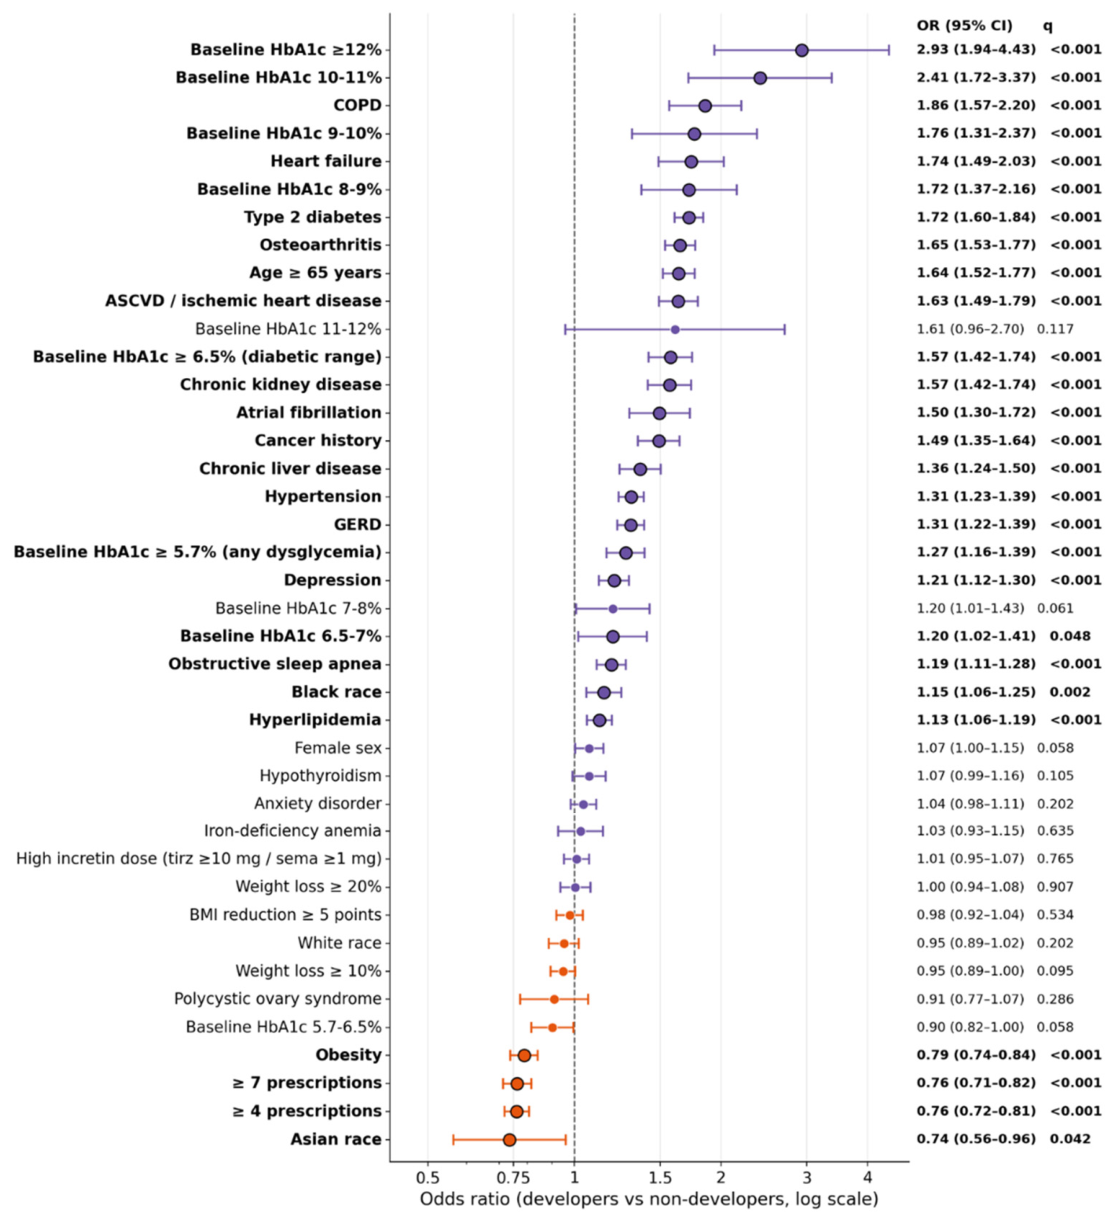
High attained incretin dose was not enriched among developers (OR, 1.01; 95% CI, 0.95 to 1.07; q=0.765). Weight loss of at least 20%, weight loss of at least 10%, and a BMI reduction of at least 5 points were also not associated with phenotype development. Having at least 4 or at least 7 prescriptions was less common among developers (OR, 0.76 for each; q<0.001), reproducing the inverse prescription-count correlation observed in Figure 3. Overall, the matched-cohort findings strengthened the glycemic-burden signal observed in Figure 3, Figure 4 and Figure 5 and the pooled enrichment analysis in Figure 11, while providing little evidence that attained dose or weight-loss magnitude explained phenotype development.
Negative-Control Outcomes Showed Heterogeneous, Comparator-Dependent Associations
Negative-control outcomes did not show a uniform directional shift (Figure 13). In the comparison with other antidiabetic medications, deviated nasal septum and benign melanocytic nevus were more frequent among GLP-1 initiators, whereas allergic rhinitis and age-related cataract were less frequent (q<0.001 for all); the remaining outcomes did not differ significantly after false-discovery-rate correction (Figure 13A). In the bariatric-surgery comparison, deviated nasal septum, sebaceous or epidermoid cyst, and benign melanocytic nevus were more frequent among GLP-1 initiators (q=0.014 for each), whereas the other negative-control outcomes did not differ significantly (Figure 13B). This bidirectional and comparator-dependent pattern was not consistent with a single generalized excess-detection process as the sole explanation for the lower neurosensory risk estimates, although residual ascertainment and comparator-related differences remain possible.
Figure 13.
Negative-Control Outcome Risk Ratios in the Propensity-Score–Matched Cohorts. Panel A shows risk ratios for GLP-1 receptor agonist initiators versus matched initiators of non–GLP-1 antidiabetic medications in the PS-5 analysis. Panel B shows risk ratios for GLP-1 receptor agonist initiators versus matched bariatric-surgery recipients in the PS-6 analysis. Negative-control outcomes were selected because no direct association with GLP-1 receptor agonist therapy was anticipated. Dots and horizontal lines indicate risk ratios and Katz 95% confidence intervals. Risk ratios greater than 1 indicate a higher incidence in the GLP-1 group, and risk ratios less than 1 indicate a higher incidence in the comparator group. P values were calculated with the chi-square test, and q values were calculated with the Benjamini–Hochberg false-discovery-rate procedure. Bold outcome labels indicate q<0.05.
Figure 13.
Negative-Control Outcome Risk Ratios in the Propensity-Score–Matched Cohorts. Panel A shows risk ratios for GLP-1 receptor agonist initiators versus matched initiators of non–GLP-1 antidiabetic medications in the PS-5 analysis. Panel B shows risk ratios for GLP-1 receptor agonist initiators versus matched bariatric-surgery recipients in the PS-6 analysis. Negative-control outcomes were selected because no direct association with GLP-1 receptor agonist therapy was anticipated. Dots and horizontal lines indicate risk ratios and Katz 95% confidence intervals. Risk ratios greater than 1 indicate a higher incidence in the GLP-1 group, and risk ratios less than 1 indicate a higher incidence in the comparator group. P values were calculated with the chi-square test, and q values were calculated with the Benjamini–Hochberg false-discovery-rate procedure. Bold outcome labels indicate q<0.05.
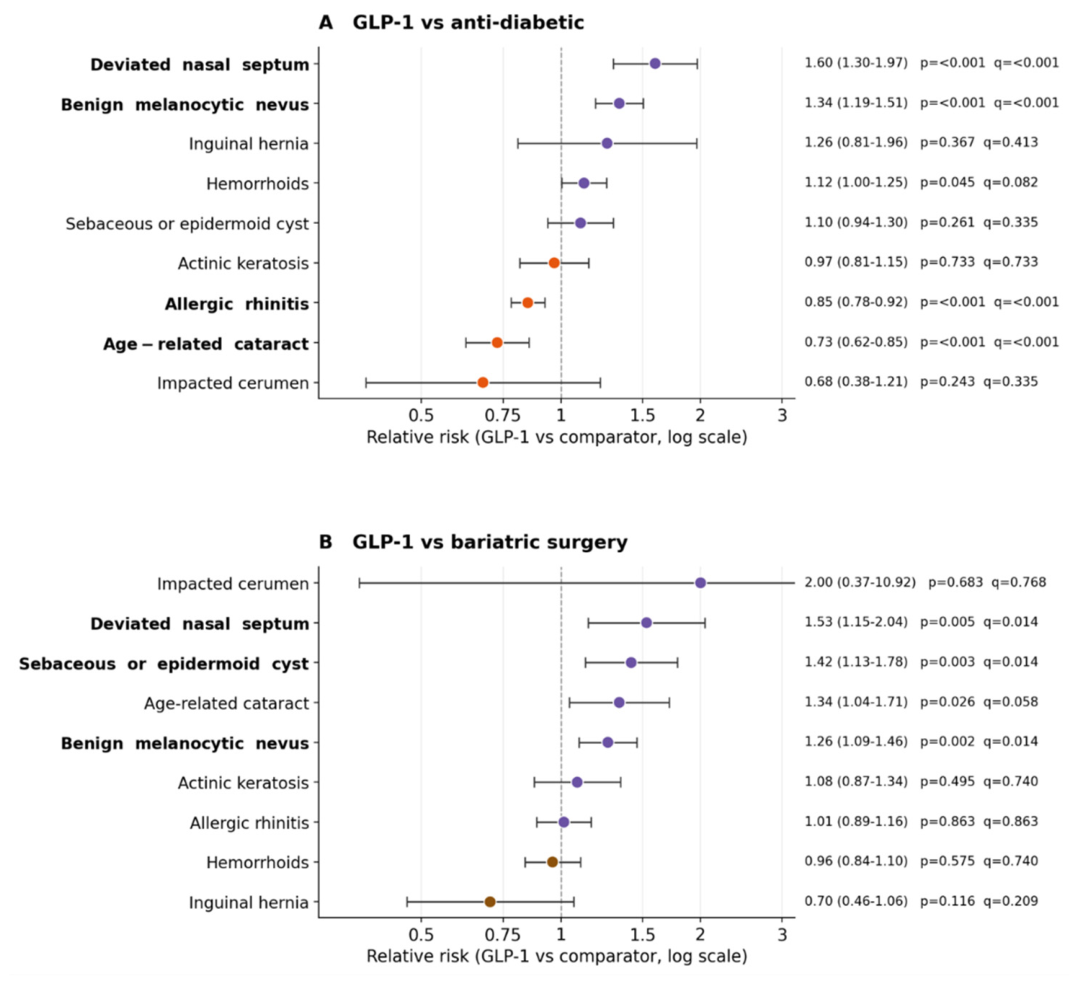
Physician Validation of Phenotype Capture
Physician review classified 198 of 223 pipeline-positive phenotype captures as valid, corresponding to an overall positive predictive value of 88.8% (95% CI, 84.0 to 92.3, Table 7). Positive predictive values were 100% for hypoesthesia and paresthesia, 95% for painful dysesthesia and hyperesthesia, and 90% for dysesthesia, mononeuropathy, and polyneuropathy. Estimates were lower for radiculopathy (75%) and postherpetic neuralgia (70%). Raw interrater agreement was 95.5%, with a nominal Krippendorff’s alpha of 0.767. Physician review supported the validity of most sampled pipeline-positive events; the validation analysis assessed positive predictive value and did not measure events missed by the pipeline.
Discussion
In this observational cohort drawn from a large-scale U.S. health-system federated data network, initiation of a GLP-1RA was not associated with a higher 12-month risk of any of the new-onset neurosensory phenotypes. Risk was lower than among matched initiators of non–GLP-1 antidiabetic medications (RR, 0.77; 95% CI, 0.75 to 0.79) and matched bariatric-surgery recipients (RR, 0.78; 95% CI, 0.75 to 0.82), with lower estimates for several of the most common individual phenotypes (Figure 6 and Figure 7 and Tables 4A-4B). The association persisted in the bariatric-surgery comparison after matching on achieved weight loss. These findings argue against a broad population-level excess across the neurosensory phenotypes studied, but they do not establish a neurologic protective effect or exclude rare drug-related events.
Across the stratified and developer-enrichment analyses, baseline glycemic burden was the most consistent correlate of phenotype development. Incidence increased across higher baseline HbA1c strata, and severe hyperglycemia, type 2 diabetes, older age, and cardiopulmonary and renal comorbidities were enriched among developers (Figure 3, Figure 4 and Figure 5, Figures 11 and 12, and Table 5 and Table 6). By contrast, incidence showed no ordered association with achieved weight loss, baseline BMI, or reduction in BMI. High attained incretin dose was not enriched among developers in the matched cohort and was only weakly enriched in the pooled cohort. The association with achieved HbA1c reduction was significant but nonmonotonic, with the highest incidence among patients with a reduction of at least 1 percentage point. This pattern is compatible with the background risk associated with chronic dysglycemia and raises the possibility of treatment-induced neuropathy of diabetes, an acute small-fiber and autonomic neuropathy reported after rapid glycemic improvement in patients with chronic hyperglycemia [25]. However, the rate and timing of HbA1c decline, autonomic manifestations, and objective evidence of small-fiber neuropathy were not directly measured. The findings therefore cannot distinguish chronic diabetes-related neuropathy from an acute response to glycemic improvement, greater underlying disease severity, or other time-varying factors.
The temporal analyses did not show a delayed increase unique to GLP-1 initiation. In both matched comparisons, cumulative-incidence curves separated early and remained lower among GLP-1 initiators through 12 months for the composite outcome and several common individual phenotypes (Figure 8). In a matched new-user, intention-to-treat analysis that included all first-fill initiators without a second-prescription or complete-follow-up requirement and censored at last observed activity, the lower risk associated with GLP-1 initiation persisted (Figure 14), indicating the findings were not an artifact of the post-index eligibility criteria. These temporal analyses were descriptive and were not designed to compare mechanistic latency patterns or establish differences in cause-specific hazards.
Figure 14.
Matched new-user, intention-to-treat sensitivity analysis (censored Kaplan–Meier). All first-fill initiators were included, with no requirement for a second prescription or for complete 12-month follow-up; patients were not excluded for future cross-cohort exposure and were censored at their last observed activity or at 12 months. The arms were propensity-score matched, and the cumulative incidence of any of the 14 neurosensory phenotypes (structured diagnosis OR affirmed clinical-note concept) is shown over the 12 months after the first fill. Panel A, GLP-1 (purple) versus anti-diabetic initiators (orange); Panel B, GLP-1 (purple) versus bariatric-surgery recipients (brown). Curve labels give the 12-month cumulative incidence per arm. This analysis removes the second-prescription and complete-follow-up requirements of the primary design and reproduces the lower risk associated with GLP-1.
Figure 14.
Matched new-user, intention-to-treat sensitivity analysis (censored Kaplan–Meier). All first-fill initiators were included, with no requirement for a second prescription or for complete 12-month follow-up; patients were not excluded for future cross-cohort exposure and were censored at their last observed activity or at 12 months. The arms were propensity-score matched, and the cumulative incidence of any of the 14 neurosensory phenotypes (structured diagnosis OR affirmed clinical-note concept) is shown over the 12 months after the first fill. Panel A, GLP-1 (purple) versus anti-diabetic initiators (orange); Panel B, GLP-1 (purple) versus bariatric-surgery recipients (brown). Curve labels give the 12-month cumulative incidence per arm. This analysis removes the second-prescription and complete-follow-up requirements of the primary design and reproduces the lower risk associated with GLP-1.
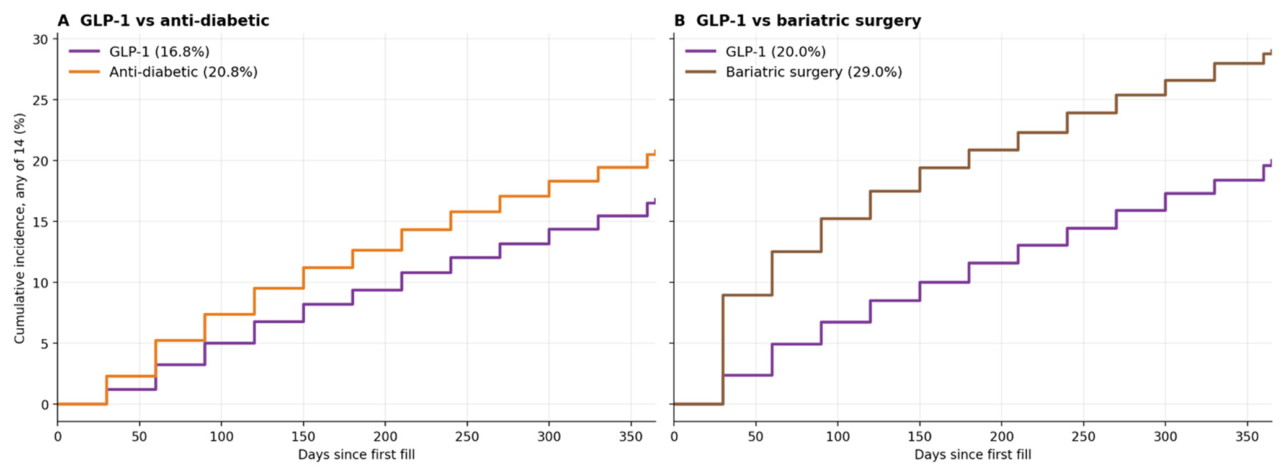
Physician review classified 198 of 223 sampled pipeline-positive events as valid, for an overall positive predictive value of 88.8% (95% CI, 84.0 to 92.3), with positive predictive values of 100% for hypoesthesia and paresthesia and lower estimates for radiculopathy and postherpetic neuralgia (Table 7). These findings support the validity of most sampled events while showing that clinical-note phenotyping substantially increased capture of symptoms that were rarely assigned a structured diagnosis. However, positive predictive value does not measure events missed by the pipeline, and the absolute incidence estimates should be interpreted as documented EHR phenotypes rather than as the prevalence of adjudicated neurologic diagnoses.
These findings differ from the case-level and pharmacovigilance literature that motivated this study. Reports have described semaglutide-associated allodynia[9], allodynia or dysesthesia with semaglutide and tirzepatide[11], recurrent brachial plexus neuritis after semaglutide-associated weight loss[22], and diabetic lumbosacral radiculoplexus or common fibular neuropathies after GLP-1RA exposure[14]. A pharmacovigilance analysis of the FDA Adverse Event Reporting System also identified disproportionality signals for several neurologic events, including allodynia[10]. These reports identify temporal associations and safety signals, but do not by themselves establish causal effects.
Spontaneous reports and case series are well suited to identifying unusual or severe presentations, but they cannot readily separate a treatment-associated event from the substantial background burden of neuropathy among patients with diabetes and obesity. The present active-comparator analyses did not identify a population-level excess across the 14 phenotypes studied. Negative-control outcomes showed bidirectional and comparator-dependent associations rather than a uniform increase among GLP-1 initiators, which does not support a simple generalized excess-detection process as the sole explanation for the findings, although differential coding and health care use remain possible (Figure 13). The gastrointestinal controls were also comparator dependent because non–GLP-1 antidiabetic therapies and bariatric surgery are gastrointestinally active and therefore did not provide inert references (Figure 10). In addition, rare focal syndromes such as diabetic lumbosacral radiculoplexus neuropathy were not separately modeled and may not be adequately represented by the broader endpoints evaluated here. The case literature and the present study should therefore be considered complementary rather than contradictory, with case-level evidence identifying unusual clinical presentations and the present analysis defining their broader population-level context.
The principal novelty of this study lies in moving beyond the narrow and fragmented neurosensory outcomes evaluated previously. Randomized trials have primarily captured grouped cutaneous dysesthesia, hyperesthesia, paresthesia, or skin-sensitivity events, including dose-related signals with higher-dose semaglutide and retatrutide, whereas pharmacovigilance studies and case reports have emphasized uncommon, severe, or focal presentations without clinically matched comparators.[2,3,4,5,6,7,8,9,10,11,12,13,14,15,16,17,18,19,20,21,22] Here, 14 neurosensory phenotypes spanning nonpainful sensory symptoms, painful dysesthesia, generalized and focal neuropathies, radicular syndromes, and rare cutaneous sensory disorders were evaluated within a common, physician-validated code-plus-note EHR framework, with two active comparators, negative-control outcomes, and parallel assessment of glycemic burden, glycemic change, attained dose, and documented weight-loss magnitude. This triangulation generates a clinically testable hypothesis: baseline glycemic burden and/or change therein may be a more informative variable for stratifying neurosensory risk after incretin initiation than achieved weight loss or attained dose, while the rate of glycemic improvement may represent an additional modifier that was not explicitly measured here.[25] Prospective studies should therefore prespecify baseline HbA1c and serial glycemic trajectories, rather than treating all incretin initiators as a single safety population, and should combine standardized symptom inventories with neurologic examination, nutritional measurements, nerve-conduction testing, and small-fiber or autonomic assessment. Drug-specific and dose-specific cohorts with blinded event adjudication will be needed to determine whether the observed phenotypes reflect background metabolic neuropathy, treatment-induced neuropathy of diabetes, weight-loss–associated nerve compression or nutritional deficiency, direct incretin-related sensory effects, or distinct combinations of these pathways.²⁵,²⁶
This study has several limitations. First, these are observational associations, not causal effects: although the active-comparator design and 1:1 propensity-score matching on age, sex, race, baseline BMI and type 2 diabetes reduce confounding, five baseline covariates cannot fully balance these clinically distinct groups, and the matched cohorts retained residual imbalances (including heart failure, obesity, anxiety, gastroesophageal reflux disease, cancer history, anemia, liver disease and hyperlipidemia; Figure 9 and Tables 1A–1B). The directionally lower risks associated with GLP-1 initiation could therefore partly reflect residual differences in indication, disease severity, health-care utilization or documentation intensity rather than a pharmacologic effect. Second, both comparators may themselves affect the outcomes under study. Bariatric surgery has been associated with peripheral neuropathy and with nutritional and metabolic factors that may influence neurologic risk[26]. The reported risk ratios should therefore be interpreted as relative comparisons with active treatments, rather than as estimates against untreated or inert controls. Third, the composite endpoint included heterogeneous and potentially overlapping symptoms, diagnoses, and syndromes. Clinical-note ascertainment may differ according to health care use, documentation practices, and treatment persistence. Physician validation assessed positive predictive value but not sensitivity, and the structured-diagnosis and clinical-note definitions yielded markedly different absolute incidence estimates. Fourth, treatment exposure, attained dose, and prescription count were based on prescribing records rather than confirmed medication administration. The inverse association with prescription count may reflect treatment discontinuation after symptom development, depletion of susceptible patients, differential follow-up, or healthy-adherer effects rather than a biologic benefit of prolonged exposure. Fifth, eligibility required at least two prescriptions within 12 months and no cross-cohort exposure within a ±12-month window, and the primary analysis required complete 12-month follow-up; because these criteria condition on post-index events, they could in principle select patients by post-initiation behavior. In a new-user, intention-to-treat sensitivity that included all first-fill initiators without a second-fill or follow-up requirement and censored at last observed activity, the GLP-1 12-month cumulative incidence of any neurosensory phenotype (structured-diagnosis endpoint) was materially unchanged (10.4% vs 11.1%), indicating these criteria do not drive the incidence estimates; comparative effects in that unmatched setting are confounded by indication, and the propensity-matched analyses remain the valid comparative estimates. Finally, several stratified, dose-related, enrichment, control, and sensitivity analyses were exploratory, and estimates for rare phenotypes were imprecise despite false-discovery-rate correction.
In conclusion, GLP-1RA initiation was not associated with a higher population-level risk of the neurosensory phenotypes studied and was associated with lower risk than either matched active comparator. Baseline glycemic burden — and, secondarily, the magnitude of glycemic improvement — rather than weight-loss magnitude or attained dose, was the feature most consistently associated with phenotype development. These results should not be interpreted as establishing neurologic safety or as excluding rare, severe, or focal treatment-associated neuropathies. New sensory symptoms after treatment initiation warrant clinical evaluation, including consideration of baseline and evolving glycemic trajectories and alternative neurologic, metabolic, nutritional, and mechanical causes. Prospective studies incorporating adjudicated neurologic outcomes, serial glycemic trajectories, confirmed treatment exposure, nutritional measurements, and longer follow-up are needed to evaluate rare focal neuropathies and clarify whether rapid glycemic improvement contributes to symptom emergence in susceptible patients.
Supplementary Materials
The following supporting information can be downloaded at the website of this paper posted on Preprints.org.
Author Contributions
Venky Soundararajan conceived the study and designed the study with Adhikaar Marwaha. The study analysis and interpretation was led by Adhikaar Marwaha with inputs from Christopher Gregg, AJ Venkatakrishnan and Venky Soundararajan. Karthik Murugadoss contributed software. Gowtham Varma and Santhosh Shiv performed expert curation and AI validation. All authors wrote the manuscript and agreed on the final submission.
Funding
This research received no external funding.
Data availability
This study involves the analysis of de-identified Electronic Health Record (EHR) data via the nference Federated System. Data shown and reported in this manuscript were extracted from this environment using an established protocol for data extraction, aimed at preserving patient privacy. The data has been de-identified pursuant to an expert determination in accordance with the HIPAA Privacy Rule. Any data beyond what is reported in the manuscript, including but not limited to the raw EHR data, cannot be shared or released due to the parameters of the expert determination to maintain the data de-identification.
Acknowledgements
The authors thank Patrick Lenehan for critical review and feedback on the manuscript.
Conflict of Interest Statement
The authors are employees of nference, inc., which conducts research collaborations with various biopharmaceutical companies whose therapeutic products are included in this study. None of these companies, nor any other nference collaborator, funded, supported, or had any role in the independent study design, data acquisition, analysis, interpretation, manuscript preparation, or the decision to submit this work for publication. All analyses were conducted by the authors using de-identified electronic health record data. The authors declare no additional competing interests.
References
- Li, P.; et al. Prescribing trends of glucagon-like peptide 1 receptor agonists for type 2 diabetes or obesity. JAMA Netw. Open 2025, 8, e2540890. [Google Scholar] [CrossRef] [PubMed]
- Laroche, M.-L.; Géniaux, H.; Jardou, M. Dysesthesia associated with GLP-1 agonist therapies: data-mining analysis and literature review. Eur. J. Clin. Pharmacol. 2026, 82. [Google Scholar] [CrossRef] [PubMed]
- Knop, F. K.; et al. Oral semaglutide 50 mg taken once per day in adults with overweight or obesity (OASIS 1): a randomised, double-blind, placebo-controlled, phase 3 trial. Lancet 2023, 402, 705–719. [Google Scholar] [CrossRef] [PubMed]
- Tran, M. M.; et al. Dermatologic findings associated with semaglutide use: A scoping review. J. Am. Acad. Dermatol. 2024, 91, 166–168. [Google Scholar] [CrossRef] [PubMed]
- Aroda, V. R.; et al. High-dose semaglutide (up to 16 mg) in people with type 2 diabetes and overweight or obesity: A randomized, placebo-controlled, phase 2 trial. Diabetes Care 2025, 48, 905–913. [Google Scholar] [CrossRef] [PubMed]
- Wharton, S.; et al. Once-weekly semaglutide 7·2 mg in adults with obesity (STEP UP): a randomised, controlled, phase 3b trial. Lancet Diabetes Endocrinol. 2025, 13, 949–963. [Google Scholar] [CrossRef] [PubMed]
- Lingvay, I.; et al. Once-weekly semaglutide 7·2 mg in adults with obesity and type 2 diabetes (STEP UP T2D): a randomised, controlled, phase 3b trial. Lancet Diabetes Endocrinol. 2025, 13, 935–948. [Google Scholar] [CrossRef] [PubMed]
- Jastreboff, A. M.; et al. Triple-hormone-receptor agonist retatrutide for obesity - A phase 2 trial. N. Engl. J. Med. 2023, 389, 514–526. [Google Scholar] [CrossRef] [PubMed]
- Stark, J.; Klass, M. J.; Owen, L. Allodynia (skin tenderness) associated with semaglutide: A case series. Am. J. Heal. Syst. Pharm. 2025, 82, e426–e430. [Google Scholar] [CrossRef] [PubMed]
- Chen, H.; et al. Pharmacovigilance analysis of neurological adverse events associated with GLP-1 receptor agonists based on the FDA Adverse Event Reporting System. Sci. Rep. 2025, 15, 18063. [Google Scholar] [CrossRef] [PubMed]
- Ahern, S. Allodynia and dysesthesia associated with semaglutide and tirzepatide. Cureus 2025, 17, e94126. [Google Scholar] [PubMed]
- Chakrabarti, M. P.; Han, S.; Campbell, N. M. Cutaneous allodynia associated with GLP-1RA tirzepatide for weight management: A case series. Am. J. Case Rep. 2026, 27, e952158. [Google Scholar] [CrossRef] [PubMed]
- Hidalgo Ramos, R. A.; Ortiz, M.; Dufner Krieger, S.; Secades, D. Semaglutide and non-arteritic anterior ischemic optic neuropathy: A systematic review. Cureus 2025, 17, e89656. [Google Scholar] [PubMed]
- Triplett, J. D.; et al. GLP-1RA-associated diabetic lumbosacral radiculoplexus and common fibular neuropathies: A case-control evaluation. Neurology 2025, 105, e213916. [Google Scholar] [CrossRef] [PubMed]
- Chandrashekhar, S.; Davalos, L.; Pradhan, R.; Paul, P. Diabetic lumbosacral radiculoplexus neuropathy after glucagon-like peptide 1 receptor agonist use: A case series. J. Neurol. Sci. 2026, 481, 125755. [Google Scholar] [CrossRef] [PubMed]
- Tucker, J. M.; Ritchie, J. The tirzepatide drop: Beware of slimmer’s paralysis. J. Investig. Med. High Impact Case Rep. 2024, 12, 23247096241264635. [Google Scholar] [CrossRef] [PubMed]
- Dhupati, P.; Kisiel, S. C.; Unadkat, K.; Noland, S. S. GLP-1 receptor agonist-associated Slimmer’s Palsy: Implications for the peripheral nerve surgeon. Ann. Plast. Surg. 2026, 96, 69–74. [Google Scholar] [CrossRef] [PubMed]
- Wentling, J.; Forte, M.; Colon, T. A.; Reuter, E. Common peroneal neuropathy following significant weight loss induced by tirzepatide therapy. PM R 2025, 17, 1512–1514. [Google Scholar] [CrossRef] [PubMed]
- Tanyous, A. I.; Levitt, J. O. Weight drop - foot drop: A case series of peroneal nerve palsy from leg crossing after tirzepatide-mediated weight loss. Case Rep. Neurol. 2026, 1–7. [Google Scholar]
- Haque, M. R.; Sharmin, K. S.; Abdullah, A. M.; Ahad, A.-U.-I.; Kundu, N. C. Slimmer’s paralysis: a case report. BIRDEM Med. J. 2026, 16, 40–43. [Google Scholar] [CrossRef]
- O’Gorman, C. Peripheral nerve complications of weight loss associated with novel antihyperglycemic agents: a cohort study. J. Neurol. 2025, 273, 33. [Google Scholar] [CrossRef] [PubMed]
- Lesinszki, L. S.; Khalili, R.; Jiang, H.; Jha, S.; Bernad, P. G. Recurrent bilateral brachial plexus neuritis following rapid semaglutide-induced weight loss: a case report. BMC Neurol. 2026, 26, 123. [Google Scholar] [CrossRef] [PubMed]
- Zahir, A.; et al. Neurological complications associated with rapid weight loss and nutritional deficiencies following GLP-1 agonist use: a case report. BMC Neurol. 2025, 26, 5. [Google Scholar] [CrossRef] [PubMed]
- Savelieff, M. G.; et al. The global and regional burden of diabetic peripheral neuropathy. Nat. Rev. Neurol. 2025, 21, 17–31. [Google Scholar] [CrossRef] [PubMed]
- Gibbons, C. H.; Freeman, R. Treatment-induced neuropathy of diabetes: an acute, iatrogenic complication of diabetes. Brain 2015, 138, 43–52. [Google Scholar] [CrossRef] [PubMed]
- Thaisetthawatkul, P.; Collazo-Clavell, M. L.; Sarr, M. G.; Norell, J. E.; Dyck, P. J. B. A controlled study of peripheral neuropathy after bariatric surgery. Neurology 2004, 63, 1462–1470. [Google Scholar] [CrossRef] [PubMed]
- Wagner, T.; et al. Augmented curation of clinical notes from a massive EHR system reveals symptoms of impending COVID-19 diagnosis. Elife 2020, 9, e58227. [Google Scholar] [CrossRef] [PubMed]
- Maro, J. C.; et al. Design of a national distributed health data network. Ann. Intern. Med. 2009, 151, 341–344. [Google Scholar] [CrossRef] [PubMed]
- von Elm, E.; et al. The Strengthening the Reporting of Observational Studies in Epidemiology (STROBE) statement: guidelines for reporting observational studies. PLoS Med. 2007, 4, e296. [Google Scholar] [CrossRef] [PubMed]
- Benchimol, E. I.; et al. The REporting of studies Conducted using Observational Routinely-collected health Data (RECORD) statement. PLoS Med. 2015, 12, e1001885. [Google Scholar] [CrossRef] [PubMed]
- Ray, W. A. Evaluating medication effects outside of clinical trials: new-user designs. Am. J. Epidemiol. 2003, 158, 915–920. [Google Scholar] [CrossRef] [PubMed]
- Lund, J. L.; Richardson, D. B.; Stürmer, T. The active comparator, new user study design in pharmacoepidemiology: historical foundations and contemporary application. Curr. Epidemiol. Rep. 2015, 2, 221–228. [Google Scholar] [CrossRef] [PubMed]
- Kyriacou, D. N.; Lewis, R. J. Confounding by indication in clinical research. JAMA 2016, 316, 1818–1819. [Google Scholar] [CrossRef] [PubMed]
- Rosenbaum, P. R.; Rubin, D. B. The central role of the propensity score in observational studies for causal effects. Biometrika 1983, 70, 41–55. [Google Scholar] [CrossRef]
- Austin, P. C. An introduction to propensity score methods for reducing the effects of confounding in observational studies. Multivar. Behav. Res. 2011, 46, 399–424. [Google Scholar] [CrossRef] [PubMed]
- Austin, P. C. Optimal caliper widths for propensity-score matching when estimating differences in means and differences in proportions in observational studies. Pharm. Stat. 2011, 10, 150–161. [Google Scholar] [CrossRef] [PubMed]
- Austin, P. C. Balance diagnostics for comparing the distribution of baseline covariates between treatment groups in propensity-score matched samples. Stat. Med. 2009, 28, 3083–3107. [Google Scholar] [CrossRef] [PubMed]
- Wilson, E. B. Probable inference, the law of succession, and statistical inference. J. Am. Stat. Assoc. 1927, 22, 209–212. [Google Scholar] [CrossRef]
- Katz, D.; Baptista, J.; Azen, S. P.; Pike, M. C. Obtaining confidence intervals for the risk ratio in cohort studies. Biometrics 1978, 34, 469. [Google Scholar] [CrossRef]
- Benjamini, Y.; Hochberg, Y. Controlling the false discovery rate: A practical and powerful approach to multiple testing. J. R. Stat. Soc. Ser. B Stat. Methodol. 1995, 57, 289–300. [Google Scholar] [CrossRef]
- Cochran, W. G. Some methods for strengthening the common χ 2 tests. Biometrics 1954, 10, 417. [Google Scholar] [CrossRef]
- Armitage, P. Tests for linear trends in proportions and frequencies. Biometrics 1955, 11, 375. [Google Scholar] [CrossRef]
- Suissa, S. Immortal time bias in pharmaco-epidemiology. Am. J. Epidemiol. 2008, 167, 492–499. [Google Scholar] [CrossRef] [PubMed]
- Diabetes Control and Complications Trial Research Group et al. The effect of intensive treatment of diabetes on the development and progression of long-term complications in insulin-dependent diabetes mellitus. N. Engl. J. Med. 1993, 329, 977–986. [PubMed]
- Murugadoss, K.; et al. Building a best-in-class automated de-identification tool for electronic health records through ensemble learning. Patterns (N. Y.) 2021, 2, 100255. [Google Scholar] [CrossRef] [PubMed]
- Murugadoss, K.; et al. Scaling text de-identification using locally augmented ensembles. medRxiv 2024. [Google Scholar] [CrossRef]
Figure 1.
Cohort Construction Across the nference U.S. Federated Data Network. Shown are the sequential new-user eligibility criteria for initiators of semaglutide or tirzepatide and for the two active-comparator cohorts, initiators of non–GLP-1 antidiabetic medications and bariatric-surgery recipients. The primary fixed-window analyses required complete 12-month follow-up and a baseline washout for the neurosensory phenotype under evaluation. Propensity-score–matched cohort sizes are shown before the baseline neurosensory-phenotype exclusion; after excluding patients with any studied phenotype at baseline, the at-risk cohorts used for the risk-ratio analyses were smaller (28,399 GLP-1 vs 32,359 antidiabetic; 10,619 GLP-1 vs 11,081 bariatric-surgery) and are shown in Table 4A and Table 4B. A separate new-user intention-to-treat sensitivity analysis included all first-fill initiators without a second-prescription or complete-follow-up requirement and censored patients at their last observed activity (Figure 14). Baseline characteristics and incidence data are summarized in Table 1A-Table 1B and Table 3.
Figure 1.
Cohort Construction Across the nference U.S. Federated Data Network. Shown are the sequential new-user eligibility criteria for initiators of semaglutide or tirzepatide and for the two active-comparator cohorts, initiators of non–GLP-1 antidiabetic medications and bariatric-surgery recipients. The primary fixed-window analyses required complete 12-month follow-up and a baseline washout for the neurosensory phenotype under evaluation. Propensity-score–matched cohort sizes are shown before the baseline neurosensory-phenotype exclusion; after excluding patients with any studied phenotype at baseline, the at-risk cohorts used for the risk-ratio analyses were smaller (28,399 GLP-1 vs 32,359 antidiabetic; 10,619 GLP-1 vs 11,081 bariatric-surgery) and are shown in Table 4A and Table 4B. A separate new-user intention-to-treat sensitivity analysis included all first-fill initiators without a second-prescription or complete-follow-up requirement and censored patients at their last observed activity (Figure 14). Baseline characteristics and incidence data are summarized in Table 1A-Table 1B and Table 3.
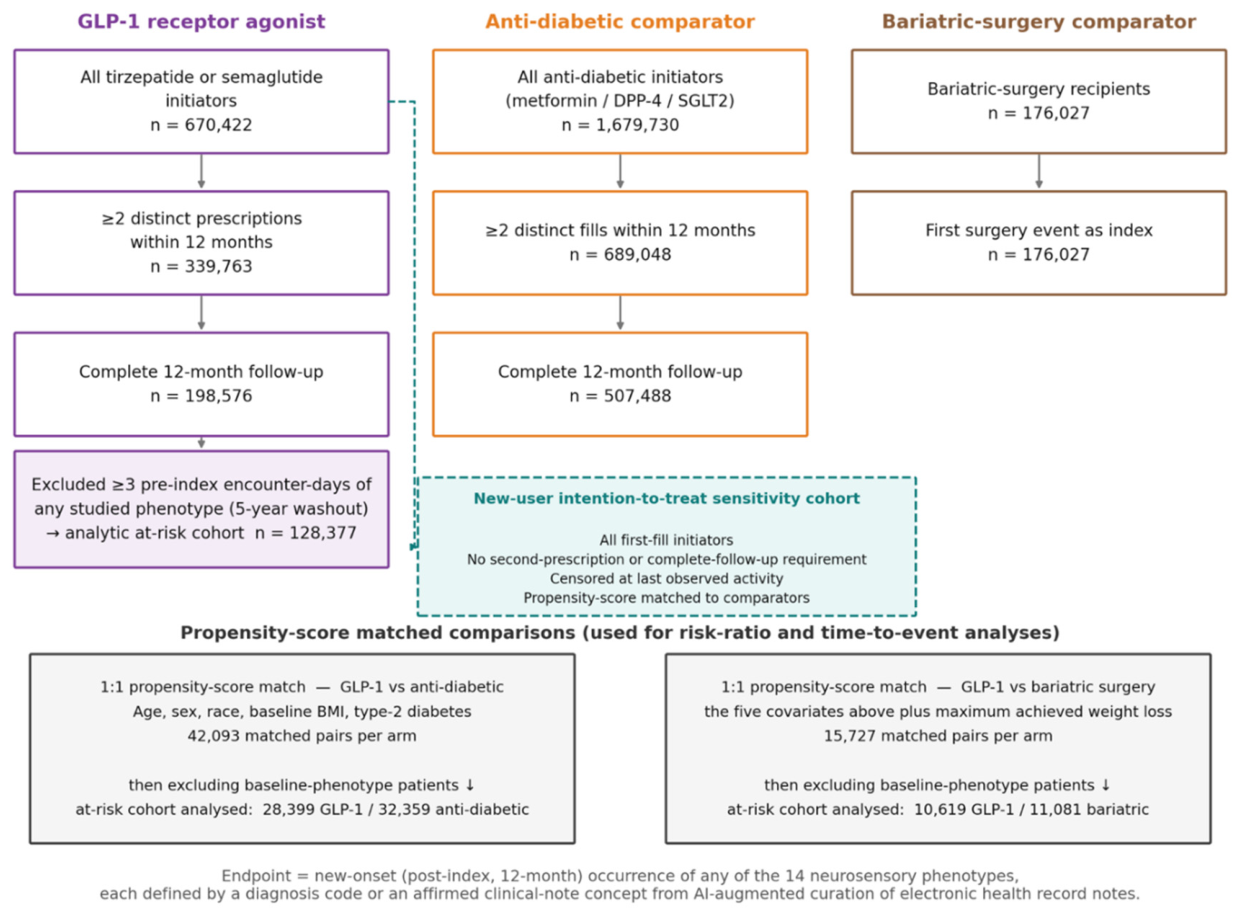
Disclaimer/Publisher’s Note: The statements, opinions and data contained in all publications are solely those of the individual author(s) and contributor(s) and not of MDPI and/or the editor(s). MDPI and/or the editor(s) disclaim responsibility for any injury to people or property resulting from any ideas, methods, instructions or products referred to in the content. |
© 2026 by the authors. Licensee MDPI, Basel, Switzerland. This article is an open access article distributed under the terms and conditions of the Creative Commons Attribution (CC BY) license (http://creativecommons.org/licenses/by/4.0/).
Copyright: This open access article is published under a Creative Commons CC BY 4.0 license, which permit the free download, distribution, and reuse, provided that the author and preprint are cited in any reuse.