
Submitted:
28 July 2026
Posted:
30 July 2026
You are already at the latest version
Abstract
While predefined cambering is widely implemented in prestressed concrete girder bridges to counterbalance dead load deflections, literature addressing its direct influence on structural behavior remains limited. Existing research focuses primarily on provided the required camber during fabrication and accidental deflections, with sparse attention dedicated to the interactive effects of diverse predefined initial profiles on structural performance. In this paper, an experimental investigation on the effect of predefined camber and accidental deflection on the structural behavior of both reinforced and prestressed rectangular concrete girders under four-point bending loading is presented. Fourteen full-size girders were tested, including eleven prestressed and three conventional reinforced concrete girders having concrete compressive strengths of 30, 40, and 80 MPa with predefined initial profiles ranging from −30 mm to +30 mm on key structural parameters, including cracking propagation, stiffness degradation, structural efficiency, displacement ductility, and total energy absorption. Test results have shown that all girders failed in a ductile manner via progressive cracking. It has been observed that positive predefined cambers could positively affect the performance of prestressed girders to a large extent, as the +30 mm predefined camber improved the ultimate load capacity by 19.3%.
Keywords:
prestressed concrete
; initial camber
; deflection control
; bridge girder
; high-strength concrete
1. Introduction
The development of modern civil infrastructure is intrinsically linked to advancements in precast, prestressed, and post-tensioned concrete. Driven by engineering demands for longer spans, optimized substructures, and accelerated construction, prestressed concrete girders have established themselves as essential structural elements for short- and medium-span highway bridges [1,2,3]. Their design exploits concrete's compressive strength together with the high tensile strength of steel tendons: by pre-compressing the tension zone, engineers delay cracking and improve both serviceability and material efficiency in the superstructure [4].
Such precision demands control over several parameters, including the girder's vertical profile. Prestressed girders are rarely straight; the eccentricity of the prestressing force about the neutral axis gives them a built-in upward curvature, or camber [5]. In theory, this offsets later deflections from dead and traffic loads, but in practice, camber is highly variable. Concrete creep, drying shrinkage, and tendon relaxation cause it to evolve nonlinearly over the structure's life [7].
Discrepancies between predicted and actual camber present significant construction and serviceability challenges, typically manifesting as uneven deck thicknesses, variable haunch depths, and compromised ride quality. Traditionally, camber has been managed as an unavoidable by-product of prestressing [5,8]. This study takes a different view, treating the girder's initial shape as a design variable. Specifically, it explores whether predefined initial profiles or sag—set through formwork adjustment before casting—can improve the load capacity and crack resistance of future bridges.
The behavior of a post-tensioned girder follows from the superposition of internal forces and section geometry. For a prismatic beam, the stress at any distance from the neutral axis is given by the elastic flexure formula:
where P is the effective prestressing force, A is the cross-sectional area, e is the tendon eccentricity, I is the second moment of area, is the external moment, and y is the distance from the neutral axis to the fiber of interest [9].
Predefined geometric modifications—predefined camber or accidental deflection—fundamentally alter this elastic stress state. Unlike a straight beam with a level centroidal axis, a pre-cambered beam has a curved one. That curvature shifts the effective tendon eccentricity, especially at midspan, and introduces second-order effects: the prestressing force now acts along a curved chord, producing transverse force components that either amplify or reduce the initial curvature [10–13].
Cracking in prestressed girders depends on how internal stresses are distributed across the section. Prestress adds compression exactly where service loads would cause tension, delaying cracking and raising the cracking moment. Any intentional geometric change reshapes this stress field. A positive midspan camber gives the girder curvature before loading, altering effective eccentricity and prestress distribution along the span. This can add compression in the lower fibers, boosting pre-compression in the crack-prone soffit; a larger external load is then needed to overcome it and reach the modulus of rupture, so cracking is delayed and elastic behavior persists longer. Negative camber or pre-deflection does the opposite—reducing lower-fiber compression, lowering the cracking load, and hastening the shift to cracked behavior. In practice, such negative pre-camber often occurs as an accidental deflection during construction due to formwork settlement, early-age concrete creep, or alignment errors. These effects remain poorly understood. In short, we hypothesize that predefined curvature—positive camber or accidental deflection—can influence cracking, stiffness loss, and ultimate behavior by reshaping the internal stress state and tendon-force geometry [14–17].
Material properties matter as much as geometry. Conventional concrete has a relatively porous interfacial transition zone (ITZ) and cracks gradually through the growth and coalescence of micro-cracks, giving a fairly gentle post-peak response. High-Performance Concrete (HPC)—target strength around 80 MPa with silica fume—has a much denser microstructure, since the pozzolanic reaction consumes calcium hydroxide and refines the paste and ITZ. The result is stiffer, stronger, and more durable [18–21]. The trade-off is reduced deformation capacity and post-peak ductility: the steeper descending branch means more brittle failure and less stress redistribution once crushing begins. Any theory here must therefore couple geometry with material behavior. HPC's higher stiffness resists service deflections and cracking, but excessive pre-camber could push critical zones toward their limiting compressive strains. Understanding this interplay is essential for predicting the behavior and failure of predefined curved prestressed girders [22–25].
Predicting camber remains one of the toughest challenges in precast bridge design. Codes such as AASHTO LRFD and ACI 318 offer semi-empirical estimates using multiplier methods (e.g., Martin's multipliers) or time-step analysis [26–28]. Yet measured camber often diverges sharply from predictions—commonly by more than 30%, sometimes 50%—owing to uncertainty in creep, shrinkage, prestress losses, material properties, and production and environmental conditions [6,27,29].
Work by [27,30] shows that the concrete elastic modulus at transfer is often uncertain, introducing errors in the initial elastic camber. Humidity and temperature cycles further alter creep and shrinkage rates, driving camber growth in ways standard models don't fully capture [31]. Recent studies have turned to stochastic modeling and machine learning [32], but still focus only on the natural camber of straight girders.
HPC and Ultra-High-Performance Concrete (UHPC) allow lighter, stronger girders. Flexural studies show that higher concrete strength raises ultimate capacity and reduces the reinforcement needed for a given span [33–35]. Researchers note that as strength increases, crack spacing becomes more regular, but crack widths at failure can grow large because of the high energy released during cracking [36,37]. Tests on UHPC beams [38,39] found that micro-silica strengthens the concrete–strand bond, improving force transfer—but also that the matrix's lower fracture energy makes failure more brittle, with the compression flange crushing suddenly and without the warning that conventional concrete provides.
While tendon eccentricity's effect is well understood, intentionally induced geometric deviation has received far less attention. Most camber research addresses the natural deflection that develops after transfer and long-term creep, shrinkage, and prestress losses, treating a straight centroidal axis as inherent to the girder. Far fewer studies examine girders deliberately curved via the formwork, so the influence of predefined camber or accidental deflection on stress distribution, cracking, and capacity remains under-explored [5,27,28,40].
Despite extensive work on prestress-induced camber, little addresses formwork-induced predefined curvature. Existing research centers on predicting naturally occurring camber and its long-term development. A few studies examine the fabrication and use of pre-cambered girders, but the interaction among initial curvature, prestress-induced stress fields, and concrete nonlinearity is still poorly characterized. Crucially, no systematic experimental comparison exists between the two predefined configurations—positive curvature (crest) and negative curvature (sag)—so the optimal curvature for maximizing capacity while preserving ductility and serviceability is unknown. This gap defines the present study [27,40].
A critical review reveals a clear split in the literature: material-focused studies (HPC/UHPC properties, durability, capacity) versus geometry-focused studies (mainly camber prediction and control). Standard design methods always assume a straight girder and treat camber as a consequence of prestress, creep, shrinkage, and losses. These work well for conventional girders but say little about members built with predefined geometry. There is little research combining positive predefined camber and accidental deflection with different concrete strengths at the ultimate limit state (ULS).
How a predefined initial profile affects stress redistribution, cracking, stiffness loss, and failure mode is largely unknown. It is unclear, for example, whether negative pre-camber accelerates tensile cracking by altering the section stress distribution, or whether positive predefined camber boosts cracking resistance through added pre-compression. Another open question is how the predefined initial profile interacts with the reduced post-peak ductility typical of HPC: will high strength, greater stiffness, and shifted stresses together trigger earlier compressive failure?
This leaves a clear gap in the coupled effects of material properties and predefined initial profiles—one that must be closed to determine whether an optimal pre-camber exists that improves performance while keeping adequate ductility, serviceability, and safety in long-span prestressed girders.
This paper reports an experimental study of geometry variation in 14 full-scale prestressed concrete bridge girders (2400 mm span). Its objectives are:
- Effect of predefined camber and accidental deflection— determine how midspan initial geometry (−30, −15, 0, +15, +30 mm) affects cracking load, stiffness degradation, and ultimate load under four-point bending.
- Material comparison — compare conventional concrete (30, 40 MPa) with silica-fume HPC (80 MPa) under identical geometric variations.
- Failure mechanisms — trace the elastic-to-nonlinear transition and the trade-off between the ductility of normal-strength girders and the brittle failure of HPC members.
- Design guidance — conclude whether predefined camber can serve as an optimization tool in bridge construction.
2. Materials and Methods
2.1. Research Program Overview
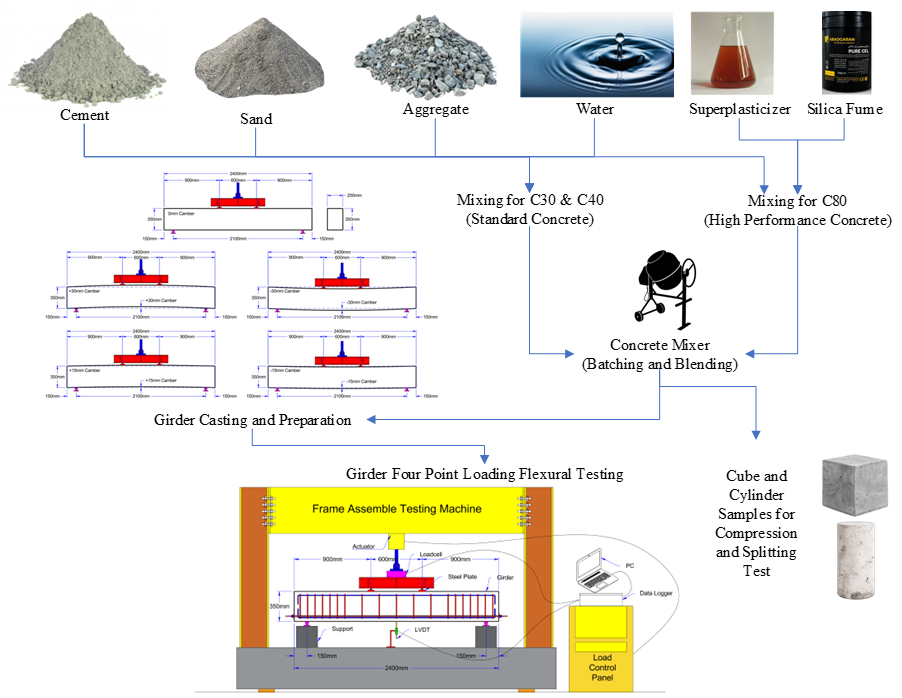
An experimental program has been designed for investigation and systematically evaluate the structural behavior of post-tensioned concrete girders with predefined initial profiles. In order to understand and study effects of initial geometry (predefined camber and accidental deflection) and concrete compressive strength on cracking propagation, stiffness degradation, ultimate capacity, and failure modes. Fourteen full-scale post-tensioned girders were tested under monotonic four-point loading machine, Figure 1. Presents the abstract illustration of the research.
The designed program considered three critical variables: (1) initial camber (magnitude and direction), (2) concrete compressive strength, and (3) reinforcement type (prestressed or conventionally reinforced). Five specimens with predefined initial profiles were created by adjusting the formwork during casting: −30, −15, 0, +15, and +30 mm. The concrete compressive strengths were studied in this research are 30, 40, and 80 MPa, they are designed to represent practical bridge-girder fabrication and evaluate whether predefined geometric modifications can improve overall structural performance.
2.2. Materials, Concrete Mix Design, and Mechanical Characterization
All concrete mixtures were produced using Ordinary Portland Cement (Type I) conforming to ASTM C150 [41]. The cement was obtained locally and stored under dry conditions. Natural river sand meeting ASTM C33 [42] requirements was used as fine aggregate. Moisture content was measured before mixing, and water adjustments were made to maintain the specified water-to-cement ratio. Crushed limestone with nominal maximum sizes of 12 and 19 mm served as coarse aggregate. Aggregate quality was verified through sieve analysis and specific gravity tests. Silica fume (ABADGARAN Pure Gel) was added to the high-performance concrete as a supplementary cementitious material to improve compressive strength, matrix density, durability, bond performance, and resistance to microcracking [42,43]. A high-range water-reducing admixture (superplasticizer) was used to achieve the required workability while maintaining a low water-to-cement ratio. Potable water free of harmful contaminants was used for mixing and curing.
Three concrete mixtures with target compressive strengths of 30, 40, and 80 MPa were developed to represent normal-strength concrete (NSC), conventional prestressed concrete (PSC), and high-performance concrete (HPC), respectively. Mix proportions were established through trial batches to achieve the required workability, strength, and durability for bridge girders. The C30 mix served as the reference concrete; C40 represented typical prestressed bridge-girder concrete, and C80 incorporated silica fume and a high-range water-reducing admixture to enhance strength and durability. The mix proportions are given in Table 1. The lower water-to-cement ratio and silica fume significantly improved the compressive strength of the HPC mixture.

Table 1.
Concrete mix proportions.
| Material | C30 | C40 | C80 |
|---|---|---|---|
| Cement (kg/m³) | 310 | 365 | 480 |
| Water (kg/m³) | 150 | 125 | 85 |
| Superplasticizer (kg/m³) | – | 2.5 | 5.8 |
| Silica Fume (kg/m³) | – | – | 45 |
| Fine Aggregate (kg/m³) | 1190 | 1105 | 855 |
| Coarse Aggregate 12 mm (kg/m³) | 235 | 230 | 350 |
| Coarse Aggregate 19 mm (kg/m³) | 580 | 575 | 580 |
| Water/Cement Ratio (%) | 48.4 | 34.2 | 27 |
Concrete properties were evaluated through compressive and splitting tensile strength tests. Compressive strength was measured using 150 × 150 × 150 mm cubes in accordance with BS EN 12390-3:2019 [44], while splitting tensile strength was determined using 100 × 200 mm cylinders following ASTM C496/C496M-17 [45]. For each mix, three specimens were tested at 28 days, and the average values were reported. All mixtures achieved their target strengths, with compressive and tensile strengths increasing consistently as concrete grade increased. The test results are summarized in Table 2.
2.3. Prototype Design, Reinforcement Configuration, and Experimental Variables
Fourteen full-scale rectangular bridge girders were designed in accordance with ACI 318-25 [46], representing typical bridge girder geometries and prestressing details outlined in the AASHTO LRFD Bridge Design Specifications [26]. All specimens maintained identical cross-sectional dimensions to ensure comparability.
Figure 2.
Geometry of test girders showing different camber configurations.
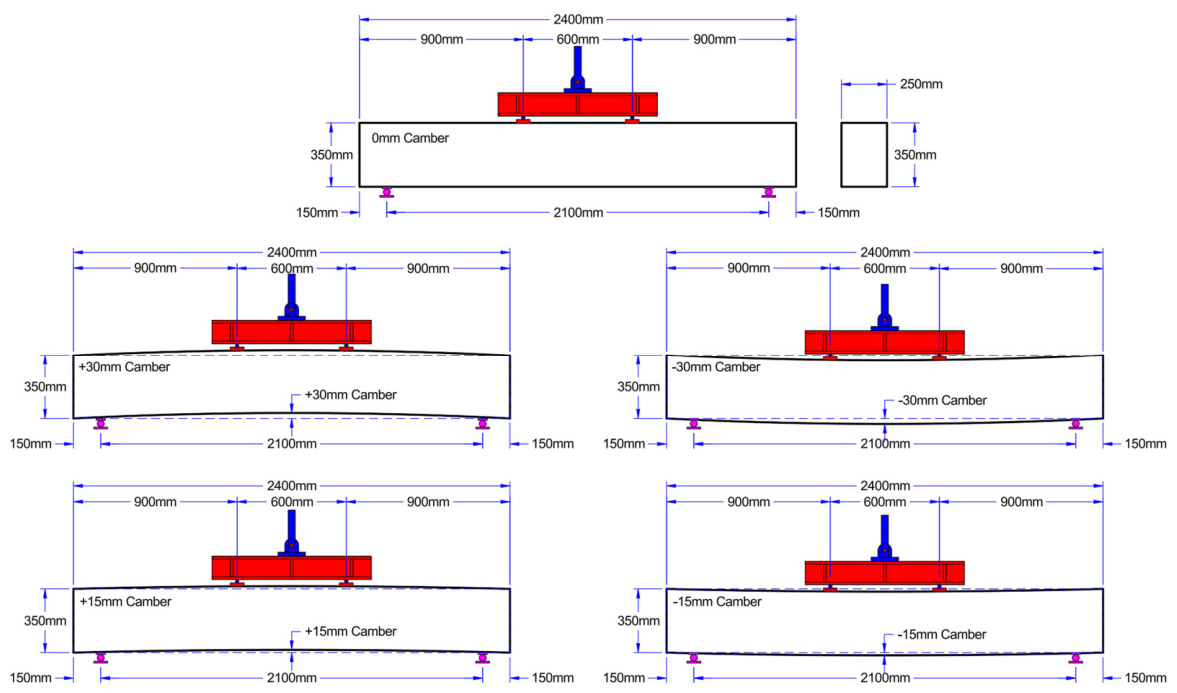
All specimens measured 2400 mm in length, 250 mm in width, and 350 mm in depth (Table 3). Enlarged, reinforced end blocks were provided to accommodate the post-tensioning anchorages and resist localized bursting stresses. The predefined mid-span profiles were introduced during casting to match camber-to-span ratios of ±L/70 (for the ±30 mm levels) and ±L/140 (for the ±15 mm levels) relative to the 2100 mm effective span.
Two reinforcement systems were investigated: conventional reinforced concrete and post-tensioned prestressed concrete. The conventional girders were reinforced with two Ø10 mm compression bars, two Ø12 mm tension bars, and transverse reinforcement, including additional reinforcement in the anchorage zones. As shown in Figure 3, the prestressed girders contained two 12.7 mm seven-wire low-relaxation strands conforming to ASTM A416/A416M [47], placed eccentrically near the bottom of the section to maximize flexural capacity. Spiral reinforcement was provided around the anchorages to control bursting stresses during post-tensioning.
The mechanical properties of the reinforcing bars and prestressing strands were obtained from manufacturer certificates and verified experimentally. The results are summarized in Table 4.
The experimental matrix (Table 5) comprised three groups. Group 1 examined the influence of camber magnitude and direction on prestressed girders with 40 MPa concrete. Group 2 compared prestressed and conventionally reinforced girders with identical geometry. Group 3 investigated the combined effects of concrete strength and initial camber. The intermediate camber levels (±15 mm) were included only for the 40 MPa prestressed series, which represents typical bridge-girder construction. After establishing the response between zero and the maximum practical camber (±30 mm), the remaining concrete-strength groups were limited to these conditions. This approach captured the interaction between camber and concrete strength while keeping the number of full-scale specimens manageable.
2.4. Specimen Fabrication and Prestressing Procedure
All specimens were fabricated under controlled laboratory conditions to guarantee uniform material properties, geometric accuracy, and reinforcement placement. Standardized fabrication protocols were maintained to ensure that variations in structural behavior could be attributed exclusively to the target experimental variables: predefined initial profile, reinforcement type, and concrete compressive strength. The fabrication process comprised five stages: reinforcement cage assembly, formwork preparation and camber adjustment, concrete casting and curing, tendon installation, and post-tensioning. Reinforcement cages were fabricated according to Figure 3 and inspected to verify bar spacing, concrete cover, and dimensional accuracy. For prestressed specimens, spiral reinforcement was provided in the anchorage zones to resist local bursting and splitting stresses during prestress transfer. The completed cages are shown in Figure 4(a).
A custom steel mould was developed to introduce the predefined initial profiles during casting. Three girder profiles were produced: straight (0 mm), positively cambered (+15 and +30 mm), and negatively cambered (−15 and −30 mm). The required geometry was achieved by adjusting the mould elevation at mid-span while keeping both ends fixed. Surveying equipment was used to verify the target profiles. Unlike the upward camber generated after prestressing, the predefined initial profiles considered in this study were introduced during casting, allowing its interaction with prestress-induced camber to be evaluated. Figure 4(b) illustrates the mould setup. Before casting, 20 mm plastic ducts and anchorage assemblies were accurately positioned and secured within the reinforcement cages to ensure proper tendon alignment and minimize friction losses during stressing (Figure 4(c)).
Concrete was mixed in a laboratory pan mixer, batched by weight, placed in layers, and compacted using internal vibrators to eliminate air voids without causing segregation. After finishing, the specimens were cured under laboratory conditions until testing. Companion cubes and cylinders were also cast to determine compressive and splitting tensile strengths. The finished specimens are shown in Figure 4(d).
After the concrete reached the required strength, the prestressed specimens were post-tensioned. Each girder contained two 12.7 mm seven-wire low-relaxation strands placed within the embedded ducts. The strands were cleaned before stressing and tensioned gradually using a hydraulic jack (Figure 5). The applied prestressing force was verified through both hydraulic pressure and strand elongation measurements. Once the target force of approximately 100 kN was reached, the strands were secured with wedge anchors, and the anchorage system was inspected to ensure proper force transfer. The same prestressing procedure was applied to all specimens to maintain consistency throughout the experimental program.
2.5. Test Setup, Instrumentation, and Data Acquisition
Fabricated concrete girders have been tested under monotonic four-point loading machine until failure and reaching ultimate load. Through this loading configuration constant-moment region has been achieved between the loading points, which is allowing reliable evaluation and understanding of flexural behavior of beam which are crack development, stiffness degradation, and ultimate load capacity. Loading has been conducted using a rigid loading frame equipped with a hydraulic actuator and a computerized data acquisition system (data logger). Beam specimen was simply supported and loaded through a hydraulic jack acting on a steel spreader beam, in order to distribute the load equally to two loading points. By this arrangement flexural response of girders under service and ultimate loading conditions has been evaluated.
The load application continuously was measured using a calibrated load cell placed between the hydraulic jack and spreader beam. deflection was recorded within the Mid-span through a Linear Variable Differential Transformer (LVDT), while additional LVDTs were used where required to verify deformation symmetry. The entire test setup is shown in Figure 6. During testing, the instrumentation continuously recorded load application, and mid-span deflection. Gradually Load was applied under displacement control situation to ensure stable crack initiation and progression. At each increment of loading recoding and observation been made for crack initiation, propagation, crack width, and local distress. The initial first visible crack in the girder was taken as the cracking load (Pcr), and crack development propagation was documented photographically for each specimens. Loading continued until the beams reached its ultimate capacity and exhibited a clear loss of resistance to load increasable.
All sensors were connected to an automated data acquisition system called data logger that continuously recorded load and displacement throughout the test. The recorded data were used to capture study parameters like the first cracking load (Pcr), first cracking deflection (Δcr), ultimate load (Pu), ultimate deflection (Δu), load–deflection response, crack patterns, and failure mode. These parameters used to assess and evaluate the effects of initial camber, reinforcement type, and concrete compressive strength on girder performance which were the study variables.
2.6. Structural Performance Evaluation
In order to perform a comprehensive assessment and evaluation of the flexural behavior of the tested girders, a series of quantitative performance indicators have been calculated from the experimentally obtained load–displacement responses. Despite of the directly measured parameters, which is including the cracking load, ultimate load, and corresponding mid-span displacements, several structural indicators were determined like stiffness characteristics, ductility, structural efficiency, energy absorption, and the relative influence of the imposed pre-camber configurations. Those determined indicators provide a unified framework for comparing specimens with different concrete strengths, reinforcement systems, and initial camber profiles through using the same evaluation criteria.
2.6.1. Percentage Performance Improvement
To quantify structural impact of varying pre-camber configurations, a percentage performance improvement analysis has been conducted as a critical structural marker, which are cracking load , ultimate load , and ultimate deflection . For each of the structural series (categorized by concrete compressive strength or steel-composite group), the straight girder specimen featuring a 0 mm camber has been used as the control specimen. The performance changes evaluated following comparative empirical equation [48,49] denoted as (2)
where represents the experimental structural parameter evaluated for a specific pre-cambered girder, and represents the corresponding control specimen within the same group of specimens. A positive result denotes an enhancement and increasable in capacity or deformability, whereas a negative value indicates a relative performance reduction and decreasable due to the variables effect of the study.
2.6.2. Stiffness Evaluation
For evaluation of the elastic, post-yield, and geometric performance variations which is provided by pre-camber configurations, several key structural indicators were calculated and determined from the experimental load-deflection curves.
The initial uncracked stiffness which values the girders structural resistance to elastic deformation prior to the onset of micro-cracking in the concrete matrix. It has been defined as the slope of the primary linear-elastic part of the load deformation curve up to the cracking load threshold [50,51], it is denoted as follows:
where:
is the experimental load at the onset of concrete cracking (kN).
is the corresponding mid-span vertical displacement at the cracking load (mm).
To calculate and evaluation of the structural rigidity which is remaining after the concrete loses its tensile integrity, the post-cracking stiffness has been determined like the secant slope extending from the cracking coordinate to the peak ultimate load. The residual stiffness ratio determined as the degree of stiffness degradation a girder undergoes [51,52] and is expressed as:
where:
is the maximum peak ultimate load capacity (kN).
is the mid-span deflection recorded at the precise instant of peak load (mm).
2.6.3. Equivalent Yield Point and Ductility
Post-yield deformation capacity has been evaluated with structural ductility of the girders, an equivalent elastoplastic bilinear idealization has been executed through the equal-energy principles established by [53]. Because reinforced and prestressed concrete beams show and perform in a highly non-linear load-deformation driven by progressive concrete cracking and steel plastic yielding, determining the physical yield point directly from the experimental curve is unfeasible. Consequently, an effective initial elastic stiffness line () is first constructed as a secant line passing through the origin and intersecting the experimental response path at an intermediate load level equivalent to 60% of the maximum recorded capacity ():
where () represents the mid-span displacement corresponding to the intermediate load threshold (). Based on the equal-energy criteria, the unique equivalent yielding load () is derived by equating the mathematically integrated area under the real non-linear envelope () to the total area which made beneath the idealized elastoplastic curve up to the ultimate boundary displacement (). By separating the bilinear profile into an initial elastic triangle and a perfectly plastic rectangle, and enforcing the stiffness boundary constraint (), the governing energy balance is formulated analytically like below:
Rearranging these expressions into a standard quadratic structure allows the precise extraction of the equivalent structural yielding load ():
Following the calculation of the idealized yielding load, the corresponding equivalent yield displacement () is computed directly by projecting the yield state along the effective elastic stiffness trajectory:
Ultimately, the dimensionless structural displacement ductility coefficient (), which indexes the component's capacity to went severe inelastic deformations without sustaining brittle failure or severe strength degradation through the loading stages, is determined explicitly as the ratio between the ultimate deformation boundary and the computed equivalent yield point:
2.6.4. Structural Efficiency
The strength-to-deflection ratio provides critical performance efficiency indicator that balances ultimate load-carrying capacity versus serviceability limits [54,55]. It provide a well indicator of structural optimization, formulated as:
where:
- is the peak ultimate load capacity (kN).
- is the ultimate mid-span deflection recorded at failure (mm).
2.6.5. Energy Absorption
To value the overall toughness and energy dissipation capacity of the fabricated and tested girders, the Total Energy Absorption has been calculated. Physically, this parameter represents the total work done on the specimen and corresponds to the entire area enclosed under the experimental load-deflection curve from the initiation of loading up to the ultimate failure point deformation. Because the continuous experimental data was captured at discrete data point intervals by the data logger system, numerical integration through Trapezoidal Rule has been applied in accordance with established structural testing formulas [56,57]. The total energy absorption calculated using below Equations (11 & 12):
For discrete experimental data sets containing n data points, the integration is approximated by splitting the area under the curve into a series of vertical trapezoids:
where:
- and are the structural loads at two consecutive data points (kN).
- and are the corresponding deflections at those same points (mm).
- is the localized width of the interval slice.
- is the average height of that localized slice.
3. Results
3.1. General Structural Response
The fourteen full-scale girders were tested to failure under monotonic four-point bending to assess how predefined initial profile, reinforcement system, and concrete strength affect flexural performance. Every specimen followed the same sequence: an initial linear-elastic stage, cracking within the constant-moment region, gradual stiffness loss as cracks multiplied, peak load, and finally flexural failure. The load–displacement records show that the girders stayed stable throughout, with no premature anchorage failure, tendon slip, support instability, or shear distress. Cracks began in the tensile zone at the bottom fiber and spread toward the compression region as load rose. They stayed concentrated in the pure-bending zone between the two load points, confirming that the setup produced flexure-dominated behavior.
In every prestressed specimen, cracking started at much higher loads than in the conventionally reinforced ones. After cracking, capacity kept rising to the maximum load. Near the ultimate stage, existing cracks widened noticeably alongside localized crushing in the compression zone. Failure was flexural, with concrete crushing in the compression region as the dominant mode. No specimen failed in brittle shear or collapsed suddenly. The gradual crack development allowed continuous monitoring and accurate measurement of cracking loads, ultimate loads, and their corresponding displacements. The main results for all specimens are summarized in Table 6.
3.2. Failure Modes
Failure mechanisms were tracked continuously from first loading to complete failure, with visual checks throughout each test to catch crack initiation, propagation, widening, and concrete crushing. The typical flexural failure progression and crushing are shown in Figure 7.
For most specimens, the failure sequence broke into five stages: Stage I – Elastic Response. Early on, all specimens behaved elastically, with a roughly linear load–displacement curve and no visible cracks, meaning tensile stresses stayed below the modulus of rupture. Stage II – Crack Initiation. As load neared the first-crack level, flexural cracks appeared in the tensile zone at the girder's bottom surface, generally within the constant-moment region between the load points. The prestressed girders cracked at far higher loads than the conventionally reinforced ones, and the first crack usually formed near midspan where the bending moment peaked. Stage III – Crack Propagation. More flexural cracks then developed across the pure-bending region. Existing cracks ran vertically toward the compression zone while new ones formed between them. Stiffness dropped gradually, seen as a flattening load–displacement slope. Crack spacing stayed fairly uniform in the central region, and no inclined shear cracks appeared outside the loading zone. Stage IV – Ultimate Load. Approaching peak capacity, cracks widened markedly, extending further into the web, and localized crushing became visible near the top surface. The ultimate load was taken as the maximum recorded value. At this point specimens showed extensive flexural cracking and pronounced nonlinear deformation. Stage V – Flexural Failure. Failure came mainly through crushing of the compression zone within the constant-moment region. It was gradual rather than sudden, allowing continued deformation past peak load. No tendon rupture, anchorage failure, or shear failure occurred, so every specimen reached the intended flexural failure mode. Representative photographs of failed specimens showing crushing and flexural cracking appear in Figure 7.
3.3. Load–Displacement Response
Figure 8 delineates the load-deflection trajectories for the experimental cohort subjected to monotonic four-point flexure. These hysteretic envelopes characterize the transition from elastic-perfectly plastic behavior to the ultimate limit state for both prestressed and conventionally reinforced specimens across varying compressive strengths. Initial response for all members remained linear until the tensile stress in the extreme bottom fibers exceeded the modulus of rupture. Subsequent crack initiation within the constant-moment region precipitated a systematic reduction in secant stiffness. Prestressed girders exhibited significantly higher cracking moments and post-cracking residuals compared to reinforced counterparts. This result aligns with the delayed decompression of the tension zone provided by the internal tendons.
Geometric configuration dictated the flexural capacity of the 40 MPa series. PRS+30-40 reached an ultimate capacity of 340.66 kN at a mid-span displacement of 14.85 mm, whereas the negative-camber PRS-30-40 attained only 249.57 kN. This disparity suggests that initial upward camber effectively offsets a portion of the downward displacement, thereby delaying the onset of non-linear geometry. Positively cambered specimens consistently demonstrated reduced deflections at identical load stages. Conversely, the 30 MPa series mirrored these trends but at lower load magnitudes; PRS+30-30 peaked at 274.46 kN. The 80 MPa specimens maintained the highest load-carrying capacities in the program. PRS+30-80 reached 365.91 kN, representing the peak resistance observed across all tests. High-strength concrete specimens yielded higher peak loads but exhibited more pronounced brittle characteristics during the crushing of the extreme compression fibers.
Conventional reinforced specimens behaved according to a different mechanical regime. Their ultimate resistance clustered within a narrow band between 137.98 kN and 139.22 kN, indicating that the absence of prestressing force makes peak capacity largely independent of initial camber. Ductility, however, varied. STL+30-40 sustained a displacement of 37.30 mm before rupture, while the straight STL+00-40 failed at 14.95 mm. Displacement capacity was inconsistent. Under identical loading protocols, the lack of pre-compression resulted in a rapid migration of the neutral axis and accelerated stiffness decay. These data suggest that while camber influences the serviceability limit state and displacement capacity of reinforced members, it does not enhance their ultimate flexural strength. Total failure occurred upon concrete crushing.
3.4. Cracking Behavior and Crack Pattern Development
Systematic monitoring of crack initiation and spatial evolution delineates the transition from a linear-elastic response to a nonlinear post-cracking regime. This shift is quantified in Table 6 through first-crack loads and corresponding midspan translations, while Figure 9 catalogs the final crack topology at the ultimate limit state.
Load paths remained stable. During initial loading stages, all specimens maintained sectional integrity with no observable surface distress. Once the extreme tension fiber stress reached the concrete modulus of rupture, primary flexural cracks initiated at the beam soffit. This fracturing occurred exclusively within the constant-moment region between the load points. Pure bending governed the response.
Recorded first-crack magnitudes ranged from 55.29 kN for STL+00-40 to 178.34 kN for PRS+30-40. Accompanying midspan displacements spanned a range of 1.71 mm to 7.91 mm, with the minimum observed in STL+30-40 and the maximum in PRS−30-30. Following crack initiation, the development of secondary vertical traces between primary fissures indicated a reduction in the effective second moment of area. This stiffness degradation aligns with the nonlinear segments of the load-displacement curves. Figure 9 illustrates a predominantly vertical crack morphology concentrated within the central, high-moment span. No specimen exhibited significant diagonal tension or shear-induced web distress near the supports. Shear did not govern.
Prestressed specimens exhibited a higher fracture density with reduced inter-crack spacing, suggesting a more efficient redistribution of internal stresses after the loss of section homogeneity. In contrast, the reinforced girders developed fewer but more substantial apertures at equivalent loading increments. As the specimens approached the ultimate stage, several principal cracks propagated toward the neutral axis and widened significantly. Final failure involved the concrete reaching its ultimate compressive strain, resulting in localized brittle crushing directly above the primary flexural fissures. Such consistency across specimens—regardless of concrete strength, camber, or prestressing levels—confirms the dominance of flexural mechanics throughout the program. The absence of anchorage slip or diagonal shear cracking indicates the experimental setup successfully isolated the intended failure mechanism. The setup was effective.
3.5. Quantitative Flexural Performance Assessment
Beyond direct empirical observations, the derivation of second-order flexural metrics from the experimental load-deformation envelopes facilitates a granular comparative analysis across the girder cohort. Relative percentage improvements, secant stiffness degradation, and displacement ductility ratios were quantified using the analytical framework established in Section 2.6. These metrics define the system response. Specific attention was directed toward the interplay between predefined parabolic profiles, concrete compressive strength, and the reinforcement architecture. This allows for a consistent assessment of the mechanical influence of pre-camber.
Table 7 catalogs the measured bifurcations in behavior, specifically the loads at first fracture (Pcr) and the ultimate limit state (Pu), alongside peak midspan translations. Comparisons against the control straight-line specimens reveal that the magnitude and vector of the initial camber significantly modify the flexural capacity. Concrete grade matters. The data indicates that improvements in peak capacity depend heavily on the alignment between the reinforcement configuration and the imposed initial geometry.
Analytical results regarding the stiffness-related parameters, including the initial elastic rigidity and the residual stiffness ratio, appear in Table 8. These data reflect the synergistic effects of active prestressing and concrete matrix properties on the structural efficiency and ductility.
Considerable variance was observed across experimental groups. Such fluctuations underscore the impact of pre-existing internal stress states on the overall deformability and the transition from elastic to inelastic response. Normalization of the ultimate capacity (Pu) against concrete compressive strength, utilizing both Pu/fc′ and ratios, removes the bias inherent in fluctuating material grades. Numerical integration of the area under the load-displacement curves yielded the total energy absorption. These values are summarized in Table 9. These strength-independent coefficients provide a standardized baseline for comparing the fracture toughness and flexural efficiency of each specimen.
Compiling these indices establishes a rigorous dataset for evaluating the efficacy of the investigated pre-cambering strategies. While the current section focuses on the objective presentation of these derived parameters, the mechanical significance and the phenomenological correlations between variables are critically interpreted in the discussion. The database is robust. This quantitative foundation ensures that the influence of geometric nonlinearity on the load path is clearly isolated.
4. Discussion
4.1. Influence of Predefined Camber and Accidental Deflection on Flexural Performance
This study examined how predefined initial profiles affect the flexural behavior of full-scale bridge girders. Because the cross-section, reinforcement, loading, and fabrication were kept constant, the observed differences can be attributed directly to the predefined initial geometry. The results show that initial geometry influences crack initiation, stiffness degradation, ultimate load, deformation, and overall structural efficiency. In general, positive camber improved performance, whereas negative camber reduced load capacity but increased deformation. Figure 10 summarizes the changes in cracking load, ultimate load, and ultimate deflection.
In the prestressed 40 MPa series, increasing camber from 0 to +30 mm increased the cracking load from 112.52 to 178.34 kN (about 58.50%). The +15 mm camber produced a notable increase of 11.92%, indicating that the benefit grows with camber magnitude. Negative camber reduced cracking resistance, with decreases of about 5.55% for −15 mm and 10.00% for −30 mm. Downward initial curvature (representing accidental pre-deflection) accelerates the development of tensile stresses at the bottom soffit, thereby expediting crack initiation. For the conventionally reinforced concrete (RC) girders, the +30 mm predefined camber resulted in a nominal 7.14% increase in cracking load, while the −30 mm specimen displayed a 4.38% increase; this limited variation is attributed to the absence of a prestress-induced compressive stress field.
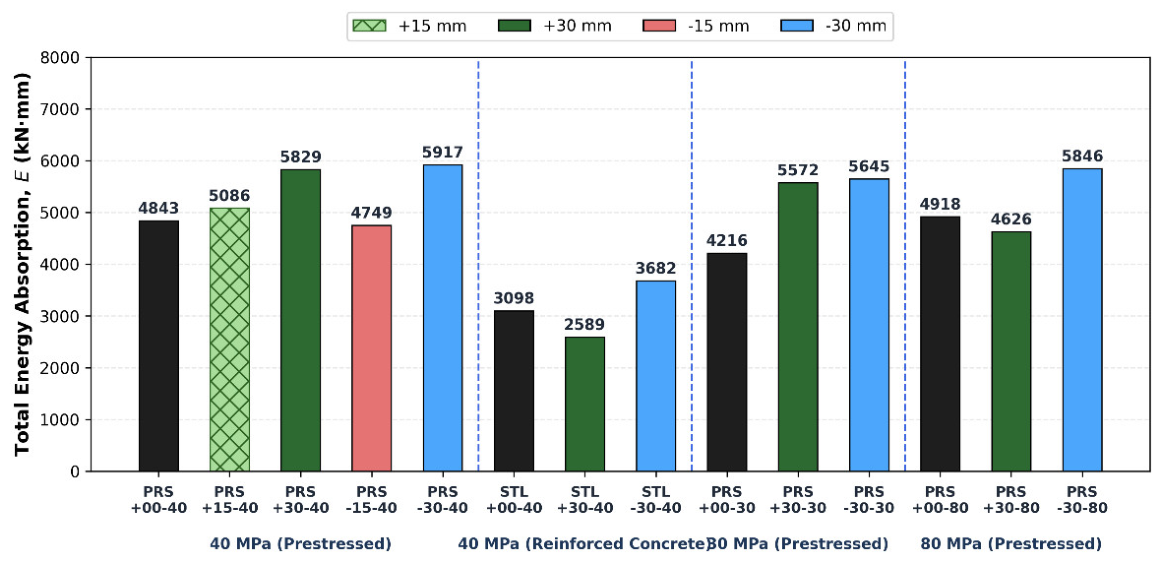
Camber had a stronger effect on ultimate capacity. For the 40 MPa prestressed girders, +15 mm and +30 mm increased the ultimate load by about 12.5% and 19.3%, respectively. In the 30 MPa series, the +30 mm specimen still achieved a 13.7% higher ultimate load than the straight girder. The effect was smaller for 80 MPa concrete, where +30 mm increased capacity by about 4.0% because concrete strength became the dominant factor. Deformation showed the opposite trend. Positive camber reduced ultimate deflection, while negative camber increased it. In the 40 MPa prestressed series, +15 mm and +30 mm reduced deflection by about 8.45% and 6.62%, whereas −15 mm and −30 mm increased it by about 7.07% and 55.72%. Accordingly, positively cambered girders exhibited a stiffer response and higher loads at smaller displacements, while negatively cambered girders showed greater flexibility and larger deformations. Structural efficiency followed the same pattern. The +30 mm prestressed girder achieved the highest efficiency (16.32 kN/mm), about 27.72% higher than the straight control (12.77 kN/mm), whereas the −30 mm specimen had the lowest value (7.17 kN/mm). Normalized strength indices confirmed that these improvements were not solely due to concrete strength; for example, Pu/f'c increased from 7.14 for PRS+00-40 to 8.52 for PRS+30-40. Energy absorption depended on both strength and deformation. Although positively cambered girders generally carried higher loads, the highest absorbed energy was recorded for PRS−30−40 (5917.32 kN·mm), slightly exceeding PRS+30−40 (5828.84 kN·mm) because of its larger deformation capacity. Mechanically, predefined camber and accidental deflection alter the internal stress state before loading. Positive camber offsets part of the bending-induced tension, delays cracking, and improves the utilization of concrete compression and prestress. Negative camber increases bottom-fiber tension, leading to earlier stiffness degradation and lower ultimate resistance, but it also allows greater inelastic deformation and, in some cases, higher energy absorption.
4.2. Effect of Prestressing and Concrete Strength on Flexural Behavior
The flexural response of bridge girders is influenced by both geometry and the interaction between prestressing and concrete strength. Representative load–displacement curves are presented in Figure 11 for the 40 MPa (a), 30 MPa (b), and 80 MPa (c) specimens. While Section 4.1 showed that predefined curvature significantly affects structural response, the present results demonstrate that its effectiveness depends on both prestressing and concrete strength. Together, these factors govern cracking, stiffness, ultimate capacity, deformation, and failure behavior.
Prestressing had the greatest influence on performance. For every concrete strength and camber level, prestressed girders outperformed conventionally reinforced specimens in cracking resistance, stiffness, and ultimate load. The initial compressive stress introduced by prestressing reduced tensile stresses during bending, delayed cracking, and improved flexural resistance. For the 40 MPa control specimens, the prestressed girder (PRS+00-40) reached an ultimate load of 285.55 kN, compared with 138.52 kN for the reinforced girder (STL+00-40), an increase of about 106%. Similar trends were observed for both positive and negative camber, confirming that prestressing remained the dominant factor controlling flexural capacity. Prestressing also significantly delayed cracking. The first crack in the 40 MPa prestressed control appeared at 39.74 kN, compared with only 10.70 kN in the reinforced specimen. The load–displacement curves further showed steeper initial slopes and slower stiffness degradation in prestressed girders, whereas reinforced specimens experienced a more rapid stiffness loss after cracking and larger deflections under similar load increments. Structural efficiency reflected the same behavior. Prestressed girders achieved values between 6.47 and 21.18 kN/mm, compared with 3.70–6.08 kN/mm for reinforced specimens, demonstrating their ability to sustain higher loads with smaller deflections.
Concrete strength also influenced flexural performance. Increasing the strength from 30 to 80 MPa increased cracking resistance and ultimate load while delaying compression failure. The ultimate load increased from 241.35 kN (30 MPa) to 285.55 kN (40 MPa) and 351.90 kN (80 MPa). However, normalized strength indices decreased (Pu/f'c = 8.05, 7.14, and 4.40, respectively), indicating that the additional concrete strength was not fully translated into proportional flexural efficiency because the reinforcement and prestressing system increasingly governed the response. Although all specimens failed by concrete crushing after flexural cracking, lower-strength girders exhibited more extensive cracking and larger deformations, whereas the 80 MPa specimens developed fewer, more localized cracks before crushing, reflecting the lower compressive strain capacity of high-strength concrete. The combined influence of prestressing, concrete strength, and pre-camber was most evident in the prestressed girders. Positive pre-camber produced the largest improvement at 40 MPa, increasing ultimate load by about 19.3%, while the gain at 80 MPa was limited to about 4.0%. This suggests that pre-camber is most effective at moderate concrete strengths, where prestressing and geometric stress redistribution act together. At higher strengths, the greater material stiffness reduces the relative influence of camber. Likewise, although the 80 MPa girders achieved the highest ultimate loads, the lower-strength specimens exhibited greater deformation capacity. Despite these differences, all specimens followed the same failure sequence: crack initiation in the constant-moment region, crack propagation, gradual stiffness degradation, concrete crushing in compression, and ductile flexural failure. No premature shear failure, anchorage failure, or strand rupture was observed, confirming that the test program successfully isolated the flexural effects of the investigated variables.
4.3. Ductility, Energy Absorption, and Overall Flexural Performance Assessment
Beyond standard limits of load capacity and elastic stiffness, flexural concrete members must sustain stable, controlled post-yield inelastic deformation while maintaining moment capacity and dissipating energy under extreme limit states. Ductility governs this inelastic performance. To evaluate the systemic impact of initial geometric profiles, parameters including displacement ductility, hysteretic energy dissipation, residual stiffness, and structural efficiency were calculated. Figure 12 illustrates these calculated structural efficiencies. Lacking direct strain measurements on the longitudinal reinforcement, tensile yielding was approximated using an equivalent bilinear idealization of the experimental load-deflection envelope.
This derivation followed the equal-energy principle. Consequently, this methodology defined the equivalent yield load, yield displacement, and displacement ductility ratio (μ) presented in Figure 13.
Figure 14.
Total Energy absorption of all tested girders.
Initial geometry exerted a pronounced influence on member ductility. Within the 40 MPa prestressed series, the displacement ductility ratio rose from 2.31 in the control specimen to 2.62 and 3.66 in the +15 mm and +30 mm pre-cambered specimens, respectively. Positive camber enhanced overall deformability. Under incremental loading, positive camber delays the onset of concrete tensile cracking and subsequent neutral axis migration, mitigating stiffness degradation. As a result, the extreme compression fibers of the concrete reached their ultimate compressive strain much later, delaying brittle crushing.
As anticipated, conventionally reinforced girders sustained greater inelastic deformability than prestressed members. Specimen STL+30-40 achieved a displacement ductility index of 3.57. However, lower yield strength accompanied this heightened deformability. Residual stiffness ratios, calculated to assess post-yield behavior, confirmed that the positive-camber specimens in the 40 MPa series exhibited lower residual stiffness ratios. This drop corresponds directly to their elevated initial elastic stiffness. Conversely, the 30 MPa and 80 MPa specimens showed that post-cracking stiffness retention depends on the complex interaction of concrete compressive strength, second moment of area, and prestressing force. Pre-camber alone cannot predict stiffness retention.
To quantify the load-deflection trade-off, structural efficiency was defined as the ratio of ultimate capacity (P_u) to ultimate deflection (Δ_u). Positive pre-camber significantly elevated this metric. Specimen PRS+30-80 exhibited the highest structural efficiency at 21.18 kN/mm. Similarly, introducing a +30 mm pre-camber in the 40 MPa series increased structural efficiency from 12.77 to 16.32 kN/mm relative to the straight baseline. Conversely, negative pre-camber consistently compromised this efficiency. For example, specimen PRS-30-40 achieved an efficiency of only 7.17 kN/mm. This represents a 43.85% reduction compared to the straight control. The 30 MPa prestressed and conventionally reinforced specimens exhibited comparable reductions.
Hysteretic energy absorption, calculated via the numerical integration of the load–deflection boundary, depends on both peak load-carrying capacity and total deformation. Within the 40 MPa prestressed series, the negative-camber specimen PRS−30-40 exhibited the highest energy dissipation at 5917.32 kN·mm. This response marginally exceeded that of specimen PRS+30-40, which dissipated 5828.84 kN·mm. Lower load capacity was offset by high deformability. Across the other concrete strength series, similar behavior was observed. These findings indicate that while negative pre-camber increases total toughness through extended plastic deformation, positive pre-camber improves strength and structural efficiency. Figure 15 illustrates this mechanical trade-off.
4.4. Engineering Implications
This study shows that initial pre-camber is not just a construction geometry detail—it works as a real design parameter that can change how prestressed concrete bridge girders perform. The experiments found that an appropriate positive pre-camber improved cracking resistance, raised ultimate flexural strength, boosted structural efficiency, and reduced service deflections, all without altering girder shape, reinforcement layout, or the prestressing setup. In other words, the gains come with no extra material demand, making camber optimization both practical and economical. From a bridge engineering standpoint, delaying flexural cracking is especially valuable because crack timing affects long-term durability. Higher cracking loads help reduce the chance of harmful moisture and chemicals reaching the concrete, which can lower maintenance needs over the bridge’s service life. The improved structural efficiency also indicates a better balance between load capacity and deformation, which is crucial for serviceability-focused designs. Normalized strength results further suggest that geometric optimization via predefined camber can improve performance regardless of concrete strength alone. Stronger concrete raises absolute capacity, but it doesn’t translate into proportional gains in how efficiently that capacity is used.
4.5. Comparison with Previous Studies
The observed monotonic and hysteretic response curves of the analyzed test specimens align with historical experimental datasets evaluating prestressed concrete (PC) and reinforced concrete (RC) flexural members subjected to initial geometric camber [5,27,40,58,59]. While literature regarding intentionally pre-cambered bridge superstructure elements under monotonic flexural loads remains sparse, the empirical findings align with established constitutive relationships governing prestress force-eccentricity and flexural stiffness evolution. Under flexural loading, the introduction of a moderate +30 mm positive upward pre-camber optimized cross-sectional stress distributions, elevating the ultimate limit state capacity by 4% to 19% relative to nominal, prismatic specimens. This physical adjustment delayed the onset of micro-cracking within the tension zone, augmented the uncracked flexural stiffness (), and enhanced overall structural efficiency. By introducing a pre-compressive stress field in the bottom extreme fibers, the initial camber effectively counteracts the load-induced tensile stresses, thereby delaying the transition from uncracked to cracked sectional properties and increasing the cracking moment () [11]. Cambers mitigate bottom-fiber tension.
These performance gains parallel research on construction tolerancing and initial geometric configurations, where a controlled upward curvature optimizes the internal stress field under serviceability limit states. The experimental evidence suggests that fabricating a controlled initial upward profile not only improves serviceability limit state performance by minimizing elastic deflections but also elevates the ultimate moment capacity () when coupled with active prestressing forces [40]. Conversely, unintended downward geometric eccentricities—often characterized as accidental deflections—compromise structural performance. Under load, these downward eccentricities accelerate the reduction of the tangent stiffness (), decrease the peak load-carrying capacity, and precipitate larger mid-span displacements. This behavioral trend is indicative of the adverse impacts of negative initial curvature, which intensifies the tensile stress field at the extreme bottom fibers and reduces structural efficiency [31]. Eccentricity governs load-path degradation.
The structural response of prestressed concrete members exhibited a heightened sensitivity to the initial camber profile compared to their conventionally reinforced counterparts. In RC specimens, variations in the initial geometric profile yielded negligible deviations in ultimate strength, despite altering the displacement field. This divergence corresponds to previous investigations indicating that active prestressing forces establish an asymmetric internal stress state, thereby amplifying the role of geometric boundary conditions and second-order structural effects () [24,25]. Prestressing amplifies geometric sensitivity.
Scaling the concrete compressive strength () from 30 MPa to 80 MPa expectedly enhanced the absolute nominal flexural capacity () across all prestressed test specimens. However, the normalized strength indices revealed a non-linear, non-proportional relationship. This behavior aligns with historical research indicating that ultimate flexural resistance is a multi-variable function governed by the reinforcement ratio (), active prestress levels, and the transition of the primary failure mode from ductile tension steel yielding to brittle concrete crushing in the compression zone [17]. Strength scaling remains non-linear.
Regardless of initial geometric configurations, all tested girders exhibited a classic three-stage flexural response. This response is characterized by an initial linear-elastic phase (), a post-cracking non-linear phase governed by progressive steel yielding, and ultimate failure occurring when the concrete reached its ultimate compressive strain and underwent brittle crushing in the extreme compression fiber. Incorporating a positive pre-camber optimized the post-cracking tangent stiffness and structural efficiency without modifying the primary limit state failure mode. In contrast, the elevated hysteretic energy dissipation observed in specimens with accidental negative camber stemmed solely from excessive plastic deformations rather than enhanced load capacity. Camber dictates deformation efficiency.
While extensive literature documents the individual impacts of prestress levels, compressive strength (), and reinforcement ratios on girder performance, the interaction between predefined camber, accidental deflection, and structural response has received limited attention. The empirical findings demonstrate that intentional pre-camber acts as more than a passive mechanism to counteract long-term gravity-load deflections. Instead, it actively regulates the evolution of cracking, post-yield tangent stiffness, ultimate flexural capacity, ductility capacity (), and total energy dissipation capacity [27,29,40]. This provides vital empirical design calibration.
5. Conclusions
In this study, the impact of predefined camber and accidental deflection on the flexural performance of full-scale reinforced and prestressed concrete bridge girders under a four-point bending test is experimentally examined. Fourteen specimens having concrete compressive strengths of 30, 40, and 80 MPa and varying pre-cambers in the range from −30 to +30 mm are used. Conclusions are made as follows:
- Failure mode of all specimens was due to flexure irrespective of their pre-camber values. Flexural cracks appeared in the zone of constant moment and progressed until concrete crushing happened after yielding of tensile reinforcement or prestressing steel strands. No cases of premature shear failure or anchorage problems were observed.
- Predefined cambering positively affected the performance of prestressed girders. Girders having +30 mm pre-camber demonstrated the greatest ultimate loads with 13.7%, 19.3%, and 4.0% increases in the 30, 40, and 80 MPa concrete specimen capacities, respectively, compared to straight girders. This is due to better initial stress distribution.
- Negative pre-camber decreased flexural capacity but increased deformation capacity. Girders with −30 mm pre-camber had up to 12.6% lower ultimate loads but demonstrated ultimate deformations up to 55.72% greater than straight specimens.
- Positive predefined camber delayed crack appearance and increased cracking loads, while accidental deflection decreased the resistance to cracking depending on concrete strength.
- An increase in concrete strength increased the absolute flexural capacity of all prestressed girders without changing the total effect of the predefined profile.
- Positive pre-camber improved initial stiffness, increased post-cracking properties and stiffness, and provided higher residual stiffness and strength-to-deflection ratio. Girders with +30 mm pre-camber demonstrated the optimal combination of load-bearing capacity and deformation.
- Normalization of strength indices showed that the above-mentioned advantages are due to predefined camber but not to concrete strength. Among all specimens, the prestressed girder with +30 mm predefined camber and 40 MPa concrete showed the most balanced performance, having the highest structural efficiency, cracking resistance, ultimate capacity, and post-cracking properties.
The conclusions are made using monotonic four-point bending tests of full-scale simply supported girders with only one cross-section, reinforcement layout, prestressing level, and pre-camber range (−30 to +30 mm). Thus, care should be taken before generalizing the results for other types of bridges, loading, and long-term service conditions.
Future studies need to focus on the long-term behavior of pre-cambered prestressed girders, taking into account creep, shrinkage, prestress losses, traffic loading, and environmental factors. Investigation of girder geometry, prestressing level, span length, and reinforcement ratio variations will help to obtain generalized recommendations on this problem. Numerical models based on the results of the current experimental study could be used for such investigations.
Author Contributions
Conceptualization, A.H.K. and G.H.A.; methodology, A.H.K. and G.H.A.; software, A.H.K.; validation, A.H.K. and G.H.A.; formal analysis, A.H.K.; investigation, A.H.K.; resources, G.H.A.; data curation, A.H.K.; writing—original draft preparation, A.H.K.; writing—review and editing, A.H.K. and G.H.A.; visualization, A.H.K.; supervision, G.H.A.; project administration, G.H.A. All authors have read and agreed to the published version of the manuscript.
Funding
This research received no funding.
Data Availability Statement
Data is contained within the article.
Conflicts of Interest
The authors declare no conflicts of interest.
AI Use Statement: The authors used an artificial intelligence (AI)-assisted language editing tool to improve the grammar, language, and readability of this manuscript. The AI tool was not used to generate the scientific content, interpret the results, or draw conclusions. The authors carefully reviewed and edited all AI-assisted revisions and accept full responsibility for the accuracy, originality, and integrity of the manuscript.
References
- Zhao, H.; et al. Experimental Study on the Flexural Performance of Precast Segmental UHPC Thin-Walled Box Girder Bridges. J. Bridge Eng. 2026, 31(4), 04026014. [Google Scholar] [CrossRef]
- Park, H.W.; et al. Rational Estimation of Initial State of Post-tensioned Concrete Beams Using Field Measurement Data. Int. J. Concr. Struct. Mater. 2026, 20(1), 34. [Google Scholar] [CrossRef]
- Galustanian, N.; et al. The Development of Continuous Connections for Multi-Span Precast Prestressed Girder Bridges: A Review. CivilEng 2025, 16. [Google Scholar] [CrossRef]
- Zhang, T.; et al. A Study on Rational Pre-Tensioning Schemes for 60 m Prefabricated Railway Box Girders Considering Steel Formwork Constraints. Buildings 2026, 1320. [Google Scholar] [CrossRef]
- Almohammedi, A.; et al. Enhanced camber and deflection estimation for AASHTO prestressed concrete girders. PCI J. 2022. [Google Scholar] [CrossRef]
- Elawadi, A.; et al. Accuracy Evaluation of Prestressed Concrete Girder Camber in Missouri Bridges. J. Bridge Eng. 2022, 27(12), 04022119. [Google Scholar] [CrossRef]
- Yao, S.; et al. Estimation formula of finished bridge pre-camber in continuous rigid-frame bridges. Sci. Rep. 2022, 12(1), 16034. [Google Scholar] [CrossRef] [PubMed]
- Zhang, J.; et al. Sensitivity analysis and monitoring of control parameters in cantilever casting construction of prestressed concrete continuous girder bridges. Sci. Rep. 2025, 15(1), 29295. [Google Scholar] [CrossRef] [PubMed]
- Bali, I.; Wicaksana, S.; Hariandja, B. Partial stressing method effectiveness in post tension prestressed concrete system. JMTS J. Mitra Tek. Sipil 2024, 785–794. [Google Scholar] [CrossRef]
- Zéhil, G.-P. A unified model for the second-order behavior of beam–columns prestressed by a follower tendon. Thin-Walled Struct. 2025, 217, 113912. [Google Scholar] [CrossRef]
- Harajli, M.; Khairallah, N.; Nassif, H. Externally prestressed members: Evaluation of second-order effects. J. Struct. Eng. (N. Y.) 1999, 125(10), 1151–1161. [Google Scholar] [CrossRef]
- Pisani, M.A. Geometrical nonlinearity and length of external tendons. J. Bridge Eng. 2005, 10(3), 302–311. [Google Scholar] [CrossRef]
- Ng, C.K.; Tan, K.H. Flexural behaviour of externally prestressed beams. Part I: Analytical model. Eng. Struct. 2006, 28(4), 609–621. [Google Scholar] [CrossRef]
- Guo, W.; et al. Experimental study on time-dependent behavior of partially prestressed concrete beams: Coupled effects of creep, cracking, and prestress loss. Eng. Struct. 2026, 122051. [Google Scholar] [CrossRef]
- Lee, D.H.; et al. Control of Tensile Stress in Prestressed Concrete Members Under Service Loads. Int. J. Concr. Struct. Mater. 2018, 12(1), 38. [Google Scholar] [CrossRef]
- Pang, M.; et al. Numerical Assessment on Bonded and Unbonded Prestressed Concrete Beams. Buildings 2022, 1658. [Google Scholar] [CrossRef]
- Le, T.D.; Pham, T.M.; Hao, H. Numerical study on the flexural performance of precast segmental concrete beams with unbonded internal steel tendons. Constr. Build. Mater. 2020, 248, 118362. [Google Scholar] [CrossRef]
- Aïtcin, P.C.; Laplante, P. Long‐Term Compressive Strength of Silica‐Fume Concrete. J. Mater. Civ. Eng. 1990, 2(3), 164–170. [Google Scholar] [CrossRef]
- Han, C.; et al. Study on static and dynamic mechanical properties and microstructure of silica fume-polypropylene fiber modified rubber concrete. Sci. Rep. 2024, 14(1), 12573. [Google Scholar] [CrossRef] [PubMed]
- Hamada, H.M.; et al. Effect of silica fume on the properties of sustainable cement concrete. J. Mater. Res. Technol. 2023, 24, 8887–8908. [Google Scholar] [CrossRef]
- Abdulkareem, O.M.; et al. Mixture design and early age investigations of more sustainable UHPC. Constr. Build. Mater. 2018, 163, 235–246. [Google Scholar] [CrossRef]
- Marzouk, H.; Chen, Z.W. Fracture Energy and Tension Properties of High-Strength Concrete. J. Mater. Civ. Eng. 1995, 7(2), 108–116. [Google Scholar] [CrossRef]
- Mendis, P. Softening of normal strength and high-strength concrete frames. Adv. Struct. Eng. 2000, 3(2), 109–117. [Google Scholar] [CrossRef]
- Zhou, R.; et al. Energy Evolution Analysis and Brittleness Evaluation of High-Strength Concrete Considering the Whole Failure Process. Crystals 2020, 10, 1099. [Google Scholar] [CrossRef]
- Taheri, A.; Moghadam, A.S.; Tasnimi, A.A. Critical factors in displacement ductility assessment of high-strength concrete columns. Int. J. Adv. Struct. Eng. 2017, 9(4), 325–340. [Google Scholar] [CrossRef]
- 26. American Association of State, H. and O. Transportation, AASHTO LRFD Bridge Design Specifications; American Association of State Highway and Transportation Officials: Washington, DC, 2024. [Google Scholar]
- Tadros, M.K.; Fawzy, F.; Hanna, K.E. Precast, prestressed girder camber variability. PCI J. 2011, 56(1), 135–154. [Google Scholar] [CrossRef]
- Mante, D.M.; et al. Effective strategies for improving camber predictions in precast, prestressed concrete bridge girders. Transp. Res. Rec. 2019, 2673(3), 342–354. [Google Scholar] [CrossRef]
- Storm, T.K.; Rizkalla, S.H.; Zia, P.Z. Effects of production practices on camber of prestressed concrete bridge girders. PCI J. 2013, 58(1), 96–111. [Google Scholar] [CrossRef]
- Hinkle, S.D. Investigation of Time-Dependent Deflection in Long Span, High Strength, Prestressed Concrete Bridge Beams; Virginia Polytechnic Institute and State University: Blacksburg, VA, 2006. [Google Scholar]
- Barr, P.J.; Stanton, J.F.; Eberhard, M.O. Effects of temperature variations on precast, prestressed concrete bridge girders. J. Bridge Eng. 2005, 10(2), 186–194. [Google Scholar] [CrossRef]
- Zhang, J.; et al. Prediction Analysis of Pre-Camber for Continuous Girder Bridge Cantilever Casting Construction Based on DBO-CNN-BiLSTM-Attention Neural Network. Buildings 2025, 2159. [Google Scholar] [CrossRef]
- Hung, C.-C.; El-Tawil, S.; Chao, S.-H. A Review of Developments and Challenges for UHPC in Structural Engineering: Behavior, Analysis, and Design. J. Struct. Eng. 2021, 147(9), 03121001. [Google Scholar] [CrossRef]
- Ali, H.H.M. Advances in High-Performance Concrete: A Comprehensive Review of Materials, Design, and Applications; KHWARIZMIA, 2023; pp. 131–137. [Google Scholar]
- Jonnalagadda, S.; Chava, S. Ultra-High-Performance Concrete (UHPC): A state-of-the-art review of material behavior, structural applications and future. Electron. J. Struct. Eng. 2023, 25–30. [Google Scholar] [CrossRef]
- Zhu, Y.; et al. An adaptive crack width prediction for flexural steel reinforced UHPC beams. Int. J. Concr. Struct. Mater. 2023, 17(1). [Google Scholar] [CrossRef]
- Soltani, A.; Harries, K.A.; Shahrooz, B.M. Crack opening behavior of concrete reinforced with high strength reinforcing steel. Int. J. Concr. Struct. Mater. 2013, 7(4), 253–264. [Google Scholar] [CrossRef]
- Shwalia, A.S.I.; Al-Salim, N.H.A. Investigating the influence of UHPC layer length on the flexural response of prestressed concrete I-beams. Adv. Bridge Eng. 2025, 6(1). [Google Scholar] [CrossRef]
- Tian, X.; Fang, Z.; Shao, Y. Flexural behavior and design of prestressed ultra-high performance concrete (UHPC) beams: Failure mode and ductility. arXiv [math.NA] 2024. [Google Scholar]
- Brice, R.; et al. Fabrication and design of precambered precast, prestressed concrete bridge girders. PCI J. 2020, 65(3). [Google Scholar] [CrossRef]
- Committee, C. Specification for Portland Cement; ASTM International: West Conshohocken, PA, 2024. [Google Scholar]
- Committee, C. Specification for concrete aggregates; ASTM International: West Conshohocken, PA, 2018. [Google Scholar]
- Ullah, Z.; et al. The impact of silica fume on the properties of high-strength concrete: Enhancing strength, workability, and durability, in Construction Technologies and Architecture; Trans Tech Publications Ltd, 2025; pp. 61–70. [Google Scholar]
- British Standards, I. Testing Hardened Concrete — Part 3: Compressive Strength of Test Specimens, in BS EN 12390-3:2019; BSI Standards Limited: London, United Kingdom, 2019. [Google Scholar]
- Committee, C. Test method for splitting tensile strength of cylindrical concrete specimens; ASTM International: West Conshohocken, PA, 2017. [Google Scholar]
- American Concrete, I. ACI CODE-318-25: Building Code Requirements for Structural Concrete and Commentary; American Concrete Institute: Farmington Hills, MI, 2025. [Google Scholar]
- Committee, A. Specification for low-relaxation, seven-wire steel strand for prestressed concrete; ASTM International: West Conshohocken, PA, 2008. [Google Scholar]
- Sharaky, I.A.; et al. Flexural response of reinforced concrete (RC) beams strengthened with near surface mounted (NSM) fibre reinforced polymer (FRP) bars. Compos. Struct. 2014, 109, 8–22. [Google Scholar] [CrossRef]
- Yang, Y.B.; et al. Inelastic postbuckling response of steel trusses under thermal loadings. J. Constr. Steel Res. 2008, 64(12), 1394–1407. [Google Scholar] [CrossRef]
- Committee, A.C.I. ACI 374.1-05; Acceptance Criteria for Moment Frames Based on Structural Testing and Commentary. American Concrete Institute: Farmington Hills, Mich, 2005.
- Bischoff, P.H.; Scanlon, A. Effective moment of inertia for calculating deflections of concrete members containing steel reinforcement. ACI Struct. J. 2007, 104(1), 68–76. [Google Scholar] [CrossRef] [PubMed]
- Committee, A.C.I. Guide for Testing Reinforced Concrete Structural Elements under Slowly Applied Simulated Seismic Loads; American Concrete Institute (ACI): Farmington Hills, MI, 2013. [Google Scholar]
- American Society of Civil. Seismic evaluation and retrofit of existing buildings. In Standards; American Society of Civil Engineers, 2017. [Google Scholar]
- Nowak, P.S.; Schultz, J.A. Simplified design criteria for Bernoulli–Euler beams: Deflection versus flexural strength. Pract. Period. Struct. Des. Constr. 2024, 29(2). [Google Scholar] [CrossRef]
- Kadhim, S.; Özakça, M. Flexural performance of RC beams externally strengthened with a single-layer of basalt fiber reinforced polymer sheets. Composites and Advanced Materials, 2022; p. 31. [Google Scholar]
- Avudaiappan, S.; et al. Experimental investigation on composite deck slab made of cold-formed profiled steel sheeting. Metals 2021, 11(2), 229. [Google Scholar] [CrossRef]
- Alavi Nia, A.; Attar, A. Akhavan. The effect of different layouts in internal and external stiffeners on the energy absorption of thin-walled structures with square sections. Arch. Civ. Mech. Eng. 2017, 17(4), 997–1010. [Google Scholar] [CrossRef]
- Rosa, M.A.; Stanton, J.F.; Eberhard, M.O. Improving Predictions for Camber in Precast Prestressed Concrete Bridge Girders; Washington State Department of Transportation, 2007. [Google Scholar]
- Cakmak, F.; et al. Evaluation of Camber and Deflections for Bridge Girders; Michigan Department of Transportation, 2021. [Google Scholar]
Figure 1.
Experimental program overview, including constituent materials, concrete production, mechanical characterization of concrete, and fabrication of prestressed bridge girder specimens with different camber configurations.
Figure 1.
Experimental program overview, including constituent materials, concrete production, mechanical characterization of concrete, and fabrication of prestressed bridge girder specimens with different camber configurations.
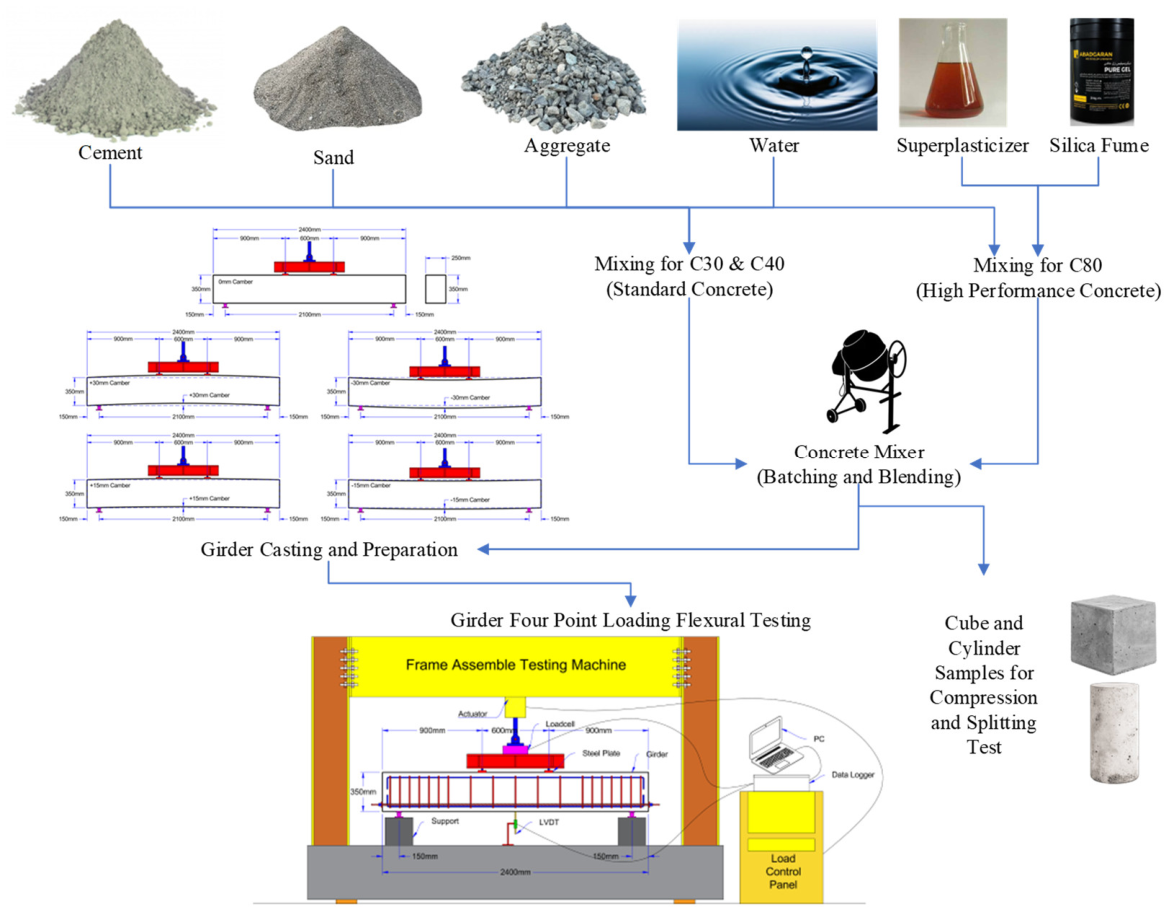
Figure 3.
Typical reinforcement and prestressing details of the tested bridge girders.
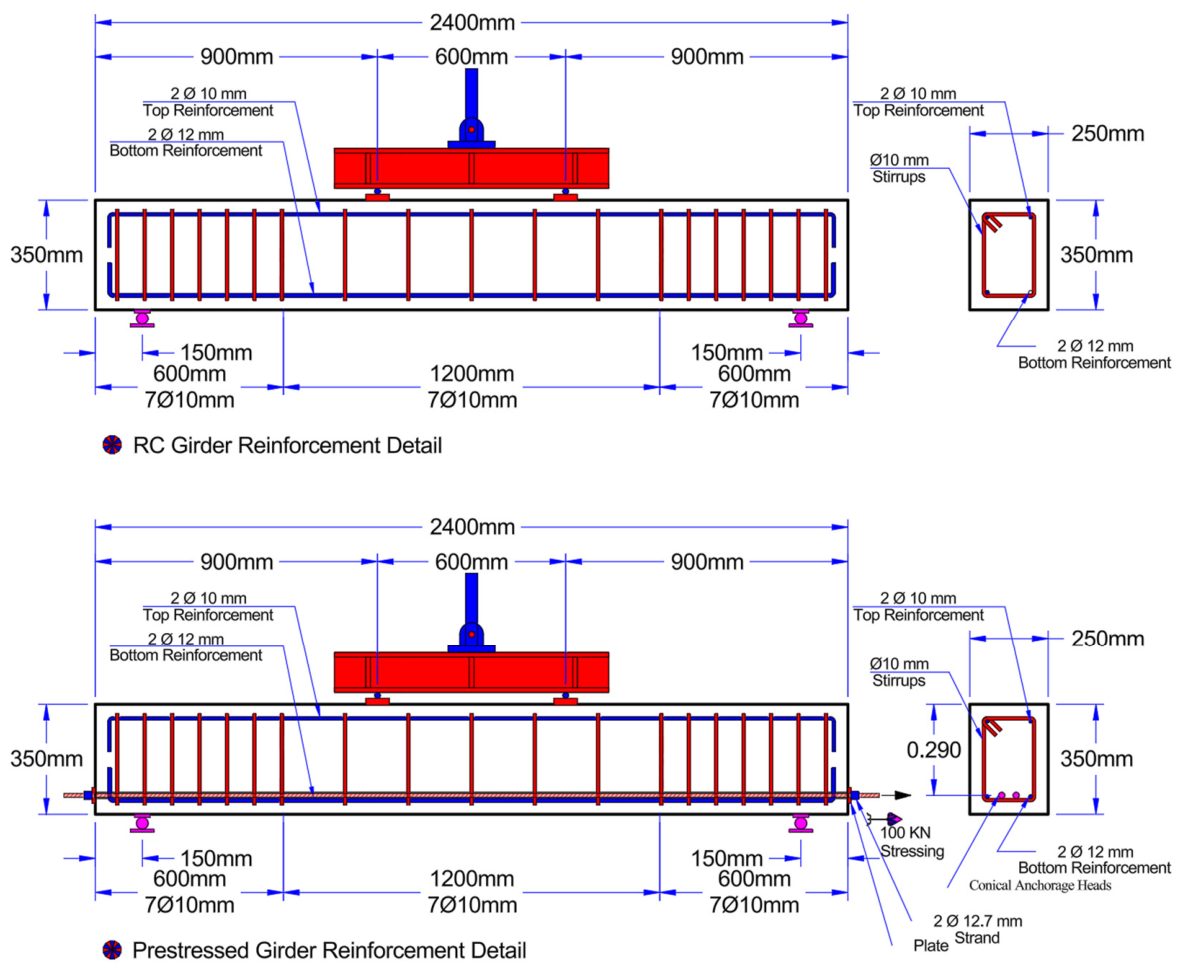
Figure 4.
Fabrication process of test specimens: (a) reinforcement cage fabrication, (b) mould preparation and camber adjustment, (c) anchorage installation, and (d) demoulded specimens.
Figure 4.
Fabrication process of test specimens: (a) reinforcement cage fabrication, (b) mould preparation and camber adjustment, (c) anchorage installation, and (d) demoulded specimens.
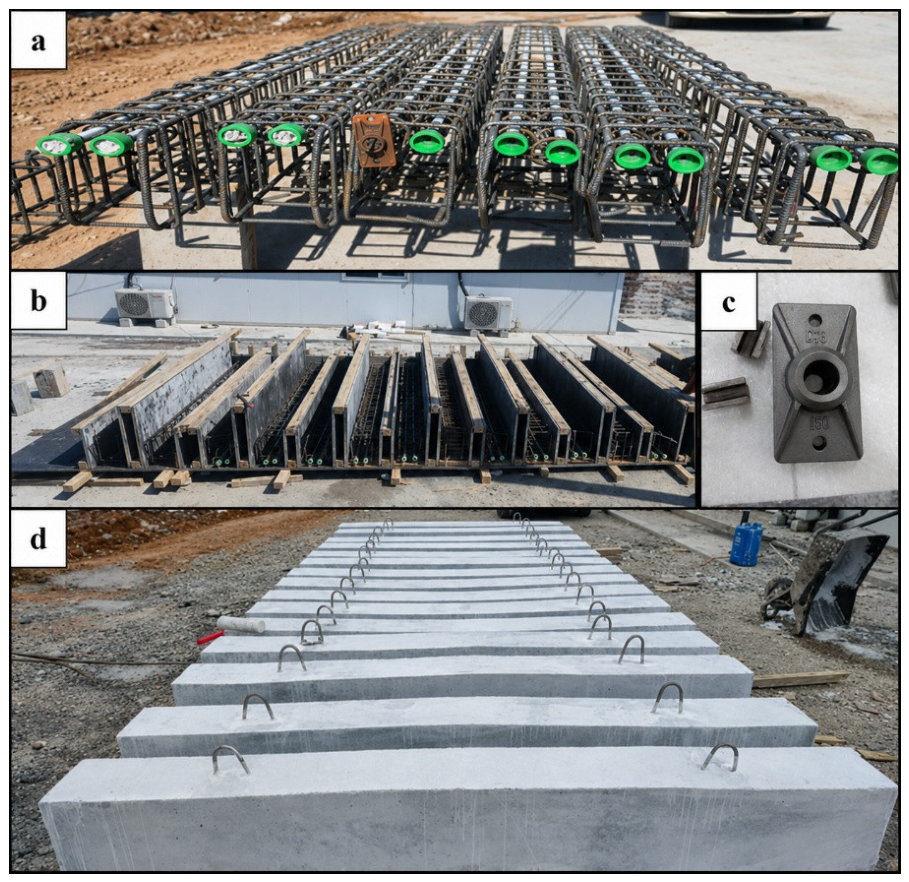
Figure 5.
Prestressing operations: (a) tendon preparation before stressing, and (b–c) application of prestressing force using a hydraulic jack system.
Figure 5.
Prestressing operations: (a) tendon preparation before stressing, and (b–c) application of prestressing force using a hydraulic jack system.
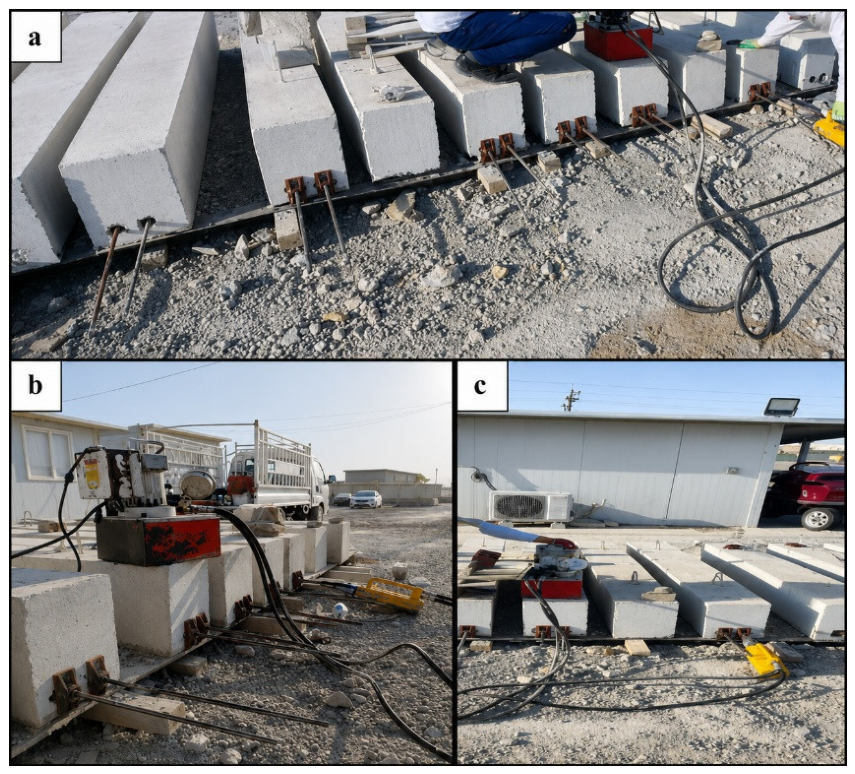
Figure 6.
Experimental setup for four-point bending tests showing support conditions, loading arrangement, instrumentation system, and data acquisition components.
Figure 6.
Experimental setup for four-point bending tests showing support conditions, loading arrangement, instrumentation system, and data acquisition components.
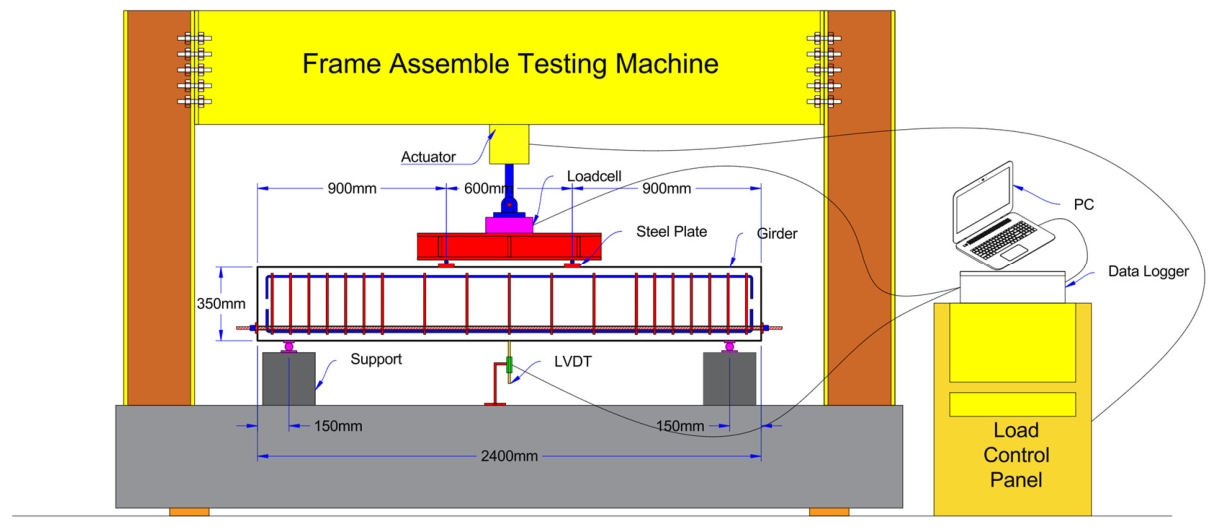
Figure 7.
Typical flexural failure and concrete crushing observed in tested bridge girder specimens.
Figure 7.
Typical flexural failure and concrete crushing observed in tested bridge girder specimens.
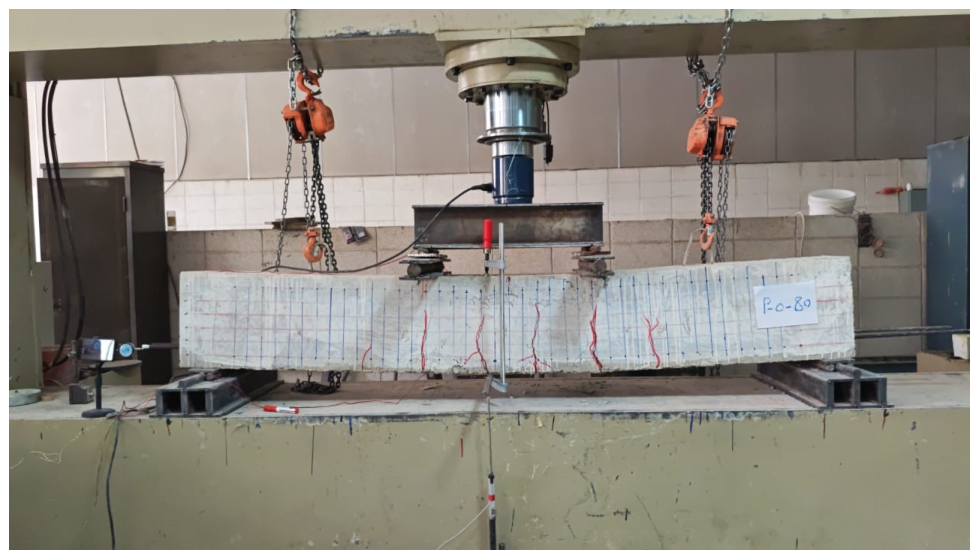
Figure 8.
Experimental load–displacement curves of tested girders: (a) prestressed girders with 30 MPa concrete, (b) prestressed girders with 80 MPa concrete, (c) prestressed girders with 40 MPa concrete, and (d) conventionally reinforced girders.
Figure 8.
Experimental load–displacement curves of tested girders: (a) prestressed girders with 30 MPa concrete, (b) prestressed girders with 80 MPa concrete, (c) prestressed girders with 40 MPa concrete, and (d) conventionally reinforced girders.
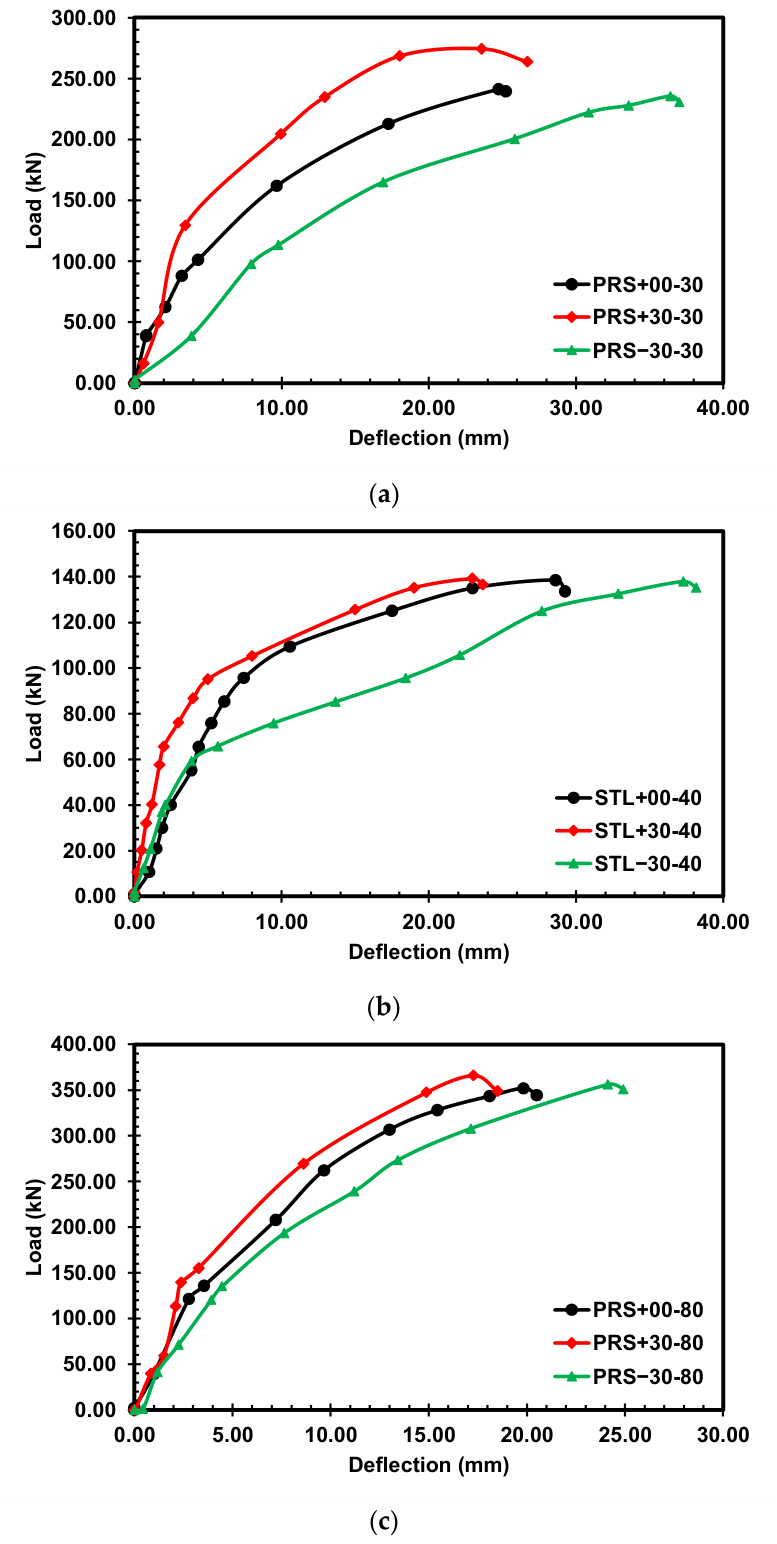
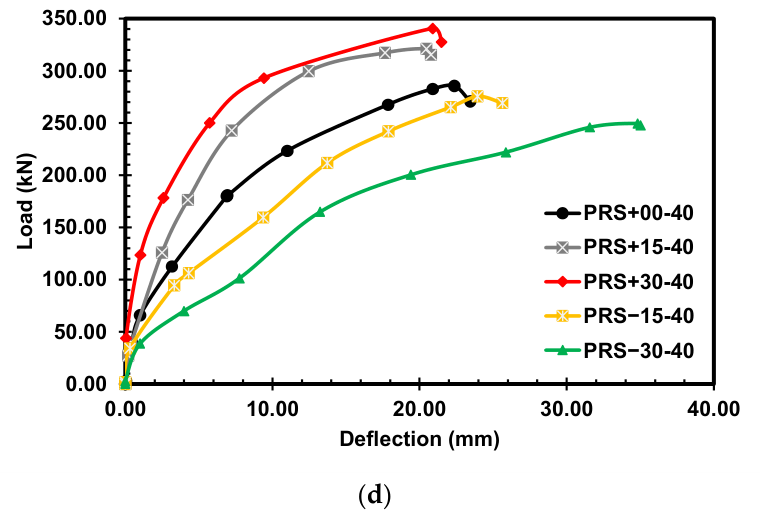
Figure 9.
Crack patterns observed at ultimate load for all tested specimens.
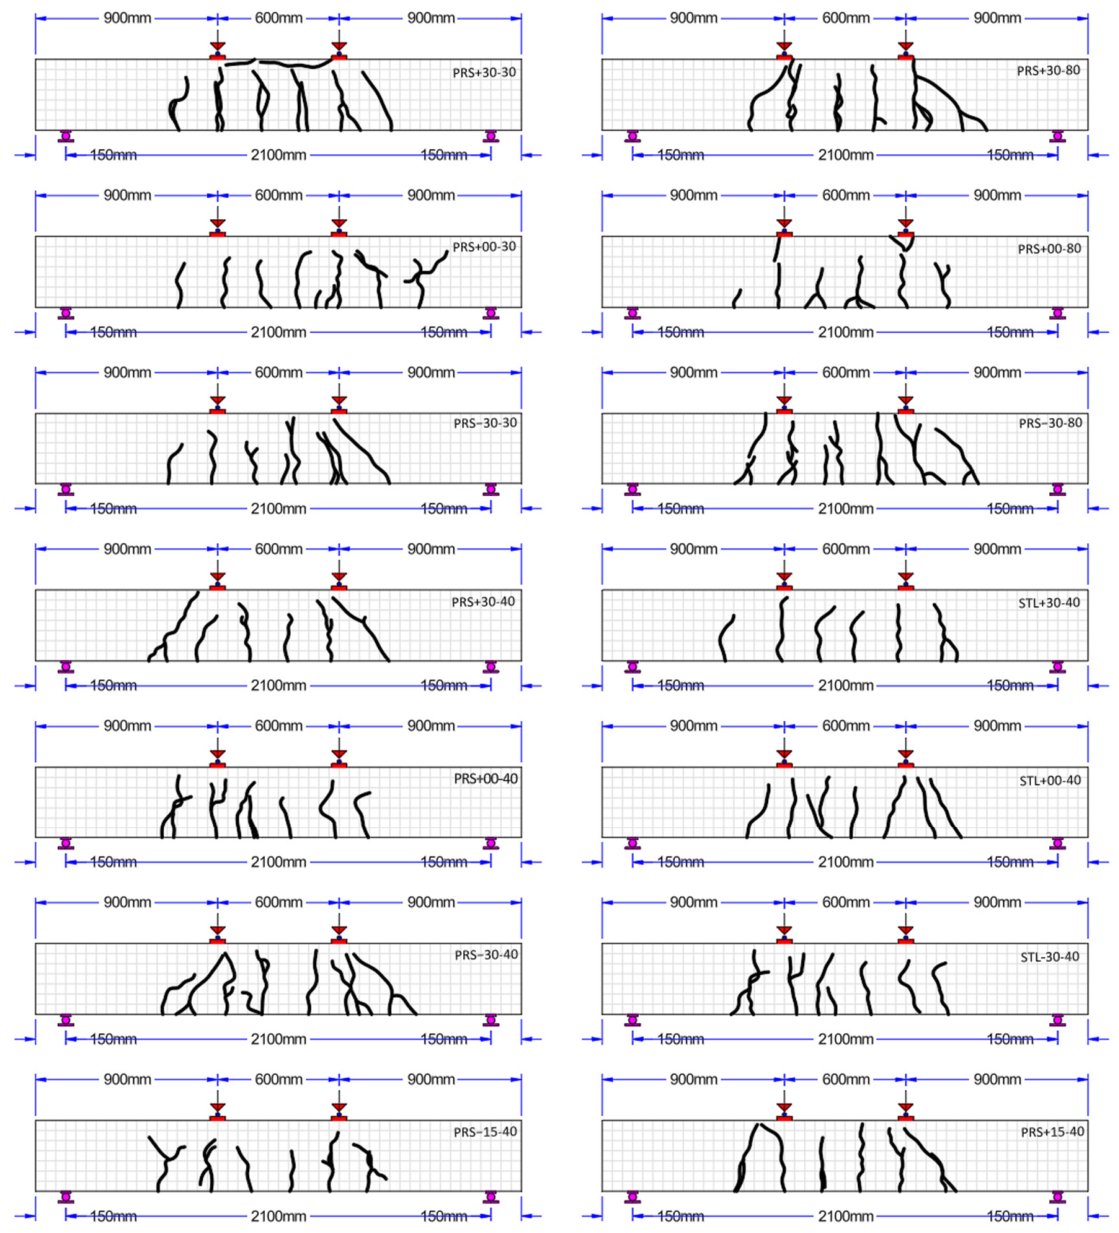
Figure 10.
Percentage performance improvement of pre-cambered specimens relative to the straight (0 mm camber) baseline for (a) cracking load, (b) ultimate load, and (c) ultimate deflection.
Figure 10.
Percentage performance improvement of pre-cambered specimens relative to the straight (0 mm camber) baseline for (a) cracking load, (b) ultimate load, and (c) ultimate deflection.
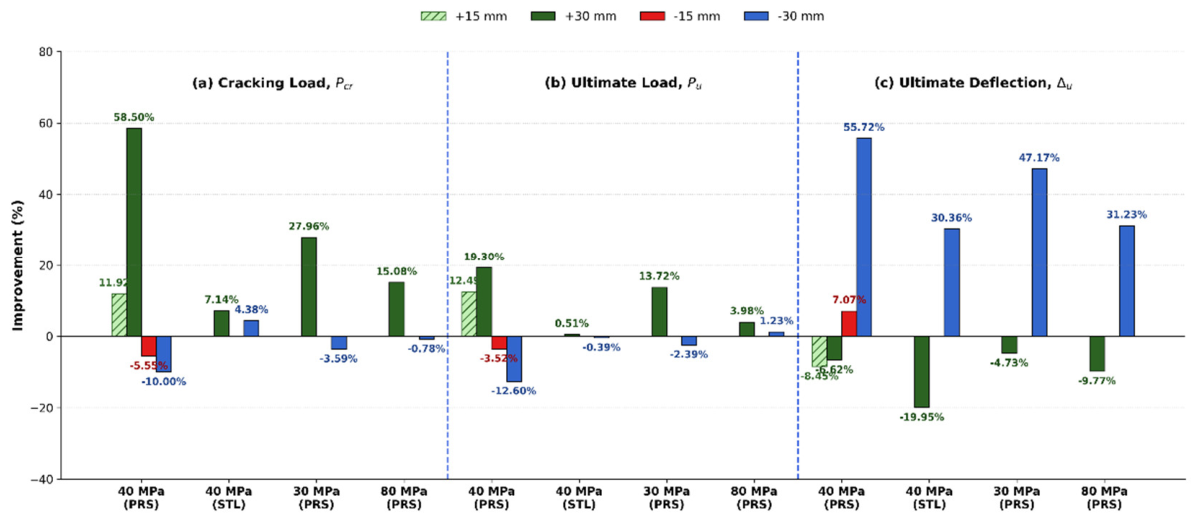
Figure 11.
Representative load–displacement responses of the tested girder series: (a) 40 MPa concrete specimens, (b) 30 MPa prestressed specimens, and (c) 80 MPa prestressed specimens.
Figure 11.
Representative load–displacement responses of the tested girder series: (a) 40 MPa concrete specimens, (b) 30 MPa prestressed specimens, and (c) 80 MPa prestressed specimens.
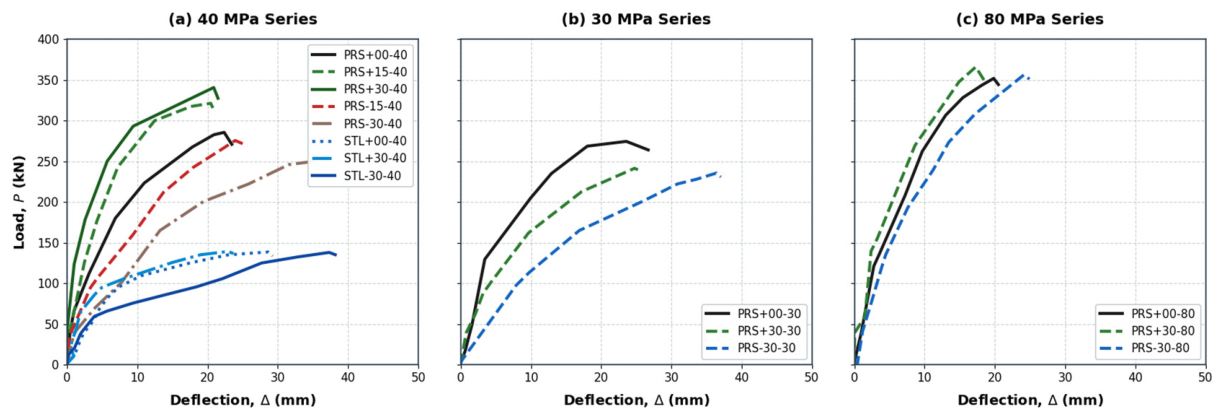
Figure 12.
Structural efficiency () of all specimens.
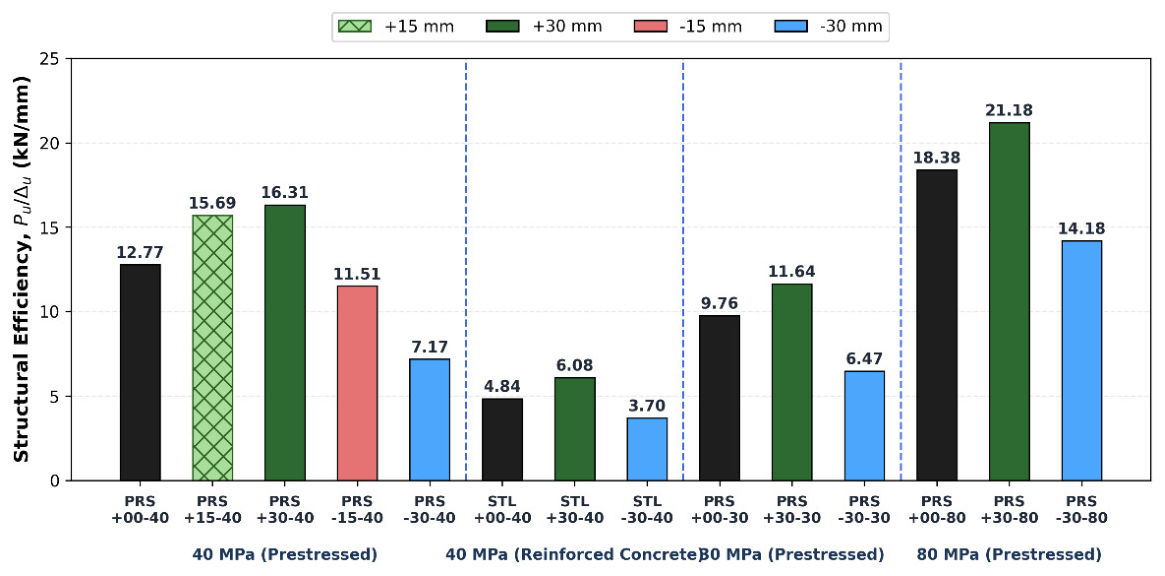
Figure 13.
Displacement ductility index () of all specimens.
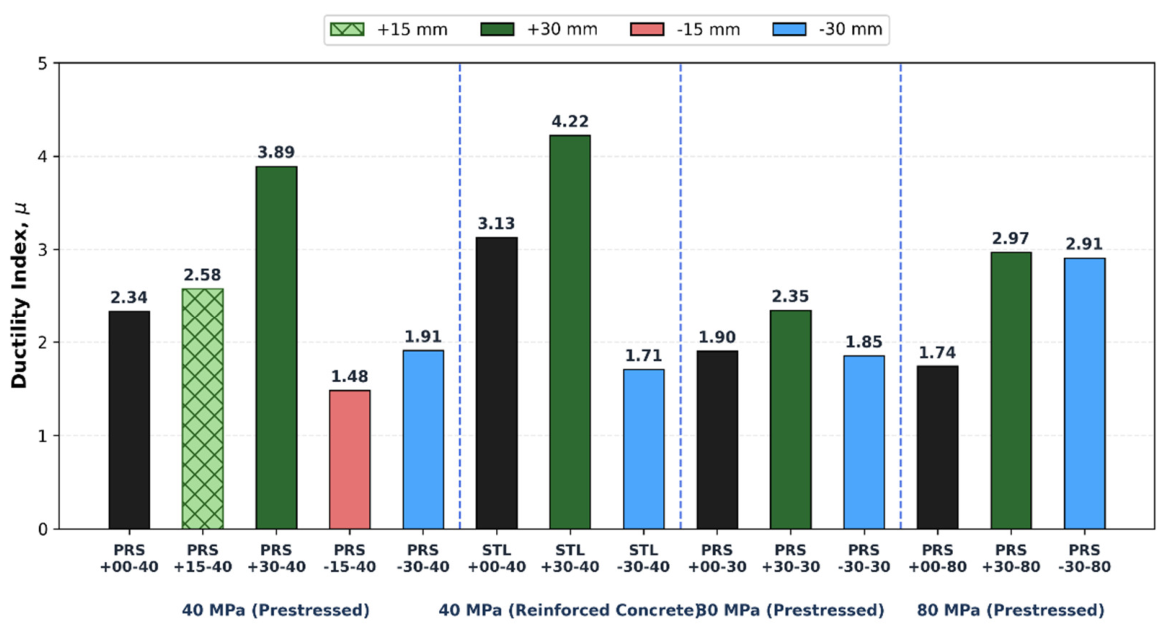
Figure 15.
Normalized ultimate load indices for different concrete strengths.
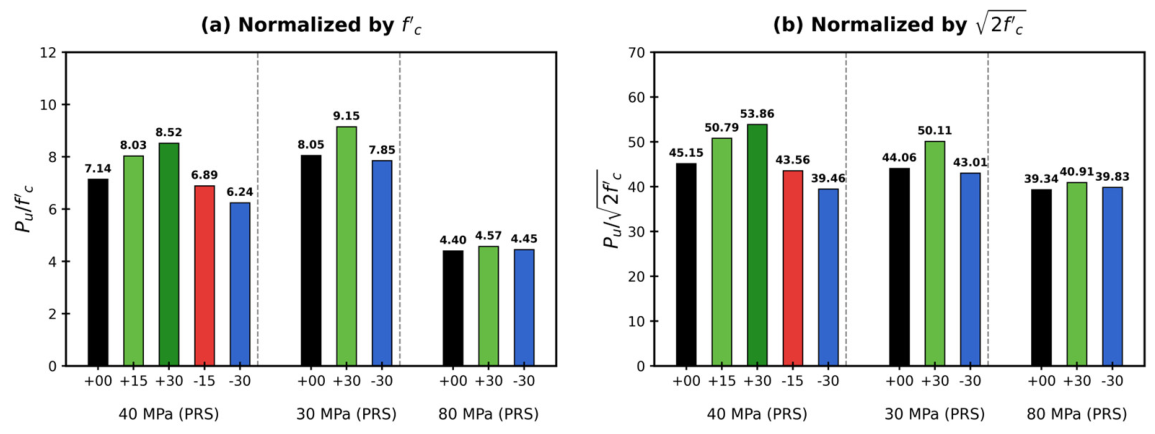
Table 2.
Mechanical properties of concrete at 28 days.
| Concrete Grade | Target Strength (MPa) | Average Compressive Strength, f'c (MPa) | Splitting Tensile Strength, fct (MPa) |
|---|---|---|---|
| C30 | 30 | 33.0 | 2.0 |
| C40 | 40 | 43.8 | 2.6 |
| C80 | 80 | 80.8 | 3.6 |
Table 3.
Geometrical properties of test specimens.
| Parameter | Value |
|---|---|
| Overall Length | 2400 mm |
| Width | 250 mm |
| Depth | 350 mm |
| Effective Span | 2100 mm |
| Prestressing Force | 100 kN |
| Tendon Eccentricity | 125 mm |
| Prestressing Steel Area | 198 mm² (2 × 99 mm² strands) |
Table 4.
Mechanical properties of reinforcement steel.
| Material | Diameter (mm) | Area (mm²) | Yield Strength (MPa) | Ultimate Strength (MPa) | Elastic Modulus (MPa) |
|---|---|---|---|---|---|
| Prestressing Strand | 12.7 | 98.7 | — | 1884 | 196,370 |
| Deformed Bar | 11.8 | 109.4 | 496 | 614 | 200,000 |
| Deformed Bar | 10 | 78.5 | 454 | 631.8 | 200,000 |
| Steel Wire | 4.37 | 15 | 1700 | 1706 | 200,000 |
Table 5.
Experimental Program and Specimen Classification.
| Group | Specimen ID | Initial Camber (mm) | Reinforcement Type | Concrete Strength (MPa) |
|---|---|---|---|---|
| Group 1: Prestressed–Camber Series | PRS+00-40 | 0 | Prestressed | 40 |
| PRS+15-40 | +15 (L/140) | Prestressed | 40 | |
| PRS+30-40 | +30 (L/70) | Prestressed | 40 | |
| PRS−15-40 | −15 (L/140) | Prestressed | 40 | |
| PRS−30-40 | −30 (L/70) | Prestressed | 40 | |
| Group 2: Steel–Camber Series | STL+00-40 | 0 | Steel Reinforced | 40 |
| STL+30-40 | +30 (L/70) | Steel Reinforced | 40 | |
| STL−30-40 | −30 (L/70) | Steel Reinforced | 40 | |
| Group 3: Prestressed–Strength Series | PRS+00-30 | 0 | Prestressed | 30 |
| PRS+30-30 | +30 (L/70) | Prestressed | 30 | |
| PRS−30-30 | −30 (L/70) | Prestressed | 30 | |
| PRS+00-80 | 0 | Prestressed | 80 | |
| PRS+30-80 | +30 (L/70) | Prestressed | 80 | |
| PRS−30-80 | −30 (L/70) | Prestressed | 80 |
Table 6.
Load, Deflection, Performance.
| Specimen | First Crack Load, Pcr (kN) | First Crack Deflection, Δcr (mm) | Ultimate Load, Pu (kN) | Ultimate Deflection, Δu (mm) |
|---|---|---|---|---|
| PRS+00-40 | 112.52 | 3.17 | 285.55 | 22.36 |
| PRS+15-40 | 125.93 | 2.49 | 321.22 | 20.47 |
| PRS+30-40 | 178.34 | 2.58 | 340.66 | 20.88 |
| PRS−15-40 | 106.27 | 4.31 | 275.49 | 23.94 |
| PRS−30-40 | 101.27 | 7.76 | 249.57 | 34.82 |
| STL+00-40 | 55.29 | 2.58 | 138.52 | 28.62 |
| STL+30-40 | 59.24 | 1.71 | 139.22 | 22.91 |
| STL−30-40 | 57.71 | 3.88 | 137.98 | 37.31 |
| PRS+00-30 | 101.27 | 4.31 | 241.35 | 24.74 |
| PRS+30-30 | 129.59 | 3.44 | 274.46 | 23.57 |
| PRS−30-30 | 97.63 | 7.91 | 235.57 | 36.41 |
| PRS+00-80 | 121.25 | 2.78 | 351.9 | 19.15 |
| PRS+30-80 | 139.54 | 2.39 | 365.91 | 17.28 |
| PRS−30-80 | 120.31 | 3.92 | 356.23 | 25.13 |
Table 7.
Load, Deflection, and Percentage Performance Improvement.
| Specimen | (kN) | Imp. (%) | (kN) | Imp. (%) | (mm) | Imp. (%) |
|---|---|---|---|---|---|---|
| PRS+00-40 | 112.52 | - | 285.55 | - | 22.36 | - |
| PRS+15-40 | 125.93 | 11.92% | 321.23 | 12.49% | 20.47 | -8.45% |
| PRS+30-40 | 178.34 | 58.50% | 340.66 | 19.30% | 20.88 | -6.62% |
| PRS−15-40 | 106.27 | -5.55% | 275.50 | -3.52% | 23.94 | 7.07% |
| PRS−30-40 | 101.27 | -10.00% | 249.57 | -12.60% | 34.82 | 55.72% |
| STL+00-40 | 55.29 | - | 138.52 | - | 28.62 | - |
| STL+30-40 | 59.24 | 7.14% | 139.22 | 0.51% | 22.91 | -19.95% |
| STL−30-40 | 57.71 | 4.38% | 137.98 | -0.39% | 37.31 | 30.36% |
| PRS+00-30 | 101.27 | - | 241.35 | - | 24.74 | - |
| PRS+30-30 | 129.59 | 27.96% | 274.47 | 13.72% | 23.57 | -4.73% |
| PRS−30-30 | 97.63 | -3.59% | 235.57 | -2.39% | 36.41 | 47.17% |
| PRS+00-80 | 121.25 | - | 351.90 | - | 19.15 | - |
| PRS+30-80 | 139.54 | 15.08% | 365.91 | 3.98% | 17.28 | -9.77% |
| PRS−30-80 | 120.31 | -0.78% | 356.23 | 1.23% | 25.13 | 31.23% |
Table 8.
Stiffness, Ductility, and Degradation Metrics.
| Specimen | Initial Stiffness Ki (kN/mm) | Residual Stiffness Ratio | Ductility Index μ | Structural Efficiency Pu/Δu (kN/mm) |
|---|---|---|---|---|
| PRS+00-40 | 35.50 | 0.25 | 2.31 | 12.77 |
| PRS+15-40 | 50.57 | 0.21 | 2.62 | 15.69 |
| PRS+30-40 | 69.12 | 0.13 | 3.66 | 16.32 |
| PRS−15-40 | 24.66 | 0.35 | 1.49 | 11.51 |
| PRS−30-40 | 13.05 | 0.42 | 1.92 | 7.17 |
| STL+00-40 | 21.43 | 0.15 | 3.13 | 4.84 |
| STL+30-40 | 34.64 | 0.11 | 3.57 | 6.08 |
| STL−30-40 | 14.87 | 0.16 | 2.52 | 3.70 |
| PRS+00-30 | 23.50 | 0.29 | 2.00 | 9.76 |
| PRS+30-30 | 37.67 | 0.19 | 1.96 | 11.64 |
| PRS−30-30 | 12.34 | 0.39 | 1.74 | 6.47 |
| PRS+00-80 | 43.62 | 0.32 | 1.70 | 18.38 |
| PRS+30-80 | 58.38 | 0.26 | 1.85 | 21.18 |
| PRS−30-80 | 30.69 | 0.36 | 1.76 | 14.18 |
Table 9.
Concrete Strength Normalization and Total Energy Absorption.
| Specimen | (kN) | Total Energy Absorption E (kN·mm) | |||
|---|---|---|---|---|---|
| PRS+00-40 | 40 | 285.55 | 7.14 | 45.15 | 4843.25 |
| PRS+15-40 | 40 | 321.23 | 8.03 | 50.79 | 5086.02 |
| PRS+30-40 | 40 | 340.66 | 8.52 | 53.86 | 5828.84 |
| PRS−15-40 | 40 | 275.50 | 6.89 | 43.56 | 4749.14 |
| PRS−30-40 | 40 | 249.57 | 6.24 | 39.46 | 5917.32 |
| STL+00-40 | 40 | 138.52 | 3.46 | 21.90 | 3098.03 |
| STL+30-40 | 40 | 139.22 | 3.48 | 22.01 | 2589.20 |
| STL−30-40 | 40 | 137.98 | 3.45 | 21.82 | 3681.63 |
| PRS+00-30 | 30 | 241.35 | 8.05 | 44.06 | 4215.54 |
| PRS+30-30 | 30 | 274.47 | 9.15 | 50.11 | 5572.37 |
| PRS−30-30 | 30 | 235.57 | 7.85 | 43.01 | 5644.78 |
| PRS+00-80 | 80 | 351.90 | 4.40 | 39.34 | 4918.45 |
| PRS+30-80 | 80 | 365.91 | 4.57 | 40.91 | 4625.84 |
| PRS−30-80 | 80 | 356.23 | 4.45 | 39.83 | 5846.37 |
Disclaimer/Publisher’s Note: The statements, opinions and data contained in all publications are solely those of the individual author(s) and contributor(s) and not of MDPI and/or the editor(s). MDPI and/or the editor(s) disclaim responsibility for any injury to people or property resulting from any ideas, methods, instructions or products referred to in the content. |
© 2026 by the authors. Licensee MDPI, Basel, Switzerland. This article is an open access article distributed under the terms and conditions of the Creative Commons Attribution (CC BY) license (http://creativecommons.org/licenses/by/4.0/).
Copyright: This open access article is published under a Creative Commons CC BY 4.0 license, which permit the free download, distribution, and reuse, provided that the author and preprint are cited in any reuse.


