
Submitted:
29 July 2026
Posted:
30 July 2026
You are already at the latest version
Abstract
Synergistic multi-treatment modification of gluten offers a viable approach to reconcile allergenicity, sensory quality and functionality of gluten-based food products. This study fabricated low-allergen gluten substitutes through sequential enzymatic hydrolysis, ultrasonication, starch compounding (wheat/rice starch) and microwave treatment. Modified gluten hydrolysates displayed improved antioxidant activity, high contents of free umami/sweet amino acids, abundant low-molecular-weight peptides (< 1 kDa) and unique amino acid signatures. Combined treatments promoted Maillard browning, yielding pale-yellow composites with lower total color difference (ΔE) and stronger wheat and Maillard aroma notes. Relative to untreated samples, modified composites exhibited superior antioxidant capacity, higher bioaccessible essential amino acids upon digestion, and residual gluten allergens < 10 ppm, complying with rigorous criteria stricter than the Codex gluten-free limit (< 20 ppm). Molecular docking demonstrated specific binding between starch fragments and gliadin harbouring the R5-targeted LQPFP epitope, alongside multi-site interactions between starch and glutenin. Ultrasonic cavitation may remodel gluten conformation and reshape its susceptibility to enzymatic cleavage. Increased epitope coverage (e.g. QQPYP) via starch–protein binding and elevated intermolecular affinity favour allergen shielding, while Maillard reactions may further aid immunoreactivity reduction. These optimised gluten–starch blends supply experimental support for developing high-performance gluten-derived products and low-allergen food matrices.
Keywords:
wheat gluten
; synergistic treatment
; the Maillard reaction
; gluten allergy
; sensory profile
; protein-starch interaction pattern
1. Introduction
Wheat flour is a staple ingredient in wheat flour-based formulated foods such as bread, cakes, crackers, biscuits, puffed foods, fried dough products [1,2]. It consists of 70–85% starch (including damaged starch) and 10–15% protein, of which 73–82% is gluten [3,4]. The structure and function of wheat flour-based products are significantly improved through multi-step processing (e.g., mechanical mixing like malaxation, optional fermentation, molding, and baking) [5,6,7]. These popular products are attributed to properties, interactions, and Maillard reaction (MR) degree of gluten and starch [8], which dictates structural characteristics and the development of desirable odor, color, and flavor [3,4,9,10,11,12]. However, gluten composition in wheat flour-based products could induce several health risks like allergy [12,13]. The pathogenic factors of gluten would limit the use of wheat flour-based products. Nevertheless, developing high-quality gluten-containing foods requires not only optimizing both formulations and processing parameters but also maintaining a balance between sensory, quality, nutrition, and safety of foods by understanding ingredient interactions during processing.
Food processing can be classified as thermal processing and non-thermal processing. Previous research has confirmed that thermal processing method including time- and energy-efficient microwave heating, can trigger the MR to simultaneously enhance the sensory attributes, nutritional value, and functional properties of food systems [9,14,15,16,17]. Non-thermal technologies including enzymatic hydrolysis (EH) for covalent bond cleavage [18], ultrasonic treatment for structural remodeling [19], are increasingly processing methods to optimize the food physicochemical processing properties especially reducing linear allergic epitopes of food matrices. However, non-thermal pretreatment cannot drive starch gelatinization or MR, which compromises texture and results in undercooked food matrices. While thermal processing only weakly modulates gluten covalent cross-linking, it cannot achieve sufficient hypoallergenicity without impairing sensory and structural characteristics. For example, baking can increase the allergenicity or glycemic index (GI) of wheat flour [17,20,21], while microwave heating alone only moderately alters IgE reactivity and allergen-induced symptoms [21].
In contrast, multi-combined food processing techniques (integrating thermal and/or non-thermal processing methods) have attracted increasing attention due to their pronounced synergistic effects on the modification and optimization of food matrices. Previous studies have shown that food processing (e.g., hydrolysis or combined treatments) can alter gluten structure, enhancing antioxidant activity and digestibility while reducing allergenicity [22,23,24,25,26]. Similarly, incorporation of exogenous components (e.g., dietary fiber, proteins/protein hydrolysates) before starch processing (e.g., hydrothermal treatment) modulates starch intermolecular interactions and its crystalline structure, thereby enhancing the functional properties of starch (e.g., mitigate starch digestibility) [27,28,29]. Studies have also shown that combinations of heat with irradiation [30], enzymolysis with microwave/heat [31], or ultrasound with autoclaving/enzymolysis [32] can modify the immunoreactivity, digestibility, and other functional properties of food matrices. Collectively, these studies demonstrate that modification of wheat gluten, rational formulation of modified gluten-starch composites, and integration of multi-combined thermal and non-thermal processing technologies can achieve a synergistic improvement of the sensory, quality, nutritional and safety properties of cereal-based food matrices.
This study aims to integrate synergistic effects of non-thermal and thermal processing for optimizing the overall performance of gluten-containing composites. Specifically, wheat gluten was modified via ultrasonic pretreatment coupled with EH, then blended with wheat starch (WS) or rice starch (RS) at a fixed ratio, respectively. Microwave heating was applied to the prepared low-moisture composites to induce MR. By comparing different combined processing strategies, the synergistic effects were evaluated whether combined processing can simultaneously enhance the food safety (reduced gluten allergenicity) while maintaining the sensory quality, and nutritional value of the products. The intermolecular interactions between modified gluten with starch have been studied from the perspective of multi-scale effects of multi-combined processing. This work provides an innovative strategy for producing both a friendly gluten-containing food matrix with low anti-nutritional factors and a better comprehensive food complex with higher senses and nutrition.
2. Materials and Methods
2.1. Materials
Wheat gluten was purchased from Heowns Biochemical Technology Co., Ltd. (Tianjin, China). WS was purchased from Shanghai Yuanye Biotechnology Co., Ltd. (Shanghai, China). RS was purchased from Sigma Chemical Co. (St. Louis, USA). The total antioxidant capacity (T-AOC) assay kit (ABTS·+ method) was obtained from Beyotime Biotechnology Co., Ltd. (Shanghai, China). The free amino acid content assay kit, artificial gastric juice (SGF), and artificial intestinal juice (SIF) were all obtained from Beijing Solarbio Technology Co., Ltd. (Beijing, China). Protamex compound protease was purchased from Novozymes Inc. (Copenhagen, Denmark). RIDASCREEN® Gliadin competitive ELISA kit was purchased from R-Biopharm AG (Darmstadt, Germany), equipped with R5 monoclonal antibody targeting immunogenic proline/glutamine-rich gluten epitopes (e.g. QQPFP, QQQFP, LQPFP and QLPFP presented in α/β-, ω- and γ-gliadins) [33]. All other reagents were of analytical grade or higher.
2.2. Preparation of Gluten Hydrolysates
Wheat gluten was dissolved in 0.2 M phosphate-buffered saline (PBS, pH 6.0) to a final concentration of 5% (m/V) and split into three groups. (1) Gluten solution was stirred at 25 °C, 1200rpm, pH 6.0 for 6 h prior to protease addition with a compound protease-to-original gluten ratio of 0.81:100 (m:m). (2) Gluten solution was hydrolyzed in a water bath at 40 °C, 1200rpm, pH 6.0 for 6 h with same compound protease-to-original gluten ratio of GO. (3) Gluten solution was first subjected to ultrasonic treatment for 30 min under 360 W, 40 kHz followed by EH using the same strategy as (2) preparation. After aforementioned treatment, the enzyme in all groups was immediately inactivated by heating at 95 °C for 1 h with constant stirring. The mixtures were then centrifuged at 9500 rpm for 20 min at 25 °C, and the supernatants of (1) & (2) & (3) were denoted as original gluten (GO), enzymatically hydrolyzed gluten(GE), and coupled-treated gluten (GC) group, respectively. All groups were stored at 4 °C or lyophilized for later analysis.
2.3. Gluten Hydrolysates Analysis
2.3.1. Molecular Distribution
Amino acid profile of 1 mg/mL GO, GE, and GC in 200 mM PB (pH 6.8) was analyzed by size-exclusion high-performance liquid chromatography (SE-HPLC; Waters 600, Milford, MA, USA). The instrument was equipped with a TSK-Gel G2000SWXL or G4000SWXL column (7.8 mm i.d. × 300 mm, Tokyo, Japan), and detection was performed at 214 nm with a 20 μL injection. Elution was conducted at 1 mL/min using 200 mM PB (pH 6.8) as the mobile phase. Transferrin (80,000 Da), cytochrome C (12,384 Da), the synthetic peptide PVLGPVRGPH (1,361 Da), glutathione (307 Da), and glutamate (147 Da) were used as standards for peak time-Mw (x-y) plotting. Each sample was fractionated into different Mw ranges (> 10 kDa, 5–10 kDa, 3–5 kDa, 1–3 kDa, and < 1 kDa) based on the time ranges from the standard curve. The percentage content of each Mw fragment was calculated as follows:
where Ci represents relative content of the target compound (%), Ai represents integrated peak area of the target peak range, and ∑Atotal represents sum of all integrated peak areas of the sample. The average molecular weight is further determined by the following equations:
where Mn represents average molecular weight, Mw represents weight-average molecular weight, Hi is peak height of different fractions in protein/hydrolysate sample, and Mi is molecular weight of different fractions in protein/hydrolysate sample.
Ci (%) = (Ai/∑Atotal) × 100
Mn = (ΣiHi)/(Σi(Hi/Mi))
Mw = (Σi(Hi/Mi))/(ΣiHi)
2.3.2. Quantitative Analysis of Amino Acids (AAs)
GO/GE/GC were pretreated via acid hydrolysis at 110 °C for 21 h. After digestion, the digestive mixture was further processed and carried out for derivatization. During derivatization, isotope-labeled internal standards were mixed for absolute quantification. Processed samples were analyzed via an HPLC-MS/MS system (Ultimate 3000-API 3200 Q TRAP, Thermo Fisher Scientific-AB SCIEX, USA) fitted with an MSLab HP-C18 column (150 × 4.6 mm, 5 μm). Mobile phase A is water containing 0.1% formic acid and phase B was acetonitrile containing 0.1% formic acid. A 3 μL sample was injected and run under 0.8 mL/min flow rate at 50 °C column temperature. Gradient separation conditions are as following: 2% B at 0 min, 28% B at 10 min, 100% B at 10.1 min (maintained to 16 min), and 2% B at 16.1 min (maintained to 25 min). Eluents were scanned in MRM mode via an ESI source (positive ion mode) for AAs detection and quantification.
2.3.3. Zeta Potential
Zeta potential of the samples was determined using a Nanoparticle Zetasizer (Nano-ZS90, Malvern Instruments, UK).
2.4. Preparation of MR Composite Products (MRCPs)
Following optimization of reaction conditions (humidity, microwave time, microwave power, and protein-starch ratio), GO/GE/GC were thoroughly mixed with WS or RS at a 1:1 ratio. Atomized distilled water was then sprayed uniformly onto the mixed samples and mixed thoroughly to adjust the batter moisture content to ~15% (detected by laboratory moisture analyzer). The wet batter was maintained at 79% relative humidity (RH, monitored by hygrometer). The moist blended composites were preheated in a microwave oven at 600 W for 5 min. After preheating, they were further heated by microwave for 5 min at 30 s intervals for 3 repeated run in total to produce MRCPs (denoted as HGOWS, HGEWS, HGCWS, HGORS, HGERS, HGCRS). Microwave-prepared MRCPs or their water-soluble extracts (obtained with deionized water) were lyophilized for subsequent analyses.
2.5. Browning Degree & Antioxidant Ability of Scavenging ABTS·+
MR intermediate products (MRIPs) and MR end products (MREPs) reflect the different stages extent of the MR. The protein/hydrolysate-starch mixtures were dissolved in 10 mM PBS (pH 7.0) to a concentration of 3 mg/mL. Absorbance was measured at 294 nm (for MRIPs) and 420 nm (for MREPs), respectively. ABTS·+ scavenging activity was determined for all samples (GO, GE, GC, HGOWS, HGEWS, HGCWS, HGORS, HGERS, HGCRS) following the T-AOC Assay Kit instructions using a microplate reader (Infinite 200 PRO, Tecan, Switzerland). The prepared ABTS·+ working solution was diluted 49-fold to an absorbance of 0.7 ± 0.05 at 734 nm and allowed to stand for 12–16 h. Samples were dissolved in deionized water to 5 mg/mL. A 10 μL aliquot of each sample solution was mixed with 200 μL of the ABTS·+ working solution, and absorbance was measured at 734 nm. Scavenging activity was calculated using a standard curve generated with Trolox at concentrations of 0.15, 0.3, 0.6, 0.9, 1.2, and 1.5 mM. All measurements were performed in triplicate. TEAC was calculated as follows:
where ∆Asample represents the blank-corrected absorbance of samples, a and b are the slope and intercept of the Trolox calibration curve, respectively. DF is the sample dilution factor, and Cprot indicates the protein concentration of samples (mg/mL).
TEAC (mM TE/(mg/mL protein)) = [(∆Asample − b)/a × DF]/Cprot
2.6. In Vitro Sequential Digestion
Original composites and MRCPs (30 mg each) were digested in 15 mL SGF (37 °C, 150 rpm, 2 h). Digestive samples (1 mL) were sampled at the end of simulated gastric digestion. 15 mL SIF was added to the previous solution, and the pH was adjusted to 6.8 for simulated intestinal digestion (37 °C, 150 rpm, 4 h). Digestive samples (1 mL) were sampled at 6 h. Enzymes were inactivated (80 °C, 20 min) and the samples were centrifuged (12,000 rpm, 5 min) for free amino acid (FAA) analysis. Centrifuged samples were mixed as kit instructions and incubated in a boiling water bath for 15 min. Solutions were inverted repeatedly after cooling. After centrifugation (8,000 rpm, 5 min), absorbance of blue-purple compound formed in collected supernatant was measured at 570 nm using a microplate reader (Infinite 200 PRO, Tecan, Switzerland). All measurements were completed within 30 min of color development. The detection mechanism and calculation (5) were shown as follows:
where Cstd represents standard FAA concentration (10 μmol/mL), FAA content (μmol/mg protein) is the digestive releasing FAA measured from the supernatant, Vstd or Vsam are volume of standard solution or volume of sample supernatant added to reaction system which equal to 0.05 mL, Cprot represents supernatant protein concentration (mg/mL), and Asam, Astd, Ablk denote absorbance of sample, standard, and blank tubes, respectively. The constant value 10 is derived from Cstd × Vstd.
CFAA = (10 × (Asam − Ablk))/((Astd − Ablk) × Cprot)
2.7. Electronic Eye Colorimetry
MRCPs were dissolved in distilled water to a concentration of 5 mg/mL and accurately pipetted into colorimetric cuvettes to ensure a consistent height. Prior to color photography, the electronic eye instrument (Digieye, VeriVide, UK) was calibrated with white tiles and swatches. A fixed diameter was set to measure color parameters, including lightness (L: 0 = black, 100 = white), red-green value (a: +a = red, -a = green), yellow-blue value (b: +b = yellow, -b = blue), whiteness (W*), chroma (C*), and color difference (∆E*). W*, C*, and ∆E* were calculated as follow [34]:
where L₀, a₀, and b₀ represent the color parameters of control samples (without microwave heating) at t = 0.
W* = 100 - [(100 - L)2 + a2 + b2]1/2
C* = (a2 + b2)1/2
∆E* = [(L - L0)2+(a - a0)2 + (b - b0)2]1/2
2.8. Ultra-Fast GAS Chromatography (GC-FID)-Electronic Nose Determination
An ultra-fast GC electronic nose system (Heracles II, Alpha M.O.S., France) was used to detect and analyze the fingerprint profiles of flavor volatile components and differences among various composites. The system was equipped with an autosampler (Odor Scanner HS 100, Alpha M.O.S., France) with two parallel metal columns (non-polar MXT-5-FID1 column (10 m × 180 μm × 0.4 μm) and medium polarity MXT-1701-FID2 column (10 m × 180 μm × 0.4 μm)), a cooled Tenax trap, and two ultra-sensitive FID detectors. A 1 g aliquot of the 5 mg/mL MRCP solution was weighed into a crimp-top GC vial for detection. The vials were shaken at 50 °C for 30 min at 500 r/min to generate headspace sample gas. A volume of 3,000 μL was injected with a speed of 125 μL/s and 29 s duration under 200 °C inlet temperature. Initial temperature and desorption temperature of trap was 50 °C and 240 °C with 34 s trapping duration, while the FID temperature was 260 °C. All flavor compounds of all composites with relevance index (RI) > 30 were used for qualitative screening and listed as compound name (CAS number) based on retention index and retention time from two columns (Double-column retention index qualitative method). Compound descriptors were assigned based on published literature (as Supplementary Table S1), and corresponding odor descriptions for each protein-starch composite were determined accordingly. The screened compounds data were subjected to subsequent principal component analysis (PCA) and discriminant function analysis (DFA) statistical analysis using peak area/relative content with pre-installed software (Alpha Soft V12.4 workstation with built-in AroChemBase volatile flavor substance database). All measurements were performed in quintuplicate.
2.9. Determination of Gluten Content in Composites (ELISA Assay)
MRCPs (1 g) were added to 10 mL of 60% ethanol, vortexed for ~10 min, and centrifuged at 10,000 rpm for 10 min. Supernatants were diluted 50-fold with dilution buffer. A 50 μL aliquot of diluted supernatant was dispensed into separate wells of a 96-well plate, mixed with 50 μL antibody-enzyme conjugates (stock diluted 1:11), and incubated for 30 min. The plate was inverted and blotted dry on filter paper. Each well was then washed ≥ 2 times with 250 μL of washing diluent (1:10 dilution of stock solution), with blotting dry on filter paper after each wash. A 100 μL aliquot of substrate/chromogen was added to each well and incubated for 10 min in the dark. The reaction was terminated by adding 100 μL of stop solution, and absorbance was measured at 450 nm within 10 min using a microplate reader (Infinite 200 PRO, Tecan, Switzerland). Standards at 10, 30, 90, 180, 270 ng/mL were assayed under the same conditions. Limit of detection (LOD) and limit of quantification (LOQ) of ELISA kit are 2.3 mg gliadin/kg food and 5 mg gliadin/kg food. Gluten content was calculated using RIDA®SOFT Win.NET (Z999, R-Biopharm AG, Darmstadt, Germany) based on gliadin content with the standard curve.
2.10. Molecular Docking
During food processing, starch could partially hydrolyze to produce starch dextrins/oligosaccharides or oligomeric starch with reducing end groups [35,36]. These starch fragments may interact with allergenic loci of gluten to generate masking or modifying effects [37]. Representative allergenic wheat gluten proteins, α/β-gliadin A-IV (P02863) and HMW-Dx5 subunit (P10388), were selected for docking based on their well-documented dominant immunogenicity [38,39,40,41,42]. Maltodextrin structure (CID 62698) was retrieved from PubChem. The docking was performed via AutoDock 4.2.6 with a 126 × 126 × 126 grid box. Short oligomeric starch fragments of rice and wheat (linear amylose and single-branched amylopectin) were constructed with CHARMM-GUI Glycan Reader & Modeler [43]. These computationally tractable simplified models were designed to reflect typical starch chain-length profiles: rice amylose DP24, rice amylopectin (DP18 main chain + DP6 side chain, branch point at residue 9); wheat amylose DP28, wheat amylopectin (DP20 main chain + DP8 side chain, branch point at residue 10) [44,45]. Subsequently, protein-starch pairwise docking was performed between DX5, Alpha/beta-gliadin A-IV, and the four starch fragments. HADDOCK3 performed fully blind rigid-body docking to produce 10,000 conformations, Uniform Manifold Approximation and Projection (UMAP) embedding of 10,000 rigid-body conformations was based on protein-starch contact fingerprints and colored according to clusters via Ward’s linkage hierarchical clustering [46]. After scoring-based screening of the top 500 poses and clustering, the lowest-HADDOCK-score conformation was adopted for binding characteristic analysis. The whole computational pipeline was jointly coded and realized via Python scripts and R language. Structural visualization and analysis were implemented in open-source PyMOL 3.10.
2.11. Statistic Analysis
All data were expressed as means ± standard deviations. One-way analysis of variance (ANOVA) was used to analyze differences in mean values among treatments. Significant differences (P < 0.05) were identified using Tukey’s honestly significant difference (HSD) test. All statistical analyses and calculations were performed using SPSS 19.0 (SPSS Inc., Chicago, IL, USA) and OriginPro 2017C SR2b9.4.2.380 (OriginLab Corporation, Northampton, MA, USA).
3. Results and Discussion
3.1. Physicochemical and Functional Properties of Gluten and Gluten Hydrolysates
3.1.1. Molecular Distribution
Molecular weight (Mw) distribution of intact and hydrolyzed gluten reveals hydrolysis extent and indirectly links structural alterations to functionality, particularly variations in allergenic epitopes. Figure 1(A) illustrates the relative abundance of gluten (hydrolysate) Mw fractions across different treatments. Notably, fractions of 5–10 kDa, 3–5 kDa, and 1–3 kDa that < 30% of the total fractions exhibited in an order of GO > GE > GC. Gluten subunits, which consist of five fractions (high Mw: 65–90 kDa; low Mw: 30–60 kDa), crosslink via disulfide bonds (S–S) to form protein networks ranging in Mw from 105 kDa to several million Da [8]. Previous studies reported that acidic enzymolysis of gluten yielded ~70% of fragments < 15 kDa, while ultrasonic pretreatment resulted in > 90% and > 65% of fragments < 3 kDa and < 2 kDa, respectively [24,25]. These demonstrated appropriately cleavage of gluten subunits into hydrolysates through non-thermal processing rather than completely cleaving the covalent structure. However, EH remained incomplete, potentially retaining residual allergenic epitopes in fraction that > 10 kDa. The inherent resistance from gluten structure (like gliadin) stabilizing by S–S and other covalent linkages with more inaccessible sites [26] may also limited the formation of more hydrolysates. The trend of increasing small molecular peptides (SMPs) correlates positively with the higher degree of hydrolysis (DH) and reduction in S-S (increasing detection of free -SH) [47]. Compared with the GE group, the GC group contained more peptides > 10 kDa and fewer fragments < 1 kDa indicating a lower DH of GC than that of GE. It may tentatively attribute to structural rearrangement of GC triggered by S-S formation, which consistent with prior ultrasonic findings [19,25,48]. However, an appropriate DH is beneficial for maintaining the mechanical properties of gluten proteins hydrolysates to provide better ability for food applications.
3.1.2. Amino Acid Composition
The AAs composition of GO/GE/GC and the corresponding taste of each AA are detailed in Table 1. The profiles showed a high abundance of Glx (Glu+Gln) and Pro, and a lower proportion of sulfur-containing AAs (Cys and Met) as reported previously [49]. This pattern likely results from a high relative content of gliadins (especially the main allergic ω-type in gluten) [8], reflecting different patterns and degrees of protein breakdown among GO/GE/GC. Generally, during continuous hydrolysis, the levels of Glu/Pro increased initially before decreasing, whereas Cys/Met showed a opposite trend [26] However, the orders of Glx and Pro percentages were GO > GE > GC, GE > GC > GO for Cys, and GE > GO > GC for Met in this study. This indicates that the introduction of ultrasound may alter the enzymatic hydrolysis mode and further change the splicing pattern of allergenic epitopes. Less Glu and Pro of GC may suggest less allergenic possibility caused by allergic locus [25]. Essential amino acid (without Trp) ranked GC > GE > GO, revealing superior nutritional retention for GC hydrolysates. The AA categories of sample attributed to distinct taste (umami, sweet, bitter, sour, sulfurous etc.) are summarized in Table 2. Sweet, umami and sour FAAs followed GO > GC > GE, while bitter sulfur-containing FAAs ranked GE > GC > GO, mixed taste-active FAAs also displayed GO > GE > GC. These profiles indicate severe enzymatic hydrolysis (GE) accumulates bitter off-flavor FAAs, while GC yielded intermediate-MW peptides with pleasant sweet/umami FAA levels similar to GO. As reported previously [50], high-MW GO peptides fold into stable structures masking bitter hydrophobic residues, whereas low-MW GE peptides expose bitter hydrophobic terminals that activate bitter-sensing G protein-coupled receptors and weaken sweet taste. Furthermore, sweet low-calorie peptides from GO and GC support low-sugar food development. In summary, treatment-modulated peptide Mw and conformation affect gluten sensory characteristics, and GC delivers the best comprehensive performance by moderately disassembling gluten while retaining favorable taste and nutritional functions.
3.1.3. Scavenging Effect of ABTS·+ and Zeta Potential
As presented in Figure 1(B), GO exhibited the lowest antioxidant capacity, while GE showed marginally higher antioxidant capacity than that of GC. Ma et al. [55] demonstrated that EH and high acoustic energy disassembled β-lactoglobulin aggregates, yielding antioxidant peptides with more free radical-scavenging sites and smaller particle size. Hydrolysates with lower Mw fragments have stronger radical-scavenging capacity [24], whereas medium-Mw or hydrophobic gluten hydrolysates contribute to ABTS·+ scavenging via hydrophobic AAs residues [22]. These results align with higher hydrophobic AAs and lower-Mw fragments of GE/GC than counterparts of GO, which produce more functional abilities. Notably, GO had the least negative zeta potential, while GE showed more negative charge than GC. Gluten peptides exhibited negative potential at neutral pH due to carboxylic group ionization of Glu/Asp [23], and deamidation (converting Gln to Glu) enhanced this negative charge [49]. In this study, charge exposure may be caused by exposure of cleaved Glu/Asp-derived negative via EH. Nevertheless, the smaller negative charge, antioxidant activity, and low-Mw fraction in GC (vs. GE) suggest ultrasonication may induce new S–S formation or oligomerization, shielding AA side chains for EH [56]. This indicates ultrasonication mitigates excessive degradation of gluten’s higher-order structure caused by EH.
3.2. Browning Degree and Antioxidant Ability of Scavenging ABTS·+ for Mixtures
Figure 2(A) shows the Maillard reaction extent (MRE) and ABTS·+ scavenging activity of MRCPs. Notably, MRCPs followed the same ranking order yet displayed weaker ABTS·+ scavenging capacity relative to their protein/hydrolysate counterparts, which might attribute to more reactive FAA residues of smaller peptides before MR as molecular distribution result shown [14]. More FAA residues of GE/GC for MR during microwave heating also increased browning absorbance and reaction degree of HE(C)W(R)S [16]. It also made MRIPs absorbance were elevated in HGEW(R)S/HGCW(R)S compared to that of HGOW(R)S. Additionally, higher MRIPs absorbance than MREPs absorbance could ascribe to stable ketoamine linkages of MRIPs during Amadori rearrangement [57] and higher A420/A294 yield of microwave heating than conventional thermal treatment [58]. This also indicated moderate MR occurred in most samples. HxWS possessed greater antioxidant activity but substantially lower MRE relative to HxRS (x refers to various gluten processed products). Relative to WS, RS exhibited higher amylopectin content, alongside lower resistant starch fraction, particle size, ΔH and solubility, which impaired the thermal stability and gelatinization resistance of RS granules [59,60]. (Post-)Steaming accelerated MR progression by depleting reducing sugars and free α-amino nitrogen within gelatinized surface layer and formed melanoidins diffusing into gelatinized starch to form conjugated complexes [61,62]. Disparities between HxWS and HxRS may partially arise from stronger interactions between reducing sugars from degraded RS and low-MW gluten hydrolysate peptides, alongside greater retention of radical-scavenging moieties in WS under microwave heating. Furthermore, smaller-sized gelatinized RS rich in amylopectin may offer greater reactive surface and binding sites, boosting molecular collisions for accelerated MR. The weaker antioxidant capacity of HGCX (X = WS/RS) relative to HGEX is likely due to enhanced masking effects from high-MW peptide fractions in the GC group, implying that MRE can be modulated by tuning starch types to meet sensory requirements.
3.3. Assessment of the Digestibility of Gluten-Starch Complexes
As shown in Figure 2(B), except for HGERS (which showed markedly decreased FAAs at 6 h), FAA release increased over time for all other complexes. All samples exhibited comparable FAA release within the first 2 h while the liberation of digestible FAAs followed the ascending order HGCX > HGEX > HGOX at 6 h, which RS conjugates yielded greater FAA release. EH combined microwave heating promoted MR and gluten aggregation/cross-linking, which increased starch-protein interactions for masking modifications and reduced digestive sites thus lowered total FAAs during digestion [16,63]. Nevertheless, milk protein aggregates with elevated viscosity exhibited enhanced FAA liberation, which may be governed by protein aggregation status and enzymatic susceptibility during digestion [64]. For HGOXS, lower total FAA release compared to treated complexes may ascribe to intact gluten but not limited MRCPs formation, which mitigated digestive cleavage. Compared to HGCX, reduced AA release in HGEX may stem from increasing MRCPs formation via higher SMP content during processing, which generates more covalent complexes and impairs proteolytic cleavage by digestive enzymes. HxRS displayed greater FAA release relative to HxWS, may be owing to finer gelatinized RS rich in amylopectin, ultrasound-mediated gluten assembly and lower SMP levels. The resultant loose aggregates and limited MR allowed easier protease access and hydrolytic breakdown of the complexes. Lowest FAA release of HGERS may be caused by elevated compact, digestion-resistant aggregates formation because of more gluten SMPs coupled with higher heating-induced starch gelatinization/MRCPs formation. Additionally, encapsulation of SMPs or AAs by gelatinized starch may further hinder the detection of FAAs in supernatants. However, these findings still require further validation.
3.4. Electronic Eye Colorimetry
As shown in Supplementary Figure S1, HGEX appeared a relatively darker yellowish color than other samples. The color of HGCX was the most uniform, and HxRS composites exhibited a darker color than the corresponding HxWS composites. Color attributes of all composites were accurately quantified as shown in Figure 3 and Table 3. L* decreased in the order HGOX > HGEX > HGCX, with HxWS conjugates exhibiting higher L* values than HxRS counterparts. As reported previously [14], Maillard-derived dark compounds reduce L*, while large-size aggregates enhance L* via light reflection [65]. This suggests fewer dark compounds exist in HGOX (lower MRE), whereas moderately higher MRE in HGEX may generate high-molecular MRIPs/MREPs aggregates and elevate L* in HGEX through reflecting light. HGEX showed the highest positive a* value, while negative a* of other samples displayed as HGCWS < HGOWS < HGEWS and HGORS < HGCRS < HGERS. Most studies [5,62,66] noted no correlation between melanoidins and a*, however, the positive a* in HGEX may stem from elevated MRIPs as shown in Figure 3. All negative b* values present order as HGOWS < HGCWS < HGEWS and HGCRS < HGERS < HGORS. Increasing proportion of enzyme-resistant flour would decrease b* (yellowness) and darkened the biscuit colors [5], while MR could enhance blueness [34]. This explains the higher MRE in HGE(C)RS vs. HGE(C)WS. Additionally, elevated blueness in HGE(C)RS may relate to increased retrograded starch and MR than HGORS while HGE(C)RS may have lower retrograded starch than HGE(C)WS (P < 0.05). C* followed the same trend as b*. HGEWS had the highest C* in HxWS, while HGORS peaked in HxRS. C* of heating glucose-ammonium system has increased firstly then decreased at 100 °C and continuously reduced at 110 °C or 120 °C [34]. Study also showed C* increased in ultrasound-treated ultrafiltrated smooth hound viscera protein-sucrose conjugates [67]. For HxWS, C* variation was consistent with browning degree of MRIPs, confirming Maillard pigment formation contributed by the color of MRIPs. For HxRS, the value order of C* was contrary to the browning degree and HGORS showed highest C*. This may be ascribed to the higher gelatinization of RS vs. WS and the diffusion of melanoidins into the gelatinized RS matrix. This may drive distinct color migration: high Mw GO retains chromophores on starch granule surfaces, while lower Mw GE/GC enable more Maillard-derived chromophoric products to diffuse into granule interiors. The superimposed enhancement of light reflectance contributes more to the color increase than MREs alone. HxWS and HxRS conjugates exhibited identical trends for W* (HGEX < HGCX < HGOX) and ΔE* (HGCX < HGOX < HGEX). Reduced W* with prolonged thermal processing indicates increased MRE [67], revealing higher MRE in HGEX. Lower W* in HxRS vs. HxWS further confirms mildly higher MRE in RS conjugates, consistent with browning assays (P > 0.05). ΔE*, which correlates with heating time [67], was highest in HGEX indicating greater MRE (P > 0.05). The elevated ΔE* in HGOX may arise from Rayleigh scattering by large protein aggregates [65]. The lowest ΔE values of HGCX also demonstrate more homogeneous color distribution throughout the matrix, which suggests HGCX is suitable for subsequent food product development.
3.5. Volatile Flavor Components Determination
The profiles of volatile flavor components with RI for different composites and the corresponding descriptions are shown in Table 4. Higher RI which reflects better chromatography matching degree of detected peaks with the standard library. All composites contained a typical wheat gluten volatile (methanethiol: burnt, thiolic notes) from methionine Strecker degradation during microwave-induced MR [68]. For HxRS, higher EH correlated with enhanced MR. HGERS showed prominent creamy roasted notes while HGCRS had the most native wheat-like fresh grassy and nutty malt aroma. HGORS, with less MRE, retained minimal roasted wheat notes. For HxWS, HGOWS with less MRE was dominated by strong smoky popcorn notes, which may be caused by pyrolysis of phenolic acid retained in the wheat matrix [69]. HGEWS had the richest balanced flavor profile while HGCWS showed the strongest raw material character with pure fresh wheat and spicy notes. The difference between HxRS and HxWS may attribute to WS’s abundant endogenous flavor precursors (phenolic acids, reducing sugars) enabling synergistic pyrolysis with proteins, while RS lacks such precursors [69,70].
PCA is an unsupervised dimensionality reduction algorithm requiring no prior knowledge, whereas DFA represents a supervised approach built on training datasets; both were applied to the odorants quantified in Supplementary Table S1. Linear fitting results of PCA and DFA are presented in Figure 4, and centroid distance of identical samples are shown in Table 5. The total explained variance rates (TEV, %) of HxWS and HxRS were 95.719% and 97.742% for PCA from two PCs while those TEV for DFA from two DFs were 100%, manifesting comprehensive coverage of dataset information by these factors. Notably, PCA clusters were closely spaced or overlapped, showing more distinct clustering of HxRS than HxWS counterparts (data largely overlapped). HGOX samples have wider spacing than those of HGEX/HGCX. Sample variability, small dataset size, non-linear correlations, and instrumental/methodological deviations can induce suboptimal separation and clustering [71,72], which explains the poor clustering performance of HxWS and HGOX. Wider spacing of HGOX also indicates the significant flavor differences among parallel HGOX samples, which may be related to the unevenness of samples and the uneven heating process. Overlapping effect among HxWS reflects the higher similarity of HxWS than HxRS, potentially attributed to lower MRE and less detectable volatile aroma compounds in HxWS. HGCRS was fully isolated on the negative PC1 axis, driven by high abundance of mild Strecker degradation products (key markers: 3-methylbutanal, hexanal, methyl eugenol) that retained the native grain aroma of wheat protein. HGERS localized to the positive PC2 axis, characterized by Maillard-derived sulfur-containing heterocyclic compounds (key markers: bis(2-methyl-3-furanyl) disulfide, 2-methylthiophene), while HGORS and HGCRS fell on the negative PC2 axis with no advanced Maillard products. HGCWS isolated on the negative PC1 axis, with the same native cereal aldehyde markers as the HGCRS. HGEWS localized to the positive PC2 axis with Maillard-derived markers, while HGOWS fell on the negative axis with smoky phenolic acid pyrolysis products (key markers: guaiacol, 2-acetylthiazoline, dimethyl trisulfide).
In contrast, DFA successfully discriminated all clusters with wider spacing particularly for HxRS. It is attributed to DFA’s ability to maximize inter-cluster differences and perform cross-validation using prior sample information [71,72]. Relative aroma index (RAI, %) in Table 5 revealed more precise inter-cluster differences, with a order as: HGEX vs HGCX > HGOX vs HGCX > HGOX vs HGEX. HxWS inter-group comparison exhibited significantly higher RAI than those of HxRS. AAs generating sulfurous/sweet/mixed flavor have large content gap between GC and GE hydrolysates may contribute to the savory/umami taste of protein hydrolysates [6], potentially explaining the discrepancy and palatable flavor between HGEX and HGCX. For HxRS, DF1 explained 84.16% of inter-group variance, representing the core discriminant dimension between HGCRS and HGORS/HGERS, with the same key markers driving separation as PC1. DF2 accounted for 15.54% of variance, serving as the discriminant dimension to distinguish HGORS, with hexyl heptanoate and trans-4,5-epoxy-(E)-2-decenal as core negative markers. For HxWS, DF1 (67.14% variance) as the core dimension could distinguish HGEWS/HGCWS, and DF2 (32.86% variance) as the dimension could separate HGCWS. The lower DF1 and PC1 variance in WS may be attributed to endogenous phenolic and lipid flavor precursors in WS, which introduced additional flavor variation and reduced separation between hydrolysis degrees. Consistent clustering patterns across both matrices confirmed that HGCX retained native cereal aroma via mild Strecker degradation, while HGOX/HGEX formed distinct profiles via intense thermal reactions. Starch matrix was the key modulator of chemometric discrimination power, composites with RS enable clearer separation of samples. The flavor profiles indicate combined treatment, especially HGCRS, have balanced MR-derived roasted wheat aroma while maximally retaining the fresh, pure original flavor of wheat gluten and starch.
3.6. ELISA Assays for Gluten Allergens
Gluten allergen detection results (Table 6) showed that HGCX matrices exhibited gluten levels < 10.00 ppm, far below the 10–20 ppm threshold for gluten-free (GF) foods specified by the International Codex Alimentarius Commission (CAC), the USA, EU, Australia, New Zealand, Argentina, and other regions [73,74,75,76]. HGEX had gluten contents around 15 ppm, while untreated groups exceeded 20 ppm. The R5 antibody strongly bound to the QQPFP, QQQFP, LQPFP and QLPFP sequences in α/β-, ω- and γ-gliadins, however, enzymolysis and deamidation (Gln to Glu) during fermentation and hydrolysis processes could destroyed toxic epitopes of gluten [33]. Relative to GO, GE/GC containing higher SMPs exhibited a reduced Glx + Pro ratio (56.16% to 55.31%/54.35%), potentially disturbing epitope conformation. MRCPs may generate through reactions between epitope-related AAs and reducing termini of starch/pyrolyzed dextrins while ultrasound and enzymatic treatments attenuated protein allergenicity, thereby reducing gluten detectability [19,32]. HGOX/HGEX retain allergenicity whereas combined treatment delivers strong synergies to lower gluten allergenicity. This suggests the promising potential of HGCX for gluten-free functional foods.
3.7. Interaction Between Wheat Gluten Subunit and Starch Fragments
Figure 5 illustrates the interaction of glutenin/gliadin with maltodextrin. Binding energies (BEs) were -0.96 and -0.92 kcal/mol, with inhibition constants (Ki) of 196.29 and 211.84 mM for glutenin and gliadin, respectively. Total interaction energy was -4.39 and -4.34 kcal/mol for glutenin and gliadin. Maltodextrin fragments spontaneously bind to both glutenin and gliadin mainly through hydrogen bonds with Gln/Glu residues and hydrophobic forces. This indicates gluten allergenicity may be mitigated by achieving epitope shielding effect.
Average contact frequencies for each residue between protein subunits and starch fragments were compared to identify different binding patterns and the best binding modes as shown in Figure 6 (individual dots stand for unique docking poses) and Table 7. Rigid-body docking revealed richer binding modes for RS fragments interacting with gluten subunits, while wheat amylopectin exhibited only two binding patterns toward glutenin. The abundant interaction sites of RS fragments increase reactive group contact probability, potentially enhancing the MRE of modified gluten-RS systems. Studies reported Gln would deamidate to Glu by transglutaminase 2 (TG2) in vivo, which further activates epitopes and stimulates T cells [38,39,40,77]. Major glutenin allergenic epitopes are QQPGQ, QQPGQGQQ, QQSGQGQ, and QGYYPTSPQQS from HMW glutenins, which could trigger a cascade of allergic and immunoreactive symptoms [40,41,78,79]. While α/β-, ω5-, and γ-gliadins possess highly homologous IgE-binding epitopes, with the consensus sequence being QQX₁PX₂QQ (where X₁ represents L, F, S or I; X₂ represents Q, E or G) and other epitopes (e.g. 1VRVPVPQLQP10, 25VQQQQFPG32, 53QPYLQQFPQQPFPPQLP72, and 77QSFPPQQPYPQQ88, 129QQQPSSQVSFQQ230), which would increase risks of urticaria, allergic reactions and WDEIA and AEDS [38,39,79,80,81]. Optimal binding conformations showed that RS fragments preferentially targets the 60–115 residue region of gliadin, precisely covering the immunodominant linear epitopes 61QQPYP64/97QQPYP101 and the R5-targeted epitope 78LQPFP82, whereas WS fragments conservatively binds the non-epitopic 826–848 region of glutenin. Thermodynamically, rice amylopectin forms more stable complexes with both gliadin and glutenin than wheat amylopectin, while amylose exhibits the opposite trend, demonstrating that branched structural characteristics primarily determine starch–gluten binding stability.
Figure 7 illustrates the structural landscapes, quality assessments and molecular conformations, following flexible refinement and energy minimization of screened rigid-body. Binding energies and intermolecular forces for the various protein-starch fragment complexes were detailed in Table 7 and Table S2. Further flexref, emref and mdref refinements and conformational energy landscape analysis confirmed that starch fragments exhibit broad-spectrum, multi-pocket and multi-stable binding toward gliadin. Starch-gliadin complexes occupied more low-energy conformationas with higher thermodynamic probability, enabling comprehensive surface shielding of gliadin rather than single-point epitope blocking. This structurally explains the significantly reduced allergenicity of modified gluten through multi-modal processing. Rice amylopectin complexes yielded lower HADDOCK scores and more hydrogen bonds than wheat amylopectin counterparts. Starch–gliadin interactions were mainly governed by van der Waals hydrophobic stacking and Gln/Glu/Pro-mediated hydrogen-bond networks (correspond to core allergenic motifs of gluten immunodominant epitopes), consistent with AutoDock results. In contrast, starch–glutenin binding relied more on electrostatic forces with limited dominant stable conformations, indicating prevalent transient and low-probability binding. Combined with ELISA results, RS reduces gluten allergenicity via dual mechanisms of specific linear epitope masking and universal steric shielding, while WS mainly interferes with conformational epitopes. Both starches primarily exert shielding effects on gliadin. These molecular-level findings clarify the improved comprehensive quality of modified gluten–RS complexes and validate the synergistic modification performance of combined non-thermal enzymatic-ultrasonic treatment and microwave heating in starch-gluten food systems.
4. Conclusions
Wheat-derived baked products carry potential health hazards for gluten-sensitive populations, as gluten triggers immunoreactive and allergic responses. This study prepared modified gluten hydrolysates via ultrasonic-enzymatic combined processing. The processing gluten was then mixed with WS or RS and subjected to microwave heating to generate MRCPs as a simplified gluten-based baked model. The resulting model exhibited desirable sensory properties with natural wheat-based & mild MR flavor and acceptable color. Ultrasound–enzymatically treated HGCX samples exhibited comprehensively improved functional performance, including elevated ABTS·+ radical scavenging activity, superior digestibility with abundant nutritional AAs liberation, and markedly reduced allergenic hazards, with gluten levels falling below 10 ppm. In terms of the experimental and molecular mechanism, the improvements were attributed to the enrichment of beneficial AAs with suitable AA profile, moderate MRCPs formation, and altered starch-gluten interaction pattern (masking effect driven by higher binding affinity with stronger hydrophobic interactions and hydrogen bonds between Glu/Gln and glucose). These effects may collectively disrupt allergenic epitope spatial/linear structures, mask epitopes of gluten (e.g. 61QQPYP64, 97QQPYP101, and 78LQPFP82) via coupling food processing and starch-gluten binding. This work demonstrates that multi-technique combined processing effectively optimizes the comprehensive quality of gluten-starch systems. It offers critical technical guidance for developing high-quality gluten-based foods with satisfactory color, flavor, functionality, and safety (low allergens). Moreover, the established cereal-based food model provides a valuable reference for industrial production of healthy baked foods for gluten-susceptible population.
Supplementary Materials
The following supporting information can be downloaded at: Preprints.org.
Author Contributions
Zhenlong Chen: Writing – original draft, review & editing, Methodology, Software, Formal analysis, Visualization, Data curation, Conceptualization, Validation. Dong He: Writing– review & editing, Methodology, Software, Data curation, Conceptualization. Xia Zhang: Writing– review & editing, Conceptualization, Validation. Lin Li: Conceptualization, Validation. Bing Li: Writing – review & editing, Supervision, Resources, Funding acquisition, Project administration, Conceptualization. Xinhui Xing: Supervision, Resources, Methodology, Project administration, Conceptualization.
Funding
This research was funded by Guangdong Provincial Special Program for Key Fields in Regular Higher Education Institutions (No. 2023ZDZX2083). The APC for manuscript publication was covered by the authors’ personal funds.
Institutional Review Board Statement
Not applicable.
Informed Consent Statement
Not applicable.
Data Availability Statement
Data will be made available on request.
Acknowledgments
Technical supports from Tsinghua University, Institute of Food Processing, Chinese Academy of Agricultural Sciences, and South China University of Technology are gratefully acknowledged. Financial support for overseas study attachment at University of Groningen and the utilization of the Hábrók HPC cluster for computational studies and analyses were provided by the Guangzhou Elite Talent Program.
Conflicts of Interest
The authors declare no conflicts of interest.
References
- Nuttall, J.G.; L., G.J.O.; Panozzo, J.F.; Walker, C.K.; Barlow, K.M.; Fitzgerald, G.J. Models of grain quality in wheat-A review. Field Crops Research 2016, S0378429015301088. [Google Scholar] [CrossRef]
- Heiniö, R.L.; Noort, M.W.J.; Katina, K.; Alam, S.A.; Poutanen, K. Sensory characteristics of wholegrain and bran-rich cereal foods - A review. Trends Food Sci. Technol. 2015, 47. [Google Scholar] [CrossRef]
- Berton, B.; Scher, J.; Villieras, F.; Hardy, J. Measurement of hydration capacity of wheat flour: Influence of composition and physical characteristics. Powder Technol. 2002, 128, 326–331. [Google Scholar] [CrossRef]
- Ortolan, F.; Steel, C.J. Protein Characteristics that Affect the Quality of Vital Wheat Gluten to be Used in Baking: A Review. Compr. Rev. Food Sci. Food Saf. 2017, 16, 369–381. [Google Scholar] [CrossRef] [PubMed]
- Candal, C.; Erbas, M. The effects of different processes on enzyme resistant starch content and glycemic index value of wheat flour and using this flour in biscuit production. J. Food Sci. Technol. 2019, 56, 4110–4120. [Google Scholar] [CrossRef] [PubMed]
- Vijaykrishnaraj, M.; Roopa, B.S.; Prabhasankar, P. Preparation of gluten free bread enriched with green mussel (Perna canaliculus) protein hydrolysates and characterization of peptides responsible for mussel flavour. Food Chem. 2016, 211, 715–725. [Google Scholar] [CrossRef] [PubMed]
- Hwang, H.I.; Hartman, T.G.; Karwe, M.V.; Izzo, H.V.; Ho, C.T. Aroma Generation in Extruded and Heated Wheat Flour. Lipids Food Flavors 1994, 558, 144–157. [Google Scholar] [CrossRef]
- Wang, P.; Jin, Z.; Xu, X. Physicochemical alterations of wheat gluten proteins upon dough formation and frozen storage- A review from gluten, glutenin and gliadin perspectives. Trends Food Sci. Technol. 2015, 46, 1–10. [Google Scholar] [CrossRef]
- Mlotkiewicz, J.A. The Role of the Maillard Reaction in the Food Industry. Maillard Reaction in Foods & Medicine 2005. [Google Scholar] [CrossRef]
- Boeswetter, A.R.; Scherf, K.A.; Schieberle, P.; Koehler, P. Identification of the Key Aroma Compounds in Gluten-Free Rice Bread. J. Agric. Food Chem. 2019, 67, 2963–2972. [Google Scholar] [CrossRef] [PubMed]
- Pogna, N. Genetic improvement of plant for coeliac disease. Dig. Liver Dis. 2002, 34, S154–S159. [Google Scholar] [CrossRef] [PubMed]
- Uvackova, L.L.; Skultety, L.; Bekesova, S.; Mcclain, S.; Hajduch, M. The MS(E)-proteomics analysis of gliadins and glutenins in wheat grain identifies and quantifies proteins associated with celiac disease and Baker's asthma. J. Proteom. 2013, 93, 65–73. [Google Scholar] [CrossRef] [PubMed]
- Brietzke, E.; Cerqueira, R.O.; Mansur, R.B.; Mcintyre, R.S. Gluten related illness and severe mental disorders: A comprehensive review. Neurosci. Biobehav. Rev. 2018, 84, 368–375. [Google Scholar] [CrossRef] [PubMed]
- Min, Y.; He, S.; Tang, M.; Zhang, Z.; Zhu, Y.; Sun, H. Antioxidant activity and sensory characteristics of Maillard reaction products derived from different peptide fractions of soybean meal hydrolysate. Food Chem. 2018, 243, 249–257. [Google Scholar] [CrossRef] [PubMed]
- Gupta, R.K.; Gupta, K.; Sharma, A.; Das, M.; Ansari, I.A.; Dwivedi, P.D. Maillard reaction in food allergy: Pros and cons. Crit. Rev. Food Sci. Nutr. 2018, 58, 208–226. [Google Scholar] [CrossRef] [PubMed]
- Xiang, S.; Zou, H.; Liu, Y.; Ruan, R. Effects of microwave heating on the protein structure, digestion properties and Maillard products of gluten. J. Food Sci. Technol. 2020, 1–11. [Google Scholar] [CrossRef] [PubMed]
- Toheder; Rahaman; Todor; Vasiljevic; Lata; Ramchandran. Effect of processing on conformational changes of food proteins related to allergenicity. Trends Food Sci. Technol. 2016, 49, 24–34. [Google Scholar] [CrossRef]
- Cuadrado, C.; Cheng, H.; Sanchiz, A.; Ballesteros, I.; Maleki, S.J. Influence of enzymatic hydrolysis on the allergenic reactivity of processed cashew and pistachio. Food Chem. 2017, 241, 372–379. [Google Scholar] [CrossRef] [PubMed]
- Li, Z.; Caolimin, L.; Jamil, K. Reduction of allergenic properties of shrimp (Penaeus Vannamei) allergens by high intensity ultrasound. Eur. Food Res. Technol. 2006, 223, 639–644. [Google Scholar] [CrossRef]
- Toutounji, M.R.; Farahnaky, A.; Santhakumar, A.B.; Oli, P.; Butardo, V.M., Jr.; Blanchard, C.L. Intrinsic and extrinsic factors affecting rice starch digestibility. Trends Food Sci. Technol. 2019, 88, 10–22. [Google Scholar] [CrossRef]
- Cabanillas, B.; Novak, N. Effects of daily food processing on allergenicity. Crit. Rev. Food Sci. Nutr. 2019, 59, 31–42. [Google Scholar] [CrossRef] [PubMed]
- Cian; Raul, E.; Vioque; Javier; Drago; Silvina, R. Structure-mechanism relationship of antioxidant and ACE I inhibitory peptides from wheat gluten hydrolysate fractionated by pH. Food Res. Int. 2015, 69, 216–223. [Google Scholar] [CrossRef]
- Fuentes-Prado, E.; Martinez-Padilla, L.P. Colloidal stability and dilatational rheology at the air-water interface of peptides derived from thermal-acidic treated wheat gluten. Food Hydrocoll. 2014, 41, 210–218. [Google Scholar] [CrossRef]
- Zhu, K.X.; Su, C.Y.; Guo, X.N.; Peng, W.; Zhou, H.M. Influence of ultrasound during wheat gluten hydrolysis on the antioxidant activities of the resulting hydrolysate. Int. J. Food Sci. Technol. 2011, 46, 1053–1059. [Google Scholar] [CrossRef]
- Zhang, Y.; Li, J.; Li, S.; Ma, H.; Zhang, H. Mechanism study of multimode ultrasound pretreatment on the enzymolysis of wheat gluten. J. Sci. Food Agric. 2018, 98(4), 1530–1538. [Google Scholar] [CrossRef] [PubMed]
- Masson, P.; Tomè, D.; Popineau, Y. Peptic hydrolysis of gluten, glutenin and gliadin from wheat grain: Kinetics and characterisation of peptides. J. Sci. Food Agric. 1986, 37, 1223–1235. [Google Scholar] [CrossRef]
- Wang, S.; Wang, S.; Liu, L.; Wang, S.; Copeland, L. Structural Orders of Wheat Starch Do Not Determine the In Vitro Enzymatic Digestibility. J. Agric. Food Chem. 2017, 65(8), 1697–1706. [Google Scholar] [CrossRef] [PubMed]
- Lopez-Baron; Nataly; Sagnelli; Domenico; Blennow; Andreas; Holse; Mette; Gao; Jun. Hydrolysed pea proteins mitigate in vitro wheat starch digestibility. Food Hydrocoll. 2018, 79, 117–126. [Google Scholar] [CrossRef]
- Chen, X.; He, X.; Fu, X.; Huang, Q. In vitro digestion and physicochemical properties of wheat starch/flour modified by heat-moisture treatment. J. Cereal Sci. 2015, 63, 109–115. [Google Scholar] [CrossRef]
- Gomaa, A.; Boye, J. Impact of irradiation and thermal processing on the immunochemical detection of milk and egg allergens in foods. Food Res. Int. 2015, 74, 275–283. [Google Scholar] [CrossRef] [PubMed]
- Mecherfi, K.E.E.; Saidi, D.; Kheroua, O.; Boudraa, G.; Touhami, M.; Rouaud, O.; Curet, S.; Choiset, Y.; Rabesona, H.; Chobert, J.M. Combined microwave and enzymatic treatments for β-lactoglobulin and bovine whey proteins and their effect on the IgE immunoreactivity. Eur. Food Res. Technol. 2011, 233, 859–867. [Google Scholar] [CrossRef]
- Li, H.; Yu, J.; Ahmedna, M.; Goktepe, I. Reduction of major peanut allergens Ara h 1 and Ara h 2, in roasted peanuts by ultrasound assisted enzymatic treatment. Food Chem. 2013, 141, 762–768. [Google Scholar] [CrossRef] [PubMed]
- Panda, R.; Boyer, M.; Garber, E.A.E. A multiplex competitive ELISA for the detection and characterization of gluten in fermented-hydrolyzed foods. Anal. Bioanal. Chem. 2017, 409, 6959–6973. [Google Scholar] [CrossRef] [PubMed]
- Li, H.; Wu, C.-J.; Yu, S.-J. Impact of Microwave-Assisted Heating on the pH Value, Color, and Flavor Compounds in Glucose-Ammonium Model System. Food Bioprocess Technol. 2018, 11(6), 1248–1258. [Google Scholar] [CrossRef]
- Van Den, T.; Biermann, C.J.; Marlett, J. A. Simple sugars, oligosaccharides and starch concentrations in raw and cooked sweet potato. J. Agric. Food Chem. 1986, 34, 421–425. [Google Scholar] [CrossRef]
- Saavedra-Leos, Z.; Leyva-Porras, C.; Araujo-Diaz, S.B.; Toxqui-Teran, A.; Borras-Enriquez, A.J. Technological Application of Maltodextrins According to the Degree of Polymerization. Molecules 2015, 20, 21067–21081. [Google Scholar] [CrossRef] [PubMed]
- Biney, E.; Wang, M.; Cheong, K.L. Starch-Based Functional Ingredients in Baking: A Review of Advances in Starch Derivatives, Quality Enhancement, and Reduction of Fermentable Oligosaccharides, Disaccharides, Monosaccharides, and Polyols. Molecules 2026, 31, 1709. [Google Scholar] [CrossRef] [PubMed]
- Chlubnová, M.; Christophersen, A.O.; Sandve, G.K.F.; Lundin, K.E.; Jahnsen, J.; Dahal-Koirala, S.; Sollid, L.M. Identification of gluten T cell epitopes driving celiac disease. Sci. Adv. 2023, 9(4), eade5800. [Google Scholar] [CrossRef] [PubMed]
- Tye-Din, J.A.; Stewart, J.A.; Dromey, J.A.; Beissbarth, T.; van Heel, D.A.; Tatham, A.; Henderson, K.; Mannering, S.I.; Gianfrani, C.; Jewell, D.P. Comprehensive, quantitative mapping of T cell epitopes in gluten in celiac disease. Sci. Transl. Med. 2010, 2, 41–51. [Google Scholar] [CrossRef] [PubMed]
- van de Wal, Y.; Kooy, Y.M.; van Veelen, P.; Vader, W.; August, S.A.; Drijfhout, J.W.; Peña, S.A.; Koning, F. Glutenin is involved in the gluten-driven mucosal T cell response. Eur. J. Immunol. 1999, 29, 3133–3139. [Google Scholar]
- Shewry, P. Wheat grain proteins: Past, present, and future. Cereal Chem. 2023, 100, 9–22. [Google Scholar] [CrossRef] [PubMed]
- El Hassouni, K.; Afzal, M.; Steige, K.A.; Sielaff, M.; Curella, V.; Neerukonda, M.; Tenzer, S.; Schuppan, D.; Longin, C.F.H.; Thorwarth, P. Multiomics Based Association Mapping in Wheat Reveals Genetic Architecture of Quality and Allergenic Related Proteins. Int. J. Mol. Sci. 2023, 24. [Google Scholar] [CrossRef] [PubMed]
- Jo, S.; Kim, T.; Iyer, V.G.; Im, W. CHARMM-GUI: a web-based graphical user interface for CHARMM. J. Comput. Chem. 2008, 29, 1859–1865. [Google Scholar] [CrossRef]
- Wen, J.; Liu, J.; Tang, J.; Zou, T.; Gao, A.; Nangia, V.; Liu, Y. The effects of exogenous spermidine on starch development, multi-scale structure, and in vitro digestibility in wheat were investigated under drought stress. Food Chem. X 2026, 35, 103757. [Google Scholar] [CrossRef] [PubMed]
- S., H. Polymodal distribution of the chain lengths of amylopectins, and its significance. Carbohydr. Res. 1986, 147, 342–347. [Google Scholar] [CrossRef]
- Giulini, M.; Reys, V.; Teixeira, J.M.C.; Jimenez-Garcia, B.; R, V.H.; Kravchenko, A.; Xu, X.; Versini, R.; Engel, A.; Verhoeven, S.; et al. HADDOCK3: A Modular and Versatile Platform for Integrative Modeling of Biomolecular Complexes. J. Chem. Inf. Model. 2025, 65, 7315–7324. [Google Scholar] [CrossRef] [PubMed]
- Masson, P.; Tomè, D.; Popineau, Y. Peptic hydrolysis of gluten, glutenin and gliadin from wheat grain: Kinetics and characterisation of peptides. J. Sci. Food Agric. 2006, 37, 1223–1235. [Google Scholar] [CrossRef]
- Ewart, J.A.D. Amino acid analyses of glutenins and gliadins. J. Sci. Food Agric. 1967, 18(3), 111–116. [Google Scholar] [CrossRef] [PubMed]
- Qiu, C.; Sun, W.; Cui, C.; Zhao, M. Effect of citric acid deamidation on in vitro digestibility and antioxidant properties of wheat gluten. Food Chem. 2013, 141, 2772–2778. [Google Scholar] [CrossRef] [PubMed]
- Elhadad, N.; Wu, J. Decoding the Taste of Peptides: Structure, Interactions With Taste Receptors, Bioactivities, and Applications. Sustain. Food Proteins 2025, 3(2), e70009. [Google Scholar] [CrossRef]
- Kato, H.; Rhue, M.R.; Nishimura, T. Role of Free Amino Acids and Peptides in Food Taste. In Flavor Chemistry ACS Symposium Series; 1989; pp. 158–174. [Google Scholar] [CrossRef]
- Schiffman, S.S.; Dackis, C. Taste of nutrients: amino acids, vitamins, and fatty acids. Percept. Psychophys. 1975, 17(2), 140–146. [Google Scholar] [CrossRef]
- Solms, J. Taste of amino acids, peptides, and proteins. J. Agric. Food Chem. 1969, 17, 686–688. [Google Scholar] [CrossRef]
- Solms, J.; Vuataz, L.; Egli, R.H. The taste of L- and D-amino acids. Experientia 1965, 21, 692–694. [Google Scholar] [CrossRef] [PubMed]
- Ma, S.; Wang, C.; Guo, M. Changes in structure and antioxidant activity of β-lactoglobulin by ultrasound and enzymatic treatment. Ultrason. Sonochemistry 2018, 43, 227–236. [Google Scholar] [CrossRef] [PubMed]
- Ekezie, F.G.C.; Cheng, J.H.; Sun, D.W. Effects of nonthermal food processing technologies on food allergens: A review of recent research advances. Trends Food Sci. Technol. 2018, 74, 12–25. [Google Scholar] [CrossRef]
- Heping, C.; Jingyang, Y.; Shuqin, X.; Emmanuel, D.; Qingrong, H.; Xiaoming, Z. Improved controlled flavor formation during heat-treatment with a stable Maillard reaction intermediate derived from xylose-phenylalanine. Food Chem. 2019, 271, 47–53. [Google Scholar] [CrossRef] [PubMed]
- Zhang, N.; Fan, D.; Zhao, Y.; Wu, Y.; Yan, B.; Zhao, J.; Wang, M.; Zhang, H. Dielectric loss mediated promotion of microwave heating in the Maillard reaction. LWT 2019, 101, 559–566. [Google Scholar] [CrossRef]
- Waterschoot, J.; Gomand, S.V.; Fierens, E.; Delcour, J.A. Production, structure, physicochemical and functional properties of maize, cassava, wheat, potato and rice starches. Starch-Stärke 2015, 67, 14–29. [Google Scholar] [CrossRef]
- Romano, A.; Mackie, A.; Farina, F.; Aponte, M.; Sarghini, F.; Masi, P. Characterisation, in vitro digestibility and expected glycemic index of commercial starches as uncooked ingredients. J. Food Sci. Technol. 2016, 53, 4126–4134. [Google Scholar] [CrossRef] [PubMed]
- Lamberts, L.; Brijs, K.; Mohamed, R.; Verhelst, N.; Delcour, J.A. Impact of Browning Reactions and Bran Pigments on Color of Parboiled Rice. J. Agric. Food Chem. 2006, 54, 9924–9929. [Google Scholar] [CrossRef] [PubMed]
- González-Mateo, S.; González-SanJosé, M.L.; Muñiz, P. Presence of Maillard products in Spanish muffins and evaluation of color and antioxidant potential. Food Chem. Toxicol. 2009, 47(11), 2798–2805. [Google Scholar] [CrossRef] [PubMed]
- Lopez-Baron, N.; Gu, Y.; Vasanthan, T.; Hoover, R. Plant proteins mitigate in vitro wheat starch digestibility. Food Hydrocoll. 2017, 69, 19–27. [Google Scholar] [CrossRef]
- Kung, B.; Turgeon, S.L.; Rioux, L.-E.; Anderson, G.H.; Wright, A.J.; Goff, H.D. Correlating in vitro digestion viscosities and bioaccessible nutrients of milks containing enhanced protein concentration and normal or modified protein ratio to human trials. Food Funct. 2019, 10, 7687–7696. [Google Scholar] [CrossRef] [PubMed]
- Farzaneh; Nasrollahzadeh; Mehdi; Varidi; Arash; Koocheki; Farzin; Hadizadeh. Effect of microwave and conventional heating on structural, functional and antioxidant properties of bovine serum albumin-maltodextrin conjugates through Maillard reaction. Food Res. Int. 2017, 100, 289–297. [Google Scholar] [CrossRef] [PubMed]
- Wong, C.W.; Wijayanti, H.B.; Bhandari, B.R. Maillard Reaction in Limited Moisture and Low Water Activity Environment; Springer New York the United States, 2015; pp. 41–63. [Google Scholar] [CrossRef]
- Abdelhedi, O.; Mora, L.; Jemil, I.; Jridi, M.; Toldrá, F.; Nasri, M.; Nasri, R. Effect of ultrasound pretreatment and Maillard reaction on structure and antioxidant properties of ultrafiltrated smooth-hound viscera proteins-sucrose conjugates. Food Chem. 2017, 230, 507–515. [Google Scholar] [CrossRef] [PubMed]
- Majcher, M. A.; Jelen, H.H. Effect of cysteine and cystine addition on sensory profile and potent odorants of extruded potato snacks. J. Agric. Food Chem. 2007, 55, 5754–5760. [Google Scholar] [CrossRef] [PubMed]
- Roman, K.; Szadkowska, D.; Szadkowski, J. Impact of Anaerobic Pyrolysis Temperature on the Formation of Volatile Hydrocarbons in Wheat Straw. Materials 2026, 19(2), 436. [Google Scholar] [CrossRef] [PubMed]
- Shahidi, F.; Danielski, R.; Ikeda, C. Phenolic compounds in cereal grains and effects of processing on their composition and bioactivities: a review. J. Food Bioact. 2021, 15, 39–50. [Google Scholar] [CrossRef]
- Yan, H.; Fang, L.; Xia, Y.; Chen, K. Scent profiling of Cymbidium ensifolium by electronic nose. Sci. Hortic. 2011, 128(3), 306–310. [Google Scholar] [CrossRef]
- Huang, L.; Liu, H.; Zhang, B.; Wu, D. Application of Electronic Nose with Multivariate Analysis and Sensor Selection for Botanical Origin Identification and Quality Determination of Honey. Food Bioprocess Technol. 2015, 8(2), 359–370. [Google Scholar] [CrossRef]
- Thompson, T.; Kane, R.R.; Hager, M.H. Food allergen labeling and consumer protection act of 2004 in effect. J. Acad. Nutr. Diet. 2006, 106, 1742–1744. [Google Scholar] [CrossRef] [PubMed]
- Food and Agriculture Organization of the United Nations; World Health Organization. Provisional Agenda, Codex Committee on Nutrition and Foods for Special Dietary Uses (CCNFSDU), 36th Session, CX/NFSDU 14/36/1; Codex Alimentarius Commission: Bali, Indonesia, 2014; Available online: https://www.fao.org/fao-who-codexalimentarius/sh-proxy/en/?lnk=1&url=https%3A%2F%2Fworkspace.fao.org%2Fsites%2Fcodex%2FShared+Documents%2FArchive%2FMeetings%2FCCNFSDU%2Fccnfsdu36%2Fnf36_01e.pdf (accessed on 28 July 2026).
- Llopart, E.; Pérez, M.P.; Borda-Bossana, D.; López-Marenghini, L. Assessment of the nutritional quality of cookies with low glycemic value in the city of Rosario, Argentina. Rev. Española De Nutr. Humana Y Dietética 2014, 18, 205–211. [Google Scholar] [CrossRef]
- Rumble, T.; Wallace, A.; Deeps, C.; McVay, K.; Curran, M.; Allen, J.; Stafford, J.; O'Sullivan, A. New food labelling initiatives in Australia and New Zealand. Food Control 2003, 14, 417–427. [Google Scholar] [CrossRef]
- Mowat, A.M. Coeliac disease-a meeting point for genetics, immunology, and protein chemistry. The Lancet 2003, 361, 1290–1292. [Google Scholar] [CrossRef] [PubMed]
- Matsuo, H.; Kohno, K.; Niihara, H.; Morita, E. Specific IgE determination to epitope peptides of omega-5 gliadin and high molecular weight glutenin subunit is a useful tool for diagnosis of wheat-dependent exercise-induced anaphylaxis. J. Immunol. 2005, 175(12), 8116–8122. [Google Scholar] [CrossRef] [PubMed]
- Guzman-Lopez, M.H.; Ruiperez, V.; Marin-Sanz, M.; Ojeda-Fernandez, I.; Ojeda-Fernandez, P.; Garrote-Adrados, J.A.; Arranz-Sanz, E.; Barro, F. Identification of RNAi hypoallergic bread wheat lines for wheat-dependent exercise-induced anaphylaxis patients. Front. Nutr. 2024, 10, 1319888. [Google Scholar] [CrossRef] [PubMed]
- Battais, F.; Mothes, T.; Moneret-Vautrin, D.A.; Pineau, F.; Kanny, G.; Popineau, Y.; Bodinier, M.; Denery-Papini, S. Identification of IgE-binding epitopes on gliadins for patients with food allergy to wheat. Allergy 2005, 60, 815–821. [Google Scholar] [CrossRef] [PubMed]
- Mameri, H.; Brossard, C.; Gaudin, J.C.; Gohon, Y.; Paty, E.; Beaudouin, E.; Moneret-Vautrin, D.A.; Drouet, M.; Sole, V.; Wien, F.; et al. Structural Basis of IgE Binding to alpha- and gamma-Gliadins: Contribution of Disulfide Bonds and Repetitive and Nonrepetitive Domains. J. Agric. Food Chem. 2015, 63(29), 6546–6554. [Google Scholar] [CrossRef] [PubMed]
- Kharwar, A.; Marban-Gonzalez, A.; Medina-Franco, J.L.; Velazquez-Martinez, C.A. Structural diversity and chemical space analysis of a PROTAC database using unsupervised machine learning. Sci. Rep. 2026. [Google Scholar] [CrossRef] [PubMed]
Figure 1.
Properties and functions of gluten processing derived fractions. (A) The molecular weight distribution fractions of gluten (hydrolysates) analysis by SE-HPLC, (B) ABTS·+ free radical scavenging effect and zeta potential of GO/GE/GC.
Figure 1.
Properties and functions of gluten processing derived fractions. (A) The molecular weight distribution fractions of gluten (hydrolysates) analysis by SE-HPLC, (B) ABTS·+ free radical scavenging effect and zeta potential of GO/GE/GC.
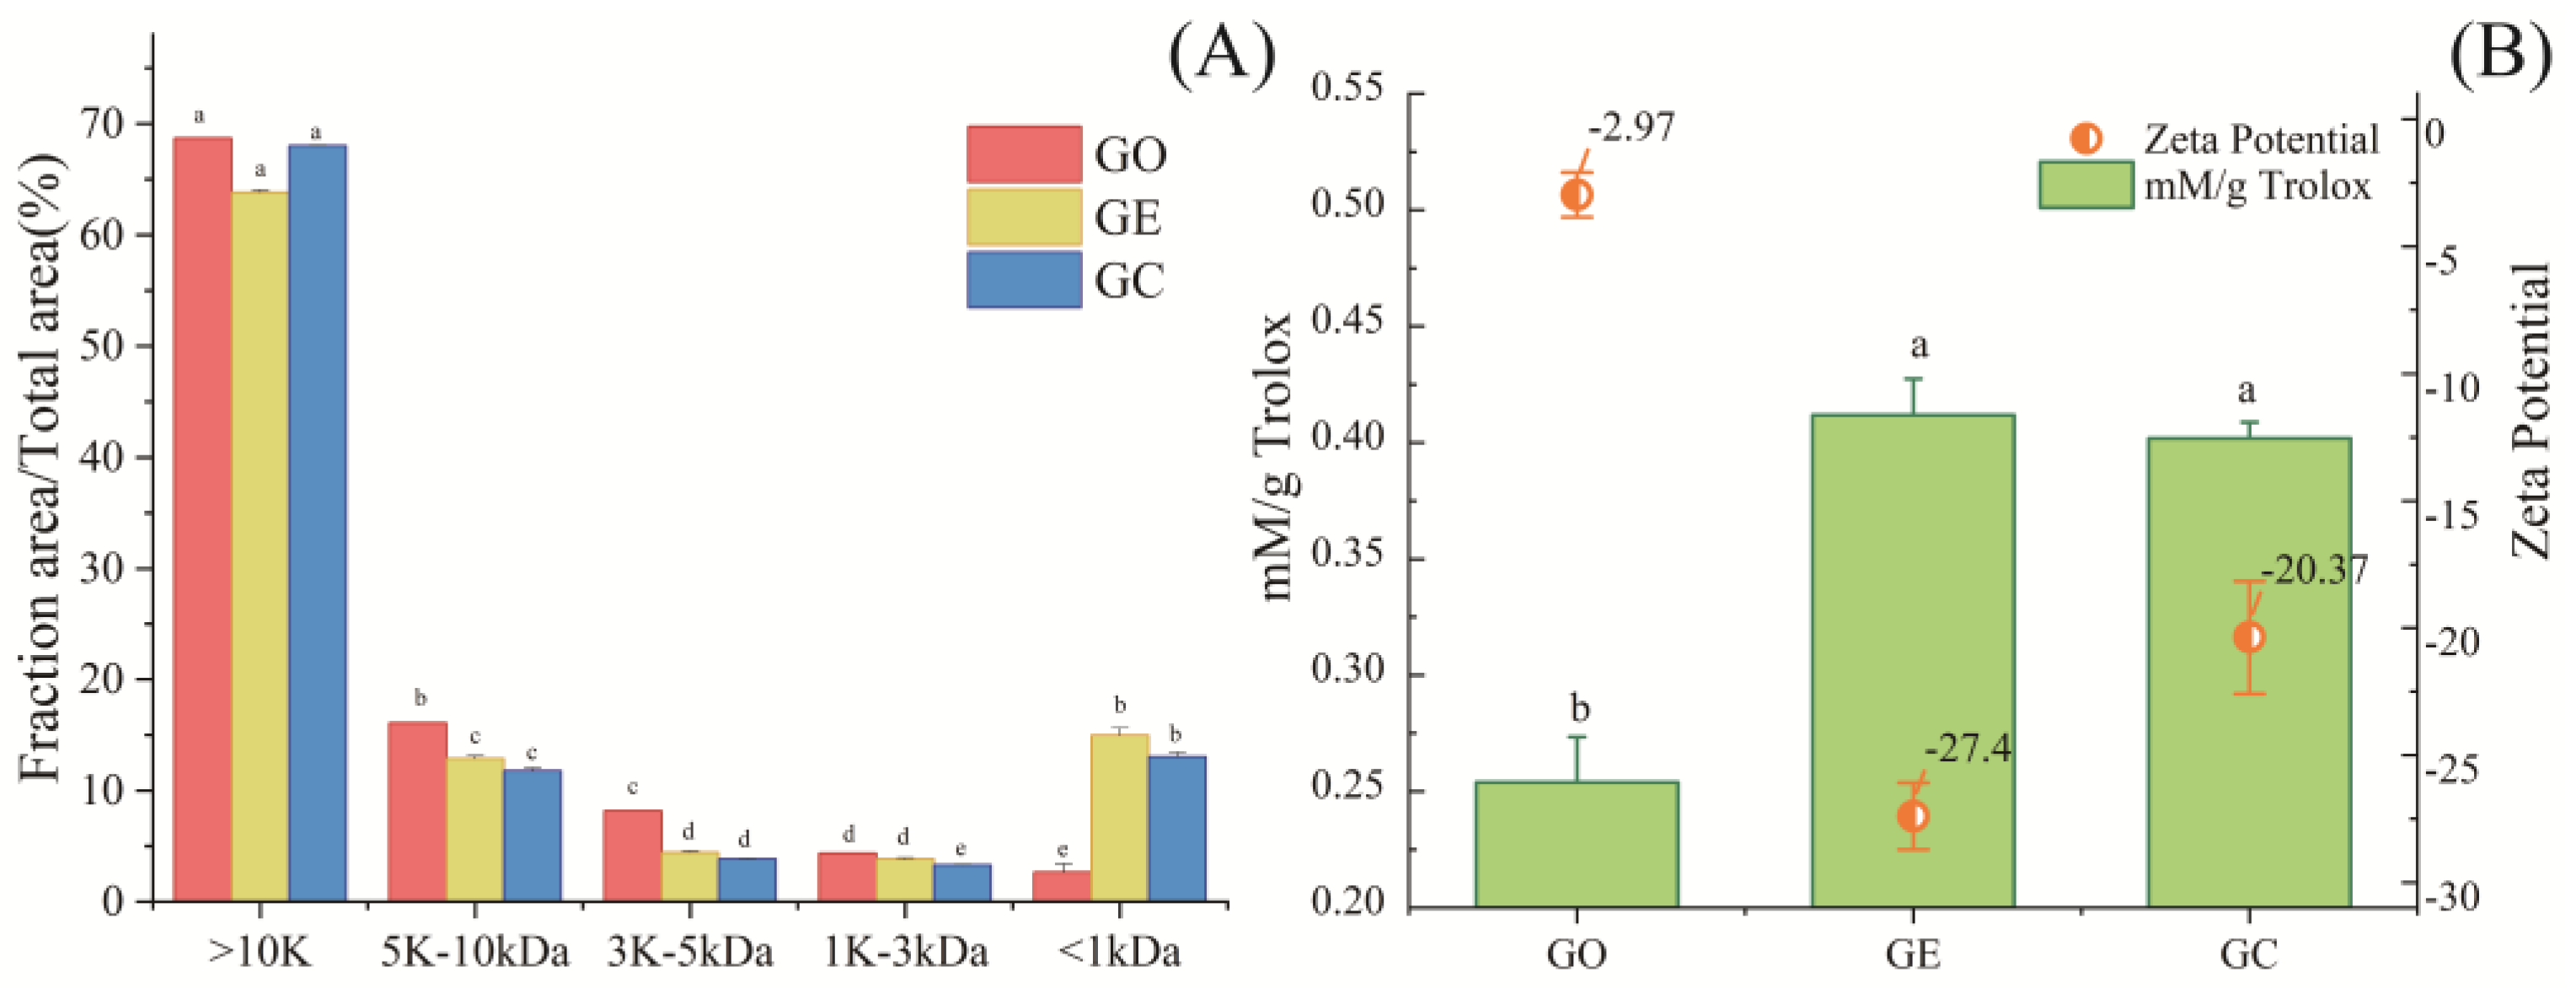
Figure 2.
Properties and functions of starch-protein Maillard complexes. (A) Browning degree and antioxidant ability of scavenging ABTS·+ for MRCPs, (B) Analysis of free amino acid contents in thermal treated protein-starch conjugates after simulated digestion at different time points.
Figure 2.
Properties and functions of starch-protein Maillard complexes. (A) Browning degree and antioxidant ability of scavenging ABTS·+ for MRCPs, (B) Analysis of free amino acid contents in thermal treated protein-starch conjugates after simulated digestion at different time points.
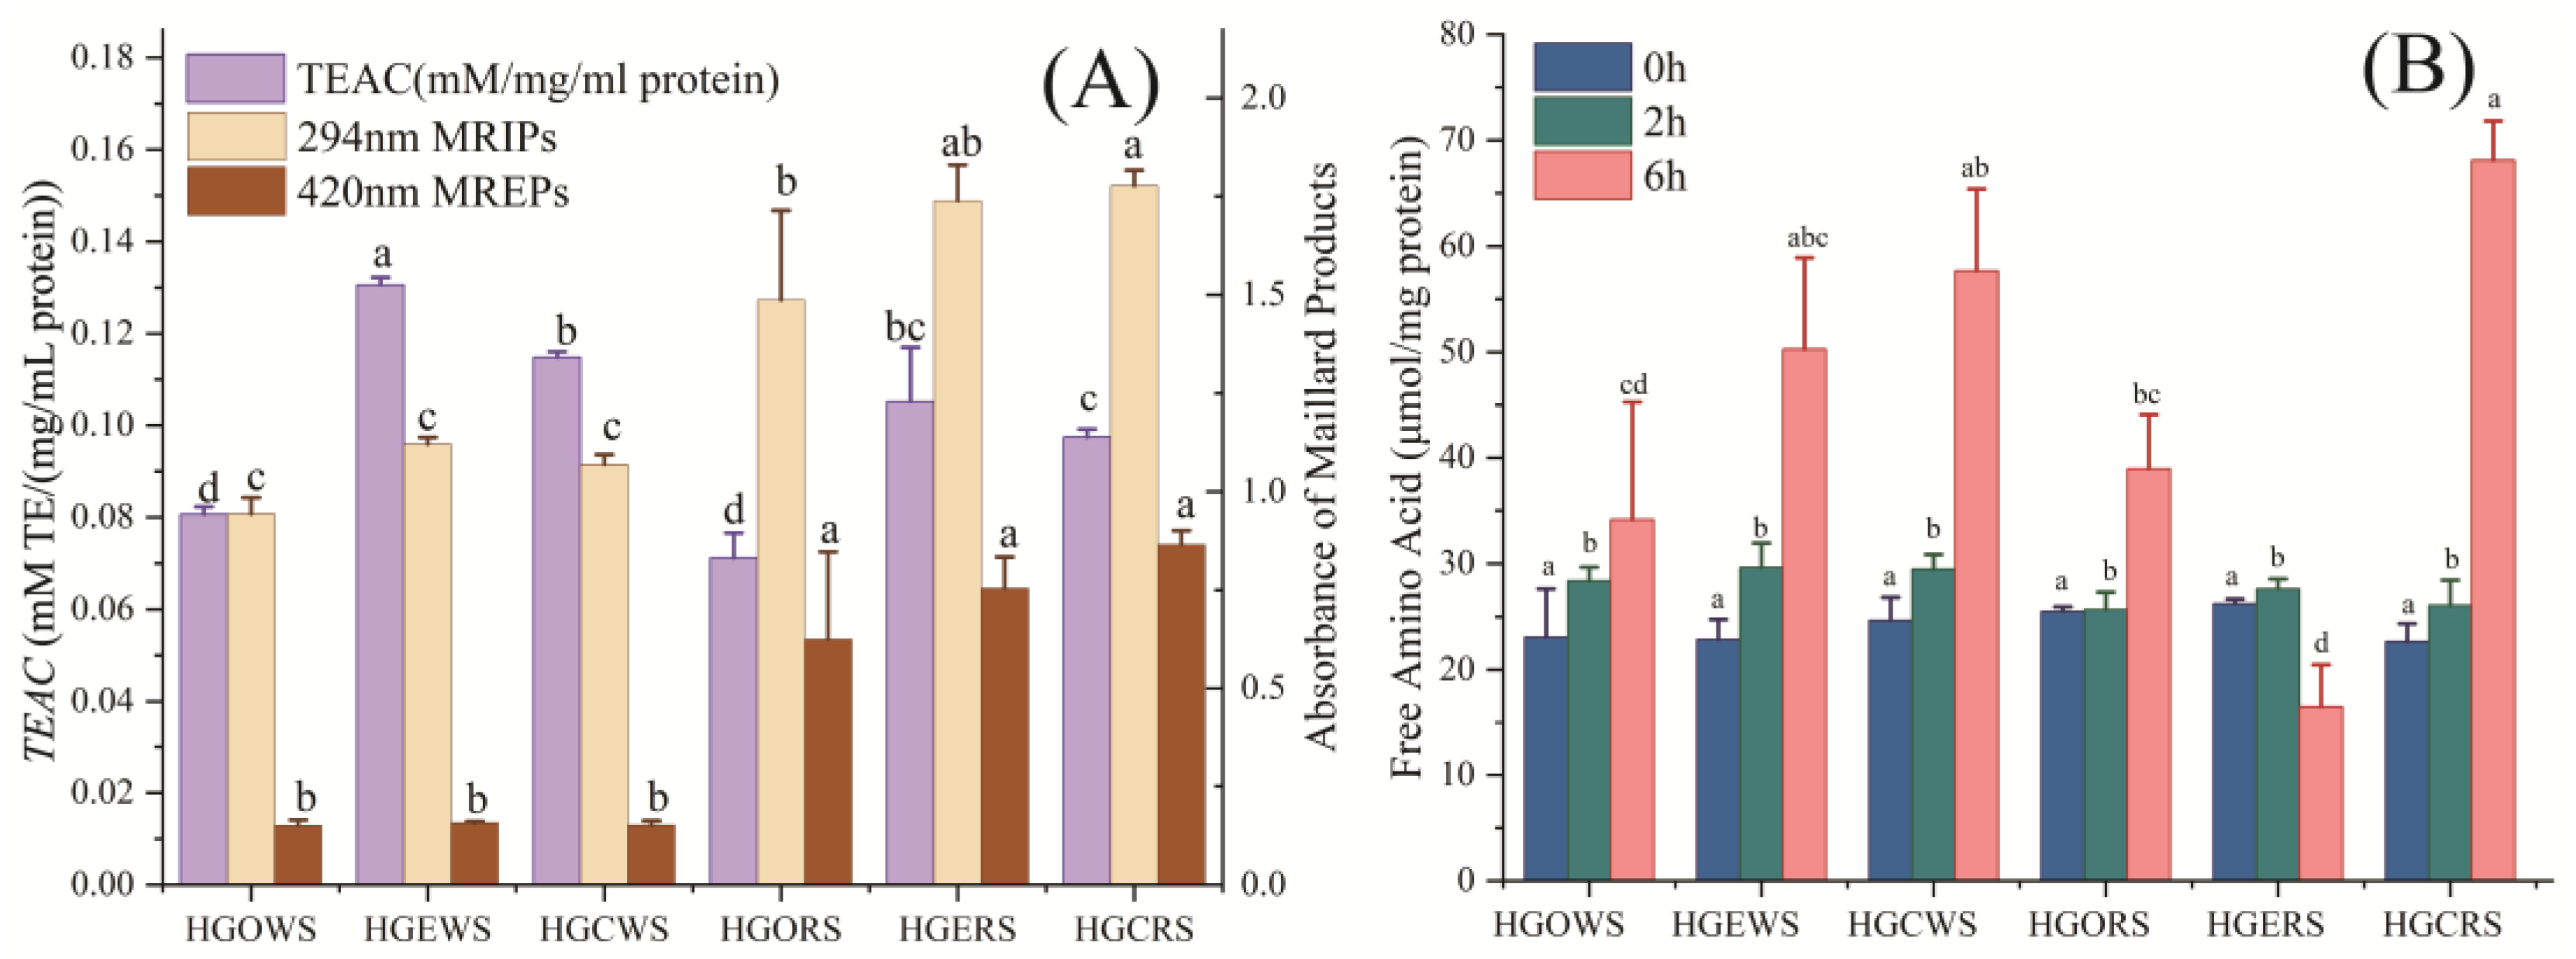
Figure 3.
The electronic eye colorimetry of gluten derived MRCPs in aqueous solution.
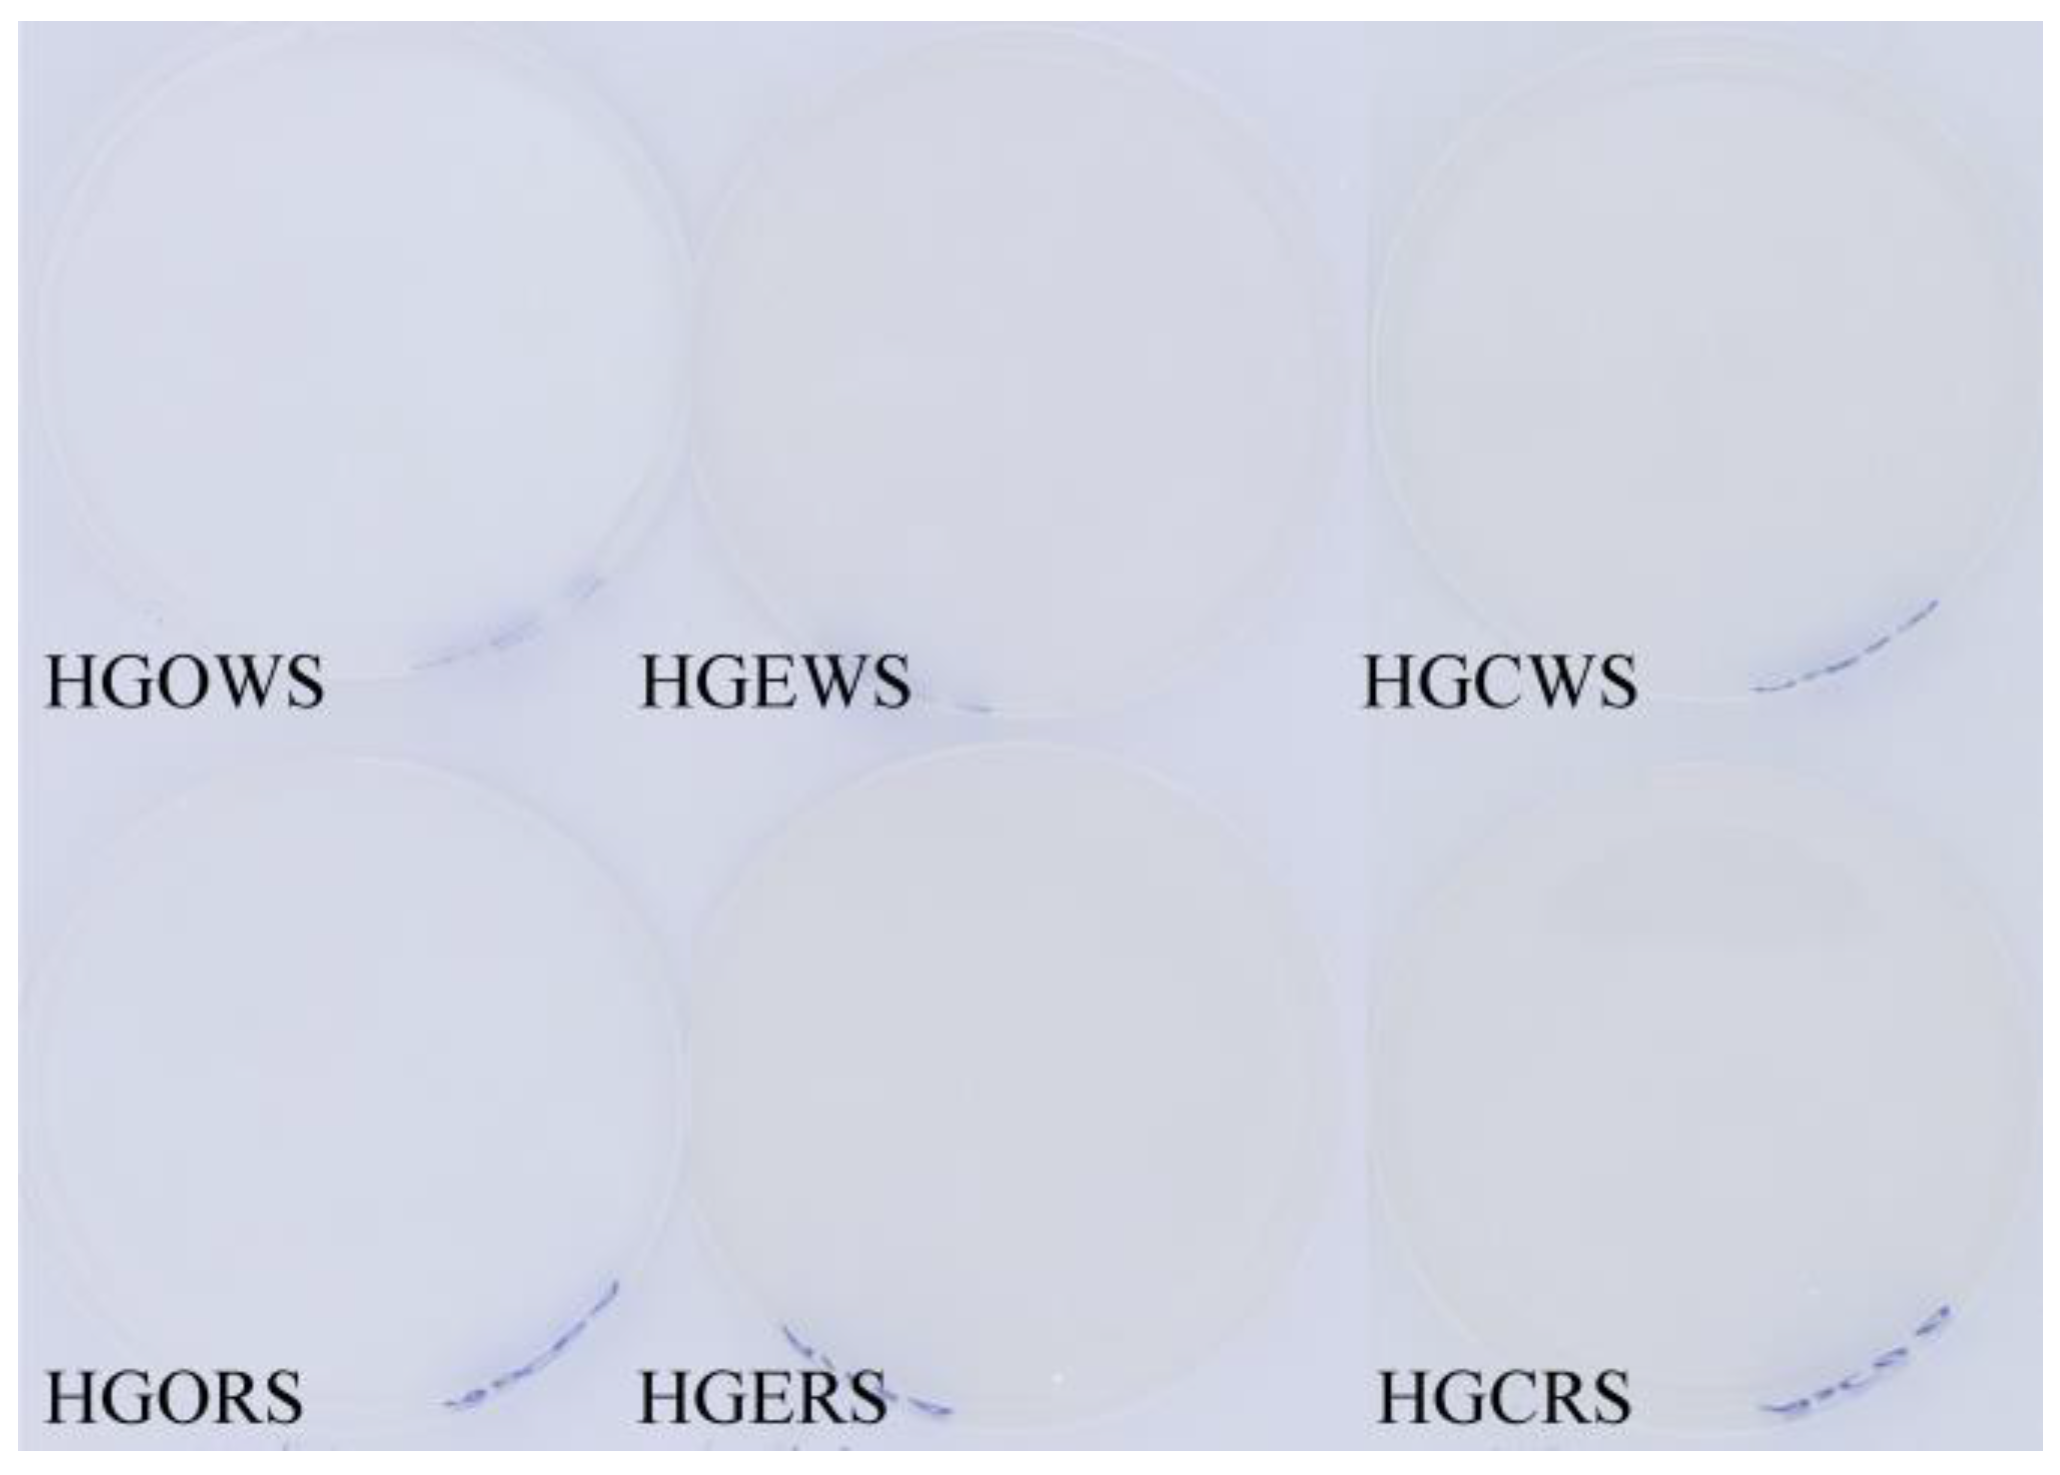
Figure 4.
Principal components analysis and discriminant function analysis of starch-protein Maillard complexes. (A) and (B) represent the PCA and DFA for HxRS conjugates, (C) and (D) represent the PCA and DFA for HxWS conjugates. (“■” represents HGOWS or HGORS, “♦” represents HGEWS or HGERS, “▲” represents HGCWS or HGCRS).
Figure 4.
Principal components analysis and discriminant function analysis of starch-protein Maillard complexes. (A) and (B) represent the PCA and DFA for HxRS conjugates, (C) and (D) represent the PCA and DFA for HxWS conjugates. (“■” represents HGOWS or HGORS, “♦” represents HGEWS or HGERS, “▲” represents HGCWS or HGCRS).
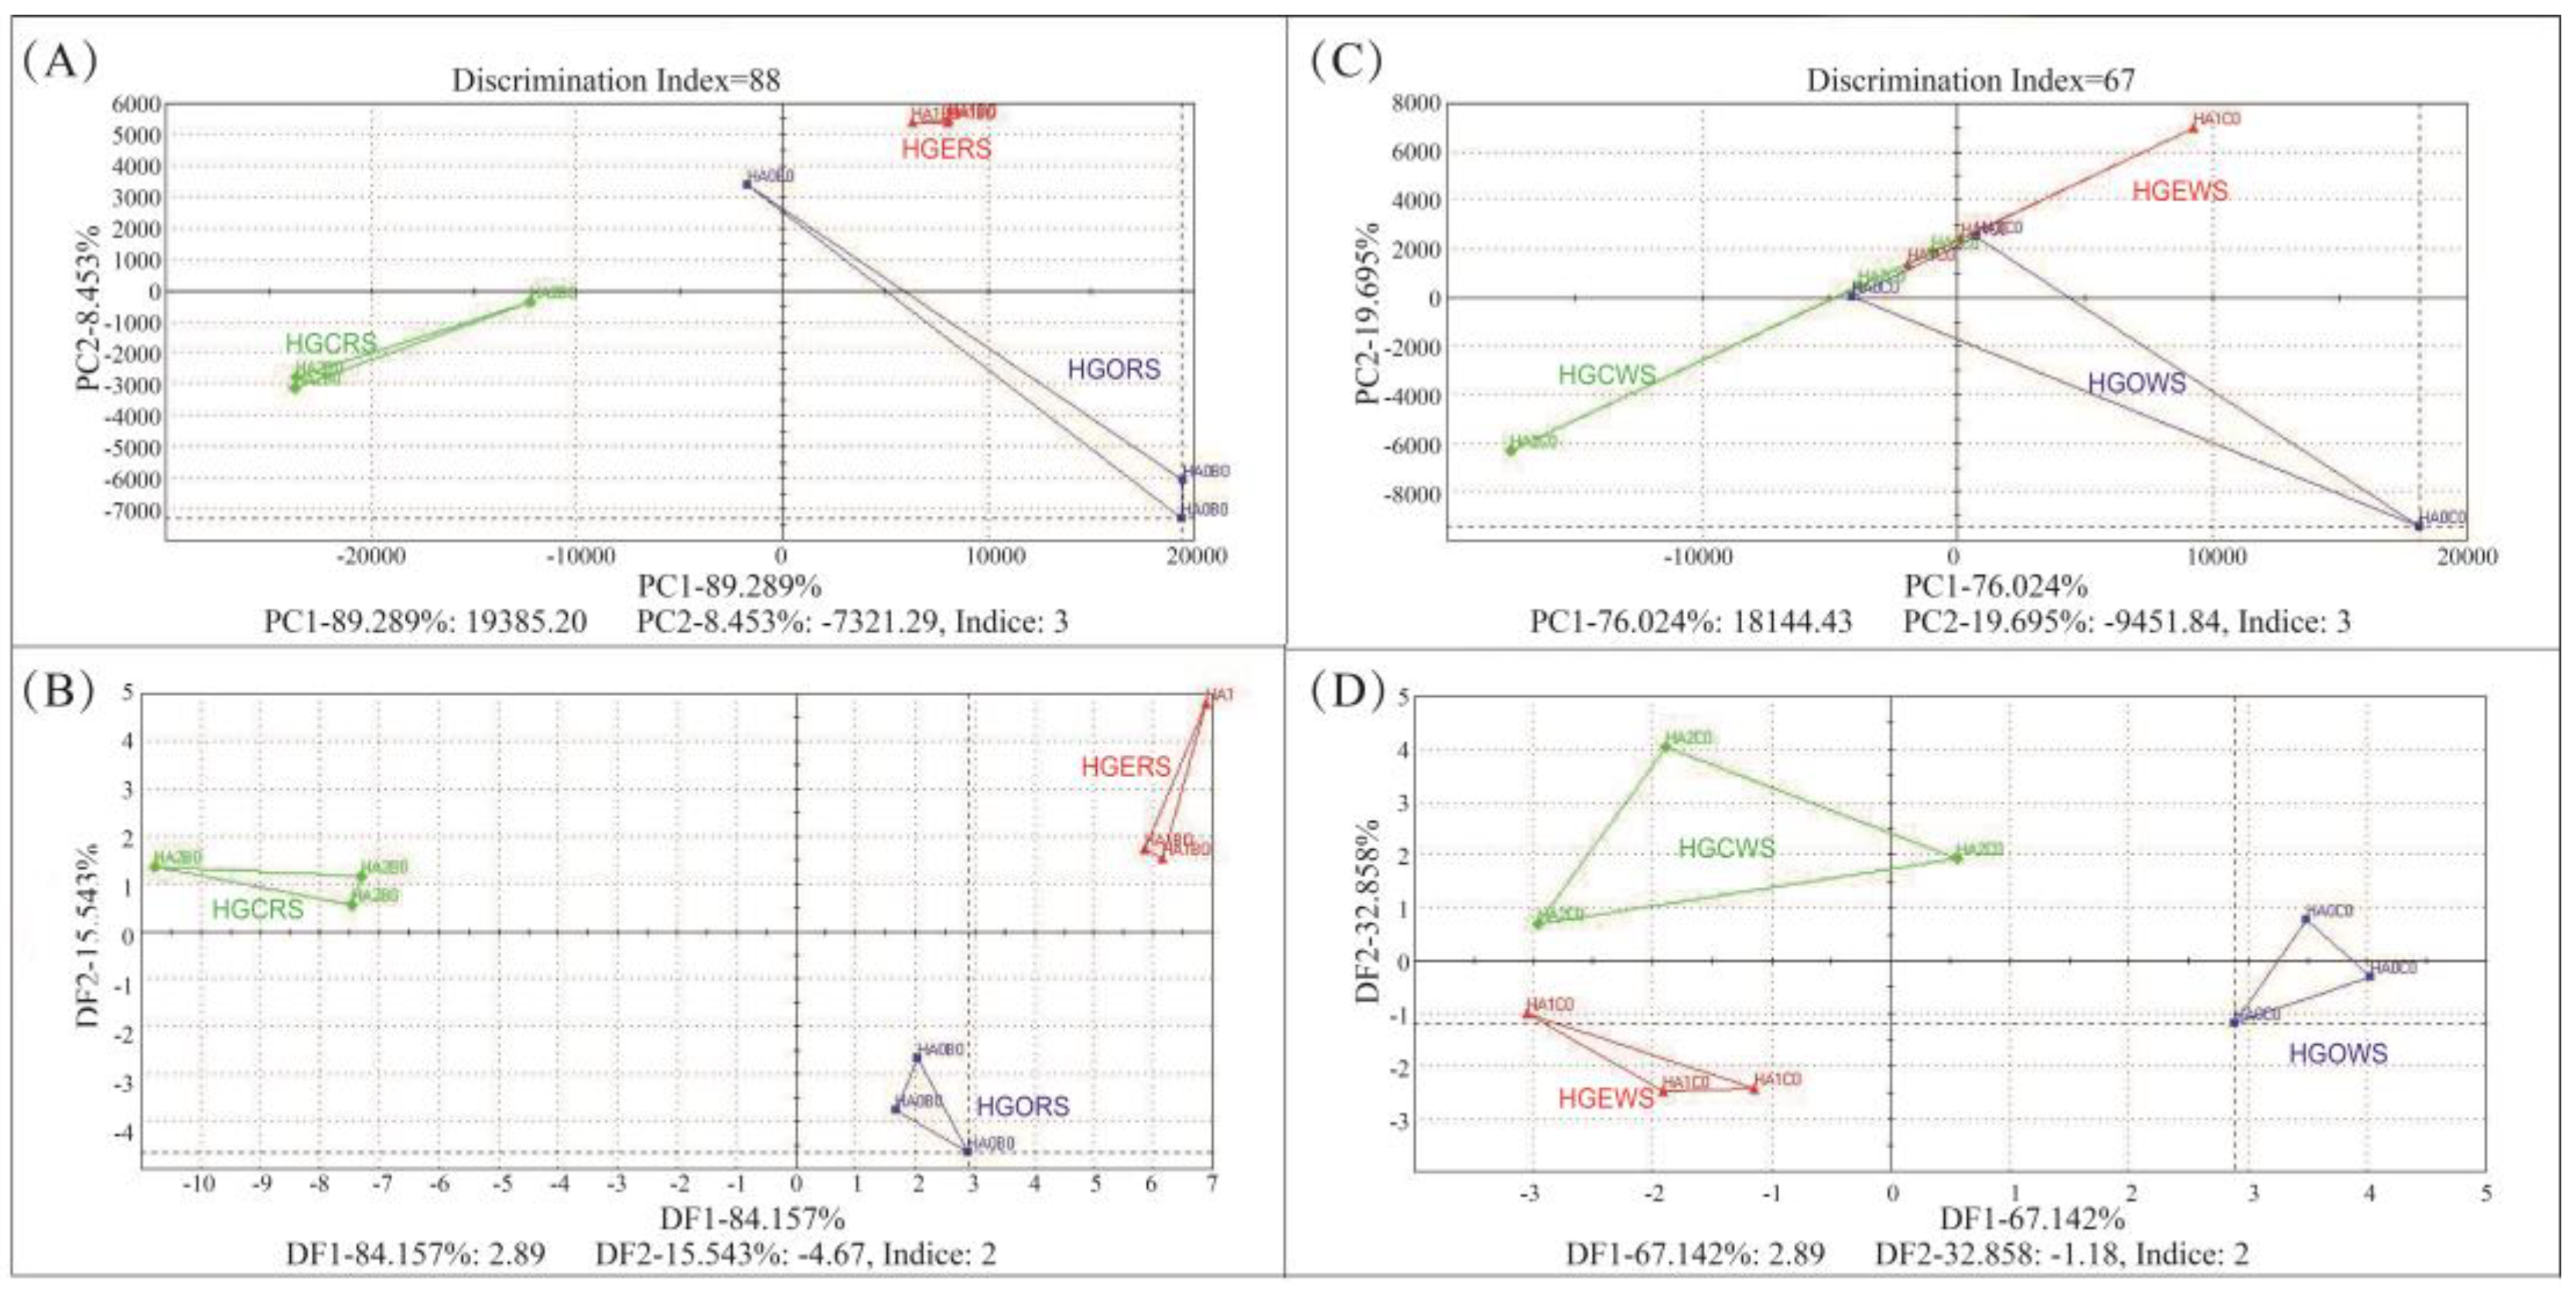
Figure 5.
Molecular interaction between starch maltodextrin (ligand) and gluten subunits (receptor). (A) Cluster of all 100 conformations of ligand with glutenin, (B) all the interaction between first lowest energy conformation of starch maltodextrin and glutenin, (C) the detailed hydrogen bond interaction between first lowest energy conformation of starch maltodextrin and glutenin (don: hydrogen bond donor, acc: hydrogen bond acceptor, accN: heavy atoms connected to acceptor atoms), (D) Cluster of all 100 conformations of ligand with gliadin, (E) all the interaction between first lowest energy conformation of starch maltodextrin gliadin, (F) the detailed hydrogen bond interaction between first lowest energy conformation of starch maltodextrin and gliadin, (G) all 100 conformations of ligand with glutenin (the epitopes shown in CPK, the red circle means the first conformation of the ligand), (H) all 100 conformations of ligand with gliadin (the epitopes shown in CPK, the red circle means the first conformation of the ligand).
Figure 5.
Molecular interaction between starch maltodextrin (ligand) and gluten subunits (receptor). (A) Cluster of all 100 conformations of ligand with glutenin, (B) all the interaction between first lowest energy conformation of starch maltodextrin and glutenin, (C) the detailed hydrogen bond interaction between first lowest energy conformation of starch maltodextrin and glutenin (don: hydrogen bond donor, acc: hydrogen bond acceptor, accN: heavy atoms connected to acceptor atoms), (D) Cluster of all 100 conformations of ligand with gliadin, (E) all the interaction between first lowest energy conformation of starch maltodextrin gliadin, (F) the detailed hydrogen bond interaction between first lowest energy conformation of starch maltodextrin and gliadin, (G) all 100 conformations of ligand with glutenin (the epitopes shown in CPK, the red circle means the first conformation of the ligand), (H) all 100 conformations of ligand with gliadin (the epitopes shown in CPK, the red circle means the first conformation of the ligand).
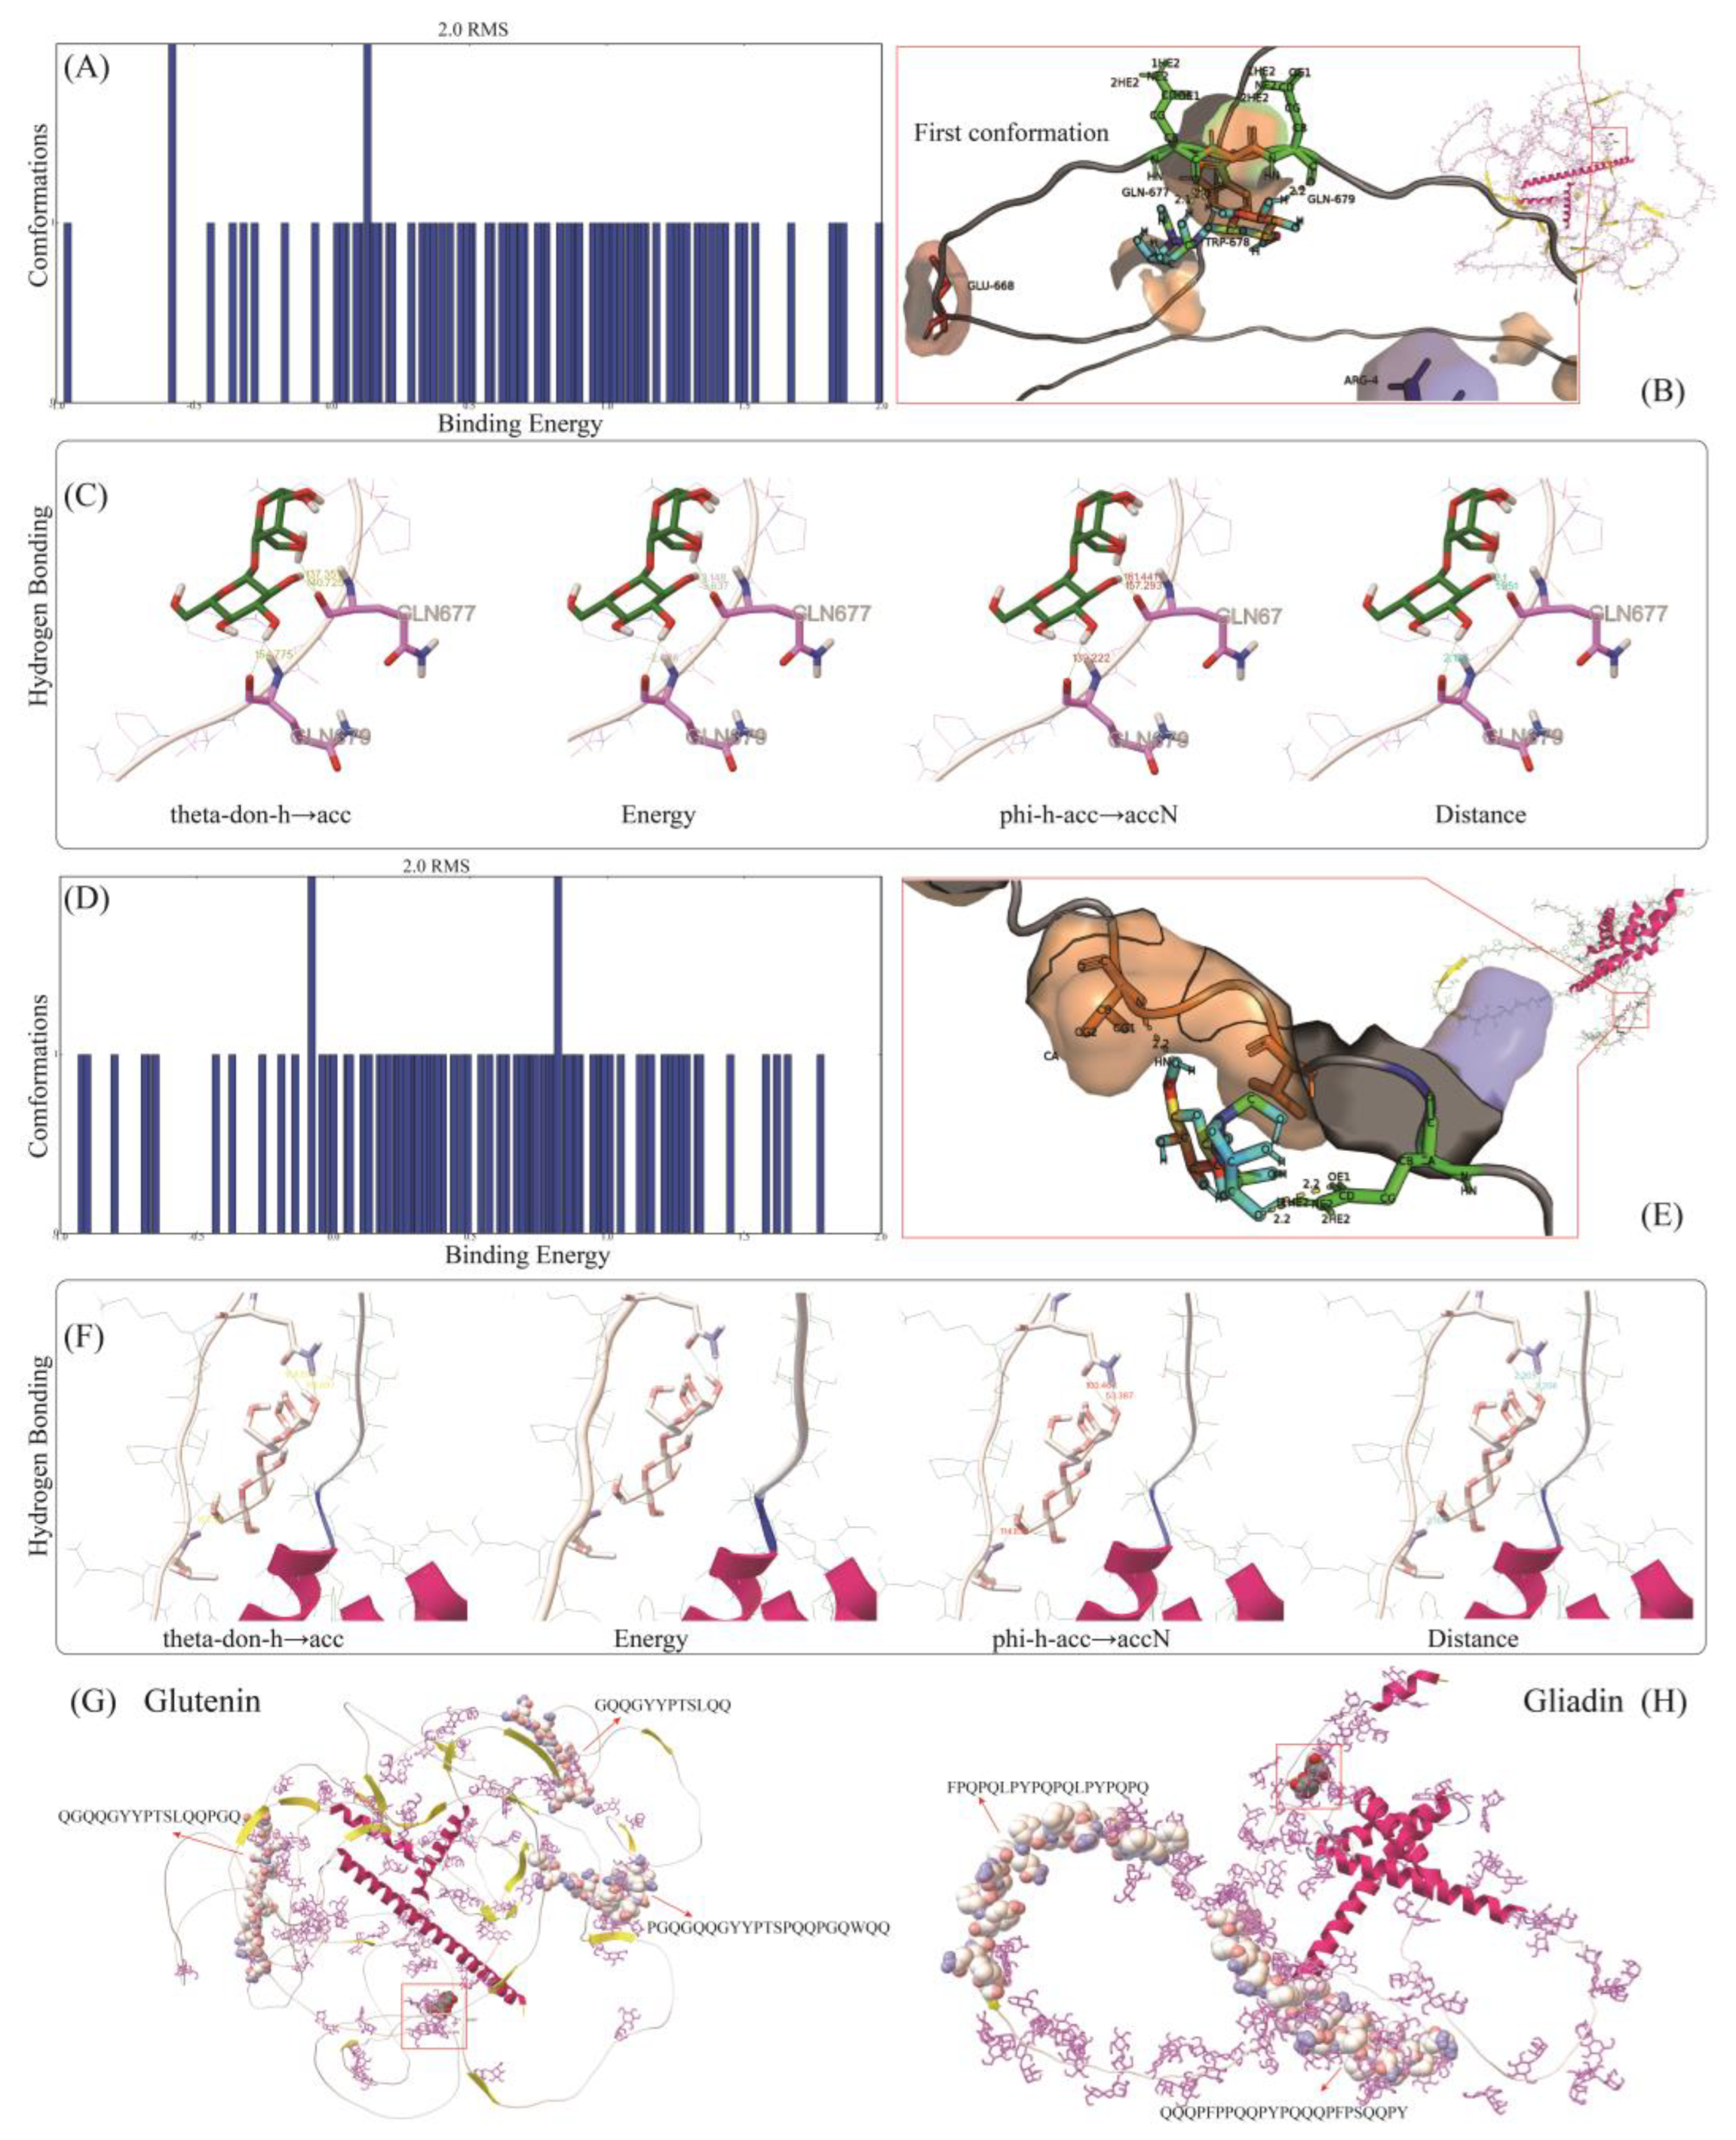
Figure 6.
UMAP projections of 10,000 rigid-body conformations of protein-starch Maillard complexes landscape based on residue binding patterns, colored by animo acid-glucose residues interface contact fingerprints (residue contact threshold < 5.0 Å, the solid red line marks the boundary between the protein sequence and the starch fragment sequence). (A) Gliadin and rice amylopectin, (B) gliadin and rice amylose, (C) gliadin and wheat amylose, (D) gliadin and wheat amylopectin, (E) glutenin and rice amylopectin, (F) glutenin and rice amylose, (G) glutenin and wheat amylose, (H) glutenin and wheat amylopectin.
Figure 6.
UMAP projections of 10,000 rigid-body conformations of protein-starch Maillard complexes landscape based on residue binding patterns, colored by animo acid-glucose residues interface contact fingerprints (residue contact threshold < 5.0 Å, the solid red line marks the boundary between the protein sequence and the starch fragment sequence). (A) Gliadin and rice amylopectin, (B) gliadin and rice amylose, (C) gliadin and wheat amylose, (D) gliadin and wheat amylopectin, (E) glutenin and rice amylopectin, (F) glutenin and rice amylose, (G) glutenin and wheat amylose, (H) glutenin and wheat amylopectin.
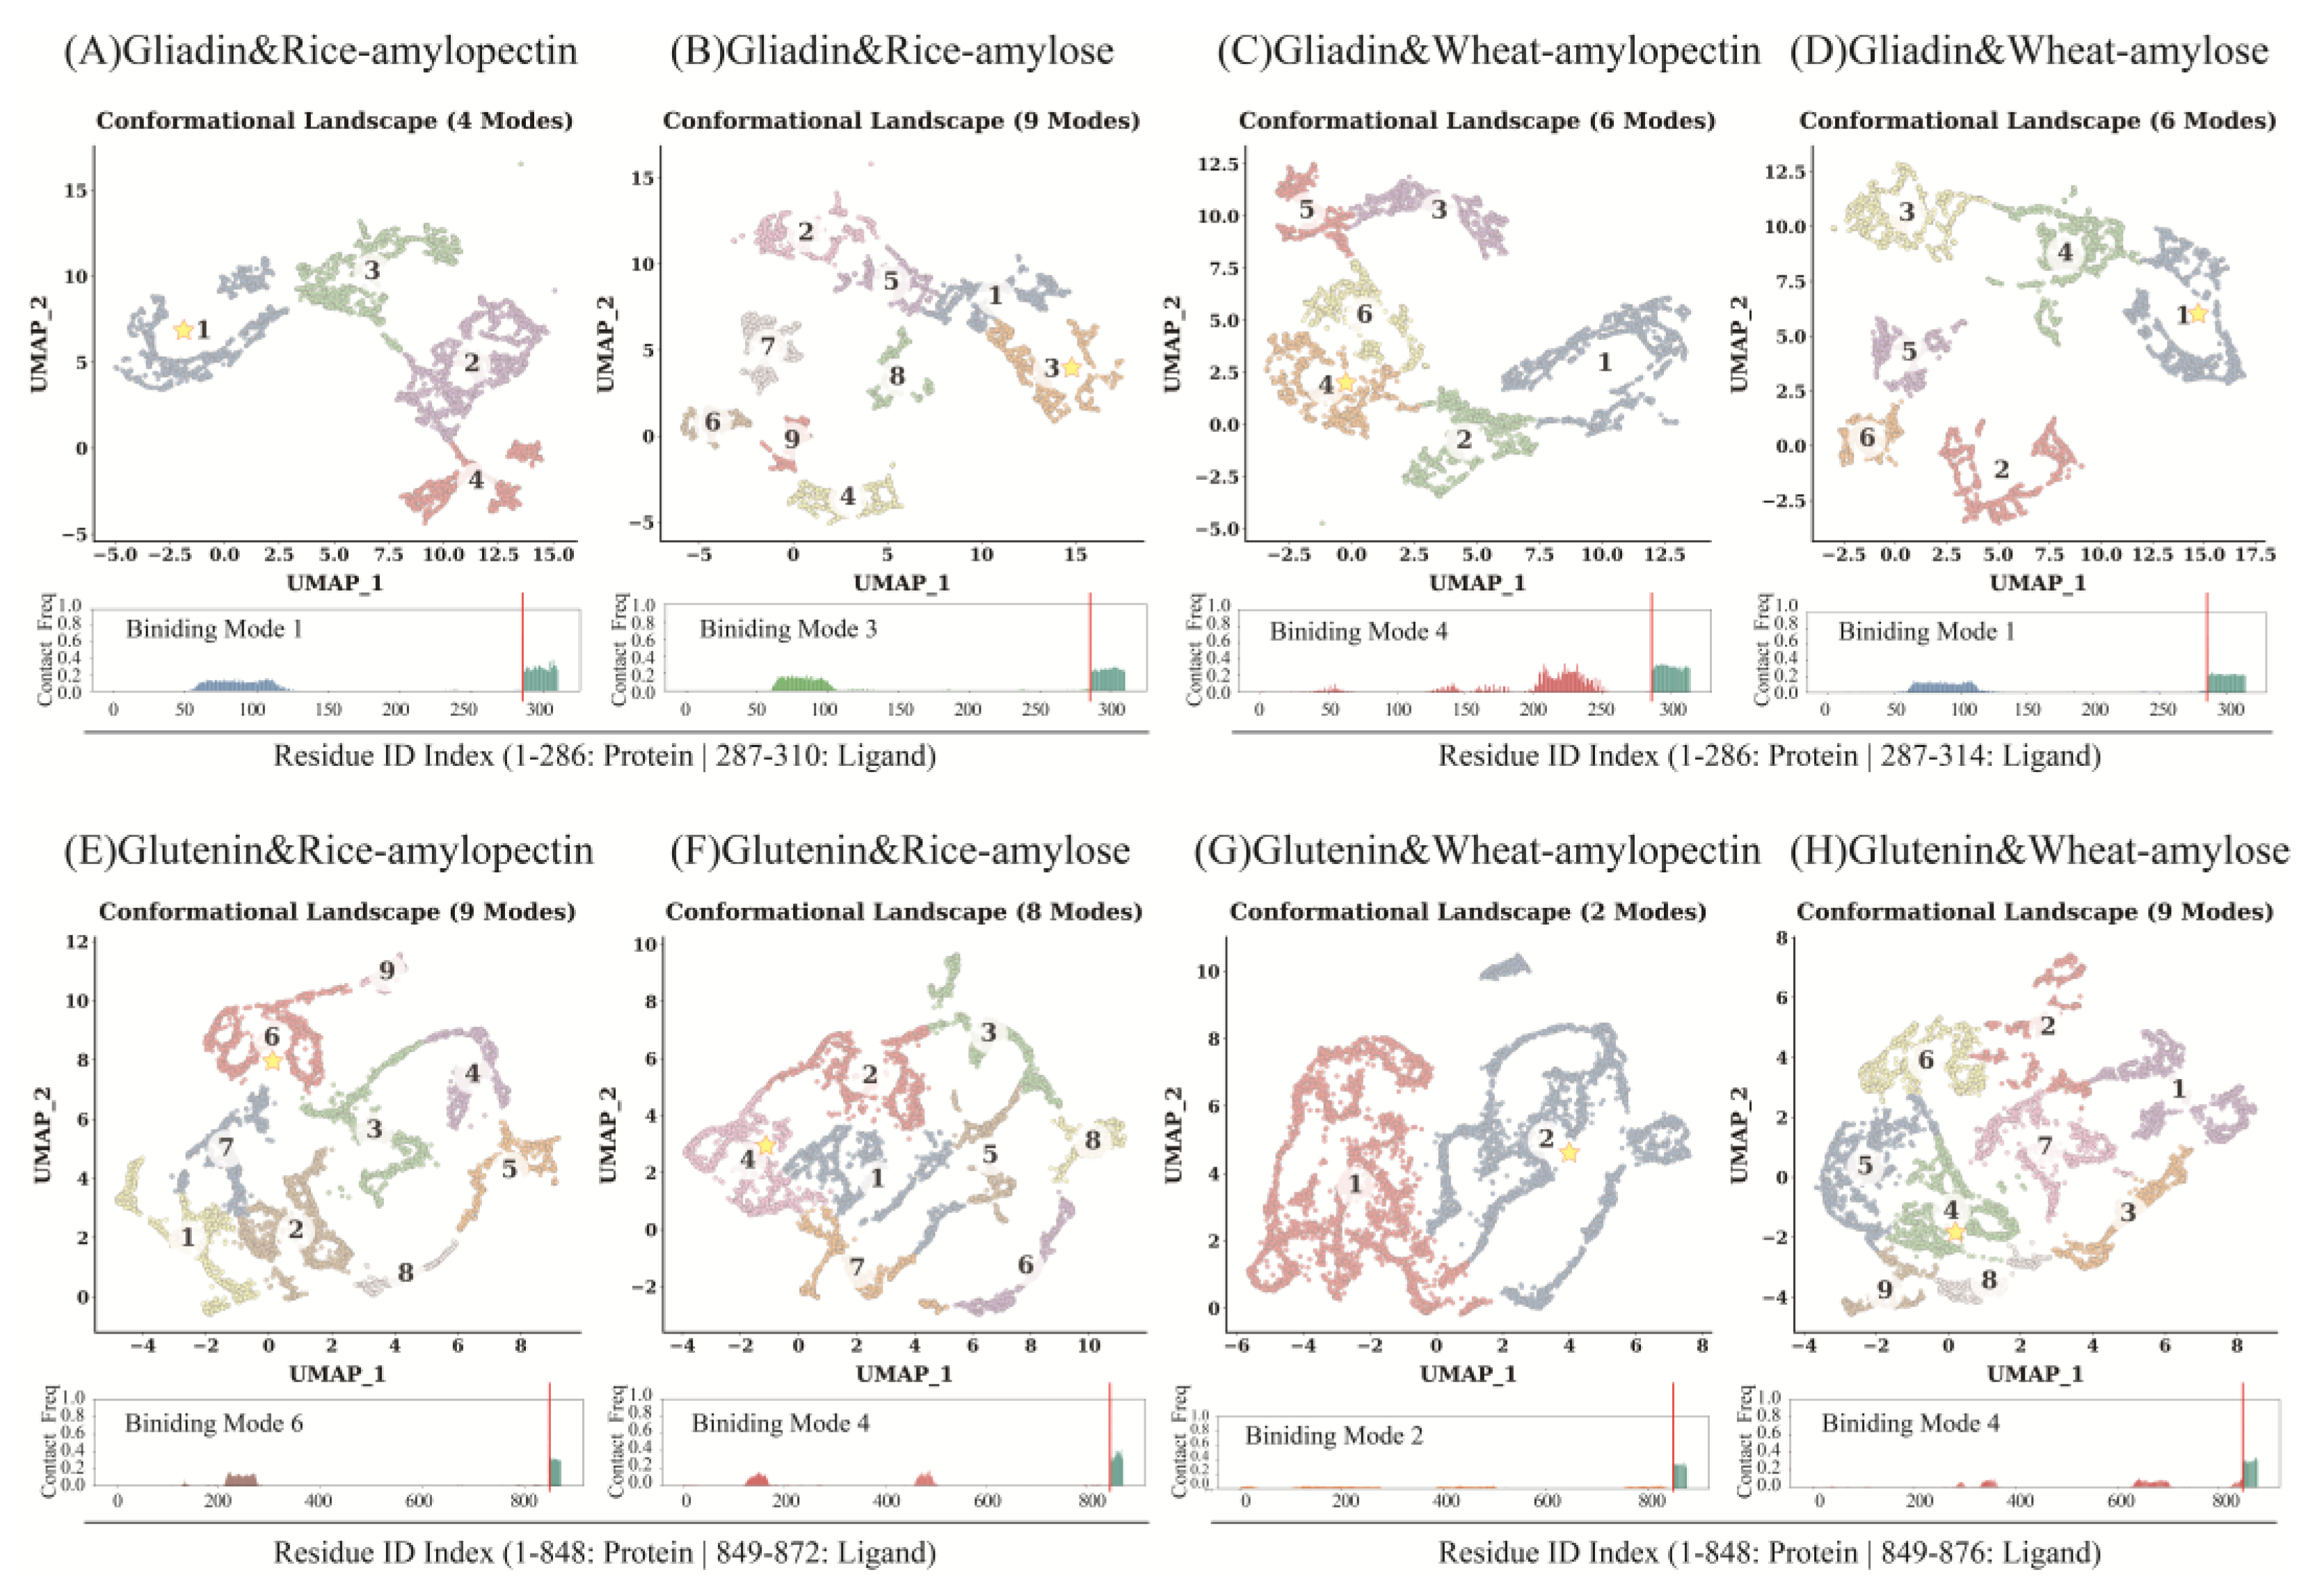
Figure 7.
Distribution of HADDOCK docking results and identification of the optimal conformation. (A) Gliadin and rice amylopectin, (B) gliadin and rice amylose, (C) gliadin and wheat amylose, (D) gliadin and wheat amylopectin, (E) glutenin and rice amylopectin, (F) glutenin and rice amylose, (G) glutenin and wheat amylose, (H) glutenin and wheat amylopectin. (wheat: protein subunits, red: AAs that form H-bonds within protein subunits, blue: starch fragments, green: glucose that form hydrogen bonds within starch fragments.).
Figure 7.
Distribution of HADDOCK docking results and identification of the optimal conformation. (A) Gliadin and rice amylopectin, (B) gliadin and rice amylose, (C) gliadin and wheat amylose, (D) gliadin and wheat amylopectin, (E) glutenin and rice amylopectin, (F) glutenin and rice amylose, (G) glutenin and wheat amylose, (H) glutenin and wheat amylopectin. (wheat: protein subunits, red: AAs that form H-bonds within protein subunits, blue: starch fragments, green: glucose that form hydrogen bonds within starch fragments.).
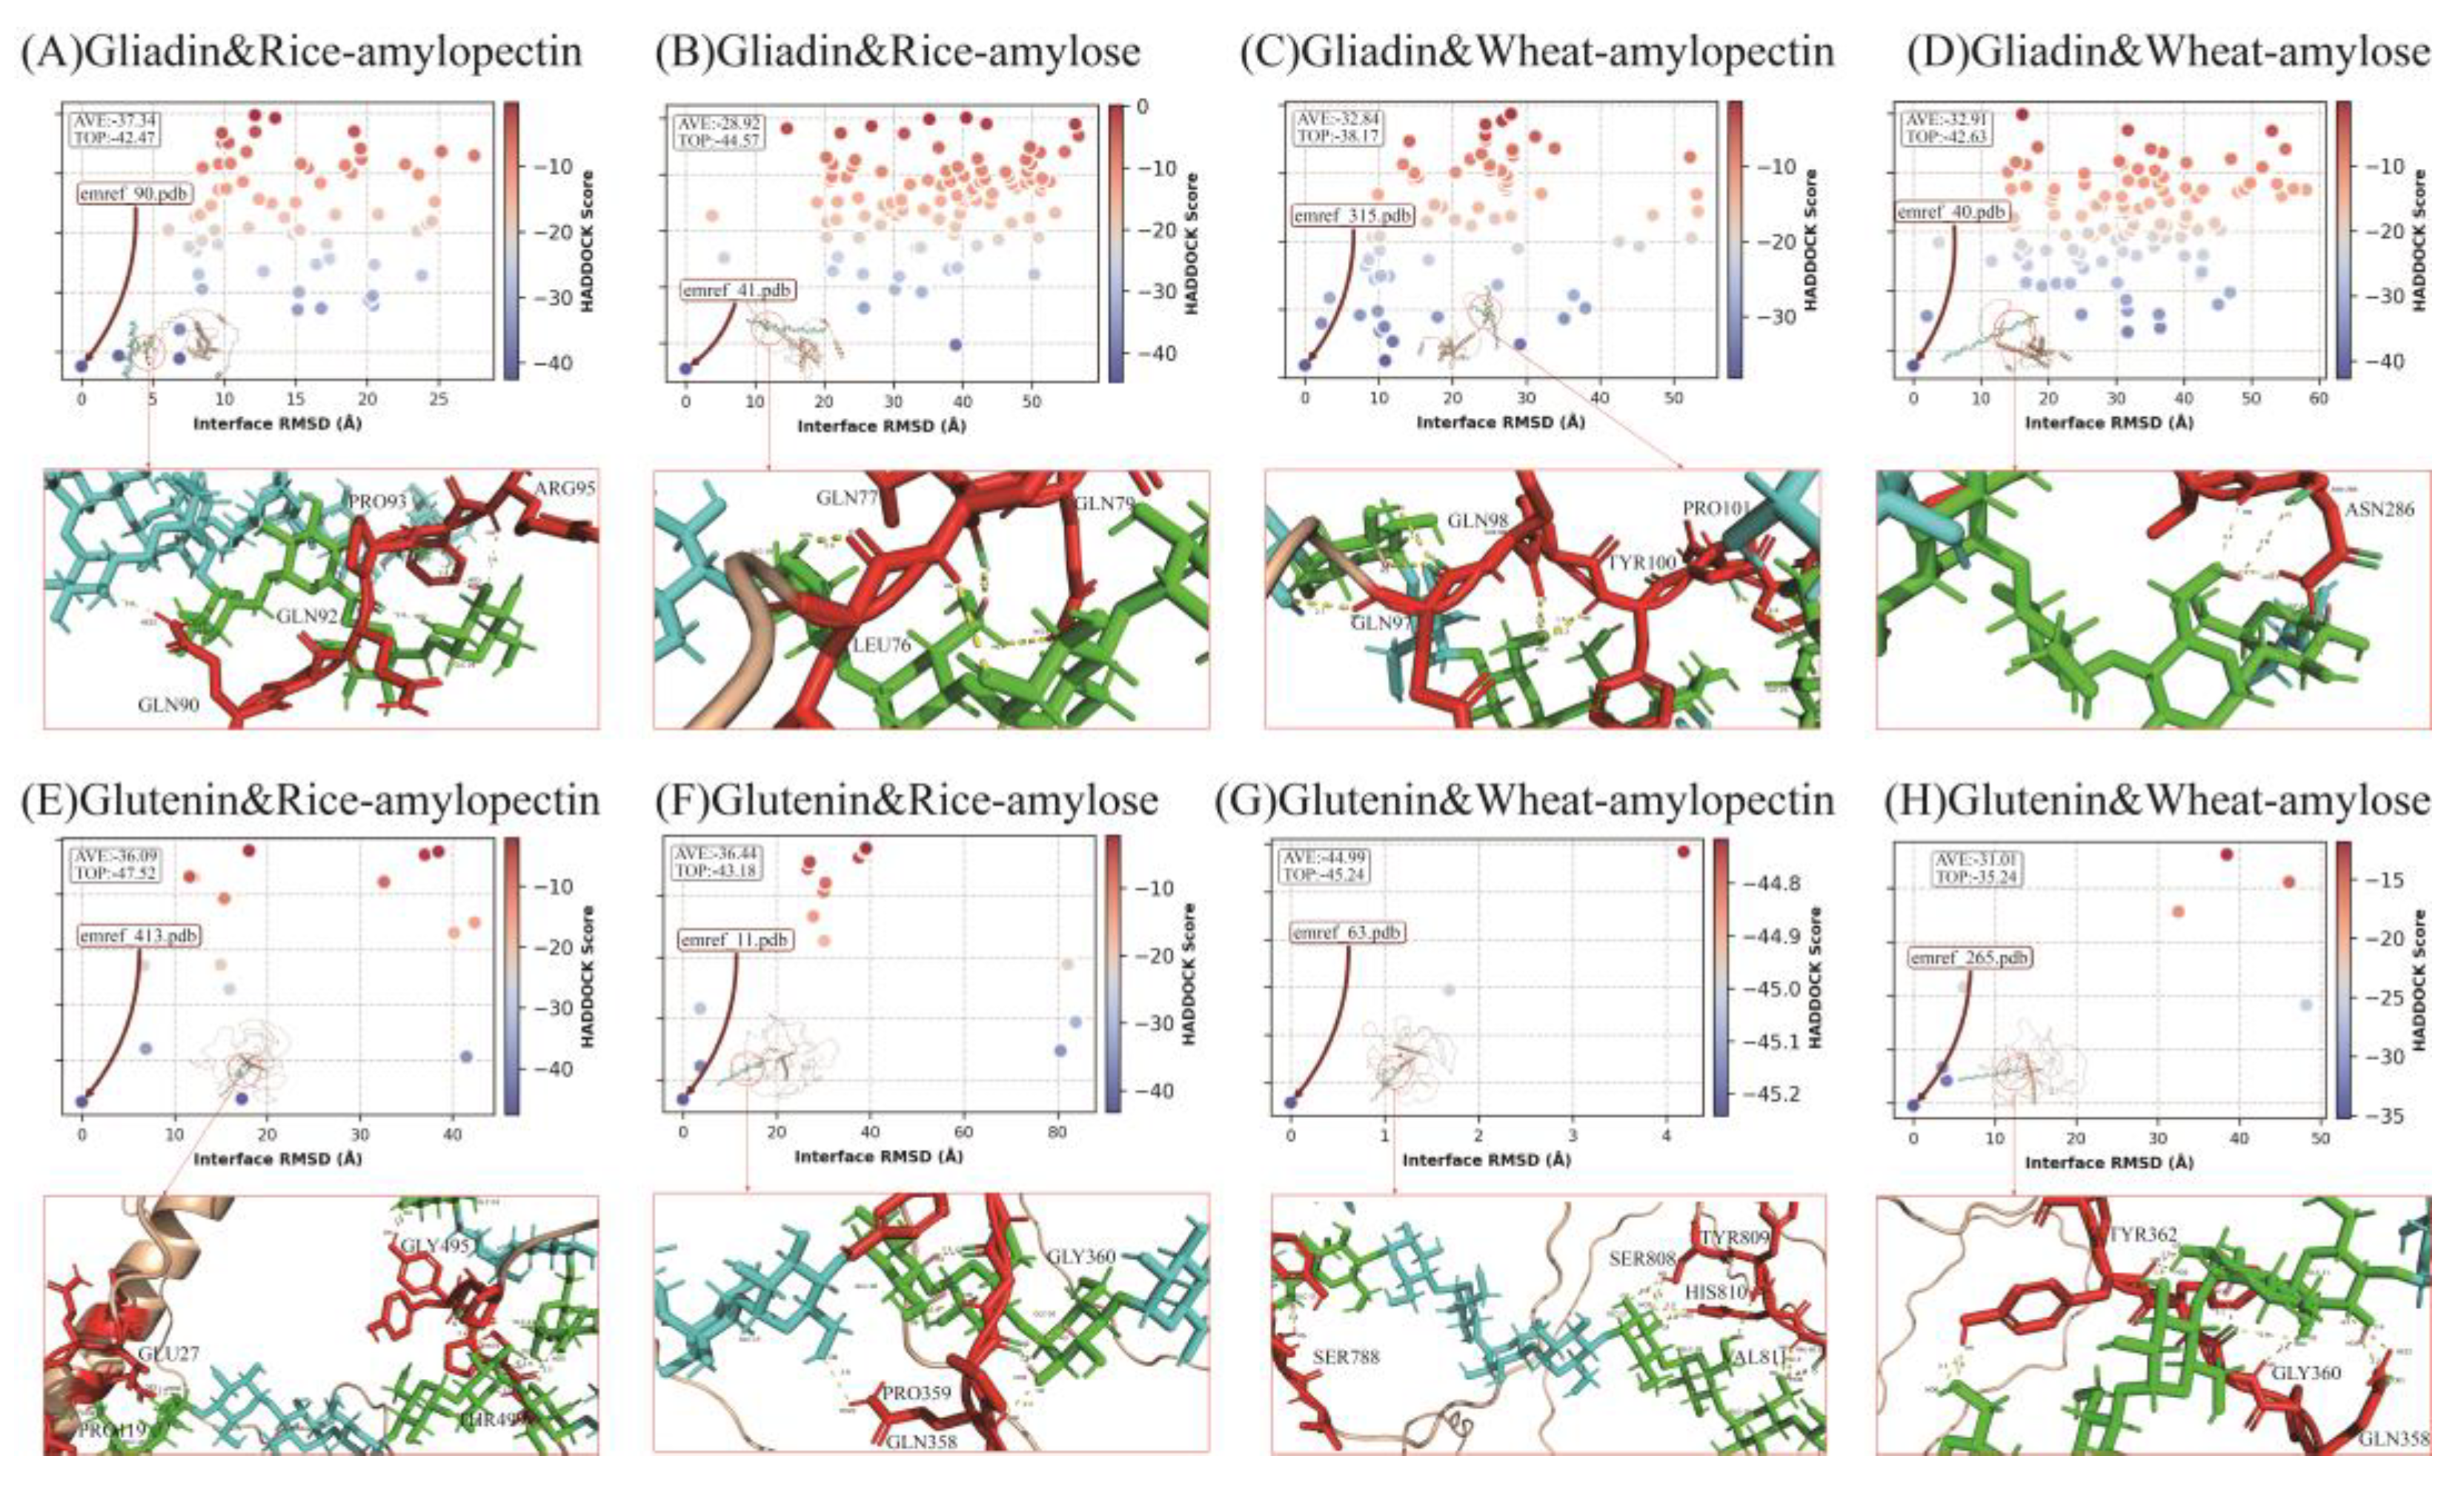

Table 1.
The AAs compositions of gluten hydrolysates.
| % (taste) | GO | GE | GC | Gluten [49] |
|---|---|---|---|---|
| Cys (sulfurous/bitter) | 0.81 | 1.63 | 1.34 | 2.23 |
| Met (sulfurous/bitter) | 0.09 | 0.48 | 0.04 | 1.02 |
| Phe (bitter) | 4.83 | 4.82 | 4.76 | 3.70 |
| Ile (bitter) | 2.38 | 2.71 | 2.70 | 3.38 |
| Leu (bitter/flat) | 5.30 | 5.21 | 5.27 | 6.16 |
| Val (bitter/slightly sweet) | 3.20 | 3.36 | 3.33 | 4.05 |
| Pro (sweet/slightly bitter) | 13.57 | 13.56 | 13.04 | 18.8 |
| Gly (sweet) | 3.97 | 3.62 | 3.82 | 5.89 |
| Ala (sweet) | 2.45 | 2.19 | 2.29 | 3.81 |
| Tyr (bitter) | 2.85 | 3.01 | 3.12 | 2.07 |
| Thr (sweet) | 2.49 | 2.11 | 2.34 | 3.06 |
| Ser (sweet) | 4.37 | 4.11 | 4.47 | 5.72 |
| His (bitter) | 3.55 | 4.44 | 3.79 | 4.29 |
| Arg (bitter) | 3.26 | 3.54 | 3.96 | 3.62 |
| Lys (bitter/sweet) | 1.46 | 1.19 | 1.49 | 1.98 |
| Glx(Glu+Gln) (umami/sour/slightly sweet) | 42.59 | 41.75 | 41.31 | 26.2 |
| Asx(Asp+Asn) (umami/sour/slightly sweet or slightly bitter) |
2.81 | 2.28 | 2.93 | 3.37 |
Table 2.
The sum of AAs taste of gluten hydrolysates based on AAs compositions
| Taste (%) [51,52,53,54] | GO | GE | GC |
|---|---|---|---|
| Sulfurous(Cys+Met) | 0.90 | 2.11 | 1.38 |
| Sweet(Gly+Ala+Thr+Ser) | 13.28 | 12.03 | 12.92 |
| Sour(Glx(Glu+Gln)+Asx(Asp+Asn)) | 45.40 | 44.03 | 44.24 |
| Umami(Glx(Glu+Gln)+Asx(Asp+Asn)) | 45.40 | 44.03 | 44.24 |
| Bitter(Phe+Ile+Leu+Tyr+His+Arg) | 22.17 | 23.73 | 23.60 |
| Mixed and complex flavor(Val+Pro+Lys) | 18.23 | 18.11 | 17.86 |
Table 3.
The electronic eye colorimetry of gluten derived MRCPs
| Sample | L* | a* | b* | C* | W* | ΔE* |
|---|---|---|---|---|---|---|
| HGOWS | 96.90 ± 0.08a | -0.50 ± 0.14b | -5.35 ± 0.15a | 5.37 ± 0.13c | 80.76 ± 0.96a | 0.93 ± 0.64a |
| HGORS | 96.05 ± 0.37ab | -0.57 ± 0.04b | -6.81 ± 0.64bc | 6.83 ± 0.64ab | 68.70 ± 5.84b | 0.32 ± 0.30a |
| HGEWS | 95.23 ± 0.06bc | 0.22 ± 0.01a | -7.00 ± 0.41bc | 7.01 ± 0.41a | 64.06 ± 3.14b | 1.01 ± 0.69a |
| HGERS | 94.54 ± 0.21bc | 0.32 ± 0.00a | -6.24 ± 0.13abc | 6.24 ± 0.14abc | 65.56 ± 0.28b | 0.63 ± 0.08a |
| HGCWS | 94.93 ± 0.56c | -0.56 ± 0.01b | -6.09 ± 0.00abc | 6.11 ± 0.00abc | 68.35 ± 2.83b | 0.67 ± 0.28a |
| HGCRS | 94.36 ± 0.03c | -0.44 ± 0.01b | -5.70 ± 0.11ab | 5.72 ± 0.11bc | 67.78 ± 0.76b | 0.25 ± 0.24a |
Note: lightness (L: 0 = black, 100 = white), red-green value (a: +a = red, -a = green), yellow-blue value (b: +b = yellow, -b = blue), whiteness (W*), chroma (C*), and color difference (ΔE*).
Table 4.
Detected volatile compounds, relative index and sensory descriptors of MRCPs.
| Sample | Odor Description | Major Compound Name (Relevance index) |
| HGOWS | Smoky roasted flavor | 2-Acetylthiazoline (74.30), Dimethyl trisulfide (44.29), Guaiacol (95.52), Indole (38.26), Methanethiol (47.34), Methional (73.62), Methyl cinnamate (32.56), 2,3-Pentanedione (89.35) |
| HGEWS | Fresh wheat notes, creamy sweet notes, light roasted notes and fermented undertone | Beta-ionone (45.62), Bis(2-methyl-3-furanyl)disulfide (69.35), Hexanal (92.25), Indole (70.79), Methanethiol (42.16), 2-Methylthiophene (74.68), Myristicin (86.80), 2,3-Pentanedione (96.01) |
| HGCWS | Pure and full spicy wheat aroma, close to native wheat flavor | Hexanal (93.99), Indole (56.45), Isoeugenol (85.64), Methanethiol (47.50), 2-Methyl-2-propanol (67.09), 3-Methylbutanal (74.46), Myristicin (83.10), Skatole (65.07) |
| HGORS | Minimal and pure basic roasted cereal aroma | Hexyl heptanoate (32.96), Indole (38.26), Methanethiol (46.23), Myristicin (81.17), Trans-4,5-epoxy-(E)-2-decenal (30.25) |
| HGERS | Full and rich creamy & roasted complex flavor, sufficient Maillard aroma | Bis(2-methyl-3-furanyl) disulfide (75.54), Hexanal (90.15), Indole (50.05), Isoeugenol (51.84), Methanethiol (45.91), 3-Methylbutanal (64.68), 2-Methylthiophene (77.58), Myristicin (84.97), 2,3-Pentanedione (97.09), Skatole (38.24) |
| HGCRS | Fresh and pure raw cereal wheat aroma, close to native wheat protein flavor | Hexanal (94.62), Indole (48.59), Methanethiol (46.72), Methyl eugenol (64.11), Myristicin (85.89), 2-Methyl-2-propanol (65.40), 3-Methylbutanal (76.62), Trans-4,5-epoxy-(E)-2-decenal (30.01) |
Table 5.
Diversity analysis and comparison of various MRCPs.
| Product names | Reference samples | Distances | Percent value | Pattern discrimination index (%) |
|---|---|---|---|---|
| HGOWS | HGEWS | 10248.78 | 0.00 | 28.23 |
| HGOWS | HGCWS | 32328.65 | 0.00 | 76.13 |
| HGEWS | HGCWS | 28362.75 | 0.00 | 90.88 |
| HGORS | HGERS | 6837.78 | 0.00 | 13.29 |
| HGORS | HGCRS | 12989.53 | 0.00 | 31.2 |
| HGERS | HGCRS | 11301.58 | 0.00 | 39.48 |
Table 6.
Gluten content of various MRCPs.
| Sample | Gluten content ppm (mg/kg) |
|---|---|
| HGOWS | 28.32 ± 1.24a |
| HGORS | 25.11 ± 0.81a |
| HGEWS | 16.56 ± 2.48b |
| HGERS | 14.35 ± 0.82b |
| HGCWS | 8.31 ± 0.63c |
| HGCRS | 9.82 ± 0.85c |
Table 7.
Docking score, energy profile and binding modes of gluten subunits and starch fragments composite
Table 7.
Docking score, energy profile and binding modes of gluten subunits and starch fragments composite
| Smaples (best binding mode of Rigidbody state) | Rigidbody state | Emref state | ||||||
|---|---|---|---|---|---|---|---|---|
| High-frequency binding AAs of best mode [82]1 | Score2 | Score2 | bsa | desolv | elec | vdw | total | |
| Gliadin&Rice-amylopectin (1) | 60-113 | -12.1 | -44.6 | 749.9 | -3.8 | -18.8 | -37.1 | -55.8 |
| Gliadin&Rice-amylose (3) | 61-101 | -10.5 | -42.5 | 510.0 | -5.5 | -17.4 | -33.5 | -50.9 |
| Gliadin&Wheat-amylopectin (4) | 40-59, 202-248 | -7.1 | -38.2 | 689.9 | -4.4 | -25.3 | -28.8 | -54.0 |
| Gliadin&Wheat-amylose (1) | 63-111 | -12.0 | -42.6 | 682.8 | -6.3 | -16.1 | -33.1 | -49.2 |
| Glutenin&Rice-amylopectin (6) | 111-120, 494-629 | -13.8 | -43.2 | 539.6 | 0.1 | -35.8 | -36.1 | -71.8 |
| Glutenin&Rice-amylose (4) | 284-306, 323-368, 635-712, 826-848 | -5.2 | -47.5 | 657.0 | -0.7 | -45.1 | -37.9 | -82.9 |
| Glutenin&Wheat-amylopectin (2) | 110-276, 388-503, 753-848 | -10.0 | -45.2 | 616.4 | -11.5 | -36.5 | -26.4 | -62.9 |
| Glutenin&Wheat-amylose (4) | 284-301, 632-712, 826-848 | -7.0 | -35.2 | 304.4 | -6.9 | -17.0 | -25.0 | -41.9 |
Note: vdw (van der Waals) and elec (electrostatic) forces are favorable binding forces, desolv (desolvation) incurs energy consumption cost, bsa aids in characterizing the degree of hydrophobic burial, total represents the final overall binding energy, Etotal = Evdw(LJ) + Eelec(Coulomb) + Edesolv + EBSA(penalty). 1 Ten thousand HADDOCK3 rigid-body docking poses were clustered by Ward’s linkage hierarchical agglomerative clustering and visualized via UMAP embedding (Python & R coding). Raw contact frequency (RawFreq) and energy-weighted frequency (EnergyWeightedFreq) at residue-level for each binding cluster were obtained from per-residue energy decomposition and compiled into a supplementary CSV dataset for identifying dominant protein–starch binding AAs and glucose. 2 This score represents the optimal binding conformation with the lowest energy at the corresponding stage.
Disclaimer/Publisher’s Note: The statements, opinions and data contained in all publications are solely those of the individual author(s) and contributor(s) and not of MDPI and/or the editor(s). MDPI and/or the editor(s) disclaim responsibility for any injury to people or property resulting from any ideas, methods, instructions or products referred to in the content. |
© 2026 by the authors. Licensee MDPI, Basel, Switzerland. This article is an open access article distributed under the terms and conditions of the Creative Commons Attribution (CC BY) license.
Copyright: This open access article is published under a Creative Commons CC BY 4.0 license, which permit the free download, distribution, and reuse, provided that the author and preprint are cited in any reuse.


