
Submitted:
29 July 2026
Posted:
29 July 2026
You are already at the latest version
Abstract
Territorial space use efficiency (TSUE) is a core indicator characterizing regional sustainable development. Nevertheless, existing studies have not established a systematic quantitative system to assess sustainable development status based on TSUE. From the perspective of production-living-ecological spaces, this study constructs a multi-dimensional efficiency evaluation framework for sustainable territorial management. This study adopts geographic data envelopment analysis (GeoDEA), spatial autocorrelation analysis and multi-scale geographically weighted regression (MGWR). It calculates TSUE, uses efficiency levels to characterize and identify territorial sustainable development status, and further reveals the spatiotemporal evolution characteristics and driving mechanisms of regional sustainable development. The results indicate that the regional sustainable development level reflected by TSUE generally shows fluctuating evolution, with distinct phase transitions emerging around 2010. Merely 20% of cities attain medium-high or higher sustainability levels, and spatial imbalance is prominent nationwide. Areas with high-efficiency production and living spaces are mainly clustered in eastern and central China, while highly sustainable ecological spaces concentrate in western and northeastern China. In addition, driving factors exert significantly heterogeneous effects on the three types of territorial functional spaces. This study provides scientific references for implementing differentiated territorial spatial governance and advancing sustainable territorial development.
Keywords:
territorial space use efficiency
; production-living-ecological spaces
; geographic data envelopment analysis
; sustainable development
; functional zoning
; spatial agglomeration
; influencing factors
1. Introduction
Urbanization is the core driving force of global land use transformation and territorial spatial restructuring. According to statistics, the global urbanization rate has increased by more than 40 percentage points since the 20th century, reaching 60% currently and expected to rise to 68% by 2050 [1,2,3]. Rapid urbanization has profoundly reshaped territorial spatial patterns and brought severe challenges to the sustainable utilization and refined governance of limited territorial space resources [4,5]. Continuous urban expansion has encroached on natural ecological spaces such as croplands, woodlands and wetlands [6], triggering the degradation of ecosystem services and biodiversity loss, which greatly restrict the sustainable development of territorial space. As the world’s most populous developing country experiencing rapid urbanization, China faces more acute human-land conflicts and prominent territorial governance dilemmas. By 2024, China’s urbanization rate had reached 67%. The superposition of rapid urban development, huge population demand and scarce territorial resources further complicates the structural and functional contradictions in the process of territorial space development and utilization [8,9,10]. Against this background, the extensive and unsustainable mode of territorial space exploitation can no longer meet the needs of sustainable governance. Therefore, the accurate evaluation and improvement of Territorial Space Use Efficiency (TSUE) has become a core breakthrough to break through the bottleneck of territorial space development and realize sustainable territorial management.
TSUE is a core indicator that measures the matching level between all factor inputs of territorial resources and comprehensive benefit outputs. Its scientific evaluation is an important prerequisite for territorial space regulation, functional optimization and sustainable governance. The evaluation methods of TSUE have been continuously developed and improved in academic circles. Early studies mostly adopted single-index evaluation models for efficiency measurement [11,12,13]. On this basis, scholars have gradually constructed multi-index comprehensive evaluation frameworks by integrating entropy weighting, analytic hierarchy process, principal component analysis, fuzzy comprehensive evaluation and other methods [14]. Current mainstream evaluation systems are built on the input-output framework, which can be divided into parametric and non-parametric models [15,16]. Among them, non-parametric models are mainly represented by Data Envelopment Analysis (DEA) and its extended models, including generalized DEA and Malmquist models [17,18,19,20]. Such models do not require predefined production functions and are suitable for efficiency evaluation with multiple inputs and multiple outputs [21].
However, the existing TSUE evaluation systems still have obvious methodological defects and research gaps, which cannot support the refined and differentiated sustainable governance of territorial space, and lack a multi-dimensional evaluation system adapted to functional zoning. There are two key unsolved scientific problems. First, mainstream efficiency evaluation models ignore the inherent geographical attributes of territorial space. Constructed based on pure mathematical and operational research theories, these models regard evaluation units as mutually independent decision-making units, ignoring the spatial correlation and spatial heterogeneity of territorial space, which is prone to result in evaluation deviations and cannot reflect the actual situation of regional territorial space utilization. Second, most existing studies adopt a single overall evaluation perspective. Statistics show that over 50% of current researches evaluate territorial efficiency from an integrated spatial perspective [22,23]. Nevertheless, territorial space is an extremely complex giant system [24,25,26,27]. The single overall evaluation paradigm is difficult to clarify the interaction mechanisms and functional trade-offs between different spatial functions. In addition, the existing spatial classification systems cannot match the input-output logic of efficiency evaluation, failing to provide accurate support for classified governance and functional synergy of territorial space [28,29].
Different from traditional spatial classification methods, the production-living-ecological space framework takes spatial functional attributes as the core classification standard. Different functional spaces have differentiated resource input and benefit output characteristics, which are highly compatible with the basic logic of TSUE evaluation and can effectively make up for the defects of traditional overall undifferentiated evaluation. Accordingly, targeting the goal of sustainable territorial management, this study integrates the production-living-ecological space functional zoning perspective with the Geographical Data Envelopment Analysis (GeoDEA) model that incorporates spatial heterogeneity, and constructs a multi-dimensional TSUE evaluation framework that adapts to functional stratification and considers geographical spatial attributes. This framework fills the research gap of existing studies that overemphasize mathematical overall measurement while ignoring geographical characteristics and functional differences. It can accurately measure the use efficiency of different functional spaces, identify differentiated development bottlenecks and driving mechanisms, and provide scientific decision-making basis for classified regulation, functional coordination and precise governance of territorial space.
China has complex natural endowments, significant regional development differences and prominent human-land conflicts, which makes it a typical research case for verifying the multi-dimensional evaluation framework and studying sustainable territorial governance. In the process of rapid urbanization, practical problems such as ecological space compression, unbalanced land use structure and uncoordinated regional development have become increasingly prominent, putting forward higher requirements for refined and differentiated evaluation of territorial space. In response to the above practical problems, this study optimizes the evaluation index system adapted to PLE spaces and strengthens the explanatory ability of ecological benefit indicators in ecological space efficiency evaluation. Meanwhile, the research methods are selected according to regional practical problems. Spatial autocorrelation analysis is used to identify the hotspots and coldspots of efficiency spatial imbalance, and the Multi-scale Geographically Weighted Regression (MGWR) model is adopted to reveal the spatially differentiated driving mechanisms of efficiency disparities.
Based on the dataset of 340 Chinese cities across four phases (1990, 2000, 2010, and 2020), this study focuses on sustainable territorial management and conducts efficiency evaluation in consideration of the functional heterogeneity of production-living-ecological spaces. The spatiotemporal patterns and driving mechanisms of territorial sustainable development are systematically explored in this work. This study yields three major contributions. First, this study proposes a multi-dimensional evaluation framework that integrates functional stratification and geographical attributes for territorial sustainability. This framework effectively addresses the limitations of traditional undifferentiated evaluation, which neglects spatial and functional disparities. Second, this study identifies 2010 as a critical transition year for China’s territorial sustainable development. It reveals the efficiency-driven spatiotemporal evolution of territorial sustainability across the study period. Third, differentiated territorial governance strategies are formulated to alleviate regional sustainable development imbalances. The findings provide solid scientific support for refined territorial management and high-quality sustainable development.
The remainder of this paper is structured as follows. Section 2 details the data sources and methodological procedures. Section 3 presents the empirical results. Section 4 further discusses the research findings. Section 5 concludes the core outcomes, proposes targeted governance implications, and delivers prospective research directions.
2. Materials and Methods
2.1. Overview of TSUE
2.1.1. Theoretical Foundations
This study integrates the triple bottom line theory of sustainable development, human–land coordination theory, and production-living-ecological spaces differentiation theory, establishing a systematic research logic of functional stratification–input–output matching–efficiency coupling analysis. Production-living-ecological spaces correspond to the three core dimensions of sustainable development (economic growth, human settlement guarantee, and ecological security). The three functional spaces interact dynamically and couple synergistically to jointly determine the overall level of regional territorial sustainable development.
Notably, TSUE is not equivalent to sustainable development level in a simplistic manner [14]. TSUE focuses on the matching degree between factor inputs and comprehensive outputs, reflecting the intensive level of territorial development. By contrast, sustainable development is a systematic state encompassing efficiency, coordination, and stability. High TSUE serves as a core prerequisite and quantitative characterization of sustainable territorial development, which can effectively judge the transformation stage of territorial exploitation and identify phased developmental problems[14,16,30].
2.1.2. Indicator System for Evaluating TSUE
Drawing on existing theories and empirical cases from relevant literature, this study systematically sorts out core indicators adopted in previous TSUE research [30,31,32]. On this basis, we innovatively expand and optimize the indicator framework to match the functional characteristics of production-living-ecological spaces. We select indicators covering natural geographic conditions, socio-economic development, infrastructure construction and ecological environment to build the comprehensive evaluation framework, as shown in Table A1.
2.1.3. Impact Factor of TSUE
TSUE spatial differentiation is co-driven by natural endowments and socioeconomic activities. Natural conditions underpin territorial development, while human socioeconomic factors dominate the evolution of spatial patterns and resource allocation. This study selected 15 influencing factors from natural and human activity dimensions. After removing multicollinear variables via the variance inflation factor test, valid indicators were screened for subsequent regression analysis (Table A2, Table A3 and Table A4).
2.2. Study Area and Data Sources
2.2.1. Study Area
Considering data availability and research feasibility, this study focuses on 340 cities in China as the study area (Figure 1). The area is characterized by vast territory, complex topography, diverse climates, and abundant resources.
2.2.2. Data Sources
This study selects four typical years including 1990, 2000, 2010, and 2020, covering the complete stages of China’s urbanization from low-speed growth and rapid expansion to high-quality transformation, and incorporates dozens of multi-source datasets with detailed information listed in Table 1.
2.3. Methods
2.3.1. GeoDEA Model
To overcome the defects of traditional DEA models that ignore geographical spatial attributes and produce biased results, this study adopts the GeoDEA model for efficiency evaluation. This model is a self-developed and formally published analytical framework, which innovatively integrates spatial correlation and spatial heterogeneity characteristics into traditional efficiency evaluation [33]. The self-developed GeoDEA model reconstructs the production frontier of geographically adjacent units through spatially constrained clustering and effectively incorporates geographical attributes to compensate for the non-geographical limitations of traditional models. Combined with the super-efficiency SBM model that considers undesirable outputs [34,35,36], this method avoids the clustering of fully efficient units and achieves accurate efficiency ranking, which is highly adaptable to the multi-input, multi-output evaluation scenario containing ecological negative outputs in territorial space research (Figure 2). The entropy weight method is applied to determine the weights of production space, living space and ecological space efficiency as 0.4431, 0.4272 and 0.1297 respectively, and the weighted values are integrated to obtain the comprehensive Territorial Space Use Efficiency.
2.3.2. Global and Local Spatial Autocorrelation Models
Global and local spatial autocorrelation models were adopted to reveal the spatial pattern of TSUE. The global Moran’s I was utilized to characterize the overall spatial agglomeration status of nationwide TSUE [37,38,39], while the local indicators of spatial association (LISA) were applied to identify high–low agglomeration and outlier units [40], so as to finely depict the spatial differentiation and interactive characteristics of territorial space use efficiency.
2.3.3. MGWR
The MGWR model was employed to explore the multi-scale driving mechanisms of TSUE spatial differentiation [41]. Different from traditional global regression and ordinary GWR models, MGWR allows each influencing factor to correspond to an independent optimal spatial bandwidth. It can accurately identify the spatial differences in the scale, intensity, and direction of natural and human factors, and effectively reveal the differentiated driving mechanisms and functional trade-off relationships of production-living-ecological space efficiency differentiation.
2.3.4 TSUE and Sustainable Development Level Classification
To establish a hierarchical correlation between TSUE and sustainable development level and avoid the simplistic logical equivalence problem, this study adopted the natural breakpoint method to objectively grade TSUE based on 1360 valid samples of four phases. According to the statistical characteristics of the dataset, sustainable development was divided into five levels: low, medium-low, medium, medium-high, and high, which correspond to the gradient development status of territorial space from extensive over-exploitation to intensive and coordinated optimization,as shown in Table 2.
2.4 Research Framework
Based on the functional differentiation characteristics of production-living-ecological spaces, this study constructs a multi-dimensional efficiency evaluation framework for sustainable territorial management (Figure 3). In the first stage, a differentiated input–output indicator system is established, and an improved GeoDEA model is employed to measure territorial space use efficiency. This method overcomes the limitation of conventional models that fail to capture geographical spatial effects, and can accurately reflect the allocation level of territorial resources. In the second stage, efficiency levels are used to characterize and identify territorial sustainable development status. This study further systematically explores the spatiotemporal evolution characteristics, spatial differentiation patterns and heterogeneous driving mechanisms of regional sustainable development [43,44]. This framework establishes a complete logical system covering efficiency measurement, pattern identification, mechanism analysis and sustainability assessment, which provides scientific support for refined territorial governance and regional sustainable development.
3. Results
3.1. Spatiotemporal Evolution Characteristics
3.1.1. Temporal Evolution Trajectory
Based on observations for 1990, 2000, 2010 and 2020, the sustainability of territorial space use presented an overall fluctuating trajectory of rising-falling-rebounding, with with notable shifts in trends observed in 2010 (Table 3). In 2010, the number of low-sustainability cities increased by 24 compared to 1990, while other categories decreased. By 2020, sustainability had significantly improved, with only 11 cities (3.24%) in the low category. The numbers of medium-low and medium sustainability cities increased substantially from 2010, together accounting for 77.65%. The evolutionary characteristics varied across functional spaces. The sustainability of production space use showed an increase-decrease-rebound pattern, with a trough in 2010. In 2010, the number of cities with low sustainability was 148, accounting for 43.53%, an increase of 32.65 percentage points from 2000. Living space sustainability exhibited the opposite trend: decrease-increase-decrease, with the best performance in 2010. In 2010, the number of cities with low sustainability was the lowest, accounting for only 21.18%. The proportion of cities with medium sustainability and above was as high as 60.88%, an increase of 15.59 percentage points from 2000. The sustainability of ecological space use demonstrated a continuous improving trend. The proportion of cities with low and medium-low sustainability in 2020 was 14.12 percentage points lower than that in 1990, and the proportion of cities reaching medium sustainability and above reached 89.71%.
Distinct shifts in the long-term trend of production space use efficiency were observed around 2010, which can be primarily attributed to the stage of China's economic development. Since the beginning of the 21st century, China's economy has largely followed a capital-driven growth model, gradually entering a phase of rapid expansion accompanied by significant structural transformation. At this stage, the relatively underdeveloped level of scientific and technological advancement inevitably led to excessive and inefficient resource inputs, thereby reducing production space use efficiency. After 2010, however, China's economic growth began to moderate, entering a period characterized by shifting growth rates, structural adjustment, and the absorption of earlier accumulated imbalances. This subsequent phase emphasizes development quality over mere expansion, resulting in a more reasonable input-output ratio and, consequently, an improvement in production space use efficiency.
3.1.2. Spatial Differentiation Pattern
The sustainability of territorial space use exhibited clear spatial unevenness, forming an obviously polarized spatial pattern (Figure 4). Overall, Northwest China, Hubei, Hunan and Jiangxi showed relatively weak sustainability, while Qinghai, Gansu, Shaanxi, Shanxi, Shandong, Henan, Jiangsu and Zhejiang performed better. From a functional zoning perspective, the sustainability of production space was weaker in the northwestern, northern, and parts of the southern regions, with more sustainable cities mainly located in central and coastal areas. For living space use, some cities in the Northeast, Central and Southwest exhibited lower sustainability, while the Northwest and North showed stronger performance. The spatial pattern of sustainability of ecological space displayed a clear “high-west-low-east, high-south-low-north” distribution. As a complex giant system of human-land relations, territorial space presented a multi-level, multi-dimensional structure. Nonlinear interactions and dynamic feedback loops operate among internal components of territorial space, leading to significant heterogeneity and dynamism in the spatial distribution of sustainability. Specifically, regional differences in natural endowments, economic development levels, and socio-cultural characteristics resulted in obvious spatial differentiation in sustainability performance. Such differentiation also posed substantial challenges to sustainability enhancement.
3.2. Spatial Autocorrelation Pattern
The sustainability of territorial space use among neighboring cities exhibits significant spatial correlation and agglomeration features. To further quantify this pattern, this study analyzed both global and local spatial autocorrelation in the sustainability of territorial space use across 340 cities nationwide.
3.2.1. Agglomeration Significance and Variation
The results indicated that the P-value was less than 0.01, Moran's I exceeded 0, and the Z-value was greater than 1.65, passing the significance test at the 1% level. This clearly rejects the null hypothesis of spatial randomness in the sustainability of territorial space use across the 340 cities, confirming a significant positive spatial correlation among them. For the four observation years of 1990, 2000, 2010 and 2020, Moran’s I for the sustainability of production space followed an upward-downward-upward trend (Figure 5), indicating that spatial correlation strengthened, then weakened, and then strengthened again,with notable trend shifts observed in 2010. For the sustainability of living space and the overall sustainability of territorial space, Moran’s I showed an upward then downward trend, with notable trend shifts observed in 2000. Moran’s I for the sustainability of ecological space decreased slightly and then increased modestly, reflecting a generally weakening spatial correlation over time.
3.2.2. LISA Agglomeration Types and Distribution
LISA cluster maps revealed notable differences in the sustainability of territorial space use across functional zones and over time (Figure 6). Cities in High-High (H-H) clusters functioned as “diffusion centers,” maintaining strong sustainability themselves while enhancing neighboring regions through spillover effects. For example, H-H clusters for the sustainability of production space in 2010 were concentrated in Jiangsu and Anhui; for the sustainability of living space in 1990, in Hebei, Shandong, and Henan; and for the sustainability of ecological space in 2010, in Qinghai, Gansu, Shaanxi, and Sichuan. In contrast, Low-Low (L-L) clusters acted as "warning depressions", where low sustainability within these units restricts the development of surrounding cities. Examples included the sustainability of production space in Guangxi in 2000, the sustainability of living space in Hunan, Hubei, and Jiangxi in 2000, and the sustainability of ecological space in Inner Mongolia, Hebei, and Liaoning in 2010. High-Low (H-L) and Low-High (L-H) outliers represented "polarization centers", where high or low sustainability in a city inhibited or promoted sustainability in adjacent cities, respectively. Examples included an H-L outlier for the sustainability of ecological space spanning Inner Mongolia, Liaoning, and Hebei in 2000, and an L-H outlier for the sustainability of living space in Hebei in 2020. Such regions require in-depth internal diagnosis and strengthened cross-regional coordination to adjust territorial space use patterns, improve efficiency, and foster sustainable development. Tailored strategies can be formulated according to each city’s agglomeration type to effectively promote sustainable territorial space use.
3.3. Mechanism of Influencing Factors
3.3.1. Positive and Negative Effects of Dominant Influencing Factors
Analyzed from the perspective of production-living-ecological spaces, the dominant influencing factors of the sustainability of the use of each functional type are not the same (Table 4). The land reclamation rate (%) only affects the sustainability of production space use and territorial space use, and does not have a decisive effect on the sustainability of living space use and ecological space use. The two influencing factors, annual average temperature (℃) and population density (person/km2), only affect the sustainability of living space use, while the effect on the other spaces' sustainability is not significant. Mean DEM (m), water area (m2), year-end real urban road area (hm2), GI core area (m2), and urbanization level exerted stronger impacts on the sustainability of all space types used. In addition, the positive and negative effects of the same influencing factor on the sustainability of different functional types are not the same. For example, the water area (m2) only positively influences the sustainability of ecological space use, and negatively influences all the other space use types. It can be seen that the positive and negative aspects of a certain influencing factor cannot be easily defined, but need to be considered in a comprehensive manner according to the development patterns of different spaces. Therefore, there is a need to balance and harmonize promoting and restraining effects of each driver in conjunction with the development of each space type.
3.3.2. Spatial Heterogeneity of Impact Factors
In this study, the regression coefficients of each influencing factor were classified into five levels using the natural breakpoint method and visualized to illustrate their spatial heterogeneity. As shown in Figure 7, the mean regression coefficients of different dominant influencing factors exhibited clear spatial heterogeneity. The coefficients generally followed spatial trends, such as increasing from east to west, south to north, northeast to southwest, or from the central region toward the east and west. However, some factors displayed irregular spatial distributions. For example, the regression coefficients for the influence of water area on the sustainability of living space use were higher in the Northeast, Northwest, and Southwest, and lower in the eastern coastal region as well as in Inner Mongolia and Hebei. Furthermore, even for the same influencing factor, the spatial distribution of regression coefficients varied noticeably across different functional space types. For instance, the coefficients for mean DEM increased from east to west in relation to the sustainability of production space, living space, and territorial space use, whereas for ecological space sustainability, they exhibited a west-to-east increasing trend. These findings underscore the complex and interconnected nature of different functional space types. Achieving sustainable development thus requires the selection of appropriate spatial use strategies that are adapted to local natural conditions and aligned with the prevailing stage of socio-economic development.
4. Discussion
4.1. Research Findings and Practical Application Linkage
The paper focuses on the production-living-ecological spaces and measures TSUE across 340 Chinese cities. The purpose of this study is to analyze the issue of sustainable development through the lens of TSUE.
The empirical results indicate that only approximately 20% of cities reach medium-high or high sustainability levels. This aligns with long-standing practical challenges in China’s urbanization, including extensive expansion and unbalanced regional development [25,45,46]. When compared with the actual status of territorial space use, several observations can be made. In terms of production space, certain core cities have achieved highly efficient development through the ‘spatial deprivation’ of production factors. This finding aligns well with the real-world phenomenon of industrial agglomeration and rapid economic growth in core cities. In contrast, peripheral cities have fallen into an ‘inefficiency trap’ due to path dependence, which is also consistent with the practical situation of lagging industrial development and insufficient resource utilization in some regions [41,47]. In terms of living space, the results show that the number of cities with medium-high and high sustainability levels is significantly lower than that of cities in production and ecological spaces (Table 3). This reflects the deep-seated contradiction of "prioritizing production over living" in the process of China's urbanization. This is consistent with the prevailing issues in certain cities, including inadequate infrastructure development and sluggish improvement in residents' quality of life [48,49]. In terms of ecological space, cities with medium-high and high sustainability are relatively large in number. However, some cities exhibit weak stability of ecological space. They excessively rely on single technical restoration means to boost ecological efficiency while ignoring biodiversity conservation and ecosystem self-stabilizing capacity. This is also consistent with practical problems in certain regions, such as the homogeneity of ecological restoration projects and the inadequacy of comprehensive ecological protection measures [50,51].
4.2. Differentiated Policies Supporting Sustainable Development of Territorial Space Use
Based on the agglomeration types identified by LISA (Figure 6) and the differentiated influencing factors revealed by MGWR (Figure 7), this study proposes a targeted policy framework for four types of regions, aiming to achieve the governance transformation from macro-strategy to micro-regulation.
(1) H-H agglomeration zones: standard formulation and collaborative reciprocity
These zones represent the highlands of sustainable development, with their driving forces characterized by distinct functional differentiation. Urbanization level and land saving and intensive utilization level serve as the core drivers for the efficient development of production and living spaces, whereas the GI core area constitutes the fundamental pillar for maintaining and enhancing the sustainability of ecological space. The key to policy-making lies in systematically translating the above multi-dimensional local advantages into comprehensive regional leadership [52,53]. Specifically, first, we should promote the joint development of regional standards. Spearheaded by H-H urban agglomerations (e.g., the Yangtze River Delta), relevant authorities should formulate unified regional standards for GI, construction land efficiency, and high-quality communities, and drive overall upgrading through mutual recognition of certifications. Second, it is necessary to establish cross-regional ecological compensation mechanisms. Based on the significant ecological value of their GI core area, market-oriented ecological product trading and horizontal compensation mechanisms should be developed with downstream beneficiary regions. Horizontal compensation schemes will help align conservation with development goals.
(2) L-L agglomeration zones: characteristic transformation and stock activation
These regions remain trapped in a low-level equilibrium. The core problem lies in insufficient development momentum, exemplified by the limited driving effect of urbanization. At the same time, structural constraints have become entrenched, specifically topographic limitations indicated by the average DEM, or the adverse impact exerted by the land conservation and intensive utilization levels on the sustainability of ecological space. To break this deadlock, two approaches are recommended. On one hand, geographically-based characteristic economies should be developed. For instance, the L-L agglomeration areas in production space (e.g., Guangxi and Hunan) should be guided to abandon the traditional industrialization path. Instead, they should rely on local natural endowments to develop environment-friendly industries including characteristic agriculture, rural tourism, and under-forest economy. On the other hand, it is imperative to carry out the reform of ecological capitalization. For example, L-L agglomeration areas in ecological space (e.g., Northeastern China) can launch pilot programs. They can adopt a carbon sink operation mechanism based on the core area size of green infrastructure such as forests and wetlands. This will shift ecological conservation from a burden-bearing model to a value-added one.
(3)H-L/L-H agglomeration zones: functional restructuring and hub construction
These two types of zones expose the "disconnections" in regional linkage [54,55]. H-L agglomeration zones (e.g., Henan) need to alleviate the siphoning pressure caused by the negative impact of population density. L-H agglomeration zones (e.g., Hebei) must break the "island effect" of their advantages such as year-end road area. Targeted strategies should be adopted accordingly. First, targeted functional relocation and benefit-sharing mechanisms should be promoted. This involves guiding H-L agglomeration zones to establish formal agreements with adjacent H-H agglomeration zones for the relocation of non-core functions, such as scientific research, education, and health-oriented industries. In parallel, a tax revenue sharing mechanism should be established to shift the development model from a siphoning effect to a function-dispersing paradigm [54,56]. Second, enhancing hub functionality and regional synergy is essential. L-H agglomeration zones should be supported in leveraging their infrastructural advantages to develop regional service capacities. For instance, priority may be given to constructing express corridors that connect the surrounding L-L agglomeration areas (e.g., Hebei). Furthermore, these areas should take the lead in establishing cross-administrative industrial alliances, acting as pivotal growth anchors for the region [46,57].
Territorial space governance needs to establish a precise regulation closed loop of type identification-diagnostic analysis-tool matching. It is recommended that under the unified national framework, local governments be authorized to explore differentiated combinations of regional coordination, ecological compensation, and land policies, ultimately achieving universal sustainable development.
4.3. Limitations and Prospects
At present, the research framework constructed in this study still presents several limitations. (1) The completeness and quantitative accuracy of the indicator system need to be improved. For instance, the quantitative characterization of complex ecological space functions, such as biodiversity maintenance capacity and ecosystem self-regulation resilience, remains challenging. This may compromise the comprehensiveness and accuracy of the evaluation results. (2) The depiction of interactive relationships between spatial functions is overly simplistic. Although the current framework integrates the three types of spaces into a unified system, sufficient analytical models have not yet been established to elucidate the complex interaction mechanisms among production, living, and ecological functions. In particular, the synergistic and trade-off relationships across different spatial types require further in-depth characterization through the development of dynamic coupling models. (3) Multi-scale conversion and data fusion is constrained by technical barriers. When extrapolating conclusions from the municipal scale to other scales (e.g., district/county, regional cluster), there exist statistical and modeling challenges, such as inconsistent data resolution and significant spatial heterogeneity.
This research framework demonstrates distinct application value and practical potential. In planning and management, it can serve as an important tool for evaluating the implementation of territorial space planning. It helps systematically identify weak links in the development of production-living-ecological spaces, thereby optimizing spatial resource allocation. Methodologically, future studies can further deepen the analysis of complex interaction mechanisms among the three functions by introducing spatial conflict diagnosis models. Additionally, leveraging cutting-edge technologies such as remote sensing big data and artificial intelligence, it is expected to build a dynamic monitoring and intelligent early warning platform for TSUE. This will advance the evaluation system from static efficiency assessment to real-time simulation, scenario prediction and decision support.
5. Conclusions
This study systematically measures TSUE across 340 Chinese cities from the perspective of functional differentiation of production-living-ecological spaces for 1990, 2000, 2010 and 2020. The spatiotemporal evolution and multi-scale driving features of territorial sustainable development are further identified. The main findings are listed as follows.
Overall, China’s territorial sustainable development level shows distinct phased fluctuations alongside efficiency changes. The period around 2010 represents a critical turning point for territorial utilization modes and sustainable development status. The territorial system gradually shifts from extensive expansion toward development driven by functional optimization. In terms of spatial pattern, territorial sustainable development displays obvious spatial imbalance and functional differentiation. High-efficiency production and living spaces are mostly concentrated in eastern and central cities, supporting regional strengths in economic and residential functions. Highly sustainable ecological spaces are mainly distributed in western and northeastern China, forming a differentiated territorial functional pattern.
There exists remarkable structural imbalance in sustainable development among production, living and ecological spaces. Living spaces suffer the most severe sustainability challenges and become the primary zone where human–land conflicts intensify. Different functional spaces differ greatly in development bottlenecks and evolutionary trends. For driving mechanisms, natural endowments and socioeconomic factors affecting territorial space use efficiency present clear spatial heterogeneity and scale differences. These factors vary significantly in influence magnitude and direction across functional spaces. Such differences eventually create the uneven spatial pattern of territorial sustainable development nationwide.
In essence, territorial sustainable development depends collectively on resource allocation efficiency of multi-functional spaces. Targeted efficiency improvement for each functional space and categorized, zoned refined territorial governance are essential approaches. These measures help ease regional human–land conflicts, optimize territorial spatial layout and advance high-quality sustainable regional development.
Author Contributions
Conceptualization, Y.M.; methodology, Y.M.; validation, X.W., X.Z. and F.X.; formal analysis, X.W. and F.X.; investigation, X.J.and X.Z.; resources, X.W. and X.Z.; data curation, X.J. and X.W.; writing—original draft preparation, X.W. and Y.M.; writing—review and editing, Y.M. and F.X.; visualization, X.J.; supervision, X.Z. and X.W.; funding acquisition, Y.M. All authors have read and agreed to the published version of the manuscript.
Funding
Airborne Laser Bathymetric Survey for Coastal Zones of Major Eastern Areas (Research projects of the China Geological Survey, DD202606302004)
Data Availability Statement
The data that support the findings of this study are available on request from the corresponding author. The data are not publicly available due to privacy or ethical restrictions.
Conflicts of Interest
The authors declare no conflicts of interest.
Appendix A

Table A1.
Indicator system for measuring TSUE.
| Type of space | Input/Output indicators | Specific indicators |
|---|---|---|
| production space | input indicators | cultivated land area, built-up area, average number of urban non-private employees, investment in fixed assets, total gas supply (gas, natural gas) and landscape pattern index |
| desirable output indicators | gross regional product (GDP), GDP growth rate, share of secondary sector in GDP, patch density | |
| undesirable output indicators | Shannon diversity, industrial particulate matter emissions | |
| living space | input indicators | core area of green infrastructure, number of practicing physicians, number of general secondary schools, number of full-time teachers in general higher education, number of cultural venues, expenditure on science and technology funds, total household liquefied petroleum gas supply |
| desirable output indicators | gross regional product per capita, total retail sales of consumer goods, natural growth rate, core area of green infrastructure per capita | |
| undesirable output indicators | Shannon diversity index, domestic wastewater discharge | |
| ecological space | input indicators | green coverage of built-up areas, branching area and perforation area, total population and total energy consumption |
| desirable output indicators | green space per capita, ecological service value, Shannon’s uniformity index | |
| undesirable output indicators | normalized difference built-up index, land surface temperature, separation index |
Table A2.
Impact factors for the preliminary selection of the TSUE.
| Impact factor selection perspectives | Impact factors | Impact factor sources and processing |
|---|---|---|
| natural factors | mean DEM (m) | resource and environmental science data platform(https://www.resdc.cn/), calculated using the zonal tools in ArcGIS 10.8 |
| rating value of production space | calculated on the basis of the area and weights of the various land use types in the production space | |
| rating value of living space | calculated on the basis of the area and weights of the various land use types in the living space | |
| rating value of ecological space | calculated on the basis of the area and weights of the various land use types in the ecological space | |
| slope | calculated using the surface tools in ArcGIS 10.8 | |
| slope direction | calculated using the surface tools in ArcGIS 10.8 | |
| annual average temperature (℃) | national Tibetan plateau data center (https://data.tpdc.ac.cn/home) | |
| annual average precipitation (mm) | national Tibetan plateau data center (https://data.tpdc.ac.cn/home) | |
| water area (m2) | acquisition of data based on remote sensing monitoring of land use | |
| human factors | land reclamation rate (%) | area of cultivated land divided by total land area |
| urbanization level | calculation of the level of urbanization in four dimensions: demographic, economic, social and spatial | |
| year-end real urban road area (hm2) | China city statistical yearbook | |
| land saving and intensive utilization level | calculate the level of land conservation and intensive utilization from three levels: land input intensity, land use intensity and land use efficiency | |
| population density (person/km2) | total population divided by the area of the administrative district | |
| GI core area (m2) | calculated based on land use data |
Table A3.
Sustainability explanatory variables multiple covariance test results.
| Type of space | Explanatory variable | VIF (1990) | VIF (2000) | VIF (2010) | VIF (2020) |
|---|---|---|---|---|---|
| production space |
mean DEM (m) | 2.3408 | 2.3966 | 2.2688 | 2.1149 |
| annual average precipitation (mm) | 3.1830 | 2.9660 | 2.6618 | 3.4455 | |
| water area (m2) | 1.5811 | 1.5713 | 1.5270 | 1.6198 | |
| year-end real urban road area (10,000 square meters) | 2.1231 | 1.7903 | 3.0900 | 2.7114 | |
| land reclamation rate (%) | 3.1326 | 2.4719 | 2.5145 | 3.0514 | |
| GI core area (m2) | 2.1056 | 2.0298 | 2.0249 | 2.0868 | |
| urbanization level | 4.7401 | 5.1103 | 5.2807 | 4.3830 | |
| land saving and intensive utilization level | 3.3798 | 3.0147 | 4.3116 | 2.6082 | |
| living space |
mean DEM (m) | 5.0765 | 4.6690 | 4.6294 | 4.5811 |
| slope | 6.3041 | 6.1335 | 6.1517 | 5.9681 | |
| annual average temperature (℃) | 5.4200 | 6.7105 | 6.8953 | 5.4821 | |
| water area (m2) | 1.6376 | 1.6753 | 1.6375 | 1.7632 | |
| rating value of living space | 2.2352 | 2.1971 | 2.6280 | 2.3989 | |
| year-end real urban road area (hm2) | 2.3728 | 1.7580 | 3.3686 | 2.6856 | |
| population density (person/ km2) | 2.1234 | 5.0247 | 5.3675 | 2.3175 | |
| GI core area (m2) | 2.1561 | 2.1640 | 2.1600 | 2.1671 | |
| urbanization level | 3.5403 | 3.6530 | 4.005 | 4.4597 | |
| ecological space |
mean DEM (m) | 5.3876 | 5.0654 | 5.0779 | 4.9509 |
| Slope | 6.9911 | 6.9940 | 6.6889 | 6.3619 | |
| annual average precipitation (mm) | 4.0908 | 4.1358 | 3.9030 | 4.5749 | |
| water area (m2) | 1.6959 | 1.6860 | 1.6759 | 1.7887 | |
| year-end real urban road area (10,000 square meters) | 2.0626 | 1.7931 | 3.0332 | 2.2138 | |
| GI core area (m2) | 2.0904 | 2.0651 | 2.0546 | 2.1313 | |
| urbanization level | 4.6476 | 4.8927 | 5.1593 | 5.0783 | |
| land saving and intensive utilization level | 3.4956 | 3.2047 | 4.4248 | 2.7291 | |
| territorial space |
mean DEM (m) | 2.4416 | 2.4636 | 2.3163 | 2.2244 |
| annual average precipitation (mm) | 3.3286 | 3.1461 | 2.7905 | 3.6580 | |
| water area (m2) | 1.6452 | 1.5919 | 1.5489 | 1.5489 | |
| rating value of living space | 3.4233 | 3.2204 | 3.8670 | 3.7323 | |
| year-end real urban road area (10,000 square meters) | 2.3790 | 1.8437 | 3.7870 | 2.7188 | |
| land reclamation rate (%) | 5.3196 | 4.8980 | 4.6818 | 5.2413 | |
| GI core area (m2) | 2.1871 | 2.1581 | 2.1138 | 2.1927 | |
| urbanization level | 4.8319 | 5.1132 | 5.2988 | 5.6991 | |
| land saving and intensive utilization level | 3.5856 | 3.0164 | 4.3532 | 2.7496 |
Table A4.
Results of the selection of explanatory variables for the sustainability of territorial space use.
Table A4.
Results of the selection of explanatory variables for the sustainability of territorial space use.
| Type of space | Explanatory variable |
|---|---|
| production space | mean digital elevation model (DEM) (m), annual average precipitation (mm), water area (m2), year-end real urban road area (hm2), land reclamation rate (%), green infrastructure (GI) core area (m2), urbanization level, land saving and intensive utilization level |
| living space | mean DEM (m), slope, annual average temperature (℃), water area (m2), rating value of living space, year-end real urban road area (hm2), population density (person/ km2), GI core area (m2), urbanization level |
| ecological space | mean DEM (m), slope, annual average precipitation (mm), water area (m2), year-end real urban road area (hm2), GI core area (m2), urbanization level, land saving and intensive utilization level |
| territorial space | mean DEM (m), annual average precipitation (mm), water area (m2), rating value of living space, year-end real urban road area (hm2), land reclamation rate (%), GI core area (m2), urbanization level, land saving and intensive utilization level |
References
- Ariken, M.; Zhang, F.; Chan, Nw.; Kung, H-t. Coupling coordination analysis and spatio-temporal heterogeneity between urbanization and eco-environment along the Silk Road Economic Belt in China. Ecol. Indic. 2021, 121, 107014. [Google Scholar]
- Orsi, F.; Le, Clec’h. S. Effects of protected areas on the expansion of impervious surfaces in their vicinity: Evidence from Dutch Natura 2000. Land Use Policy 2023, 127, 106557. [Google Scholar]
- Wang, H.; He, Q.; Liu, X.; Zhuang, Y.; Hong, S. Global urbanization research from 1991 to 2009: A systematic research review. Landscape. Urban. Plan. 2012, 104, 299–309. [Google Scholar]
- Nayan, Nk.; Das, A.; Mukerji, A.; Mazumder, T.; Bera, S. Spatio-temporal dynamics of water resources of Hyderabad Metropolitan Area and its relationship with urbanization. Land Use Policy 2020, 99, 105010. [Google Scholar] [CrossRef]
- Qiao, W.; Huang, X. Assessment the urbanization sustainability and its driving factors in Chinese urban agglomerations: An urban land expansion - Urban population dynamics perspective. J. Clean. Prod. 2024, 449, 141562. [Google Scholar] [CrossRef]
- Nor, A.N.M.; Corstanje, R.; Harris, J.A.; Brewer, T. Impact of rapid urban expansion on green space structure. Ecol. Indic. 2017, 81, 274–284. [Google Scholar] [CrossRef]
- Yao, Y.; Ma, L.; Che, X.; Dou, H. Simulation study of urban expansion under ecological constraint—Taking Yuzhong County, China as an example. Urban. For. Urban. Gree. 2021, 57, 126933. [Google Scholar] [CrossRef]
- Dong, X.; Yang, R.; Ye, Y.; Cui, L. Trade-off efficiency: Linking urban socioecological quality with land use efficiency from return on investment perspective. Sustain. Cities. Soc. 2023, 99, 104968. [Google Scholar] [CrossRef]
- Hu, Y.; Liu, Y.; Chen, P.; Zhang, M. The impact of residents' perceptions of urban shrinkage on overall life satisfaction – The case of Yichun, China. Cities 2023, 141, 104445. [Google Scholar] [CrossRef]
- Wang, C.; Liu, S.; Zhou, S.; Zhou, J.; Jiang, S.; Zhang, Y.; Feng, T.; Zhang, H.; Zhao, Y.; Lai, Z.; Cui, S.; Mao, X. Spatial-temporal patterns of urban expansion by land use/ land cover transfer in China. Ecol. Indic. 2023, 155, 111009. [Google Scholar] [CrossRef]
- Kılkış, Ş. Urban emissions and land use efficiency scenarios towards effective climate mitigation in urban systems. Renew. Sust. Energ. Rev. 2022, 167, 112733. [Google Scholar] [CrossRef]
- Wu, C.; Cai, G.; Zhang, J.; Du, M.; Li, C.; Peng, S. Identification of urban land use efficiency by indicator-SDG 11.3.1. PLoS ONE 2020, 15, e0244318. [Google Scholar] [CrossRef] [PubMed]
- Zhou, M.; Lu, L.; Guo, H.; Weng, Q.; Cao, S.; Zhang, S.; Li, Q. Urban Sprawl and Changes in Land-Use Efficiency in the Beijing–Tianjin–Hebei Region, China from 2000 to 2020: A Spatiotemporal Analysis Using Earth Observation Data. Remote Sens.-Basel 2021, 13, 2850. [Google Scholar] [CrossRef]
- Ma, Y.; Zheng, M.; Zheng, X.; Huang, Y.; Xu, F.; Wang, X.; Liu, J.; Lv, Y.; Liu, W. Land Use Efficiency Assessment under Sustainable Development Goals: A Systematic Review. Land. 2023, 12, 894. [Google Scholar] [CrossRef]
- Aigner, D.; Lovell, C.A.K.; Schmidt, P. Reprint of: Formulation and estimation of stochastic frontier production function models. J. Econom. 2023, 234, 15–24. [Google Scholar] [CrossRef]
- Deng, X.; Gibson, J. Sustainable land use management for improving land eco-efficiency: a case study of Hebei, China. Ann. Oper. Res. 2018, 290, 265–277. [Google Scholar] [CrossRef]
- Liu, J.S.; Lu, L.Y.Y.; Lu, W.-M. Research fronts in data envelopment analysis. Omega-Int. J. Manag. S. 2016, 58, 33–45. [Google Scholar] [CrossRef]
- Liu, J.S.; Lu, L.Y.Y.; Lu, W.-M.; Lin, B.J.Y. Data envelopment analysis 1978–2010: A citation-based literature survey. Omega 2013, 41, 3–15. [Google Scholar] [CrossRef]
- C., W.D. Data envelopment analysis: A comprehensive text with models, applications, references and DEA-solver software. Interfaces 2001, 31, 116–118. [Google Scholar]
- W.D.C.; Tone, K.; Zhu, J. Data envelopment analysis: Prior to choosing a model Omega-Int. J. Manag. S. 2014, 44, 1–4. [CrossRef]
- Attardi, R.; Cerreta, M.; Sannicandro, V.; Torre, C.M. Non-compensatory composite indicators for the evaluation of urban planning policy: The Land-Use Policy Efficiency Index (LUPEI). Eur. J. Oper. Res. 2018, 264, 491–507. [Google Scholar] [CrossRef]
- Du, J.; Thill, J.-C.; Peiser, R.B. Land pricing and its impact on land use efficiency in post-land-reform China: A case study of Beijing. Cities 2016, 50, 68–74. [Google Scholar] [CrossRef]
- Saikku, L.; Mattila, T.J. Drivers of land use efficiency and trade embodied biomass use of Finland 2000–2010. Ecol. Indic. 2017, 77, 348–356. [Google Scholar] [CrossRef]
- Gorelova, I.; Bellini, F.; D'Ascenzo, F. Understanding smart territories: A conceptual framework. Cities 2024, 152, 105146. [Google Scholar] [CrossRef]
- Liu, Y.; Zhou, Y. Territory spatial planning and national governance system in China. Land Use Policy 2021, 102, 105288. [Google Scholar] [CrossRef]
- Lu, H.; Chen, Y.; Luo, J. Development of green and low-carbon agriculture through grain production agglomeration and agricultural environmental efficiency improvement in China. J. Clean. Prod. 2024, 442, 141128. [Google Scholar] [CrossRef]
- Mulatu, T.; Larsen, L.; Yeshitella, K. The impact of land governance and ownership regimes on public green spaces in East African cities: The case of Addis Ababa (Ethiopia) and Kampala (Uganda). Cities 2025, 156, 105539. [Google Scholar] [CrossRef]
- Yang, X.; Bo, S.; Wang, J. Classifying Urban Functional Zones by Integrating the Homogeneity and Structural Similarity of POIs. J. Urban. Plan. Dev. 2024, 150, 04024052. [Google Scholar] [CrossRef]
- Zhang, Y.Z.; Lin, W.P.; Yin, H.L.; Cheng, L.; Zhang, K.W.; Ye, S. Spatiotemporal Evolution Characteristics and Influence Factor Analysis of the Production-Living-Ecological Space in Laiwu, China, from 2001 to 2018. J. Urban. Plan. Dev. 2024, 150, 04024007. [Google Scholar] [CrossRef]
- Fu, J.; Bu, Z.; Jiang, D.; Lin, G.; Li, X. Sustainable land use diagnosis based on the perspective of production–living–ecological spaces in China. Land Use Policy 2022, 122, 106386. [Google Scholar] [CrossRef]
- Liu, S.C.; Lin, Y.B.; Ye, Y.M.; Xiao, W. Spatial-temporal characteristics of industrial land use efficiency in provincial China based on a stochastic frontier production function approach. J. Clean. Prod. 2021, 295, 126432. [Google Scholar] [CrossRef]
- Yu, J.; Zhou, K.; Yang, S. Land use efficiency and influencing factors of urban agglomerations in China. Land Use Policy 2019, 88, 104143. [Google Scholar] [CrossRef]
- Zheng, M.; Ma, Y.; Zheng, X.; Wang, X.; Li, L.; Xu, F.; Zhang, X.; Gan, F.; Wang, J.; Zhu, Z. Evaluating Territorial Space Use Efficiency: A Geographic Data Envelopment Model Considering Geospatial Effects. Land 2025, 14, 635. [Google Scholar] [CrossRef]
- Lee, H.-S. An integrated model for SBM and Super-SBM DEA models. J. Oper. Res. Soc. 2021, 72, 1174–1182. [Google Scholar] [CrossRef]
- Li, H.; Shi, J.F. Energy efficiency analysis on Chinese industrial sectors: an improved Super-SBM model with undesirable outputs. J. Clean. Prod. 2014, 65, 97–107. [Google Scholar] [CrossRef]
- Xie, Y.; Diao, J.; Meng, J.; Wang, J.; Zhang, J.; Zhang, J.; Zhang, L.; Leung, J.Y.S.; Bi, R.; Liu, W.; Wang, T. Optimizing entropy weight model to accurately predict variation of pharmaceuticals and personal care products in the estuaries and coasts of the South China. Mar. Pollut. Bull. 2024, 207. [Google Scholar] [CrossRef] [PubMed]
- Mulgeta, D.; Gotu, B.; Temesgen, S.; Belina, M.; Likassa, H.T.; Tsegaye, D. Statistical Analysis of Spatial Distribution of Ambient Air Pollution in Addis Ababa, Ethiopia. Stoch. Env. Res. Risk. A. 2024.
- Ndagijimana, A.; Nduwayezu, G.; Kagoyire, C.; Elfving, K.; Umubyeyi, A.; Mansourian, A.; Lind, T. Childhood stunting is highly clustered in Northern Province of Rwanda: A spatial analysis of a population-based study. Heliyon 2024, 10, e24922. [Google Scholar] [CrossRef] [PubMed]
- Mpoyi, C.M.; Kipute, D.D.; Kaswera, C.K.; Tshipinda, L.K.; Maindo, A.M. Socio-anthropology of traditional wildlife exploitation mechanisms among the Turumbu people, DRC: What are the challenges for biodiversity conservation? Environ. Dev. Sustain. 2024. [Google Scholar] [CrossRef]
- Kowe, P.; Mutanga, O.; Odindi, J.; Dube, T. A quantitative framework for analysing long term spatial clustering and vegetation fragmentation in an urban landscape using multi-temporal landsat data. Int. J. Appl. Earth. Obs. 2020, 88. [Google Scholar] [CrossRef]
- Oshan, T.; Li, Z.; Kang, W.; Wolf, L.; Fotheringham, A. MGWR: A Python Implementation of Multiscale Geographically Weighted Regression for Investigating Process Spatial Heterogeneity and Scale. Isprs. Int. J. Geo-Inf. 2019, 8, 269. [Google Scholar] [CrossRef]
- Chen, Y.; Liu, L. Improving eco-efficiency in coal mining area for sustainability development: An emergy and super-efficiency SBM-DEA with undesirable output. J. Clean. Prod. 2022, 339, 130701. [Google Scholar] [CrossRef]
- Leng, A.; Wang, K.; Bai, J.; Gu, N.; Feng, R. Analyzing sustainable development in Chinese cities: A focus on land use efficiency in production-living-ecological aspects. J. Clean. Prod. 2024, 448. [Google Scholar] [CrossRef]
- Jilai, L. The foundation for “production-living-ecological” space evaluation: Theory and methodology. Geogr. Res. 2025, 44, 3222–3247. [Google Scholar]
- Li, M.; Tan, L.; Yang, X. The Impact of Environmental Regulation on Cultivated Land Use Eco-Efficiency: Evidence from China. Agriculture 2023, 13, 1723. [Google Scholar] [CrossRef]
- Yang, B.; Xu, T.; Shi, L. Analysis on sustainable urban development levels and trends in China's cities. J. Clean. Prod. 2017, 141, 868–880. [Google Scholar] [CrossRef]
- Gong, W.; Zhu, M.; Gürel, B.; Xie, T. The Lineage Theory of the Regional Variation of Individualism/Collectivism in China. Front. Psychol. 2021, 11, 596762. [Google Scholar] [CrossRef] [PubMed]
- Li, S.; Song, W. Research Progress in Land Consolidation and Rural Revitalization: Current Status, Characteristics, Regional Differences, and Evolution Laws. Land 2023, 12, 210. [Google Scholar] [CrossRef]
- Song, L.; Kong, X.; Cheng, P. Supply-demand matching assessment of the public service facilities in 15-minute community life circle based on residents' behaviors. Cities 2024, 144, 104637. [Google Scholar] [CrossRef]
- Jiang, X.; Zhai, S.; Liu, H.; Chen, J.; Zhu, Y.; Wang, Z. Multi-scenario simulation of production-living-ecological space and ecological effects based on shared socioeconomic pathways in Zhengzhou, China. Ecol. Indic. 2022, 137, 108750. [Google Scholar] [CrossRef]
- Wang, S.; Huang, L.; Xu, X.; Li, J. Spatio-temporal variations in ecological spaces and their ecological carrying status in China’s mega-urban agglomerations. J. Geogr. Sci. 2022, 32, 1683–1704. [Google Scholar] [CrossRef]
- Jin, G.; Deng, X.; Zhao, X.; Guo, B.; Yang, J. Spatiotemporal patterns in urbanization efficiency within the Yangtze River Economic Belt between 2005 and 2014. J. Geogr. Sci. 2018, 28, 1113–1126. [Google Scholar] [CrossRef]
- Wang, J.; Yang, Y.; Zu, J.; Cai, W.; Yang, J. Investigating the spatial interaction between urban expansion and the regional thermal environment in Guangxi Beibu Gulf urban agglomeration of China. Phys. Chem. Earth Parts A/B/C 2024, 135, 103666. [Google Scholar] [CrossRef]
- Hu, P.; Huang, Y.; He, Q.; Zhang, G. Can urban agglomeration policies promote regional economic agglomeration? Evidence from the Yangtze River Economic Belt in China. Environ. Plan. B-Urban. 2024.
- Liu, J.; Qian, Y.; Song, S.F.; Duan, R.R. Industrial symbiotic agglomeration and green economic growth: A spatial difference-in-differences approach. J. Clean. Prod. 2022, 364, 132560. [Google Scholar] [CrossRef]
- Hunt, S.D. Sustainable marketing, equity, and economic growth: a resource-advantage, economic freedom approach. J. Acad. Mark. Sci. 2010, 39, 7–20. [Google Scholar] [CrossRef]
- Ji, Y.; Zhang, L. Comparative analysis of spatial–temporal differences in sustainable development between the Yangtze River Economic Belt and the Yellow River Economic Belt. Environ. Dev. Sustain. 2022, 25, 979–994. [Google Scholar] [CrossRef]
Figure 1.
Study area.
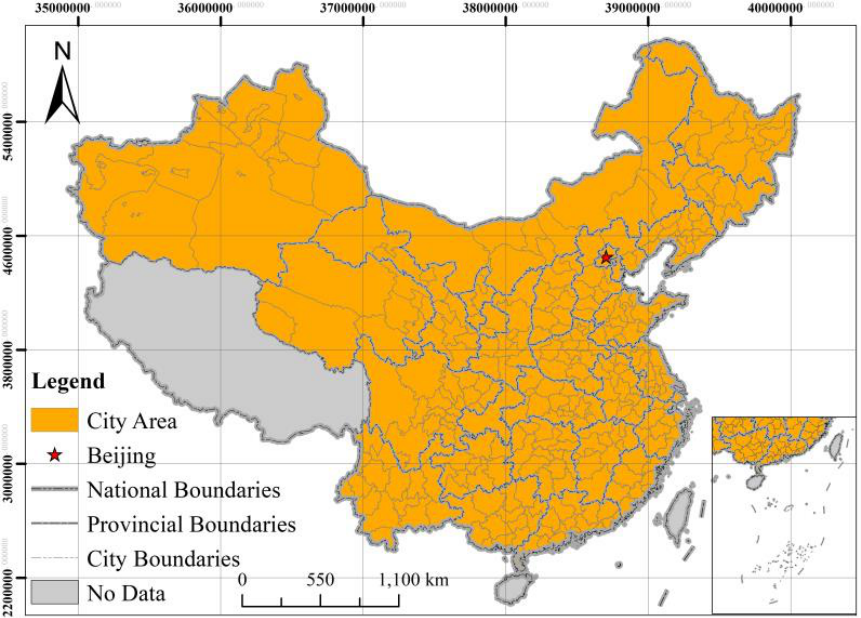
Figure 2.
Schematic diagram of GeoDEA model structure.
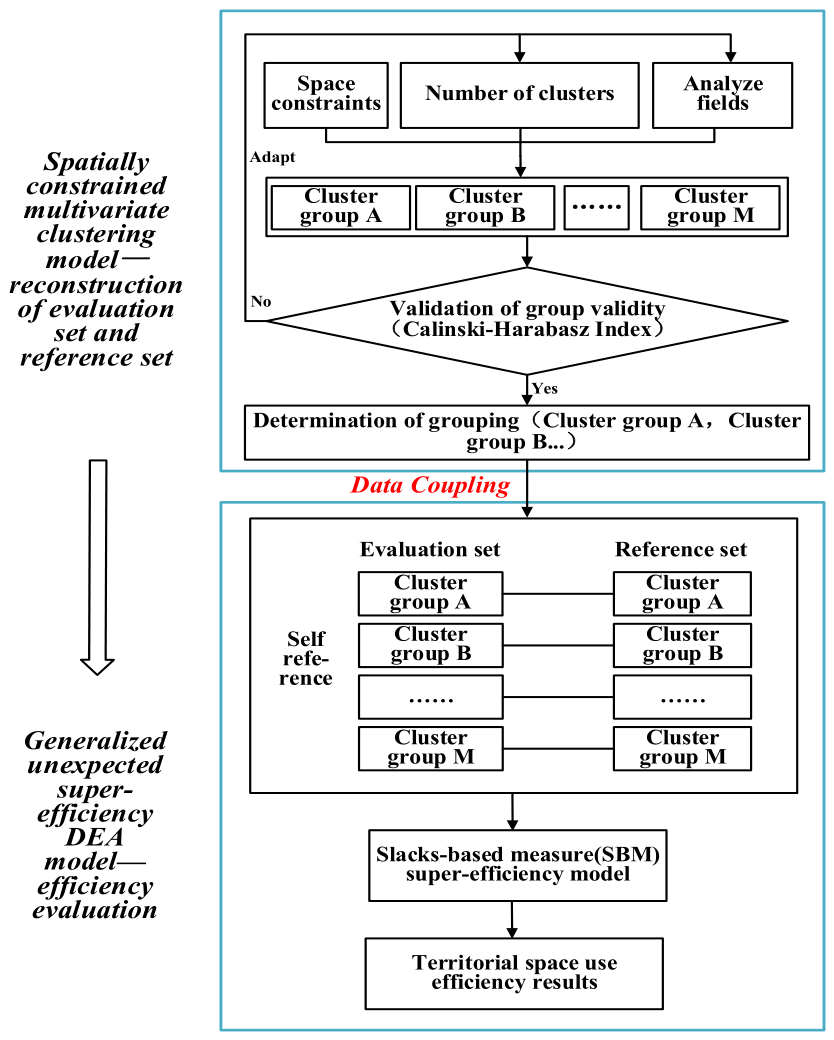
Figure 3.
Framework for evaluating the TSUE and analyzing sustainable development based on the production-living-ecological spaces.
Figure 3.
Framework for evaluating the TSUE and analyzing sustainable development based on the production-living-ecological spaces.
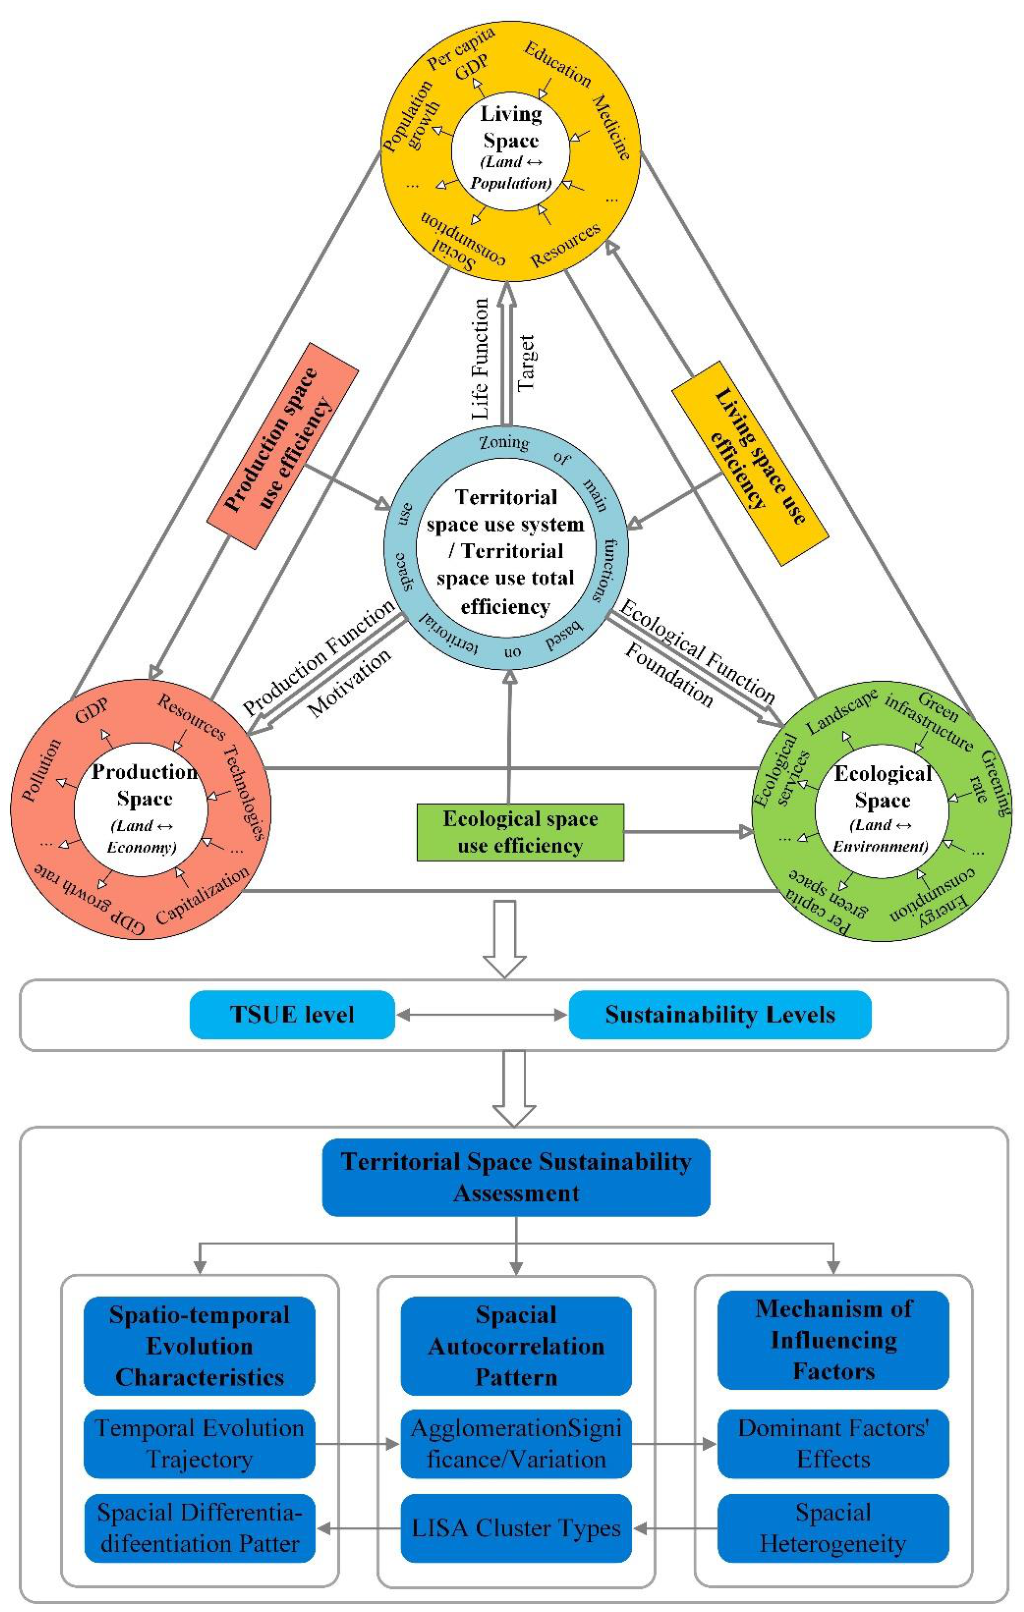
Figure 4.
Spatial distribution of the sustainability of territorial space use in 1990, 2000, 2010 and 2020.
Figure 4.
Spatial distribution of the sustainability of territorial space use in 1990, 2000, 2010 and 2020.
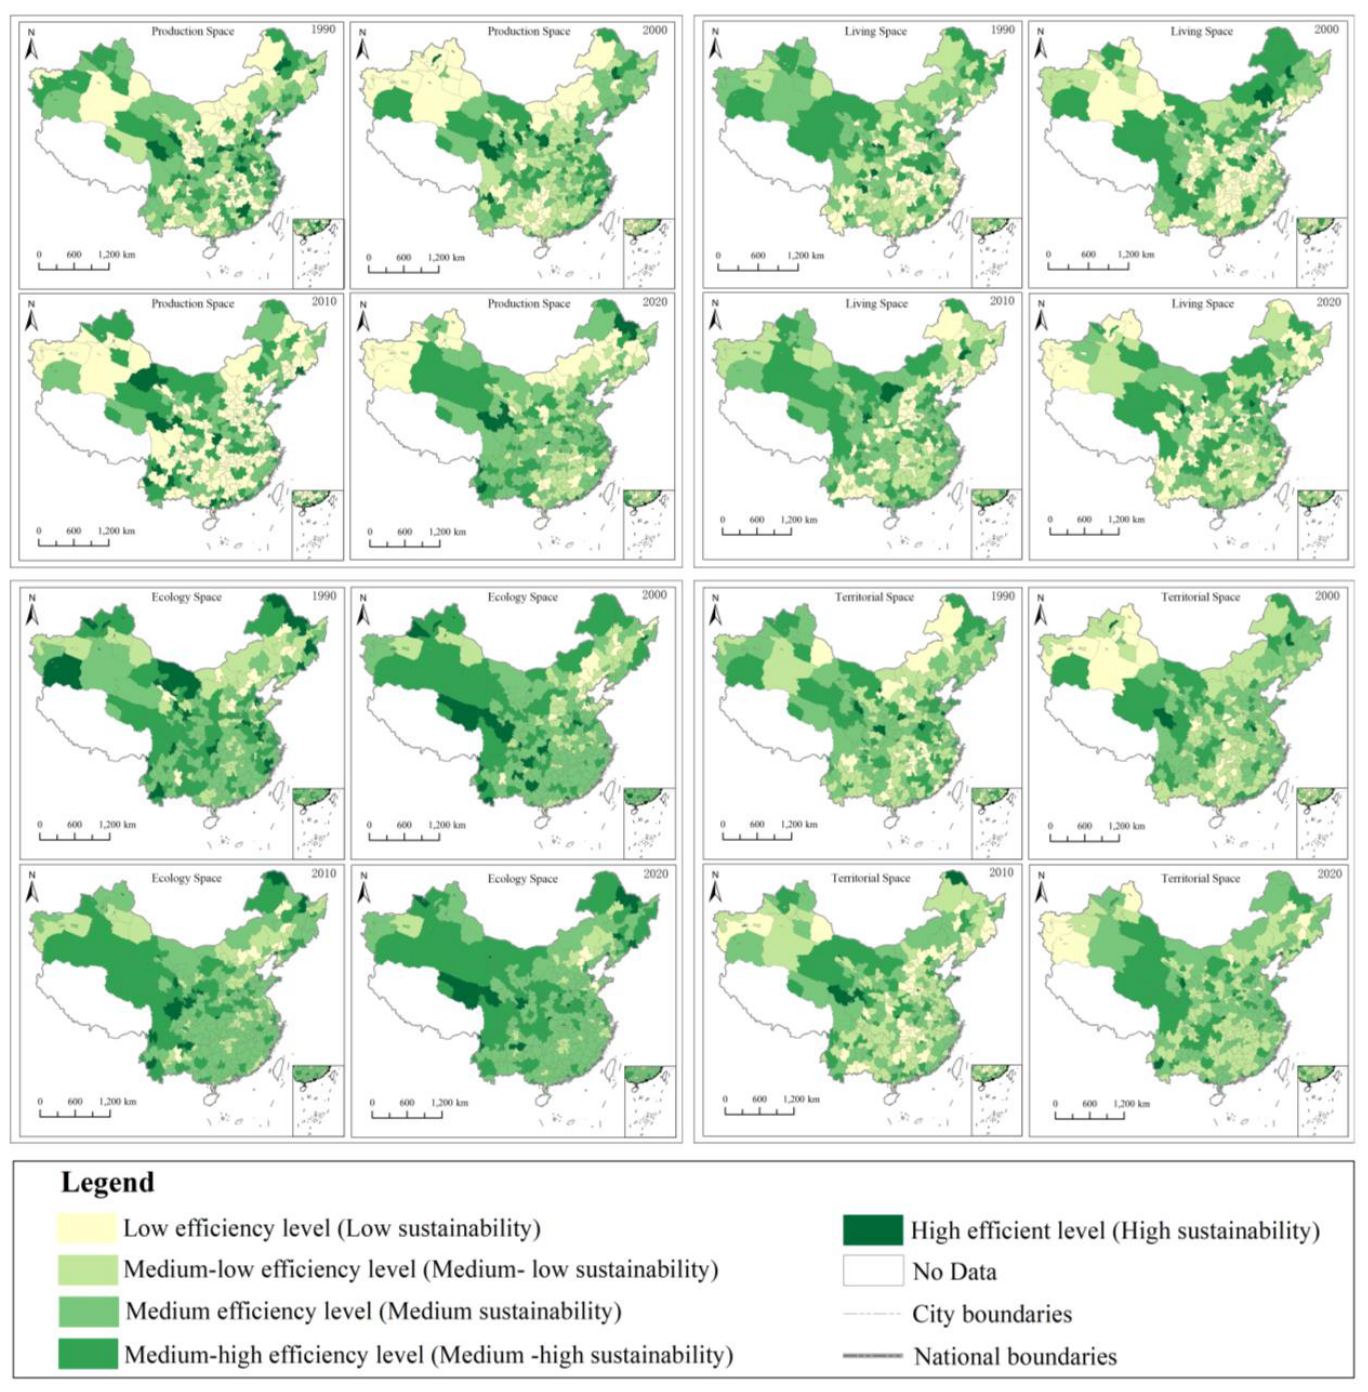
Figure 5.
Moran's I change in sustainability of territorial space use in 1990, 2000, 2010 and 2020..
Figure 5.
Moran's I change in sustainability of territorial space use in 1990, 2000, 2010 and 2020..
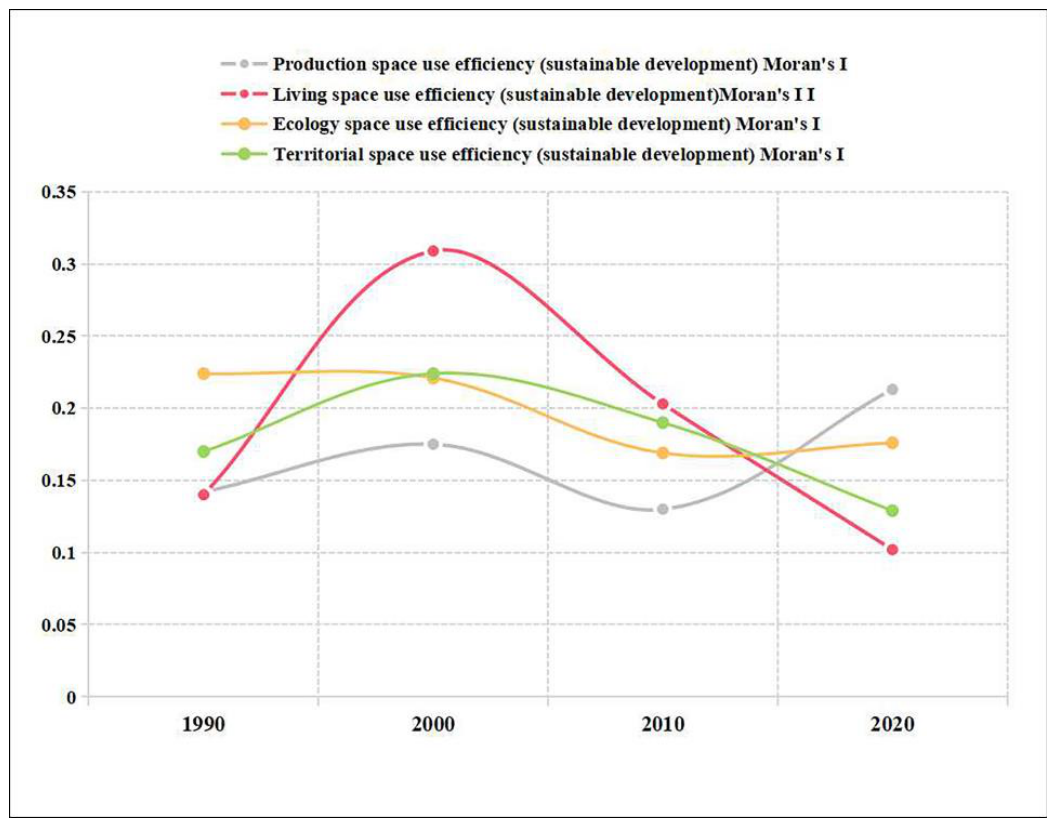
Figure 6.
LISA cluster map of sustainability of territorial space use in 1990, 2000, 2010 and 2020.
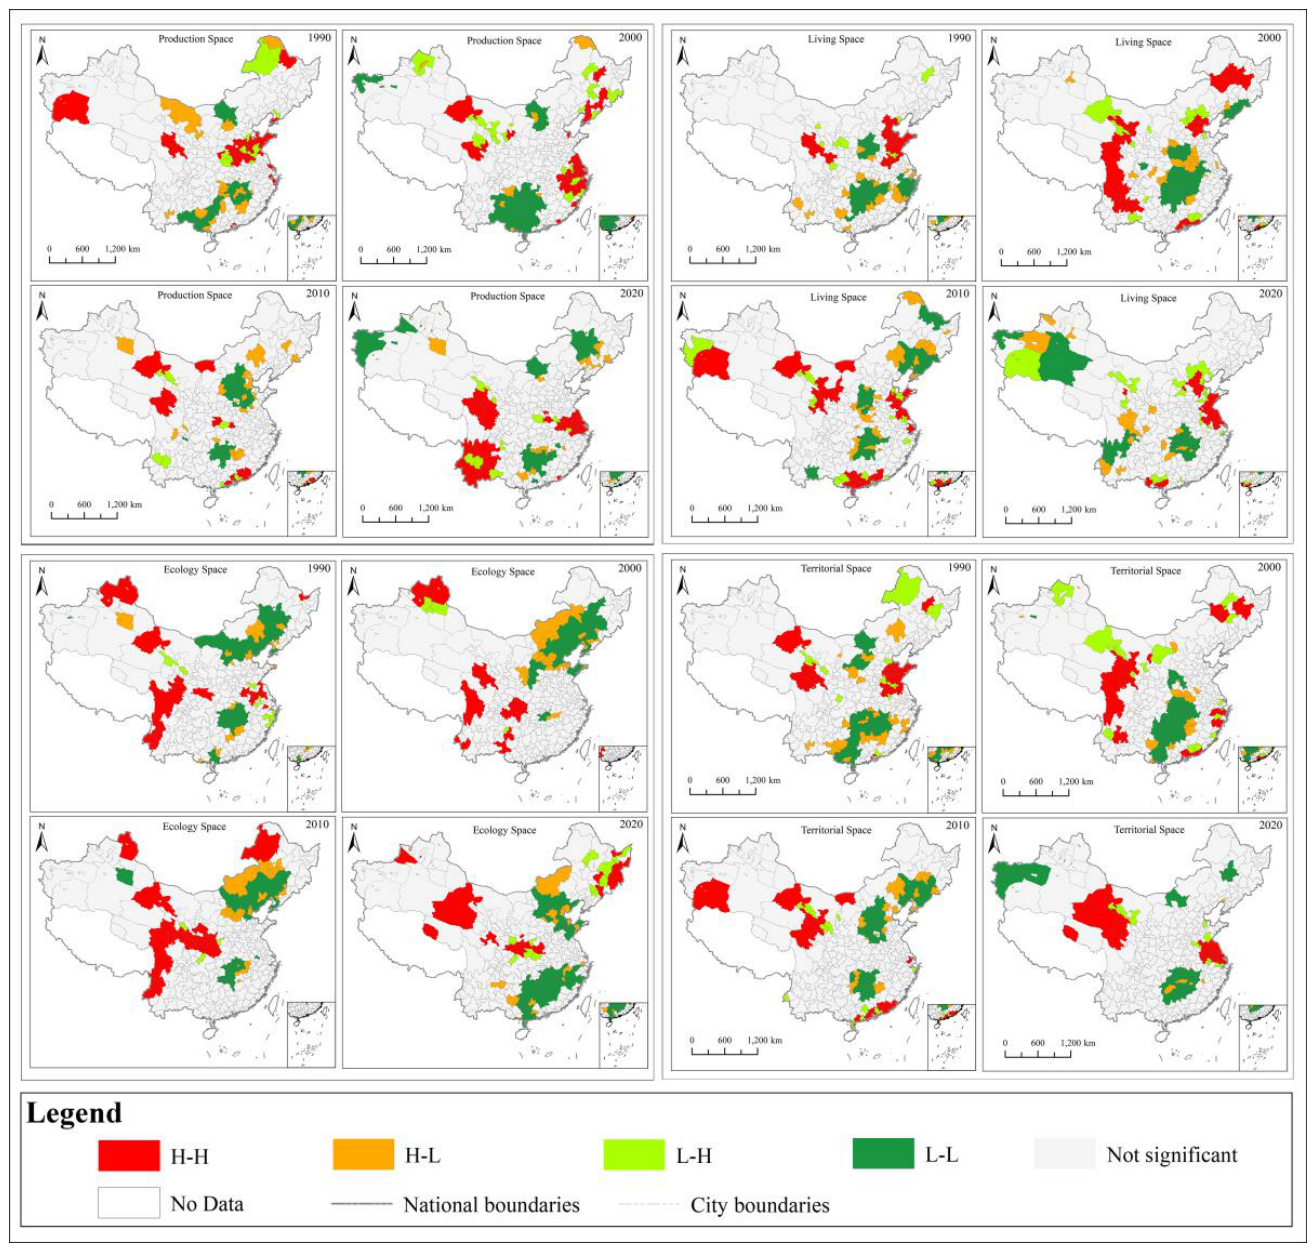
Figure 7.
Spatial heterogeneity of drivers ((a) sustainability of production space use; (b) sustainability of living space use; (c) sustainability of ecological space use; (d) sustainability of territorial space use )( Note: RCM--regression coefficient mean, MDEA--mean DEM (m), AAP--annual average precipitation (mm), WA--water area (m2), YERURA --year-end real urban road area (hm2), LRR--land reclamation rate (%),GICA--GI core area (m2), UL--urbanization level, LSIUL--land saving and intensive utilization level, S--slope, AAT--Annual average temperature (℃), RVLS--rating value of living space, PD--population density (person/ km2).
Figure 7.
Spatial heterogeneity of drivers ((a) sustainability of production space use; (b) sustainability of living space use; (c) sustainability of ecological space use; (d) sustainability of territorial space use )( Note: RCM--regression coefficient mean, MDEA--mean DEM (m), AAP--annual average precipitation (mm), WA--water area (m2), YERURA --year-end real urban road area (hm2), LRR--land reclamation rate (%),GICA--GI core area (m2), UL--urbanization level, LSIUL--land saving and intensive utilization level, S--slope, AAT--Annual average temperature (℃), RVLS--rating value of living space, PD--population density (person/ km2).
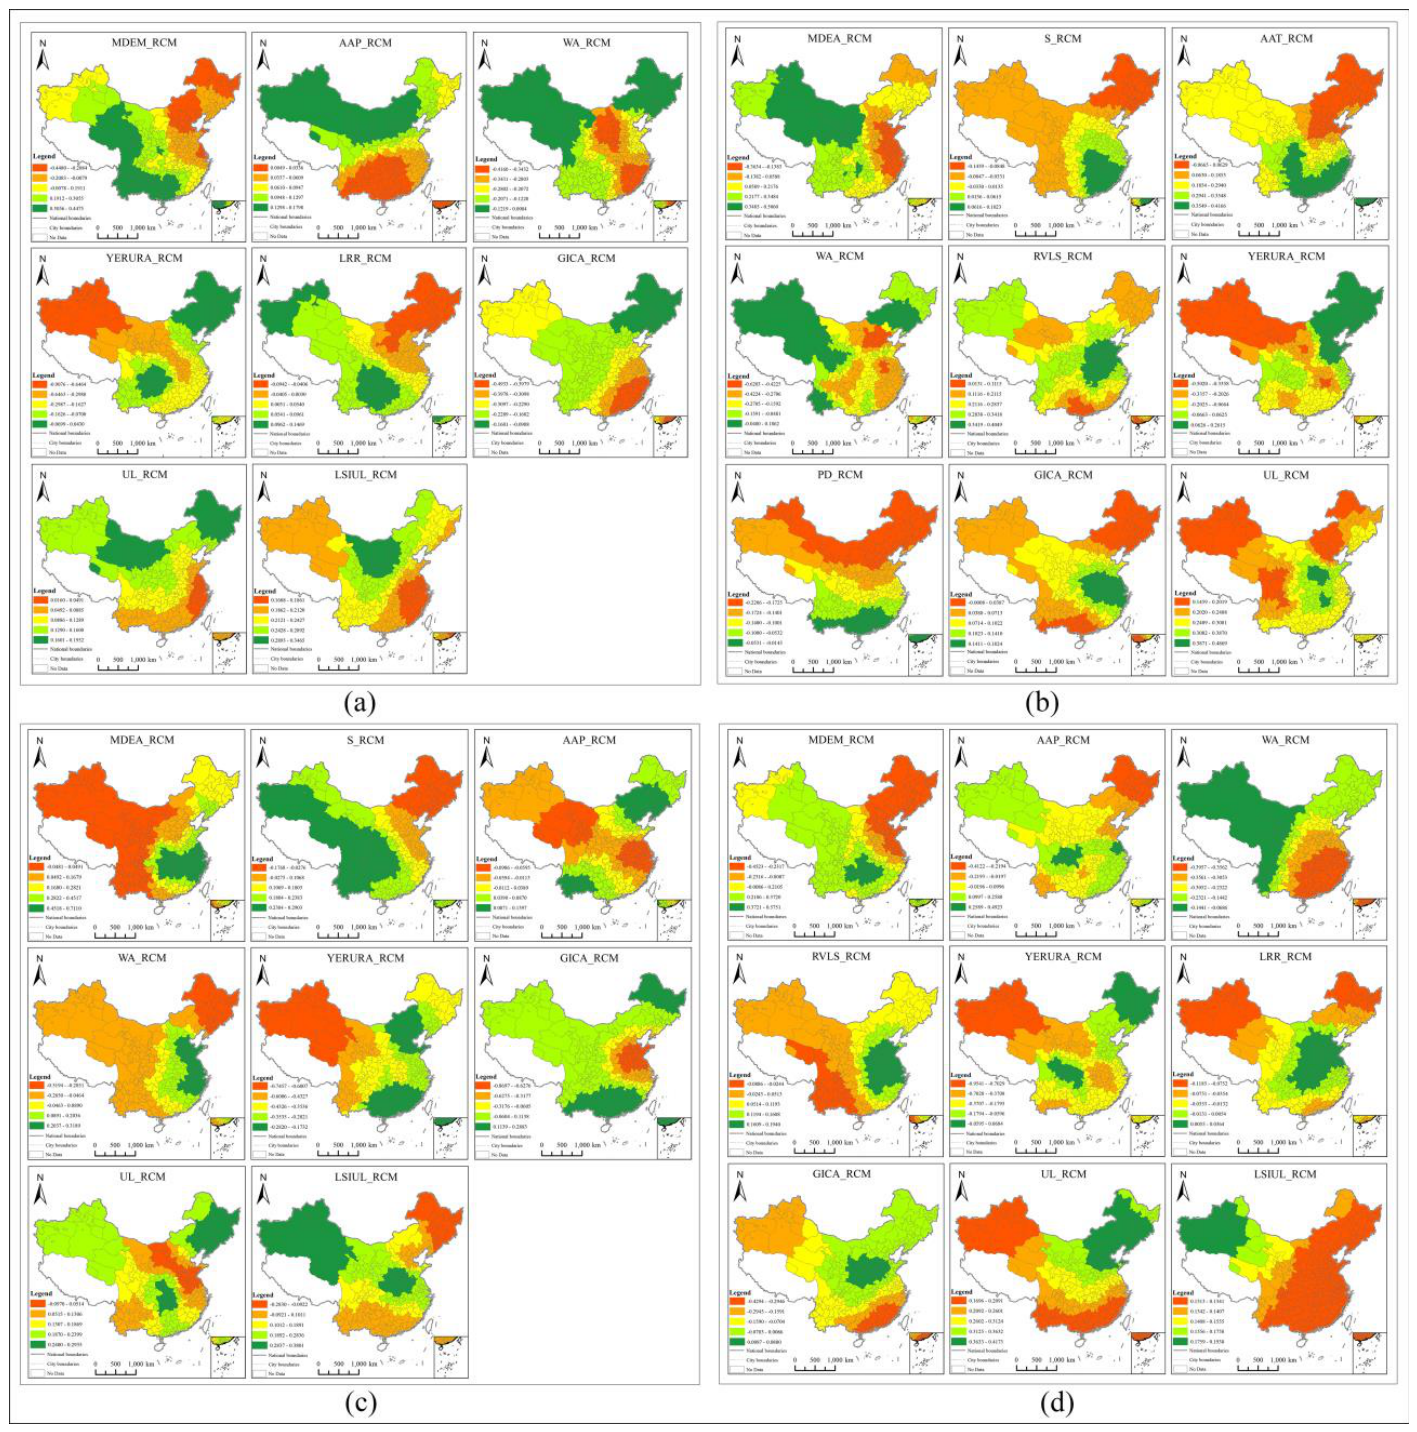
Table 1.
Data sources.
| Data | Time | Type | Sources | Description |
|---|---|---|---|---|
| land use remote sensing monitoring data | 1990, 2000, 2010, 2020 |
raster (1000 m) | the resource and environmental science data platform (https://www.resdc.cn/) | these are mainly used to extract data on indicators such as area of various land types, green infrastructure, landscape index, etc. |
| DEM | / | raster (1000 m) | the resource and environmental science data platform (https://www.resdc.cn/) | primarily for impact factor data |
| remote sensing image data (Landsat 5, Landsat8) | 1990, 2000, 2010, 2020 |
raster (30 m) | the Google Earth Engine (GEE) platform | realize the extraction of the full range of remote sensing index data |
| China city statistical yearbook, prefecture-level city statistical yearbook | 1990, 2000, 2010, 2020 |
text | China economic and social big data research platform (https://data.cnki.net/ ) | focuses on data for social, economic, resource and other indicators |
| literature study derived data | / | text | China knowledge network (https://www.cnki.net/), https://webofscience.clarivate.cn/ | used to calculate eco-indicator data, among other things |
| population distribution, average temperature, average precipitation, grid data | 1990, 2000, 2010, 2020 | raster (1000 m) | the resource and environmental science data platform (https://www.resdc.cn/) | used for impact factor analysis |
| GDP grid data | 1992, 2000, 2010, 2019 | raster (1000 m) | the resource and environmental science data platform (https://www.resdc.cn/) | used for impact factor analysis |
Table 2.
Correspondence between TSUE levels and sustainability levels.
| Sustainability Level | TSUE Level | TSUE Value Range | Level Meaning |
|---|---|---|---|
| low sustainability | low efficiency level | <0.36 | production-living-ecological spaces use coordination is poor, with efficiency ranking among the lowest in the overall sample. development patterns may be extensive or imbalanced. |
| medium-low sustainability | medium-low efficiency level | 0.36-0.72 | spatial use efficiency is below average, posing sustainability challenges with significant room for improvement. |
| medium sustainability | medium efficiency level | 0.72-1.08 | spatial use efficiency falls within the core range of the sample, representing the typical state of most cities with average sustainability performance. |
| medium-high sustainability | medium-high efficiency level | 1.08-1.44 | spatial use efficiency exceeds average levels, reflecting well-coordinated and intensive development of production-living-ecological spaces. |
| high sustainability | high efficiency level | >1.44 | production-living-ecological spaces use demonstrates high coordination and high efficiency, representing the group with the most optimal sustainable development performance. |
Table 3.
Number of cities with various types of space use efficiency in 1990, 2000, 2010 and 2020.
| Space type | Year | Low efficiency level (Low sustainability) | Medium-low efficiency level (Medium-low sustainability) | Medium efficiency level (Medium sustainability) | Medium-high efficiency level (Medium-high sustainability) | High efficient level (High sustainability) |
|---|---|---|---|---|---|---|
| production space | 1990 | 71(20.88%) | 46(13.53%) | 111(32.65%) | 82(24.12%) | 30(8.82%) |
| 2000 | 37(10.88%) | 97(28.53%) | 110(32.35%) | 77(22.65%) | 19(5.59%) | |
| 2010 | 148(43.53%) | 6(1.76%) | 82(24.12%) | 84(24.71%) | 20(5.88%) | |
| 2020 | 36(10.59%) | 74(21.76%) | 146(42.94%) | 71(20.88%) | 13(3.82%) | |
| living space | 1990 | 114(33.53%) | 51(15.00%) | 108(31.76%) | 60(17.65%) | 7(2.06%) |
| 2000 | 115(33.82%) | 71(20.88%) | 76(22.35%) | 70(20.59%) | 8(2.35%) | |
| 2010 | 72(21.18%) | 61(17.94%) | 132(38.82%) | 66(19.41%) | 9(2.65%) | |
| 2020 | 96(28.24%) | 68(20.00%) | 95(27.94%) | 74(21.76%) | 7(2.06%) | |
| ecological space | 1990 | 16(4.71%) | 67(19.71%) | 134(39.41%) | 93(27.35%) | 30(8.82%) |
| 2000 | 18(5.29%) | 57(16.76%) | 165(48.53%) | 77(22.65%) | 23(6.76%) | |
| 2010 | 9(2.65%) | 66(19.41%) | 173(50.88%) | 77(22.65%) | 15(4.41%) | |
| 2020 | 4(1.18%) | 31(9.12%) | 196(57.65%) | 94(27.65%) | 15(4.41%) | |
| territorial space | 1990 | 29(8.53%) | 113(33.24%) | 121(35.59%) | 67(19.71%) | 10(2.94%) |
| 2000 | 18(5.29%) | 129(37.94%) | 134(39.41%) | 51(15.00%) | 8(2.35%) | |
| 2010 | 53(15.59%) | 111(32.65%) | 107(31.47%) | 62(18.24%) | 7(2.06%) | |
| 2020 | 11(3.24%) | 119(35.00%) | 145(42.65%) | 58(17.06%) | 7(2.06%) |
Table 4.
Statistics on the mean values of regression coefficients of impact factors based on the MGWR model in 1990, 2000, 2010 and 2020.
Table 4.
Statistics on the mean values of regression coefficients of impact factors based on the MGWR model in 1990, 2000, 2010 and 2020.
| Influencing Factors (Note: After the line is the abbreviation) | Sustainability of production space use | Sustainability of living space use | Sustainability of ecological space use | Sustainability of territorial space use |
|---|---|---|---|---|
| mean DEM (m)--MDEA | 0.0699 | 0.1083 | 0.2424 | 0.0567 |
| annual average precipitation (mm)--AAP | 0.0796 | -- | 0.0029 | 0.0651 |
| water area (m2) --WA | -0.2316 | -0.1976 | 0.0064 | -0.2662 |
| year-end real urban road area (hm2) --YERURA | -0.2296 | -0.091 | -0.3611 | -0.2816 |
| land reclamation rate (%) --LRR | 0.0309 | -- | -- | -0.0183 |
| GI core area (m2) --GICA | -0.2639 | 0.089 | -0.1259 | -0.1008 |
| urbanization Level--UL | 0.1081 | 0.2782 | 0.1558 | 0.2803 |
| land saving and intensive utilization level--LSIUL | 0.224 | -- | 0.1583 | 0.1368 |
| slope--S | -- | -0.0049 | 0.1497 | -- |
| annual average temperature (℃) --AAT | -- | 0.2333 | -- | -- |
| rating value of living space--RVLS | -- | 0.2724 | -- | 0.0884 |
| population density (person/ km2) --PD | -- | -0.1262 | -- | -- |
Disclaimer/Publisher’s Note: The statements, opinions and data contained in all publications are solely those of the individual author(s) and contributor(s) and not of MDPI and/or the editor(s). MDPI and/or the editor(s) disclaim responsibility for any injury to people or property resulting from any ideas, methods, instructions or products referred to in the content. |
© 2026 by the authors. Licensee MDPI, Basel, Switzerland. This article is an open access article distributed under the terms and conditions of the Creative Commons Attribution (CC BY) license (http://creativecommons.org/licenses/by/4.0/).
Copyright: This open access article is published under a Creative Commons CC BY 4.0 license, which permit the free download, distribution, and reuse, provided that the author and preprint are cited in any reuse.