

Submitted:
28 July 2026
Posted:
29 July 2026
You are already at the latest version
Abstract
Polyendocrine metabolic ovarian syndrome (PMOS), previously referred to as polycystic ovary syndrome, is conventionally diagnosed through reproductive manifestations, although its metabolic evolution before diagnosis remains poorly defined. Here we conducted an observational study of de-identified electronic health records from a large federated US network to characterize the prediagnostic evolution of PMOS through four complementary analyses. First, across a reference landscape of 1,929 clinical conditions spanning 15,087,821 people, PMOS combined high body weight at diagnosis of 94.3 kg with marked five-year prediagnostic weight gain of 10.0 kg, corresponding to 15.6%, positioning it alongside insulin resistance, metabolic syndrome and obesity rather than reproductive disorders. This condition-wide pattern placed PMOS within the metabolic disease landscape and raised the question of when the anthropometric divergence begins. Second, among 104,003 women receiving their first recorded PMOS diagnosis at a mean age of 30.9 years (s.d. 9.5) and matched controls, BMI was already higher at the earliest 15-year lookback during adolescence, averaging 23 kg m⁻² versus 20 kg m⁻², respectively (P < 0.001). During the final five years before diagnosis, mean weight increased from 85.9 kg to 94.0 kg, an 8.1 kg gain corresponding to 9.4%, and was 17.9 kg higher than in matched controls at diagnosis (94.0 kg vs 76.1 kg, P < 0.001). This established that the PMOS-associated weight gap was present during adolescence rather than emerging only near reproductive-age diagnosis. Third, among 809,719 women with BMI recorded between 5 and 20 years of age, 19,681 subsequently received a PMOS diagnosis. Ten-year cumulative PMOS incidence increased progressively from 3.3% with healthy BMI to 17.9% with obesity class III, corresponding to an RR of 5.4 (P < 0.001). Black women constituted 11.1% of the healthy-BMI group and 26.5% of the obesity class III group, a 2.4-fold difference across increasing adiposity bands (each band versus healthy BMI, P < 0.001). Thus, early-life adiposity not only preceded PMOS diagnosis but stratified subsequent incidence across a pronounced dose gradient. Fourth, among 1,416 matched case–control pairs with AI-extracted serial body-composition measurements, women with PMOS had 9.8 kg greater fat mass at diagnosis than controls (55.4 kg vs 45.6 kg, P < 0.001). Despite greater absolute lean mass, their lean-mass proportion was 3.8 percentage points lower (52.0% vs 55.8%, P < 0.001). Approximately 72% of the 14.1 kg excess total weight near diagnosis was non-lean mass, revealing that the prediagnostic weight excess was predominantly adipose. Together, these analyses trace an adiposity-linked prediagnostic continuum that begins during pediatric and adolescent years, stratifies more than fivefold variation in subsequent PMOS incidence and culminates in predominantly adipose weight excess before reproductive-age diagnosis.
Keywords:
PMOS
; weight
; BMI
Introduction
Polyendocrine metabolic ovarian syndrome (PMOS), previously named polycystic ovary syndrome (PCOS), affects approximately one in eight women and is the most common endocrine disorder of reproductive age. The recent global consensus name change was intended to replace an ovarian morphology-centred label with one that more accurately represents the condition as a lifelong disorder involving endocrine, metabolic and ovarian dysfunction [1]. Clinical diagnosis nevertheless remains anchored to reproductive and androgenic manifestations (Rotterdam criteria), including ovulatory dysfunction, clinical or biochemical hyperandrogenism and polycystic ovarian morphology or anti-Müllerian hormone concentrations in adults after exclusion of alternative disorders [2]. Metabolic dysfunction is central to clinical management but is not itself required for diagnosis.
This diagnostic framework creates a potential temporal mismatch between the biological evolution of PMOS and the point at which the disorder becomes clinically evident. Menstrual irregularity and androgenic features often emerge around puberty, when physiological variation can complicate diagnostic interpretation. Current guidelines therefore recommend longitudinal reassessment of adolescents with suggestive features, particularly those with persistent symptoms or substantial weight gain [2]. In practice, diagnosis frequently remains delayed. In an international survey of 1,385 women, 33.6% reported waiting more than two years and 47.1% consulted at least three healthcare professionals before receiving a diagnosis [3]. The natural history preceding that diagnosis remains poorly resolved, particularly during childhood and adolescence.
A metabolic origin is biologically plausible. Clamp studies have demonstrated insulin resistance in women with PMOS independently of obesity [4], while adipocytes from affected women show reduced insulin-stimulated glucose transport and lower GLUT4 abundance [5]. Adipose tissue studies have further identified enlarged adipocytes, reduced adiponectin, central fat accumulation and impaired insulin sensitivity even after matching for age and BMI [6,7]. Hyperinsulinaemia is closely associated with hyperandrogenism [8] and can potentiate gonadotropin-stimulated ovarian androgen production in vivo [9]. These observations support a model in which inherited susceptibility and tissue-specific insulin resistance interact with excess or dysfunctional adipose tissue, producing a reinforcing relationship between hyperinsulinaemia, androgen excess and further adiposity [4].
Previous studies have linked weight gain and obesity to PMOS, but the timing and composition of this association remain uncertain. In the Northern Finland Birth Cohort, women with PMOS symptoms or a subsequent diagnosis experienced greater weight gain from adolescence into adulthood [10]. An electronic health record study of 137,502 adolescents found progressively higher odds of diagnosed PMOS across increasing obesity classes [11]. Genome-wide cross-trait and Mendelian randomisation analyses have also supported contributions of both childhood and adult BMI to PMOS susceptibility [12,13]. However, these studies have not established when absolute body weight begins to diverge from unaffected women, whether childhood BMI predicts incident PMOS over subsequent decades, or whether the excess weight preceding diagnosis is predominantly adipose rather than lean tissue.
Here we used longitudinal electronic health records from a large federated network to define the prediagnostic natural history of PMOS. We first positioned PMOS within a population-wide landscape of prediagnostic weight change across 1,929 clinical conditions. We then reconstructed body weight and BMI trajectories extending up to 15 years before the first recorded diagnosis in 104,003 matched case-control pairs. In a separate cohort of 115,269 women, we examined whether BMI measured between 5 and 20 years of age stratified subsequent PMOS incidence. Finally, we evaluated longitudinal fat and lean mass trajectories in 1,416 matched pairs with body-composition measurements. Together, these analyses tested whether PMOS diagnosed during adulthood is preceded by a measurable pediatric and adolescent adiposity phenotype.
Methods
Study Design and Data Source
We conducted a retrospective, pharmacoepidemiologic study using de-identified electronic health record (EHR) data accessed through the nference federated network, spanning more than 30 million patients across multiple United States academic medical centers. Women with PMOS were identified by at least one diagnosis code for polycystic ovary syndrome (International Classification of Diseases, Tenth Revision [ICD-10] E28.2 or Ninth Revision [ICD-9] 256.4), and each woman's earliest such diagnosis defined her index date. For the natural-history analysis, all women with PMOS and longitudinal anthropometric data were retained.
Natural History of PMOS
PMOS cases were matched 1:1 without replacement to non-PMOS women exactly on age, race, calendar year of index, and measurement-density band (the number of pre-index weight measurements), with the matched control assigned her case's index date; BMI was deliberately not matched so that divergence in adiposity and body composition would be preserved. Weight and body-composition trajectories were constructed on a uniform grid of six-month intervals spanning up to 15 years before to 5 years after index; within each interval, each patient contributed the median of her measurements, and interval means were aggregated across patients. A body-composition subcohort with paired weight and lean body mass measurements supported the analysis of the lean and fat proportions and of fat mass.
Population-Wide Pre-Diagnosis Weight Change Across Conditions
To position PMOS among clinical conditions by its pre-diagnosis weight trajectory, we assembled a whole-population reference from all patients in the network with routine-vitals body-weight measurements. For every disease concept present in at least 100 patients, and for each patient with that condition (index defined as the earliest date of the condition), we computed two quantities from routine outpatient weights: the baseline weight nearest to and within one year before index, and a five-year pre-diagnosis weight change defined as the median weight in the year before index minus the median weight five to six years before index (window centers five years apart, so the difference is a five-year change without normalization by time), reported in kilograms and as a percentage. Per-condition means were aggregated, and conditions were displayed as a scatter of baseline weight versus five-year pre-diagnosis weight change, colored by metabolic, reproductive/gynecologic, or other categories, with PMOS highlighted (Figure 1).
Childhood and Adolescent BMI and Incident PMOS
To evaluate whether early-life adiposity stratified subsequent PMOS incidence, we assembled a separate cohort of women with at least one BMI measurement recorded between 5 and 20 years of age, with age at each measurement computed from the year of birth. For each woman a single landmark BMI was selected as the measurement nearest 12.5 years of age within this window; for women later diagnosed with PMOS, only measurements on or before the PMOS index date were eligible, so the landmark always preceded diagnosis. Each landmark BMI was classified into absolute categories (underweight, below 18.5 kg/m²; healthy, 18.5 to below 25; overweight, 25 to below 30; obesity class I, 30 to below 35; class II, 35 to below 40; class III, at least 40 kg/m²) and, as a sensitivity classification, into age-standardized BMI-for-age percentile bands derived from the U.S. Centers for Disease Control and Prevention growth reference. Follow-up began at the landmark, and each woman contributed time until the earliest of an incident PMOS diagnosis, her last observed record (weight, BMI or diagnosis), death, or attained age 45 years; only women with follow-up beyond the landmark were retained. Cumulative PMOS incidence was estimated from the landmark and, in a complementary attained-age analysis, evaluated at a fixed age of 25 years and stratified by age at BMI measurement (5 to 10, 10 to 15 and 15 to 20 years).
Comorbidities and Medications
Baseline comorbidities were defined by fifteen predefined condition groups, each specified by a set of ICD-9 and ICD-10 diagnosis-code prefixes (for example, E11 and 250 for type 2 diabetes; the full code sets are shown in brackets in the corresponding tables). Medication use was summarized for fourteen curated drug groups (metformin, glucagon-like peptide-1 receptor agonists [GLP-1 RA], sodium-glucose co-transporter-2 inhibitors, dipeptidyl-peptidase-4 inhibitors, sulfonylureas, insulin, combined oral contraceptives, cyclic progestins, anti-androgens, ovulation-induction agents, statins, antihypertensives, antidepressants and thyroid hormone), each matched by generic and brand name; the constituent drug names for every group are listed (Table 2). For the matched trajectory and body-composition cohorts, a comorbidity or medication was counted when the woman had at least one qualifying diagnosis or prescription within six months before or after her index date (Table 1, Table 3, Table 6 and Table 7). For the childhood and adolescent BMI cohort, comorbidities and medications were instead counted as incident occurrences after the landmark BMI measurement, reflecting conditions and treatments accrued over subsequent follow-up (Table 4 and Table 5).

Table 1.
Baseline characteristics and comorbidities of women with PMOS and matched non-PMOS controls in the overall weight-trajectory cohort (comorbidities within ±6 months of index).
Table 1.
Baseline characteristics and comorbidities of women with PMOS and matched non-PMOS controls in the overall weight-trajectory cohort (comorbidities within ±6 months of index).
| Characteristic | PMOS cases (N=104003) | Matched controls (N=104003) | Standardized mean difference |
|---|---|---|---|
| Matching variables | |||
| Age at index, years | 30.9 (9.5) | 30.9 (9.5) | 0.000 |
| Index calendar year | 2020.1 (4.2) | 2020.1 (4.2) | 0.000 |
| Weight measurements, n (density) | 28.6 (32.0) | 30.3 (50.7) | -0.041 |
| Race: White | 75,745 (72.8%) | 75,745 (72.8%) | 0.000 |
| Race: Black | 14,201 (13.7%) | 14,201 (13.7%) | 0.000 |
| Race: Asian | 4,154 (4.0%) | 4,154 (4.0%) | 0.000 |
| Race: Hispanic | 1,940 (1.9%) | 1,940 (1.9%) | 0.000 |
| Race: Other / unknown | 7,963 (7.7%) | 7,963 (7.7%) | 0.000 |
| Baseline anthropometrics | |||
| Baseline weight, kg | 94.0 (25.2) | 76.1 (21.0) | 0.772 |
| Baseline body mass index, kg/m2 | 33.2 (6.4) | 27.3 (5.7) | 0.967 |
| Comorbidities (>= 1 diagnosis within +/-6 months of index) | |||
| Hypertension [I10-I13, I15; 401-405] | 14,379 (13.8%) | 5,384 (5.2%) | 0.298 |
| Dyslipidemia [E78*; 272*] | 13,560 (13.0%) | 4,330 (4.2%) | 0.321 |
| Type 2 diabetes [E11*; 250*] | 8,343 (8.0%) | 2,156 (2.1%) | 0.274 |
| Prediabetes [R73.0*; 790.2*] | 10,161 (9.8%) | 1,915 (1.8%) | 0.344 |
| Obesity [E66*; 278.0*] | 37,681 (36.2%) | 8,211 (7.9%) | 0.727 |
| Ischemic heart disease [I20-I25; 410-414] | 897 (0.9%) | 454 (0.4%) | 0.053 |
| Heart failure [I50*; 428*] | 603 (0.6%) | 413 (0.4%) | 0.026 |
| Atrial fibrillation [I48*; 427.31] | 357 (0.3%) | 263 (0.3%) | 0.017 |
| Stroke / TIA [I60-I69, G45*; 430-438] | 705 (0.7%) | 495 (0.5%) | 0.027 |
| Venous thromboembolism [I26, I80-I82; 415, 451, 453] | 1,240 (1.2%) | 631 (0.6%) | 0.062 |
| MASLD / NAFLD [K76.0, K75.81; 571.5/8/9] | 3,604 (3.5%) | 687 (0.7%) | 0.198 |
| Obstructive sleep apnea [G47.33; 327.23, 780.57] | 6,412 (6.2%) | 1,267 (1.2%) | 0.265 |
| Depression [F32*, F33*; 296*, 311] | 14,218 (13.7%) | 6,749 (6.5%) | 0.240 |
| Anxiety [F40*, F41*; 300.0*] | 25,310 (24.3%) | 13,106 (12.6%) | 0.306 |
| Infertility [N97*; 628*] | 7,976 (7.7%) | 721 (0.7%) | 0.354 |
Table 2.
Medication groups and the drug names / search terms used to define them.
| Medication group | Drug names / search terms |
|---|---|
| Metformin | metformin, glucophage, glumetza, fortamet, riomet |
| GLP-1 receptor agonist | semaglutide, ozempic, rybelsus, wegovy, tirzepatide, mounjaro, zepbound, dulaglutide, trulicity, liraglutide, victoza, saxenda, exenatide, byetta, bydureon, lixisenatide, adlyxin, albiglutide |
| SGLT2 inhibitor | canagliflozin, dapagliflozin, empagliflozin, ertugliflozin |
| DPP-4 inhibitor | sitagliptin, saxagliptin, linagliptin, alogliptin |
| Sulfonylurea | glipizide, glyburide, glibenclamide, glimepiride, gliclazide, chlorpropamide, tolazamide, tolbutamide |
| Insulin | insulin, glargine, lispro, aspart, detemir, degludec, lantus, humalog, novolog, novorapid, levemir, tresiba, humulin, novolin, toujeo, basaglar, lyumjev, fiasp |
| Combined oral contraceptive | ethinyl estradiol, drospirenone, norgestimate, levonorgestrel, desogestrel, norelgestromin, etonogestrel |
| Cyclic progestin | medroxyprogesterone, norethindrone, progesterone |
| Anti-androgen | spironolactone, finasteride, flutamide, cyproterone, bicalutamide |
| Ovulation induction | clomiphene, letrozole |
| Statin | atorvastatin, rosuvastatin, simvastatin, pravastatin, lovastatin, pitavastatin, fluvastatin, lipitor, crestor, zocor, pravachol, livalo |
| Antihypertensive | lisinopril, enalapril, ramipril, benazepril, captopril, quinapril, fosinopril, perindopril, trandolapril, moexipril, losartan, valsartan, olmesartan, irbesartan, candesartan, telmisartan, azilsartan, eprosartan, hydrochlorothiazide, chlorthalidone, indapamide, metolazone, amlodipine, nifedipine, diltiazem, verapamil, felodipine, nicardipine, isradipine, nisoldipine, metoprolol, atenolol, carvedilol, propranolol, bisoprolol, nebivolol, labetalol, nadolol, acebutolol |
| Antidepressant | sertraline, fluoxetine, paroxetine, citalopram, escitalopram, venlafaxine, desvenlafaxine, duloxetine, bupropion, mirtazapine, trazodone, amitriptyline, nortriptyline, fluvoxamine, vortioxetine, zoloft, prozac, paxil, celexa, lexapro, effexor, cymbalta, wellbutrin |
| Thyroid hormone | levothyroxine, liothyronine, synthroid, levoxyl, unithroid, tirosint, cytomel, armour thyroid |
Table 3.
Medication use (≥1 prescription within ±6 months of index) in the overall weight-trajectory cohort. Drug names for each class are in Table 2.
Table 3.
Medication use (≥1 prescription within ±6 months of index) in the overall weight-trajectory cohort. Drug names for each class are in Table 2.
| Medication group | PMOS cases (N=104,003) | Matched controls (N=104,003) | Standardized mean difference |
|---|---|---|---|
| Metformin | 33,067 (31.8%) | 1,840 (1.8%) | 0.877 |
| GLP-1 receptor agonist | 10,016 (9.6%) | 2,173 (2.1%) | 0.325 |
| SGLT2 inhibitor | 949 (0.9%) | 288 (0.3%) | 0.083 |
| DPP-4 inhibitor | 466 (0.4%) | 138 (0.1%) | 0.059 |
| Sulfonylurea | 1,031 (1.0%) | 323 (0.3%) | 0.085 |
| Insulin | 6,291 (6.0%) | 3,419 (3.3%) | 0.131 |
| Combined oral contraceptive | 25,763 (24.8%) | 12,402 (11.9%) | 0.337 |
| Cyclic progestin | 27,803 (26.7%) | 9,268 (8.9%) | 0.479 |
| Anti-androgen | 12,503 (12.0%) | 1,541 (1.5%) | 0.430 |
| Ovulation induction | 5,673 (5.5%) | 368 (0.4%) | 0.307 |
| Statin | 4,904 (4.7%) | 2,178 (2.1%) | 0.145 |
| Antihypertensive | 19,818 (19.1%) | 10,433 (10.0%) | 0.258 |
| Antidepressant | 33,165 (31.9%) | 19,928 (19.2%) | 0.295 |
| Thyroid hormone | 10,295 (9.9%) | 4,098 (3.9%) | 0.236 |
Table 4.
Characteristics and comorbidity incidence after the BMI measurement of the childhood/adolescent BMI cohort by absolute BMI band.
Table 4.
Characteristics and comorbidity incidence after the BMI measurement of the childhood/adolescent BMI cohort by absolute BMI band.
| Characteristic | Underweight | Healthy | Overweight | Obesity I | Obesity II | Obesity III |
|---|---|---|---|---|---|---|
| N (women) | 184,555 | 395,749 | 128,173 | 57,713 | 25,894 | 17,635 |
| Age at BMI measurement, years | 11.7 (3.3) | 14.8 (3.0) | 15.3 (2.9) | 15.6 (2.8) | 16.0 (2.7) | 16.4 (2.6) |
| BMI at measurement, kg/m2 | 16.6 (1.4) | 21.4 (1.8) | 27.1 (1.4) | 32.1 (1.4) | 37.1 (1.4) | 41.7 (3.9) |
| Race: White | 139,887 (75.8%) | 293,030 (74.0%) | 88,401 (69.0%) | 37,489 (65.0%) | 16,219 (62.6%) | 10,366 (58.8%) |
| Race: Black | 17,342 (9.4%) | 44,057 (11.1%) | 19,132 (14.9%) | 10,702 (18.5%) | 5,566 (21.5%) | 4,671 (26.5%) |
| Race: Asian | 7,416 (4.0%) | 14,049 (3.5%) | 3,534 (2.8%) | 1,393 (2.4%) | 566 (2.2%) | 374 (2.1%) |
| Race: Hispanic | 2,738 (1.5%) | 8,882 (2.2%) | 4,365 (3.4%) | 2,280 (4.0%) | 959 (3.7%) | 545 (3.1%) |
| Race: Other / unknown | 17,172 (9.3%) | 35,731 (9.0%) | 12,741 (9.9%) | 5,849 (10.1%) | 2,584 (10.0%) | 1,679 (9.5%) |
| Comorbidity incidence after the BMI measurement | ||||||
| Hypertension [I10-I13, I15; 401-405] | 1,215 (0.7%) | 5,264 (1.3%) | 3,227 (2.5%) | 2,349 (4.1%) | 1,573 (6.1%) | 1,597 (9.1%) |
| Dyslipidemia [E78*; 272*] | 2,365 (1.3%) | 9,292 (2.3%) | 5,267 (4.1%) | 3,292 (5.7%) | 1,909 (7.4%) | 1,394 (7.9%) |
| Type 2 diabetes [E11*; 250*] | 419 (0.2%) | 1,588 (0.4%) | 1,252 (1.0%) | 1,178 (2.0%) | 912 (3.5%) | 922 (5.2%) |
| Prediabetes [R73.0*; 790.2*] | 989 (0.5%) | 5,006 (1.3%) | 3,894 (3.0%) | 3,033 (5.3%) | 1,974 (7.6%) | 1,681 (9.5%) |
| Obesity [E66*; 278.0*] | 1,863 (1.0%) | 20,934 (5.3%) | 20,681 (16.1%) | 13,935 (24.1%) | 7,542 (29.1%) | 5,361 (30.4%) |
| Ischemic heart disease [I20-I25; 410-414] | 210 (0.1%) | 497 (0.1%) | 217 (0.2%) | 88 (0.2%) | 51 (0.2%) | 47 (0.3%) |
| Heart failure [I50*; 428*] | 191 (0.1%) | 421 (0.1%) | 168 (0.1%) | 92 (0.2%) | 63 (0.2%) | 73 (0.4%) |
| Atrial fibrillation [I48*; 427.31] | 107 (0.1%) | 320 (0.1%) | 107 (0.1%) | 63 (0.1%) | 23 (0.1%) | 23 (0.1%) |
| Stroke / TIA [I60-I69, G45*; 430-438] | 339 (0.2%) | 973 (0.2%) | 343 (0.3%) | 173 (0.3%) | 78 (0.3%) | 62 (0.4%) |
| Venous thromboembolism [I26, I80-I82; 415, 451, 453] | 432 (0.2%) | 1,557 (0.4%) | 697 (0.5%) | 397 (0.7%) | 210 (0.8%) | 170 (1.0%) |
| MASLD / NAFLD [K76.0, K75.81; 571.5/8/9] | 343 (0.2%) | 1,466 (0.4%) | 1,328 (1.0%) | 1,062 (1.8%) | 730 (2.8%) | 631 (3.6%) |
| Obstructive sleep apnea [G47.33; 327.23, 780.57] | 912 (0.5%) | 2,717 (0.7%) | 1,808 (1.4%) | 1,388 (2.4%) | 982 (3.8%) | 1,180 (6.7%) |
| Depression [F32*, F33*; 296*, 311] | 15,055 (8.2%) | 44,321 (11.2%) | 16,376 (12.8%) | 8,042 (13.9%) | 3,802 (14.7%) | 2,655 (15.1%) |
| Anxiety [F40*, F41*; 300.0*] | 28,543 (15.5%) | 79,824 (20.2%) | 26,832 (20.9%) | 12,292 (21.3%) | 5,601 (21.6%) | 3,676 (20.8%) |
| Infertility [N97*; 628*] | 564 (0.3%) | 2,580 (0.7%) | 1,130 (0.9%) | 608 (1.1%) | 319 (1.2%) | 262 (1.5%) |
Table 5.
Medication incidence after the BMI measurement in the childhood/adolescent BMI cohort by absolute BMI band (drug names in Table 2).
Table 5.
Medication incidence after the BMI measurement in the childhood/adolescent BMI cohort by absolute BMI band (drug names in Table 2).
| Medication group | Underweight (N=184,555) | Healthy (N=395,749) | Overweight (N=128,173) | Obesity I (N=57,713) | Obesity II (N=25,894) | Obesity III (N=17,635) |
|---|---|---|---|---|---|---|
| Metformin | 730 (0.4%) | 5,151 (1.3%) | 4,907 (3.8%) | 4,417 (7.7%) | 3,015 (11.6%) | 2,659 (15.1%) |
| GLP-1 receptor agonist | 416 (0.2%) | 4,868 (1.2%) | 4,987 (3.9%) | 3,890 (6.7%) | 2,590 (10.0%) | 2,414 (13.7%) |
| SGLT2 inhibitor | 43 (0.0%) | 185 (0.0%) | 193 (0.2%) | 189 (0.3%) | 151 (0.6%) | 175 (1.0%) |
| DPP-4 inhibitor | 11 (0.0%) | 49 (0.0%) | 76 (0.1%) | 67 (0.1%) | 47 (0.2%) | 64 (0.4%) |
| Sulfonylurea | 135 (0.1%) | 351 (0.1%) | 229 (0.2%) | 247 (0.4%) | 173 (0.7%) | 186 (1.1%) |
| Insulin | 4,739 (2.6%) | 14,791 (3.7%) | 5,435 (4.2%) | 2,721 (4.7%) | 1,435 (5.5%) | 1,123 (6.4%) |
| Combined oral contraceptive | 36,439 (19.7%) | 108,371 (27.4%) | 34,433 (26.9%) | 15,386 (26.7%) | 6,728 (26.0%) | 4,335 (24.6%) |
| Cyclic progestin | 25,731 (13.9%) | 74,517 (18.8%) | 24,222 (18.9%) | 11,070 (19.2%) | 5,173 (20.0%) | 3,412 (19.3%) |
| Anti-androgen | 4,486 (2.4%) | 13,198 (3.3%) | 3,965 (3.1%) | 1,758 (3.0%) | 941 (3.6%) | 728 (4.1%) |
| Ovulation induction | 290 (0.2%) | 1,470 (0.4%) | 624 (0.5%) | 355 (0.6%) | 159 (0.6%) | 96 (0.5%) |
| Statin | 358 (0.2%) | 1,448 (0.4%) | 895 (0.7%) | 603 (1.0%) | 392 (1.5%) | 360 (2.0%) |
| Antihypertensive | 11,273 (6.1%) | 37,243 (9.4%) | 14,086 (11.0%) | 7,220 (12.5%) | 3,735 (14.4%) | 3,003 (17.0%) |
| Antidepressant | 34,886 (18.9%) | 97,367 (24.6%) | 33,054 (25.8%) | 15,272 (26.5%) | 6,973 (26.9%) | 4,603 (26.1%) |
| Thyroid hormone | 1,895 (1.0%) | 6,808 (1.7%) | 3,215 (2.5%) | 1,846 (3.2%) | 954 (3.7%) | 762 (4.3%) |
Table 6.
Comorbidities (≥1 diagnosis within ±6 months of index) of the body-composition subcohort (PMOS vs matched controls).
Table 6.
Comorbidities (≥1 diagnosis within ±6 months of index) of the body-composition subcohort (PMOS vs matched controls).
| Characteristic | PMOS cases (N=1416) | Matched controls (N=1416) | Standardized mean difference |
|---|---|---|---|
| Matching variables | |||
| Age at diagnosis, years | 34.9 (11.1) | 34.9 (11.1) | 0.000 |
| Index calendar year | 2020.8 (3.4) | 2020.8 (3.4) | 0.000 |
| Body-composition measurements, n (±5 y) | 4.0 (4.3) | 4.1 (4.6) | -0.016 |
| Race: White | 1,099 (77.6%) | 1,099 (77.6%) | 0.000 |
| Race: Black | 246 (17.4%) | 246 (17.4%) | 0.000 |
| Race: Unknown | 68 (4.8%) | 68 (4.8%) | 0.000 |
| Race: Asian | <11 | <11 | 0.000 |
| Baseline anthropometrics | |||
| Baseline BMI, kg/m² | 38.0 (5.1) | 34.9 (6.8) | 0.516 |
| Baseline weight, kg | 112.5 (27.5) | 98.4 (27.7) | 0.511 |
| Baseline lean body mass, kg | 57.0 (13.3) | 53.0 (13.5) | 0.298 |
| Comorbidities (>= 1 diagnosis within +/-6 months of index) | |||
| Hypertension [I10-I13, I15; 401-405] | 423 (29.9%) | 313 (22.1%) | 0.178 |
| Dyslipidemia [E78*; 272*] | 357 (25.2%) | 252 (17.8%) | 0.181 |
| Type 2 diabetes [E11*; 250*] | 227 (16.0%) | 104 (7.3%) | 0.273 |
| Prediabetes [R73.0*; 790.2*] | 269 (19.0%) | 206 (14.5%) | 0.119 |
| Obesity [E66*; 278.0*] | 1,137 (80.3%) | 978 (69.1%) | 0.260 |
| Ischemic heart disease [I20-I25; 410-414] | 27 (1.9%) | 28 (2.0%) | -0.005 |
| Heart failure [I50*; 428*] | 16 (1.1%) | 18 (1.3%) | -0.013 |
| Atrial fibrillation [I48*; 427.31] | 12 (0.8%) | <11 | 0.016 |
| Stroke / TIA [I60-I69, G45*; 430-438] | 11 (0.8%) | 18 (1.3%) | -0.049 |
| Venous thromboembolism [I26, I80-I82; 415, 451, 453] | 30 (2.1%) | 26 (1.8%) | 0.020 |
| MASLD / NAFLD [K76.0, K75.81; 571.5/8/9] | 179 (12.6%) | 117 (8.3%) | 0.143 |
| Obstructive sleep apnea [G47.33; 327.23, 780.57] | 335 (23.7%) | 199 (14.1%) | 0.247 |
| Depression [F32*, F33*; 296*, 311] | 265 (18.7%) | 236 (16.7%) | 0.054 |
| Anxiety [F40*, F41*; 300.0*] | 450 (31.8%) | 421 (29.7%) | 0.044 |
| Infertility [N97*; 628*] | 31 (2.2%) | <11 | 0.124 |
Table 7.
Medication use (≥1 prescription within ±6 months of index) in the body-composition subcohort (drug names in Table 2).
Table 7.
Medication use (≥1 prescription within ±6 months of index) in the body-composition subcohort (drug names in Table 2).
| Characteristic | PMOS cases (N=1416) | Matched controls (N=1416) | Standardized mean difference |
|---|---|---|---|
| Metformin | 680 (48.0%) | 268 (18.9%) | 0.648 |
| GLP-1 receptor agonist | 539 (38.1%) | 426 (30.1%) | 0.169 |
| SGLT2 inhibitor | 21 (1.5%) | 17 (1.2%) | 0.025 |
| DPP-4 inhibitor | 11 (0.8%) | <11 | 0.046 |
| Sulfonylurea | 26 (1.8%) | <11 | 0.117 |
| Insulin | 133 (9.4%) | 101 (7.1%) | 0.082 |
| Combined oral contraceptive | 363 (25.6%) | 200 (14.1%) | 0.291 |
| Cyclic progestin | 251 (17.7%) | 146 (10.3%) | 0.215 |
| Anti-androgen | 204 (14.4%) | 53 (3.7%) | 0.378 |
| Ovulation induction | 22 (1.6%) | <11 | 0.088 |
| Statin | 134 (9.5%) | 103 (7.3%) | 0.079 |
| Antihypertensive | 524 (37.0%) | 399 (28.2%) | 0.189 |
| Antidepressant | 637 (45.0%) | 583 (41.2%) | 0.077 |
| Thyroid hormone | 198 (14.0%) | 144 (10.2%) | 0.117 |
Body-Composition Measures
Body-composition measurements were extracted from clinical notes using a large language model workflow [14]. Candidate notes were first enriched with a body-composition keyword strategy (for example, lean body mass, fat mass, fat percentage, bioimpedance and dual-energy X-ray absorptiometry terminology), after which a note-level large language model (gpt-oss-20b) was applied with structured output to extract the measurement date, measurement source, body weight, fat percentage and lean body mass together with supporting evidence text. Extracted values were harmonized to consistent units, with weight, lean body mass and fat mass expressed in kilograms; unit inconsistencies were resolved using explicit unit strings, note evidence text, parenthetical metric equivalents, arithmetic consistency among total weight, lean body mass and fat percentage, and proximal structured weight measurements. Measurement sources were canonicalized into device-level categories (for example, bioimpedance, dual-energy X-ray absorptiometry, air-displacement plethysmography and indirect calorimetry), and structured body weight and BMI were obtained from structured measurement tables. For the body-composition subcohort, fat mass was derived as total body weight minus lean body mass, and the fat and lean proportions were computed as the corresponding fraction of total body weight.
Statistical Analysis
Continuous measures were compared by the two-sided Welch t-test, and covariate balance between matched groups was summarized by the standardized mean difference (SMD), with an absolute value above 0.1 indicating residual imbalance (Table 1, Table 3, Table 6 and Table 7). Body-weight and BMI trajectories (Figure 2) and the absolute body-composition trajectories (Figure 4A–E) are displayed as interval means with 95% confidence bands; the overall between-group difference in the absolute measure was tested at the index interval by the two-sided Welch t-test and reported as Pgroup, and the absolute between-group gap over time is shown directly in the difference panels (Figure 2B,D). For the normalized (near-index - referenced) body-composition trajectories, the difference in trajectory shape is reported as Pgroup × time (Figure 4F–I). For the childhood and adolescent BMI cohort, cumulative PMOS incidence was estimated by the Kaplan-Meier method with Greenwood 95% confidence bands, curves across BMI categories were compared by the log-rank test, and ten-year relative risks were computed relative to the healthy-BMI reference group with log-normal (Katz) confidence intervals (Figure 3). Prevalences of comorbidities and medications were compared between groups by two-proportion z-tests. Event counts and category counts below 11 are reported as '<11' per the privacy convention adopted in this study. Analyses were performed in Python with numpy, pandas and scipy.
Figure 2.
Higher body weight and BMI are evident 15 years before PMOS diagnosis and the absolute gap widens toward the index date. Body weight (A) and BMI (C) from up to 15 years before to 5 years after the first PMOS diagnosis, in 104,003 women with PMOS and 104,003 non-PMOS women matched on age, race, calendar year and pre-index measurement density; the displayed window is truncated where data become sparse. Panels B and D show the mean between-group difference (PMOS minus control) in weight (kg) and BMI (kg/m²), with the zero line indicating no difference. The x-axis is years from the first PMOS diagnosis (or the matched pseudo-index for controls); shaded bands denote the 95% confidence interval of the mean (A, C) or of the difference (B, D). Pgroup denotes the overall between-group difference.
Figure 2.
Higher body weight and BMI are evident 15 years before PMOS diagnosis and the absolute gap widens toward the index date. Body weight (A) and BMI (C) from up to 15 years before to 5 years after the first PMOS diagnosis, in 104,003 women with PMOS and 104,003 non-PMOS women matched on age, race, calendar year and pre-index measurement density; the displayed window is truncated where data become sparse. Panels B and D show the mean between-group difference (PMOS minus control) in weight (kg) and BMI (kg/m²), with the zero line indicating no difference. The x-axis is years from the first PMOS diagnosis (or the matched pseudo-index for controls); shaded bands denote the 95% confidence interval of the mean (A, C) or of the difference (B, D). Pgroup denotes the overall between-group difference.
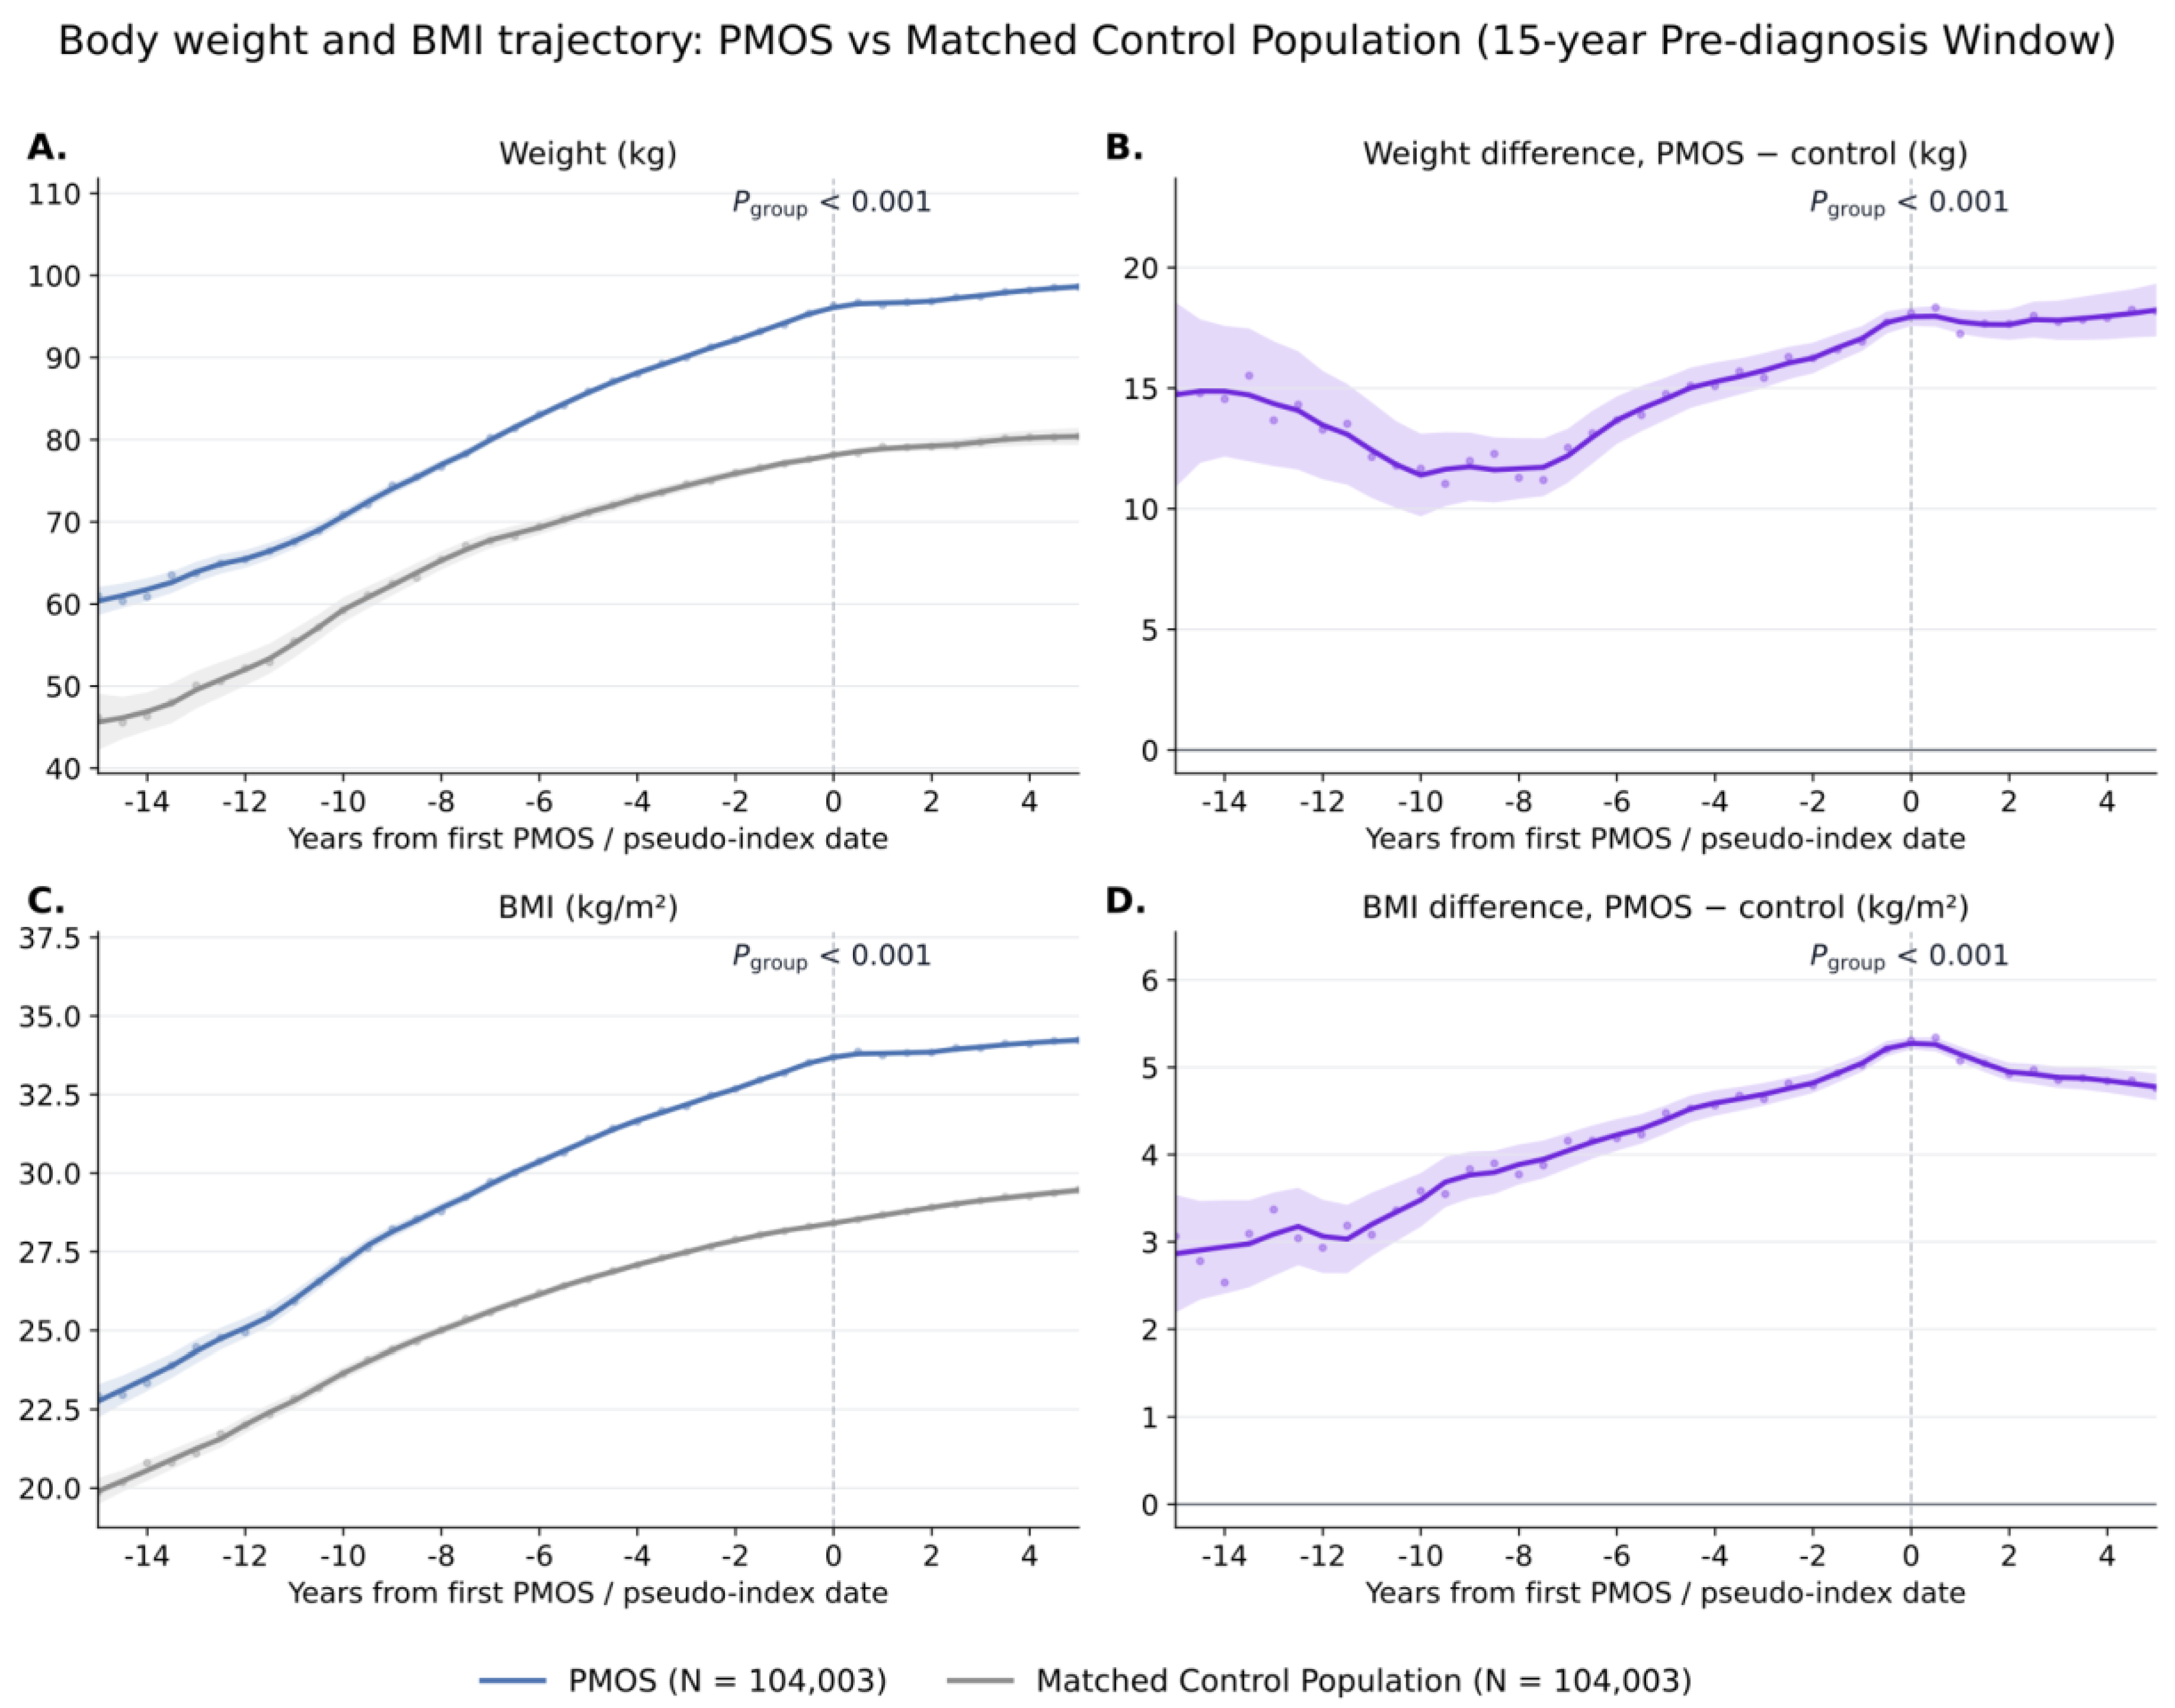
Figure 3.
Childhood and adolescent BMI stratifies subsequent PMOS incidence. Childhood and adolescent BMI measured between 5 and 20 years of age was evaluated in 809,719 women, among whom 19,681 subsequently received an incident PMOS diagnosis. A. Cohort distribution across BMI categories. Underweight was defined as BMI below 18.5 kg/m², healthy BMI as 18.5 to below 25 kg/m², overweight as 25 to below 30 kg/m², obesity class I as 30 to below 35 kg/m², obesity class II as 35 to below 40 kg/m² and obesity class III as at least 40 kg/m². B. Ten-year cumulative PMOS incidence across BMI categories; labels show the cumulative incidence and the number of incident PMOS diagnoses, and relative risks compare each category with the healthy-BMI reference group. C. Cumulative PMOS incidence over time by childhood or adolescent BMI category, with shaded 95% confidence bands; differences across curves were assessed by the log-rank test. D. Cumulative PMOS incidence by age 25 by BMI category and age at BMI measurement (5–10, 10–15 and 15–20 years); labels show cumulative incidence and the number of contributing participants. Cells with fewer than 11 events are not shown, per the privacy convention adopted in this study.
Figure 3.
Childhood and adolescent BMI stratifies subsequent PMOS incidence. Childhood and adolescent BMI measured between 5 and 20 years of age was evaluated in 809,719 women, among whom 19,681 subsequently received an incident PMOS diagnosis. A. Cohort distribution across BMI categories. Underweight was defined as BMI below 18.5 kg/m², healthy BMI as 18.5 to below 25 kg/m², overweight as 25 to below 30 kg/m², obesity class I as 30 to below 35 kg/m², obesity class II as 35 to below 40 kg/m² and obesity class III as at least 40 kg/m². B. Ten-year cumulative PMOS incidence across BMI categories; labels show the cumulative incidence and the number of incident PMOS diagnoses, and relative risks compare each category with the healthy-BMI reference group. C. Cumulative PMOS incidence over time by childhood or adolescent BMI category, with shaded 95% confidence bands; differences across curves were assessed by the log-rank test. D. Cumulative PMOS incidence by age 25 by BMI category and age at BMI measurement (5–10, 10–15 and 15–20 years); labels show cumulative incidence and the number of contributing participants. Cells with fewer than 11 events are not shown, per the privacy convention adopted in this study.
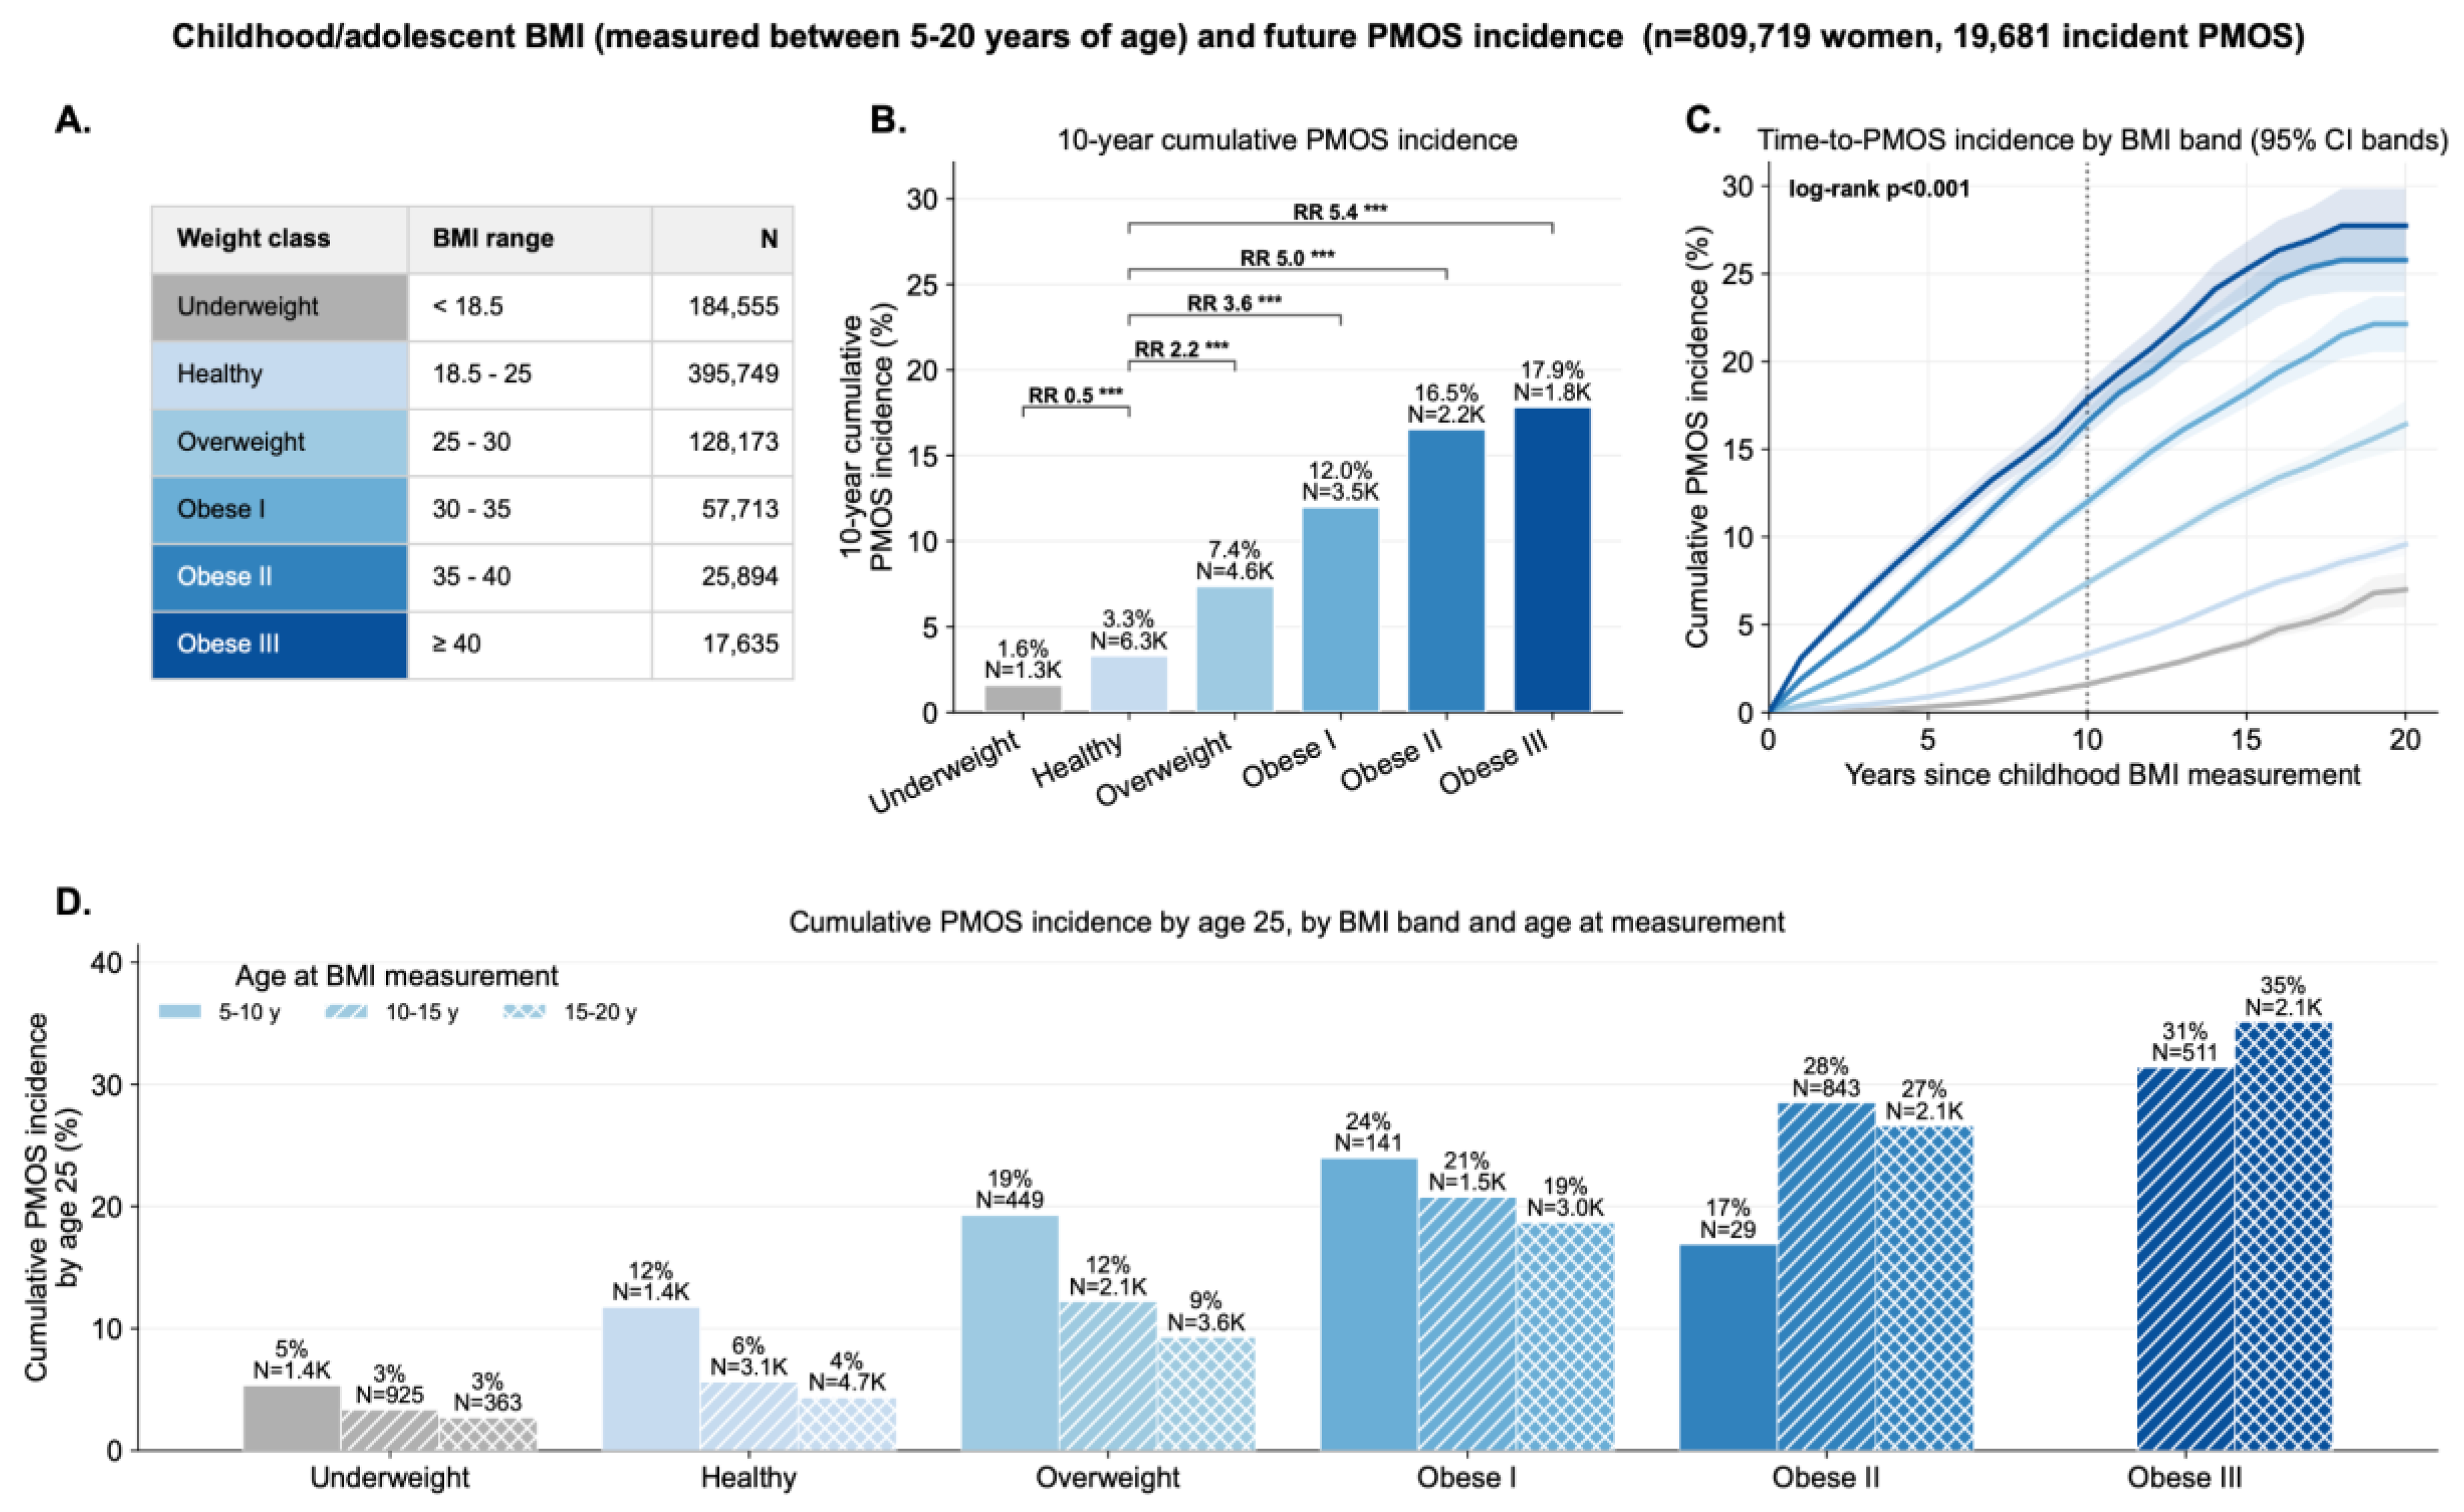
Figure 4.
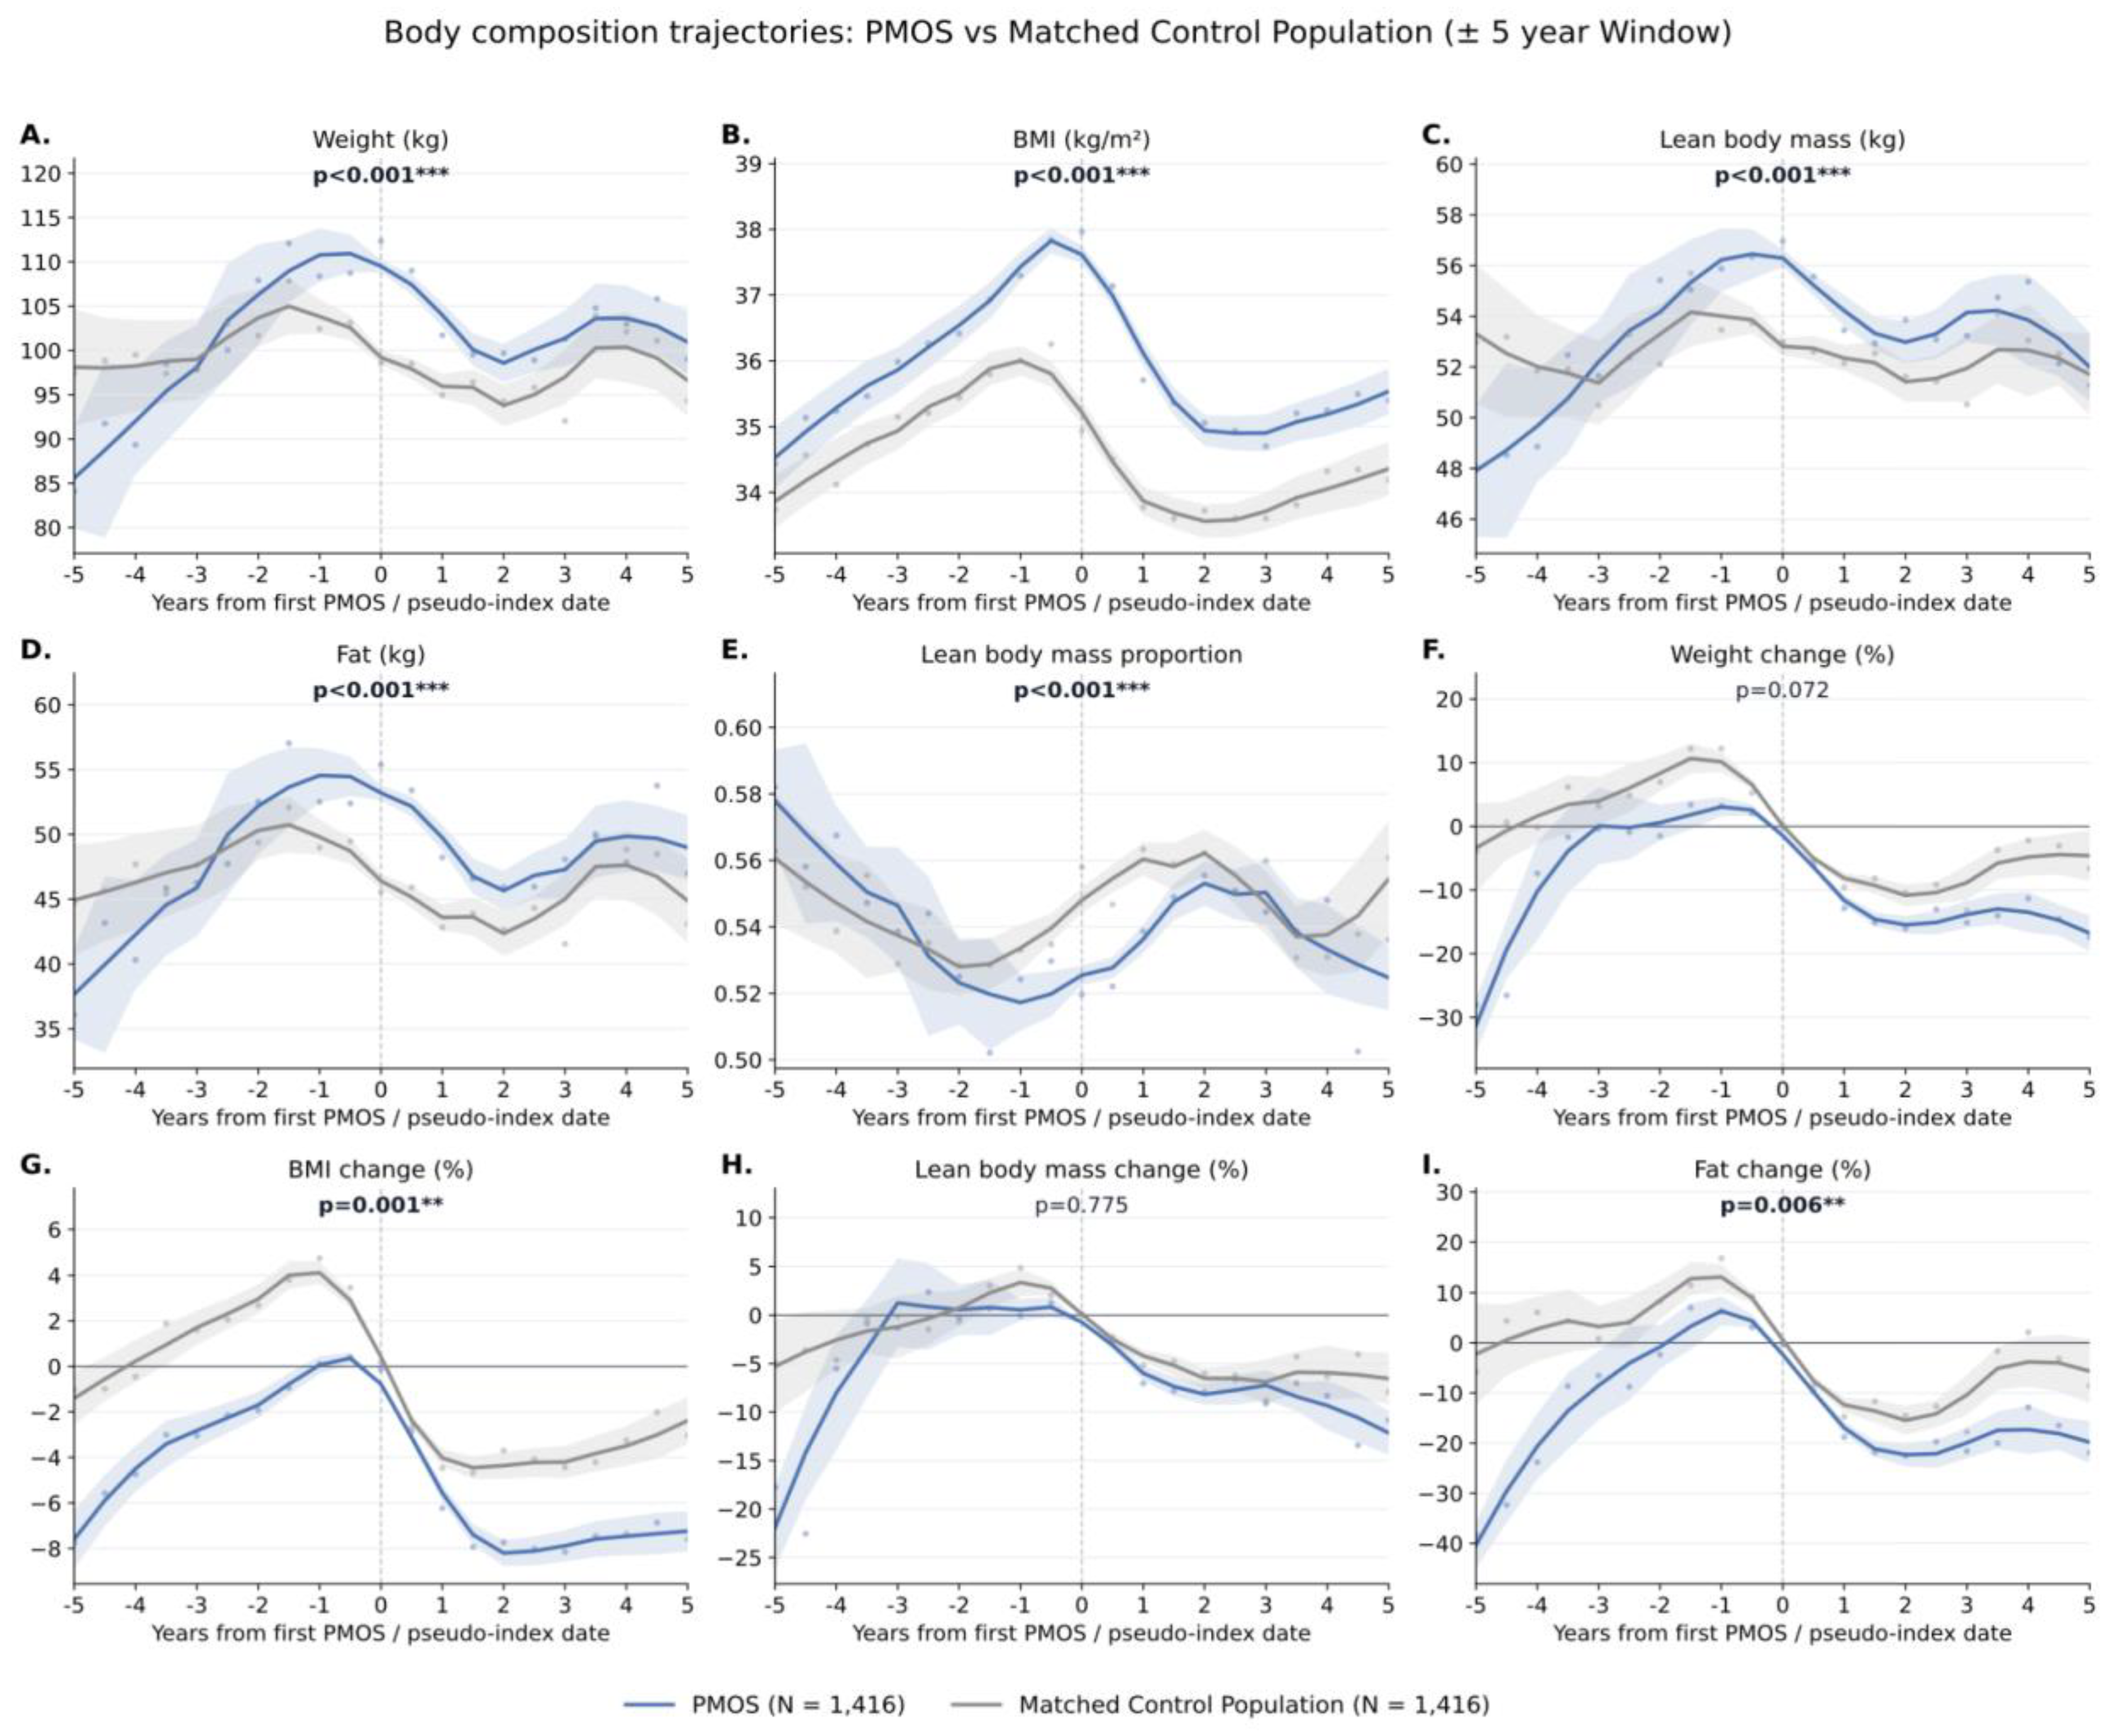
Fat-predominant weight gain and a falling lean-mass proportion precede PMOS. Body weight, BMI, lean body mass, fat mass and the lean body mass proportion of body weight (A-E), and the corresponding changes relative to each cohort's near-index value (F-I), over the years around the first PMOS diagnosis, in 1,416 women with PMOS and paired body-composition measurements matched 1:1 to 1,416 non-PMOS women on age, race, calendar year of index and body-composition measurement density; BMI was not matched. The x-axis is years from the first PMOS diagnosis (or the matched pseudo-index for controls), and shaded bands denote the 95% confidence interval of the mean. The overall between-group difference in each absolute measure is reported as Pgroup (A–E) and the difference in normalized trajectory shape as Pgroup × time (F–I). Fat mass in women with PMOS rises and diverges from matched controls before diagnosis, whereas the lean body mass proportion falls.
Figure 4.
Fat-predominant weight gain and a falling lean-mass proportion precede PMOS. Body weight, BMI, lean body mass, fat mass and the lean body mass proportion of body weight (A-E), and the corresponding changes relative to each cohort's near-index value (F-I), over the years around the first PMOS diagnosis, in 1,416 women with PMOS and paired body-composition measurements matched 1:1 to 1,416 non-PMOS women on age, race, calendar year of index and body-composition measurement density; BMI was not matched. The x-axis is years from the first PMOS diagnosis (or the matched pseudo-index for controls), and shaded bands denote the 95% confidence interval of the mean. The overall between-group difference in each absolute measure is reported as Pgroup (A–E) and the difference in normalized trajectory shape as Pgroup × time (F–I). Fat mass in women with PMOS rises and diverges from matched controls before diagnosis, whereas the lean body mass proportion falls.
Statistical Analysis Plan for Study Advancement
The analytic approach followed established pharmacoepidemiologic and biostatistical conventions throughout. The study was implemented as a distributed, federated analysis in which each academic medical center executed identical code locally and only aggregate statistics, never patient-level records, were exported and pooled, the standard privacy-preserving architecture for multi-site real-world-evidence research, and it was reported in accordance with the STROBE [15] and RECORD [16] frameworks. PMOS cases were compared with non-PMOS women matched 1:1 without replacement, exactly on age, race, calendar year of index and pre-index measurement density, with covariate balance assessed by the standardized mean difference, an absolute value above 0.1 indicating residual imbalance [17]; body weight and BMI were deliberately left unmatched so that adiposity divergence would be preserved. Continuous measures were compared by the two-sided Welch t-test [18]. For the childhood and adolescent BMI cohort, incident PMOS was analyzed as time-to-event data, with cumulative incidence estimated by the Kaplan-Meier method [19], categories compared by the log-rank test [20], and relative risks expressed relative to the healthy-BMI reference group with log-normal confidence intervals [21]; childhood and adolescent BMI was additionally classified against the CDC/AAP BMI-for-age reference using the LMS method [22]. Body-composition phenotypes were extracted from clinical notes with a large language model workflow [23]. Prevalences of comorbidities and medications were compared by two-proportion z-tests [24], and incident events in the pediatric cohort were counted only among women with observed follow-up beyond the landmark BMI measurement, mitigating immortal-time and reverse-causation concerns through incident-event restriction [25,26].
Institutional Review Board Statement, Informed Consent Statement, De-Identification and HIPAA Compliance Certification
Prior to analysis, all EHR data were de-identified under an expert determination consistent with the Health Insurance Portability and Accountability Act (HIPAA) Privacy Rule (45 CFR §164.514(b)(1)). The de-identification methodology [27,28] employed a multi-layered transformation approach to both structured and unstructured data fields. In structured data, direct identifiers including patient names and precise geographic locations were excluded entirely, while indirect identifiers underwent specific transformations: patient identifiers, medical record numbers, and accession numbers were replaced with one-way cryptographic hashes using confidential salts to preserve linkage across patient encounters; all dates were shifted backward by patient-specific random offsets (1 to 31 days) to preserve temporal relationships while obscuring exact event timing; ZIP codes were truncated to two-digit state-level resolution; and continuous variables including age, height, weight, and body mass index were thresholded to prevent identification of extreme values (for example, ages 89 years or older transformed to '89+' and BMI over 40 transformed to '40+'). In clinical text, an ensemble de-identification system that combines attention-based deep learning with rule-based methods achieved an estimated >99% recall for personally identifiable information (PII) detection, with detected identifiers replaced by plausible fictional surrogates. Institutional Review Board Statement and Informed Consent Statement are not applicable.
Data Harmonization
To address heterogeneity in EHR data, we harmonized clinical variables including medications, anthropometric measurements, and diagnoses to standardized concepts. For medications, we first constructed a standardized drug concept database combining the nference knowledge graph with RxNorm hierarchies to capture ingredient, brand, and dose-specific information. Medication records were matched using a hierarchical approach prioritizing RxNorm codes when available, followed by ingredient-level matching, and finally natural language processing and pattern matching on free-text medication orders when structured codes were absent. For anthropometric measurements (height, weight, body mass index), we created a unified vocabulary from SNOMED and LOINC and matched EHR measurement descriptions using standardized text matching algorithms with abbreviation expansion and synonym resolution; ambiguous mappings were resolved using OpenAI GPT-4o with summary statistics as context, followed by manual verification. For diagnoses, we developed a hierarchical disease concept database from the knowledge graph and matched EHR diagnosis records by identifying the most specific common child concept in the hierarchy.
Code Availability
The analysis code is not publicly available. Please contact the corresponding author for details.
Results
PMOS Aligns with Metabolic Diseases Across the Prediagnostic Weight Landscape
To position PMOS within the broader clinical landscape, we evaluated 1,929 disease concepts (across 15,087,821 patients) represented by at least 100 patients with longitudinal routine-vitals measurements and compared body weight at the first recorded diagnosis with weight change over the preceding five years. PMOS combined a high mean weight at diagnosis of 94.3 kg with a five-year prediagnostic gain of 10.0 kg, corresponding to 15.6%, and was positioned near the 97th percentile of the condition-wide distributions for both measures (Figure 1). Its position was closest to cardinal metabolic conditions including insulin resistance, which had a baseline weight of 99.5 kg and a five-year gain of 10.6 kg, metabolic syndrome at 102.2 kg and 8.1 kg, obesity at 101.1 kg and 5.4 kg, obstructive sleep apnea at 100.5 kg and 3.1 kg, and type 2 diabetes at 94.8 kg and 1.0 kg. Of note, hirsutism (a component of the Rotterdam criteria) was also positioned nearer the metabolic conditions, with a baseline weight of 90.9 kg and a five-year gain of 6.9 kg.
By contrast, reproductive and gynecological conditions generally had lower body weight and smaller prediagnostic gains. Endometriosis had a baseline weight of 78.5 kg and a five-year gain of 3.2 kg, uterine fibroids had a baseline weight of 84.6 kg and a gain of 1.8 kg, and menopause had a baseline weight of 75.4 kg and a decline of 0.6 kg. The background distribution showed several examples of plausible control phenotypes, with childhood obesity and acanthosis nigricans among the conditions showing the largest prediagnostic gains and pancreatic cancer, protein-energy malnutrition and adult failure to thrive showing weight loss (Figure 1). Thus, PMOS was distinguished by the combination of elevated body weight and sustained prediagnostic weight gain and aligned more closely with disorders of adiposity and insulin resistance than with reproductive disorders.
Pediatric Divergence in Body Weight and BMI Precedes PMOS Diagnosis by 15 Years
We identified a total of 145,593 women with PMOS across the federated EHR network. From this cohort, the longitudinal trajectory analysis included 104,003 women with PMOS and 104,003 non-PMOS controls matched exactly on age, race, index calendar year and frequency of pre-index weight measurement. Mean age at index was 30.9 years in both groups, and all post-matching standardized mean differences for the other matching variables were 0.000 (Table 1). Body weight and BMI were deliberately excluded from matching to preserve the anthropometric phenotype associated with PMOS.
Women subsequently diagnosed with PMOS already had substantially higher body weight and BMI at the earliest observable interval 15 years before diagnosis, corresponding to approximately 13 to 19 years of age. During this interval, mean body weight was approximately 60 kg in women who later developed PMOS compared with 46 kg in matched controls, while mean BMI was approximately 23 kg m⁻² compared with 20 kg/m2 (Figure 2). This pediatric divergence persisted throughout adolescence and young adulthood, with the absolute between-group difference remaining evident and becoming larger by the index date. At the near-index baseline, women with PMOS weighed a mean of 94.0 kg compared with 76.1 kg among controls (SMD: 0.77; P < 0.001) and had a mean BMI of 33.2 kg/m2 compared with 27.3 kg/m2 (SMD 0.97; P < 0.001, Table 1).
Across the complete 15-year trajectory, absolute body weight and BMI remained significantly higher among women subsequently diagnosed with PMOS than among matched controls (Pgroup < 0.001) (Figure 2). Although both groups gained weight before the index date, the persistent separation in absolute weight and BMI indicates that the PMOS-associated anthropometric phenotype was already established during pediatric years rather than emerging only near the reproductive-age diagnosis. The absolute between-group difference in weight and BMI was present at the earliest observable interval and persisted throughout, narrowing modestly during the period of shared adolescent weight gain before widening again toward diagnosis, reaching approximately 18 kg and 5 kg/m² near the index date (Figure 2B,D). Because the difference was expressed in absolute units rather than relative to each cohort's own index value, it isolates the sustained adiposity gap rather than the shape of within-cohort weight accumulation, and confirms that the PMOS-associated anthropometric phenotype was established during pediatric years rather than emerging near the reproductive-age diagnosis.
Baseline comorbidity and medication profiles reinforced this adiposity phenotype. Within six months of the index date, women with PMOS carried a higher burden of metabolic conditions than matched controls, including obesity (36.2% versus 7.9%, P < 0.001), hypertension (13.8% versus 5.2%, P < 0.001), dyslipidemia (13.0% versus 4.2%, P < 0.001), prediabetes (9.8% versus 1.8%, P < 0.001), type 2 diabetes (8.0% versus 2.1%, P < 0.001), obstructive sleep apnea (6.2% versus 1.2%, P < 0.001) and metabolic dysfunction-associated steatotic liver disease (3.5% versus 0.7%, P < 0.001), alongside higher rates of depression (13.7% versus 6.5%, P < 0.001), anxiety (24.3% versus 12.6%, P < 0.001) and infertility (7.7% versus 0.7%, P < 0.001) (Table 1). Medication use mirrored this pattern (Table 3): women with PMOS more frequently received metformin (31.8% versus 1.8%, P < 0.001), cyclic progestins (26.7% versus 8.9%, P < 0.001), combined oral contraceptives (24.8% versus 11.9%, P < 0.001), anti-androgens (12.0% versus 1.5%, P < 0.001), ovulation-induction agents (5.5% versus 0.4%, P < 0.001) and glucagon-like peptide-1 receptor agonists (GLP-1 RA; 9.6% versus 2.1%, P < 0.001), as well as antidepressants (31.9% versus 19.2%, P < 0.001), antihypertensives (19.1% versus 10.0%, P < 0.001) and thyroid hormone (9.9% versus 3.9%, P < 0.001); the constituent drug names for each medication group are provided (Table 2).
Childhood and Adolescent BMI Stratifies Subsequent PMOS Incidence
The persistent elevation in body weight and BMI observed up to 15 years before PMOS diagnosis in the matched trajectory cohort prompted a direct assessment of whether BMI measured during childhood and adolescence stratified subsequent PMOS incidence (Figure 2 and Table 1). This analysis included 809,719 women with BMI recorded between 5 and 20 years of age, comprising 184,555 with underweight, 395,749 with healthy BMI, 128,173 with overweight, 57,713 with obesity class I, 25,894 with obesity class II and 17,635 with obesity class III. During follow-up, 19,681 women received an incident PMOS diagnosis (Figure 3A).
The racial composition of the bands differed markedly with baseline adiposity. The proportion of Black women rose monotonically across increasing childhood or adolescent BMI, from 11.1% with healthy BMI to 14.9% with overweight, 18.5% with obesity class I, 21.5% with obesity class II and 26.5% with obesity class III, while the underweight group was lower at 9.4% (each versus healthy BMI, P < 0.001) (Table 4). Black women were thus represented approximately 2.4 times as often in the highest obesity band as in the healthy-BMI reference group.
Ten-year cumulative PMOS incidence increased progressively across childhood and adolescent BMI categories, from 1.6% among participants with underweight to 3.3% with healthy BMI, 7.4% with overweight, 12.0% with obesity class I, 16.5% with obesity class II and 17.9% with obesity class III (Figure 3B). The corresponding numbers of incident PMOS diagnoses were 1,270, 6,345, 4,584, 3,496, 2,225 and 1,761. Relative to healthy BMI, underweight was associated with lower cumulative incidence (RR 0.5, P < 0.001), whereas overweight and obesity showed a graded increase, with relative risks of 2.2 for overweight, 3.6 for obesity class I, 5.0 for obesity class II and 5.4 for obesity class III, all P < 0.001.
Time-to-event curves separated early after the childhood or adolescent BMI measurement and remained ordered throughout follow-up, with progressively greater cumulative PMOS incidence across increasing BMI bands (log-rank P < 0.001) (Figure 3C). This temporal separation indicates that the association was not confined to diagnoses occurring immediately after BMI ascertainment and remained evident for up to 20 years.
The BMI-associated gradient was also present when cumulative PMOS incidence was evaluated by age 25 and stratified by age at BMI measurement (Figure 3D). Among participants measured at 10 to 15 years of age, cumulative incidence by age 25 increased from 3% with underweight and 6% with healthy BMI to 12% with overweight, 21% with obesity class I, 28% with obesity class II and 31% with obesity class III. Corresponding estimates among participants measured at 15 to 20 years were 3%, 4%, 9%, 19%, 27% and 35%. Among participants measured at 5 to 10 years, incidence by age 25 was 5% with underweight, 12% with healthy BMI, 19% with overweight and 24% with obesity class I; the highest obesity classes at this youngest measurement age contributed too few events for stable estimation and are shown without emphasis.
Comorbidities recorded after the childhood or adolescent BMI measurement accumulated steeply with baseline BMI, but selectively along metabolic axes (Table 4). Comparing obesity class III with healthy BMI, incident diagnoses were higher for obesity (30.4% versus 5.3%, P < 0.001), prediabetes (9.5% versus 1.3%, P < 0.001), hypertension (9.1% versus 1.3%, P < 0.001), dyslipidemia (7.9% versus 2.3%, P < 0.001), obstructive sleep apnea (6.7% versus 0.7%, P < 0.001), type 2 diabetes (5.2% versus 0.4%, P < 0.001) and metabolic dysfunction-associated steatotic liver disease (3.6% versus 0.4%, P < 0.001), corresponding to roughly 7- to 13-fold differences. Depression was modestly higher (15.1% versus 11.2%, P < 0.001) and infertility was higher in relative terms (1.5% versus 0.7%, P < 0.001). By contrast, anxiety was nearly identical across bands (20.8% with obesity class III versus 20.2% with healthy BMI, P = 0.029), the small difference reaching significance only because of the large sample. The gradient was therefore specific to cardiometabolic morbidity rather than a uniform increase across all recorded conditions.
Medication incidence after the BMI measurement followed the same metabolic gradient (Table 5). Relative to healthy BMI, women with obesity class III more often began metformin (15.1% versus 1.3%, P < 0.001), GLP-1 RA (13.7% versus 1.2%, P < 0.001), antihypertensives (17.0% versus 9.4%, P < 0.001), insulin (6.4% versus 3.7%, P < 0.001), thyroid hormone (4.3% versus 1.7%, P < 0.001) and statins (2.0% versus 0.4%, P < 0.001). Reproductive and psychotropic prescribing, in contrast, was flat or lower across bands: combined oral contraceptive use was slightly lower with obesity class III than with healthy BMI (24.6% versus 27.4%, P < 0.001), cyclic progestin use was comparable (19.3% versus 18.8%, P = 0.085) and antidepressant use was only marginally higher (26.1% versus 24.6%, P < 0.001). This dissociation, a steep metabolic-treatment gradient against flat contraceptive and psychotropic use, indicates that higher BMI bands were distinguished specifically by early metabolic morbidity and its pharmacologic management rather than by broader differences in care.
These incident-disease findings extend the matched natural-history analysis, in which women later diagnosed with PMOS already had higher body weight and BMI than controls during pediatric years and remained anthropometrically separated through reproductive adulthood (Figure 2 and Table 1). Together with the positioning of PMOS alongside insulin resistance, metabolic syndrome and obesity in the condition-wide prediagnostic weight landscape (Figure 1), the graded childhood BMI association identifies early-life adiposity as a measurable prediagnostic hallmark of PMOS rather than a feature that emerges only near reproductive-age diagnosis.
Prediagnostic Weight Excess in PMOS Is Predominantly Adipose
To determine whether the long-standing excess body weight observed before PMOS diagnosis reflected adipose or lean tissue, we examined 1,416 women with PMOS and 1,416 matched controls with paired body-composition measurements. Cases and controls were identical in mean age at diagnosis at 34.9 years, index calendar year, and racial distribution, and had similar numbers of body-composition measurements within five years of index at 4.0 compared with 4.1 measurements per participant (Table 6). BMI was intentionally not included as a matching variable so that differences in body composition would remain observable.
Across the five years before and after index, women with PMOS had higher absolute body weight, BMI, lean body mass, and fat mass, together with a lower lean body mass proportion, than matched controls, with all trajectory comparisons reaching Pgroup < 0.001 (Figure 4A–E). Near index, mean body weight was 112.5 kg in women with PMOS compared with 98.4 kg in controls, mean BMI was 38.0 kg m⁻² compared with 34.9 kg m⁻², and mean lean body mass was 57.0 kg compared with 53.0 kg (Table 6). Thus, only 4.0 kg of the 14.1 kg between-group difference in total body weight was attributable to lean mass, leaving approximately 10.1 kg, or 72%, as non-lean mass.
Fat mass rose and diverged from matched controls as diagnosis approached, reaching 55.4 kg in women with PMOS compared with 45.6 kg in controls at diagnosis (Figure 4D). Although absolute lean body mass was also higher in women with PMOS, it did not increase in proportion to their greater total weight. The lean body mass proportion was consequently lower at diagnosis at 52.0% compared with 55.8% in matched controls and remained significantly different across the trajectory (Figure 4C,E).
When trajectories were normalized to their near-index values, the difference in trajectory shape was significant for BMI change (Pgroup × time = 0.001) and fat-mass change (Pgroup × time = 0.006), but not for total body-weight change (Pgroup × time = 0.072) or lean-mass change (Pgroup × time = 0.775) (Figure 4F–I). These findings help resolve the composition of the elevated weight observed from pediatric ages onward in the 15-year trajectory analysis (Figure 2) and the graded increase in future PMOS incidence across childhood and adolescent BMI categories (Figure 3). Together with the positioning of PMOS alongside insulin resistance, metabolic syndrome, and obesity in the condition-wide landscape (Figure 1), these data show that the prediagnostic phenotype is not simply greater body size, but a predominantly adipose excess that is established by the time PMOS is first diagnosed.
Baseline comorbidities and medications in the body-composition subcohort were consistent with this adipose phenotype (Table 6 and Table 7). Within six months of index, women with PMOS more often had obesity (80.3% versus 69.1%, P < 0.001), hypertension (29.9% versus 22.1%, P < 0.001), dyslipidemia (25.2% versus 17.8%, P < 0.001), obstructive sleep apnea (23.7% versus 14.1%, P < 0.001), type 2 diabetes (16.0% versus 7.3%, P < 0.001) and infertility (2.2% versus 0.7%, P < 0.001), whereas depression (18.7% versus 16.7%, P = 0.15) and anxiety (31.8% versus 29.7%, P = 0.24) did not differ. Medication use was correspondingly higher, most notably metformin (48.0% versus 18.9%, P < 0.001), GLP-1 RA (38.1% versus 30.1%, P < 0.001), antihypertensives (37.0% versus 28.2%, P < 0.001), combined oral contraceptives (25.6% versus 14.1%, P < 0.001) and anti-androgens (14.4% versus 3.7%, P < 0.001) (Table 7).
Discussion
This study delineates a long prediagnostic anthropometric history of PMOS across four complementary analyses. Within a reference landscape of 1,929 clinical conditions, PMOS combined a high mean weight at diagnosis of 94.3 kg with a five-year prediagnostic gain of 10.0 kg, corresponding to 15.6%, and aligned with insulin resistance, metabolic syndrome and obesity rather than reproductive disorders. Among 104,003 matched case–control pairs, women subsequently diagnosed with PMOS already had an approximate mean weight of 60 kg compared with 46 kg in controls and a mean BMI of 23 kg m⁻² compared with 20 kg m⁻² at the earliest 15-year lookback interval. This divergence persisted and widened through reproductive adulthood, reaching 94.0 kg compared with 76.1 kg and 33.2 kg m⁻² compared with 27.3 kg m⁻² near diagnosis, with both trajectory comparisons reaching Pgroup < 0.001. In the incident cohort, ten-year cumulative PMOS incidence increased from 3.3% among participants with healthy childhood or adolescent BMI to 7.4%, 12.0%, 16.5% and 17.9% across overweight and obesity classes I, II and III. These estimates corresponded to relative risks of 2.2, 3.6, 5.0 and 5.4 relative to healthy BMI, with all comparisons reaching P < 0.001. Body-composition trajectories further showed that the prediagnostic weight excess was predominantly adipose, with fat mass reaching 55.4 kg compared with 45.6 kg and lean body mass proportion reaching 52.0% compared with 55.8% at diagnosis.
The condition-wide landscape provides a clinically interpretable context for these findings. PMOS was distinguished not simply by elevated body weight, but by the combination of elevated weight and pronounced continuing gain before diagnosis. Its proximity to insulin resistance, metabolic syndrome and obesity contrasted with the lower weights and smaller prediagnostic changes associated with endometriosis, uterine fibroids and menopause. Hirsutism was the reproductive phenotype positioned closest to the metabolic cluster, consistent with the recognised association between hyperandrogenism and insulin resistance. This separation supports the conceptual transition from PCOS to PMOS by showing that the longitudinal anthropometric behaviour of the disorder resembles that of systemic metabolic disease more closely than that of other gynaecological conditions [1,2].
The childhood and adolescent incidence analysis strengthens the earliest observable interval, women who later received a PMOS diagnosis weighed approximately 60 kg compared with 46 kg among matched controls and had a BMI of approximately 23 kg m⁻² compared with 20 kg m⁻². At diagnosis, mean weight had reached 94.0 kg compared with 76.1 kg and mean BMI had reached 33.2 kg m⁻² compared with 27.3 kg m⁻². The resulting standardized mean differences of 0.772 for weight and 0.967 for BMI persisted despite exact matching on age, race, calendar year and measurement density, reflecting the deliberate exclusion of body size from the matching set. In the childhood and adolescent incidence cohort, underweight was associated with lower cumulative PMOS incidence (relative risk 0.5, P < 0.001), whereas progressively greater obesity was accompanied by progressively higher incidence. Stratification by age at BMI measurement showed that this gradient remained evident when BMI was recorded during childhood, early adolescence or later adolescence.
These results extend previous observations rather than merely reproducing the known cross-sectional association between obesity and PMOS. The Northern Finland Birth Cohort linked weight gain between adolescence and adulthood with subsequent PMOS symptoms and diagnosis [10]. The Kaiser Permanente adolescent cohort found markedly higher odds of diagnosed PMOS among adolescents with increasing obesity severity [11]. Genetic analyses have reported shared loci between obesity and PMOS and have supported associations of genetically predicted childhood and adult BMI with PMOS risk [12,13]. The present study adds absolute longitudinal trajectories, incident time-to-event analyses and clinically interpretable cumulative incidence estimates within the same natural-history framework.
The body-composition findings help resolve what the elevated prediagnostic weight represents. Women with PMOS had approximately 14.1 kg more total body weight than matched controls near diagnosis, but only 4.0 kg more lean body mass. Approximately 10 kg of the difference was therefore attributable to non-lean mass. Absolute lean body mass was greater in PMOS, as expected in individuals carrying greater total mass, but it was insufficient to preserve the lean body mass proportion. The resulting reduction in lean proportion indicates relative dilution of lean tissue by a larger adipose compartment rather than absolute depletion of lean mass.
The longitudinal comparisons reinforce this interpretation. Absolute weight, BMI, lean mass, fat mass and lean mass proportion differed between groups across the five-year body-composition window, with each comparison reaching Pgroup < 0.001. After normalisation to near-index values, the trajectory-shape difference remained significant for BMI change (Pgroup × time = 0.001) and fat-mass change (Pgroup × time = 0.006), whereas total weight change (Pgroup × time = 0.072) and lean-mass change (Pgroup × time = 0.775) were not significantly different. The strongest compositional distinction was therefore concentrated in adipose mass and in the balance between adipose and lean tissue. Prior DXA and MRI studies have similarly shown greater central fat accumulation, enlarged adipocytes and impaired adipose insulin sensitivity in PMOS, including in comparisons matched for BMI [6,7].
These observations are consistent with an adipose–insulin–ovarian feedback model, although they do not establish its directionality. PMOS-associated insulin resistance can occur independently of obesity [4], and impaired adipocyte glucose transport is detectable in both lean and obese women with the condition [5]. Increasing adiposity can superimpose additional insulin resistance on this susceptibility. Compensatory hyperinsulinaemia can then potentiate ovarian androgen steroidogenesis [8,9], while androgen excess and metabolic dysfunction may further influence fat distribution and adipocyte function. The data therefore favour an interaction between intrinsic susceptibility and acquired adiposity rather than a model in which obesity is either universally necessary or solely sufficient for PMOS.
This distinction is clinically important. The findings do not support diagnosing PMOS on the basis of childhood obesity, nor do they imply that every girl with obesity will develop the disorder. They instead identify longitudinal weight and BMI trajectories as candidate risk markers that may precede the reproductive manifestations used for diagnosis. Current guidelines already recommend reassessment of adolescents with persistent PMOS features or substantial weight gain and emphasise lifelong attention to metabolic health, body composition and prevention of further weight gain [2]. The present results provide empirical support for studying whether repeated BMI trajectories, menstrual history, androgenic features, family history and metabolic measurements can be integrated into age-appropriate risk models. Such approaches should avoid weight stigma and should distinguish supportive metabolic care from premature disease labelling.
Earlier recognition could create a longer window for prevention, but the present study does not demonstrate that reducing childhood BMI will prevent PMOS. Trials conducted in adults with established PMOS have shown that weight-loss interventions can improve ovulation and aspects of hyperandrogenism [29,30]. Whether intervention during childhood or adolescence can delay, attenuate or prevent the emergence of PMOS remains unknown. Prospective studies should therefore prioritise interventions that preserve healthy growth, improve metabolic function and avoid harmful weight-centred messaging rather than applying adult weight-loss paradigms directly to children.
The duration of the prediagnostic metabolic phenotype may also be relevant to later cardiometabolic disease. Large population studies have reported elevated risks of major cardiovascular and cardiocerebrovascular events among women with PMOS, including after adjustment or matching for BMI and conventional risk factors [31,32]. Other long-term cohorts have found increased cardiovascular risk factors without clear excess coronary mortality, indicating that risk may vary by age, phenotype, adiposity and population [33]. The present study did not evaluate cardiovascular outcomes, but it suggests that metabolic exposure may begin many years before reproductive diagnosis. Studies linking the duration and severity of pediatric adiposity trajectories to later vascular outcomes could help explain part of this heterogeneity.
Several features strengthen the study. The analyses span a large, multisite clinical population and combine condition-level positioning, matched longitudinal trajectories, incident-disease analysis and body-composition phenotyping. Exact matching on age, race, calendar year and measurement-density band reduced differences in demographic composition and observation intensity. The 15-year lookback extends into adolescence for the average participant, while the separate childhood BMI cohort directly evaluates measurements obtained between 5 and 20 years of age. The agreement across these analytically distinct cohorts reduces the likelihood that the central finding is attributable to any single cohort definition or measurement strategy.
The study also has important limitations. The index date represents the first recorded diagnosis rather than biological onset. Some women may have had unrecognised PMOS for years, meaning that the observed prediagnostic interval could include established but undocumented disease. Diagnosis was based on coded clinical records rather than uniform adjudication of guideline criteria, creating potential misclassification. EHR measurements are obtained for clinical rather than research purposes and are subject to informative sampling, missingness and differences in follow-up. Matching balanced the selected variables but could not account for socioeconomic circumstances, diet, physical activity, pubertal timing, age at menarche, pregnancy, medication exposure, family history or genetic susceptibility.
The childhood BMI analysis used fixed BMI bands across ages 5–20 years. These bands do not capture age-specific changes in BMI during growth and are particularly limited in younger children, for whom BMI-for-age percentiles or z-scores are preferable. Replication using age-standardised pediatric growth classifications is therefore essential. The body-composition cohort was smaller, had high mean BMI in both groups and may represent individuals receiving more intensive metabolic care. Routine-care body-composition measurements may also vary by device, indication and site. Fat mass was derived from weight and lean mass rather than measured through a uniform prospective protocol.
Finally, the observational design cannot determine whether adiposity initiates PMOS, accelerates expression in susceptible individuals, results partly from early PMOS biology, or reflects bidirectional relationships. The term prodrome is therefore used descriptively to denote a detectable prediagnostic phenotype rather than a deterministic or proven causal disease stage. Prospective pediatric cohorts with repeated age-standardised anthropometry, body composition, insulin sensitivity, androgen measurements and menstrual phenotyping will be required to resolve directionality.
Together, these findings indicate that PMOS first diagnosed during reproductive adulthood can have an observable metabolic natural history extending into childhood and adolescence. Elevated pediatric BMI stratified future PMOS incidence in a graded manner, the weight difference widened over the subsequent 15 years, and the excess weight approaching diagnosis was predominantly adipose. This convergence across population-level, longitudinal, incident and body-composition analyses supports an adiposity-centric prediagnostic phenotype of PMOS and identifies early life as a critical period for mechanistic study, risk stratification and prospective prevention research.
Author Contributions
VS conceived and designed the study. KM contributed software with inputs from VS and AJV. All authors reviewed the findings, wrote the manuscript and agreed on final submission.
Funding
This research received no external funding.
Acknowledgments
The authors thank Patrick Lenehan for thorough review of the manuscript.
Conflicts of Interest Statement
The authors are employees of nference, inc., which conducts research collaborations with various biopharmaceutical companies whose therapeutic products are included in this study. None of these companies, nor any other nference collaborator, funded, supported, or had any role in the independent study design, data acquisition, analysis, interpretation, manuscript preparation, or the decision to submit this work for publication. All analyses were conducted by the authors using de-identified electronic health record data. The authors declare no additional competing interests.
References
- Teede, H. J.; et al. Polyendocrine metabolic ovarian syndrome, the new name for polycystic ovary syndrome: a multistep global consensus process. Lancet 2026, 407, 2329–2339. [Google Scholar] [CrossRef] [PubMed]
- Teede, H. J.; et al. Recommendations from the 2023 International Evidence-based guideline for the assessment and management of polycystic ovary syndrome. J. Clin. Endocrinol. Metab. 2023, 108, 2447–2469. [Google Scholar] [CrossRef] [PubMed]
- Gibson-Helm, M.; Teede, H.; Dunaif, A.; Dokras, A. Delayed diagnosis and a lack of information associated with dissatisfaction in women with polycystic ovary syndrome. J. Clin. Endocrinol. Metab. 2017, 102, 604–612. [Google Scholar] [PubMed]
- Dunaif, A.; Segal, K. R.; Futterweit, W.; Dobrjansky, A. Profound peripheral insulin resistance, independent of obesity, in polycystic ovary syndrome. Diabetes 1989, 38, 1165–1174. [Google Scholar] [CrossRef]
- Rosenbaum, D.; Haber, R. S.; Dunaif, A. Insulin resistance in polycystic ovary syndrome: decreased expression of GLUT-4 glucose transporters in adipocytes. Am. J. Physiol. 1993, 264, E197–202. [Google Scholar] [CrossRef] [PubMed]
- Mannerås-Holm, L.; et al. Adipose tissue has aberrant morphology and function in PCOS: enlarged adipocytes and low serum adiponectin, but not circulating sex steroids, are strongly associated with insulin resistance. J. Clin. Endocrinol. Metab. 2011, 96, E304–11. [Google Scholar] [CrossRef] [PubMed]
- Glintborg, D.; Petersen, M. H.; Ravn, P.; Hermann, A. P.; Andersen, M. Comparison of regional fat mass measurement by whole body DXA scans and anthropometric measures to predict insulin resistance in women with polycystic ovary syndrome and controls. Acta Obstet. Gynecol. Scand. 2016, 95, 1235–1243. [Google Scholar] [CrossRef] [PubMed]
- Burghen, G. A.; Givens, J. R.; Kitabchi, A. E. Correlation of hyperandrogenism with hyperinsulinism in polycystic ovarian disease. J. Clin. Endocrinol. Metab. 1980, 50, 113–116. [Google Scholar] [CrossRef] [PubMed]
- Tosi, F.; et al. Hyperinsulinemia amplifies GnRH agonist stimulated ovarian steroid secretion in women with polycystic ovary syndrome. J. Clin. Endocrinol. Metab. 2012, 97, 1712–1719. [Google Scholar] [CrossRef] [PubMed]
- Ollila, M.-M. E.; et al. Weight gain and dyslipidemia in early adulthood associate with polycystic ovary syndrome: Prospective cohort study. J. Clin. Endocrinol. Metab. 2016, 101, 739–747. [Google Scholar] [CrossRef] [PubMed]
- Christensen, S. B.; et al. Prevalence of polycystic ovary syndrome in adolescents. Fertil. Steril. 2013, 100, 470–477. [Google Scholar] [CrossRef] [PubMed]
- Liu, Q.; et al. Genomic correlation, shared loci, and causal relationship between obesity and polycystic ovary syndrome: a large-scale genome-wide cross-trait analysis. BMC Med. 2022, 20, 66. [Google Scholar] [CrossRef] [PubMed]
- Venkatesh, S. S.; et al. Obesity and risk of female reproductive conditions: A Mendelian randomisation study. PLoS Med. 2022, 19, e1003679. [Google Scholar] [CrossRef] [PubMed]
- Murugadoss, K.; Venkatakrishnan, A. J.; Soundararajan, V. Greater lean-body-mass decline with tirzepatide than semaglutide in routine care, revealed by body-composition digital phenotyping. medRxiv 2026. [Google Scholar] [CrossRef]
- von Elm, E.; et al. The Strengthening the Reporting of Observational Studies in Epidemiology (STROBE) statement: guidelines for reporting observational studies. PLoS Med. 2007, 4, e296. [Google Scholar] [CrossRef] [PubMed]
- Benchimol, E. I.; et al. The REporting of studies Conducted using Observational Routinely-collected health Data (RECORD) statement. PLoS Med. 2015, 12, e1001885. [Google Scholar] [CrossRef] [PubMed]
- Austin, P. C. An introduction to propensity score methods for reducing the effects of confounding in observational studies. Multivar. Behav. Res. 2011, 46, 399–424. [Google Scholar] [CrossRef] [PubMed]
- Welch, B. L. The generalisation of student’s problems when several different population variances are involved. Biometrika 1947, 34, 28–35. [Google Scholar] [CrossRef]
- Kaplan, E. L.; Meier, P. Nonparametric estimation from incomplete observations. J. Am. Stat. Assoc. 1958, 53, 457–481. [Google Scholar] [CrossRef]
- Mantel, N. Evaluation of survival data and two new rank order statistics arising in its consideration. Cancer Chemother. Rep. 1966, 50, 163–170. [Google Scholar] [PubMed]
- Katz, D.; Baptista, J.; Azen, S. P.; Pike, M. C. Obtaining confidence intervals for the risk ratio in cohort studies. Biometrics 1978, 34, 469. [Google Scholar] [CrossRef]
- Cole, T. J.; Green, P. J. Smoothing reference centile curves: the LMS method and penalized likelihood. Stat. Med. 1992, 11, 1305–1319. [Google Scholar] [CrossRef] [PubMed]
- Agrawal, M.; Hegselmann, S.; Lang, H.; Kim, Y.; Sontag, D. Large language models are few-shot clinical information extractors. in Proceedings of the 2022 Conference on Empirical Methods in Natural Language Processing 1998–2022 (Association for Computational Linguistics, Stroudsburg, PA, USA, 2022).
- Fleiss, J. L.; Levin, B.; Paik, M. C. Statistical Methods for Rates and Proportions; John Wiley & Sons: Nashville, TN, 2003. [Google Scholar]
- Suissa, S. Immortal time bias in pharmaco-epidemiology. Am. J. Epidemiol. 2008, 167, 492–499. [Google Scholar] [CrossRef] [PubMed]
- Ray, W. A. Evaluating medication effects outside of clinical trials: new-user designs. Am. J. Epidemiol. 2003, 158, 915–920. [Google Scholar] [CrossRef] [PubMed]
- Murugadoss, K.; et al. Building a best-in-class automated de-identification tool for electronic health records through ensemble learning. Patterns (N. Y.) 2021, 2, 100255. [Google Scholar] [CrossRef] [PubMed]
- Murugadoss, K.; et al. Scaling text de-identification using locally augmented ensembles. medRxiv 2024. [Google Scholar] [CrossRef]
- Legro, R. S.; et al. Randomized controlled trial of preconception interventions in infertile women with polycystic ovary syndrome. J. Clin. Endocrinol. Metab. 2015, 100, 4048–4058. [Google Scholar] [CrossRef] [PubMed]
- Dietz de Loos, A. L. P.; et al. Improvements in PCOS characteristics and phenotype severity during a randomized controlled lifestyle intervention. Reprod. Biomed. Online 2021, 43, 298–309. [Google Scholar] [CrossRef] [PubMed]
- Berni, T. R.; Morgan, C. L.; Rees, D. A. Women with polycystic ovary syndrome have an increased risk of major cardiovascular events: A population study. J. Clin. Endocrinol. Metab. 2021, 106, e3369–e3380. [Google Scholar] [CrossRef] [PubMed]
- Ryu, K.-J.; Park, H.; Kim, M. S.; Jeong, H. G.; Kim, T. Risk of cardiocerebrovascular diseases is increased in Korean women with polycystic ovary syndrome: a nationwide cohort study. Sci. Rep. 2024, 14, 1055. [Google Scholar] [CrossRef] [PubMed]
- Wild, S.; Pierpoint, T.; McKeigue, P.; Jacobs, H. Cardiovascular disease in women with polycystic ovary syndrome at long-term follow-up: a retrospective cohort study. Clin. Endocrinol. (Oxf.) 2000, 52, 595–600. [Google Scholar] [CrossRef] [PubMed]
Figure 1.
PMOS among clinical conditions by pre-diagnosis weight change. Each point is a disease concept present in at least 100 patients in the whole-population routine-vitals reference, plotted by baseline weight at diagnosis (y-axis) against the five-year pre-diagnosis weight change (x-axis; median weight in the year before diagnosis minus the median five to six years before, window centers five years apart). Points are colored metabolic, reproductive/gynecologic, or other, with PMOS highlighted; point area scales with the number of contributing patients.
Figure 1.
PMOS among clinical conditions by pre-diagnosis weight change. Each point is a disease concept present in at least 100 patients in the whole-population routine-vitals reference, plotted by baseline weight at diagnosis (y-axis) against the five-year pre-diagnosis weight change (x-axis; median weight in the year before diagnosis minus the median five to six years before, window centers five years apart). Points are colored metabolic, reproductive/gynecologic, or other, with PMOS highlighted; point area scales with the number of contributing patients.
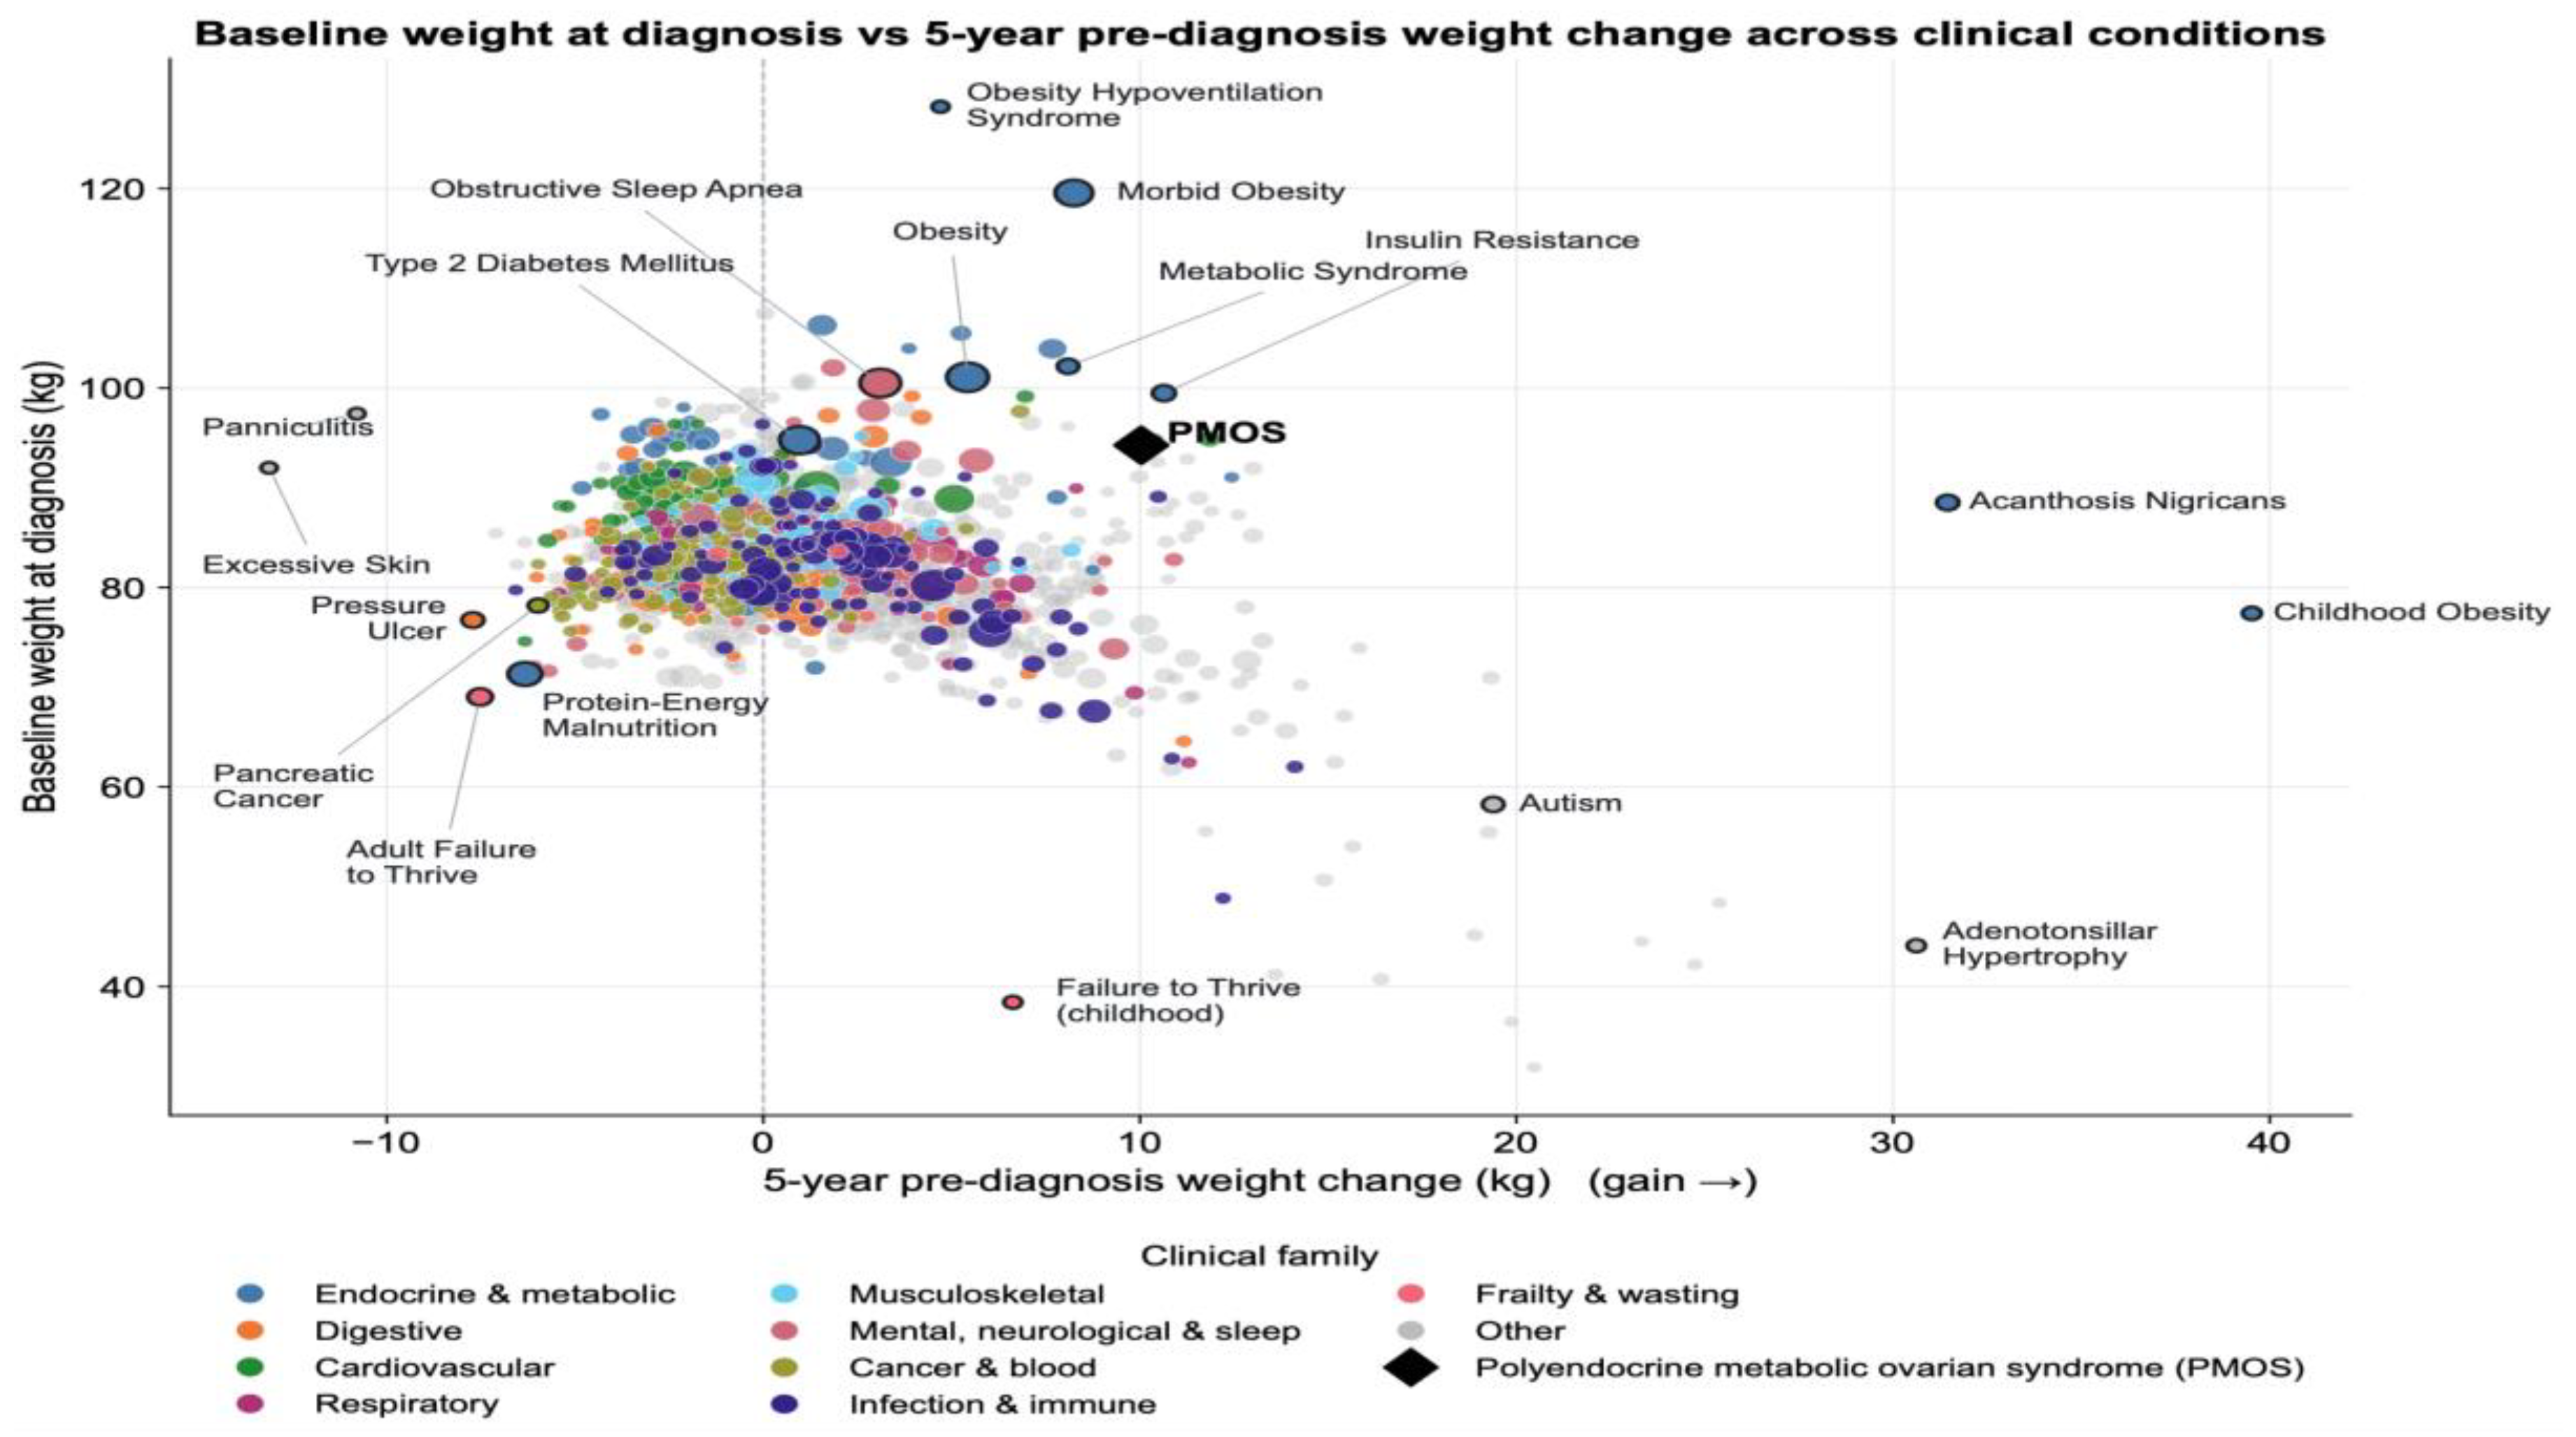
Disclaimer/Publisher’s Note: The statements, opinions and data contained in all publications are solely those of the individual author(s) and contributor(s) and not of MDPI and/or the editor(s). MDPI and/or the editor(s) disclaim responsibility for any injury to people or property resulting from any ideas, methods, instructions or products referred to in the content. |
© 2026 by the authors. Licensee MDPI, Basel, Switzerland. This article is an open access article distributed under the terms and conditions of the Creative Commons Attribution (CC BY) license.
Copyright: This open access article is published under a Creative Commons CC BY 4.0 license, which permit the free download, distribution, and reuse, provided that the author and preprint are cited in any reuse.