

Submitted:
27 July 2026
Posted:
29 July 2026
You are already at the latest version
Abstract
Measles remains a public-health concern where immunity gaps and incomplete vaccination coverage persist. This study assessed household and geographic factors associated with laboratory-confirmed measles among suspected cases in three Zambian provinces. Measles surveillance data from Luapula, Northern and Northwestern provinces were retrospectively analysed. Participant characteristics were summarised descriptively. Bayesian logistic regression estimated associations between laboratory-confirmed measles and age, sex, vaccination status, household size and previous measles history, with province added in a second model. Results were reported as posterior odds ratios with 95% credible intervals. Among the 172 suspected cases, 45 (26.2%) were laboratory-confirmed. Vaccinated participants had 93% lower adjusted odds of laboratory-confirmed measles than unvaccinated participants (adjusted posterior OR: 0.07, 95% CrI: 0.02-0.18). Adjusted posterior probabilities were consistently lower among vaccinated participants across all three provinces (34% to 49%) than among unvaccinated participants (86% to 92%). Age, sex and household size were not clearly associated with measles positivity. All four participants reporting a previous measles history tested positive, and the unadjusted association was significant using Fisher’s exact test (p=0.004). Vaccination status was most strongly associated with laboratory-confirmed measles, with substantially lower adjusted odds among vaccinated participants. These findings reinforce the importance of measles vaccination in outbreak prevention and control.
Keywords:
measles
; vaccination
; bayesian logistic regression
; laboratory confirmation
; surveillance
; Zambia
1. Introduction
The Measles remains one of the most contagious vaccine-preventable diseases in the world, and despite the availability of a safe and effective vaccine for over five decades, it continues to cause significant morbidity and mortality among children, particularly in low- and middle-income countries [1]. Although substantial progress has been made globally through routine immunization programs and supplementary immunization activities (SIAs) [2], measles outbreaks continue to occur, particularly in low- and middle-income countries where immunity gaps, suboptimal vaccination coverage, and weaknesses in surveillance systems persist [3].
Zambia has struggled to achieve and sustain elimination-level measles-rubella (MR) vaccine coverage. Disruption of routine health services during the COVID-19 pandemic is estimated to have caused over 600,000 Zambian children to miss their first measles-containing vaccine dose, and roughly 500,000 to miss both the first and second doses, between 2020 and 2024 [4]. A subsequent Post-Campaign Coverage Survey conducted across all ten provinces found that, despite the campaign, 11.97% of children aged 9-59 months remained "zero-dose" (unvaccinated against measles and rubella), with the highest prevalence recorded in Central (19.15%) and Western (17.71%) provinces and the lowest in Copperbelt (6.69%) [5]. Post-campaign survey cannot address whether susceptible children seronegative to measles and rubella viruses were vaccinated during the SIA [6].
Methodologically, understanding the individual- and community-level factors that predict measles susceptibility or vaccination status requires an analytical approach suited to binary outcomes (e.g., vaccinated/unvaccinated, case/non-case) while also accommodating the kind of sparse, clustered, and hierarchically structured data typical of provincial-level health surveillance in low-resource settings. Bayesian logistic regression [7] offers such an approach: rather than relying solely on maximum likelihood estimation, it treats model coefficients as random variables with prior probability distributions that are updated with observed data, via Markov Chain Monte Carlo (MCMC) simulation, to yield posterior distributions and credible intervals for each parameter. Bayesian approach is an adaptive prior that can perform parameter estimation and variable selection well in high-dimensional logistic regression [8].
The Bayesian logistic framework has already been applied productively to closely related questions in African immunisation research. A Bayesian hierarchical (ordinal) logistic regression was used to model the determinants of childhood immunisation coverage across five East African countries using Demographic and Health Survey data, allowing candidate models to be formally compared via leave-one-out cross-validation and coefficients to be interpreted through 95% posterior credible intervals rather than conventional p-values [9]. Similarly, a Bayesian multilevel logistic regression was used to identify individual- and community-level predictors of vaccine acceptance in a Ghanaian municipality, combined with spatial mapping to visualise sub-district disparities in uptake [10]. In a related Kenyan study [11], a Bayesian geospatial approach was used to determine subnational inequalities in measles vaccination coverage.
Zambia's measles burden is not uniformly distributed. Certain provinces repeatedly emerge as high-risk areas across outbreak surveillance reports, coverage surveys, and serosurveys [5], even as national administrative coverage figures often appear close to elimination targets. This apparent contradiction between reported administrative coverage and actual population immunity and the sub-national clustering of risk provides the rationale for the present study. The study uses Bayesian logistic regression to examine measles epidemiology, immunisation coverage, and associated risk factors in Luapula, Northern and Northwestern provinces of Zambia, with a view to informing more geographically targeted disease control and immunisation strategies.
2. Materials and Methods
A retrospective analytical study was conducted using routinely collected measles surveillance data from Luapula, Northern and Northwestern provinces of Zambia. The analysis included suspected measles cases recorded in Jan to June 2026 and investigated through the national measles surveillance system. The study assessed demographic, household, vaccination, and clinical-history factors associated with laboratory-confirmed measles among individuals reported as suspected measles cases. Because the analysis was based on previously collected surveillance records, no additional contact was made with participants.
Study population
The study population comprised individuals notified as suspected measles cases within the three participating provinces during the study period. Records were eligible for inclusion when they had a documented laboratory measles result, information on province, sufficient information on the variables required for the regression analysis.
Sample Size
A total of 172 suspected measles cases were included in the analytical dataset, of whom 45 tested positive for measles. Records with indeterminate or undocumented laboratory results were excluded from the primary outcome analysis. Participants with unknown vaccination status were excluded from the primary regression analysis so that the estimated vaccination effect represented a direct comparison between participants classified as vaccinated and unvaccinated. The final number included in each regression model was reported because complete information was required for all variables entered in the model.
Outcome Variable
The primary outcome was laboratory-confirmed measles, defined using the recorded laboratory result. The outcome was coded as:
Participants with positive laboratory results were therefore classified as confirmed measles cases, whereas those with negative results formed the comparison group.
Explanatory variables
The following explanatory variables were considered based on their epidemiological relevance and availability in the surveillance dataset: age, sex, vaccination status, household size, reported previous history of measles and province. Age was analysed as a continuous variable. To improve model estimation and facilitate comparison with other continuous predictors, age was standardised using:
The resulting odds ratio was interpreted as the change in the odds of laboratory-confirmed measles associated with a one-standard-deviation increase in age.
Sex was treated as a categorical variable, with female as the reference category and male as the comparison category. Vaccination status was categorised as unvaccinated and vaccinated. Unvaccinated participants were used as the reference category. Participants whose vaccination status was recorded as unknown were not included in the primary regression analysis. The coefficient for vaccinated participants therefore represented the odds of laboratory-confirmed measles among vaccinated participants relative to unvaccinated participants, after adjustment for the other variables in the model.
Household size was analysed as a continuous variable and standardised in the same way as age:
Its odds ratio was interpreted per one-standard-deviation increase in household size.
Reported previous measles history was classified as no and yes. Participants reporting no previous measles history formed the reference category. Province was treated as a categorical variable with Luapula Province as the reference category.
Descriptive and Statistical Analysis
Participant characteristics were summarised using frequencies and percentages for categorical variables. Continuous variables were summarised using the mean and standard deviation when approximately normally distributed, or the median and interquartile range when the distribution was skewed. Differences in continuous variables between participants with positive and negative laboratory results were assessed using the Mann–Whitney U test because the variables did not meet the assumptions required for an independent-samples t-test. Categorical variables were compared using Pearson’s chi-square test where expected cell counts were adequate, while Fisher’s exact test was used for sparse comparisons or when expected cell counts were small.
Bayesian logistic regression was used to estimate associations between participant characteristics and laboratory-confirmed measles. The primary model included age, sex, vaccination status, household size and previous measles history. A second model additionally adjusted for province to assess whether geographic differences influenced the magnitude or direction of the estimated associations. Data management, statistical analysis and visualisation were performed in Python.
Bayesian logistic regression analysis
Bayesian logistic regression was used to estimate associations between participant characteristics and laboratory-confirmed measles. For participant the laboratory result was modelled as a Bernoulli outcome [12], such that , where represents the probability of testing positive for measles. The probability was related to the explanatory variables through the logit link:
where is the intercept, represents the value of predictor for participant , and is the corresponding regression coefficient. The primary model included standardized age, sex, vaccination status, standardized household size and previous measles history. A second model additionally adjusted for province to assess whether geographic differences influenced the estimated associations.
Weakly informative normal priors were assigned to the regression coefficients, . These priors permitted associations in either direction while regularising extreme estimates arising from the small number of laboratory-positive cases and sparse categories, particularly previous measles history, for which all four exposed participants tested positive. Posterior distributions were estimated using Markov chain Monte Carlo sampling with the No-U-Turn Sampler implemented through Bambi and PyMC [13]. Regression coefficients were exponentiated to obtain posterior odds ratios:
Results were summarized using posterior odds ratios, 95% credible intervals and posterior directional probabilities, expressed as for estimated positive associations or for estimated inverse associations. A 95% credible interval was interpreted as containing 95% of the posterior probability for the parameter, conditional on the observed data, model, and prior distributions. Model convergence was assessed using trace plots, rank-normalized , bulk and tail effective sample sizes and the number of divergent transitions. Convergence was considered satisfactory when all values were below 1.01, effective sample sizes were adequate, and no divergent transitions were observed. Posterior predictive checks were also conducted to assess whether the fitted models adequately reproduced the observed distribution of laboratory-positive and laboratory-negative cases.
3. Results
Of the 172 suspected measles cases included in the analysis, 45 (26.2%) were laboratory-confirmed. Participant characteristics stratified by laboratory result are presented in Table 1. Age and household size were comparable between laboratory-positive and laboratory-negative participants (p=0.518 and p=.0.214, respectively). Laboratory positivity differed substantially by vaccination status, with a greater proportion of positive cases among unvaccinated participants (p<0.001). All four participants reporting a previous history of measles tested positive, and previous measles history was associated with laboratory positivity in the unadjusted analysis (Fisher's exact p=0.004).
Factors associated with laboratory-confirmed measles in the fully adjusted Bayesian logistic regression model.
Factors associated with laboratory-confirmed measles were assessed using the fully adjusted Bayesian logistic regression model, which included age, sex, vaccination status, household size, previous measles history and province (Table 2). Vaccination status showed the strongest and most clearly supported association with laboratory-confirmed measles. After adjustment for the other covariates, vaccinated participants had substantially lower odds of testing positive compared with unvaccinated participants (posterior OR 0.07, 95% CrI 0.02–0.18). The estimated associations for age, sex, household size and previous measles history were less precise, with 95% credible intervals including the null value.
In the primary Bayesian logistic-regression model, vaccination was strongly associated with reduced odds of laboratory-confirmed measles. The posterior estimates for age, sex, household size and previous measles history were imprecise, with 95% credible intervals spanning the null value. In the province-adjusted Bayesian logistic regression model (Figure 1), vaccination status remained strongly associated with laboratory-confirmed measles. The magnitude and direction of the vaccination effect were materially unchanged after adjustment for province. In addition, the posterior credible intervals for the province coefficients did not include the null value, indicating meaningful differences in measles positivity between the included provinces and the reference province.
The adjusted posterior probability of laboratory-confirmed measles was substantially higher among unvaccinated than vaccinated participants across all provinces (Figure 2). Among unvaccinated participants, the estimated probability of positivity ranged from approximately 86% in Luapula to 92% in Northwestern Province, compared with approximately 34% to 49% among vaccinated participants. Although predicted positivity appeared somewhat higher in Northwestern Province, the overlapping credible intervals indicated considerable uncertainty in the provincial differences.
4. Discussion
This study examined factors associated with laboratory-confirmed measles among suspected cases reported from Luapula, Northern and Northwestern provinces. The principal finding was that vaccination status was strongly associated with measles positivity. Vaccinated participants had substantially lower adjusted odds and lower predicted probabilities of laboratory-confirmed measles than unvaccinated participants. This association remained evident after adjustment for age, sex, household size, previous measles history and province, suggesting that the observed protective association of vaccination was not explained by the measured demographic, household or geographic characteristics.
The adjusted probability analysis further illustrated the importance of vaccination status. Across all three provinces, unvaccinated participants had a considerably higher predicted probability of testing positive than vaccinated participants. Although predicted positivity appeared to vary across provinces, the credible intervals for the provincial estimates overlapped, particularly among vaccinated participants. Therefore, the evidence for differences between provinces was less conclusive than the evidence for differences by vaccination status. Provincial variation may nevertheless reflect differences in vaccination coverage, population movement, outbreak intensity, access to health services, case detection and timeliness of specimen collection. These contextual factors were not fully captured in the surveillance dataset and should be considered when interpreting the geographic findings.
The strong inverse association between vaccination and laboratory-confirmed measles is consistent with the biological and public-health role of measles vaccination in reducing susceptibility to infection. However, some vaccinated participants still tested positive. This finding should not necessarily be interpreted as evidence of vaccine failure because the surveillance data did not provide sufficient information on the number of vaccine doses received, age at vaccination, documentation of vaccination, time since vaccination, cold-chain integrity or underlying immunological status. Vaccination status may also have been based partly on caregiver recall rather than written records, which could have resulted in misclassification. Future analyses should distinguish between zero, one and two documented doses where this information is available.
Age was not clearly associated with measles positivity after adjustment for the other covariates. The posterior estimate was imprecise and its credible interval included the null value. This suggests that the available data did not provide strong evidence that the odds of laboratory-confirmed measles changed with increasing age. Nevertheless, the absence of clear evidence should not be interpreted as proof that age has no epidemiological importance. The relatively small number of confirmed cases, the treatment of age as a linear continuous variable and possible clustering of cases within particular age groups may have limited the ability to detect an age-related pattern. A larger study could examine age using epidemiologically meaningful categories or assess whether its association with positivity is nonlinear.
Similarly, there was no clear evidence of an independent association between sex and laboratory-confirmed measles. The adjusted estimates for males and females were uncertain and compatible with little or no difference. This may indicate that exposure and susceptibility were broadly similar by sex in the study population. However, differences in care-seeking behaviour, surveillance reporting or exposure patterns could still exist and may require a larger sample to evaluate adequately.
Household size was also not clearly associated with measles positivity in the adjusted analysis. Although measles is highly transmissible and household crowding could plausibly increase exposure, household size alone may not accurately represent contact intensity or crowding. Variables such as the number of rooms, sleeping arrangements, presence of school-aged children, contact with a confirmed case and population density may provide more direct measures of transmission opportunity. The absence of a clear association may also reflect limited statistical power and incomplete measurement of household-level exposure.
A particularly notable descriptive finding was that all four participants who reported a previous history of measles tested positive. Fisher’s exact test indicated evidence of an unadjusted association. However, the Bayesian adjusted estimate was highly imprecise and its 95% credible interval included 1. This difference arises because the unadjusted analysis considered only the two-way association between previous measles history and laboratory outcome, whereas the regression model simultaneously adjusted for other variables and accounted for uncertainty arising from the very small, exposed group. The pattern also created complete separation because no laboratory-negative participant reported a previous measles history. Although the Bayesian prior produced a finite estimate, the small number of participants meant that the independent association could not be estimated precisely.
The estimates from the primary and province-adjusted models were generally similar. Adjustment for province did not materially alter the association between vaccination status and measles positivity. This stability supports the robustness of the principal finding within the limitations of the available data. However, the province-adjusted model should not be interpreted as fully accounting for all geographic differences, because only three provinces were represented and unmeasured variation may have existed between districts, facilities and communities.
The use of Bayesian logistic regression was an important strength of the analysis. The dataset contained only 45 laboratory-positive cases and included sparse categories, especially previous measles history. Under these conditions, conventional maximum-likelihood logistic regression can produce unstable or infinite estimates. Weakly informative priors regularised extreme coefficients while allowing the uncertainty associated with limited data to be reflected in the posterior distributions. Reporting posterior odds ratios, credible intervals and directional probabilities also provided a more complete description of the strength and uncertainty of the observed associations than relying solely on dichotomous significance testing.
5. Conclusion
In conclusion, vaccination status was the most clearly supported factor associated with laboratory-confirmed measles in this analysis. Vaccinated participants had markedly lower adjusted odds and predicted probabilities of positivity than unvaccinated participants, and this finding remained stable after adjustment for province. Evidence for independent associations with age, sex, household size and previous measles history was less conclusive because of wide credible intervals and sparse data. Strengthening routine immunisation, closing geographic immunity gaps and improving the completeness of measles surveillance data remain essential for measles prevention and outbreak control.
Supplementary Materials
The following supporting information can be downloaded at the website of this paper posted on Preprints.org. Figure S1: Trace plots for province-adjusted sensitivity model.
Author Contributions
Conceptualization, P.N.G., D.N., R.C. and D.S.; Methodology, P.N.G., D.N., M.C., R.C. and D.S.; Investigation, P.N.G., D.N., M.C., K.M. and L.L.; Data Curation, P.N.G., D.N. and W.A.; Formal Analysis, P.K.; Project Administration, P.N.G., D.S. and R.C.; Supervision, P.N.G., D.S. and R.C.; Writing – Original Draft Preparation, P.N.G. and D.N.; Writing – Review & Editing, P.N.G., D.N. and W.A. All authors have read and agreed to the published version of the manuscript.
Funding
This study was funded by the Pandemic Fund with support from the World Health Organization.
Institutional Review Board Statement
The study was conducted in accordance with the Declaration of Helsinki and approved by the ERES Converge Institutional Review Board, Lusaka, Zambia (protocol code 2026-May-041; date of approval: 1 June 2026). Authority to conduct research was obtained from the National Health Research Authority (NHRA), Zambia.
Informed Consent Statement
Individual informed consent was not applicable because this study involved a retrospective analysis of routinely collected, anonymized measles surveillance data.
Data Availability Statement
The datasets generated and/or analyzed during the current study are available from the corresponding author upon reasonable request.
Conflicts of Interest
The authors declare no conflict of interest. The sponsors had no role in the design, execution, interpretation, or writing of the study.
Acknowledgments
The authors acknowledge the provincial and district health teams involved in measles surveillance and reporting in Luapula, Northern, and Northwestern provinces.
Appendix A. Ethical Approval

Appendix B: NHRA Approval

References
- Munetsi, T.; Chirundu, D.; Chadambuka, A.; Juru, T.P.; Shambira, G.; Gombe, N.T.; Tshimanga, M.; Makurumidze, R. Measles Outbreak: Knowledge, Vaccine Hesitancy, Health-Seeking Practices among Caregivers of Children with Measles and Factors Associated with Measles Transmission in Sanyati District, Zimbabwe, 2022. JOURNAL_ABBREVIATION 2025, 51, 18 2025, 51. [Google Scholar] [CrossRef]
- Yitbarek, K.; Mahimbo, A.; Tekle Bobo, F.; Woldie, M.; Sheel, M.; Frawley, J.; Hayen, A.; Glob Health, B. Impact of Measles Vaccination Strategies on Vaccination Rates in Low-Income and Middle-Income Countries: A Systematic Review and Meta-Analysis. BMJ Glob. Health 2025, 10, 16647. [Google Scholar] [CrossRef] [PubMed]
- Mbivnjo, E.L.; Lynch, M.; Huws, J.C. Measles Outbreak Investigation Process in Low- and Middle-Income Countries: A Systematic Review of the Methods and Costs of Contact Tracing. Z. Gesundh. Wiss. 2022, 30, 2407–2426. [Google Scholar] [CrossRef] [PubMed]
- World Health Organization. The Measles Rubella Post-Campaign Coverage Survey Disseminated. Available online: https://www.afro.who.int/countries/zambia/news/measles-rubella-post-campaign-coverage-survey-disseminated (accessed on 26 July 2026).
- Mwale, M.; Phiri, G.; Mwansa, F.D.; Chipimo, P.J.; Masumbu, P.; Matanda, K.; Kayeye, P.; Mwangilwa, K.; Nakazwe, C.; Namukoko, H.; et al. Profiling Zero-Dose Measles-Rubella Children in Zambia: Insights from the 2024 Post-Campaign Coverage Survey. PLoS Glob. Public Health 2025, 5. [Google Scholar] [CrossRef] [PubMed]
- Prosperi, C.; Truelove, S.; Carcelen, A.C.; Chongwe, G.; Mwansa, F.D.; Ndubani, P.; Simulundu, E.; Bwalya, I.C.; Hamahuwa, M.; Kapungu, K.; et al. High Measles and Rubella Vaccine Coverage and Seroprevalence among Zambian Children Participating in a Measles and Rubella Supplementary Immunization Activity. PLoS Glob. Public Health 2025, 5, e0003209. [Google Scholar] [CrossRef] [PubMed]
- MacLehose, R.F.; Hamra, G.B. Applications of Bayesian Methods to Epidemiologic Research. Curr. Epidemiol. Rep. 2014 1:3 2014, 1, 103–109. [Google Scholar] [CrossRef]
- Zhang, J.; Wang, W.; Yang, M.; Tian, M. Variational Bayesian Variable Selection in Logistic Regression Based on Spike-and-Slab Lasso. Mathematics 2025, Vol. 13 13, 2205 2025 2205. [Google Scholar] [CrossRef]
- Endalamew, S.G.; Gebeye, E.; Assefa, S.K.; Geremew, B.M. Immunization Coverage and Its Determinants Among Children Aged 12–23 Months in East Africa: A Bayesian Hierarchical Modeling Approach Based on DHS 2019–2022. BioMed Res. Int. 2025, 2025, 6645541. [Google Scholar] [CrossRef] [PubMed]
- Kwadzokpui, P.K.; Ablordey, K. Community-Level Determinants of RTS,S/AS01 Vaccine Acceptance in a Hyperendemic Ghanaian Region: A Bayesian Multilevel Analysis from Kpando Municipality, Ghana. PLoS Glob. Public Health 2025, 5, e0005436. [Google Scholar] [CrossRef] [PubMed]
- Njuguna, B.; Sayianka, S.; Okunga, E.; Omondi, G.P.; Kiarie, H.; Kimani, T.N.; Maritim, M.C.; Fronterre, C. Subnational Inequities in Measles Vaccination Coverage in Kenya: A Bayesian Geostatistical Modelling Analysis. Res. Sq. 2026. [Google Scholar] [CrossRef] [PubMed]
- Gosho, M.; Ishii, R.; Nagashima, K.; Noma, H.; Maruo, K. Determining the Prior Mean in Bayesian Logistic Regression with Sparse Data: A Nonarbitrary Approach. J. R. Stat. Soc. Ser. C Appl. Stat. 2025, 74, 126–141. [Google Scholar] [CrossRef]
- Khanday, M.A.; Afsar, S.; Gilhotra, I.; Bhat, D.A.; Jahan, S.A. MARKOV CHAIN MONTE CARLO AND MODERN BAYESIAN COMPUTATION. Reliab. Theory Appl. 2025, 20, 1115–1128. [Google Scholar] [CrossRef]
Figure 1.
Posterior odds ratios from the primary and province-adjusted models.
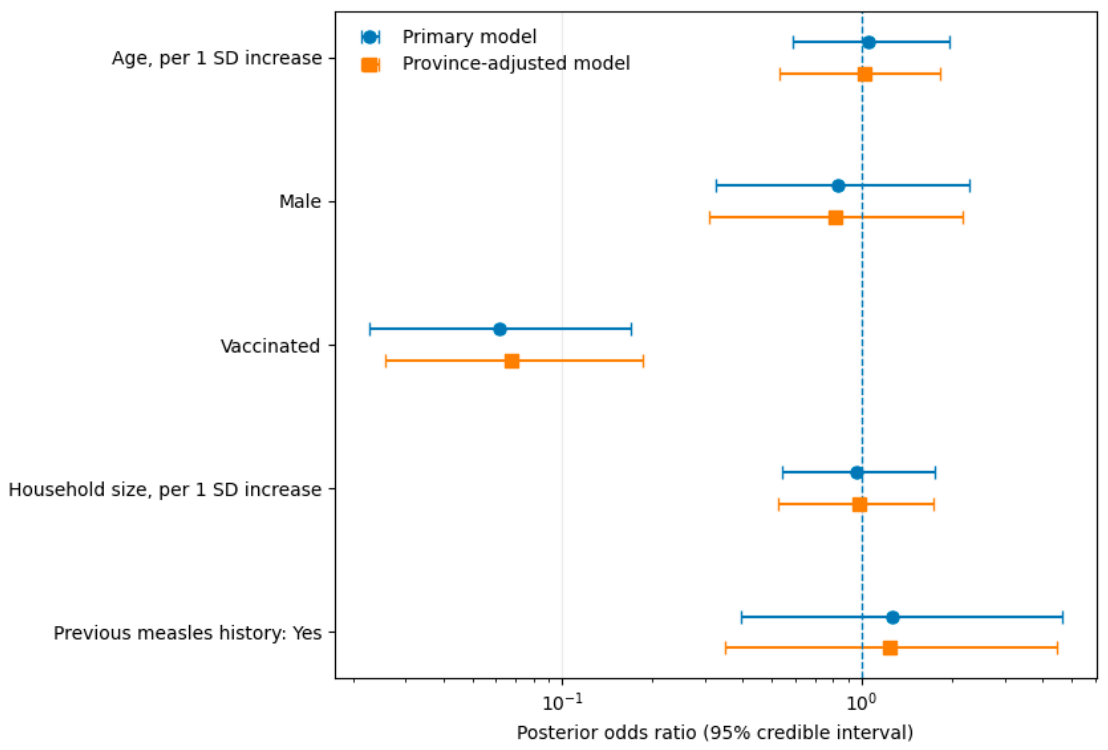
Figure 2.
Adjusted posterior probability of laboratory-confirmed measles by vaccination status and province.
Figure 2.
Adjusted posterior probability of laboratory-confirmed measles by vaccination status and province.
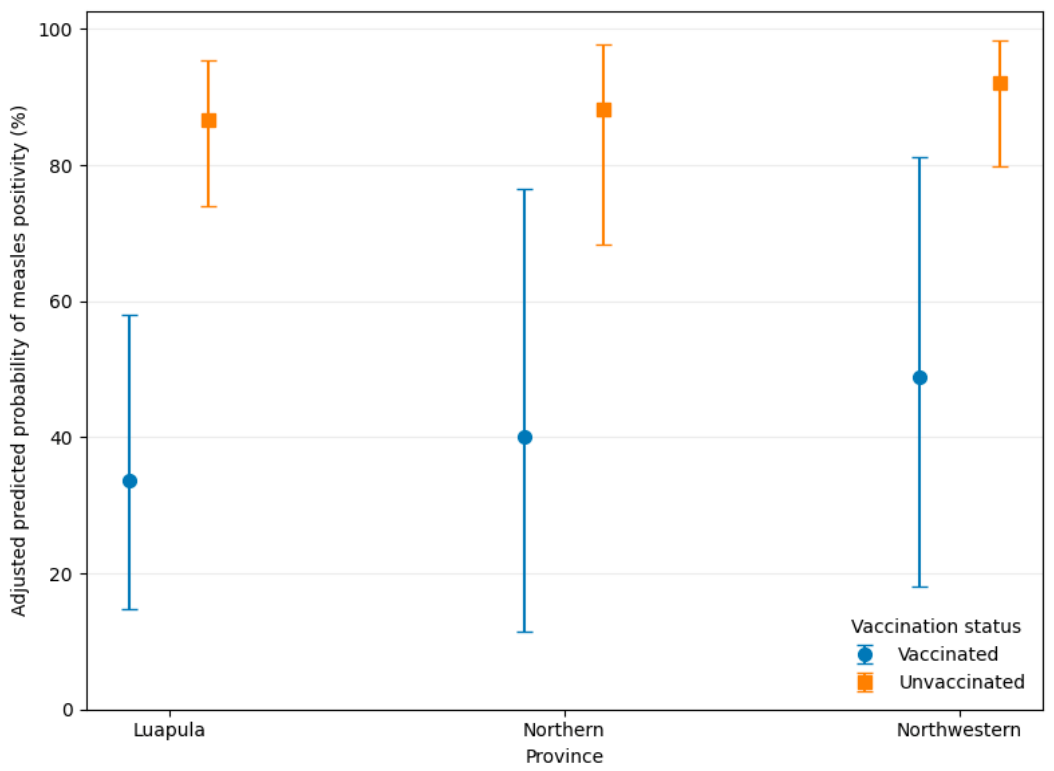

Table 1.
Participant Characteristics.
| Characteristic | Overall | Positive | Negative | p-value |
| Total | 172 | 45 | 127 | |
| Age, years, median (IQR) | 6.0 (4.0–8.0) | 6.0 (4.0–9.0) | 6.0 (4.0–8.0) | 0.518† |
| Household size, median (IQR) | 5.0 (4.0–6.0) | 5.0 (5.0–6.0) | 5.0 (4.0–6.0) | 0.214† |
| Province | 0.677‡ | |||
| Luapula | 105 (61.0%) | 25 (55.6%) | 80 (63.0%) | |
| Northwestern | 54 (31.4%) | 16 (35.6%) | 38 (29.9%) | |
| Northern | 13 (7.6%) | 4 (8.9%) | 9 (7.1%) | |
| Sex | 0.766‡ | |||
| Female | 95 (55.2%) | 24 (53.3%) | 71 (55.9%) | |
| Male | 77 (44.8%) | 21 (46.7%) | 56 (44.1%) | |
| Age group | 0.910‡ | |||
| <1 year | 0 (0.0%) | 0 (0.0%) | 0 (0.0%) | |
| 1–4 years | 48 (27.9%) | 12 (26.7%) | 36 (28.3%) | |
| 5–9 years | 104 (60.5%) | 27 (60.0%) | 77 (60.6%) | |
| 10–14 years | 20 (11.6%) | 6 (13.3%) | 14 (11.0%) | |
| ≥15 years | 0 (0.0%) | 0 (0.0%) | 0 (0.0%) | |
| Vaccination status | <0.001‡ | |||
| Vaccinated | 17 (9.9%) | 0 (0.0%) | 17 (13.4%) | |
| Unvaccinated | 45 (26.2%) | 45 (100.0%) | 0 (0.0%) | |
| Unknown | 110 (64.0%) | 0 (0.0%) | 110 (86.6%) | |
| Previous history of measles | 0.004§ | |||
| Yes | 4 (2.3%) | 4 (8.9%) | 0 (0.0%) | |
| No | 168 (97.7%) | 41 (91.1%) | 127 (100.0%) |
Values are presented as n (%) unless otherwise indicated. † Mann–Whitney U test; ‡ Pearson’s chi-square test; § Fisher’s exact test. Percentages were calculated within laboratory-result groups.
Table 2.
Factors associated with laboratory-confirmed measles.
| Predictor | Adjusted posterior OR (95% CrI) | Probability of increased odds (%) | Probability of reduced odds (%) |
| Age, per 1 SD increase | 1.02 (0.55–1.89) | 53.2 | 46.8 |
| Sex | |||
| Female Male |
1.00 (REF) 0.81 (0.31–2.17) |
REF 34.3 |
REF 65.7 |
| Vaccination Status | |||
| Unvaccinated Vaccinated | 1.00 (REF) 0.07 (0.02–0.18) |
REF0 | REF 100 |
| Household size, per 1 SD increase | 0.98 (0.53–1.78) | 47.4 | 52.6 |
| Previous measles history | |||
| No Yes |
1.00 (REF) 1.24 (0.35–4.54) |
REF 63.2 |
REF 36.8 |
| Province | |||
| Luapula Northern Northwestern |
1.00 (REF) 1.30 (0.38–4.36) 1.97 (0.65–6.28) |
REF 66 87.5 |
REF 34 12.5 |
Disclaimer/Publisher’s Note: The statements, opinions and data contained in all publications are solely those of the individual author(s) and contributor(s) and not of MDPI and/or the editor(s). MDPI and/or the editor(s) disclaim responsibility for any injury to people or property resulting from any ideas, methods, instructions or products referred to in the content. |
© 2026 by the authors. Licensee MDPI, Basel, Switzerland. This article is an open access article distributed under the terms and conditions of the Creative Commons Attribution (CC BY) license.
Copyright: This open access article is published under a Creative Commons CC BY 4.0 license, which permit the free download, distribution, and reuse, provided that the author and preprint are cited in any reuse.


