

Submitted:
28 July 2026
Posted:
29 July 2026
You are already at the latest version
Abstract
Federated learning (FL) enables collaborative training without centralizing raw data, yet malicious clients can poison local data or updates and degrade the global model. We present FLVaccin, a hierarchical framework on an unbalanced tree in which every non-root node aggregates and hosts local clients—to our knowledge, the first design not confining all clients to the deepest level; only the root aggregates with zero local clients. All experiments use personalized federated learning (FedPer): shared feature layers are federated bottom-up, while each client keeps a private classifier head. FLVaccin combines two defenses: (i) node-level vaccination, mixing CIFAR-100 images into CIFAR-10 shards, and (ii) depth- and round-adaptive quarantine, whose per-client tolerances are set from vaccination mean-accuracy calibration (30 single-round trials across injection-intensity bands); clients exceeding allowed metric swings are temporarily excluded, while the root rejects global backbone updates with deteriorating validation trends. Implemented with MobileNetV2/FedPer and Dirichlet Non-IID partitioning (α = 0.5), 100 clients federate across 25 nodes over four levels. Without defense, 130 attacks collapse test accuracy from 77.4% to 21.0%; with our defense mechanism, 535 attacks yield 77.3% (k-fold 76.5%±0.4%), within 2.6 percentage points of the clean baseline (96.8% of clean accuracy), showing practical tree-aware robustness while preserving privacy.
Keywords:
personalized federated learning
; hierarchical aggregation
; data poisoning
; model poisoning
; vaccination defense
; quarantine
1. Introduction
Federated learning enables institutions to train a shared model from decentralized data without exchanging raw samples, offering strong privacy benefits for domains such as healthcare and finance [1]. However, any participant with control over local data or outgoing updates can launch poisoning attacks that reduce global accuracy, prevent convergence, or implant backdoors [2,3]. Classical robust aggregators (Krum, trimmed mean, geometric median) assume a flat star topology and often struggle when data are highly Non-IID [4,5].
Hierarchical FL organizes participants under intermediate aggregators in a tree or multi-tier graph, improving scalability and communication efficiency [6]. In most prior hierarchical designs, all clients reside exclusively at the leaf level while interior nodes only aggregate [7]. FLVaccin instead uses an unbalanced tree in which each non-root node hosts its own local clients and FedPer-aggregates child shared backbones; only the root has no local data. Security in this richer topology remains under-explored: a compromised branch can affect many downstream participants, and flat defenses do not directly exploit depth-dependent heterogeneity. SHIELD [7] recently addressed secure aggregation against poisoning in hierarchical FL, motivating comparison with tree-aware proactive defenses.
This paper proposes FLVaccin, a modular hierarchical FL simulator built on personalized federated learning (FedPer) [8]: a shared backbone is federated across the tree, but every client retains its own classifier head. The system includes two defense pillars:
- 1.
- Node-level data vaccination. Trusted tree nodes replace a configurable percentage of each hosted client’s local CIFAR-10 shard with out-of-distribution CIFAR-100 images while preserving the original labels. To our knowledge, this node-scoped auxiliary-data injection—applied selectively across an unbalanced aggregator tree rather than uniformly at all leaves—has not been combined with depth-calibrated monitoring in prior FL poisoning defenses.
- 2.
- Trend-based quarantine with vaccination-calibrated tolerances. Quarantine operates per client, not per aggregator node. After a universal round-one calibration quarantine of all federation clients, each client is monitored on training and validation accuracy and loss. The maximum allowed relative drop for client i depends on the tree level of the node that hosts it and on the training round t, using shallow- and deep-level bounds chosen from the vaccination mean study (Section 3.6). If any round-over-round trend for client i falls below , that client is excluded from FedPer aggregation for round t only. The root has no local clients and is never quarantined; instead, after bottom-up FedPer aggregation, the root rejects the candidate global shared backbone when its own validation trend would exceed the root-level allowance, keeping the previously accepted (shared backbone), see Table 2.
Our contributions are:
- 1.
- An unbalanced hierarchical tree FL topology with FedPer aggregation at every node, in which each non-root node is both an aggregator and a client host; to our knowledge, this is the first hierarchical FL system that does not place all clients exclusively at the deepest level—only the root has zero local clients.
- 2.
- A vaccination mean-accuracy calibration procedure (30 single-round runs across three injection-intensity bands) that quantifies the round-one accuracy cost of node-level CIFAR-100 mixing and guides depth-dependent quarantine thresholds.
- 3.
- A depth- and round-adaptive quarantine policy that assigns each client a vaccination-calibrated allowed drop according to host-node depth and training progress, with root-level FedPer backbone rejection rather than node quarantine; to our knowledge, coupling auxiliary-data vaccination statistics with tree-depth-aware per-client trend quarantine is novel among FL poisoning defenses.
- 4.
- An experimental study on CIFAR-10 under hierarchical FedPer showing clean accuracy of 79.9%, near-random collapse under unconstrained attacks (20.2%), and 76.5% k-fold accuracy with defense enabled despite four times more attack events.
Figure 1 summarizes FLVaccin: an unbalanced FedPer tree (center) with a federated shared backbone and private client heads (top left); red paths show poisoned updates without defense. Defense Pillar I (bottom) injects CIFAR-100 auxiliary data at vaccinated nodes, calibrated in 30 single-round runs. Defense Pillar II (right) quarantines clients whose metric trends exceed depth-dependent tolerances and lets the root reject bad global backbone updates.
2. Related Work
2.1. Poisoning Attacks
Poisoning attacks are commonly grouped by adversarial goal. Untargeted attacks degrade overall accuracy [9,10]; targeted attacks such as backdoors preserve clean accuracy while misclassifying triggered inputs [3,11]. Representative attack vectors include:
Label flipping (data poisoning): the adversary corrupts labels in a fraction of local samples [12,13].
Backdoor (data poisoning): a visual trigger is embedded in training images and associated with a target class [3,11,14].
Model poisoning (model/update poisoning): the adversary manipulates outgoing weights after local training, e.g., by injecting scaled noise [10,15,16].
Byzantine updates (model/update poisoning): the adversary replaces a subset of parameters with arbitrary values [4,17].
Sign-flip updates (model/update poisoning): after local training, the adversary negates a random subset of coordinates in the submitted weight tensor to flip the contribution direction relative to honest updates [10].
2.2. Defense Strategies
Robust aggregation: Krum [4] selects the single client update closest to its peers in parameter space, tolerating a bounded number of Byzantine workers. Coordinate-wise trimmed mean and geometric median aggregation [5,18] discard extreme coordinates or outliers before averaging, improving resilience when malicious updates deviate strongly from the honest distribution.
Server-trust and validation-based defenses: FLTrust [19] maintains a small server-held root dataset, computes a trusted root update, and reweights each client contribution by cosine similarity to that reference. BaFFLe [20] uses feedback from a validation set to detect backdoor behavior and exclude suspicious local models before aggregation.
Anomaly detection: CONTRA [21] flags client updates whose cosine similarity to expected patterns falls outside a learned tolerance band. Auror [22] clusters training behavior across workers to surface coordinated poisoning campaigns in distributed settings.
Reputation and audit mechanisms: Blockchain-backed reputation schemes [23,24,25] track client trust scores over time and can penalize participants whose updates repeatedly harm global performance.
Provable ensemble defenses: FLCert [26] ensembles multiple global models and provides certified robustness bounds against a bounded number of adversarial clients, trading compute for formal guarantees.
Vaccination-style auxiliary data: Recent work injects or curates auxiliary samples to harden clients against poisoning. Sundar et al. [27] propose a vaccination framework that mixes trusted auxiliary data into local training, while RECESS [28] uses curated external samples to regularize updates and resist model-poisoning attacks.
Surveys [2,29,30] note that most of these defenses target flat star topologies and do not exploit hierarchical aggregation structure.
SHIELD [7] is the closest hierarchical baseline: it combines secure aggregation with poisoning resilience up to 50% malicious clients on CIFAR-10 with negligible accuracy drop. FLVaccin differs by using an unbalanced tree with intra-level clients, personalized federated learning (FedPer) [8], node-level CIFAR-100 vaccination calibration, and per-client trend quarantine with depth-adaptive thresholds rather than cryptographic secure aggregation alone.
Table 1 situates FLVaccin among representative CIFAR-10 poisoning defenses. Our experiments use hierarchical FedPer (personalized FL).
3. Materials and Methods
3.1. System Architecture
Figure 2 shows how FLVaccin’s modules communicate. The orchestrator (main) drives every round and selects the compute device (CUDA, Apple MPS, or CPU). It first loads four setup modules: config (hyperparameters), data_loader (CIFAR-10/100 shards), tree_structure (unbalanced host tree), and model (MobileNetV2 FedPer split). These feed client + personalization, where hosted clients train locally and keep private heads. From there, two optional paths may apply: vaccination mixes trusted CIFAR-100 samples into selected client shards, and attacks corrupt data or updates. Client metrics go to defense, which quarantines suspicious clients and can reject a bad root backbone. Non-quarantined updates enter aggregation (bottom-up FedPer averaging), then evaluation records metrics and plots and feeds results back to the orchestrator for the next round. The experimental tree instance is detailed in Section 4.
3.2. Hierarchical Topology and FedPer Protocol
We model the federation as an unbalanced tree , where is the set of vertices (aggregator nodes) and is the set of undirected edges connecting parent–child aggregators. Each vertex has depth (the root at ), child aggregators , and hosted clients with private CIFAR-10 shards. Unlike classical hierarchical FL, where all clients sit at the leaves and interior nodes only relay updates, FLVaccin allows intra-level placement: every non-root node hosts local clients that perform all local training on private shards and FedPer-aggregates its subtree before passing the result upward—nodes aggregate only and do not train. Only the root has —it coordinates the federation, broadcasts the accepted shared backbone, and may reject a bad global update after validation (Section 3.6). Because fan-out and client load differ across nodes, the tree is heterogeneous rather than balanced; to our knowledge, prior hierarchical FL papers assume clients only at the deepest tier.
All experiments use personalized FL (FedPer) [8]. Each MobileNetV2 network splits into a shared feature block (the features backbone, federated bottom-up) and a local classifier block (the classifier head, private to client i). Table 2 defines every symbol in the round protocol; superscript t always denotes the start of communication round .

Table 2.
FedPer round-protocol notation.
| Group | Symbol | Meaning |
| Model split | ||
| Shared backbone (features); averaged bottom-up at every node | ||
| Private classifier head of client i (classifier); never sent to aggregation | ||
| , | Backbone and head of client i when round t begins | |
| Rounds | ||
| t, T | Current round index and total communication rounds | |
| E | Local training epochs per active client in each round | |
| Indices | ||
| i | Federation client (hosted at some tree node) | |
| v | Aggregator node in | |
| j | Model indexed in aggregation pool | |
| Aggregation | ||
| Non-quarantined models at node v (hosted clients and child-node models) | ||
| Number of models averaged in Eq. (1) | ||
| , | Shared backbone after aggregation at v; candidate global backbone at root (accepted or rejected) | |
Over T communication rounds, learning proceeds bottom-up through the tree:
- 1.
- Broadcast. The root sends to all clients. Client i assembles from the broadcast backbone and the head retained from the previous round.
- 2.
- Local training. Each active client runs E local epochs on its shard (after optional vaccination or attack corruption), updating both parameter blocks; is stored locally and is not federated.
- 3.
-
Bottom-up FedPer aggregation. From the deepest level to the root, each node v pools non-quarantined models from its hosted clients and child nodes into and averages only shared weights:Classifier heads are averaged solely to build a complete model for node-level validation and upward relay; clients never receive this pooled head.
- 4.
- Global acceptance. The root evaluates the candidate ; if validation trends exceed the allowed tolerance, the previous backbone is kept (Section 3.6).
Figure 3 illustrates this topology schematically. Green horizontal bands mark hierarchy levels (). The black node at is the root; all other aggregator nodes are grey. Solid and dashed lines denote top-down broadcast and bottom-up FedPer aggregation, respectively. Each non-root grey node may host from 0 to N local clients (inset); only the root has . Section 4 and Figure 4 give the fixed experimental tree with concrete client counts per node.
3.3. Datasets, Partitioning, and Vaccination
We use CIFAR-10 as the primary classification benchmark (50 000 training and 10 000 test images, 10 classes, RGB) and CIFAR-100 as an auxiliary source of out-of-distribution vaccine images. Training images are augmented with random crop (padding 4), horizontal flip, and channel normalization using CIFAR-10 statistics. The 50 000 training samples are split across N federation clients under a Dirichlet Non-IID partition with concentration : for each class k, a client mixture vector
gives the fraction of class k allocated to client , with ; lower induces stronger label skew across clients.
Vaccination is applied at the node level on this same data setup: any non-root aggregator can be marked as vaccinated. For node v with vaccine fraction , each hosted client replaces exactly samples in its local shard with random CIFAR-100 images while keeping the original CIFAR-10 labels. Because clients reside at multiple hierarchy levels, injection can target shallow coordinators, deep edge nodes, or any combination—unlike leaf-only schemes in flat or classical hierarchical FL.
Before multi-round defended training, we run a vaccination mean-accuracy calibration to characterize how benign auxiliary injection affects round-one performance—not adversarial attacks. We execute 30 independent single-round FedPer trials on the fixed tree (defense disabled). These trials are grouped into three vaccination bands—Low, Medium, and Hard—with 10 random configurations per band. Each trial independently samples (i) which non-root aggregator nodes are vaccinated and (ii) what fraction of each selected node’s client shard is replaced, drawing both values uniformly at random within the band ranges below (the same percentage interval applies to node coverage and per-node injection dose). Vaccinated nodes may therefore appear at any hierarchy level (–):
- Low: 10–25% of non-root nodes vaccinated; each selected node receives 10–25% vaccine in its clients’ shards;
- Medium: 25–50% of nodes; 25–50% vaccine per selected node;
- Hard: 50–80% of nodes; 50–80% vaccine per selected node.
Each trial completes one FedPer round and records round-one global validation accuracy on the full CIFAR-10 test set. The spread of benign accuracy reactions across these 30 setups feeds the quarantine tolerance mapping (Section 3.6); measured outcomes are reported in Section 4.2.
3.4. Model Architecture and Training Protocol
Each client trains a MobileNetV2 [1] backbone initialized from ImageNet pre-training. Because CIFAR images are , the first convolution uses stride 1 instead of 2, and the 10-class head outputs one logit per CIFAR-10 category. Following FedPer (Section 3.2), the features module maps to the shared parameters federated at every tree node (Eq. (1)), while the classifier module maps to the private head retained by client i across rounds.
All experiments run for communication rounds. In each round, every active client performs local epochs with Adam (, batch size , cross-entropy loss) on its local shard after the root broadcasts and the client merges it with . Optional node-level CIFAR-100 mixing and adversarial corruption are applied to the shard before local training; each client is then evaluated on the full 10 000-image CIFAR-10 test set. Clients whose metric trends trigger quarantine are omitted from for that round only; non-quarantined updates are FedPer-aggregated bottom-up as in Section 3.2.
3.5. Threat Model and Attack Suite
We assume a white-box adversary controlling a subset of clients who can corrupt local data and/or outgoing weights before FedPer aggregation. Each attack is parameterized by severity , which deterministically sets the fraction of corrupted samples (data attacks) or perturbed parameters (model attacks). Five attacks are supported, each tied to primary literature:
- 1.
- 2.
- 3.
- 4.
- 5.
- Sign-flip update (model/update poisoning) [10]: after local training, independently select each weight scalar with probability s and negate it (); unselected parameters are unchanged.
In free-attack mode, compromised clients still participate in FedPer aggregation; in attack+defense mode, quarantine may exclude them.
3.6. Trend-Based Quarantine Defense
Quarantine applies to individual clients (node_id, client_id), not to aggregator nodes as a whole. Each hosted client is monitored on four signals when available: training accuracy, training loss, validation accuracy, and validation loss. The allowed relative drop for client i depends on the tree level of its host node and on the training round t. To our knowledge, no prior FL poisoning defense couples vaccination mean-accuracy calibration with depth-interpolated, round-adaptive per-client trend quarantine on an unbalanced aggregator tree.
Round-one baseline. All clients are quarantined in round so their metrics establish trend baselines without influencing FedPer aggregation; enforcement begins in round .
Intuition. Each client is allowed a relative amount of metric deterioration from one round to the next before it is treated as suspicious. That allowance is not a constant: it is learned from benign vaccination experiments (how much accuracy can legitimately move when CIFAR-100 is mixed in), scaled by how deep the client sits in the tree, and tightened as training progresses. Table 3 lists every symbol used below.
Step 1: calibrating from vaccination. The 30-run study (Section 4.2) asks: without any attack, how much can round-one global accuracy move when benign CIFAR-100 is injected at Low, Medium, or Hard intensity? For each trial we record global validation accuracy and compare it to the unvaccinated round-one baseline. The largest relative swing across all benign setups is
i.e., the worst-case legitimate performance change induced by heterogeneous vaccination—not by poisoning. We use as the reference scale for how much round-over-round movement a deep client may exhibit before quarantine.
Step 2: depth-dependent endpoints at round . Clients deeper in the tree see stronger local Non-IID skew and larger auxiliary-data effects, so they receive a wider tolerance band than clients near the root (whose updates propagate upward and affect the global backbone). At the start of enforcement () we set:
meaning a deepest-level client may tolerate up to relative deterioration in any monitored metric, while a shallow-level client—and the root’s own global-backbone acceptance test—may tolerate only half that. In our experiments , so and (Section 4.2).
Step 3: tightening over rounds. As training proceeds, the model should stabilize and large metric swings become less plausible even under benign heterogeneity. Both depth endpoints therefore shrink linearly from round 2 to the final round T:
where the late-round targets are and . At with , this yields and : shallow clients become strictest by the end of training, while deep clients tighten only to the early root level.
Step 4: per-client allowance by depth. A client hosted at intermediate level receives a tolerance interpolated between the root and deep endpoints for that round. With normalized depth ( at the root, at the deepest level):
Thus a level- client uses , a level- client uses , and clients at (say) fall halfway between when .
Step 5: per-client quarantine rule. For each client i and round , we compare metrics to the previous round and express the change as a fraction of the prior value (so a 5-point accuracy drop from 50% and from 80% are treated consistently):
means accuracy improved; means loss decreased (also an improvement). Validation accuracy and loss trends are computed the same way. Client i is quarantined for round t only if any one of its four trends falls below —that is, if accuracy drops by more than relative to the prior round, or loss rises by more than , on either the training or validation split. Excluded clients may rejoin in a later round when their trends recover; quarantine does not permanently ban a client.
Root global-backbone rejection. The root has no local clients; after bottom-up FedPer aggregation it evaluates the candidate global shared backbone on the CIFAR-10 test set. If the global validation-accuracy or validation-loss trend relative to the last accepted round falls below , the round fails and the previous accepted is retained and broadcast unchanged.
Algorithm 1 summarizes the per-round defense loop and aggregation implemented in FLVaccin.
| Algorithm 1 Trend-based quarantine with vaccination-calibrated tolerances |
|
Require: Tree , round t, total rounds T, client metrics Ensure: Set of clients included in FedPer aggregation
|
Quarantine is per-client, per-round exclusion from FedPer aggregation. The root never quarantines nodes; it only accepts or rejects the candidate global shared backbone based on its validation trend.
4. Results
4.1. Experimental Tree and Setup
All scenarios use one fixed unbalanced tree of the form illustrated schematically in Figure 3: four levels (root at level 0), 25 non-root aggregator nodes, and 100 hosted clients distributed across levels 1–3. Figure 4 shows the concrete instance used in every experimental condition. Client counts per node range from 1 to 10 with heterogeneous fan-out: for example, hosts 10 local clients and three child aggregators (–), whereas hosts one client and no children. Branches differ in depth and arity— fans out to four level-2 leaves (–), while ’s subtree reaches level 3 with nine additional aggregators—so shallow coordinators and deep edge nodes coexist in the same federation. Parenthetical numbers on each node denote hosted client counts; only the root at aggregates with .
Figure 4.
Fixed experimental unbalanced tree used in all scenarios. Four hierarchy levels (–): the root at (red) has zero local clients; blue nodes – are non-root aggregators at levels 1–3. Edges show heterogeneous fan-out (e.g., has three children; has one; is a leaf). Parenthetical counts are hosted clients per node (1–10; 100 total). The same structure is instantiated in every run reported below.
Figure 4.
Fixed experimental unbalanced tree used in all scenarios. Four hierarchy levels (–): the root at (red) has zero local clients; blue nodes – are non-root aggregators at levels 1–3. Edges show heterogeneous fan-out (e.g., has three children; has one; is a leaf). Parenthetical counts are hosted clients per node (1–10; 100 total). The same structure is instantiated in every run reported below.
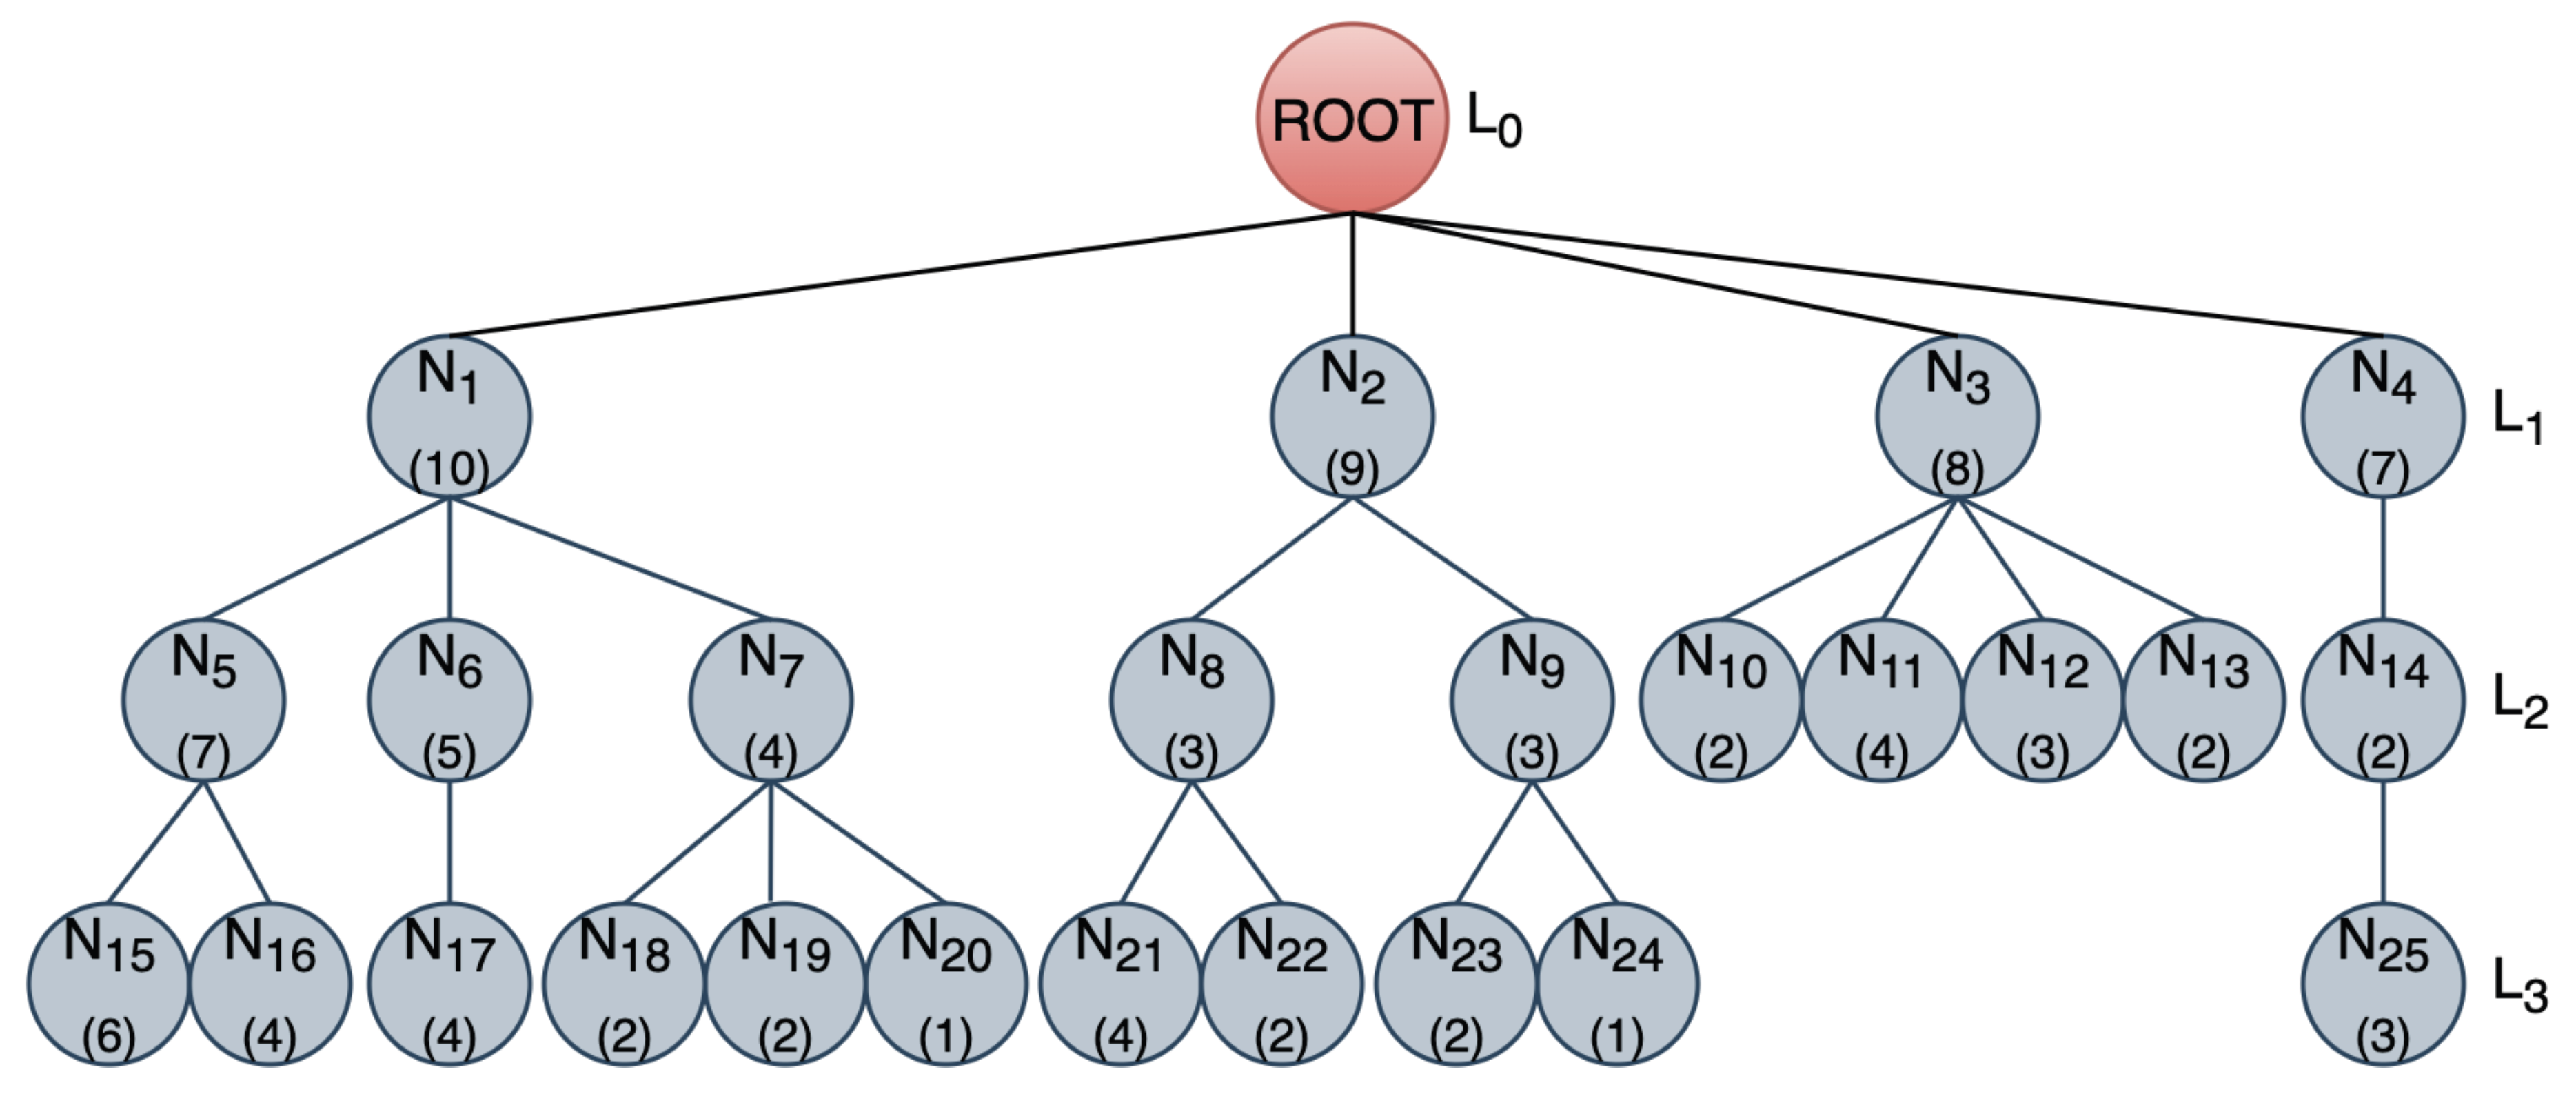
Every scenario trains with hierarchical FedPer: MobileNetV2 shared features are federated bottom-up and each client keeps a private classifier head. The same topology, Dirichlet Non-IID partitioning (, ), and optimization hyperparameters are used unless noted below. Table 4 summarizes the four experimental conditions.
4.2. Vaccination Mean-Accuracy Analysis
We first quantify how node-level CIFAR-100 injection affects early global accuracy on the unbalanced tree before any adversarial stress test. Thirty independent single-round runs—each on the same fixed topology with a fresh random seed—sample configurations within three vaccination bands (10 runs per band); each band jointly draws the fraction of vaccinated non-root nodes and the per-node injection percentage uniformly at random from the same range.
The overall mean round-one global accuracy is 30.8%. Group means across the three bands—which increase both node coverage and per-node injection rate together—are: Low 34.7%, Medium 31.5%, and Hard 26.3%. Higher band severity consistently reduces first-round accuracy, reflecting the distribution shift introduced by out-of-distribution vaccine images with preserved CIFAR-10 labels. Figure 5 plots round-one global accuracy for all 30 single-round calibration runs, grouped into Low (10–25%), Medium (25–50%), and Hard (50–80%) bands (ten runs each; each percentage range applies to both node fraction and injection dose): green, yellow, and red bars show per-run accuracy with dashed tier means and a solid overall mean at 30.8%, and round-to-round spread within each band—for example, Hard ranges from 18.0% to 33.3%—captures benign volatility under random node selection and injection fractions.
Figure 6 summarizes the sampled vaccination configuration behind each run: cell color encodes the mean CIFAR-100 injection percentage across vaccinated nodes, and the “nC” label counts hosted clients at vaccinated nodes for that run. Hard bands consistently cover more nodes, vaccinate more clients, and apply higher per-node injection than Low bands, explaining the accuracy gradient above.
Compared with the clean baseline round-one accuracy of 32.1%, the Hard band shows an additional ≈8.4 percentage-point penalty relative to Low. The largest benign relative swing across these setups motivates for the deepest level and for the root in (Eq. (6)); shallow and deep clients interpolate between these endpoints by tree depth.
4.3. Baseline Training Without Attacks
The clean baseline trains for 20 rounds without attacks, vaccination, or defense on the same unbalanced tree under FedPer. Figure 7 tracks global validation accuracy and loss at the root after each communication round: accuracy rises from 32.1% in round 1 to 79.9% at round 20 while loss falls from to , with the steepest gain in early rounds and steady refinement thereafter.
Figure 8 breaks down performance across all 20 rounds, pooling per-client training and validation metrics and per-node validation at aggregators. Hosted clients reach high local training accuracy (mean 83.7%, median 85.7%) but lower validation accuracy (mean 44.6%, median 45.9%), reflecting Dirichlet Non-IID label skew; several client–round points fall below 50% training accuracy. Aggregator nodes validate near 50.3% mean accuracy with wider spread than the global model, while training loss stays near zero for most clients but validation loss shows a long tail (maximum ≈22.6). This heterogeneity motivates per-client monitoring in the defended scenario (Section 4.5).
We next assess the frozen global FedPer model—shared backbone with each client’s retained private head—using repeated stratified 5-fold×10 validation (50 folds total). Final test accuracy is 79.9% with training accuracy 80.0%. Table 5 summarizes the repeated k-fold statistics.
Figure 9 shows the tight fold-wise distributions (accuracy IQR –; loss IQR –). Both metrics differ significantly from chance ( for accuracy vs. random guessing and for loss vs. a random-classifier baseline).
Figure 10 reports the mean k-fold confusion matrix. Macro-averaged F1 is 79.6%. Recall is highest for automobile (96.9%), frog (94.1%), and ship (91.6%) and lowest for cat (52.6%), bird (61.9%), and airplane (67.5%). The dominant off-diagonal mass is cat→dog (258 mean counts) and bird→frog (130), consistent with visually similar CIFAR-10 categories under personalized heads. This run establishes the reference FedPer performance for the chosen topology and Non-IID configuration.
4.4. Free Attacks Without Defense
In the unconstrained attack scenario, the adversary launches random attacks covering all five attack types (130 events total: 29 label-flipping, 28 sign-flip, 25 model-poisoning, 24 Byzantine, 24 backdoor). Severity is set interactively per round via a Min–Max percentage band; bands across the 20-round schedule span 1–100%. No quarantine is applied—all client updates still enter hierarchical FedPer aggregation. Figure 11 tracks root-level validation metrics: accuracy mirrors the clean baseline through round 5, drops under attacks in rounds 6–10 (minimum 21.2% at round 7), recovers during attack-free rounds 11–17, peaks at 77.4% in round 18, then collapses to 21.0% at round 20 after renewed poisoning in rounds 18–20 (loss falls to at the peak and rises to at round 20; round 19 reaches 10.0% accuracy).
Figure 12 contrasts normal and attacked clients and nodes, pooled over all 20 rounds. Attacked clients show lower training accuracy (mean 56.8%, median 55.1%) and validation accuracy (mean 23.2%, median 20.2%) than normal clients (training 82.9%/84.9%; validation 42.8%/43.9%). Attacked aggregator nodes validate at mean 25.9% (median 17.5%) versus 46.0%/46.4% for normal nodes; attacked-client validation loss reaches 15.3%.
Figure 13 maps the 130 attack events to communication rounds 6–10 and 18–20 (no attacks in rounds 1–5 or 11–17). Cell color encodes mean severity (%); the count in each cell is the number of targeted clients for that attack type in that round. All five attack types appear in every attack round, with 10–25 attacked clients per round.
We next assess the frozen poisoned FedPer model with the same repeated 5-fold×10 validation (50 folds). Final test accuracy is 21.0% with training accuracy 20.0%—indistinguishable from 10-class chance. Table 6 summarizes the k-fold statistics.
Figure 14 shows the collapsed fold-wise distributions (middle 50% of folds: accuracy 19.8%–20.3%; loss 2.317–2.322).
Figure 15 reports the mean k-fold confusion matrix after collapse. Macro-averaged F1 is 10.5%. Predictions concentrate on cat (recall 45.2%), deer (82.5%), and frog (69.0%), while automobile, bird, dog, horse, and truck reach 0% recall. Hierarchical FedPer averaging alone does not contain this adaptive mixed-attack schedule.
4.5. Attacks with Trend-Based Defense
The defended scenario applies interactive attack scheduling with substantially higher volume (535 attack events: 117 backdoor, 109 model-poisoning, 106 Byzantine, 105 sign-flip, 98 label-flipping) and enables vaccination-calibrated per-client quarantine: round-one calibration of all clients, then depth- and round-adaptive allowances (from 15% at shallow levels to 30% at depth 3 early in training, tightening by round 20), plus root-level FedPer backbone rejection when validation trends exceed the root allowance. Per-round attack severity bands are interactive; most rounds use 1–25% to 1–50% ranges, but the schedule includes at least one 80–100% round. CIFAR-100 injection is not active in this run; defense relies on the monitoring policy whose bounds were calibrated from the vaccination mean study. Figure 16 tracks root-level validation metrics under attacks in every round: accuracy rises from 28.3% at round 2 to 77.3% at round 20 while loss falls from to ; orange markers at rounds 10, 12, 14, 19, and 20 mark root-level backbone rejection (skip-root aggregation).
Figure 17 contrasts normal and attacked clients and nodes, pooled over all rounds ( normal vs. 535 attacked client–round records). Attacked clients show lower training accuracy (mean 66.0%, median 67.2%) and validation accuracy (mean 26.2%, median 25.1%) than normal clients (training 80.5%/82.8%; validation 40.9%/42.1%), but attacked aggregator nodes validate at mean 43.7% (median 46.0%)—comparable to normal nodes (42.5%/44.0%)—indicating that quarantine and root rejection limit poisoned updates before they accumulate branch-wide.
Figure 18 maps all 535 attack events and 815 quarantine events across 20 rounds. Cell color encodes mean attack severity (%); the count in each attack-type cell is the number of targeted clients for that type in that round. Attacks occur in every round (5–50 clients per round); severity peaks in rounds 18–19 (≈80–100%). Round 1 quarantines all 100 clients for calibration; subsequent rounds quarantine 14–47 clients, generally matching or exceeding the number attacked.
The system logged 815 quarantine events across 19 completed FedPer aggregation rounds after round-one calibration. Root-level backbone rejection skipped global aggregation in 5 of those rounds (10, 12, 14, 19, and 20), leaving only 14 successful root updates; nevertheless, final test accuracy is 77.3% with training accuracy 76.4%—only 2.6 percentage points below the 79.9% clean baseline (retaining 96.8% of clean accuracy) despite more than four times as many attacks as the free-attack run and despite one-quarter of post-calibration root rounds being rejected. Table 7 summarizes the repeated k-fold statistics.
Figure 19 shows the tight fold-wise distributions (middle 50% of folds: accuracy 76.2%–76.8%; loss 0.680–0.693). Both metrics differ significantly from chance ().
Figure 20 reports the mean k-fold confusion matrix. Macro-averaged F1 is 76.3%. Recall is highest for frog (91.9%), automobile (91.7%), and truck (88.0%) and lowest for cat (48.5%) and bird (53.9%). The dominant off-diagonal mass is cat→dog (302 mean counts) and bird→frog (130), similar to the clean baseline but at much higher overall accuracy than the undefended attack run.
5. Discussion
Our experimental program (Section 4) evaluates four conditions on one fixed unbalanced tree—25 non-root aggregators, 100 hosted clients across four levels, Dirichlet Non-IID shards (), and hierarchical FedPer with MobileNetV2—using the methods in Section 3. Table 4 summarizes outcomes; the subsections below interpret each stage and how they connect to the defense design.
Vaccination calibration and tolerance mapping. Before any adversarial stress test, the 30-run vaccination mean-accuracy study (Section 4.2) quantified how benign node-level CIFAR-100 injection perturbs round-one global accuracy on our tree. The overall mean is 30.8%, with band means Low 34.7%, Medium 31.5%, and Hard 26.3%—a monotonic penalty as both vaccinated-node coverage and per-node injection rise. Compared with the clean baseline’s round-one accuracy of 32.1%, the Hard band costs an additional ≈8.4 percentage points relative to Low. The largest benign relative swing across these setups () directly anchors : deepest clients may tolerate up to early in training, shallow clients and the root only , with both endpoints tightening linearly to round 20 (Equations (4)–(6)). This couples auxiliary-data statistics to depth-aware monitoring rather than fixing a single global threshold.
Unbalanced topology and Non-IID heterogeneity. Hosting clients at every non-root level—not only at leaves—assigns local training to clients at intermediate aggregators, while those nodes FedPer-aggregate subtree backbones without training locally (Section 3.2). The clean baseline (Section 4.3) shows why per-client monitoring is necessary: hosted clients reach mean training accuracy 83.7% but validation accuracy only 44.6% under Dirichlet skew, while aggregator nodes validate near 50.3%—well below the global model’s 79.9%. Depth-interpolated tolerances in acknowledge that deeper branches legitimately exhibit larger metric swings than shallow coordinators whose updates propagate to the root.
Attack impact without defense. The free-attack scenario (Section 4.4) confirms that hierarchical FedPer averaging alone does not contain a mixed, severity-adaptive adversary. Despite fewer attack events (130 vs. 535 in the defended run), accuracy mirrors the clean curve through round 5, collapses to 21.2% under rounds 6–10 attacks, partially recovers during attack-free rounds 11–17 (peaking at 77.4% in round 18), then falls to 21.0% when poisoning resumes in rounds 18–20. K-fold validation (20.02%±0.42%) and macro F1 (10.5%) are indistinguishable from chance. Attacked aggregator nodes validate at mean 25.9% versus 46.0% for normal nodes—poisoned updates propagate branch-wide without filtering. This aligns with critiques that production FL threat models must assume sustained, heterogeneous attack schedules [34].
Effectiveness of trend-based quarantine. The defended scenario (Section 4.5) subjects the same tree to 535 attack events in every round (five attack types, 5–50 targeted clients per round, severity peaking at ≈80–100% in rounds 18–19) while applying the quarantine policy in Algorithm 1. Round-one calibration quarantines all 100 clients; subsequent rounds log 815 quarantine events across 19 post-calibration FedPer rounds. Per-client exclusion removes anomalous local updates before they accumulate: attacked clients validate at mean 26.2%, yet attacked nodes validate at 43.7%—comparable to normal nodes (42.5%)—showing that branch-level damage is contained even when individual shards are corrupted.
Root-level FedPer backbone rejection provides a second safety layer. Global aggregation was skipped in 5 rounds (10, 12, 14, 19, 20), leaving only 14 successful root updates—yet final test accuracy reaches 77.3% (76.46%±0.39% k-fold), only 2.6 percentage points below the 79.9% clean baseline (96.8% of clean accuracy). Macro F1 (76.3%) and per-class recall patterns (strong on automobile, frog, truck; weak on cat, bird) closely resemble the clean run (79.6% macro F1) rather than the collapsed free-attack confusion matrix. Training progress (Figure 16) shows stable convergence after calibration despite continuous attacks, and the attack timeline (Figure 18) correlates quarantine volume with attack bursts—including the round 18–19 severity spike.
Comparison with literature. Table 1 compares FLVaccin with representative CIFAR-10 poisoning defenses on accuracy under attack, topology, and data heterogeneity. Our defended k-fold accuracy (76.5%) is reported after 535 events from five attack types (label flip, backdoor, model poison, Byzantine, sign-flip) with per-event severity from 1–100%, sustained in every communication round on an unbalanced four-level tree with intra-level clients, Dirichlet Non-IID shards at , and FedPer personalization—a strictly harder setting than most prior rows.
Against flat methods with a single attack vector, FLVaccin outperforms RECESS [28] (60.4%, model poison) and FLAIR [33] (66.9%, untargeted) by large margins while facing a broader mixed threat. It is within ≈2 percentage points of BOD-hybrid [31] (78.2%, backdoor; IID and Non-IID reported) despite five simultaneous attack families and continuous poisoning. Sundar et al. [27] (82.9%) and FeRA [32] (86.1%) report higher accuracy, but under backdoor-only attacks on flat topologies with Non-IID splits not reported—conditions less demanding than our hierarchical FedPer setup.
Among hierarchical defenses, SHIELD [7] is the closest baseline (60.58% under poisoning; IID and milder Non-IID at ). FLVaccin exceeds that figure by ≈16 percentage points on k-fold accuracy while using a stricter label skew (), an explicit unbalanced tree with clients at multiple levels, and trend-based per-client quarantine plus root backbone rejection rather than secure aggregation alone. Direct ranking is imperfect—attack models, personalization protocols, and evaluation setups differ—but Table 1 shows that tree-aware monitoring stays within 2.6 percentage points of our clean baseline under a substantially richer adversary than most compared methods were tested against.
6. Conclusions
We presented FLVaccin, a hierarchical personalized federated learning framework built on an unbalanced tree in which every non-root node hosts local CIFAR-10 clients (which perform all local training) and FedPer-aggregates shared MobileNetV2 features from its subtree—to our knowledge, the first hierarchical FL design that does not confine all clients to the deepest level. The system combines two complementary defenses described in Section 3: (i) node-level CIFAR-100 vaccination, calibrated through a benign mean-accuracy study that guides depth-dependent tolerances, and (ii) depth- and round-adaptive per-client quarantine with root-level backbone rejection.
Section 4 shows that hierarchical FedPer alone is insufficient under mixed poisoning, whereas vaccination-calibrated quarantine and root rejection keep global performance close to the clean baseline despite a substantially heavier attack schedule. These results demonstrate that tree-aware, vaccination-informed trend monitoring provides a practical, privacy-preserving defense layer for hierarchical FedPer without centralizing raw data.
All experiments reported in this paper, together with the full source code, are available in the public Git repository at https://github.com/tudordavidz/FLVaccin.
Author Contributions
Conceptualization, T.-M.D.; methodology, T.-M.D.; software, T.-M.D.; validation, T.-M.D.; formal analysis, T.-M.D.; investigation, T.-M.D.; resources, T.-M.D. and M.U.; data curation, T.-M.D.; writing—original draft preparation, T.-M.D.; writing—review and editing, T.-M.D. and M.U.; visualization, T.-M.D.; supervision, M.U.; project administration, T.-M.D. and M.U. All authors have read and agreed to the published version of the manuscript.
Funding
This research received no external funding.
Institutional Review Board Statement
Not applicable.
Informed Consent Statement
Not applicable.
Data Availability Statement
CIFAR-10 and CIFAR-100 are publicly available from the torchvision datasets repository. The FLVaccin framework, experimental configurations, and result artifacts are available at https://github.com/tudordavidz/FLVaccin.
Conflicts of Interest
The authors declare no conflicts of interest.
Acknowledgments
The authors thank Politehnica University of Timisoara for institutional support.
Abbreviations
The following abbreviations are used in this manuscript:
| FL | Federated Learning |
| FedPer | Personalized Federated Learning |
| Non-IID | Non-Independent and Identically Distributed |
| CIFAR | Canadian Institute For Advanced Research |
References
- McMahan, B.; Moore, E.; Ramage, D.; Hampson, S.; y Arcas, B.A. Communication-efficient learning of deep networks from decentralized data. In Artificial intelligence and statistics; pp. 1273–1282. 2017.
- Lyu, L.; Yu, H.; Yang, Q. Threats to federated learning: A survey. arXiv preprint arXiv:2003.02133 2020.
- Bagdasaryan, E.; Veit, A.; Hua, Y.; Estrin, D.; Shmatikov, V. How to backdoor federated learning. In International conference on artificial intelligence and statistics; pp. 2938–2948. 2020.
- Blanchard, P.; El Mhamdi, E.M.; Guerraoui, R.; Stainer, J. Machine learning with adversaries: Byzantine tolerant gradient descent. Advances in neural information processing systems 2017, 30.
- Yin, D.; Chen, Y.; Kannan, R.; Bartlett, P. Byzantine-robust distributed learning: Towards optimal statistical rates. In International conference on machine learning; pp. 5650–5659. 2018.
- Liu, L.; et al. Edge-cloud computing for federated learning: A survey. IEEE Internet of Things Journal 2020.
- Siriwardhana, Y.; Porambage, P.; Liyanage, M.; Marchal, S.; Ylianttila, M. SHIELD: Secure aggregation against poisoning in hierarchical federated learning. IEEE Transactions on Dependable and Secure Computing 2025, 22(2), 1024–1040. [CrossRef]
- Collins, L.; Hassani, H.; Mokhtari, A.; Shakkottai, S. Exploiting shared representations for personalized federated learning. In International conference on machine learning; pp. 2089–2099. 2021.
- Xie, C.; Koyejo, O.; Gupta, I. Fall of empires: Breaking byzantine-tolerant sgd by inner product manipulation. In Uncertainty in artificial intelligence; pp. 261–270. 2020.
- Fang, M.; Cao, X.; Jia, J.; Gong, N. Local model poisoning attacks to Byzantine-Robust federated learning. In 29th USENIX security symposium (USENIX Security 20); pp. 1605–1622. 2020.
- Wang, H.; Sreenivasan, K.; Rajput, S.; Vishwakarma, H.; Agarwal, S.; Sohn, J.y.; Lee, K.; Papailiopoulos, D. Attack of the tails: Yes, you really can backdoor federated learning. Advances in neural information processing systems 2020, 33, 16070–16084.
- Biggio, B.; Nelson, B.; Laskov, P. Poisoning attacks against support vector machines. arXiv preprint arXiv:1206.6389 2012.
- Tolpegin, V.; Truex, S.; Gursoy, M.E.; Liu, L. Data poisoning attacks against federated learning systems. In European symposium on research in computer security; pp. 480–501. 2020.
- Xie, C.; Huang, K.; Chen, P.Y.; Li, B. Dba: Distributed backdoor attacks against federated learning. In International conference on learning representations; 2019.
- Bhagoji, A.N.; Chakraborty, S.; Mittal, P.; Calo, S. Analyzing federated learning through an adversarial lens. In International conference on machine learning; pp. 634–643. 2019.
- Baruch, G.; Baruch, M.; Goldberg, Y. A little is enough: Circumventing defenses for distributed learning. Advances in Neural Information Processing Systems 2019, 32. [CrossRef]
- Guerraoui, R.; Rouault, S.; et al. The hidden vulnerability of distributed learning in byzantium. In International conference on machine learning; pp. 3521–3530. 2018.
- Pillutla, K.; Kakade, S.M.; Harchaoui, Z. Robust aggregation for federated learning. IEEE Transactions on Signal Processing 2022, 70, 1142–1154. [CrossRef]
- Cao, X.; Fang, M.; Liu, J.; Gong, N.Z. Fltrust: Byzantine-robust federated learning via trust bootstrapping. arXiv preprint arXiv:2012.13995 2020.
- Andreina, S.; Marson, G.A.; Möllering, H.; Karame, G. Baffle: Backdoor detection via feedback-based federated learning. In 2021 IEEE 41st International Conference on Distributed Computing Systems (ICDCS); pp. 852–863. 2021.
- Awan, S.; Luo, B.; Li, F. Contra: Defending against poisoning attacks in federated learning. In European symposium on research in computer security; pp. 455–475. 2021.
- Shen, S.; Tople, S.; Saxena, P. Auror: Defending against poisoning attacks in collaborative deep learning systems. In Proceedings of the 32nd annual conference on computer security applications; pp. 508–519. 2016.
- Tan, J.; Liang, Y.C.; Luong, N.C.; Niyato, D. Toward smart security enhancement of federated learning networks. IEEE Network 2020, 35(1), 340–347. [CrossRef]
- Kang, J.; Xiong, Z.; Niyato, D.; Zou, Y.; Zhang, Y.; Guizani, M. Reliable federated learning for mobile networks. IEEE Wireless Communications 2020, 27(2), 72–80. [CrossRef]
- Uprety, A.; Rawat, D.B. Mitigating poisoning attack in federated learning. In 2021 IEEE symposium series on computational intelligence (SSCI); pp. 01–07. 2021.
- Cao, X.; Zhang, Z.; Jia, J.; Gong, N.Z. Flcert: Provably secure federated learning against poisoning attacks. IEEE Transactions on Information Forensics and Security 2022, 17, 3691–3705. [CrossRef]
- Sundar, S.; et al. Vaccination-based defense against poisoning attacks in federated learning. In IEEE International Conference; 2025.
- Yan, H.; et al. RECESS vaccine for federated learning. In Advances in Neural Information Processing Systems; 2023. arXiv:2310.05431.
- Xia, G.; Chen, J.; Yu, C.; Ma, J. Poisoning attacks in federated learning: A survey. Ieee Access 2023, 11, 10708–10722. [CrossRef]
- Kairouz, P.; McMahan, H.B.; Avent, B.; Bellet, A.; Bennis, M.; et al. Advances and open problems in federated learning. Foundations and Trends® in Machine Learning 2021. [CrossRef]
- Wilkerson, J.; et al. BOD-hybrid: Backdoor defense for federated learning. In International Conference on Cyber Security and Technology; 2025.
- Authors, FeRA: Representative-attention defense against distributed backdoor attacks. arXiv preprint arXiv:2505.10297 2025.
- Sharma, A.; et al. FLAIR: Federated learning anomaly and intrusion resilience. In Workshop on Federated Learning; 2023.
- Shejwalkar, V.; Houmansadr, A.; Kairouz, P.; Ramage, D. Back to the drawing board: A critical evaluation of poisoning attacks on production federated learning. In 2022 IEEE symposium on security and privacy (SP); pp. 1354–1371. 2022.
Figure 1.
Graphical abstract of FLVaccin. Center: unbalanced tree—root (green); aggregators (grey) host clients and FedPer-aggregate upward; red: malicious updates. Top left: Personalized FL, shared backbone vs. private head. Bottom mid: node-level CIFAR-100 vaccination (30-run calibration). Bottom right: depth-aware per-client quarantine and root backbone rejection.
Figure 1.
Graphical abstract of FLVaccin. Center: unbalanced tree—root (green); aggregators (grey) host clients and FedPer-aggregate upward; red: malicious updates. Top left: Personalized FL, shared backbone vs. private head. Bottom mid: node-level CIFAR-100 vaccination (30-run calibration). Bottom right: depth-aware per-client quarantine and root backbone rejection.
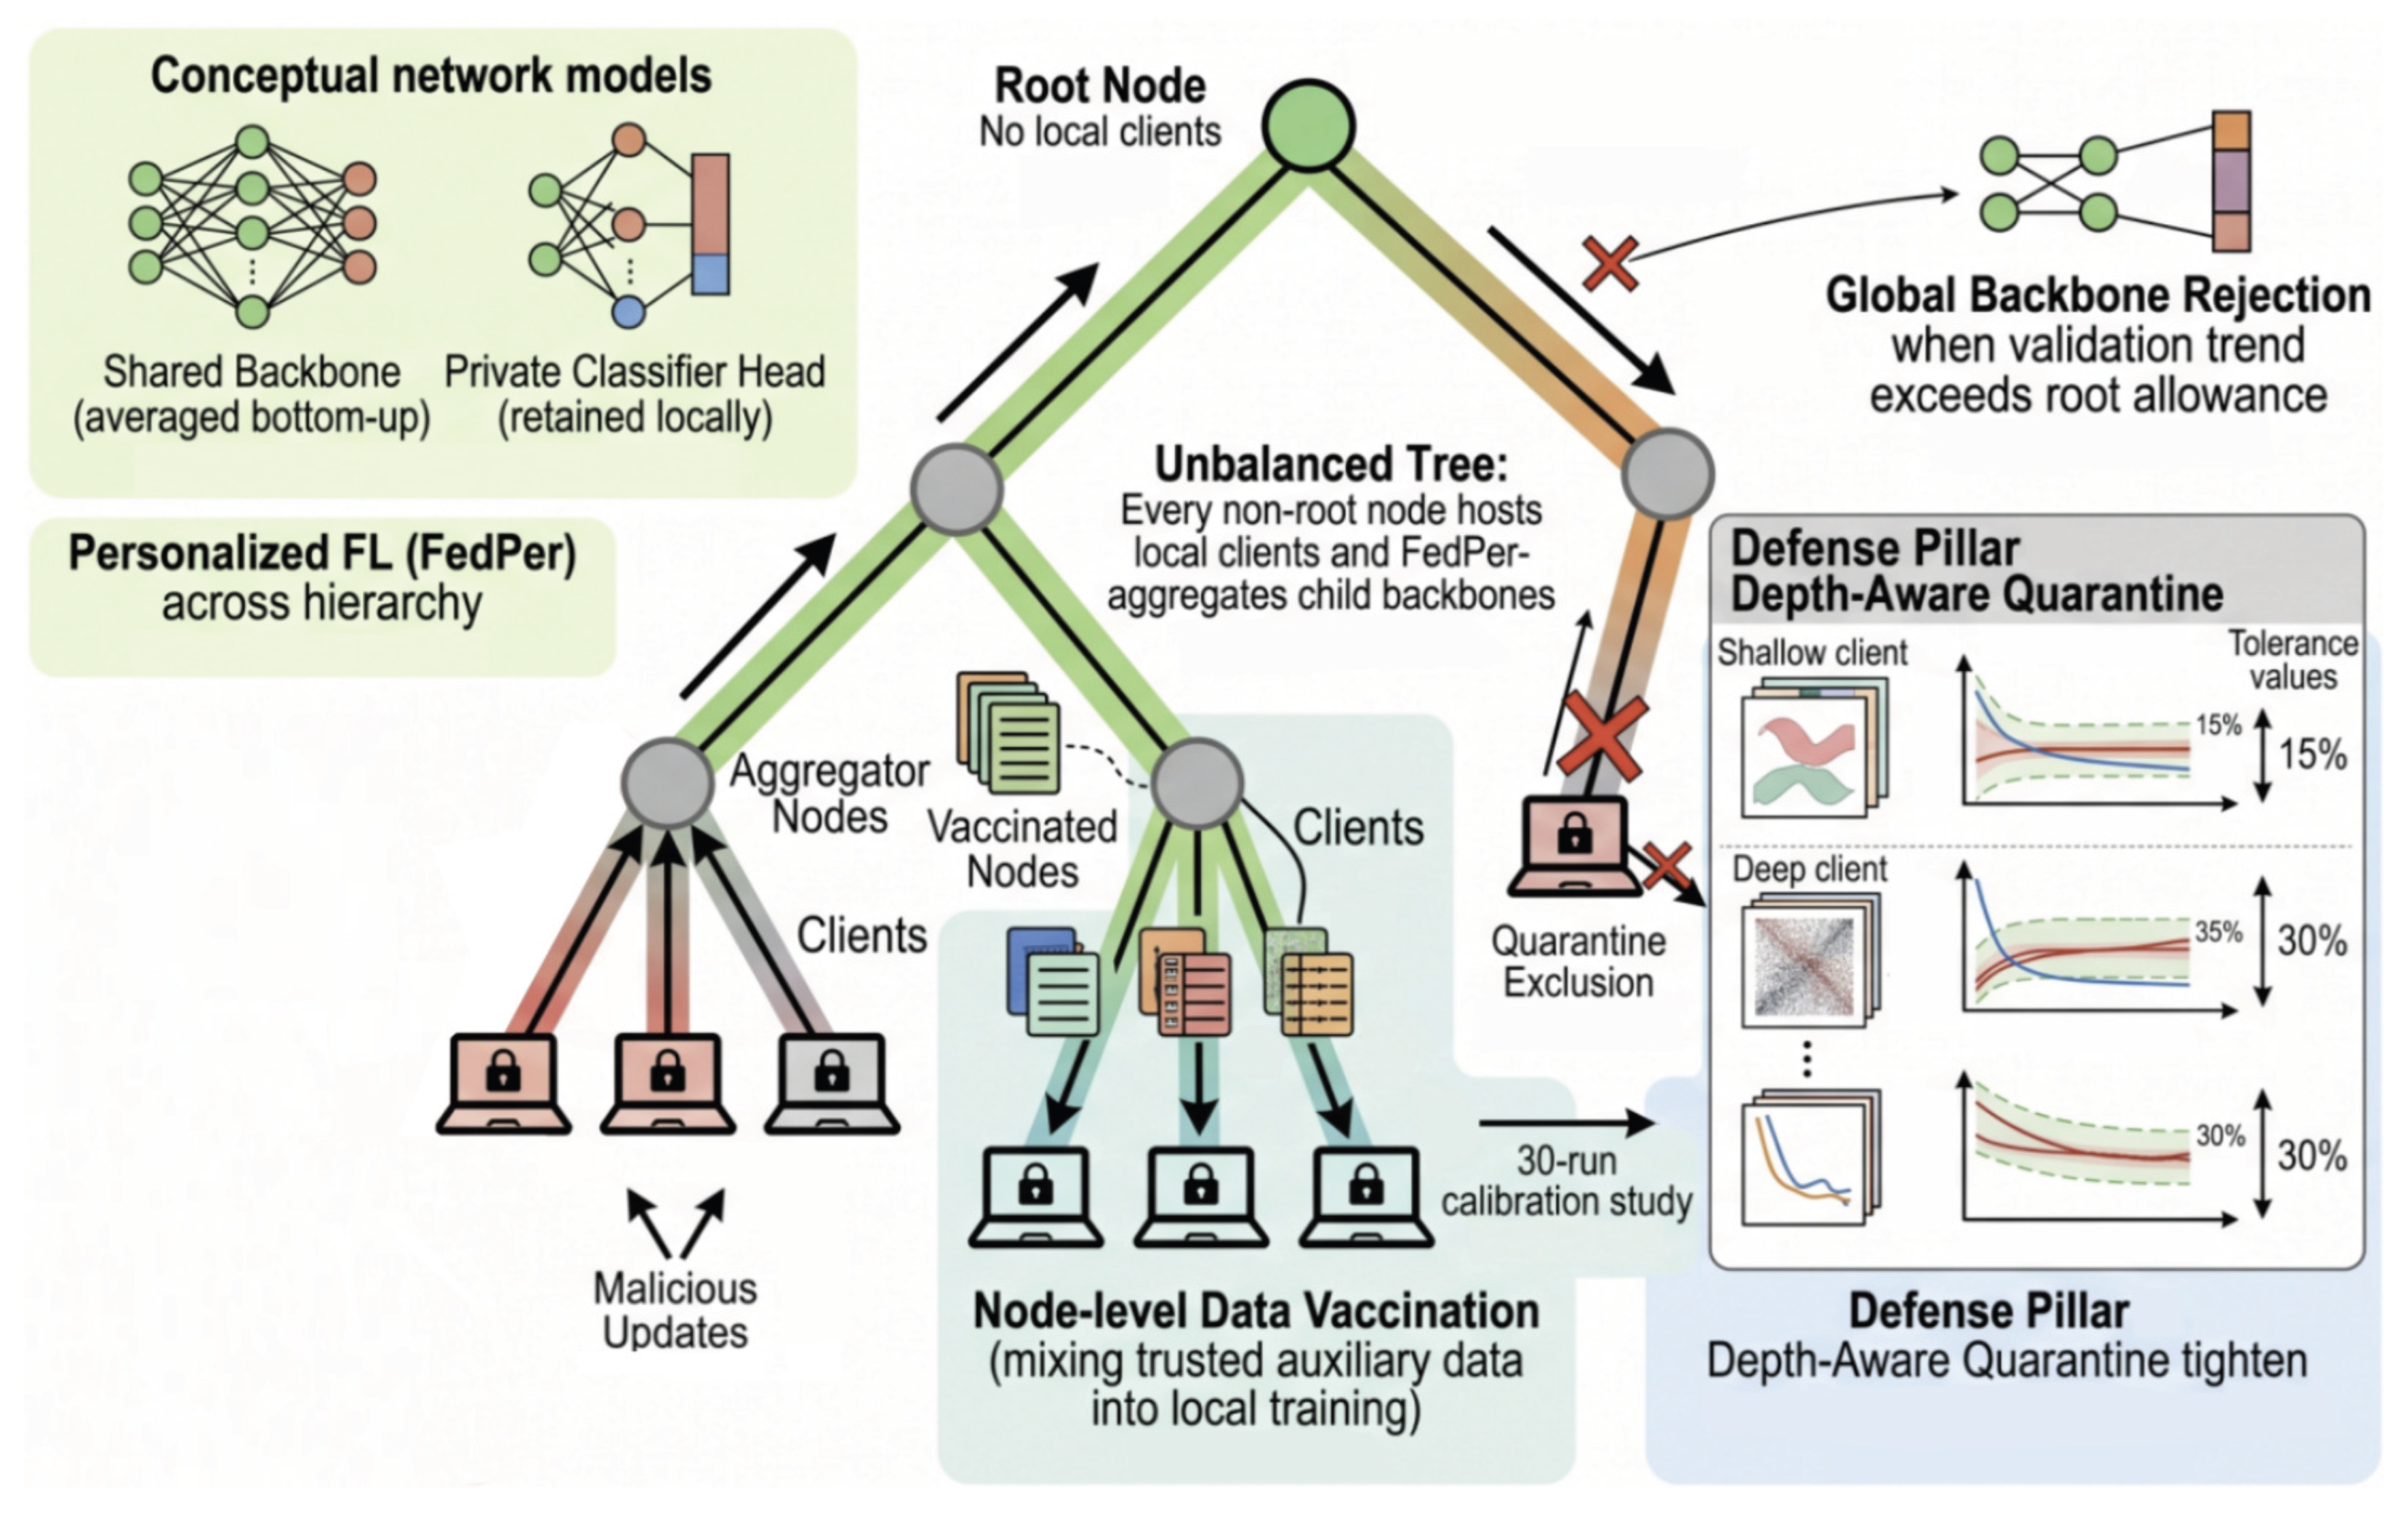
Figure 2.
FLVaccin software architecture. The orchestrator loads config, data_loader, tree_structure, and model, then runs client + personalization. Optional dashed paths: vaccination into clients and attack methods on clients. Solid paths: client metrics to defense, filtered updates to aggregation, then evaluation, with feedback to the orchestrator.
Figure 2.
FLVaccin software architecture. The orchestrator loads config, data_loader, tree_structure, and model, then runs client + personalization. Optional dashed paths: vaccination into clients and attack methods on clients. Solid paths: client metrics to defense, filtered updates to aggregation, then evaluation, with feedback to the orchestrator.
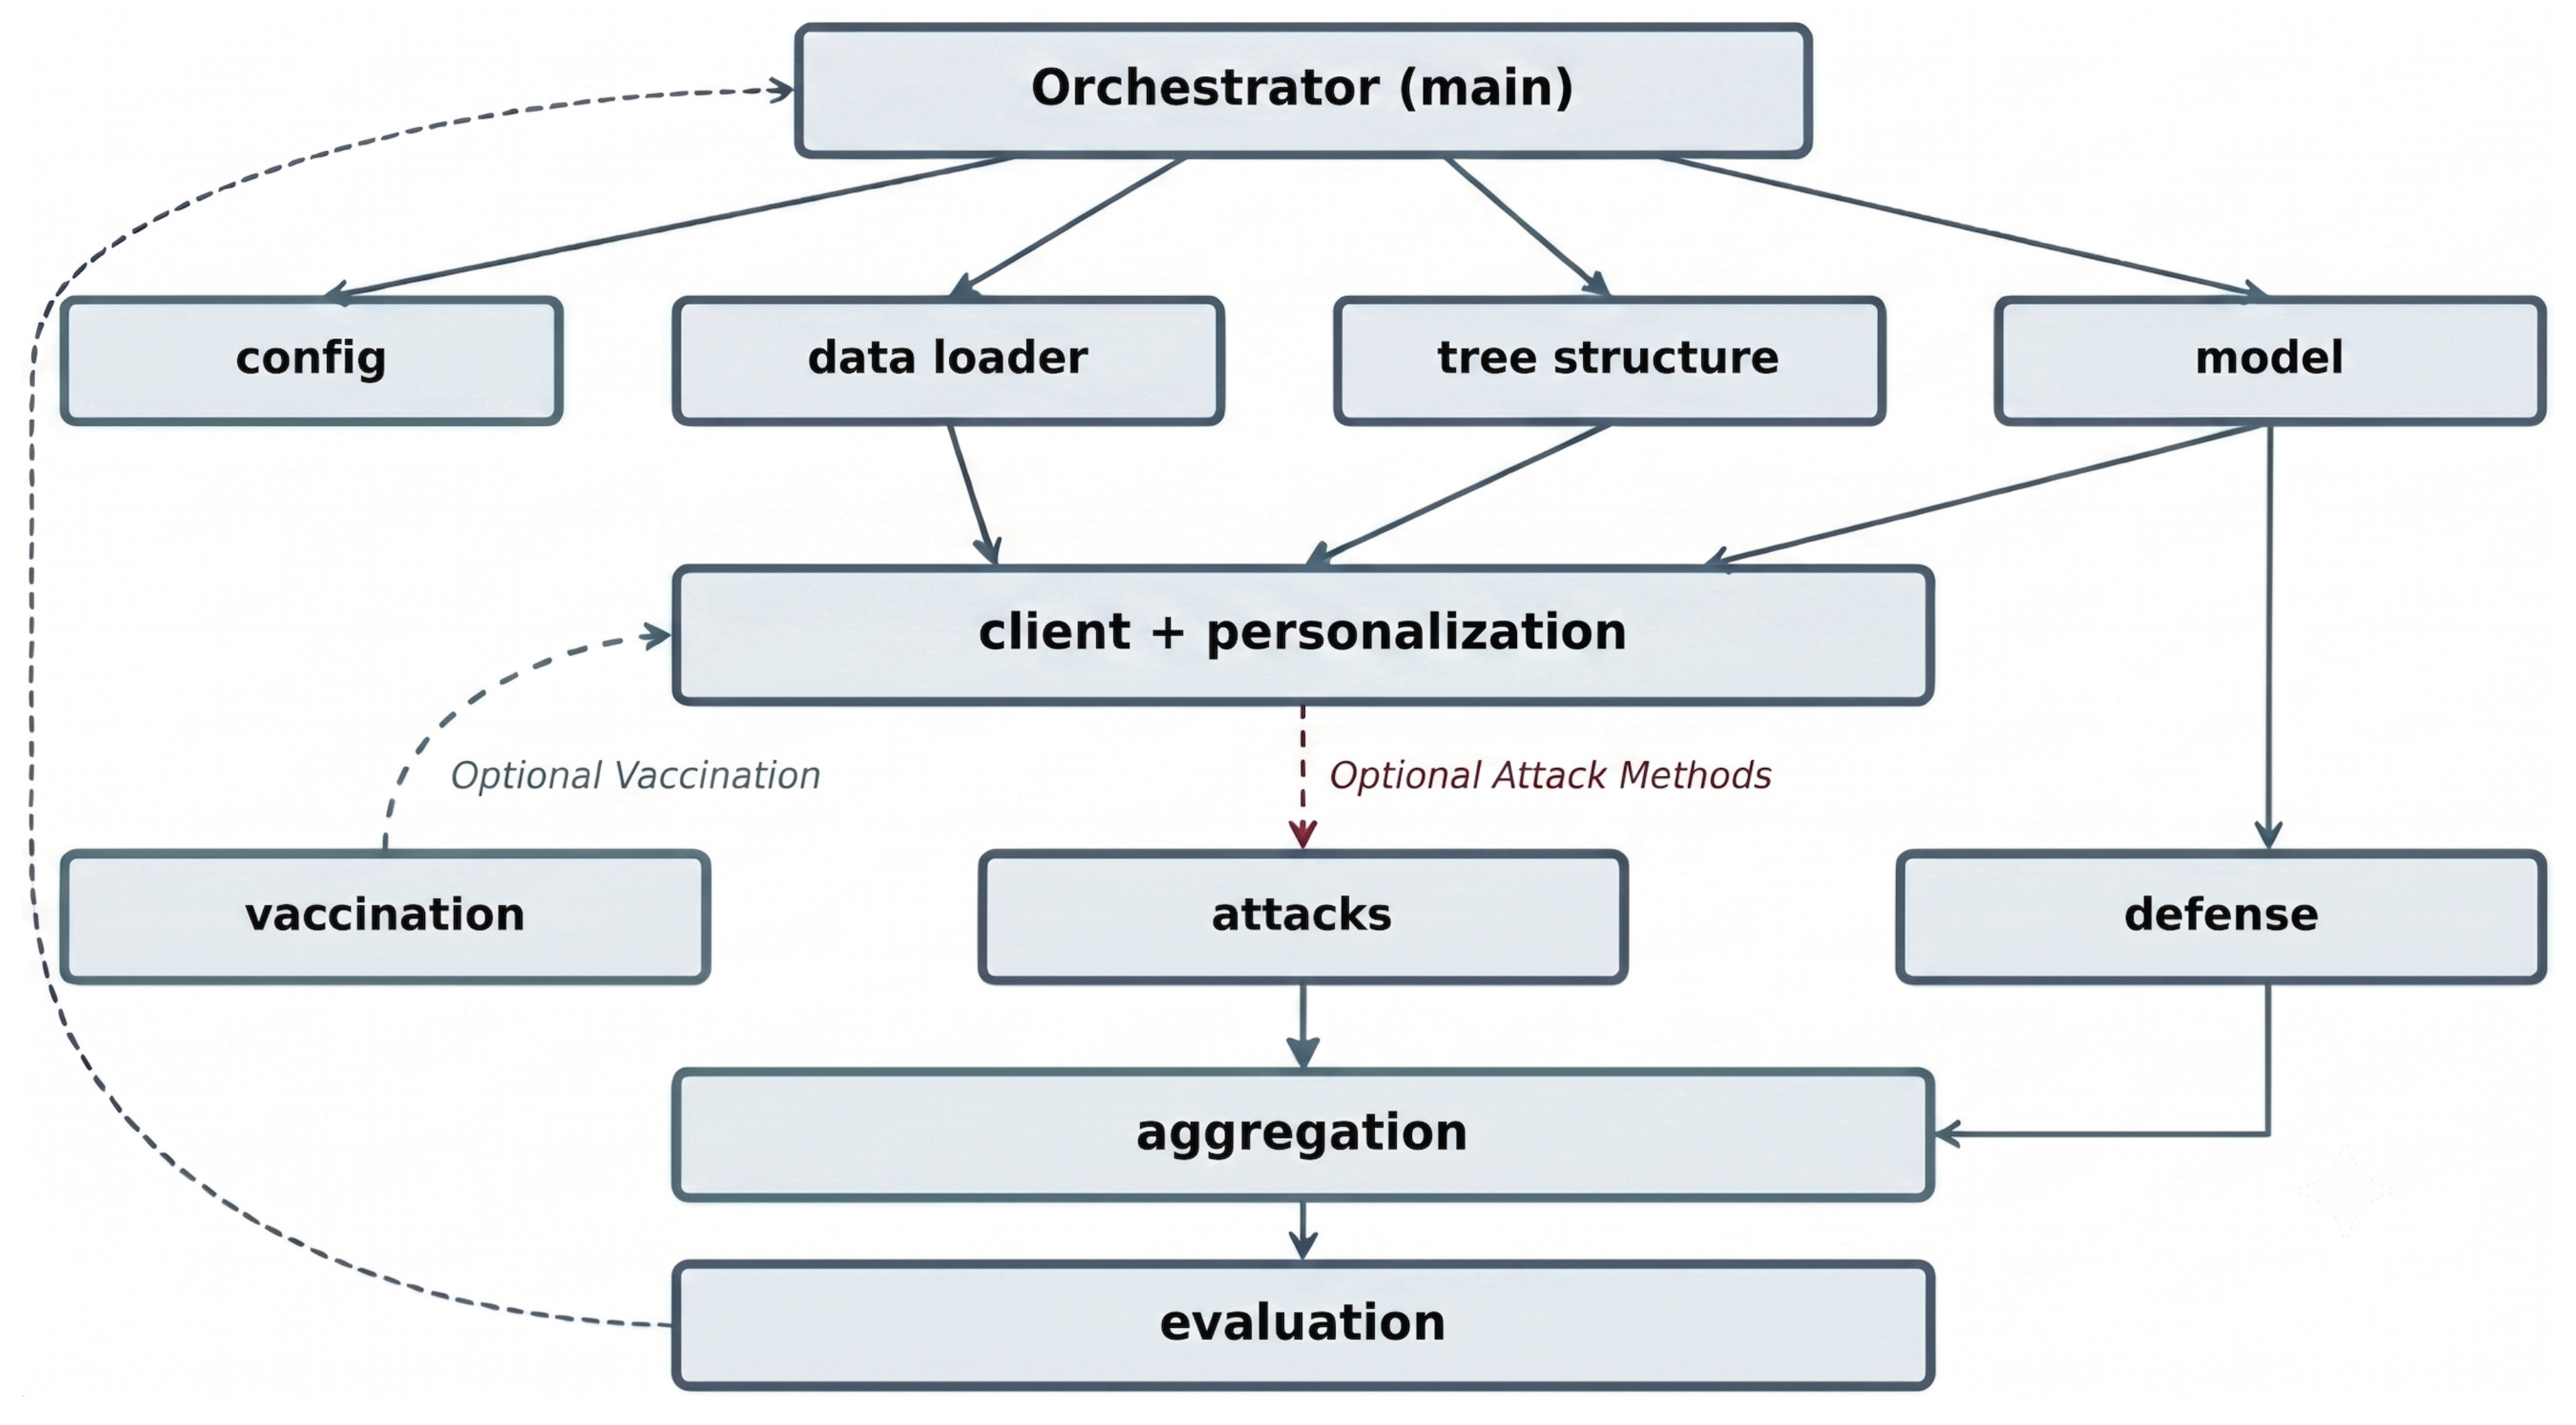
Figure 3.
Schematic unbalanced hierarchical FL tree under FedPer. Green bars: levels . Black circle: root (no local clients). Grey circles: non-root aggregators that FedPer-aggregate child shared backbones; each may host 0–N local clients (right inset). Lines: federation flow between levels and from node to clients.
Figure 3.
Schematic unbalanced hierarchical FL tree under FedPer. Green bars: levels . Black circle: root (no local clients). Grey circles: non-root aggregators that FedPer-aggregate child shared backbones; each may host 0–N local clients (right inset). Lines: federation flow between levels and from node to clients.
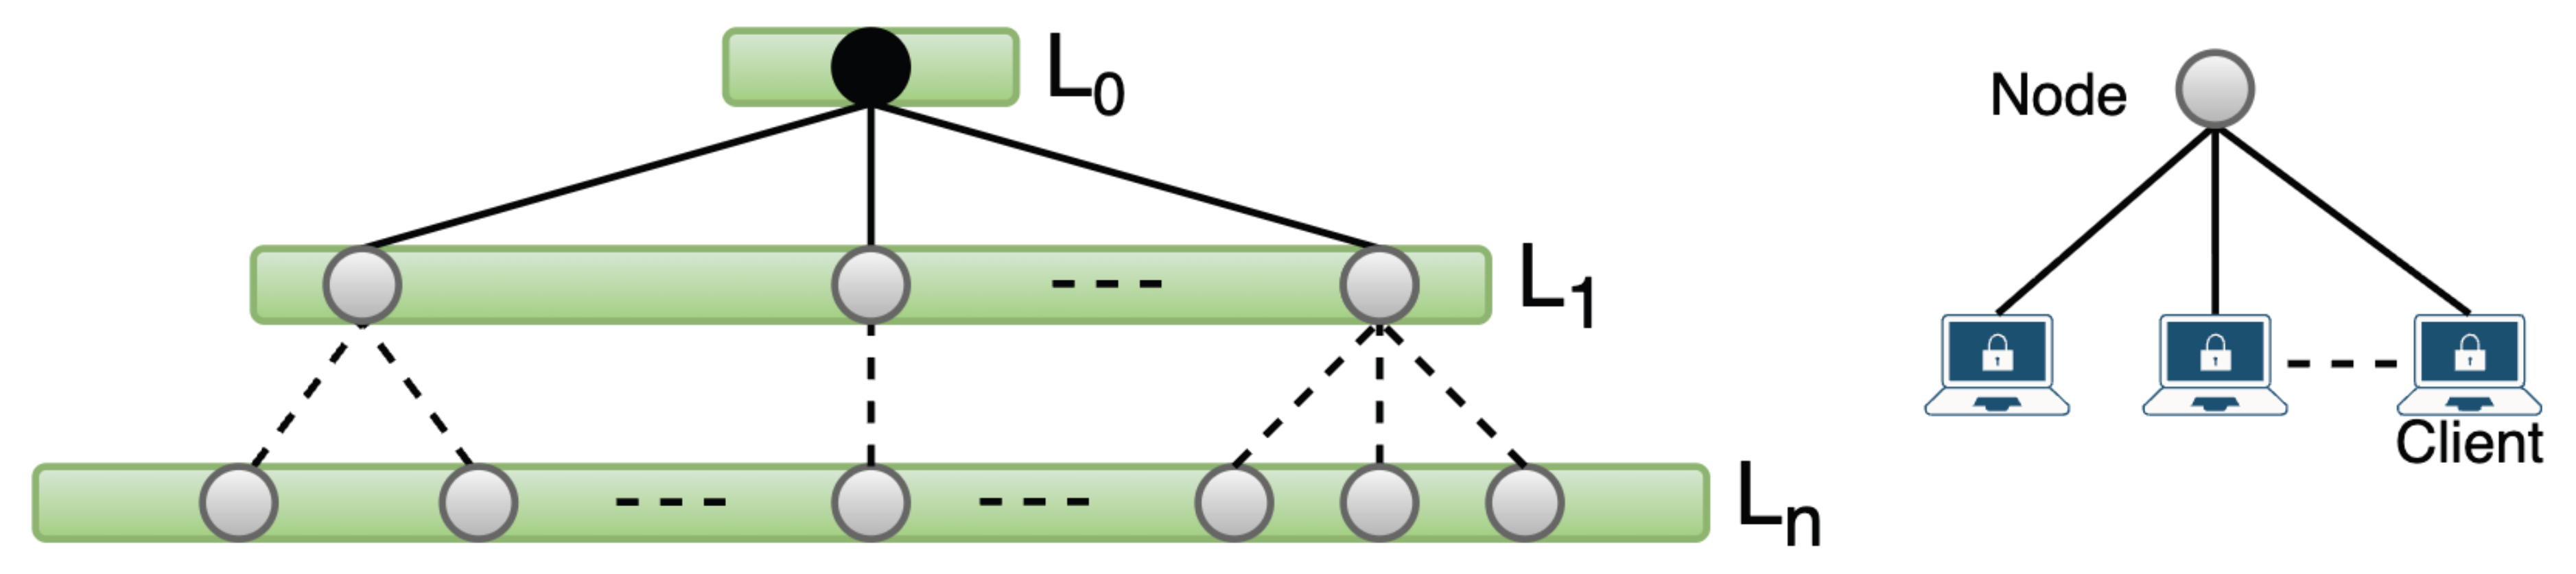
Figure 5.
Round-one global accuracy across 30 vaccination calibration runs on the fixed tree (one federated round per run). Bars are grouped by vaccination band—Low, Medium, and Hard (10–25%, 25–50%, and 50–80% node coverage and per-node injection, respectively)—with ten runs per band. Dashed horizontal lines: tier means (Low 34.7%, Medium 31.5%, Hard 26.3%); solid navy line: overall mean 30.8%. Per-run values are printed inside each bar.
Figure 5.
Round-one global accuracy across 30 vaccination calibration runs on the fixed tree (one federated round per run). Bars are grouped by vaccination band—Low, Medium, and Hard (10–25%, 25–50%, and 50–80% node coverage and per-node injection, respectively)—with ten runs per band. Dashed horizontal lines: tier means (Low 34.7%, Medium 31.5%, Hard 26.3%); solid navy line: overall mean 30.8%. Per-run values are printed inside each bar.
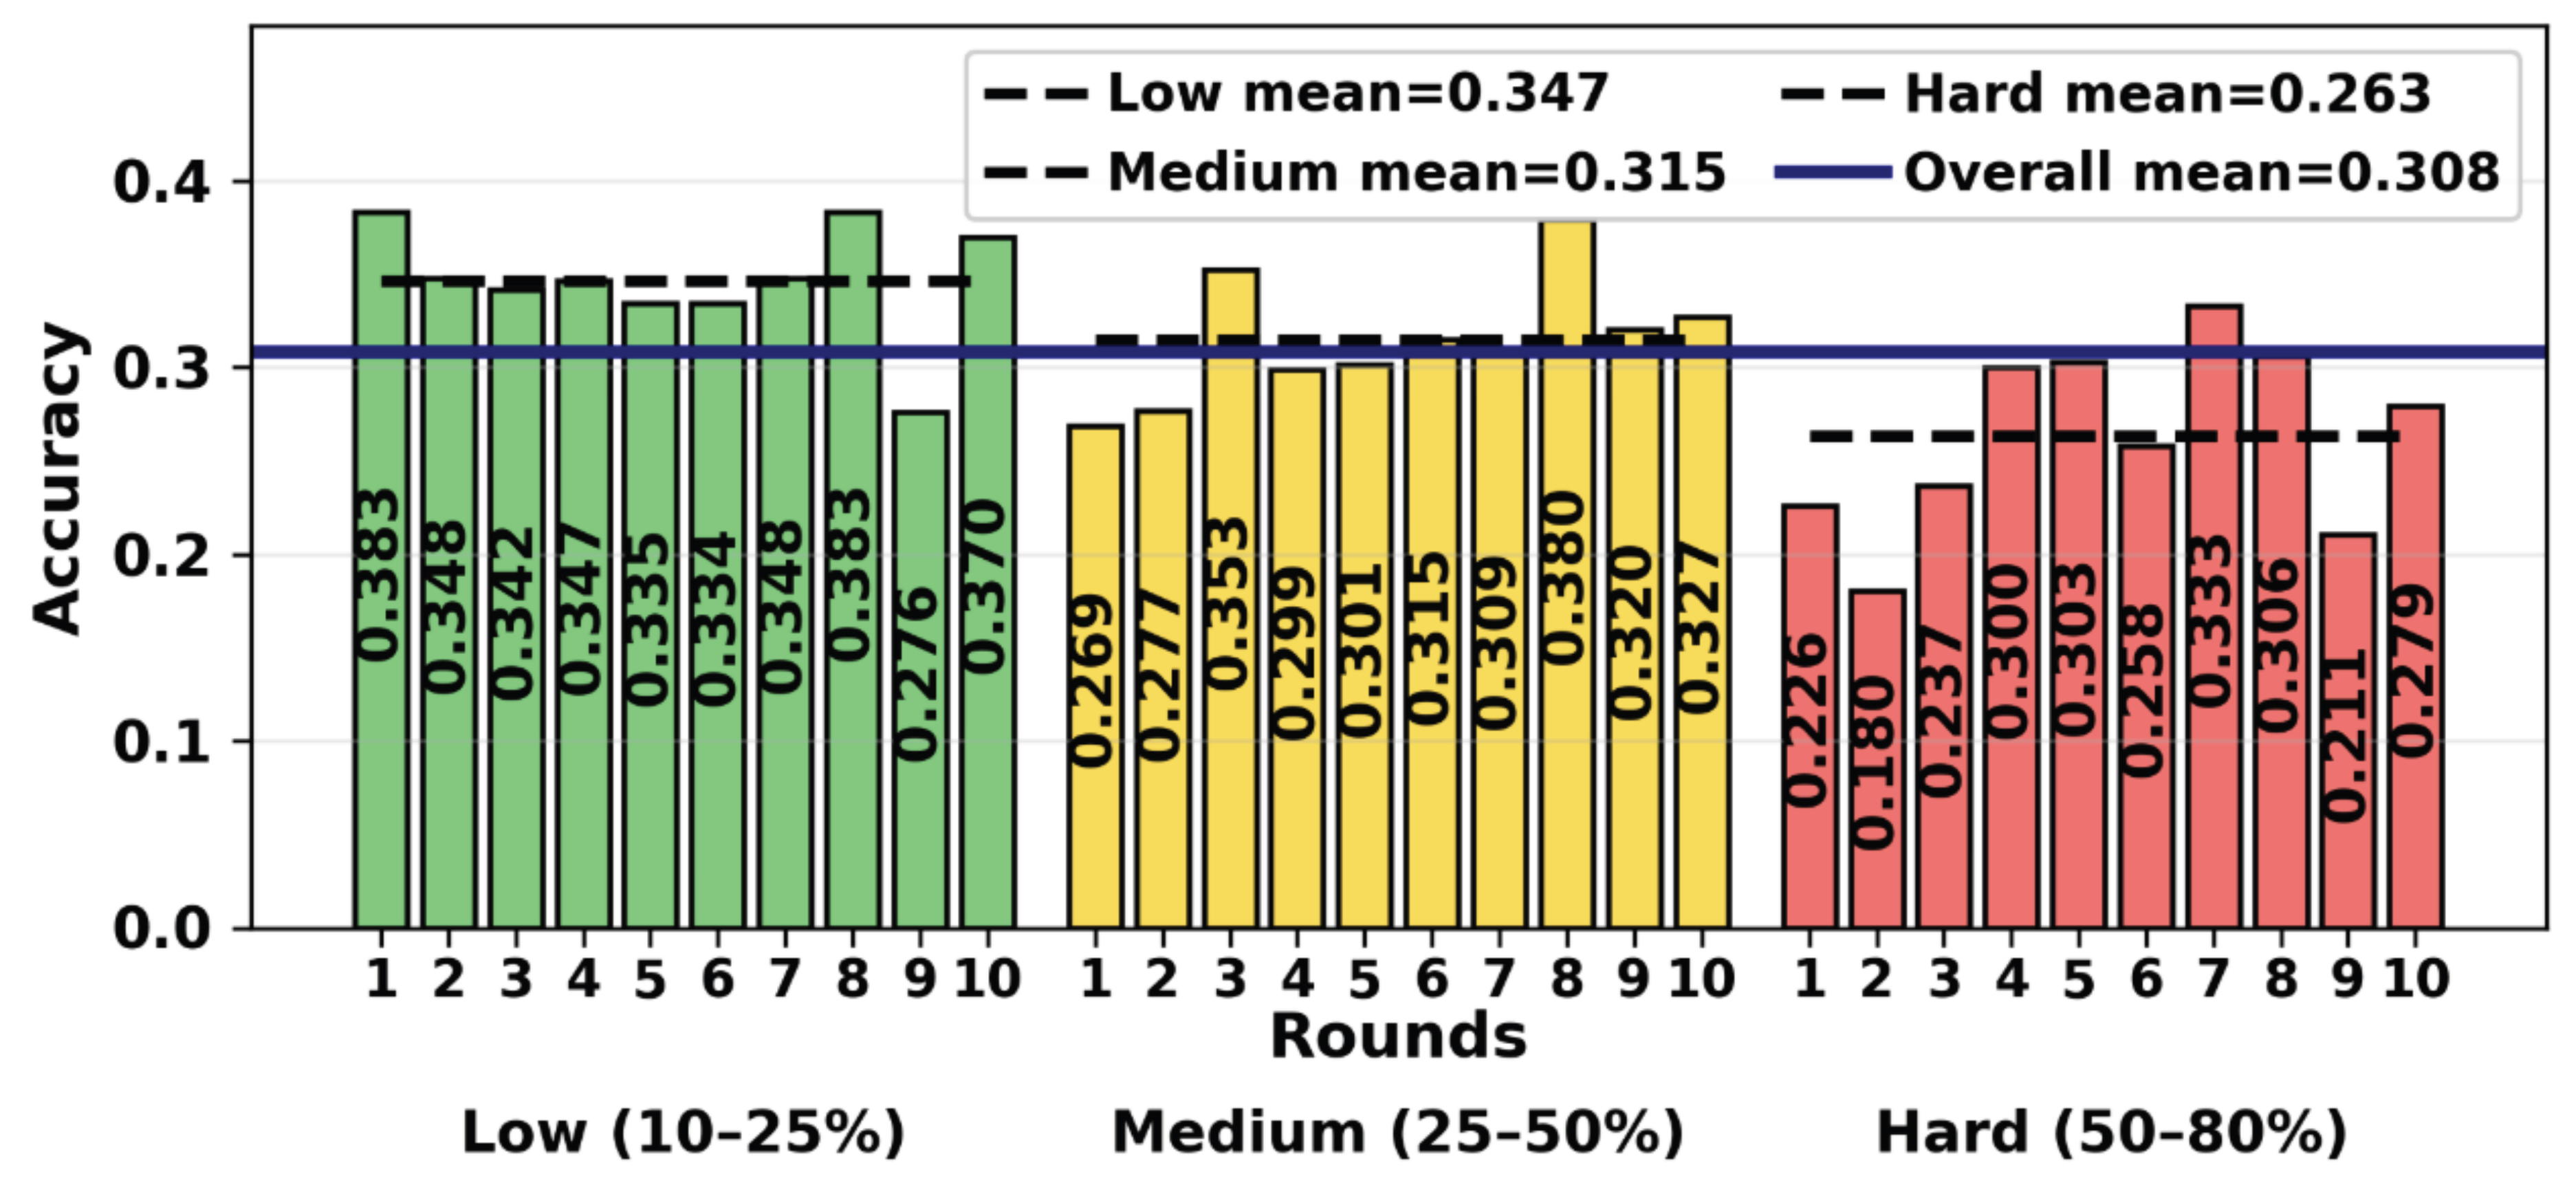
Figure 6.
Vaccination configuration sampled in each calibration run. Cell color: mean CIFAR-100 injection percentage across vaccinated nodes (scale 0–80%). Cell label (e.g., “12C”): number of hosted clients at vaccinated nodes for that run. Runs are grouped by the same Low, Medium, and Hard bands; darker cells in the Hard band reflect both broader node coverage and higher per-node injection rates.
Figure 6.
Vaccination configuration sampled in each calibration run. Cell color: mean CIFAR-100 injection percentage across vaccinated nodes (scale 0–80%). Cell label (e.g., “12C”): number of hosted clients at vaccinated nodes for that run. Runs are grouped by the same Low, Medium, and Hard bands; darker cells in the Hard band reflect both broader node coverage and higher per-node injection rates.
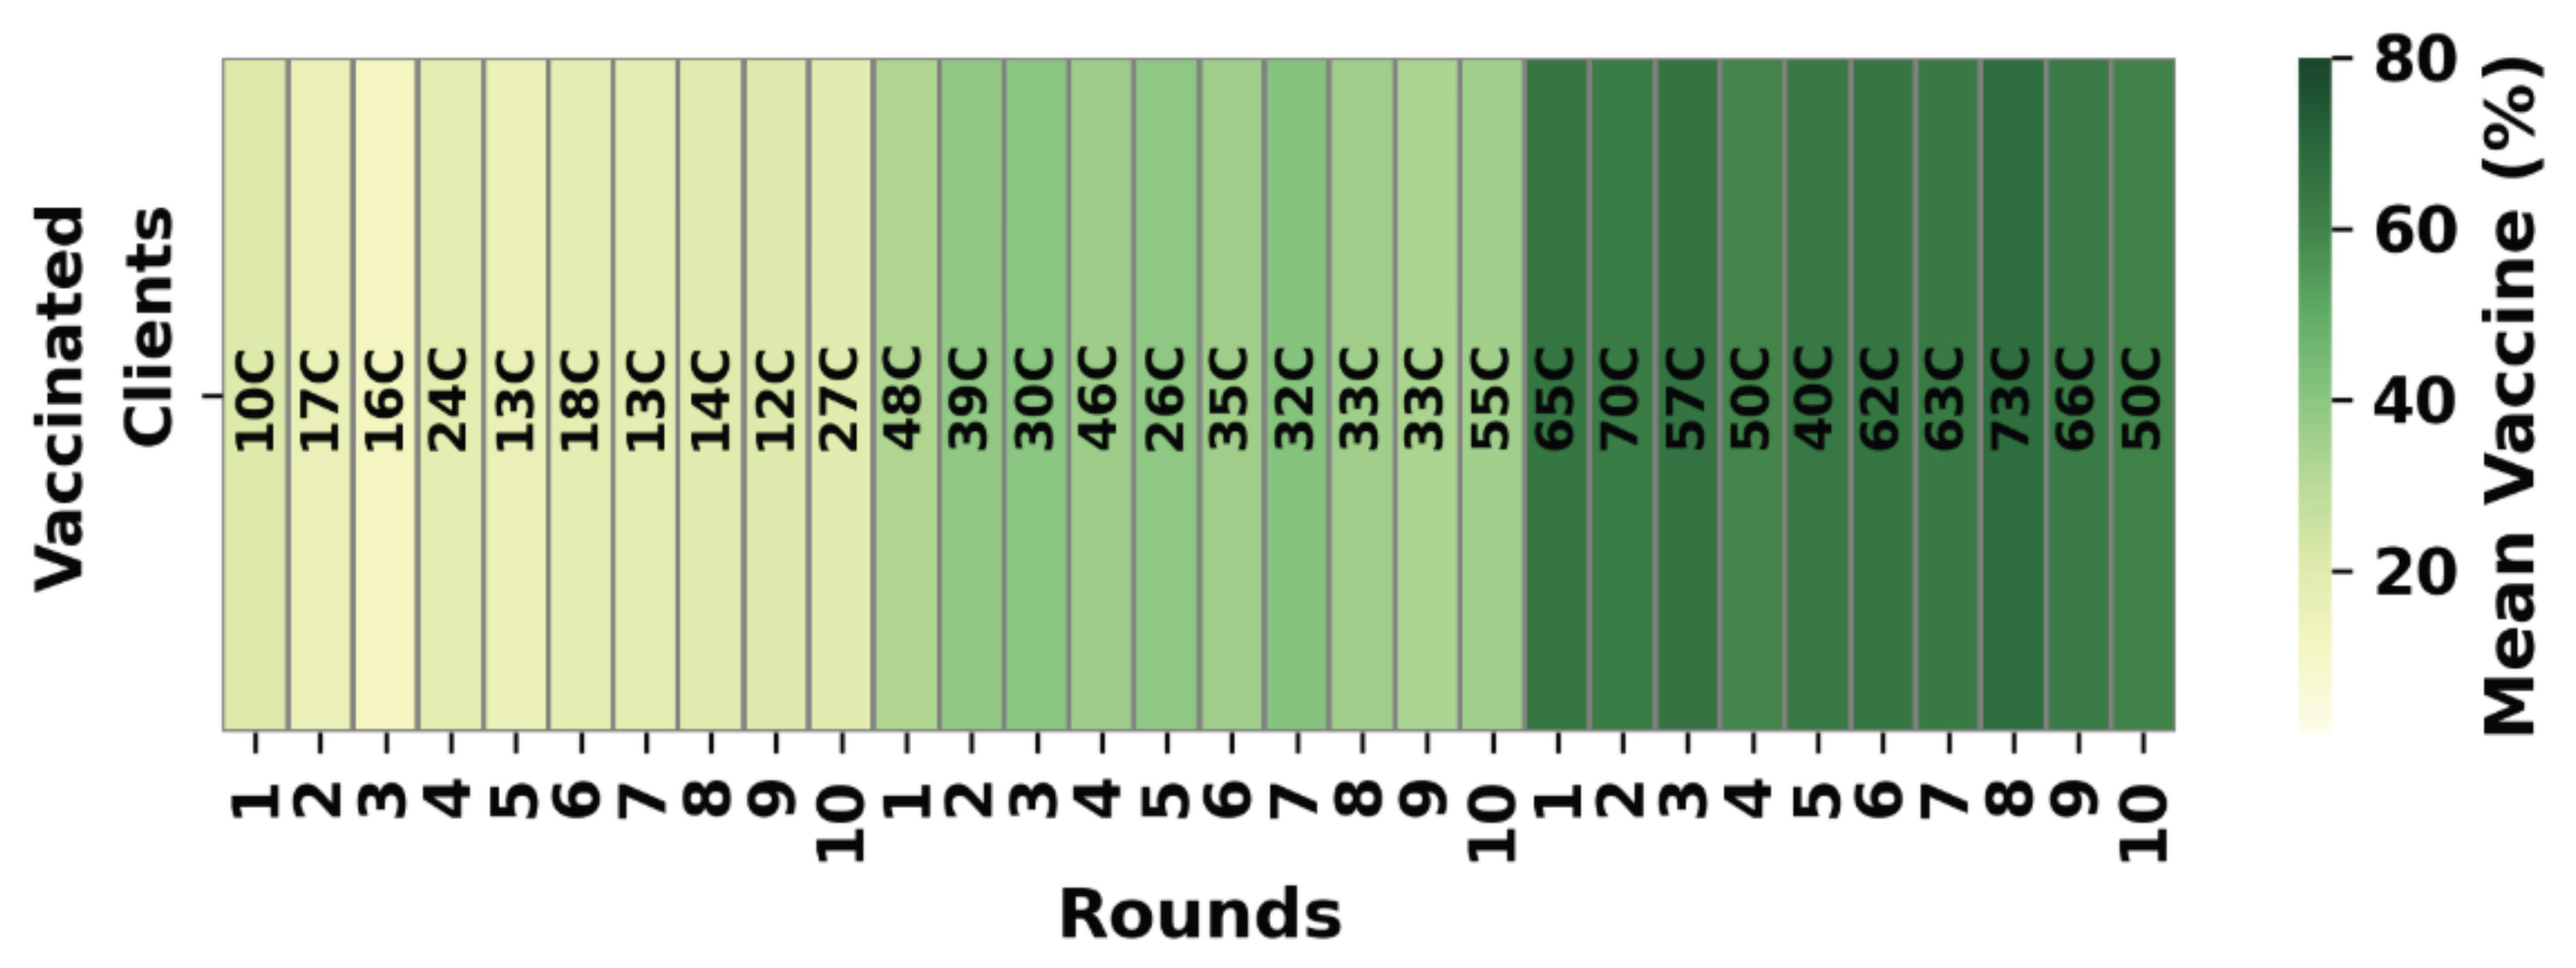
Figure 7.
Global validation accuracy and loss during clean 20-round hierarchical FedPer training on the fixed tree. Dual y-axes: accuracy (left, blue) and cross-entropy loss (right, red) evaluated on the full CIFAR-10 test set at the root after each communication round.
Figure 7.
Global validation accuracy and loss during clean 20-round hierarchical FedPer training on the fixed tree. Dual y-axes: accuracy (left, blue) and cross-entropy loss (right, red) evaluated on the full CIFAR-10 test set at the root after each communication round.
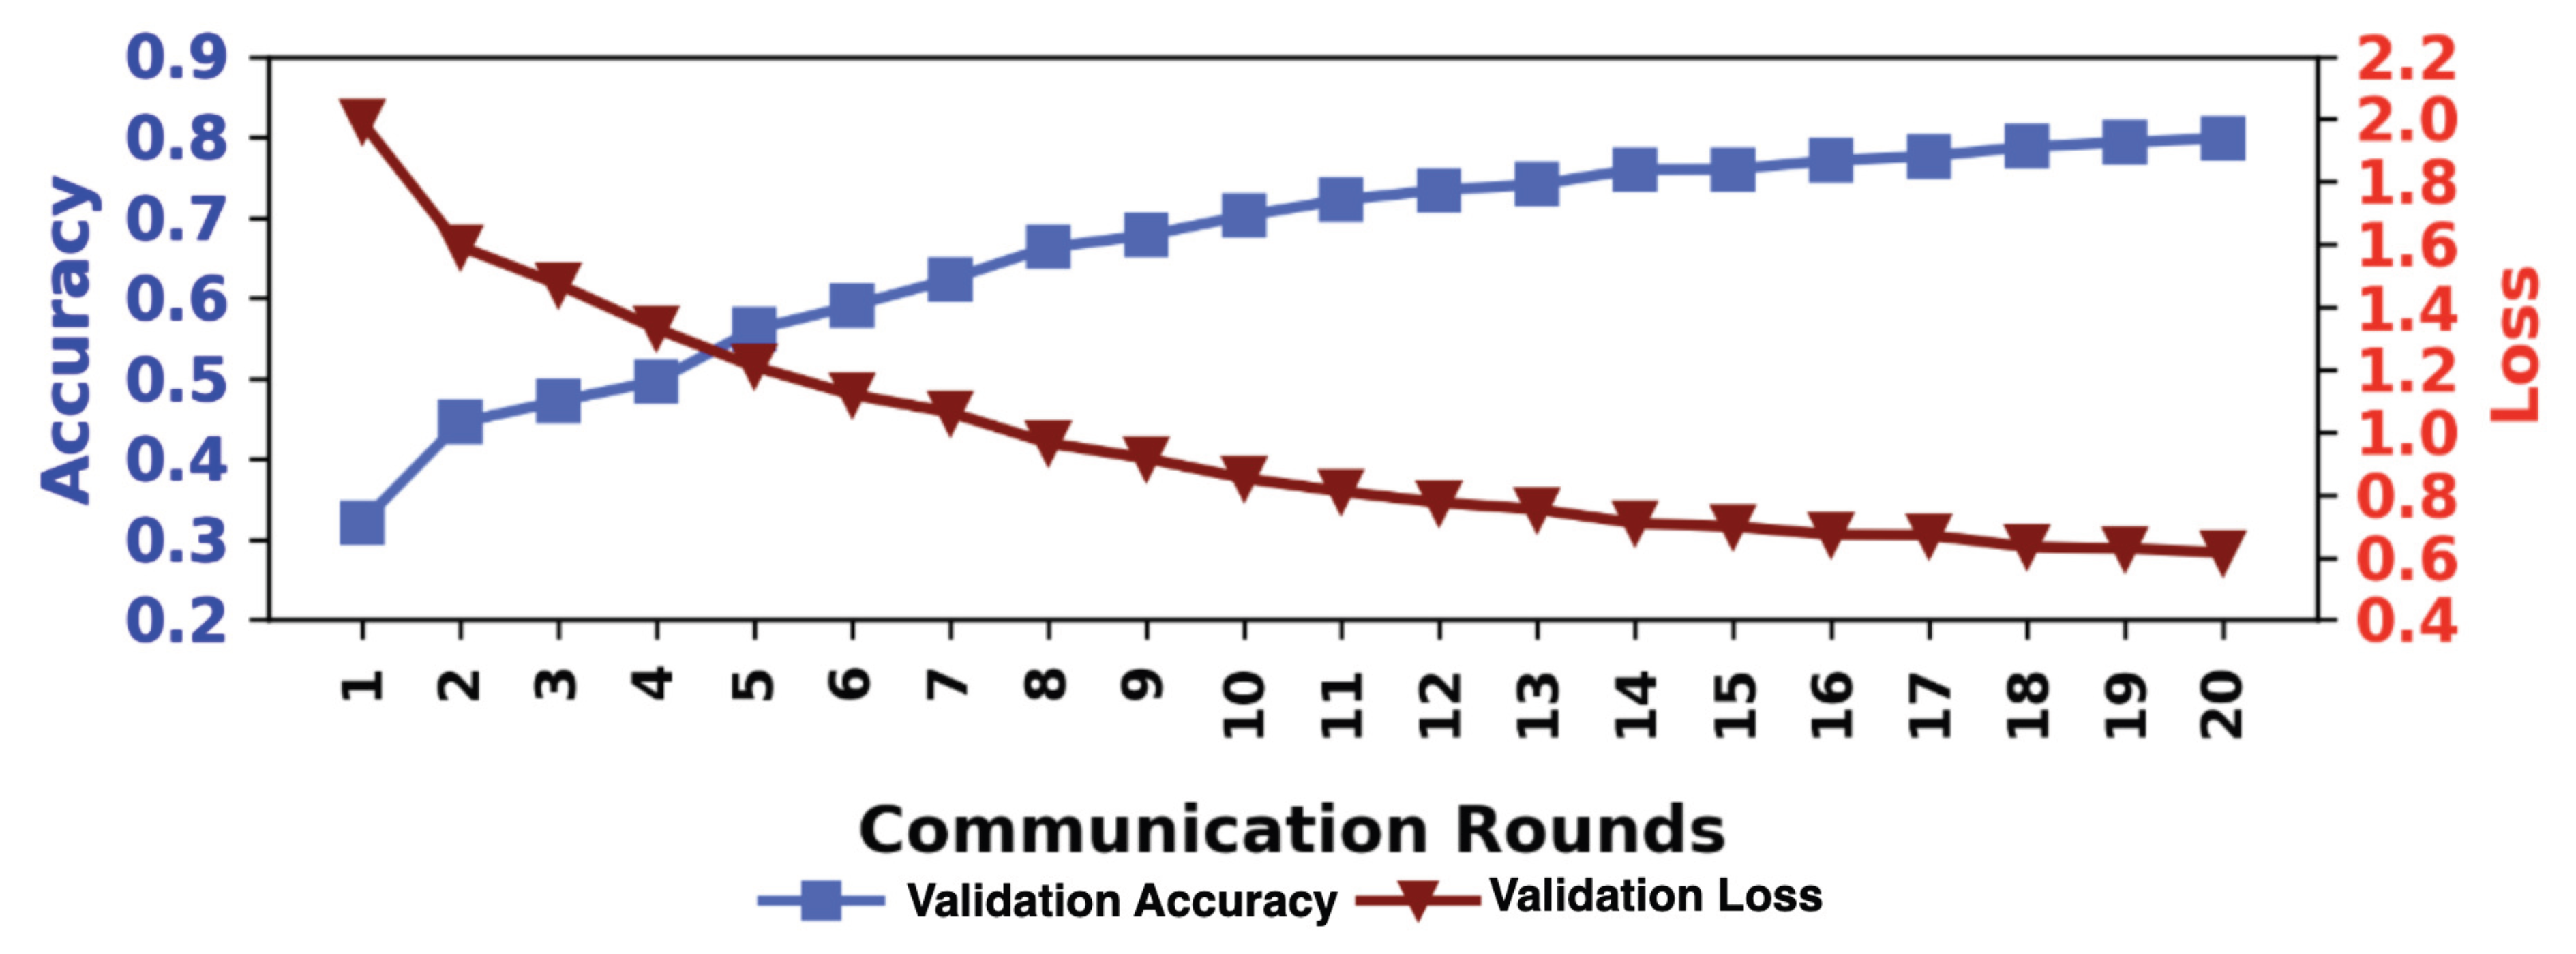
Figure 8.
Distribution of training and validation metrics across hosted clients and aggregator nodes, pooled over all 20 communication rounds. Dual y-axes: accuracy (left, blue) and loss (right, red). Red line: median; black triangle: mean; circles: outliers.
Figure 8.
Distribution of training and validation metrics across hosted clients and aggregator nodes, pooled over all 20 communication rounds. Dual y-axes: accuracy (left, blue) and loss (right, red). Red line: median; black triangle: mean; circles: outliers.
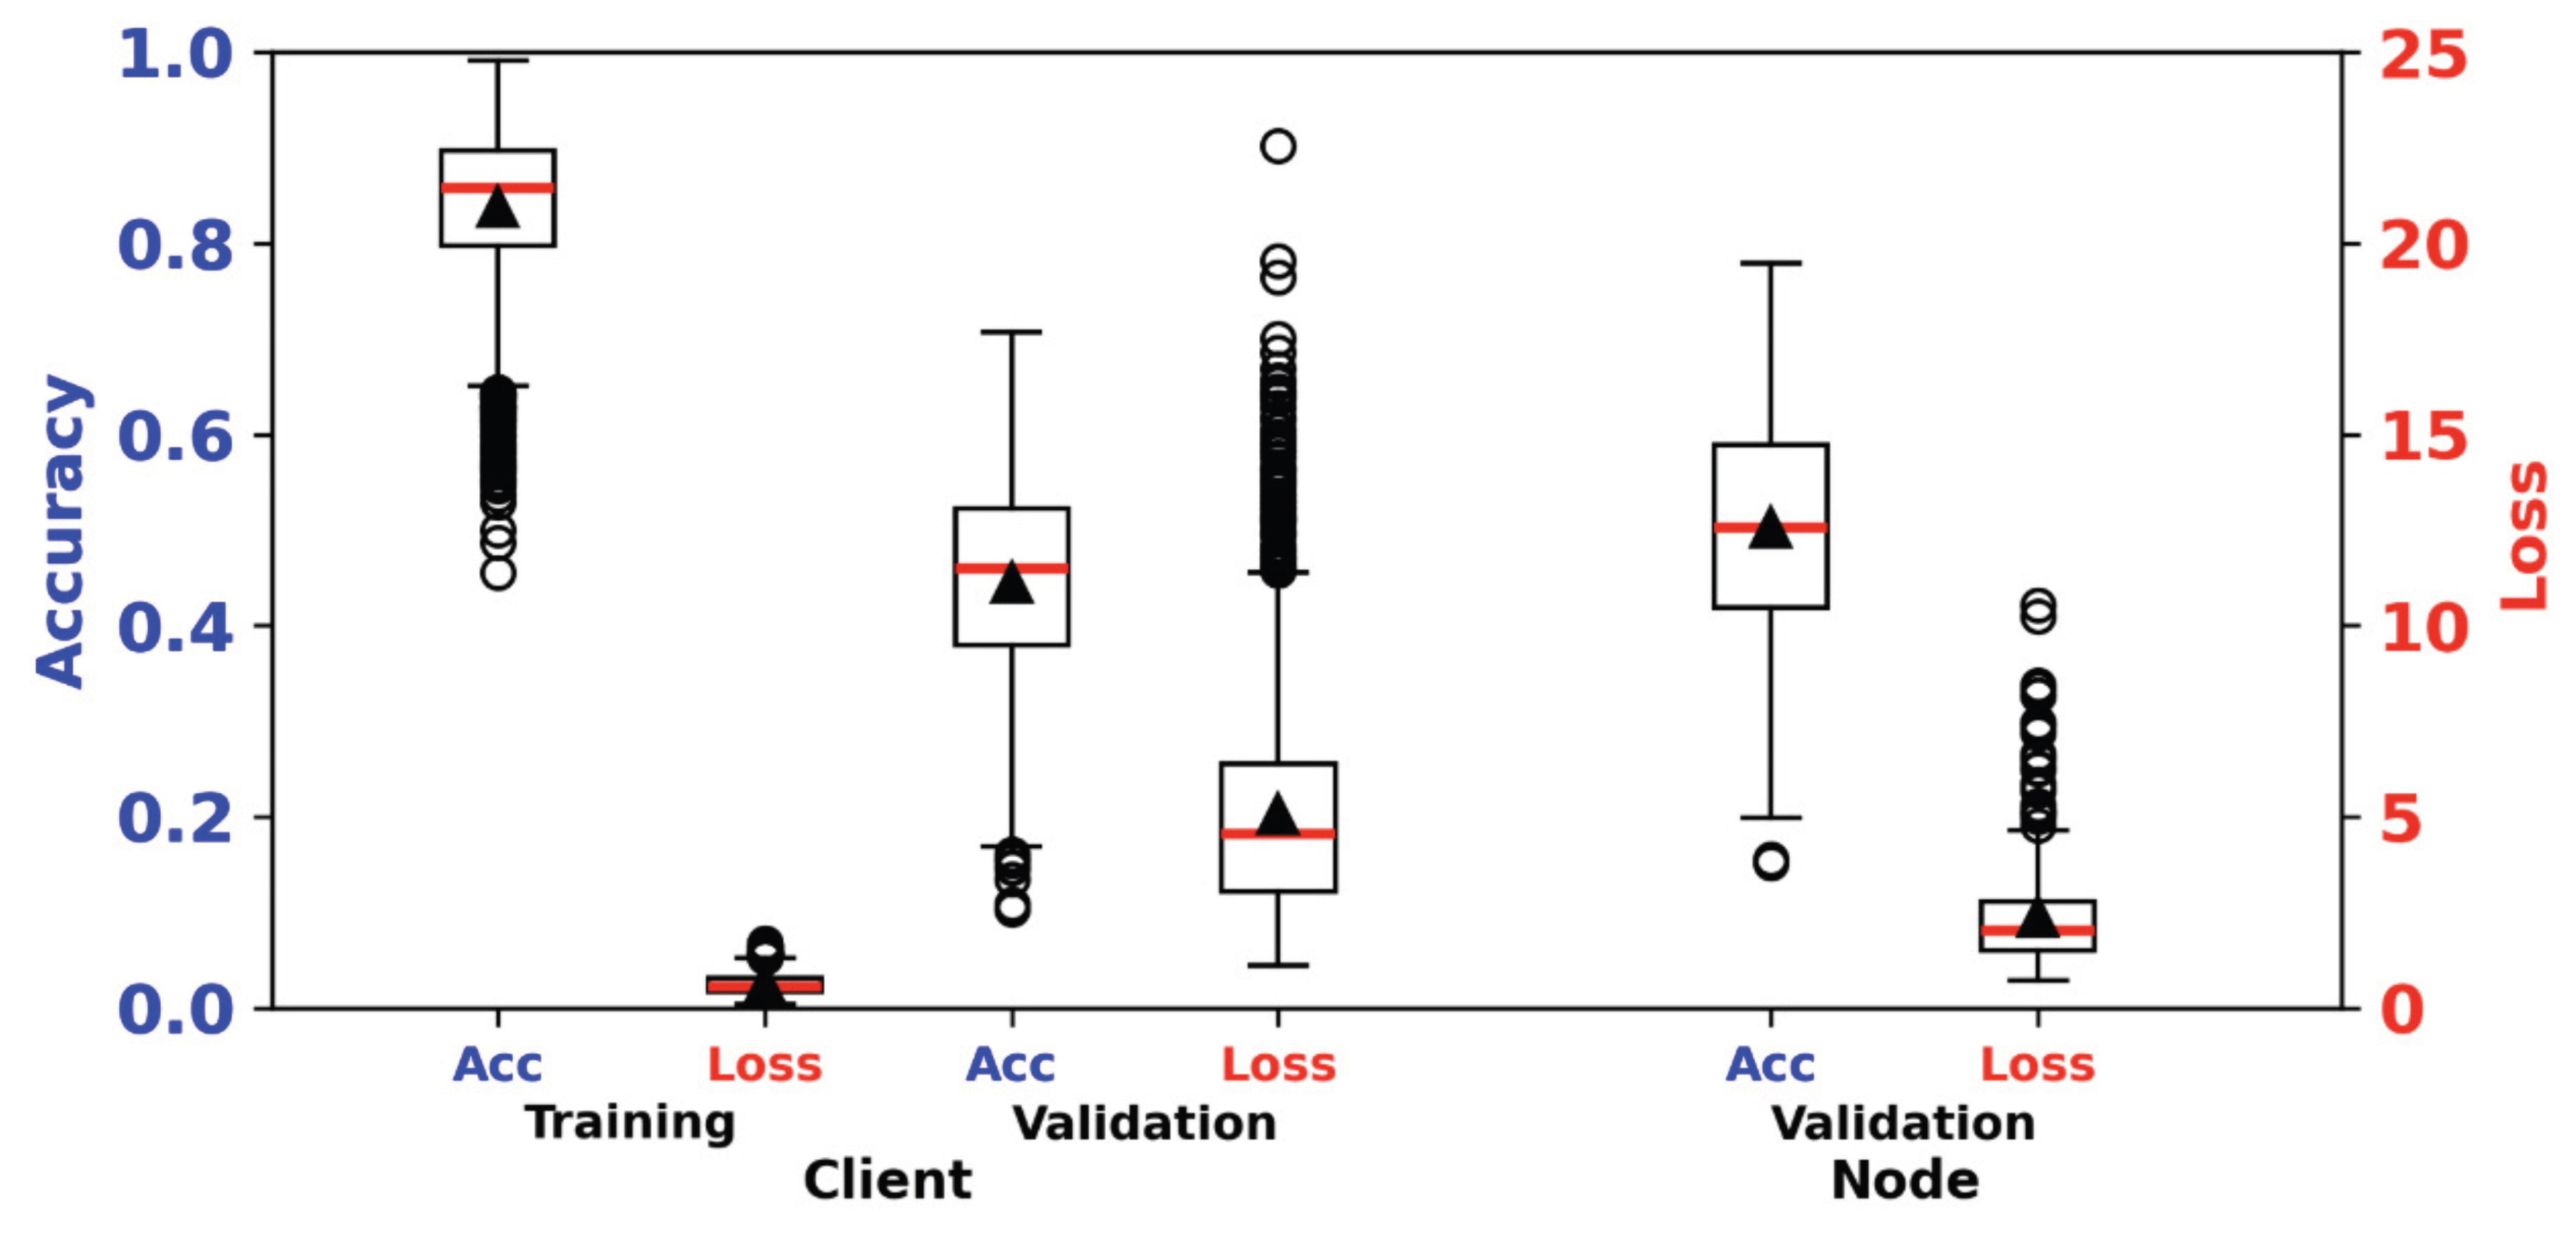
Figure 9.
Repeated k-fold validation accuracy and loss for the frozen clean FedPer model (50 folds: 5-fold × 10 repeats). Red line: median; black triangle: mean.
Figure 9.
Repeated k-fold validation accuracy and loss for the frozen clean FedPer model (50 folds: 5-fold × 10 repeats). Red line: median; black triangle: mean.
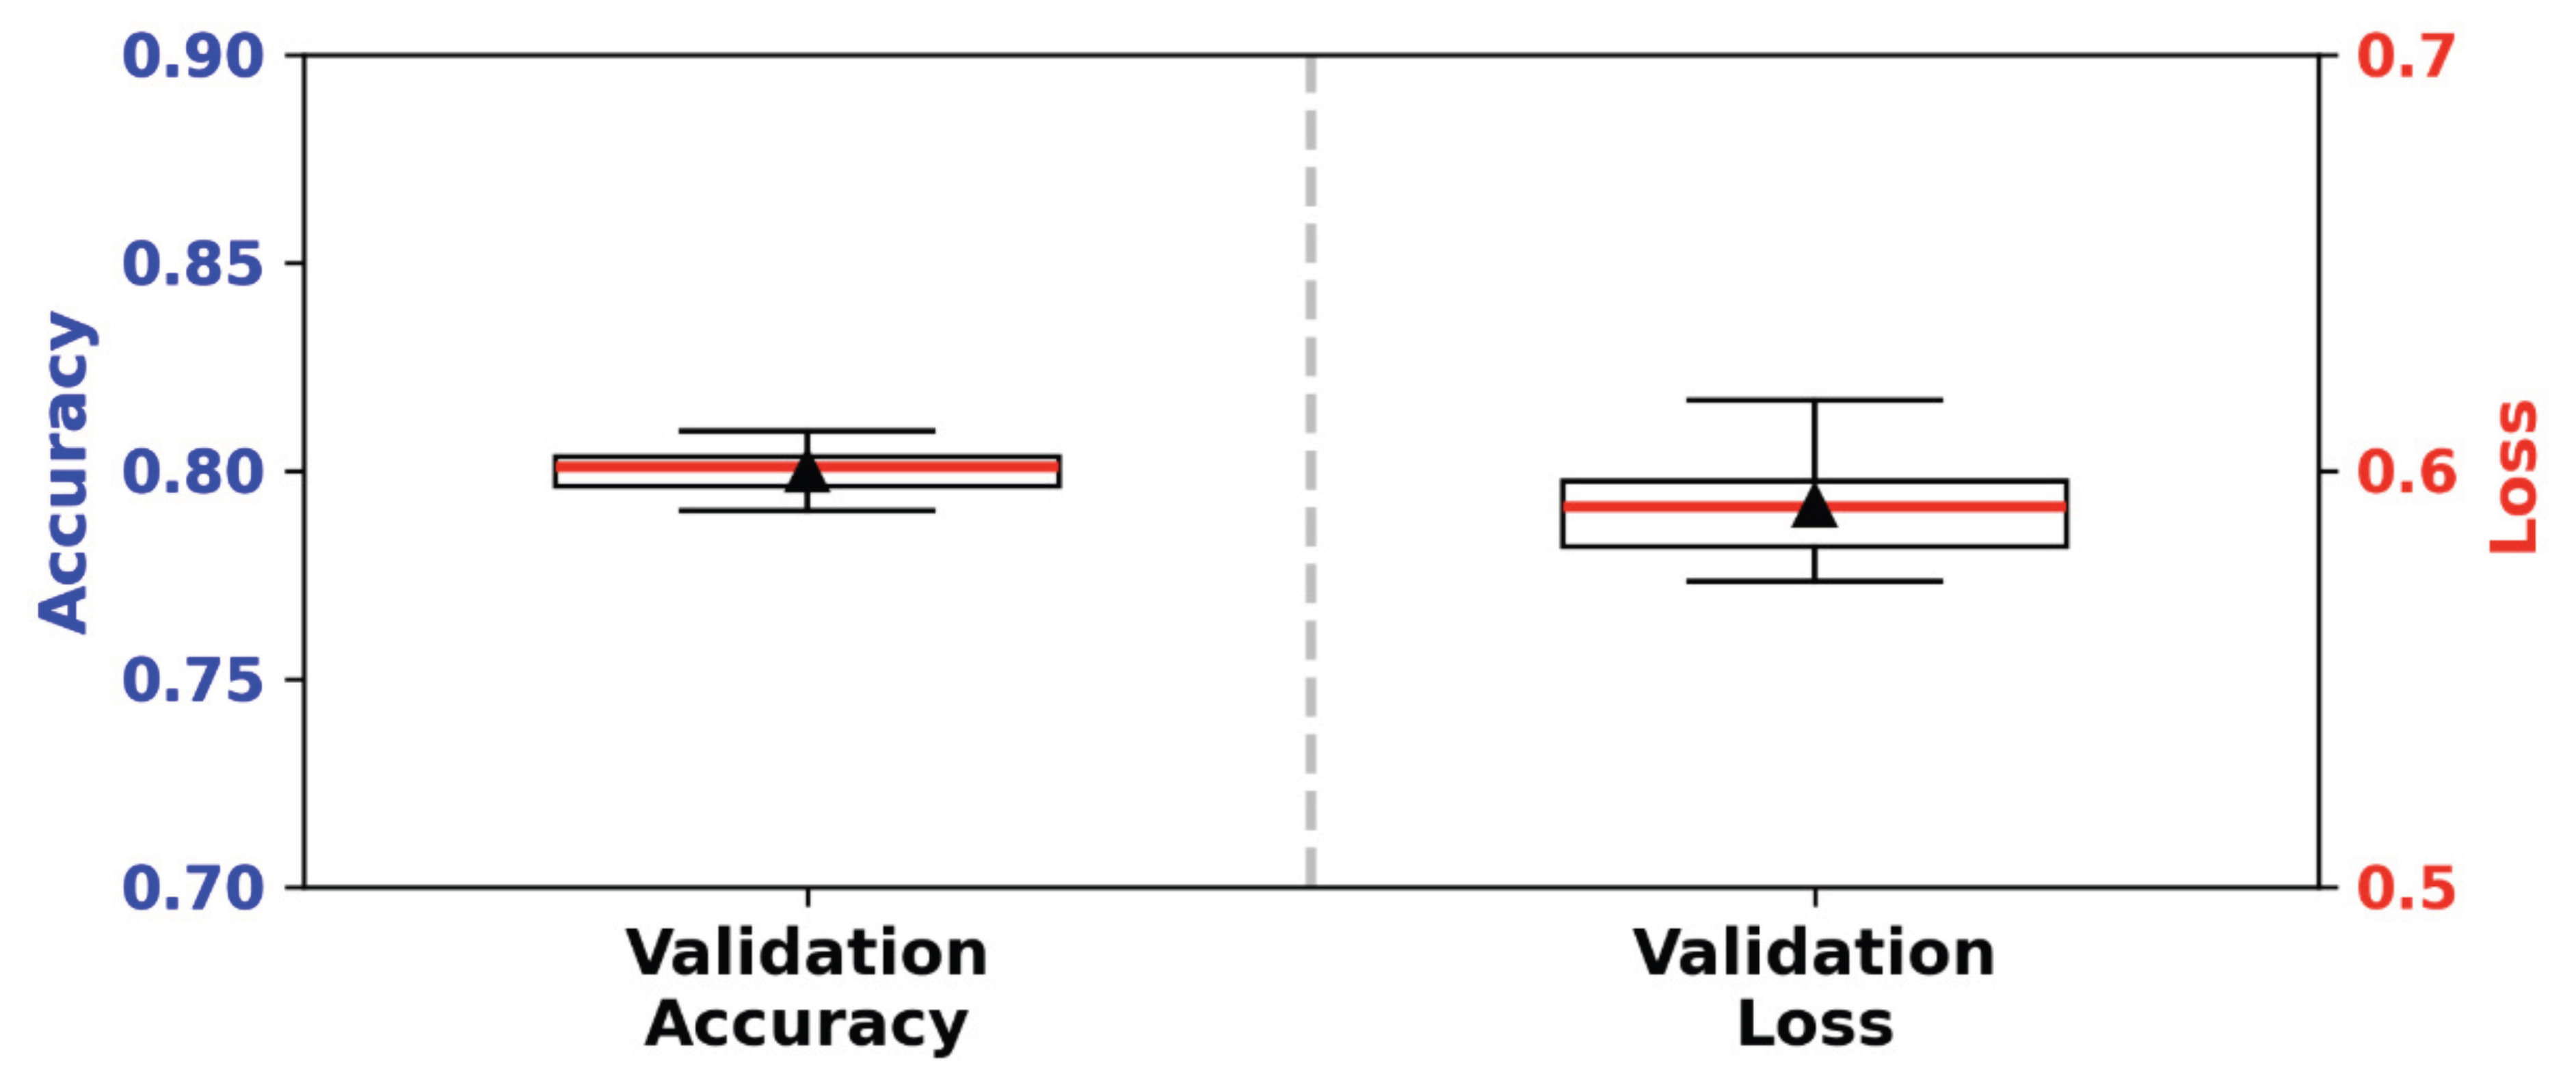
Figure 10.
Mean k-fold confusion matrix for the clean baseline (aggregated over 50 validation folds). Cell values: mean predicted counts per true class; darker blue indicates higher counts.
Figure 10.
Mean k-fold confusion matrix for the clean baseline (aggregated over 50 validation folds). Cell values: mean predicted counts per true class; darker blue indicates higher counts.
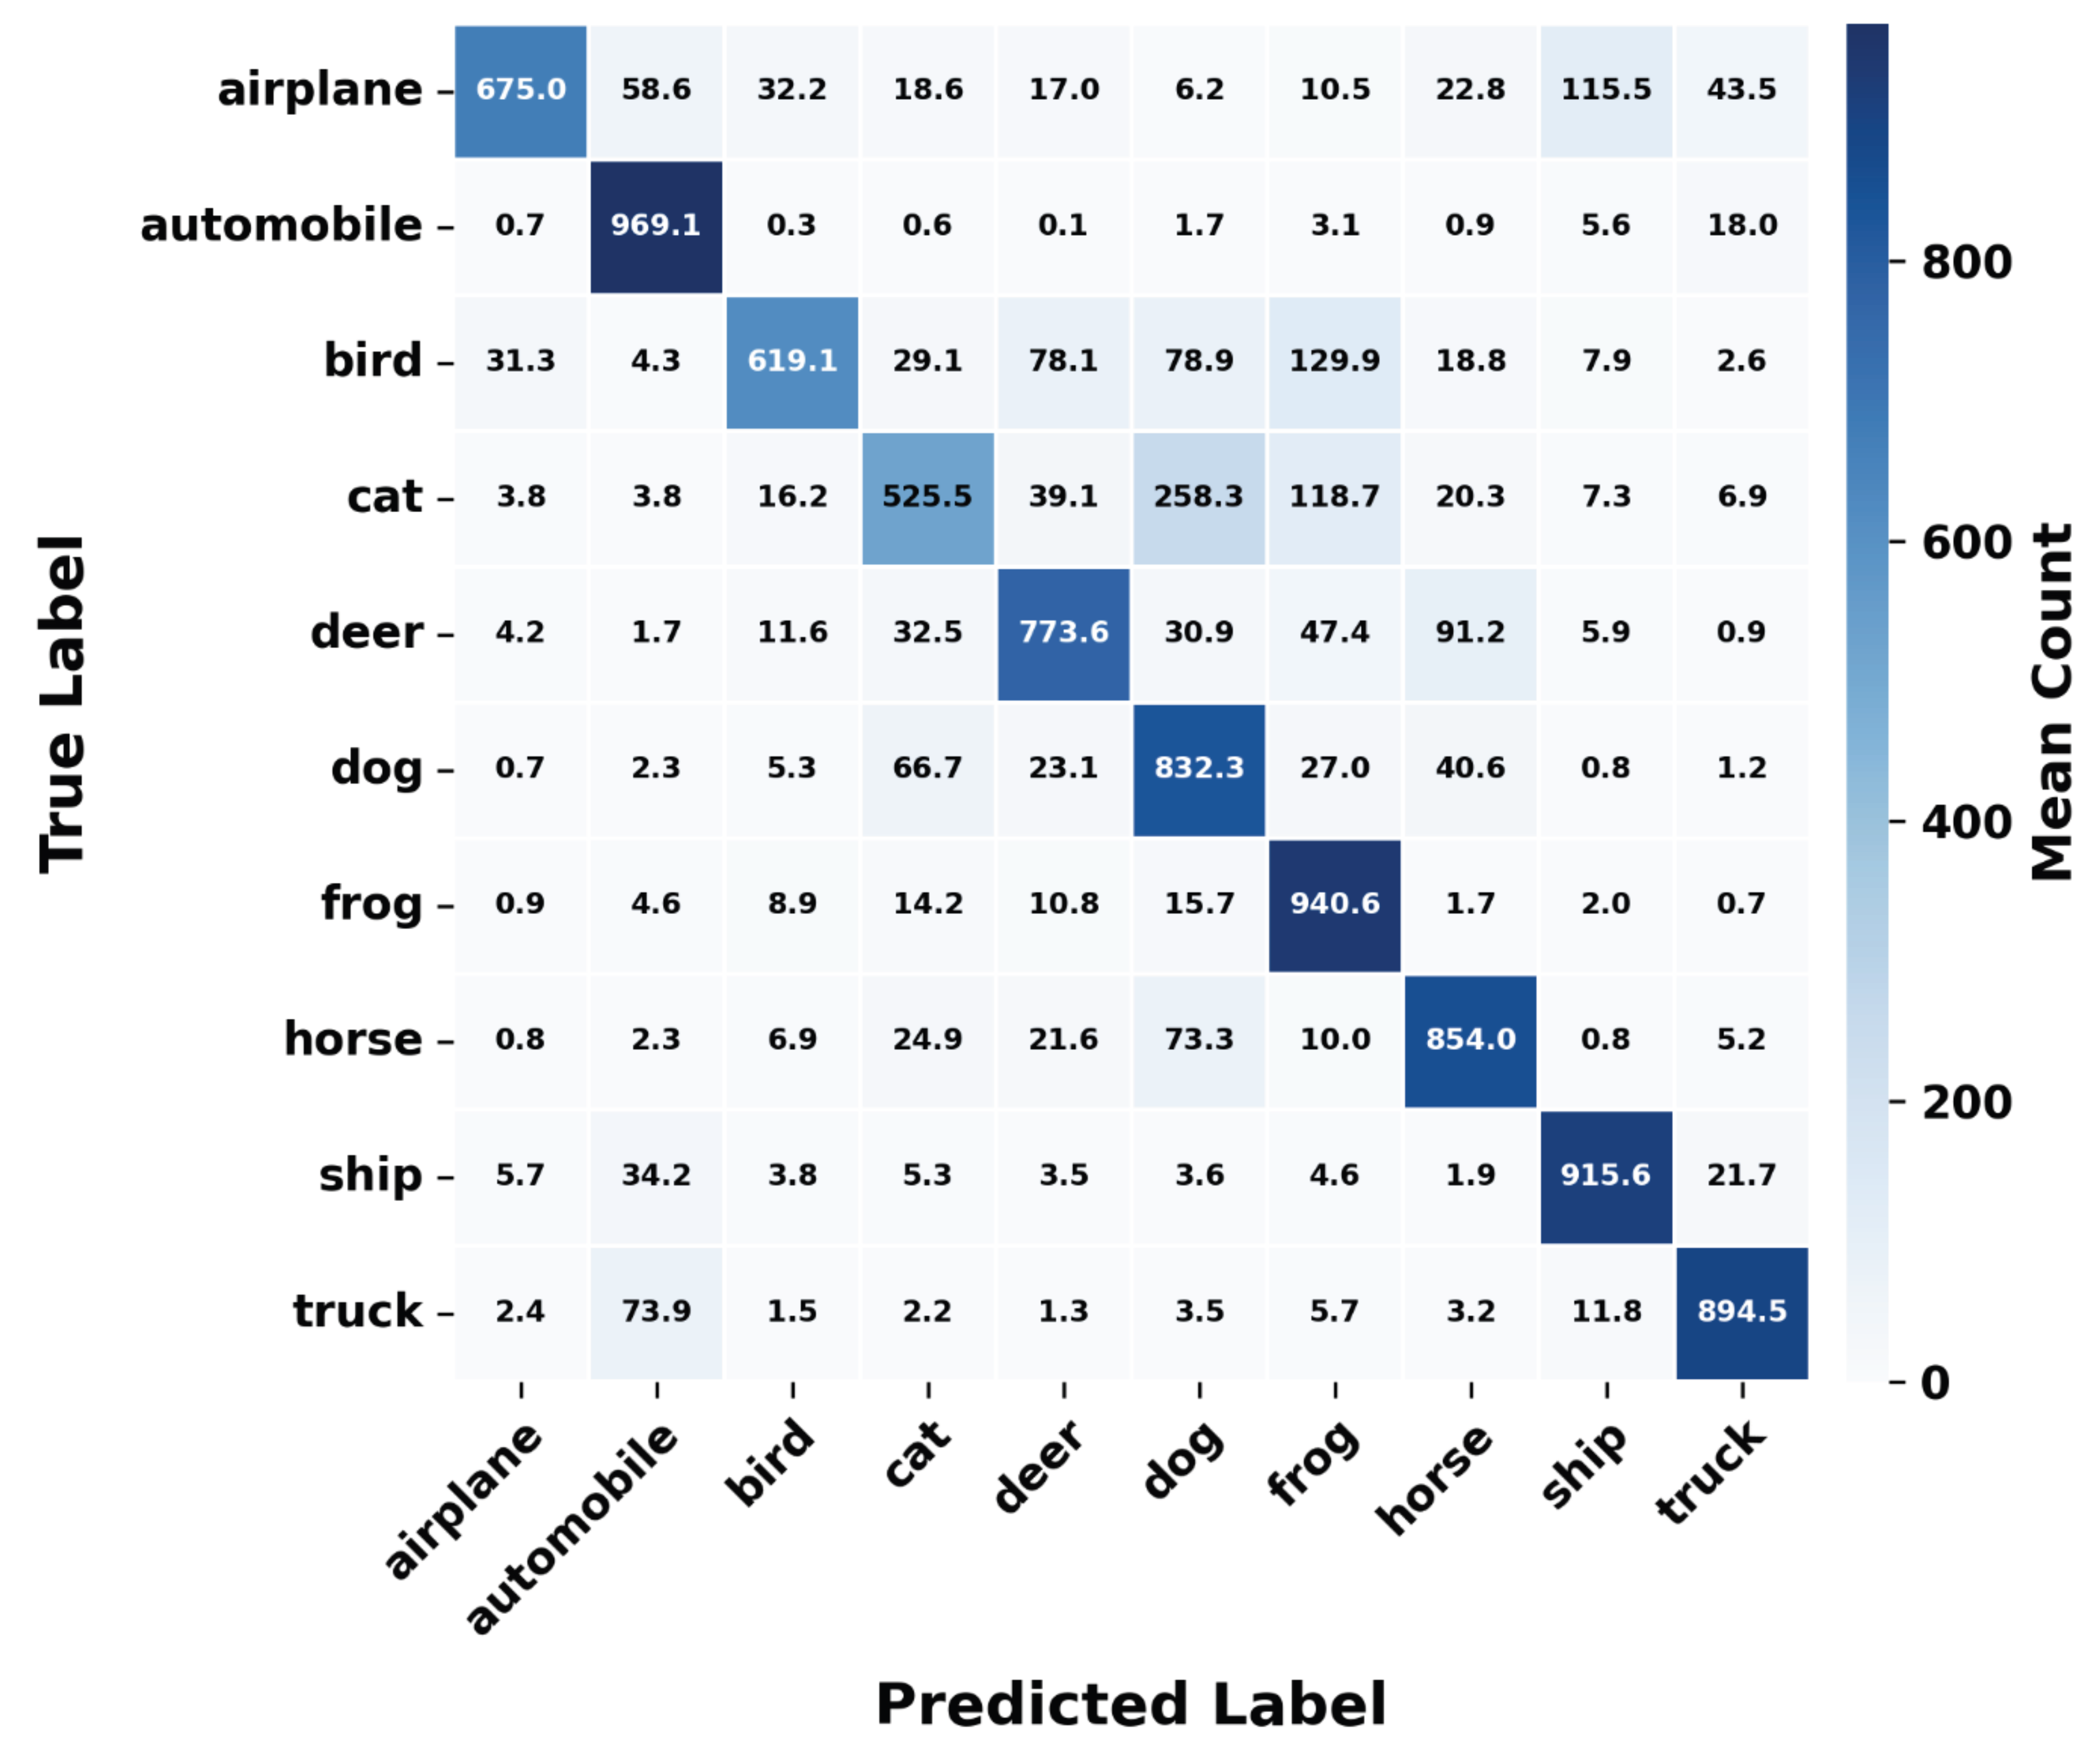
Figure 11.
Global validation accuracy and loss under free-attack poisoning without defense. Dual y-axes: accuracy (left, blue) and loss (right, red) at the root after each round; dashed vertical lines mark attack rounds.
Figure 11.
Global validation accuracy and loss under free-attack poisoning without defense. Dual y-axes: accuracy (left, blue) and loss (right, red) at the root after each round; dashed vertical lines mark attack rounds.
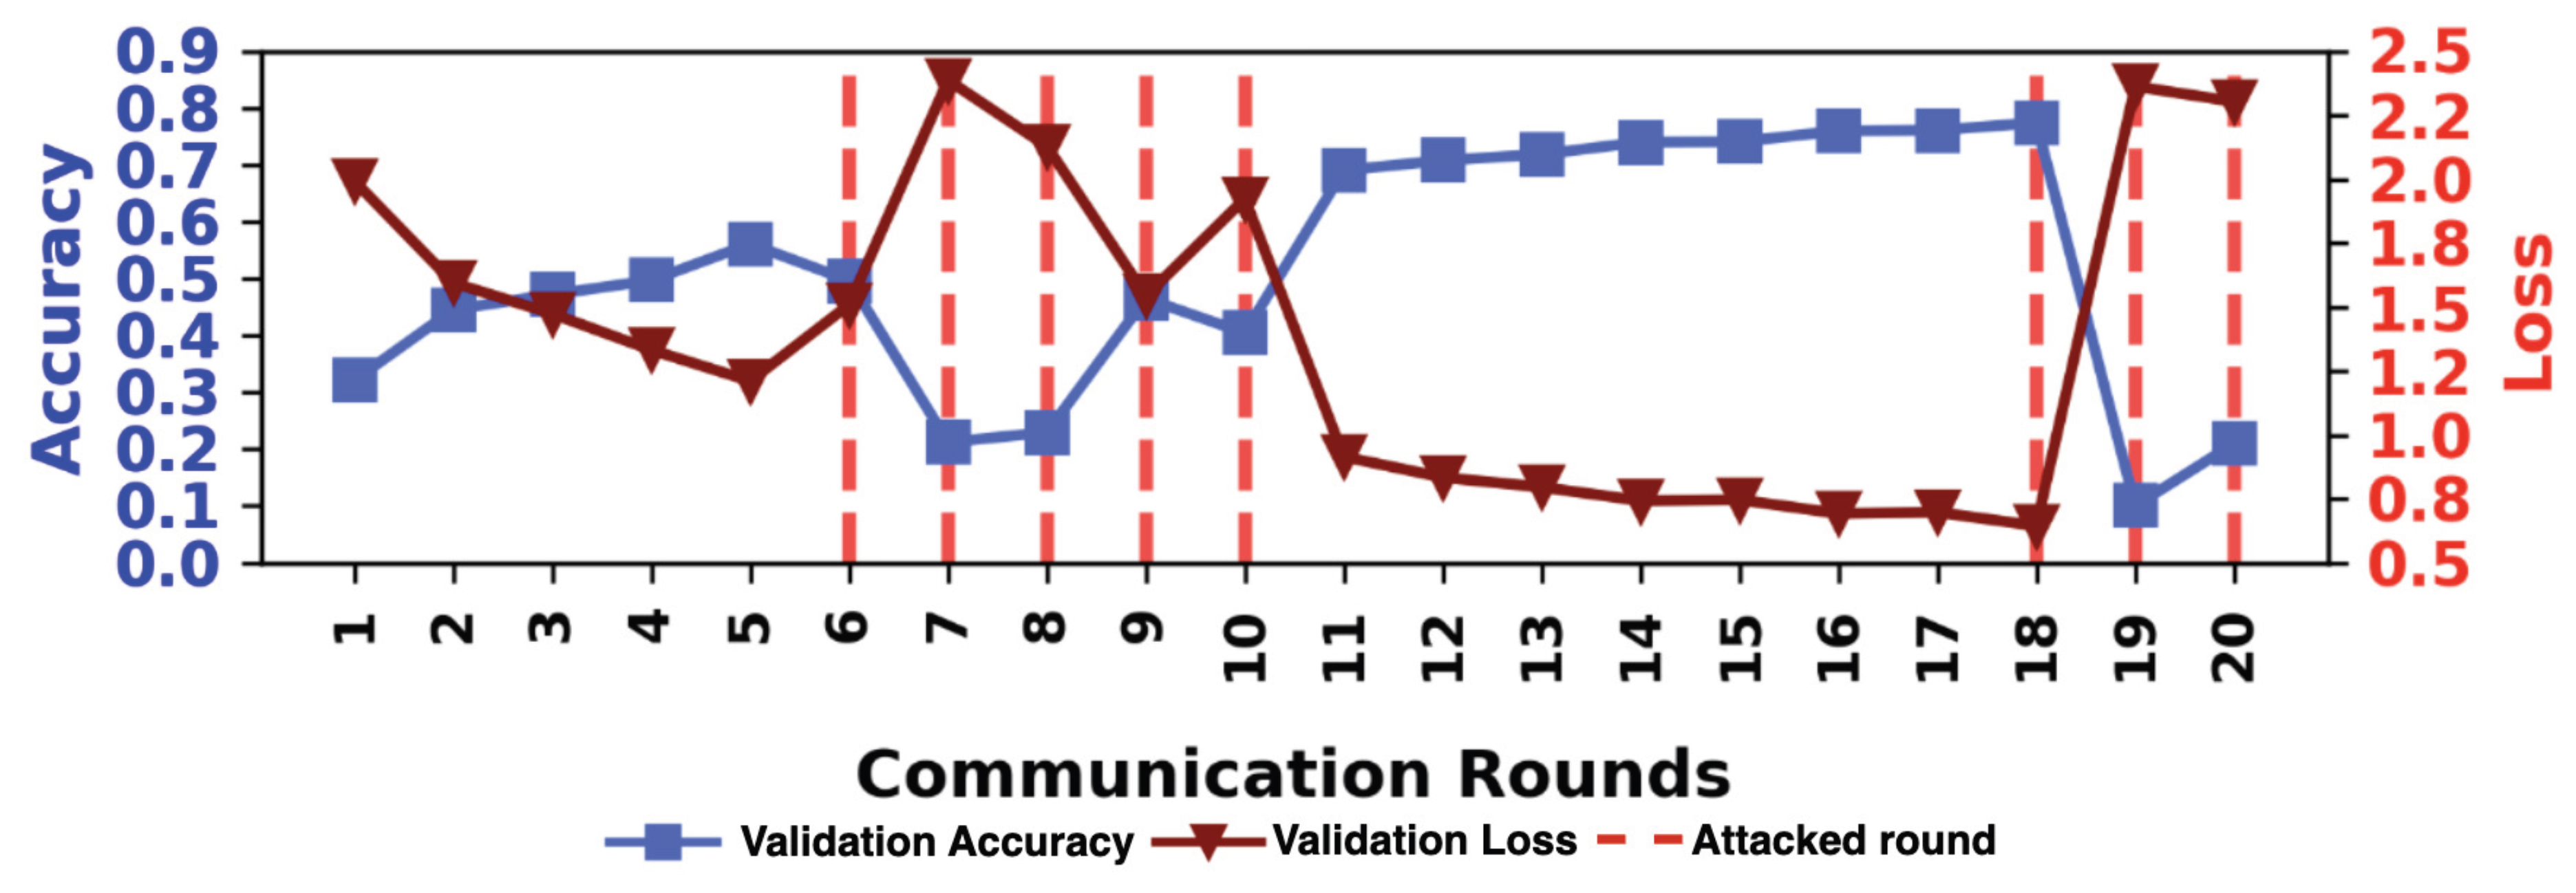
Figure 12.
Distribution of training and validation metrics for normal vs. attacked clients and nodes under free attacks (pooled over all rounds). Dual y-axes: accuracy (left, blue) and loss (right, red). Red line: median; black triangle: mean; circles: outliers.
Figure 12.
Distribution of training and validation metrics for normal vs. attacked clients and nodes under free attacks (pooled over all rounds). Dual y-axes: accuracy (left, blue) and loss (right, red). Red line: median; black triangle: mean; circles: outliers.
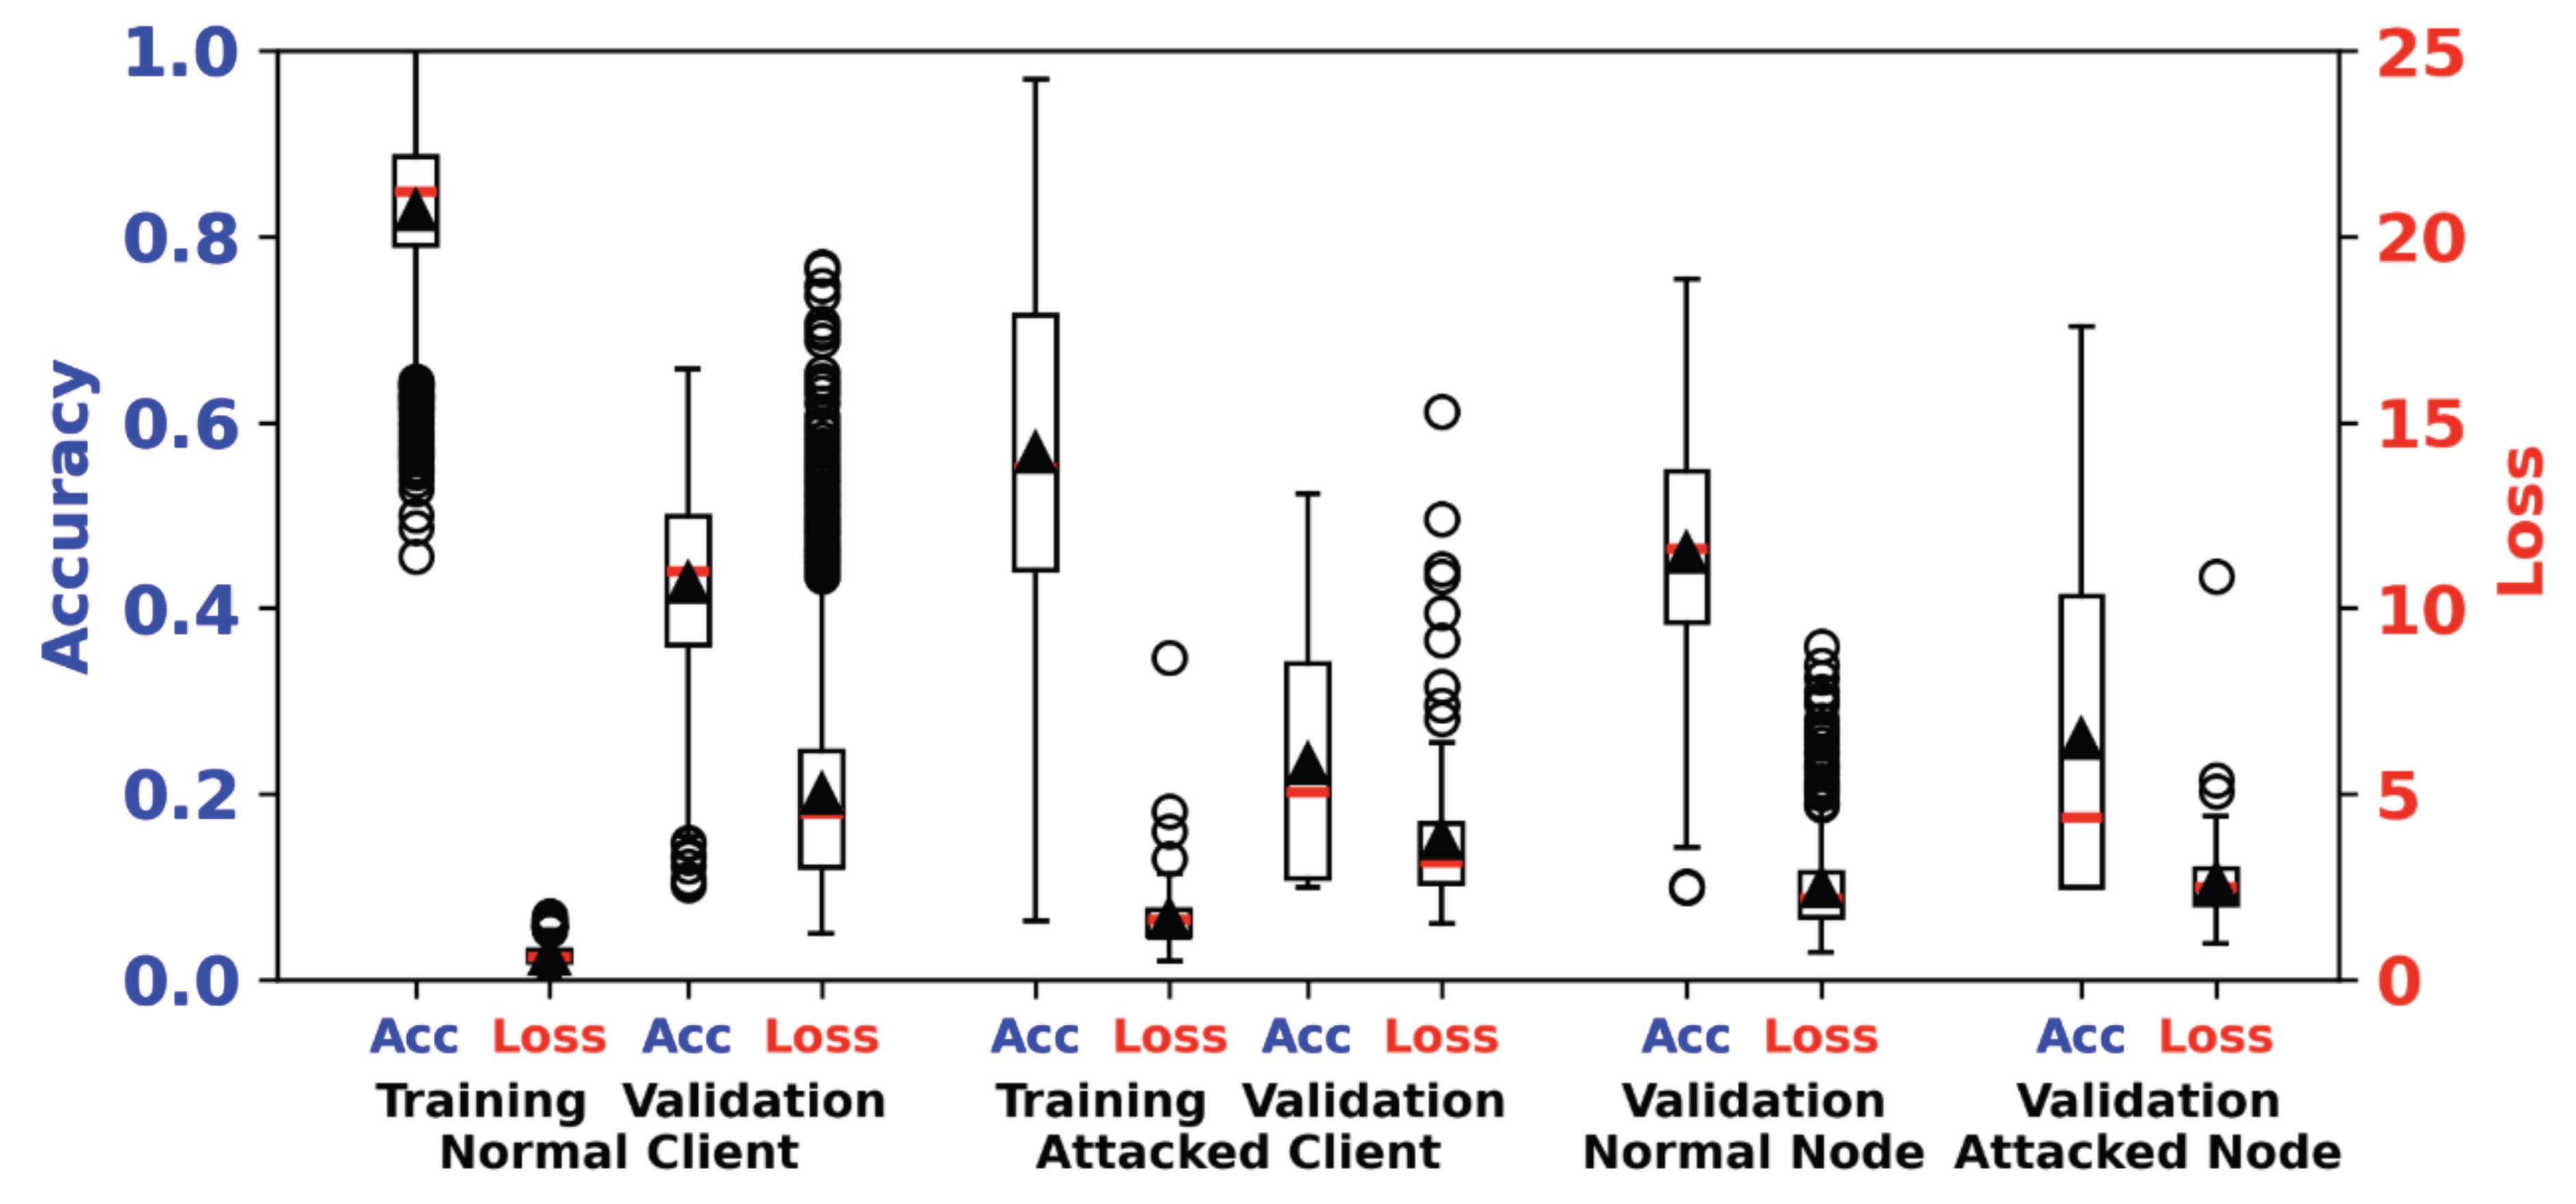
Figure 13.
Attack-event timeline for the free-attack scenario. Rows: five attack types plus total attacked clients per round. Columns: communication rounds 1–20; color scale: mean severity (%). Cell labels: number of targeted clients per attack type (bottom row: total attacked clients). Attacks cluster in rounds 6–10 and 18–20.
Figure 13.
Attack-event timeline for the free-attack scenario. Rows: five attack types plus total attacked clients per round. Columns: communication rounds 1–20; color scale: mean severity (%). Cell labels: number of targeted clients per attack type (bottom row: total attacked clients). Attacks cluster in rounds 6–10 and 18–20.
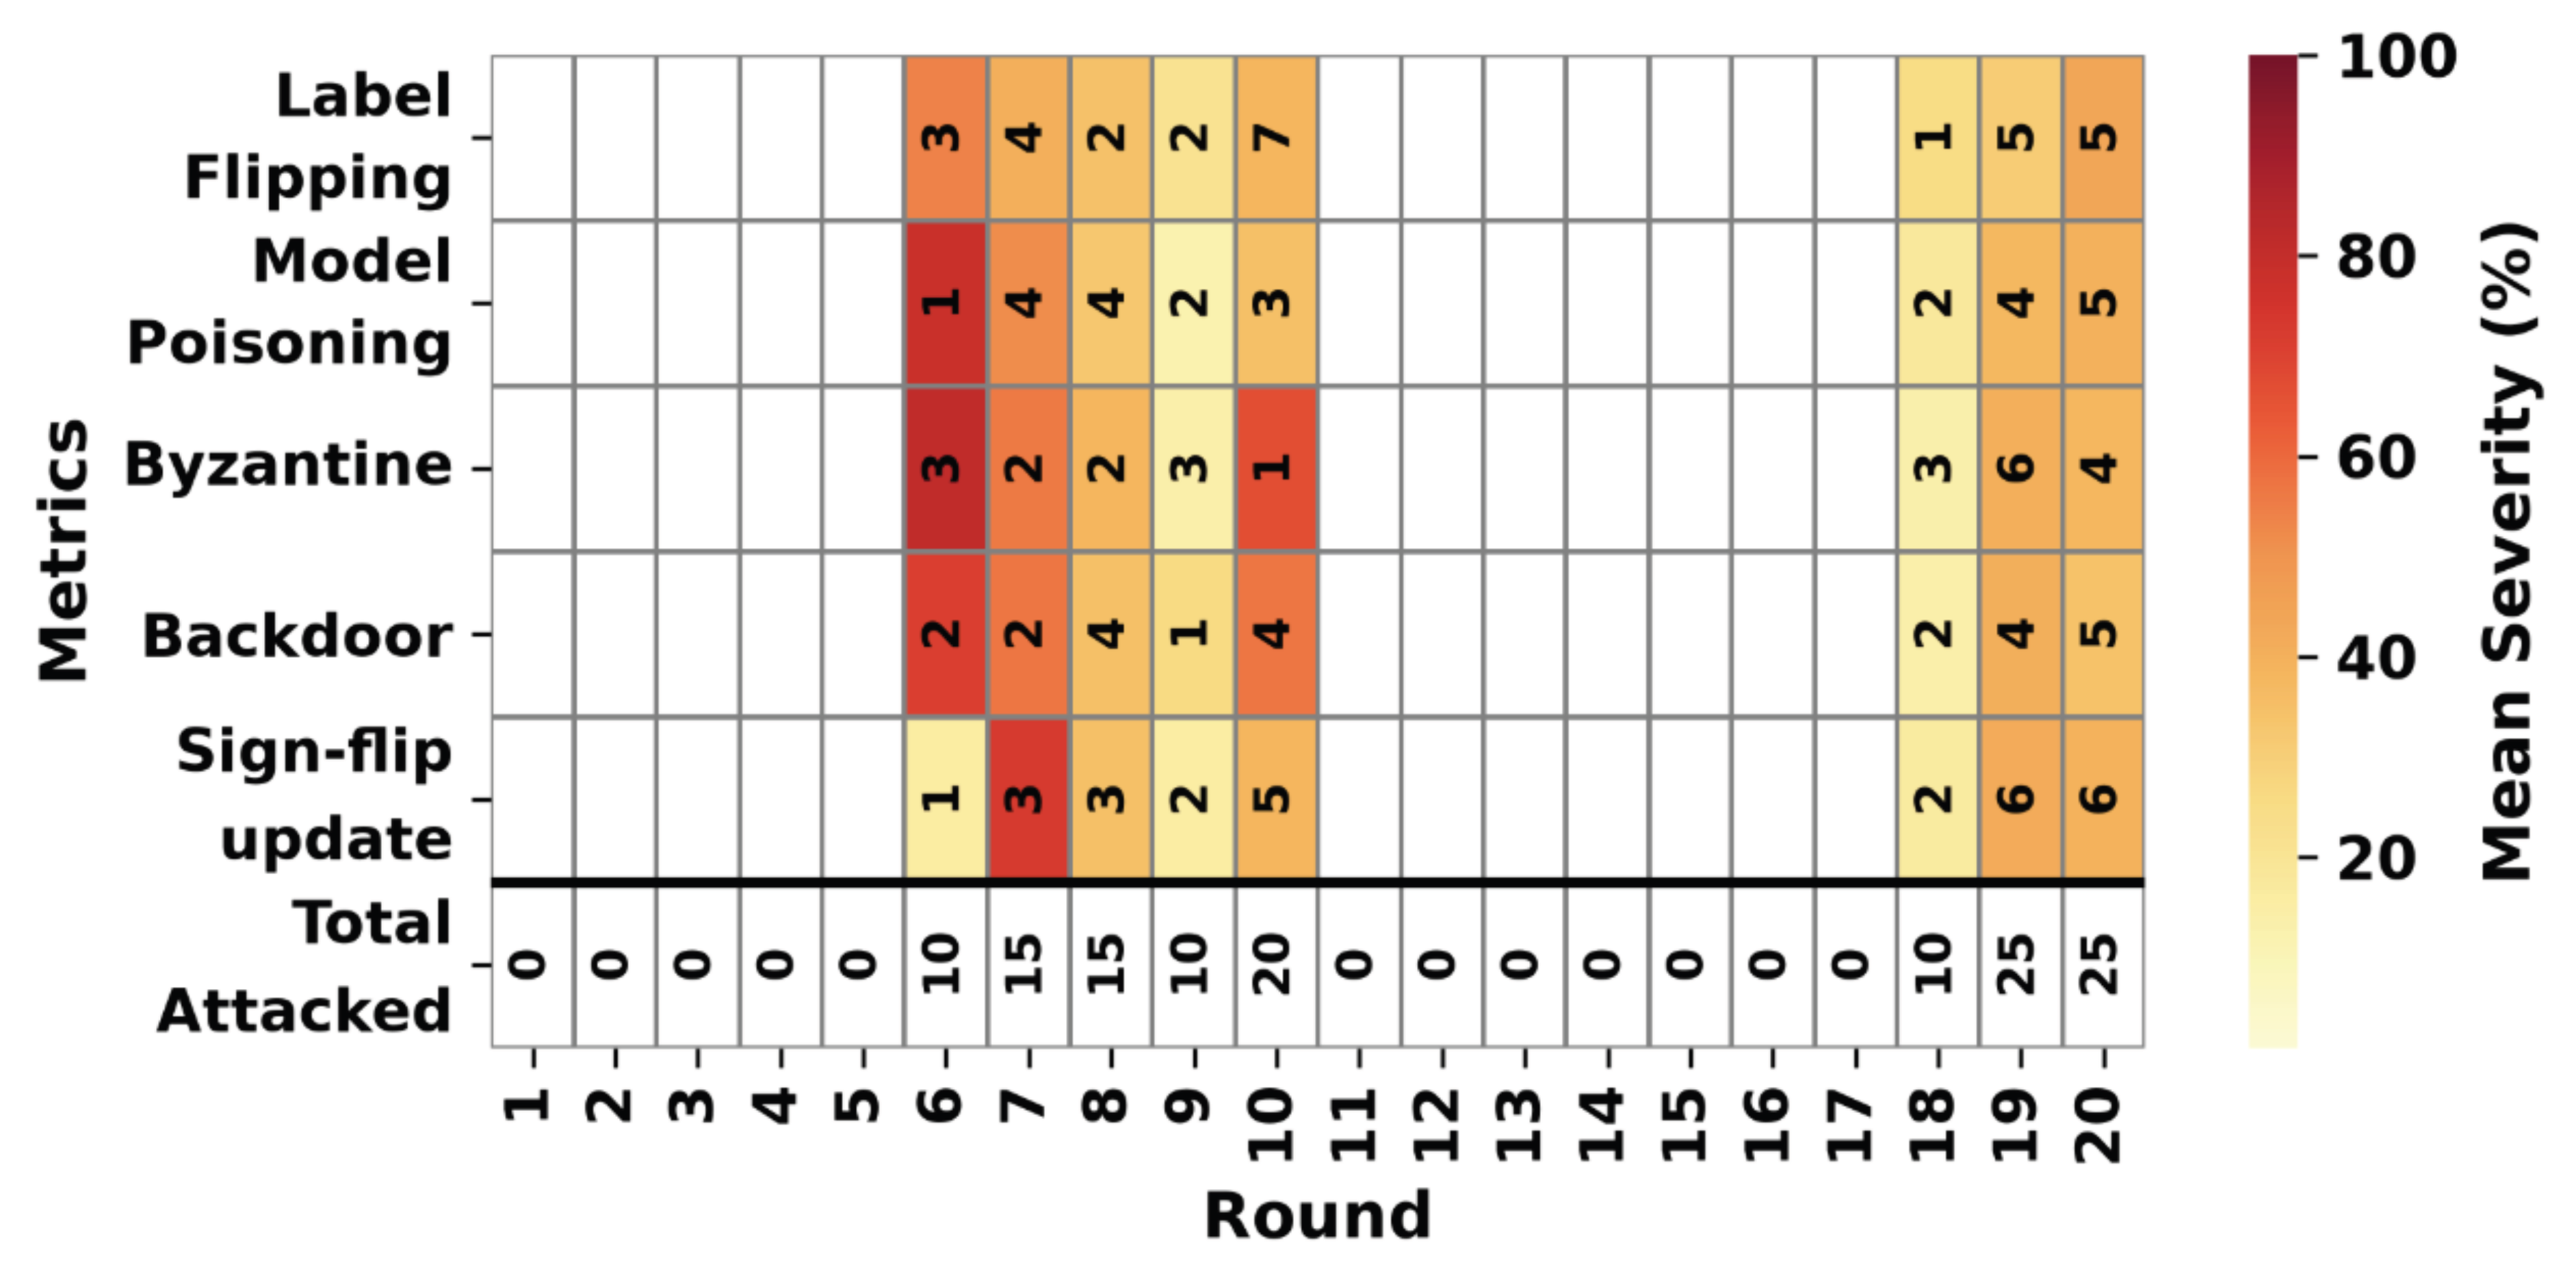
Figure 14.
Repeated k-fold validation accuracy and loss for the frozen model after free-attack training (50 folds: 5-fold × 10 repeats). Red line: median; black triangle: mean.
Figure 14.
Repeated k-fold validation accuracy and loss for the frozen model after free-attack training (50 folds: 5-fold × 10 repeats). Red line: median; black triangle: mean.
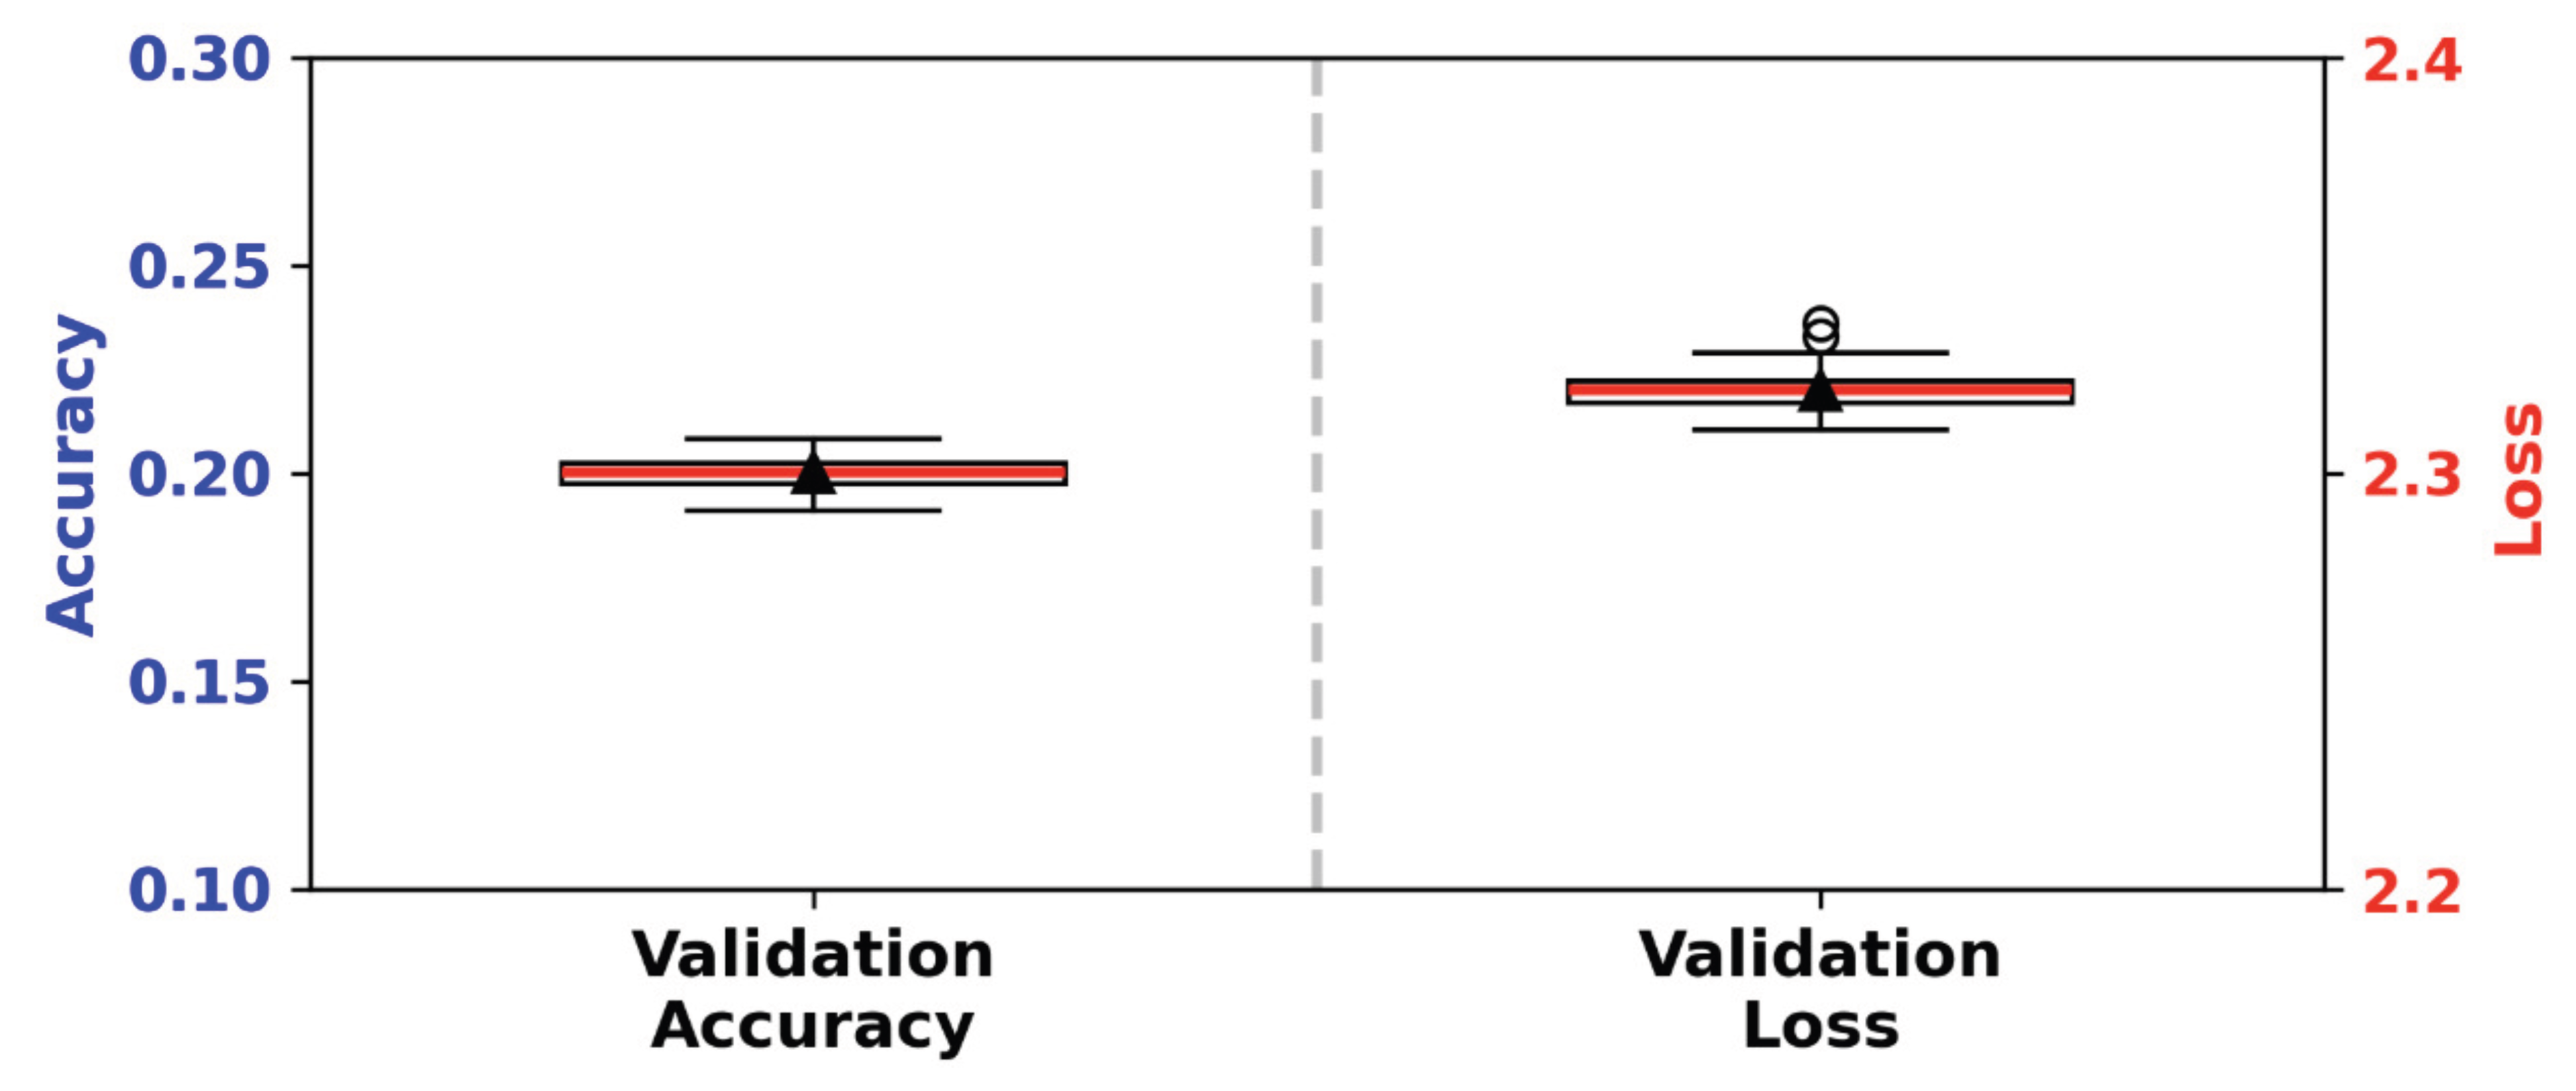
Figure 15.
Mean k-fold confusion matrix after unconstrained attacks without defense (aggregated over 50 validation folds). Cell values: mean predicted counts per true class.
Figure 15.
Mean k-fold confusion matrix after unconstrained attacks without defense (aggregated over 50 validation folds). Cell values: mean predicted counts per true class.
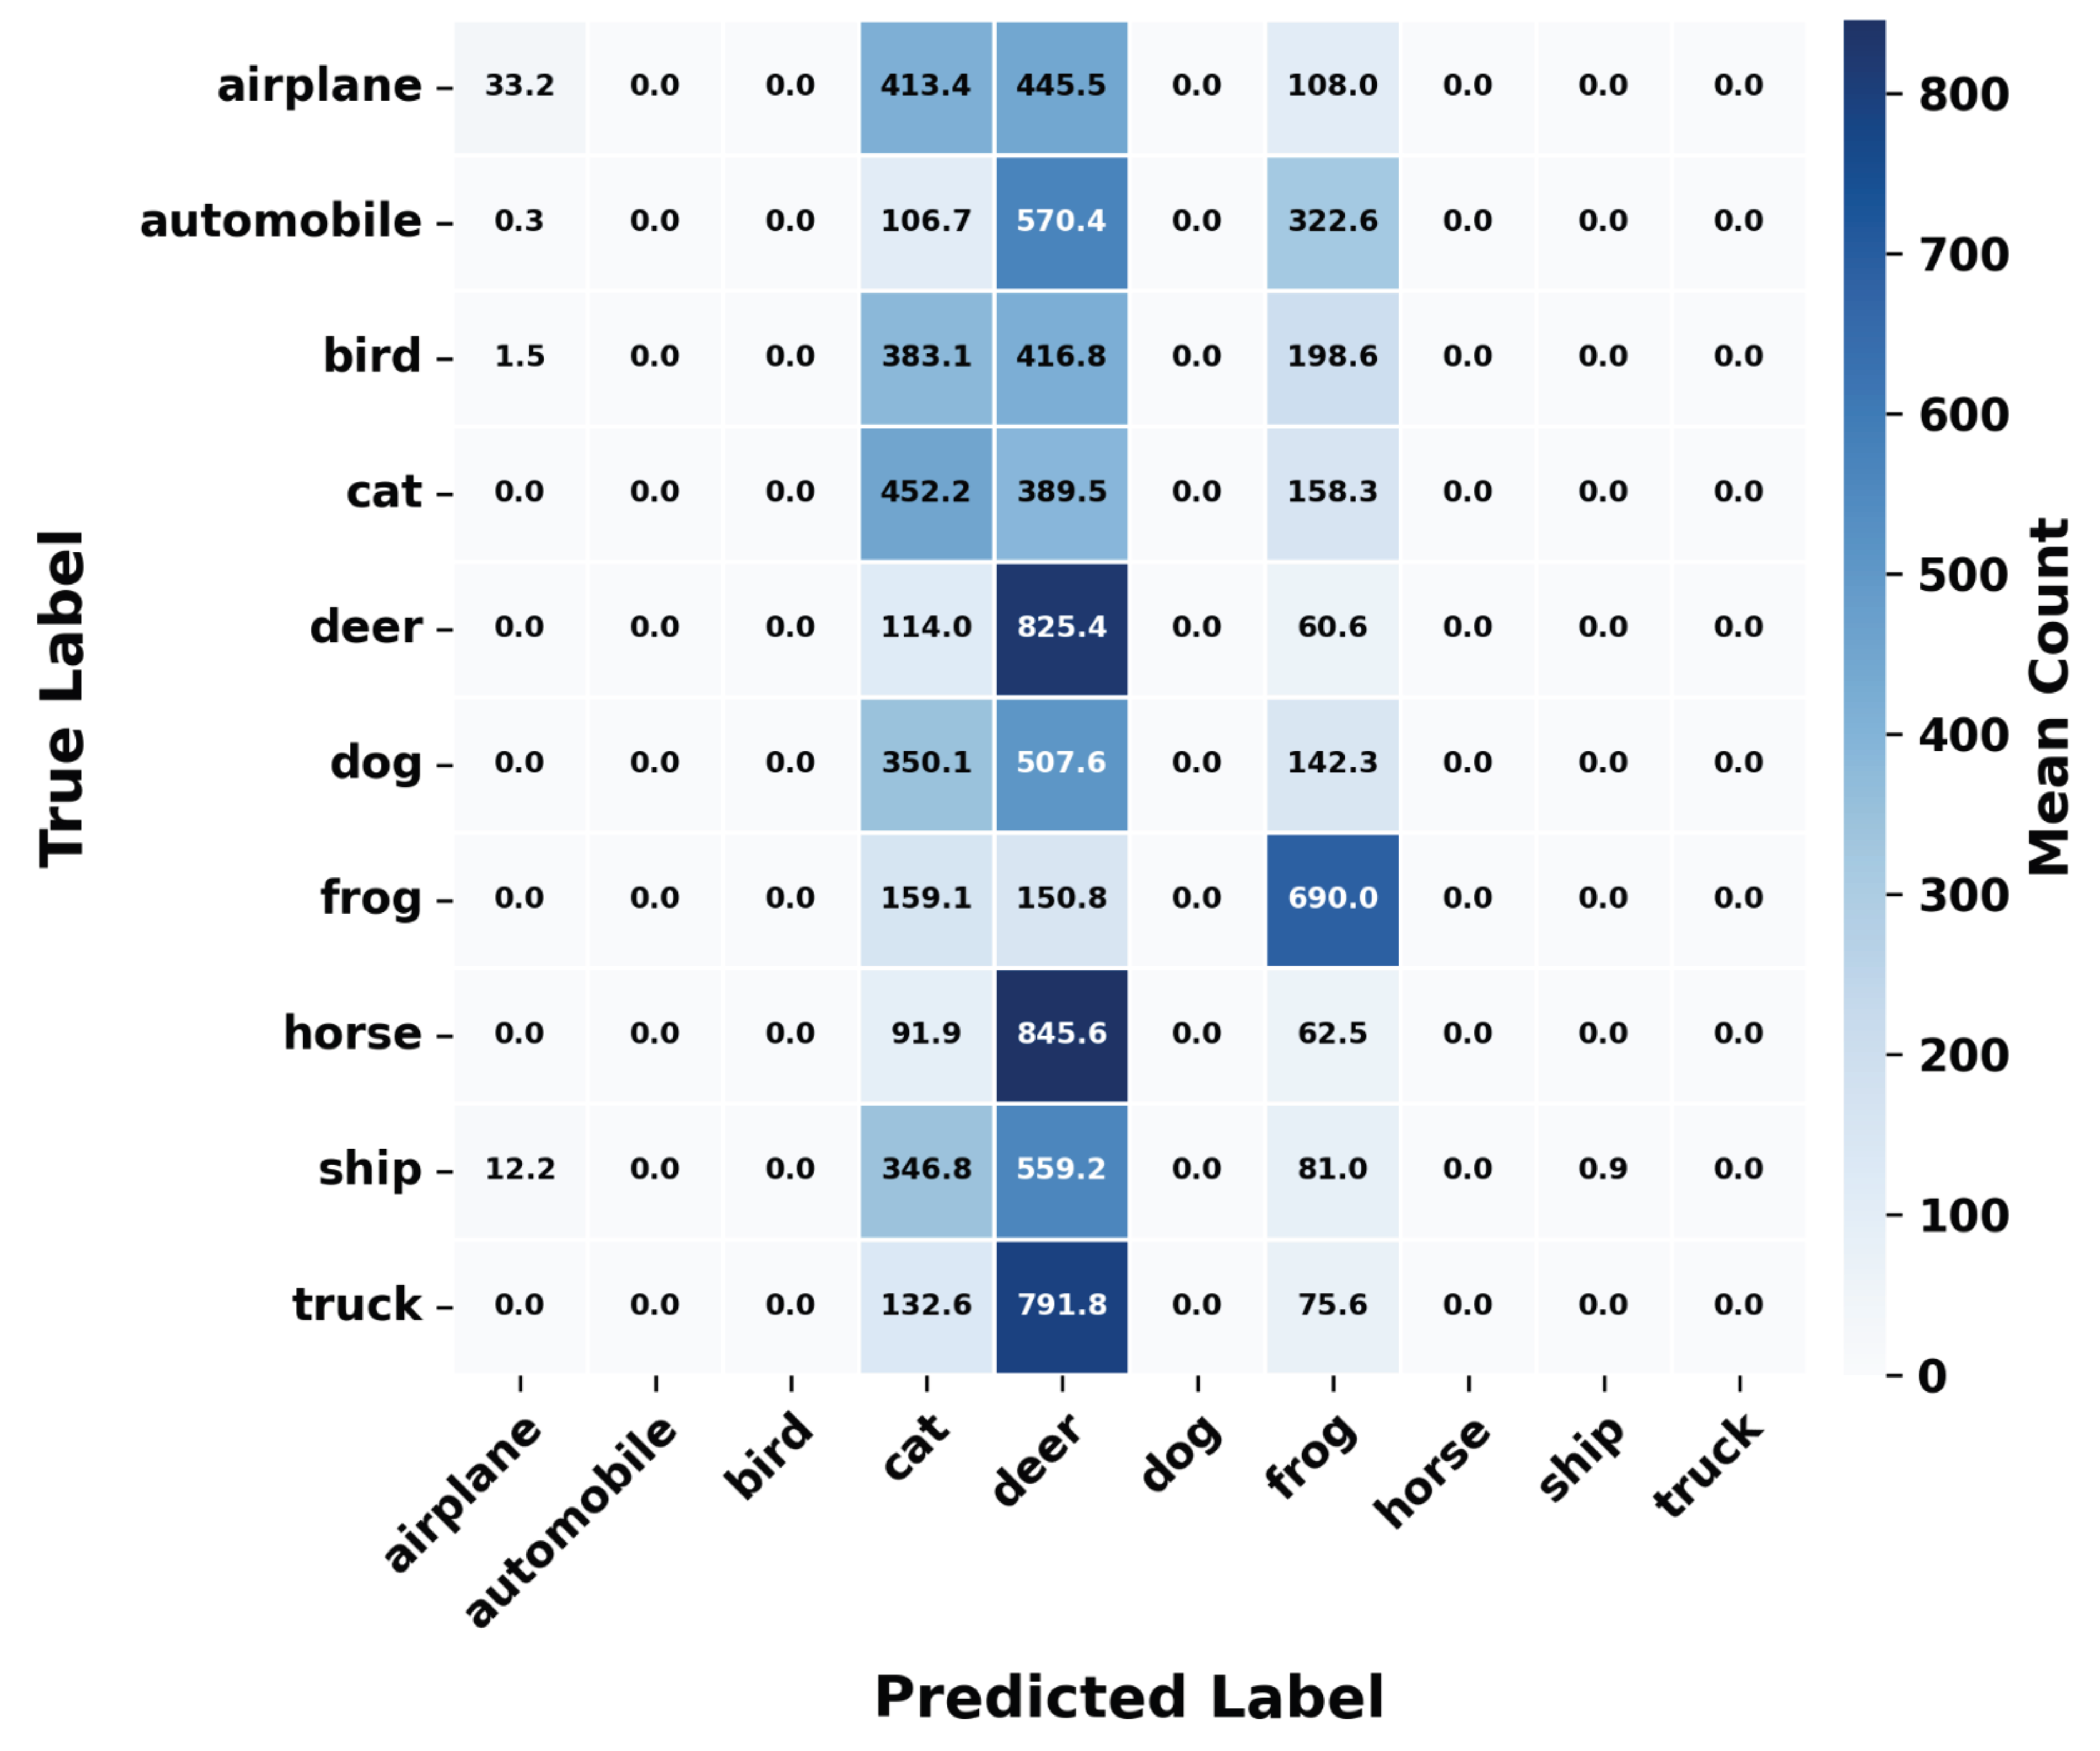
Figure 16.
Global validation accuracy and loss under sustained attacks with trend-based quarantine enabled. Dual y-axes: accuracy (left, blue) and loss (right, red) at the root; dashed vertical lines mark attack rounds; orange squares: skip-root aggregation (rejected global backbone update).
Figure 16.
Global validation accuracy and loss under sustained attacks with trend-based quarantine enabled. Dual y-axes: accuracy (left, blue) and loss (right, red) at the root; dashed vertical lines mark attack rounds; orange squares: skip-root aggregation (rejected global backbone update).
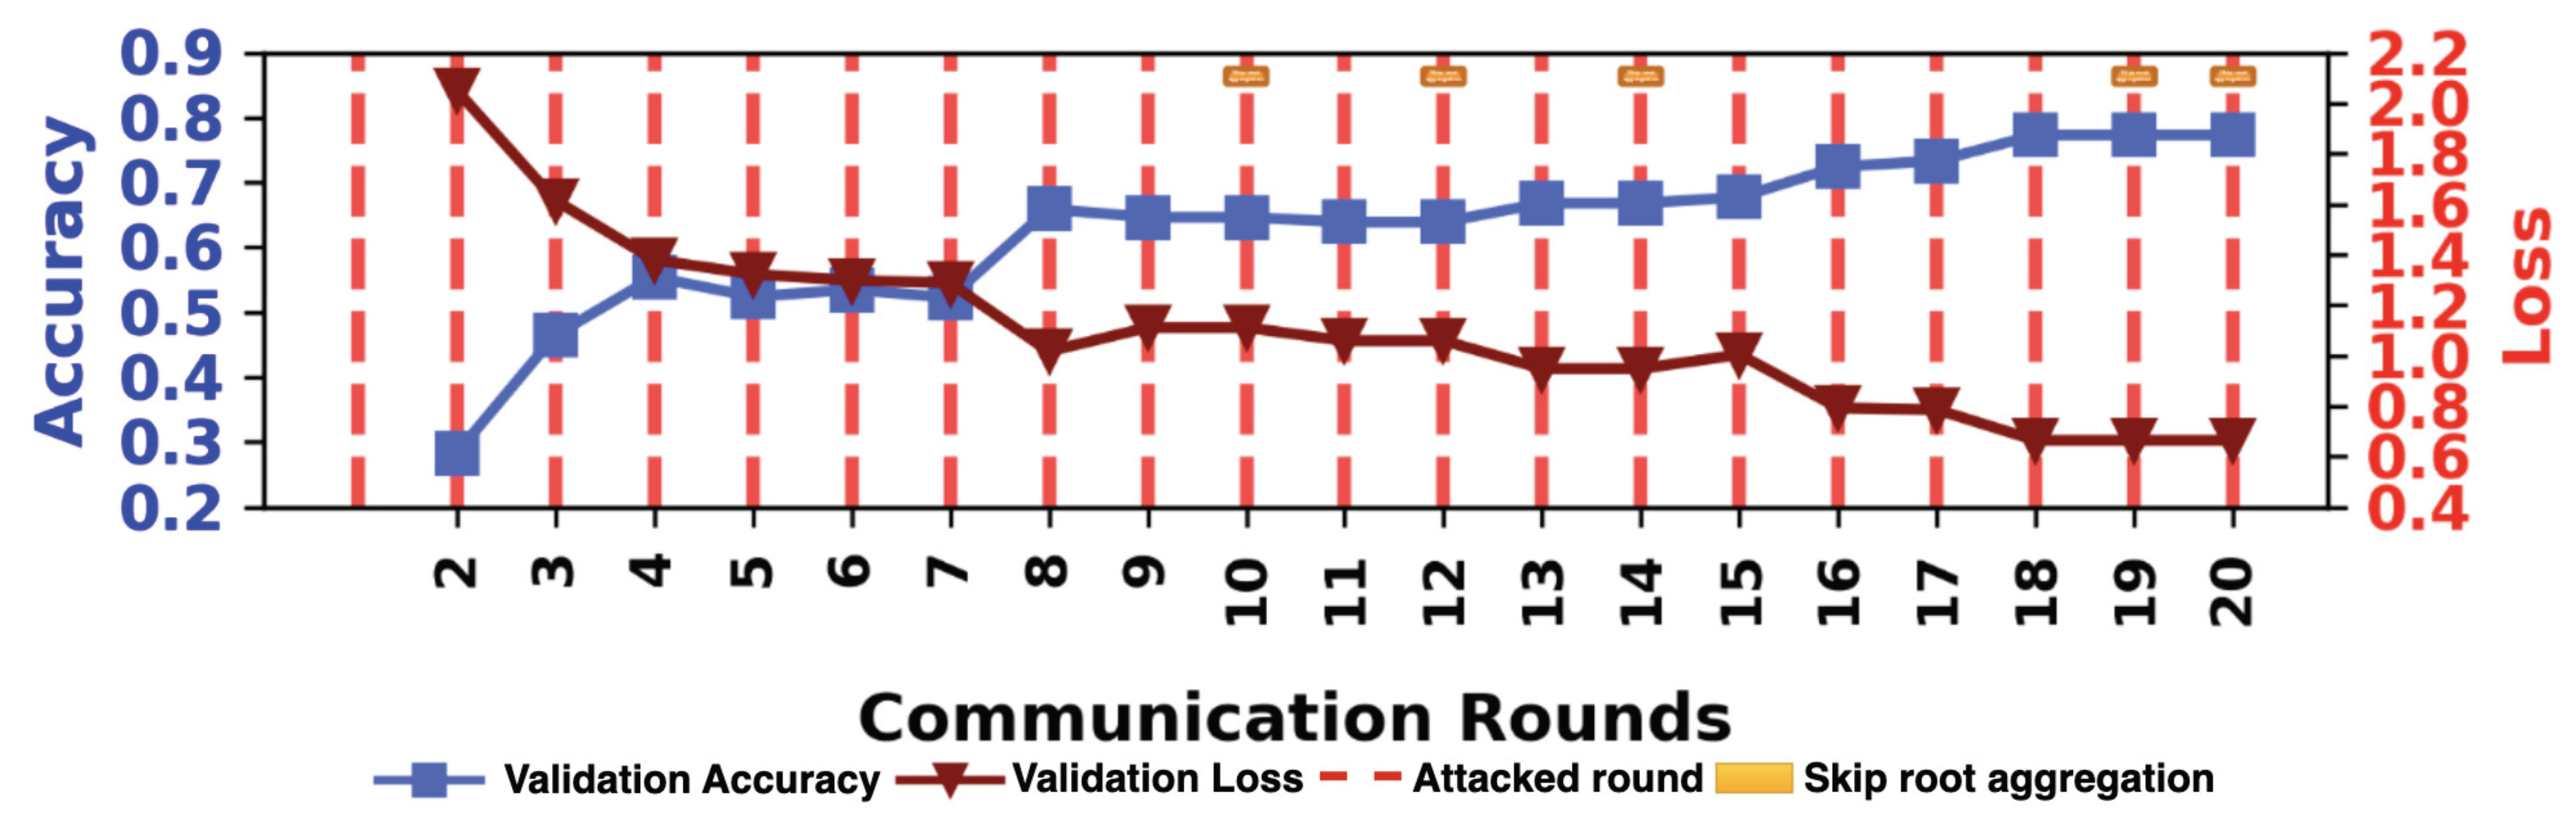
Figure 17.
Distribution of training and validation metrics for normal vs. attacked clients and nodes under defended training (pooled over all rounds). Dual y-axes: accuracy (left, blue) and loss (right, red). Red line: median; black triangle: mean; circles: outliers.
Figure 17.
Distribution of training and validation metrics for normal vs. attacked clients and nodes under defended training (pooled over all rounds). Dual y-axes: accuracy (left, blue) and loss (right, red). Red line: median; black triangle: mean; circles: outliers.
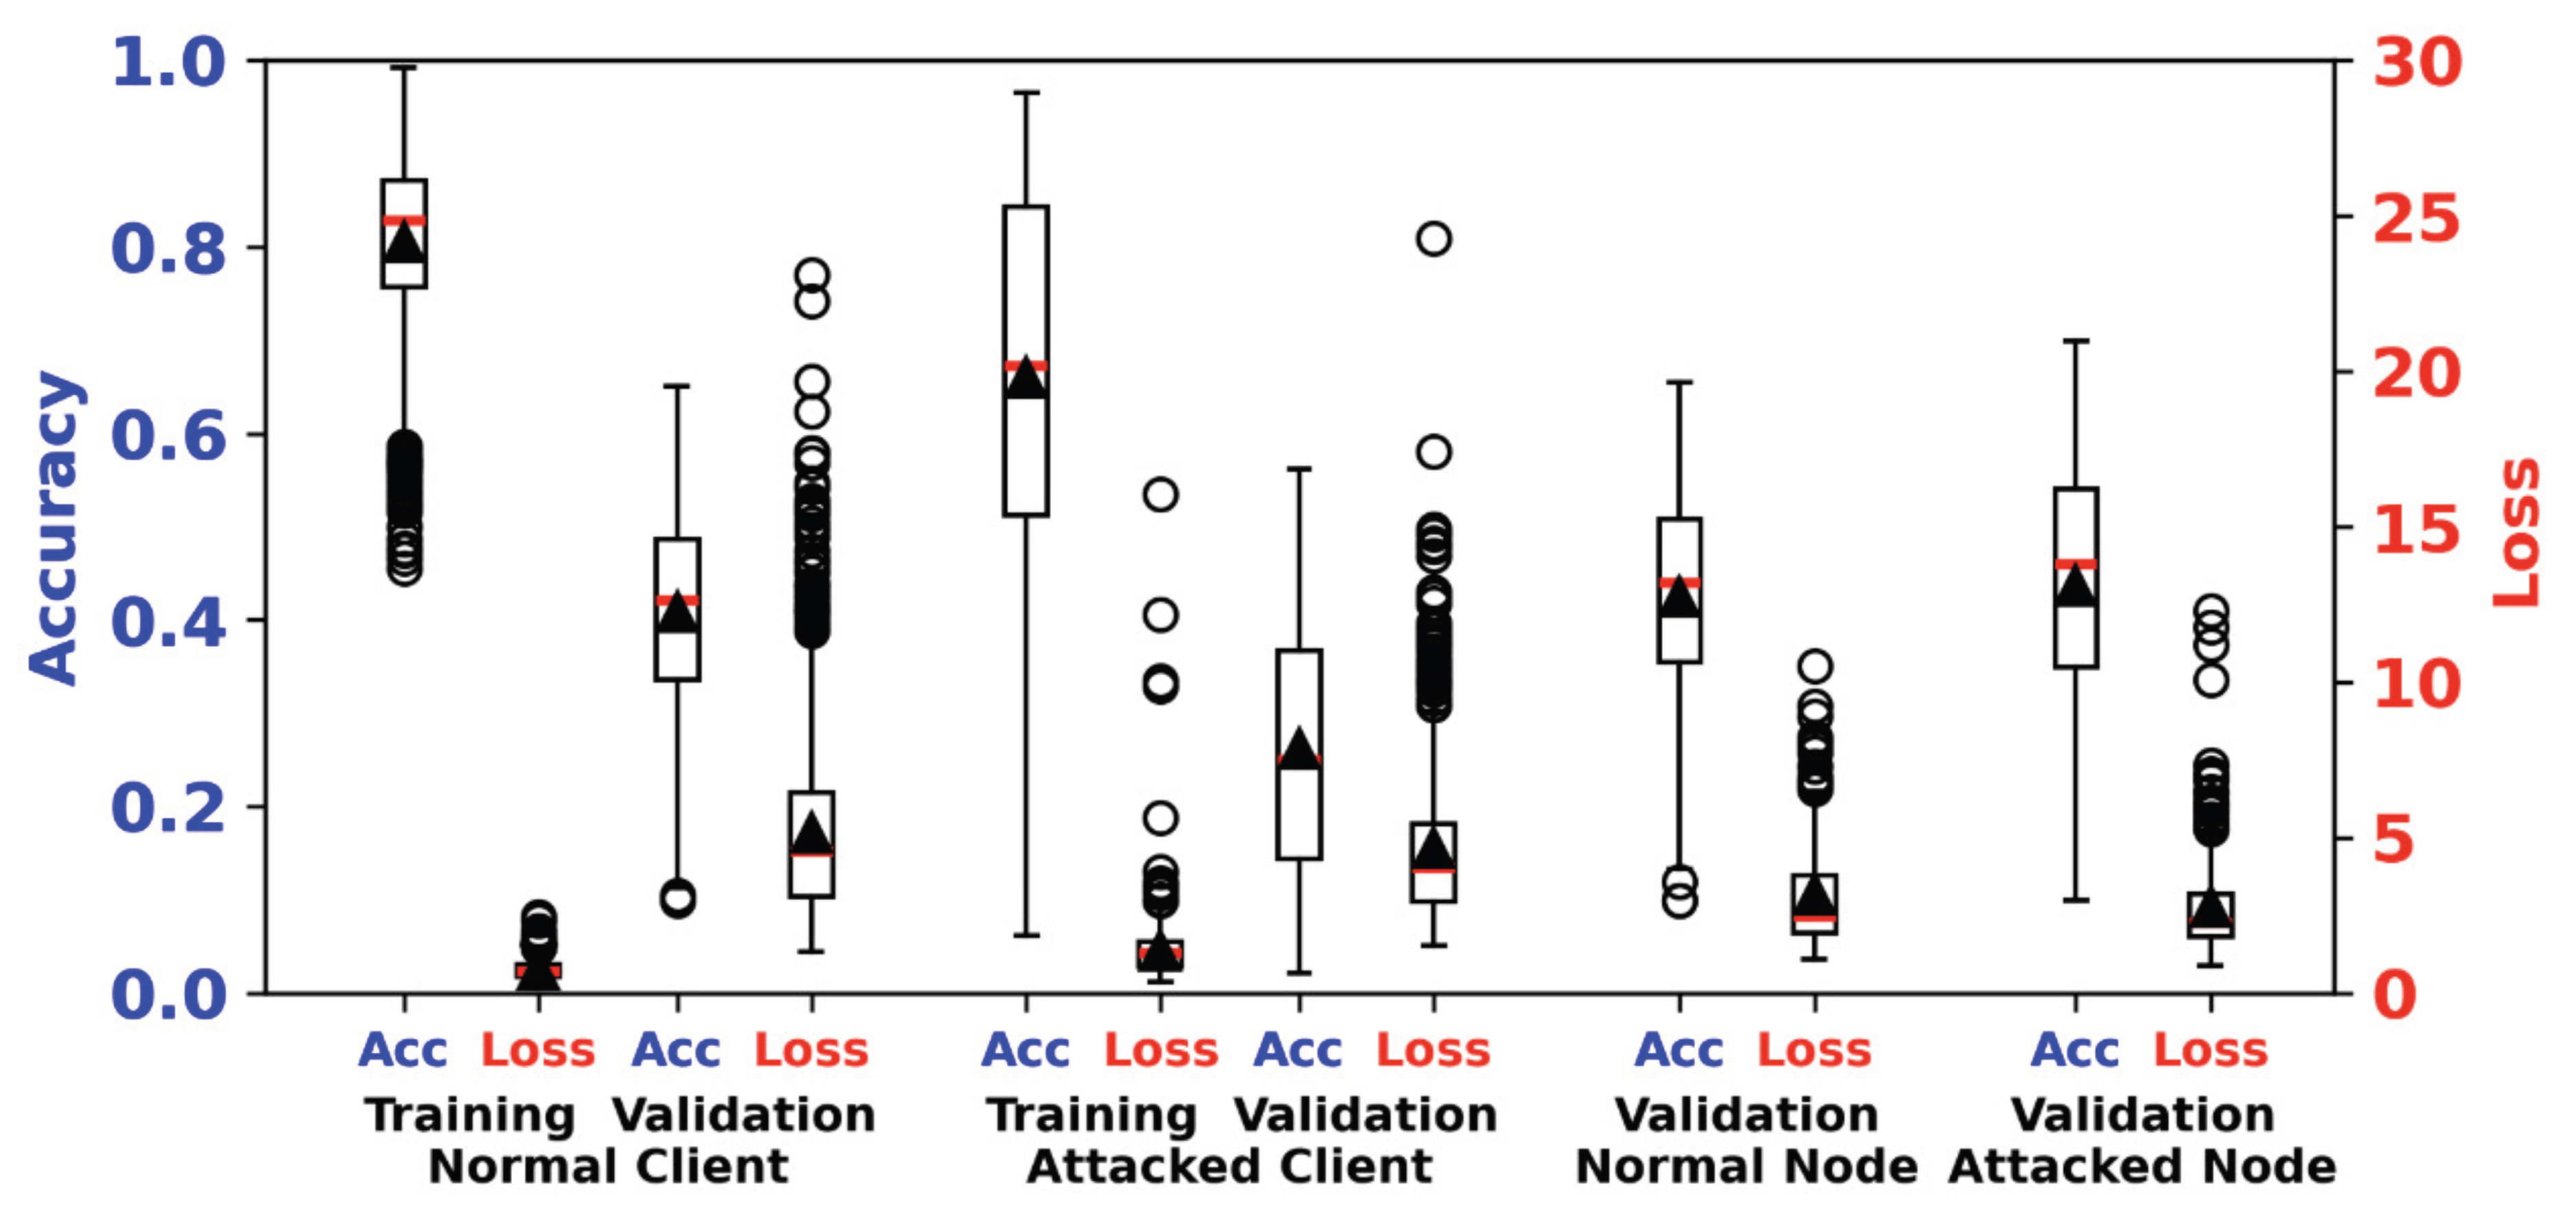
Figure 18.
Attack and quarantine timeline for the defended scenario. Rows: five attack types, total attacked clients, and total quarantined clients per round. Columns: communication rounds 1–20; color scale: mean attack severity (%). Cell labels: targeted client counts per attack type.
Figure 18.
Attack and quarantine timeline for the defended scenario. Rows: five attack types, total attacked clients, and total quarantined clients per round. Columns: communication rounds 1–20; color scale: mean attack severity (%). Cell labels: targeted client counts per attack type.
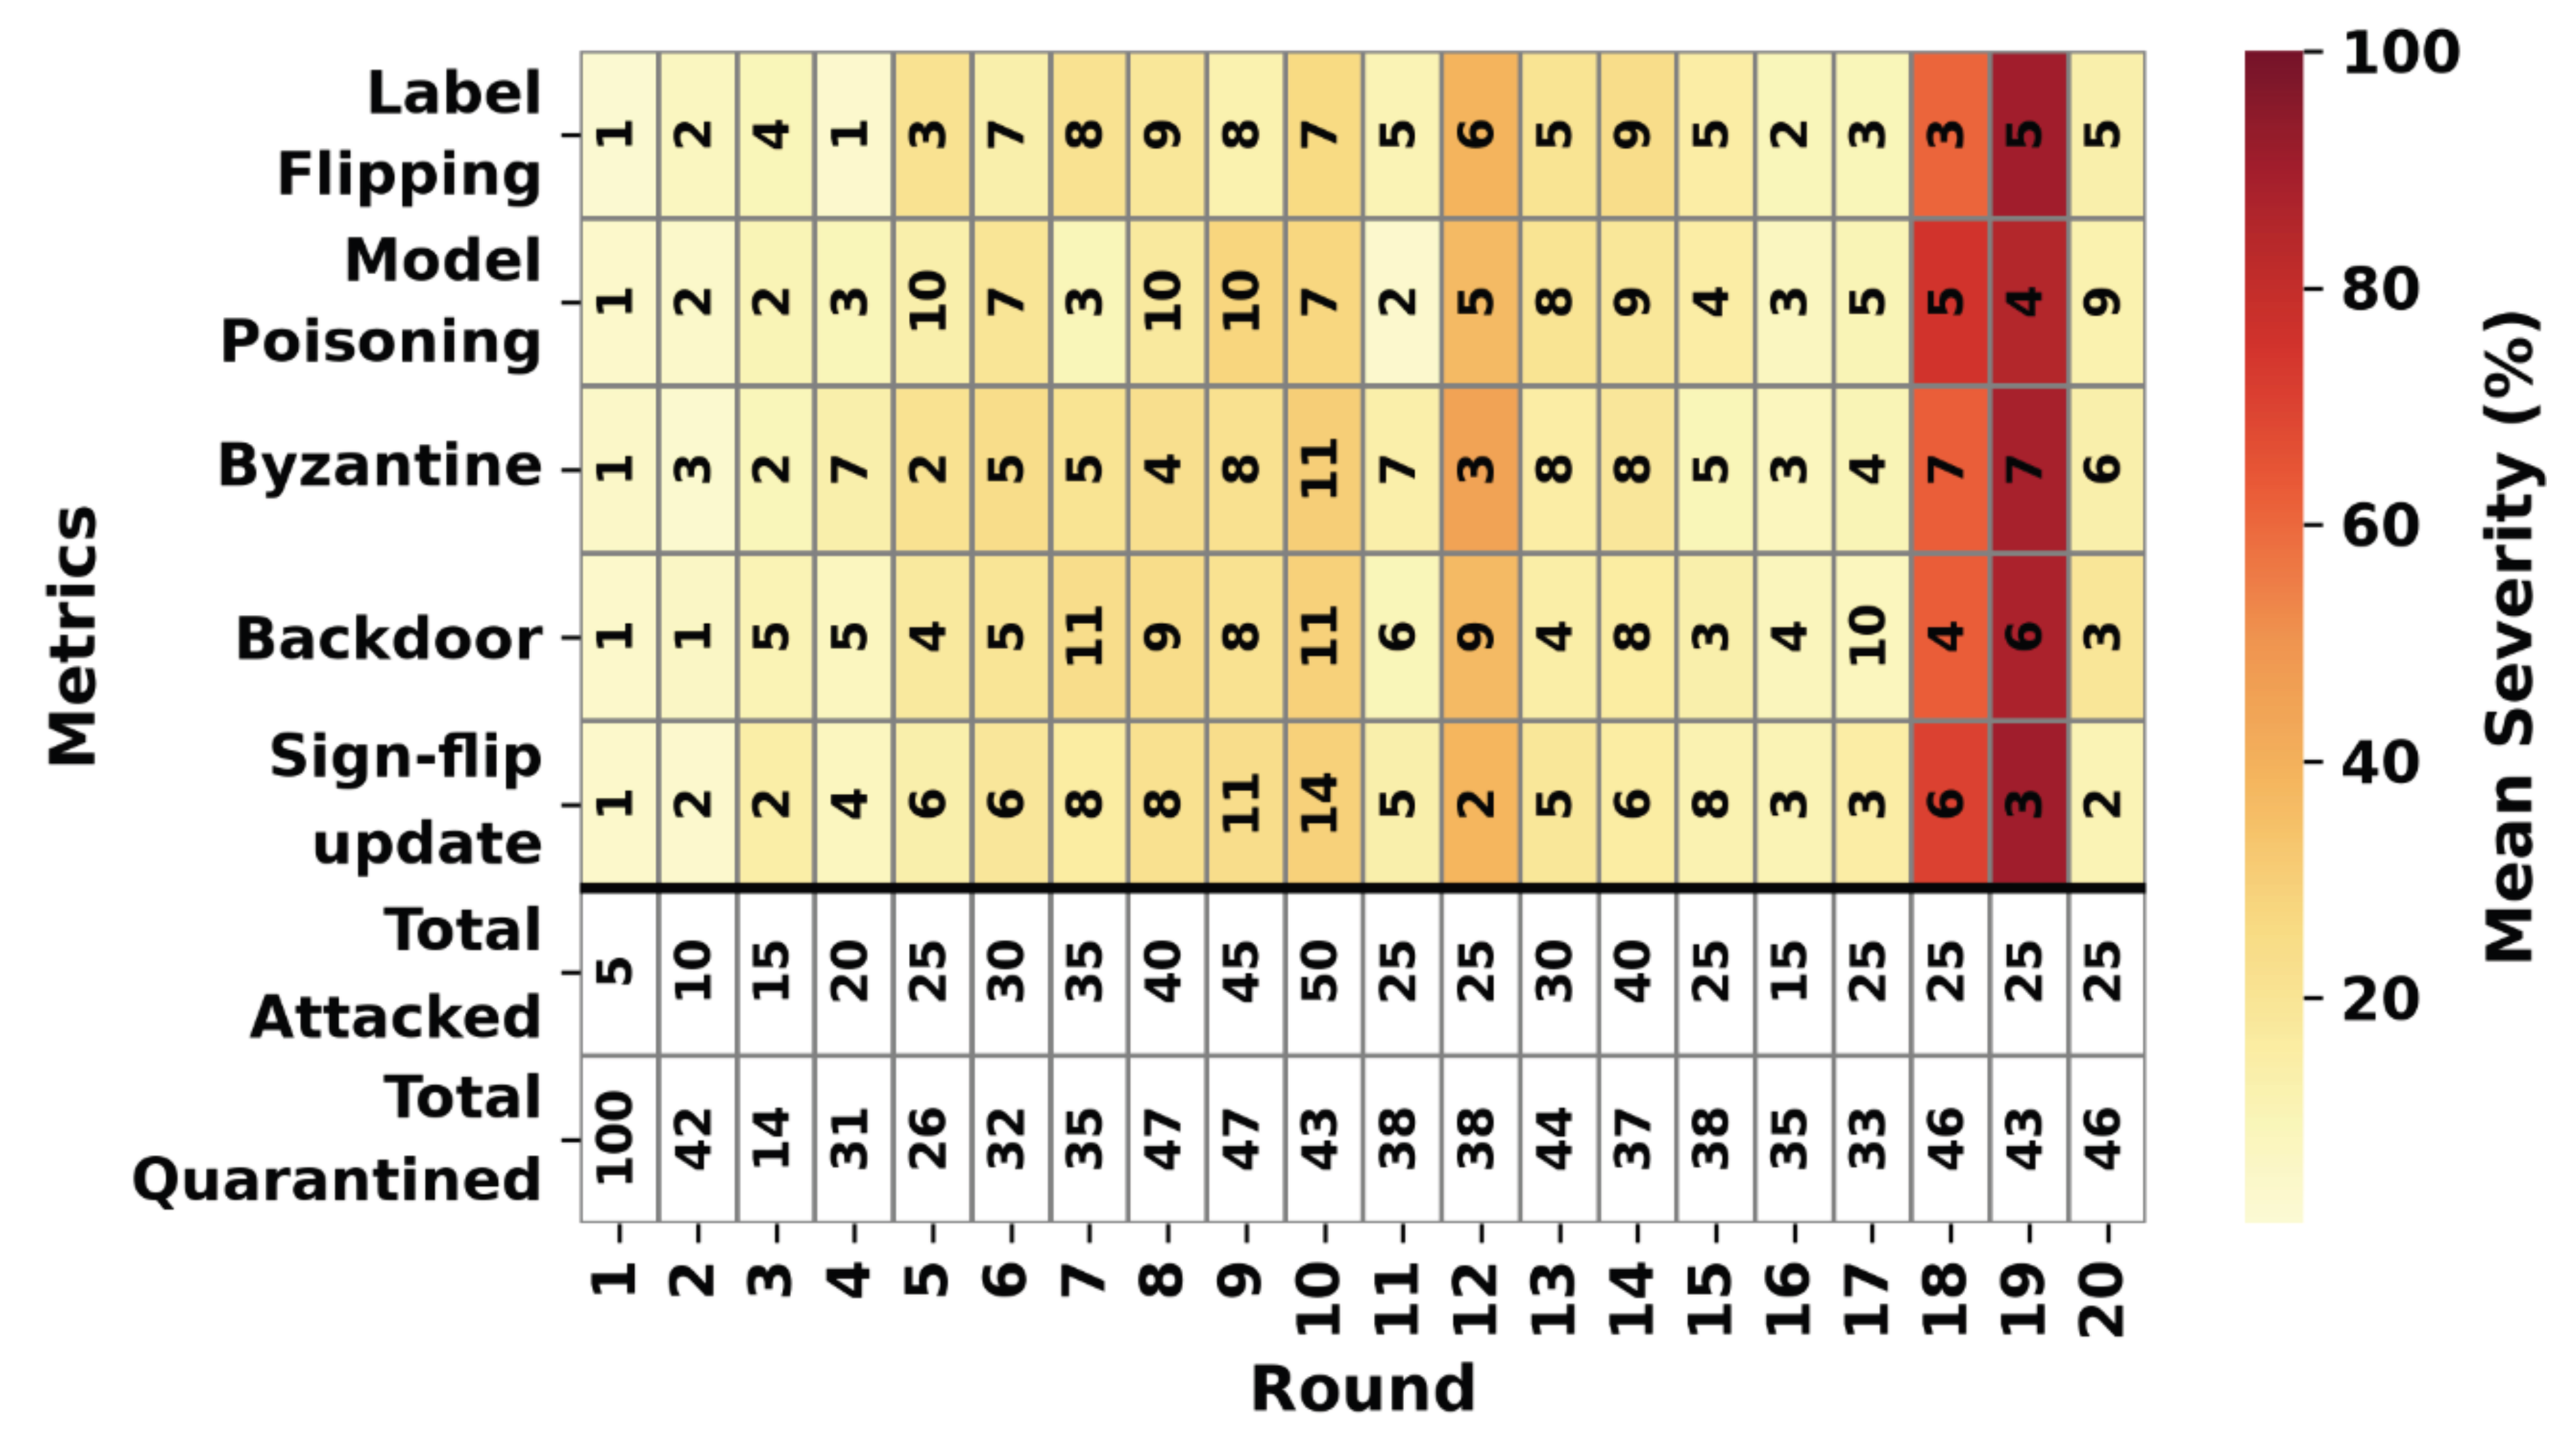
Figure 19.
Repeated k-fold validation accuracy and loss for the frozen defended FedPer model (50 folds: 5-fold × 10 repeats). Red line: median; black triangle: mean.
Figure 19.
Repeated k-fold validation accuracy and loss for the frozen defended FedPer model (50 folds: 5-fold × 10 repeats). Red line: median; black triangle: mean.
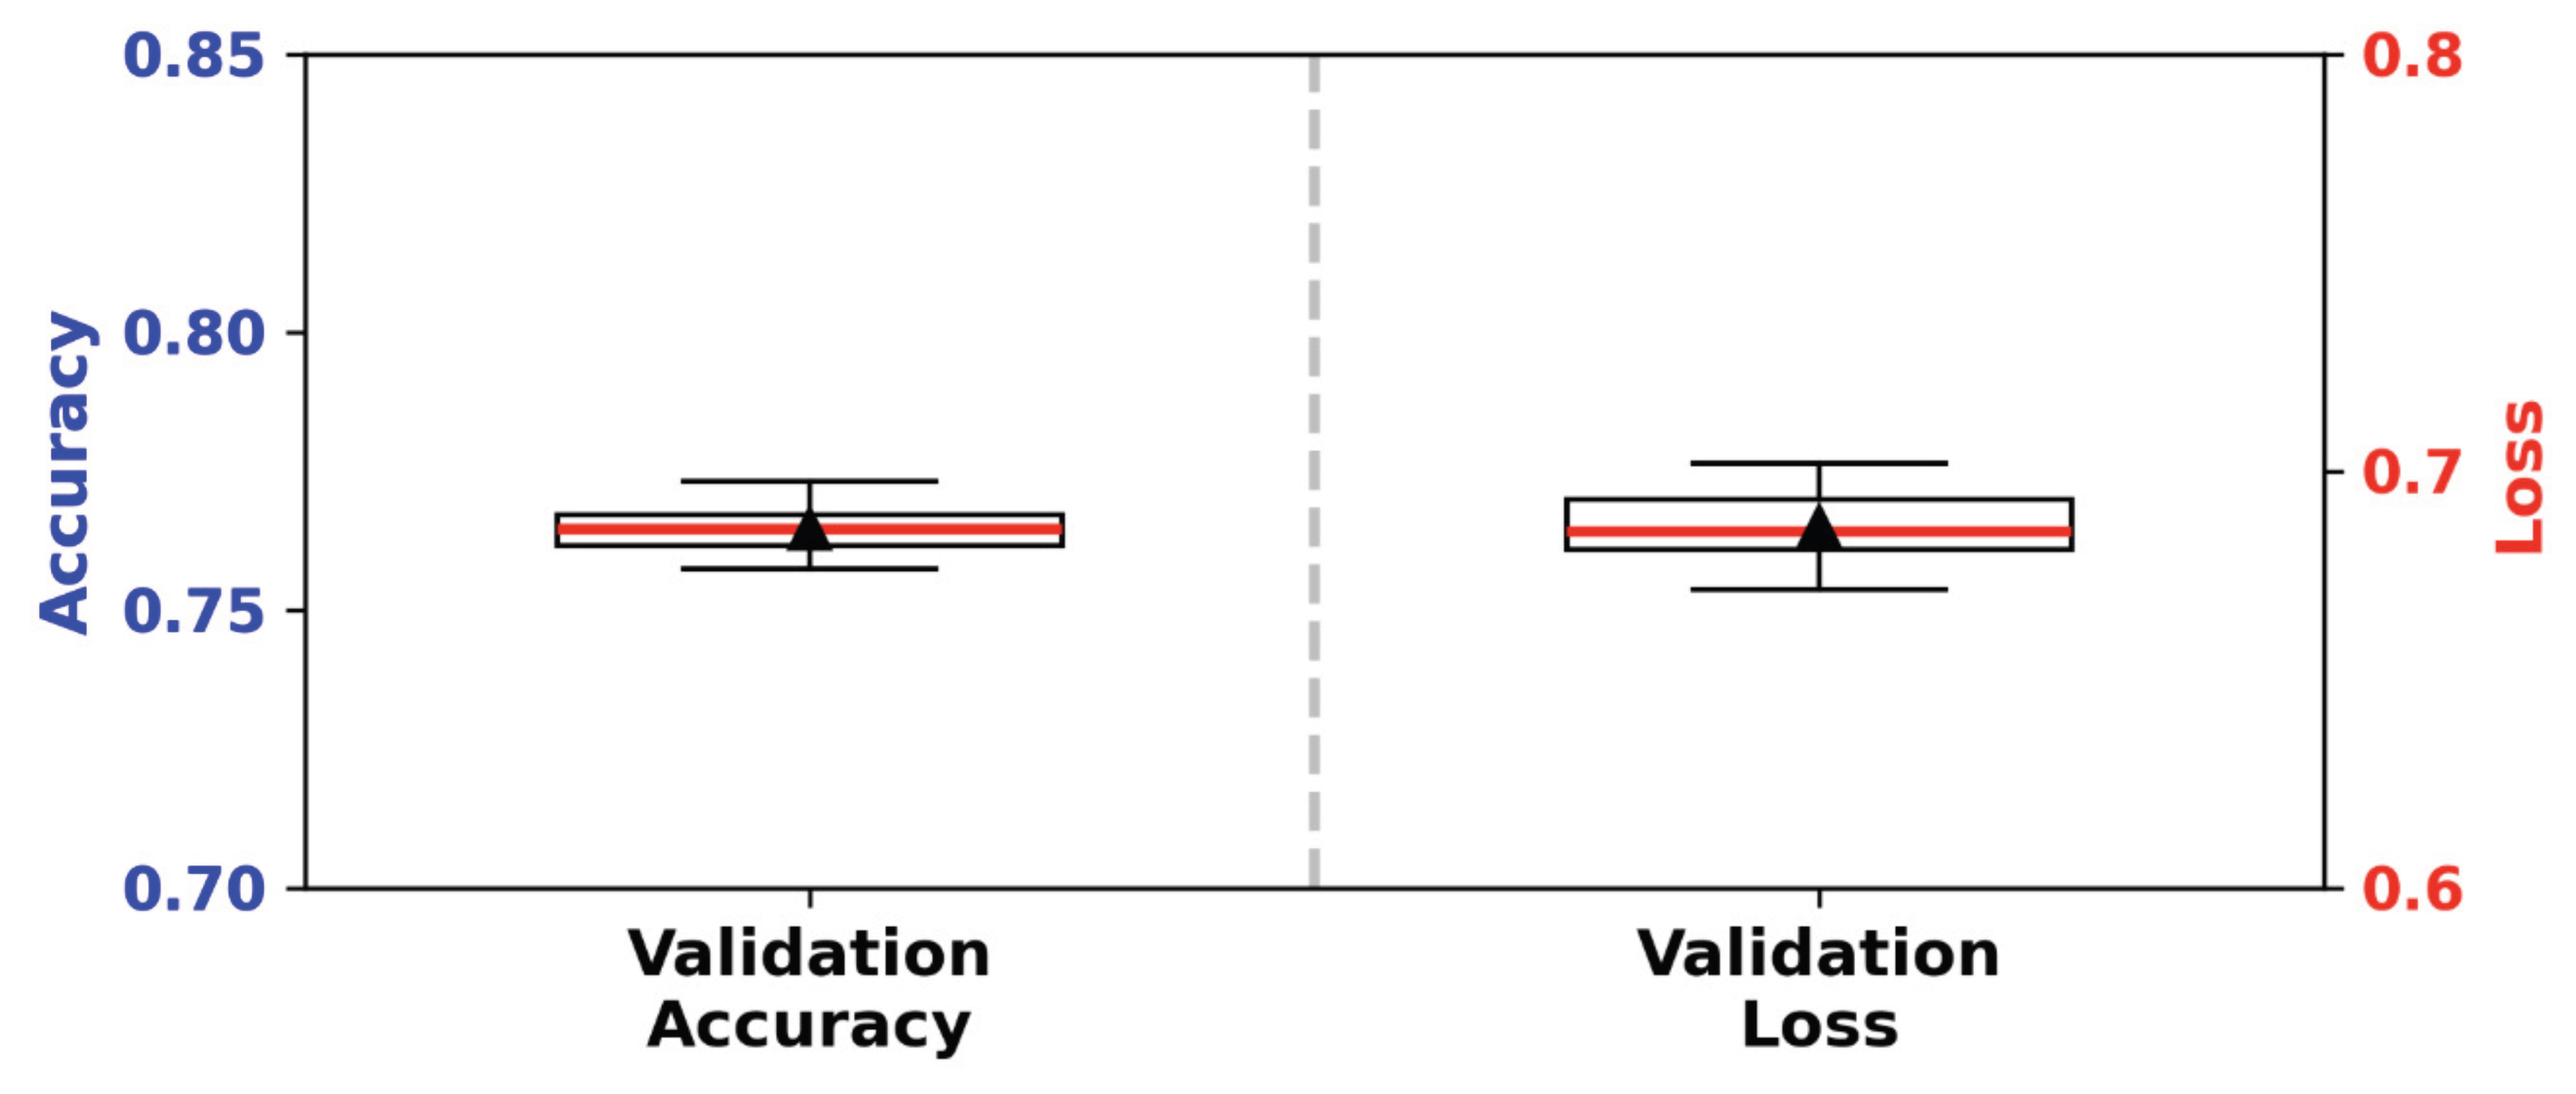
Figure 20.
Mean k-fold confusion matrix after defended training (aggregated over 50 validation folds). Cell values: mean predicted counts per true class.
Figure 20.
Mean k-fold confusion matrix after defended training (aggregated over 50 validation folds). Cell values: mean predicted counts per true class.
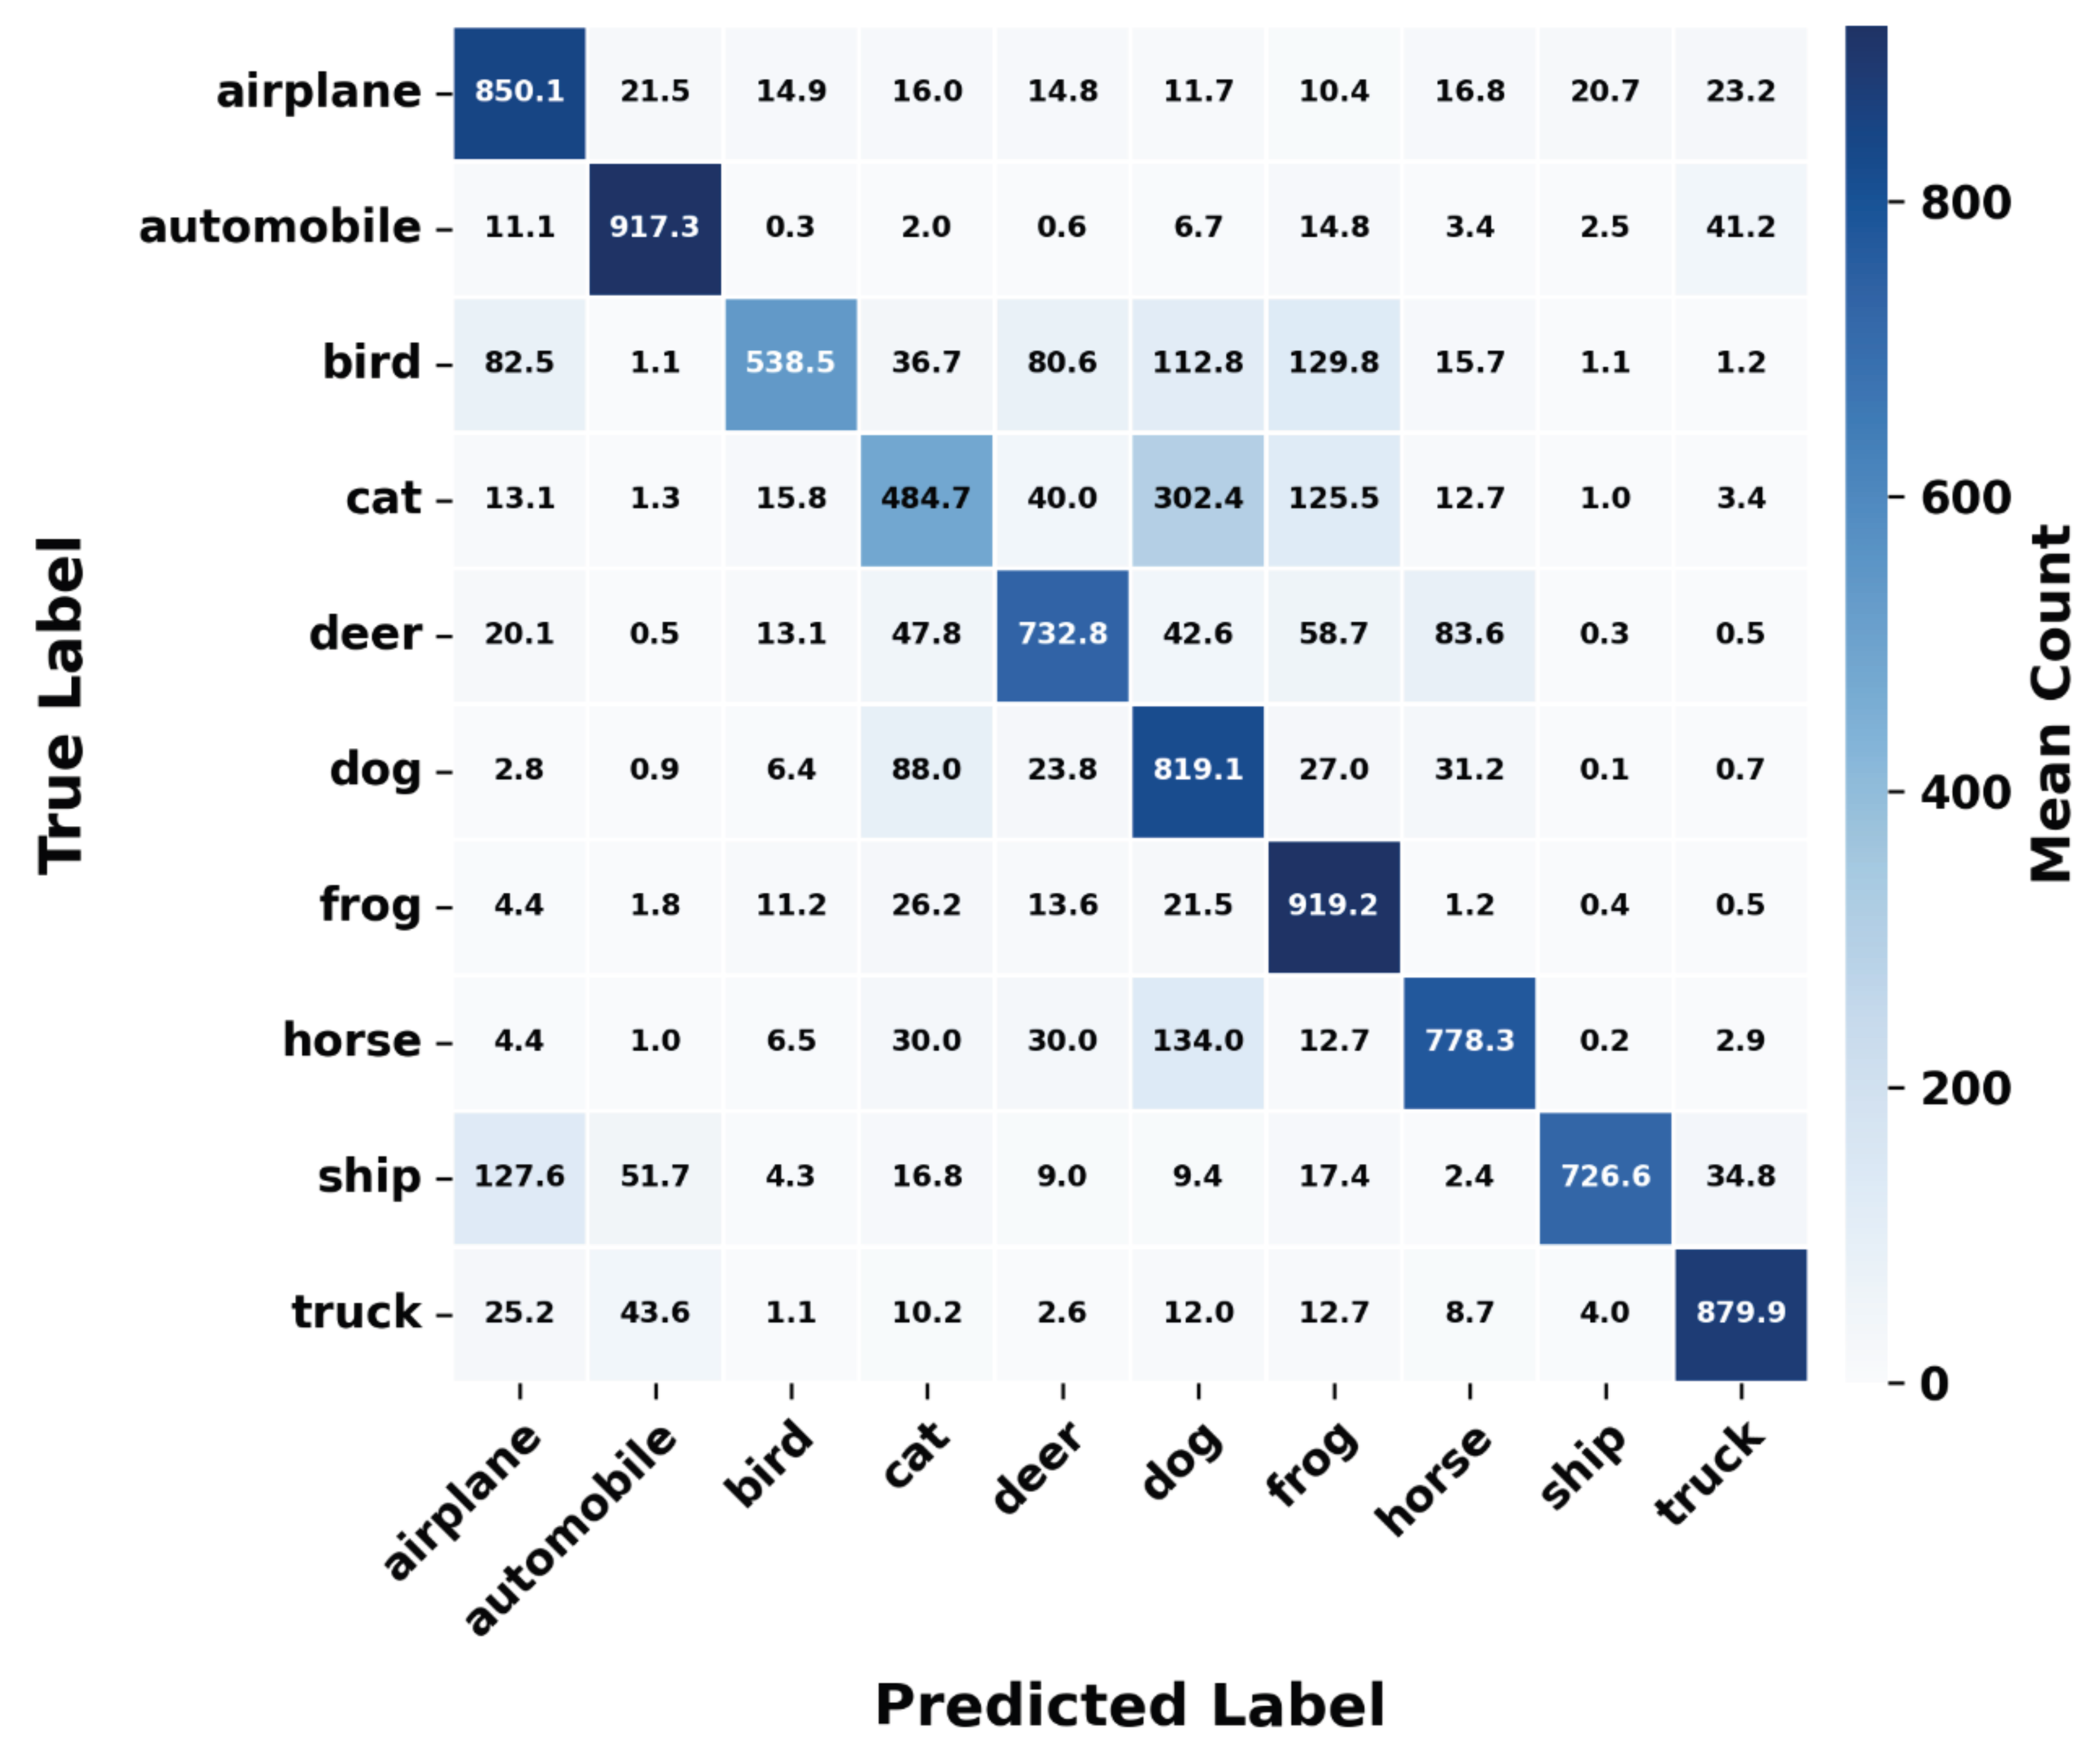
Table 1.
Comparison of representative poisoning defenses on CIFAR-10. Columns: Attack—threat type; Acc. with defense—reported accuracy under attack with the defense enabled; Hierarchy—whether the method uses hierarchical aggregation; Non-IID ()—client data split (IID, Dirichlet Non-IID with concentration , or not reported).
Table 1.
Comparison of representative poisoning defenses on CIFAR-10. Columns: Attack—threat type; Acc. with defense—reported accuracy under attack with the defense enabled; Hierarchy—whether the method uses hierarchical aggregation; Non-IID ()—client data split (IID, Dirichlet Non-IID with concentration , or not reported).
| Method | Year | Attack | Acc. with defense | Hierarchy | Non-IID () |
| Sundar et al. [27] | 2025 | Backdoor | 82.9% | No | Not reported |
| RECESS [28] | 2023 | Model poison | 60.4% | No | Not reported |
| SHIELD [7] | 2025 | Poisoning | 60.58% | Yes | IID & Non-IID () |
| BOD-hybrid [31] | 2025 | Backdoor | 78.2% | No | IID & Non-IID |
| FeRA [32] | 2025 | DBA backdoor | 86.1% | No | Not reported |
| FLAIR [33] | 2023 | Untargeted | 66.9% | No | Not reported |
| Bagdasaryan et al. [3] | 2020 | Model-repl. | ∼80% | No | Not reported |
| FLVaccin (ours) | 2026 | Mixed (5) | 76.5%† | Yes | Non-IID () |
Mixed (5): label flip, backdoor, model poison, Byzantine, and sign-flip. †5-fold×10 k-fold after 535 attacks with quarantine.
Table 3.
Quarantine notation: symbols, meaning, and role in the defense.
| Symbol | Meaning |
| , | Client i’s training accuracy and loss after round t (validation metrics computed on the full CIFAR-10 test set) |
| , | Round-over-round relative change in accuracy and loss (Eq. (7)); positive means improvement |
| Maximum tolerated drop for client i in round t; quarantine triggers if any trend falls below | |
| Largest benign relative accuracy swing from the 30-run vaccination calibration (Section 4.2); upper bound on legitimate metric movement | |
| , | Allowed drops at the shallowest hosted level (, near the root) and at the deepest level () in round t |
| , , | Tree level of the node hosting client i; maximum level in the tree; normalized depth (0 at root, 1 at deepest) |
| Maps depth and round to client i’s allowance by linear interpolation between the root and deep endpoints (Eq. (6)) |
Table 4.
Summary of experimental scenarios and key outcomes.
| Scenario | Attacks | Defense | Test Acc | Repeated K-fold Acc |
| Vaccination mean | 0 | Off | — | 30.8% (round-1 mean) |
| Normal baseline | 0 | Off | 79.9% | |
| Free attack | 130 | Off | 21.0% | |
| Attack + defense | 535 | Vaccination + quarantine | 77.3% |
Table 5.
Repeated k-fold validation statistics for the clean baseline (5-fold × 10 repeats, 50 folds; frozen global shared backbone with per-client heads).
Table 5.
Repeated k-fold validation statistics for the clean baseline (5-fold × 10 repeats, 50 folds; frozen global shared backbone with per-client heads).
| Metric | Mean ± Std | 95% CI | p-value |
| Validation accuracy | [79.87, 80.11] | ||
| Validation loss | [0.588, 0.595] |
Table 6.
Repeated k-fold validation statistics after free-attack training (5-fold × 10 repeats, 50 folds; frozen global shared backbone with per-client heads).
Table 6.
Repeated k-fold validation statistics after free-attack training (5-fold × 10 repeats, 50 folds; frozen global shared backbone with per-client heads).
| Metric | Mean ± Std | 95% CI | p-value |
| Validation accuracy | [19.90, 20.14] | ||
| Validation loss | [2.319, 2.322] |
Table 7.
Repeated k-fold validation statistics after defended training (5-fold × 10 repeats, 50 folds; frozen global shared backbone with per-client heads).
Table 7.
Repeated k-fold validation statistics after defended training (5-fold × 10 repeats, 50 folds; frozen global shared backbone with per-client heads).
| Metric | Mean ± Std | 95% CI | p-value |
| Validation accuracy | [76.35, 76.58] | ||
| Validation loss | [0.685, 0.689] |
Disclaimer/Publisher’s Note: The statements, opinions and data contained in all publications are solely those of the individual author(s) and contributor(s) and not of MDPI and/or the editor(s). MDPI and/or the editor(s) disclaim responsibility for any injury to people or property resulting from any ideas, methods, instructions or products referred to in the content. |
© 2026 by the authors. Licensee MDPI, Basel, Switzerland. This article is an open access article distributed under the terms and conditions of the Creative Commons Attribution (CC BY) license (http://creativecommons.org/licenses/by/4.0/).
Copyright: This open access article is published under a Creative Commons CC BY 4.0 license, which permit the free download, distribution, and reuse, provided that the author and preprint are cited in any reuse.