

Submitted:
27 July 2026
Posted:
29 July 2026
You are already at the latest version
Abstract
Extreme heat is an escalating climate-health hazard in the United States. However, its health effects remain uneven because exposure intersects with housing quality, energy insecurity, chronic illness, outdoor work, transportation barriers, limited tree canopy, and historical disinvestment. This study combines an integrative evidence synthesis with an exploratory ecological secondary analysis of publicly reported Centers for Disease Control and Prevention data for the 10 U.S. Department of Health and Human Services regions. The analysis examined regional mean warm-season 2023 heat-related illness emergency department (HRI ED) visit rates, 2018–2022 baseline rates, and the number of 2023 days above each region’s historical 95th percentile. Elevated day counts and 2023 regional rates were strongly correlated (Pearson r = 0.874, p = 0.001; Spearman rho = 0.924, p < 0.001), as were baseline and 2023 rates (Pearson r = 0.938, p < 0.001). Conventional ordinary least squares models showed strong associations, but heteroscedasticity-robust estimates and influence diagnostics indicated that the adjusted elevated-day coefficient was unstable in this small sample. The analysis therefore demonstrates regional clustering in the surveillance measures rather than causal or independently predictive effects. The evidence synthesis supports a five-pillar framework linking hazard anticipation, social vulnerability mapping, targeted intervention, adaptive risk communication, and ethical governance. Artificial intelligence can strengthen heat-risk management when it is locally validated, transparent, privacy-protective, and connected to funded interventions such as functional cooling, energy assistance, worker protections, transportation, wellness checks, resilient housing, and urban heat mitigation. AI should operate as accountable decision support rather than replace operational meteorology, public-health expertise, or community knowledge.
Keywords:
artificial intelligence
; extreme heat
; climate risk management
; social vulnerability
; public health
; early warning
; environmental justice
; United States
1. Introduction
Extreme heat has moved from the margins of climate policy to the center of public-health and resilience planning in the United States. Across 50 large U.S. cities, average heatwave frequency rose from approximately two events per year in the 1960s to approximately six per year in the 2010s and 2020s, while the average heatwave season lengthened by 46 days (U.S. Environmental Protection Agency [EPA], 2024). Recent average heatwaves in these cities last about four days. These trends show that extreme heat is no longer an occasional summer inconvenience; it is a recurring climate risk that tests health systems, housing, labor protections, emergency management, energy affordability, and local government capacity.
Heat also produces measurable health harm. Howard et al. (2024) identified 21,518 U.S. deaths recorded with heat as an underlying or contributing cause from 1999 through 2023. Annual deaths increased from 1,069 in 1999 to 2,325 in 2023, a 117% increase in the count and a 63% increase in the age-adjusted mortality rate. Mortality is only part of the burden. Emergency department surveillance during the 2023 warm season showed substantial elevations in heat-related illness, particularly among males and adults aged 18–64 years (Vaidyanathan et al., 2024). This pattern extends heat-risk planning beyond older adults to working-age populations whose jobs, housing, transportation, or recreational exposure increase risk.
The challenge is not only that the United States is becoming hotter. Heat is socially mediated. Two neighborhoods can receive the same forecast and experience very different outcomes because residents differ in housing quality, air-conditioning functionality, ability to pay utility bills, health status, occupation, transportation, social support, and trust in public institutions. The CDC/ATSDR Social Vulnerability Index (SVI) operationalizes demographic and socioeconomic conditions that influence how communities experience hazards, including poverty, crowded housing, disability, language barriers, and limited vehicle access (CDC/ATSDR, 2024). A heatwave becomes a disaster when hazardous conditions intersect with sensitivity and constrained adaptive capacity.
Maricopa County, Arizona, illustrates the practical consequences. The county recorded 608 heat-related deaths in 2024, down from 645 in 2023 (Maricopa County Department of Public Health, 2025). Among indoor deaths in 2024, 88% of decedents had an air-conditioning unit present, but 70% of those units were not functioning. In addition, 51% of all heat-related deaths occurred on days classified as moderate rather than extreme by HeatRisk. These findings challenge two assumptions: nominal air-conditioning access does not guarantee protection, and fatal outcomes are not confined to the most severe warning category. Functional cooling, affordability, indoor conditions, social isolation, and locally relevant thresholds must be part of heat-risk management.
Heatwave resilience is defined here as the capacity of individuals, households, infrastructure, institutions, and communities to anticipate, withstand, respond to, and recover from extreme heat while reducing future risk. This definition includes preparedness before an event, protection during exposure, recovery after harm, and structural adaptation. It also recognizes unequal starting conditions. People with secure housing, reliable electricity, functioning cooling, paid leave, private transportation, healthcare, and social support can act on warnings more readily than people without those resources. A technically accurate resilience strategy can therefore remain inequitable if it fails to address who can use the information and who receives material protection.
The built environment embeds these disparities. Urban heat islands arise from impervious surfaces, dark roofs, building mass, limited vegetation, and anthropogenic heat. Across 108 U.S. urban areas, formerly redlined “D”-rated neighborhoods were approximately 2.6°C warmer in land-surface temperature than “A”-rated neighborhoods (Hoffman et al., 2020). Across 5,723 urban communities, low-income blocks had 15.2% less tree cover and were 1.5°C hotter than high-income blocks (McDonald et al., 2021). Household energy insecurity compounds these conditions: 34 million U.S. households, or 27%, reported difficulty meeting energy needs or maintaining safe indoor temperatures because of cost in 2020 (U.S. Energy Information Administration [EIA], 2022). These patterns connect present heat exposure to housing discrimination, disinvestment, unequal green infrastructure, and constrained household resources.
Regional scholarship by Damoah and colleagues provides a useful bridge between broad climate-risk analysis and the operational demands of heat resilience. Damoah et al. (2024) describe how industrial development, urbanization, ecosystem loss, and infrastructure pressures compound climate vulnerability across the U.S. Gulf Coast. Damoah and Khalo (2024) connect extreme-temperature variability in Mississippi with health, livelihoods, infrastructure, and adaptation needs. Damoah (2026) then shows that Gulf Coast early-warning practice often separates hazard information from ecosystem conditions, social vulnerability, accessible communication, and response activation. Read together, this body of work supports a regional, end-to-end approach in which climate intelligence is judged by whether it reaches exposed populations and enables feasible action.
The literature relevant to AI-enabled heatwave resilience can be organized into four connected streams: heat-health epidemiology, the social and spatial production of vulnerability, heat-action and warning systems, and AI-supported climate-risk decision-making. These streams have developed unevenly. Epidemiological studies provide strong evidence of health burden, environmental-justice research explains why exposure and adaptive capacity differ across places, and forecasting research has advanced rapidly. The weaker connection lies between these knowledge bases and the institutional mechanisms that convert a warning or risk score into material protection.
The heat-health literature consistently links extreme heat with mortality and multiple forms of morbidity. A systematic review by Arsad et al. (2022) found elevated mortality and morbidity across age groups and identified socioeconomic disadvantages, chronic disease, rural location, and demographic characteristics as important vulnerability factors. U.S. studies add clinical specificity: extreme heat is associated with adult emergency visits for renal disease, mental disorders, and other causes, higher pediatric emergency use, rising heat-related mortality, and severe burdens among people experiencing homelessness (Bernstein et al., 2022; Howard et al., 2024; Sun et al., 2021; Weckstein et al., 2025). This evidence supports multi-outcome surveillance but also shows why heat vulnerability cannot be reduced to a single age category or diagnosis.
A second literature stream locates heat risk in the built environment and in unequal access to adaptive resources. Research on redlining, tree canopy, urban heat islands, energy insecurity, and power outages demonstrates that heat exposure is produced by land-use decisions, housing quality, infrastructure investment, and household affordability (Andresen et al., 2023; Hoffman et al., 2020; Hsu et al., 2021; McDonald et al., 2021). More recent evidence from Los Angeles indicates that contemporary income inequality can be at least as consequential as historical redlining for present thermal disparities (Shreevastava et al., 2025). The implication for AI is methodological as well as ethical: vulnerability models should represent current service and housing conditions rather than rely only on static demographic indices.
A third stream examines heat action plans, warning thresholds, and public communication. A review of 21 local U.S. heat action plans found that jurisdictions commonly included activation triggers, risk communication, cooling centers, surveillance, and interagency coordination, but implementation details and targeted strategies remained uneven (Randazza et al., 2023). A 2025 systematic review of heat-health warning systems similarly concluded that systems rely heavily on temperature-based thresholds and should incorporate local epidemiology, built-environment conditions, and population-specific vulnerability (Chandra N and Lee, 2025). Evidence linking HeatRisk categories with emergency department burden supports impact-based warning, but warning effectiveness still depends on whether messages identify concrete actions and available services (Muscatiello et al., 2025). Communication also becomes more difficult during compound events such as heat and wildfire smoke, when protective guidance can conflict or remain incomplete (Coker et al., 2024).
The fourth stream concerns AI and climate resilience. Systematic reviews show rapid growth in AI applications but also a concentration in hazard prediction, agriculture, and infrastructure rather than health, implementation, or governance. In Ayadi et al. (2025), health represented only a small fraction of the 385 studies reviewed, while transparency, data access, geographic imbalance, and equitable deployment remained persistent concerns. Mehryar et al. (2024) likewise found that AI for climate adaptation emphasizes hazard and exposure assessment more than vulnerability reduction, prioritization, implementation, and institutional accountability. The forecasting literature confirms that machine learning can add speed and skill, yet it also documents physical-consistency problems, sensitivity to unprecedented extremes, and contexts in which physics-based models perform better (Bonavita, 2024; Lam et al., 2023; Price et al., 2025; Zhang et al., 2026).
Taken together, the literature reveals three gaps. First, heat-health evidence and AI forecasting are rarely joined to an explicit intervention pathway. Second, vulnerability mapping often identifies high-risk places without specifying which institution must act, what resource should be mobilized, or how access will be verified. Third, model evaluation commonly prioritizes predictive accuracy over service reach, distributive fairness, and health outcomes. The present study addresses these gaps by treating AI as one component of an accountable climate-risk management system rather than as an autonomous solution.
Artificial intelligence (AI) can help integrate environmental, health, social, infrastructure, and service data. Machine-learning systems can support probabilistic forecasting, map neighborhood heat exposure, detect emerging health burdens, identify gaps in cooling access, prioritize outreach, and tailor warnings. Recent systems such as GraphCast and GenCast demonstrate substantial speed and skill in medium-range weather prediction (Lam et al., 2023; Price et al., 2025). However, prediction is not protection. A model that forecasts temperature accurately but overlooks broken cooling systems, energy burden, outdoor labor, or social isolation has limited public value. Likewise, a high-resolution risk map that does not trigger transportation, home repair, utility assistance, or wellness checks remains an analytic product rather than a resilience intervention.
This study asks how AI can support equitable heatwave resilience in high-risk U.S. communities without obscuring uncertainty or institutional responsibility. It makes three contributions. First, it synthesizes current evidence on the climatic, health, infrastructural, occupational, and historical production of heat vulnerability. Second, it provides a transparent exploratory analysis of regional HRI ED surveillance measures to illustrate geographic clustering and the limitations of aggregate data. Third, it develops an equity-centered five-pillar climate risk management framework that links hazard anticipation to vulnerability profiles, interventions, communication, and governance. The central proposition is that AI should be judged by whether it helps accountable institutions reduce preventable harm, not only by predictive performance.
2. Materials and Methods
2.1. Study Design and Evidence Synthesis
The study used a mixed conceptual and quantitative design. The conceptual component was an integrative, purposive evidence synthesis rather than a systematic review. The review was organized around four literature streams: heat-health epidemiology; social and spatial vulnerability; heat-action plans, early warning, and risk communication; and AI-enabled forecasting, decision support, and governance. Sources were retained when they directly informed U.S. extreme-heat burden, vulnerability pathways, operational response, or the design and evaluation of AI-supported climate-risk management. Priority was given to peer-reviewed studies published from 2020 through 2026, supplemented by influential earlier work, official federal datasets, and local surveillance reports with verifiable quantitative information. The synthesis compared areas of convergence, disagreement, and omission across the literature and used exposure, sensitivity, adaptive capacity, institutional response, and responsible AI governance as organizing concepts.
Because the evidence review was not systematic, it did not use a preregistered protocol, exhaustive database search, duplicate screening, formal risk-of-bias tool, or meta-analysis. It should therefore be interpreted as an analytically structured review of representative evidence rather than a complete census of the field. No study counts, pooled effects, or formal evidence grades were inferred from this component. The approach was appropriate for theory building and operational framework development, but it cannot support claims about the prevalence or comparative quality of the entire literature; this limitation is addressed explicitly in the discussion.
2.2. Regional Data Source and Measures
The quantitative component used aggregate regional values published by Vaidyanathan et al. (2024) from the National Syndromic Surveillance Program. The unit of analysis was the U.S. Department of Health and Human Services (HHS) region (n = 10). The outcome was the mean warm-season 2023 HRI ED visit rate per 100,000 ED visits. The first predictor was the number of days in 2023 on which the regional HRI ED visit rate exceeded the region-specific 2018–2022 95th percentile. The second predictor was the 2018–2022 mean regional HRI ED visit rate, used as an indicator of preexisting regional burden. The 20 regional rate values were reconciled directly against Table 1 of the published MMWR report, and the 10 elevated-day totals were independently summed from the May–September 2023 entries in its Table 2. The verified values are reproduced in Table 1 and Supplementary Data 1.
The reported average of the 10 regional 2023 rates is an unweighted mean of regional values and is not a population-weighted national rate. Region 2 excludes Puerto Rico and the U.S. Virgin Islands because they did not report to the surveillance system in the cited analysis. No individual-level, identifiable, or restricted health records were accessed.
2.3. Statistical Analysis
The analysis calculated means, sample standard deviations, ranges, Pearson correlations, and Spearman rank correlations. Two ordinary least squares (OLS) models were estimated. Model 1 regressed the 2023 regional HRI ED rate on elevated HRI days. Model 2 added the 2018–2022 baseline rate. Tests were two-sided with alpha = 0.05. Conventional OLS standard errors are reported to reproduce the initial analysis, and HC3 heteroscedasticity-robust standard errors are reported because the sample is small and regional observations may have unequal residual variance. Calculations were reproduced in Python 3.13.5 with SciPy 1.17.0 and statsmodels 0.14.6, independently checked through direct matrix algebra, and protected by automated assertion tests in Supplementary File 1.
Residual normality, heteroscedasticity, leverage, and Cook’s distance were examined as descriptive diagnostics. Given n = 10, diagnostics have low power and coefficients can be strongly affected by single regions. The statistical analysis is therefore exploratory and ecological. It was not designed to estimate causal effects, predict individual risk, or validate an independent heat-exposure model. In particular, the outcome and elevated-day measure both derive from HRI ED surveillance, creating conceptual and statistical dependence that limits interpretation.
3. Results
3.1. Extreme Heat Burden and Structural Vulnerability
The evidence synthesis identified three interacting features of U.S. heat risk: increasing exposure, rising health burden, and unequal adaptive capacity. EPA indicators document more frequent and longer heatwaves in major cities, while the Fifth National Climate Assessment concludes that climate change affects every U.S. region and disproportionately burdens communities already facing social and environmental stressors (EPA, 2024; U.S. Global Change Research Program [USGCRP], 2023). Heat differs from visually destructive hazards because severe physiological stress, chronic-disease exacerbation, emergency care, and mortality can rise without obvious physical damage.
Mortality and morbidity evidence shows a broad and growing burden. Heat-related deaths increased markedly from 1999 to 2023 (Howard et al., 2024). Adult emergency department visits rise on extreme-heat days for heat-related illness, renal disease, mental disorders, and other causes (Sun et al., 2021). Higher warm-season temperatures are also associated with increased pediatric emergency department visits (Bernstein et al., 2022). Together, these findings support surveillance that extends beyond narrowly coded heat stroke and includes multiple clinical pathways and age groups.
Regional evidence identifies substantial geographic heterogeneity. HHS Region 6, which includes Arkansas, Louisiana, New Mexico, Oklahoma, and Texas, had the highest reported mean warm-season 2023 HRI ED visit rate and the greatest number of days above its historical threshold (Vaidyanathan et al., 2024). Hot climate, humidity, outdoor work, rapid urban growth, rural healthcare constraints, energy burden, and power disruption can converge in this region. Maricopa County shows a related local pattern in which severe mortality occurs through both outdoor exposure and failed indoor cooling (Maricopa County Department of Public Health, 2025).
Occupational and housing conditions broaden the at-risk population. In 2023, 33.0% of workers were regularly exposed to outdoor conditions as part of their job (Bureau of Labor Statistics [BLS], 2024). Construction, agriculture, logistics, sanitation, utilities, public safety, and airport operations can involve high heat, radiant exposure, exertion, and limited control over pace or rest. Heat alerts have limited protective value when workers cannot modify schedules or access water, rest, shade, acclimatization, and anti-retaliation protections.
People experiencing homelessness face direct exposure, limited hydration and sanitation, chronic illness, and few safe recovery spaces. National emergency department data show substantially higher heat-related illness among people experiencing homelessness than among housed populations (Weckstein et al., 2025). Protective mapping can guide mobile cooling, hydration, medical outreach, and transportation, but the same location data can enable displacement or punitive enforcement. The intended use and governance of risk data therefore form part of the intervention itself.
Indoor risk depends on affordability, building performance, and power reliability. Energy-insecure households may reduce cooling, defer repairs, or keep homes at unsafe temperatures (EIA, 2022). Power outages also produce disproportionate effects among lower-income households, racial and ethnic minority communities, children, older adults, and rural residents (Andresen et al., 2023). Treating air-conditioning access as a binary variable can therefore misclassify protection. Functional status, operating cost, insulation, outage exposure, and medically sensitive household needs are more decision-relevant measures.
The social production of vulnerability is also spatial. Older adults and people with chronic illness face physiological sensitivity, but their actual risk depends on cooling, housing, transportation, healthcare, and social support. Renters may have limited authority to repair failing systems or modify buildings. Historically disinvested neighborhoods often have more impervious surface and less tree canopy, and contemporary income inequality continues to shape intra-urban heat disparities (Hoffman et al., 2020; Hsu et al., 2021; McDonald et al., 2021; Shreevastava et al., 2025). These conditions are not fixed attributes of populations; they are consequences of policy, infrastructure, labor, housing, and resource allocation.
Cooling-center access illustrates why spatial proximity is insufficient. A center may be technically nearby but practically inaccessible because of limited transit, unsafe walking exposure, disability barriers, operating hours, pet restrictions, distrust, or lack of medical support. In Arizona, older adults reported limited awareness of cooling-center locations and transportation barriers, and mapping that combined service locations with SVI data revealed gaps between hazard, vulnerability, and usable protection (Mallen et al., 2022). AI-enabled planning must therefore evaluate service networks and lived accessibility rather than point locations alone.
3.2. Exploratory Regional HRI ED Analysis
Table 1 presents the 10 regional observations. The unweighted mean of the regional warm-season 2023 HRI ED rates was 193.2 per 100,000 ED visits (SD = 138.1; range 51–483). The mean number of elevated HRI days was 16.4 (SD = 17.0; range 3–56). Region 6 reported the highest 2023 rate (483) and elevated-day count (56), while Region 2 reported the lowest 2023 rate (51). These descriptive contrasts illustrate the concentration of reported acute heat-health burden across regions.
Bivariate associations were strong (Table 2). Elevated HRI days correlated with the 2023 rate (Pearson r = 0.874, p = 0.001; Spearman rho = 0.924, p < 0.001). The 2018–2022 baseline rate also correlated with the 2023 rate (Pearson r = 0.938, p < 0.001; Spearman rho = 0.964, p < 0.001). Figure 1 displays the association between elevated days and the regional 2023 rate. The pattern indicates regional clustering within the surveillance measures. However, it should not be interpreted as an independent effect of meteorological duration because elevated days are defined using the same HRI ED surveillance process as the outcome.
In conventional OLS Model 1, each additional elevated day was associated with 7.08 additional HRI ED visits per 100,000 ED visits (95% CI 3.86–10.30; p = 0.001), and the model explained 76.3% of regional variation (Table 3). HC3-robust inference produced a similar coefficient (95% CI 4.52–9.64; p < 0.001). In conventional Model 2, the elevated-day coefficient decreased to 3.32 (p = 0.007), while the baseline coefficient was 1.28 (p = 0.001); R2 was 0.961.
Sensitivity diagnostics materially qualified the adjusted model. With HC3 robust standard errors, the elevated-day coefficient in Model 2 was not statistically distinguishable from zero (95% CI −3.23–9.86; p = 0.270), whereas the baseline coefficient remained associated with the 2023 rate (95% CI 0.49–2.07; p = 0.007). HHS Region 6 had the largest Cook’s distance (D = 4.58), indicating substantial influence on the two-predictor model. These findings reinforce a descriptive interpretation: the regional data reveal persistent and clustered heat-health burden, but the sample is too small and internally dependent to support causal attribution or stable multivariable prediction.
3.3. AI-Enabled Climate Risk Management Functions
The synthesis identified five linked functions for AI-enabled heat-risk management: hazard anticipation, social vulnerability mapping, public-health surveillance, targeted intervention, and adaptive communication. Existing AI-and-climate research is concentrated in hazard and exposure assessment, with less attention to vulnerability, prioritization, implementation, and governance (Mehryar et al., 2024). A 385-study systematic review likewise found rapid growth but fragmented sectoral coverage, limited health applications, and persistent challenges in data access, transparency, and equitable deployment (Ayadi et al., 2025).
Hazard anticipation can extend lead time and represent forecast uncertainty. GraphCast and GenCast show that machine-learning weather prediction can generate skillful global forecasts rapidly (Lam et al., 2023; Price et al., 2025). For heat action, speed can support earlier activation of cooling sites, outreach teams, utility coordination, work modifications, and school or event decisions. However, global skills do not guarantee local performance. Machine-learning models may struggle with physical consistency, mesoscale processes, or unprecedented extremes, and physics-based models can outperform current AI systems for some record-breaking events (Bonavita, 2024; Zhang et al., 2026). High-stakes use should therefore combine AI with operational numerical prediction, local calibration, uncertainty communication, and expert review.
Social vulnerability mapping should integrate environmental layers—air temperature, humidity, nighttime minimum temperature, land-surface temperature, impervious surface, canopy, and building density—with social and service layers such as poverty, disability, language access, vehicle access, outdoor work, energy burden, housing conditions, homelessness, chronic illness, and cooling availability. The SVI provides a starting point, and Heat.gov already combines projected heat with social vulnerability (CDC/ATSDR, 2024; Heat.gov, 2024). AI can model nonlinear interactions, but outputs should be interpretable vulnerability profiles rather than a single opaque score.
Public-health surveillance can detect unusual increases in symptoms, emergency calls, and healthcare demand. CDC’s Heat & Health Tracker provides local information on exposure, health outcomes, and protective assets (Centers for Disease Control and Prevention [CDC], 2026). AI could support anomaly detection, short-term burden forecasts, and resource planning, but health and utility data require minimization, aggregation, access controls, and purpose limitation. Surveillance should be restricted to public-health protection rather than secondary enforcement.
Targeted intervention is the decisive step. Risk classifications should map to predefined actions, responsible agencies, activation thresholds, and evaluation metrics. Depending on the vulnerability profile, actions may include cooling-center hours, transportation, mobile outreach, air-conditioning repair, energy assistance, utility shutoff protection, building inspection, worker protection, shaded transit, tree canopy, or cool roofs. Without this operational linkage, AI becomes a dashboard rather than resilience infrastructure.
Adaptive communication should translate forecasts into audience-specific, multilingual, accessible, and resource-linked guidance. NWS HeatRisk offers a seven-day, impact-oriented framework that incorporates local climatology and health evidence (National Weather Service [NWS], 2025). Higher HeatRisk levels were generally associated with higher HRI ED visit rates in New York during May–September 2024 (Muscatiello et al., 2025). AI can help tailor messages, but trusted public-health professionals and community organizations should review content and deliver it through channels residents use.
These functions are organized into the five-pillar framework in Table 4. Hazard anticipation identifies when and where conditions may become dangerous; social vulnerability mapping identifies why risk is uneven; targeted intervention specifies what action follows; adaptive communication connects warnings to usable resources; and ethical governance defines accountability, privacy, validation, contestability, and evaluation. The framework treats AI as decision support that should make institutions more responsive rather than transfer responsibility to an algorithm.
4. Discussion
4.1. Principal Findings
The study produced three main findings. First, the U.S. heat burden is simultaneously climatic, clinical, infrastructural, and social. Rising heat exposure interacts with housing, energy, labor, health, transportation, and historical land-use patterns. Second, the regional HRI ED analysis reveals strong clustering and persistence in aggregate surveillance measures, but robust inference and influence diagnostics show why small ecological models should not be presented as causal validation. Third, the most defensible role for AI is not autonomous prediction; it is governed integration of forecasts, vulnerability information, services, and accountable action.
The statistical qualification is important. The strong correlations are partly expected because the outcome and elevated-day count are derived from the same regional HRI ED series. Model 2 also contains only seven residual degrees of freedom, and Region 6 strongly influences the fit. The revised interpretation is therefore narrower than the original draft: the data illustrate that persistent baseline burden and repeated high-utilization days coincide geographically. They do not show that elevated days cause regional mean rates, that AI improves outcomes, or that the proposed framework has been empirically validated.
Even with these limits, the descriptive pattern has operational relevance. A climate risk management system should track not only forecast temperature but also prior health burden, current syndromic signals, cooling functionality, outage risk, service accessibility, and response capacity. The purpose of integration is to identify jurisdictions where hazardous conditions and constrained adaptive capacity converge early enough to mobilize protection.
These findings are consistent with the broader heat-health evidence but sharpen its operational meaning. Systematic and epidemiological studies show that heat affects mortality, renal and cardiovascular stress, mental health, pediatric care, and people experiencing homelessness, while vulnerability varies by health status, income, occupation, housing, and locality (Arsad et al., 2022; Bernstein et al., 2022; Sun et al., 2021; Weckstein et al., 2025). The present framework interprets these differences not as a list of vulnerable groups but as distinct intervention needs. The same forecast may call for worker protections in one area, cooling repair and utility assistance in another, and home-based outreach where older adults live alone.
The results also reinforce environmental-justice research showing that thermal risk is embedded in urban form and resource distribution. Redlining, low canopy, impervious surfaces, housing disinvestment, and contemporary income inequality affect both exposure and the capacity to act on warnings (Hoffman et al., 2020; Hsu et al., 2021; McDonald et al., 2021; Shreevastava et al., 2025). This literature cautions against treating vulnerability as a stable trait of a population. A neighborhood can become safer through cooling repairs, shaded transit, tenant protection, and reliable power, or more vulnerable through displacement, utility shutoffs, and infrastructure failure. AI systems should therefore update decision-relevant conditions rather than reproduce static labels.
The warning-system literature further supports an end-to-end interpretation. U.S. heat action plans commonly identify triggers, communication, cooling centers, surveillance, and coordination, yet the details needed to reach and protect high-risk residents remain inconsistent (Randazza et al., 2023). Recent review evidence calls for warning thresholds that integrate local epidemiology, built-environment conditions, and population sensitivity rather than temperature alone (Chandra N and Lee, 2025). Damoah (2026) reaches a parallel conclusion for Gulf Coast hazards: forecast capability does not guarantee equitable warning reach or feasible response. The five-pillar framework adds value by making intervention activation and governance part of the warning architecture rather than treating them as downstream considerations.
The study also extends the AI-and-resilience literature. Ayadi et al. (2025) and Mehryar et al. (2024) identify fragmentation, limited health applications, weak attention to implementation, and unresolved questions of transparency and equity. The framework responds by shifting the unit of evaluation from the model to the sociotechnical system. Forecast skill remains necessary, but the more consequential outcomes are whether agencies act earlier, whether resources reach high-risk communities, whether false negatives are concentrated among marginalized groups, and whether illness and mortality decline.
4.2. Implications for Climate Risk Management and Practice
The framework aligns closely with climate risk management because it links predictive modeling to decisions, anticipatory action, public health, equity, and technology governance. Local governments should embed AI tools within heat action plans, emergency protocols, housing enforcement, labor protections, utility regulation, adaptation budgets, and community partnerships rather than procure stand-alone dashboards. Table 5 translates the framework into implementation priorities and measurable outcomes.
Functional cooling should be treated as health infrastructure. Agencies need indicators of whether cooling systems work, whether households can afford to operate them, whether buildings retain dangerous heat, and whether outages threaten medically vulnerable residents. Public-health departments, utilities, energy-assistance programs, housing agencies, and community organizations should share only the minimum data needed to coordinate repair, weatherization, shutoff protection, and emergency outreach.
Occupational protection should also be integral to heat resilience. AI-supported forecasts can identify high-risk work periods, but protection depends on enforceable standards for water, rest, shade, acclimatization, schedule modification, training, and anti-retaliation. Forecasts should guide inspections and preparedness, not replace employer duties or shift responsibility to workers.
Urban heat mitigation should prioritize historically underserved areas while guarding against displacement. Tree canopy, cool roofs, reflective surfaces, parks, shaded transit, and building retrofits can reduce exposure, but benefits depend on maintenance and tenant protections. Community participation is necessary to identify appropriate locations, monitor who benefits, and prevent adaptation investments from increasing housing costs or displacing residents.
Cooling services must be evaluated as networks. Placement, operating hours, transit, disability access, language, pet policies, trust, and medical support determine practical use. Demand models can estimate coverage gaps, but community organizations often know barriers that administrative data miss. Mobile and home-based interventions may be more effective than fixed centers for some residents.
Health systems can combine HeatRisk, syndromic surveillance, and patient outreach to prepare for emergency demand and support high-risk patients. Risk communication should state what action to take, what service is available, how to reach it, and whom to contact. Messages should be tested with intended audiences and evaluated for reach, comprehension, service uptake, and health outcomes rather than judged only by delivery counts.
This end-to-end orientation is consistent with Damoah’s (2026) Gulf Coast analysis, which emphasizes integrating vulnerability information with warning thresholds, accessible dissemination, and response activation. For heat-risk management, technical accuracy should therefore be evaluated alongside message reach, comprehension, service access, and the feasibility of protective action.
The framework’s practical contribution is intervention matching. A composite risk score can rank places, but it cannot by itself determine what protection is required. Agencies should retain component-level profiles and pre-agree the action associated with each pattern of risk. High nighttime heat combined with older housing may trigger building inspections and cooling repair; high occupational exposure may trigger worksite enforcement; high transit dependence may trigger mobile cooling and extended transit; and elevated syndromic signals may trigger health-system surge preparation. This design reduces the distance between analysis and action.
Evaluation should proceed across four levels. Technical metrics should assess forecast error, calibration, geographic transportability, and uncertainty. Operational metrics should assess lead time, activation speed, data latency, and agency coordination. Equity metrics should examine coverage, subgroup false-negative rates, service accessibility, and the distribution of public resources. Health metrics should assess emergency visits, hospitalizations, mortality, and avoided harm. A system that performs well technically but fails operationally or distributes protection inequitably should not be considered successful.
Policy responsibilities are distributed across levels of government. Federal agencies can support interoperable data standards, HeatRisk and surveillance infrastructure, model documentation, and funding for local implementation. States can coordinate public-health, labor, utility, housing, and emergency-management authorities. Local governments can define activation thresholds, maintain service inventories, contract with trusted community organizations, and evaluate post-event performance. Clear authority is essential because AI cannot resolve institutional fragmentation on its own.
4.3. Ethical Governance and Accountability
Data bias is the first governance challenge. Broken air conditioners, informal caregiving, undocumented work, indoor temperature, landlord neglect, social isolation, and distrust of government are often missing from standard datasets. An absence of records may indicate weak reporting rather than low risk. Models should therefore display uncertainty and allow local knowledge to correct or supplement administrative data.
False precision is a related risk. Detailed maps and scores can appear objective even though they reflect data quality, model choices, temporal mismatch, and classification thresholds. A single composite score may hide whether a neighborhood needs cooling repairs, transportation, worker protection, or canopy investment. Decision-makers should receive component profiles, uncertainty intervals where feasible, and clear explanations of why a location is classified as high risk.
Privacy protections are especially important when models combine health, utility, housing, emergency-call, mobility, or social-service data. Data should be aggregated whenever possible, personally identifiable information minimized, access logged, retention limited, and secondary uses prohibited. Heat-risk data should not be repurposed for eviction, policing, immigration enforcement, or punitive benefit surveillance.
Accountability cannot be delegated to a model. Public agencies, vendors, and decision-makers should define responsibility before deployment, maintain documentation and audit trails, conduct independent validation, and publish post-event evaluations. Procurement should require data provenance, interoperability, model documentation, audit access, and exit provisions that avoid vendor lock-in. The environmental footprint of AI also matters; data-center electricity demand is projected to rise substantially, making efficient models and proportionate computing part of responsible adaptation (International Energy Agency [IEA], 2025).
Legitimacy depends on whether communities see tangible benefits. Residents should participate in selecting variables, interpreting outputs, defining intervention thresholds, and evaluating performance. They should also have a mechanism to contest classifications and report missing conditions. Community participation is not an optional ethical addition; it improves data validity, service design, trust, and accountability.
Governance requirements should be proportional to the consequences of the decision. A model used to support broad situational awareness may require less stringent review than a system that prioritizes household outreach, allocates limited cooling assistance, or directs inspections. High-consequence applications should undergo documented validation, subgroup testing, independent review, human authorization, and post-deployment monitoring. Agencies should also maintain a safe fallback process when data feeds fail or predictions conflict with field observations.
Human oversight must be substantive rather than ceremonial. Decision-makers need enough information to understand model limitations, override outputs, document reasons, and learn from errors. Community organizations and frontline workers should be treated as knowledge partners because they can identify conditions that administrative records miss. Their participation should be funded and incorporated into operating procedures rather than confined to one-time consultation.
4.4. Equity, Implementation, and Institutional Capacity
Implementation capacity is itself a determinant of climate risk. Some jurisdictions have strong forecasting and data systems but limited staff, transportation, cooling infrastructure, housing enforcement, or discretionary funds. In those settings, additional analytics can expose need without creating the capacity to respond. Funding decisions should therefore pair digital tools with operational resources, maintenance, and workforce development.
A minimum viable heat-resilience system does not require the most complex model. It requires reliable weather and health signals, a current inventory of services, clearly assigned authority, trusted communication channels, and predefined actions. More advanced AI should be added only when it improves a specific decision and can be validated against a simpler baseline. This principle guards against technology-centered procurement and directs scarce resources toward the point at which they reduce harm.
Equity also requires attention to maladaptation. Tree planting, cool-roof programs, and neighborhood retrofits can reduce exposure, but they may raise rents or accelerate displacement if tenant protections and affordability measures are absent. Digital outreach may miss residents without stable internet access, and data-sharing agreements may expose communities to secondary surveillance. Each intervention should therefore be assessed for who benefits, who bears new costs, and whether the strategy changes the structural conditions that created vulnerability.
Institutional learning should continue after every heat event. Agencies should document forecast performance, activation decisions, unmet demand, service use, complaints, adverse events, and community feedback. Public post-event reviews can identify where the chain failed—prediction, communication, transportation, staffing, power, cooling functionality, or trust—and convert those lessons into revised thresholds and operating procedures.
4.5. Research Agenda
The framework requires stronger empirical testing. A national extension could use counties, while tract-level studies in heat-prone metropolitan areas would better capture neighborhood variation. Outcomes could include HRI ED visits, hospitalizations, mortality, emergency medical calls, or locally verified heat deaths. Exposure variables should include maximum and minimum temperature, humidity, HeatRisk, duration, and land-surface temperature. Social and service variables should include SVI components, energy burden, outdoor work, tree canopy, building conditions, homelessness, chronic disease, transport, and functional cooling.
Analyses should account for distribution and spatial dependence. Count outcomes may require negative binomial models with population offsets; rate outcomes may use generalized linear models with robust errors. Spatial autocorrelation should be tested, and spatial lag, spatial error, or multilevel models considered where appropriate. Machine-learning classifiers may identify nonlinear interactions, but they should be evaluated through geographic and temporal validation, calibration, subgroup performance, recall for high-risk communities, and explainable outputs. Performance outside training geographies and during unprecedented extremes is especially important.
The most consequential studies will evaluate interventions rather than risk scores alone. Quasi-experimental or stepped-wedge designs could test whether AI-supported outreach, cooling repair, transportation, or worksite targeting reduces emergency visits, improves service uptake, or lowers mortality. Evaluation should examine fairness in resource allocation, false-negative rates in vulnerable communities, community trust, and cost-effectiveness. The relevant question is not only whether a model predicts risk, but whether the institutional system using it reduces risk.
A validation hierarchy would strengthen this research agenda. Studies should first establish data quality and temporal alignment, then compare AI models with transparent statistical or rule-based baselines, test calibration and subgroup performance, validate across geography and time, and finally evaluate decision and health outcomes. This sequence would reduce the risk of treating a high in-sample fit as evidence of public-health value.
Research should also examine compound and cascading hazards. Heat may coincide with wildfire smoke, drought, grid stress, flooding after tropical systems, or outages caused by severe storms. Protective guidance can conflict—for example, opening windows may reduce indoor heat but increase smoke exposure. Multi-hazard models and communication protocols should therefore be tested with public-health agencies and affected communities rather than developed solely as technical exercises (Coker et al., 2024).
4.6. Limitations
The study has several limitations. The evidence synthesis was purposive rather than systematic, so it may omit relevant studies and cannot support a formal assessment of publication bias or evidence quality. The quantitative analysis used 10 aggregate HHS regions, not counties, tracts, households, or individuals. It did not include independent meteorological exposure, SVI, housing, energy, or intervention variables. HRI ED visits capture acute healthcare utilization but not all morbidity, mortality, indoor exposure, or people who do not seek care.
The regional predictors are also statistically dependent on the outcome because elevated days were defined from the same HRI ED series, and the adjusted model was sensitive to influential observations. The framework is therefore a theoretically and empirically informed proposal, not a validated AI system. Local data availability, governance capacity, institutional authority, and community trust vary widely, so implementation should be tested and adapted rather than assumed to transfer across jurisdictions.
The integrative review also reflects the availability and framing of published evidence. English-language peer-reviewed and official sources are more visible than local evaluations, community reports, and unpublished operational lessons. The review may therefore underrepresent failed implementations, rural practices, Tribal knowledge, and community-led heat responses. Future systematic or scoping reviews should use explicit protocols and include gray literature and participatory evidence.
Finally, the evidence base is changing quickly. AI weather models, HeatRisk operations, surveillance coverage, state heat standards, and local adaptation programs will continue to evolve. The framework should be treated as a testable structure that can incorporate new evidence, not as a fixed classification of technologies or policies.
5. Conclusions
Extreme heat is a major U.S. climate-health risk whose effects are produced through the interaction of meteorological exposure with housing, energy, work, health, transportation, neighborhood infrastructure, and historical inequality. The literature shows that accurate warnings alone are insufficient when residents cannot afford cooling, workers cannot alter exposure, services are unreachable, or institutions lack authority and resources to respond. AI can contribute by linking forecasts, health signals, vulnerability profiles, and service information, but its value is conditional on the public system in which it operates.
The exploratory regional analysis supports a limited but useful conclusion: heat-related emergency burden clusters geographically and reflects persistent regional differences, but the small, dependent dataset does not establish causal effects or validate an AI model. That boundary strengthens rather than weakens the central argument. Climate-risk management requires multiple forms of evidence—meteorological, epidemiological, social, infrastructural, and experiential—and must preserve uncertainty when deciding where and how to act.
The five-pillar framework joins hazard anticipation, social vulnerability mapping, targeted intervention, adaptive communication, and ethical governance in one accountable chain. Its principal contribution is to move evaluation beyond predictive accuracy. A credible system should demonstrate that it activates decisions earlier, reaches populations that face the greatest barriers, allocates resources fairly, protects privacy, supports community authority, and reduces preventable illness and death.
For public agencies, the immediate priority is not to purchase the most complex model. It is to define decisions, responsibilities, thresholds, services, and measures of success before deployment. AI should then be used where it improves that operational chain and should be compared with transparent alternatives. The future of AI-enabled heat resilience will depend less on whether models can identify danger than on whether institutions can convert intelligence into timely, equitable, and durable protection.
Ethics Statement
Ethics approval and informed consent were not required because the analysis used publicly available aggregate data and involved no identifiable human participants.
Author Contributions
SA: Conceptualization, Methodology, Formal analysis, Investigation, Data curation, and Visualization. BD: Conceptualization, Formal analysis, Writing – original draft, and Writing – review and editing. All authors contributed to the article and approved the submitted version.
Funding
This research received no external funding.
Data Availability Statement
The regional observations used in the exploratory analysis are reproduced in Table 1 and provided as Supplementary Data 1. Reproducible Python code with automated verification checks is provided as Supplementary File 1. A statistical verification and source-audit report, including exact outputs, influence diagnostics, and file checksums, accompanies the submission materials. The source values are publicly available in Vaidyanathan et al. (2024).
Conflicts of Interest
The authors declare no conflict of interest.
Acknowledgments
The authors used generative AI features in Grammarly tools for language editing, structural organization, and reference-format checking. The authors verified the analysis, citations, and final content.
References
- Andresen, A.X.; Kurtz, L.C.; Hondula, D.M.; Meerow, S.; Gall, M. Understanding the social impacts of power outages in North America: A systematic review. Environ. Res. Lett. 2023, 18, 053004. [Google Scholar] [CrossRef]
- Arsad, F.S.; Hod, R.; Ahmad, N.; Ismail, R.; Mohamed, N.; Baharom, M. The impact of heatwaves on mortality and morbidity and the associated vulnerability factors: A systematic review. Int. J. Environ. Res. Public Health 2022, 19, 16356. [Google Scholar] [CrossRef] [PubMed]
- Ayadi, R.; Forouheshfar, Y.; Moghadas, O. Enhancing system resilience to climate change through artificial intelligence: A systematic literature review. Front. Clim. 2025, 7, 1585331. [Google Scholar] [CrossRef]
- Bernstein, A.S.; Sun, S.; Weinberger, K.R.; Spangler, K.R.; Sheffield, P.E.; Wellenius, G.A. Warm season and emergency department visits to U.S. children’s hospitals. Environ. Health Perspect. 2022, 130, 017001. [Google Scholar] [CrossRef] [PubMed]
- Bonavita, M. On some limitations of current machine learning weather prediction models. Geophys. Res. Lett. 2024, 51, e2023GL107377. [Google Scholar] [CrossRef]
- Bureau of Labor Statistics. It’s summer and it’s hot on the job. 2024. Available online: https://www.bls.gov/opub/ted/2024/its-summer-and-its-hot-on-the-job.htm (accessed on 22 July 2026).
- Centers for Disease Control and Prevention. Heat & Health Tracker. 2026. Available online: https://ephtracking.cdc.gov/Applications/heatTracker/ (accessed on 22 July 2026).
- Centers for Disease Control and Prevention/Agency for Toxic Substances and Disease Registry. CDC/ATSDR Social Vulnerability Index. 2024. Available online: https://www.atsdr.cdc.gov/place-health/php/svi/index.html (accessed on 22 July 2026).
- Chandra N, S.V.S.; Lee, J.K.W. A systematic review of heat health warning systems: Enhancing the framework towards effective health outcomes. Curr. Environ. Health Rep. 12 2025, 31. [Google Scholar] [CrossRef] [PubMed]
- Coker, E.S.; Stone, S.L.; McTigue, E.; Yao, J.A.; Brigham, E.P.; Schwandt, M. Climate change and health: Rethinking public health messaging for wildfire smoke and extreme heat co-exposures. Front. Public Health 2024, 12, 1324662. [Google Scholar] [CrossRef] [PubMed]
- Damoah, B. Operational early warning systems and socio-ecological risk in the U.S. Gulf Coast: Integrating ecosystem loss and social vulnerability, a scoping review. Sustainability 2026, 18, 3872. [Google Scholar] [CrossRef]
- Damoah, B.; Adu, E.; Ofori, E.; Apraku, A. Aggravation of climate change crisis in Gulf Regions of United States: A review of anthropogenic factors. J. Ecohumanism 2024, 3, 438–449. [Google Scholar] [CrossRef]
- Damoah, B.; Khalo, X. Extreme temperature variability in the Southeastern United States: Trends in Mississippi State. Int. J. Environ. Sustain. Soc. Sci. 2024, 5, 1991–2002. [Google Scholar] [CrossRef]
- Heat.gov. Extreme Heat Vulnerability Mapping Tool. 2024. Available online: https://heat.gov/data-tools/extreme-heat-vulnerability-mapping-tool/ (accessed on 22 July 2026).
- Hoffman, J.S.; Shandas, V.; Pendleton, N. The effects of historical housing policies on resident exposure to intra-urban heat: A study of 108 U.S. urban areas. Climate 2020, 8, 12. [Google Scholar] [CrossRef]
- Howard, J.T.; Androne, N.; Alcover, K.C.; Santos-Lozada, A.R. Trends of heat-related deaths in the US, 1999–2023. JAMA 2024, 332, 1203–1204. [Google Scholar] [CrossRef] [PubMed]
- Hsu, A.; Sheriff, G.; Chakraborty, T.; Manya, D. Disproportionate exposure to urban heat island intensity across major U.S. cities. Nat. Commun. 2021, 12, 2721. [Google Scholar] [CrossRef] [PubMed]
- International Energy Agency. Energy and AI: Executive Summary. 2025. Available online: https://www.iea.org/reports/energy-and-ai/executive-summary (accessed on 22 July 2026).
- Lam, R.; Sanchez-Gonzalez, A.; Willson, M.; Wirnsberger, P.; Fortunato, M.; Alet, F. Learning skillful medium-range global weather forecasting. Science 2023, 382, 1416–1421. [Google Scholar] [CrossRef] [PubMed]
- Mallen, E.; Roach, M.; Fox, L.; Gillespie, E.; Watkins, L.; Hondula, D.M. Extreme heat exposure: Access and barriers to cooling centers—Maricopa and Yuma Counties, Arizona, 2010–2020. MMWR Morb. Mortal. Wkly. Rep. 2022, 71, 781–785. [Google Scholar] [CrossRef] [PubMed]
- Maricopa County Department of Public Health. 2024 Heat-Related Deaths Report. 2025. Available online: https://www.maricopa.gov/ArchiveCenter/ViewFile/Item/5934 (accessed on 22 July 2026).
- McDonald, R.I.; Biswas, T.; Sachar, C.; Housman, I.; Boucher, T.M.; Balk, D. The tree cover and temperature disparity in U.S. urbanized areas: Quantifying the association with income across 5,723 communities. PLoS ONE 2021, 16, e0249715. [Google Scholar] [CrossRef] [PubMed]
- Mehryar, S.; Yazdanpanah, V.; Tong, J. AI and climate resilience governance. iScience 2024, 27, 109812. [Google Scholar] [CrossRef] [PubMed]
- Muscatiello, N.A.; Hsu, W.; Aydin-Ghormoz, H.; Weng, C.; Dorabawila, V.; Bush, K.F. Notes from the field: HeatRisk forecasts and emergency department visits for heat-related illness—New York, May–September 2024. MMWR Morb. Mortal. Wkly. Rep. 2025, 74, 302–304. [Google Scholar] [CrossRef] [PubMed]
- National Weather Service. HeatRisk: Identifying Potential Heat Risks in the Seven-Day Forecast. 2025. Available online: https://www.wpc.ncep.noaa.gov/heatrisk/ (accessed on 22 July 2026).
- Price, I.; Sanchez-Gonzalez, A.; Alet, F.; Andersson, T.R.; El-Kadi, A.; Masters, D. Probabilistic weather forecasting with machine learning. Nature 2025, 637, 84–90. [Google Scholar] [CrossRef] [PubMed]
- Randazza, J.M.; Hess, J.J.; Bostrom, A.; Hartwell, C.; Adams, Q.H.; Nori-Sarma, A. Planning to reduce the health impacts of extreme heat: A content analysis of heat action plans in local United States jurisdictions. Am. J. Public Health 2023, 113, 559–567. [Google Scholar] [CrossRef] [PubMed]
- Shreevastava, A.; Hulley, G.; Prasanth, S.; Chakraborty, T.C.; Aguilera, D.R.; Sanders, K.T. Contemporary income inequality outweighs historic redlining in shaping intra-urban heat disparities in Los Angeles. Nat. Commun. 2025, 16, 4950. [Google Scholar] [CrossRef] [PubMed]
- Sun, S.; Weinberger, K.R.; Nori-Sarma, A.; Spangler, K.R.; Sun, Y.; Dominici, F. Ambient heat and risks of emergency department visits among adults in the United States: Time-stratified case-crossover study. BMJ 2021, 375, e065653. [Google Scholar] [CrossRef] [PubMed]
- U.S. Energy Information Administration. In 2020, 27% of U.S. Households Had Difficulty Meeting Energy Needs. 2022. Available online: https://www.eia.gov/todayinenergy/detail.php?id=51979 (accessed on 22 July 2026).
- U.S. Environmental Protection Agency. Climate Change Indicators: Heat Waves. 2024. Available online: https://www.epa.gov/system/files/documents/2024-09/climate_indicators_2024.pdf (accessed on 22 July 2026).
- U.S. Global Change Research Program. Fifth National Climate Assessment; Washington, DC; USGCRP, 2023. Available online: https://nca2023.globalchange.gov/ (accessed on 22 July 2026).
- Vaidyanathan, A.; Gates, A.; Brown, C.; Prezzato, E.; Bernstein, A. Heat-related emergency department visits—United States, May–September 2023. MMWR Morb. Mortal. Wkly. Rep. 2024, 73, 324–329. [Google Scholar] [CrossRef] [PubMed]
- Weckstein, T.N.; Woolhandler, S.; Himmelstein, D.U.; Lambert, J.T.; Cai, C.L.; Gaffney, A. Heat-related illness among US patients experiencing homelessness. JAMA Intern. Med. 2025, 185, 1034–1036. [Google Scholar] [CrossRef] [PubMed]
- Zhang, Z.; Fischer, E.M.; Zscheischler, J.; Engelke, S. Physics-based models outperform AI weather forecasts of record-breaking extremes. Sci. Adv. 2026, 12, eaec1433. [Google Scholar] [CrossRef] [PubMed]
Figure 1.
Association between elevated HRI burden days and mean warm-season 2023 HRI ED visit rates across HHS regions. Each point is labeled with its HHS region number. The fitted line is the simple OLS association. Rates are per 100,000 ED visits. The plot illustrates an ecological association within related surveillance measures and does not establish causality.
Figure 1.
Association between elevated HRI burden days and mean warm-season 2023 HRI ED visit rates across HHS regions. Each point is labeled with its HHS region number. The fitted line is the simple OLS association. Rates are per 100,000 ED visits. The plot illustrates an ecological association within related surveillance measures and does not establish causality.
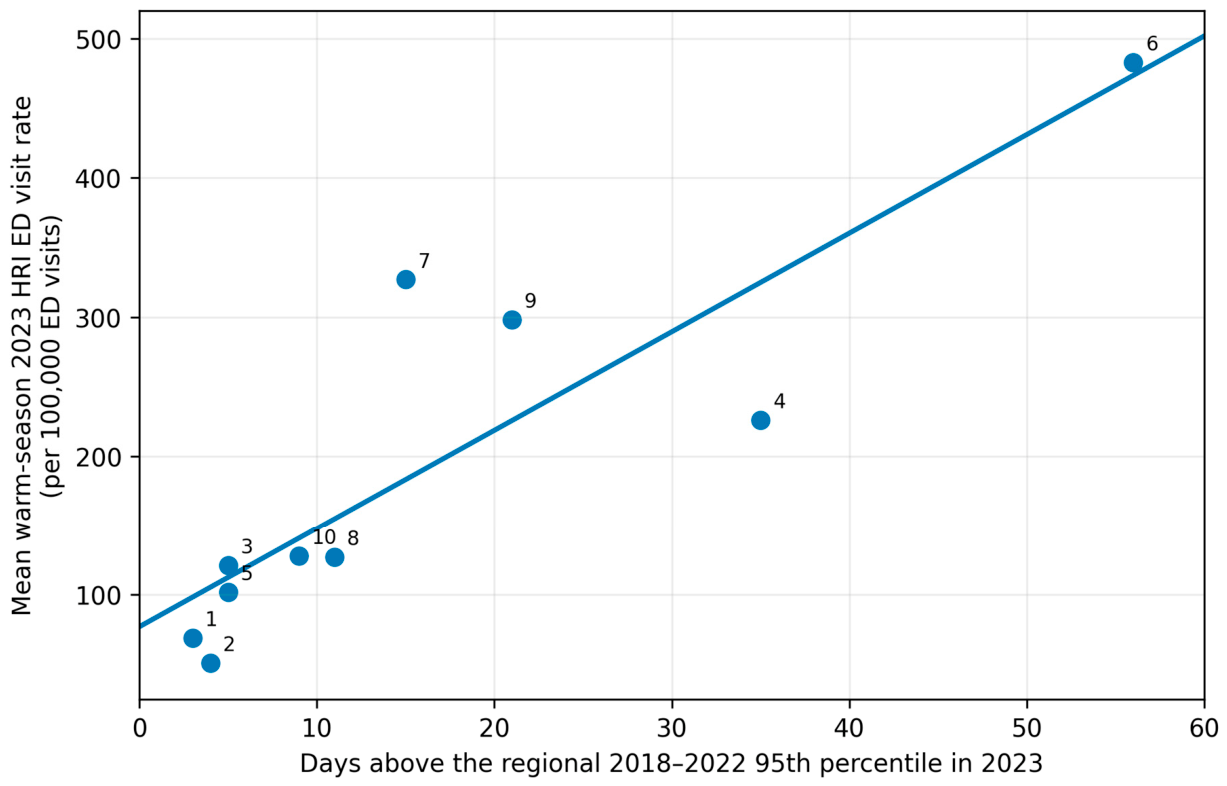

Table 1.
CDC Regional Dataset Used for the Exploratory Ecological Analysis.
| HHS region | Included states | 2023 HRI ED rate | 2018–2022 baseline rate | Elevated HRI days |
| 1 | CT, ME, MA, NH, RI, VT | 69 | 92 | 3 |
| 2 | NJ, NY | 51 | 66 | 4 |
| 3 | DE, DC, MD, PA, VA, WV | 121 | 144 | 5 |
| 4 | AL, FL, GA, KY, MS, NC, SC, TN | 226 | 183 | 35 |
| 5 | IL, IN, MI, MN, OH, WI | 102 | 109 | 5 |
| 6 | AR, LA, NM, OK, TX | 483 | 254 | 56 |
| 7 | IA, KS, MO, NE | 327 | 248 | 15 |
| 8 | CO, MT, ND, SD, UT, WY | 127 | 120 | 11 |
| 9 | AZ, CA, HI, NV | 298 | 247 | 21 |
| 10 | AK, ID, OR, WA | 128 | 131 | 9 |
Note. HRI ED rates are per 100,000 emergency department visits. Elevated HRI days are days in 2023 when the regional HRI ED visit rate exceeded the region-specific 2018–2022 95th percentile. Values were transcribed from Vaidyanathan et al. (2024), Table 1 and Table 2. Region 2 excludes Puerto Rico and the U.S. Virgin Islands because they did not report to NSSP in the cited analysis.
Table 2.
Bivariate Associations With the 2023 Regional HRI ED Visit Rate.
| Predictor | Pearson r | p | Spearman rho | p |
| Elevated HRI days in 2023 | 0.874 | 0.001 | 0.924 | <0.001 |
| 2018–2022 baseline HRI ED rate | 0.938 | <0.001 | 0.964 | <0.001 |
Note. n = 10 HHS regions. Associations are ecological. The elevated-day predictor and outcome are derived from the same HRI ED surveillance series and are not statistically independent constructs.
Table 3.
Exploratory OLS Models Predicting the 2023 Regional HRI ED Visit Rate.
| Model | Predictor | B | OLS SE | OLS p | HC3 SE | HC3 p |
| 1 | Intercept | 77.08 | 32.12 | 0.043 | 23.79 | 0.012 |
| 1 | Elevated HRI days | 7.08 | 1.39 | 0.001 | 1.11 | <0.001 |
| 2 | Intercept | -64.92 | 27.78 | 0.052 | 29.94 | 0.067 |
| 2 | Elevated HRI days | 3.32 | 0.88 | 0.007 | 2.77 | 0.270 |
| 2 | 2018–2022 baseline rate | 1.28 | 0.22 | 0.001 | 0.33 | 0.007 |
Note. Model 1: R2 = 0.763, adjusted R2 = 0.733, F(1, 8) = 25.77, p = 0.001. Model 2: R2 = 0.961, adjusted R2 = 0.949, F(2, 7) = 85.27, p < 0.001. HC3 estimates are heteroscedasticity-robust. HC3 95% CIs were 4.52–9.64 for Model 1 elevated days, −3.23–9.86 for Model 2 elevated days, and 0.49–2.07 for the Model 2 baseline rate. Model 2 was highly sensitive to Region 6 (Cook’s D = 4.58); results are exploratory.
Table 4.
Five-Pillar Framework for AI-Enabled Heatwave Resilience.
| Pillar | AI-enabled function | Climate risk management contribution | Minimum governance requirement |
| Hazard anticipation | Probabilistic forecasting of intensity, duration, nighttime heat, humidity, and compound hazards | Earlier activation of heat action plans and contingency resources | Local validation, uncertainty display, and operational meteorologist review |
| Social vulnerability mapping | Integration of environmental, health, housing, energy, labor, mobility, and service data | Identification of place-specific drivers of exposure and limited adaptive capacity | Interpretable component profiles, data-quality flags, and community validation |
| Targeted intervention | Risk-informed prioritization of cooling, repair, transport, outreach, labor protection, greening, and health services | Movement from risk identification to funded protective action | Predefined activation pathways, responsible agencies, and equitable allocation criteria |
| Adaptive risk communication | Audience-specific, multilingual, accessible, and resource-linked guidance | Improved ability to act on warnings and use services | Human review, trusted messengers, accessibility testing, and feedback mechanisms |
| Ethical governance | Privacy, documentation, audit, contestability, procurement safeguards, and outcome evaluation | Prevention of surveillance misuse, false precision, bias, and responsibility gaps | Purpose limitation, independent audit, public accountability, and appeal mechanisms |
Note. The framework positions AI as accountable decision support linking prediction to social vulnerability reduction and intervention.
Table 5.
Priority Implementation Pathways and Outcome Measures.
| Priority | AI-supported decision | Required institutional action | Illustrative outcome measures |
| Functional cooling | Identify buildings or areas with high indoor heat, repair, energy burden, and outage risk. | Coordinate repair, weatherization, energy assistance, and shutoff protection. | Repairs completed before heat events; indoor temperature reduction; service uptake |
| Cooling service access | Estimate demand, travel-time, operating-hour, and accessibility gaps | Open or extend centers; provide transport, mobile cooling, and trusted outreach | Population within usable service coverage; visits; unmet demand |
| Occupational heat protection | Flag high-risk work periods and sectors | Require water, rest, shade, acclimatization, schedule changes, training, and inspections. | Compliance; heat-illness incidents; protected work hours |
| Health surveillance and outreach | Detect unusual HRI, EMS, and hospital demand and prioritize wellness checks. | Activate health-system surge plans and community outreach | HRI ED rates; EMS calls; patients reached; time to activation |
| Urban heat mitigation | Prioritize low-canopy, high-exposure, socially vulnerable blocks | Fund canopy, shade, cool roofs, reflective surfaces, maintenance, and anti-displacement safeguards | Canopy and shade gains; surface/air temperature change; beneficiary retention |
| Risk communication | Tailor multilingual messages to risk profile and available services | Use trusted messengers and test accessibility and comprehension | Reach; comprehension; protective action; service use |
| Governance and evaluation | Monitor model drift, subgroup errors, resource allocation, and downstream outcomes. | Audit models, publish performance, enable appeals, and revise interventions. | Calibration; false-negative rates; equity of allocation; preventable morbidity and mortality |
Note. Measures should be selected with community partners and disaggregated where feasible to identify inequitable performance.
Disclaimer/Publisher’s Note: The statements, opinions and data contained in all publications are solely those of the individual author(s) and contributor(s) and not of MDPI and/or the editor(s). MDPI and/or the editor(s) disclaim responsibility for any injury to people or property resulting from any ideas, methods, instructions or products referred to in the content. |
© 2026 by the authors. Licensee MDPI, Basel, Switzerland. This article is an open access article distributed under the terms and conditions of the Creative Commons Attribution (CC BY) license.
Copyright: This open access article is published under a Creative Commons CC BY 4.0 license, which permit the free download, distribution, and reuse, provided that the author and preprint are cited in any reuse.