

Submitted:
27 July 2026
Posted:
29 July 2026
You are already at the latest version
Abstract
Italy's special legal status for "innovative" small and medium-sized enterprises (SMEs) grants fiscal, financial and administrative benefits intended to strengthen competitiveness, yet whether the status marks a distinctive profile of realised firm performance remains empirically underexplored. Using ten years of balance-sheet data assembled within the LUCE (LUtech Campus Ecosystem) research project on 4,043 firms (2,873 innovative and 1,170 ordinary), we compare the two populations across six performance dimensions—performance persistence, revenue growth, labour productivity, operating profitability, earnings volatility and financial stability. Because the populations differ systematically in size, sector and location, we use propensity-score matching (1,031 balanced pairs) and interpret the resulting differential as a conditional innovative-status premium rather than as a causal effect. Innovative SMEs display a large and robust revenue-growth premium—a median growth rate roughly three-and-a-half times that of matched ordinary peers (+17.3 percentage points per year; rank-biserial 0.53)—coexisting with a fragility penalty of higher earnings volatility and lower financial stability; operating profitability is higher but does not survive our robustness battery, and labour productivity is marginally lower. A within-firm event study around the registration date shows that the growth advantage largely predates registration, indicating that the status certifies and renders visible already-dynamic firms rather than causally upgrading them. The premium is strongly and significantly heterogeneous across space—broadest in the South, where local institutions are weakest—consistent with an institutional-substitution boundary condition that a formal region-by-status interaction confirms. The results are robust to nine alternative estimators, multiple-testing correction and hidden-bias diagnostics. We read the innovative-firm register as an informative screening and monitoring device rather than as a policy whose causal returns we measure.
Keywords:
innovative SMEs
; firm performance
; propensity score matching
; high-growth firms
; financial fragility
; regional divide
; Italy
; entrepreneurship policy
1. Introduction
The competitiveness of small and medium-sized enterprises (SMEs) has become a central concern for European industrial and innovation policy. SMEs account for the overwhelming majority of firms and employment in the European Union, yet they face structural constraints—limited internal resources, thin managerial capacity and difficult access to external finance—that hamper their capacity to invest in the intangible assets underpinning digital transformation. To address these constraints, several countries have introduced dedicated legal categories that identify and support innovation-intensive firms. In Italy, the "innovative startup" regime introduced by the 2012 Startup Act (Decree-Law 179/2012) and its subsequent extension to the broader population of "innovative SMEs" established a public register of firms that meet objective innovation requirements—such as research-and-development intensity, a qualified workforce, or the ownership of intellectual property—and granted them a battery of fiscal incentives, simplified access to guaranteed credit, and tailored equity-investment reliefs.
A large evaluation literature has examined whether these schemes affect the quantity of resources that flow to eligible firms—in particular access to external finance—yet comparatively little is known about whether the innovative-firm status is associated with a distinctive profile of realised firm-level performance once firms are observed over a multi-year horizon, and still less about why any such profile arises. This gap matters. If innovative SMEs merely grow faster because they are younger and smaller, the status adds little diagnostic value; if instead it demarcates firms with a genuinely different performance architecture—higher growth, but also different risk and stability properties—then it becomes a meaningful signal for investors, lenders and policymakers, and the questions of whether that signal reflects the selection of already-dynamic firms or a genuine effect of the status, and of how its value varies across territories, acquire first-order importance.
This paper addresses that gap, and it does so explanatorily rather than descriptively. Using ten years of balance-sheet data assembled within the LUCE (LUtech Campus Ecosystem) research project, we compare innovative and ordinary Italian SMEs across six complementary performance dimensions—performance persistence, revenue growth, labour productivity, operating profitability, earnings volatility and financial stability. Because the two populations differ systematically in size, sector and location, we adopt a propensity-score matching design and are explicit that it recovers a conditional association—an innovative-status premium—rather than a causal effect. We then make three contributions that go beyond documenting the familiar fact that innovative firms grow faster but are riskier. First, we reconcile the matched cross-section with a within-firm event study around the registration date, showing that the growth premium largely predates registration: the status certifies and renders visible already-dynamic firms rather than causally upgrading them. Second, we show that the premium is institutionally contingent, testing—through a formal region-by-status interaction, not a descriptive split—an institutional-substitution boundary condition under which the certified differential is largest where local institutions are weakest. Third, we organise these results in a contingent-certification framework that recasts how the innovative-status literature should interpret such premia and yields testable propositions.
Three sets of findings emerge. First, innovative SMEs enjoy a large and robust revenue-growth premium relative to matched ordinary peers, alongside a profitability premium that is sizeable in the raw comparison but does not survive our robustness battery, and marginally lower labour productivity. Second, these features coexist with a fragility penalty: innovative SMEs are significantly more volatile and less financially stable. Third, and most novel, two results reframe the others: the event study attributes much of the growth premium to selection rather than to a treatment effect of the status, and the premium is strongly and significantly heterogeneous across space—broad-based in the Italian South, where the ordinary-firm baseline and local institutions are weakest, but narrowing to a growth-and-margin advantage shadowed by fragility in the North and Centre.
The remainder of the paper is organised as follows. The second section reviews the literature and develops the contingent-certification framework and its three propositions. The third section describes the data and the six performance measures, and the fourth sets out the propensity-score-matching strategy. The fifth section reports the results—the matched comparison, its spatial heterogeneity, the event-study benchmark and the robustness checks—and the sixth discusses them against competing accounts. The seventh draws policy implications, the eighth acknowledges limitations, and the ninth concludes.
2. Literature Review
Research on innovative firms has expanded rapidly, yet it remains fragmented across three questions that are rarely addressed together: whether innovative status pays off in financial and productivity terms, why it might, and for whom and where the payoff materializes. Reviewing this literature around these three axes exposes both a substantive gap — the role of certification and selection is asserted more often than it is isolated — and a methodological one that motivates our design. A first strand documents that innovation is associated with superior firm performance, but that the association is heterogeneous rather than uniform. Edeh et al. (2020), analysing developing-market firms, show that different innovation types have markedly different effects on SME outcomes, cautioning against treating "innovativeness" as a single treatment. Le and Ngo (2023) reach a similar conclusion for Vietnamese SMEs, and Matricano (2020) finds that among Italian innovative start-ups defined under Law 221/2012, it is specific inputs — R&D investment, highly skilled employees, and patents — rather than the label itself that drive turnover and employment. Onesti et al. (2022) confirm wide dispersion in profitability and labour productivity across Italian innovative start-ups using a composite performance score, while Bellstam et al. (2021) show, with a text-based measure, that innovation is imperfectly captured by patents and R&D alone. Taken together, this work implies that any innovative-versus-ordinary comparison is a comparison of distributions, not of a homogeneous premium — a point our matched design takes seriously. A second strand reframes innovative status as a problem of information and certification. Because innovative firms confront lenders with innovation-failure risk, uncertain R&D payoffs, cash-flow volatility, and intangible assets of low collateral value, they are systematically harder to finance: Santos (2022) estimates that being innovative raises the probability of being financially constrained by 21–32%, and Hoffmann et al. (2021) show that reducing informational opacity — through more readable disclosure — lowers innovative firms' cost of debt. In this setting a credible public signal can be pivotal. Moro et al. (2020) find that government initiatives reduce lenders' perceived risk and thereby raise entrepreneurial firms' access to bank credit; Pyo (2020) shows that a venture-certification programme heterogeneously improves certified firms' sales, especially for young and innovative ones; and Roche (2020) documents that founder characteristics that are hard for outsiders to observe shape venture outcomes even when invention performance is equivalent. This literature supplies the theoretical backbone of our certification mechanism (Proposition 2): the innovative-firm register can function less as a productivity treatment than as a legitimacy device that repositions firms in capital and product markets. A third strand, however, warns that the same firms are also fragile and self-selected, which is where the identification problem becomes acute. Gimenez-Fernandez et al. (2020) disentangle the liabilities of newness and smallness that depress innovative start-ups' output relative to established SMEs; Guerzoni et al. (2021) and Anderloni (2025) study exactly the Italian post-2012 population and find that innovative firms exhibit stronger financial structures and higher survival, yet — tellingly — take longer to reach profitability, a pattern consistent with risk-return repositioning rather than an unconditional advantage. Anderloni's (2025) use of matching, survival analysis, and panel regressions on Startup-Act firms makes it the closest antecedent to our own comparison, and its ambiguous profitability timing is precisely what a static cross-section cannot resolve. Crucially, most of these studies estimate conditional associations on selected samples; few observe firms before and after they acquire innovative status, so the estimated "effect" conflates who selects into the register with what the register does. This is the gap our event-study benchmark is built to expose. A fourth strand shifts the question from whether to where, and grounds our boundary condition. Istipliler et al. (2023) show that innovative SMEs in weak-institution environments can convert adversity into advantage through innovative capabilities and networking — institutions and firm strategy are substitutes at the margin. Boubakri et al. (2021) establish that national culture and formal institutions shape corporate innovation; Cavallo et al. (2021) and De Pascale (2024) tie innovative start-up activity to entrepreneurial-ecosystem and local institutional quality; and Bhattacharjee et al. (2023) find, specifically for southern Italy, that innovation raises firm survival both directly and through agglomeration spillovers. This literature motivates our institutional-substitution proposition (Proposition 3): the certification value of innovative status should be largest precisely where the surrounding institutional environment is weakest, which in the Italian setting predicts a stronger relative premium in the South — a prediction we test rather than assume. Finally, a policy-evaluation strand supplies the methodological standard against which we position our contribution. The Italian Startup Act has been evaluated by Grilli and Murtinu (2023) for its effect on the human-capital composition of entrants, and comparable "start-up label" schemes have been assessed elsewhere — most rigorously by Ali (2025), who exploits the selection process of Tunisia's Startup Act to compare marginal entrants with marginal rejects and thereby limit selection on unobservables. These designs make explicit what much of the innovative-firm performance literature leaves implicit: absent a credible counterfactual, a raw innovative-versus-ordinary gap is an estimand of selection as much as of treatment. Our contribution is to make that distinction operational within a single study — a propensity-score-matched cross-sectional comparison that quantifies the conditional association, paired with a staggered-adoption event study that recovers the within-firm dynamics around registration — and, in doing so, to give the certification-and-selection account the direct empirical test that the prior literature has largely inferred.
2.1. Theoretical Background
Italy was an early mover in creating a dedicated statutory category for innovation-intensive firms. The 2012 Startup Act (Decree-Law 179/2012) established a public register of "innovative startups", later extended to the wider population of "innovative SMEs", and attached to it a comprehensive set of fiscal, financial and administrative supports. Crucially, eligibility is defined by objective, verifiable criteria—minimum thresholds of research-and-development expenditure, the share of highly qualified personnel, or the holding of registered intellectual property—so that the status is not a self-declared label but a screened, publicly observable marker of innovation orientation. Programme evaluations show that the regime materially improved eligible firms' access to external finance, bank credit and equity (Giraudo et al., 2019; Biancalani et al., 2023; Menon et al., 2018). These studies concentrate on inputs and on the financing channel; the realised, multidimensional performance of the firms that carry the status—and how it should be interpreted—has received far less attention.
The dominant reading of that performance is an "innovation-to-outcome" one. Innovation is associated with higher productivity in Italian SMEs (Hall et al., 2009) and is a first-order driver of growth, especially in high-technology sectors and at the upper quantiles of the growth distribution (Coad and Rao, 2008; Colombo and Grilli, 2010), while innovative startups differ systematically from their traditional peers in growth and survival (Anderloni et al., 2025). Rapid, innovation-driven expansion is, however, frequently episodic and is mirrored by greater volatility and exit risk (Coad et al., 2014; Daunfeldt and Halvarsson, 2015). Yet these regularities describe the effects of innovation as an activity; they do not tell us what the innovative-firm status identifies, nor why the differential associated with it should vary across firms and places. We therefore move from cataloguing effects to a mechanism, and propose that the innovative-firm status is best understood as a contingent certification device whose informational and resource value—and hence the performance differential attached to it—depends on the environment in which it operates.
The framework rests on three linked arguments. First, because eligibility is granted on objective thresholds and made public, the status functions as a certification and screening signal in the sense of signaling theory (Spence, 1973): it separates and makes visible firms whose innovation orientation is otherwise costly for banks, investors and partners to observe, and it does so largely by selecting firms that are already on a dynamic trajectory rather than by transforming laggards. This implies that a substantial part of any measured differential reflects selection into the register rather than a treatment effect of the status—an implication we test directly with the event study of Section 5.4. Second, the certified population is not uniformly "better": innovation-intensive firms carry intangible-heavy asset structures, long and uncertain payback horizons and greater reliance on external finance, so certification marks firms that are repositioned on the risk–return frontier—trading financial stability for growth and margins—rather than firms that dominate ordinary peers. Third, and centrally, the value of a certification signal is not fixed but contingent on the thickness of the local entrepreneurial ecosystem. Where local finance, supplier networks and agglomeration economies are abundant, ordinary firms already access the complementary resources that innovation requires, the public signal is partly redundant, and the certified differential compresses. Where these institutions are thin, the status substitutes for missing local resources and conveys scarcer information and capital, widening the differential. This institutional-substitution logic (Khanna and Palepu, 2000; Rodríguez-Pose, 2013; Iammarino et al., 2019) turns the Italian North–South divide from a descriptive backdrop into a theorised boundary condition.
These arguments yield three mechanism-based propositions, which replace the descriptive hypotheses of the earlier formulation:
- Proposition 1 (risk–return repositioning). Relative to matched ordinary SMEs, innovative SMEs display a distinct performance locus—a positive differential in revenue growth and operating profitability coupled with a negative differential in earnings stability—rather than uniform superiority.
- Proposition 2 (certification through selection). The differential operates predominantly through selection and certification of already-dynamic firms rather than through a behavioural treatment effect of the status, so that the growth differential largely predates entry into the register.
- Proposition 3 (institutional-substitution boundary condition). The certified performance differential is decreasing in the thickness of the local ecosystem: it is largest where supporting institutions are weakest—the Italian South—and compresses where local finance and agglomeration are abundant.
The framework carries explicit scope conditions. It applies to the SME segment (not large firms), under a certification regime based on objective public thresholds, and in a national context marked by pronounced regional institutional heterogeneity; its transferability to discretionary or self-declared innovation labels, or to institutionally homogeneous settings, is an empirical question we return to in the conclusions.
3. Data and Variables
The empirical analysis is based on a firm-level dataset assembled within the LUCE research project from the AIDA–Bureau van Dijk archive of Italian company accounts, which provides up to ten consecutive years of balance-sheet and income-statement information. The working sample comprises 4,043 SMEs, of which 2,873 are registered innovative firms (the treatment group) and 1,170 are ordinary firms drawn from the same sectors and size range (the control group). For every firm we retain identifying and structural information—registered office (province and macro-region), number of employees, revenues, total assets and a sector cluster—together with the six performance indicators described below, each computed over the available multi-year window so as to capture the firm's performance architecture rather than a single-year snapshot. A conceptual clarification is in order. Our treatment variable is the administrative innovative-firm status, not a direct measure of realised innovation output such as patents, new-product sales or R&D productivity. Eligibility is granted on objective but coarse thresholds—R&D intensity, the share of qualified personnel, or the ownership of intellectual property—so the status is best understood as a screened, publicly observable marker of innovation orientation rather than as innovation itself. Accordingly, every differential we report is the differential associated with the status—an innovative-status premium—and not the economic return to innovation as an activity. This is not a limitation to be apologised for but the object of study: consistent with the certification framework of Section 2, what we estimate is the performance signature of the institutional label, which is precisely the quantity relevant to the lenders, investors and policymakers who observe the register rather than the underlying innovation.
The six performance dimensions are defined as follows. Performance persistence is measured by the first-order serial correlation (autocorrelation) of the firm's EBITDA margin over time. This operationalisation follows the persistence-of-profits literature, in which the degree to which abnormal profitability is sustained rather than competed away is captured precisely by the autoregressive coefficient of a firm's profitability series (Mueller, 1977, 1986; Geroski and Jacquemin, 1988; Waring, 1996; McGahan and Porter, 1999): a high value denotes sticky, durable returns—a persistent competitive position, whether advantageous or disadvantageous—whereas a low value indicates rapid reversion toward the sector norm as competition erodes idiosyncratic rents. Revenue growth is the compound annual growth rate of turnover. Labour productivity is revenue per employee; we use revenue rather than value added per worker because value added is not consistently reported across the sample, and we interpret this indicator with particular care for intangible-intensive firms, whose output is imperfectly captured by contemporaneous revenue per employee—productivity is, moreover, one of six dimensions and does not drive any headline result, innovative firms being if anything slightly less productive on this measure. Operating profitability is the average EBITDA margin. Earnings volatility is the coefficient of variation of the EBITDA margin, so that higher values denote greater instability; because the coefficient of variation is known to become unstable when the mean margin approaches zero, EBITDA margins are winsorised at the 1st and 99th percentiles before the dispersion statistic is computed, and, crucially, the fragility finding does not rest on this measure alone but is independently corroborated by the cash-flow-based financial-stability indicator, which does not scale by the mean and points in the same direction, so the conclusion that innovative firms are structurally more fragile is not an artefact of the coefficient of variation. Financial stability is a cash-flow stability index, with higher values denoting steadier internally generated funds. Throughout, higher values are preferable for all indicators except earnings volatility, for which lower values are preferable.
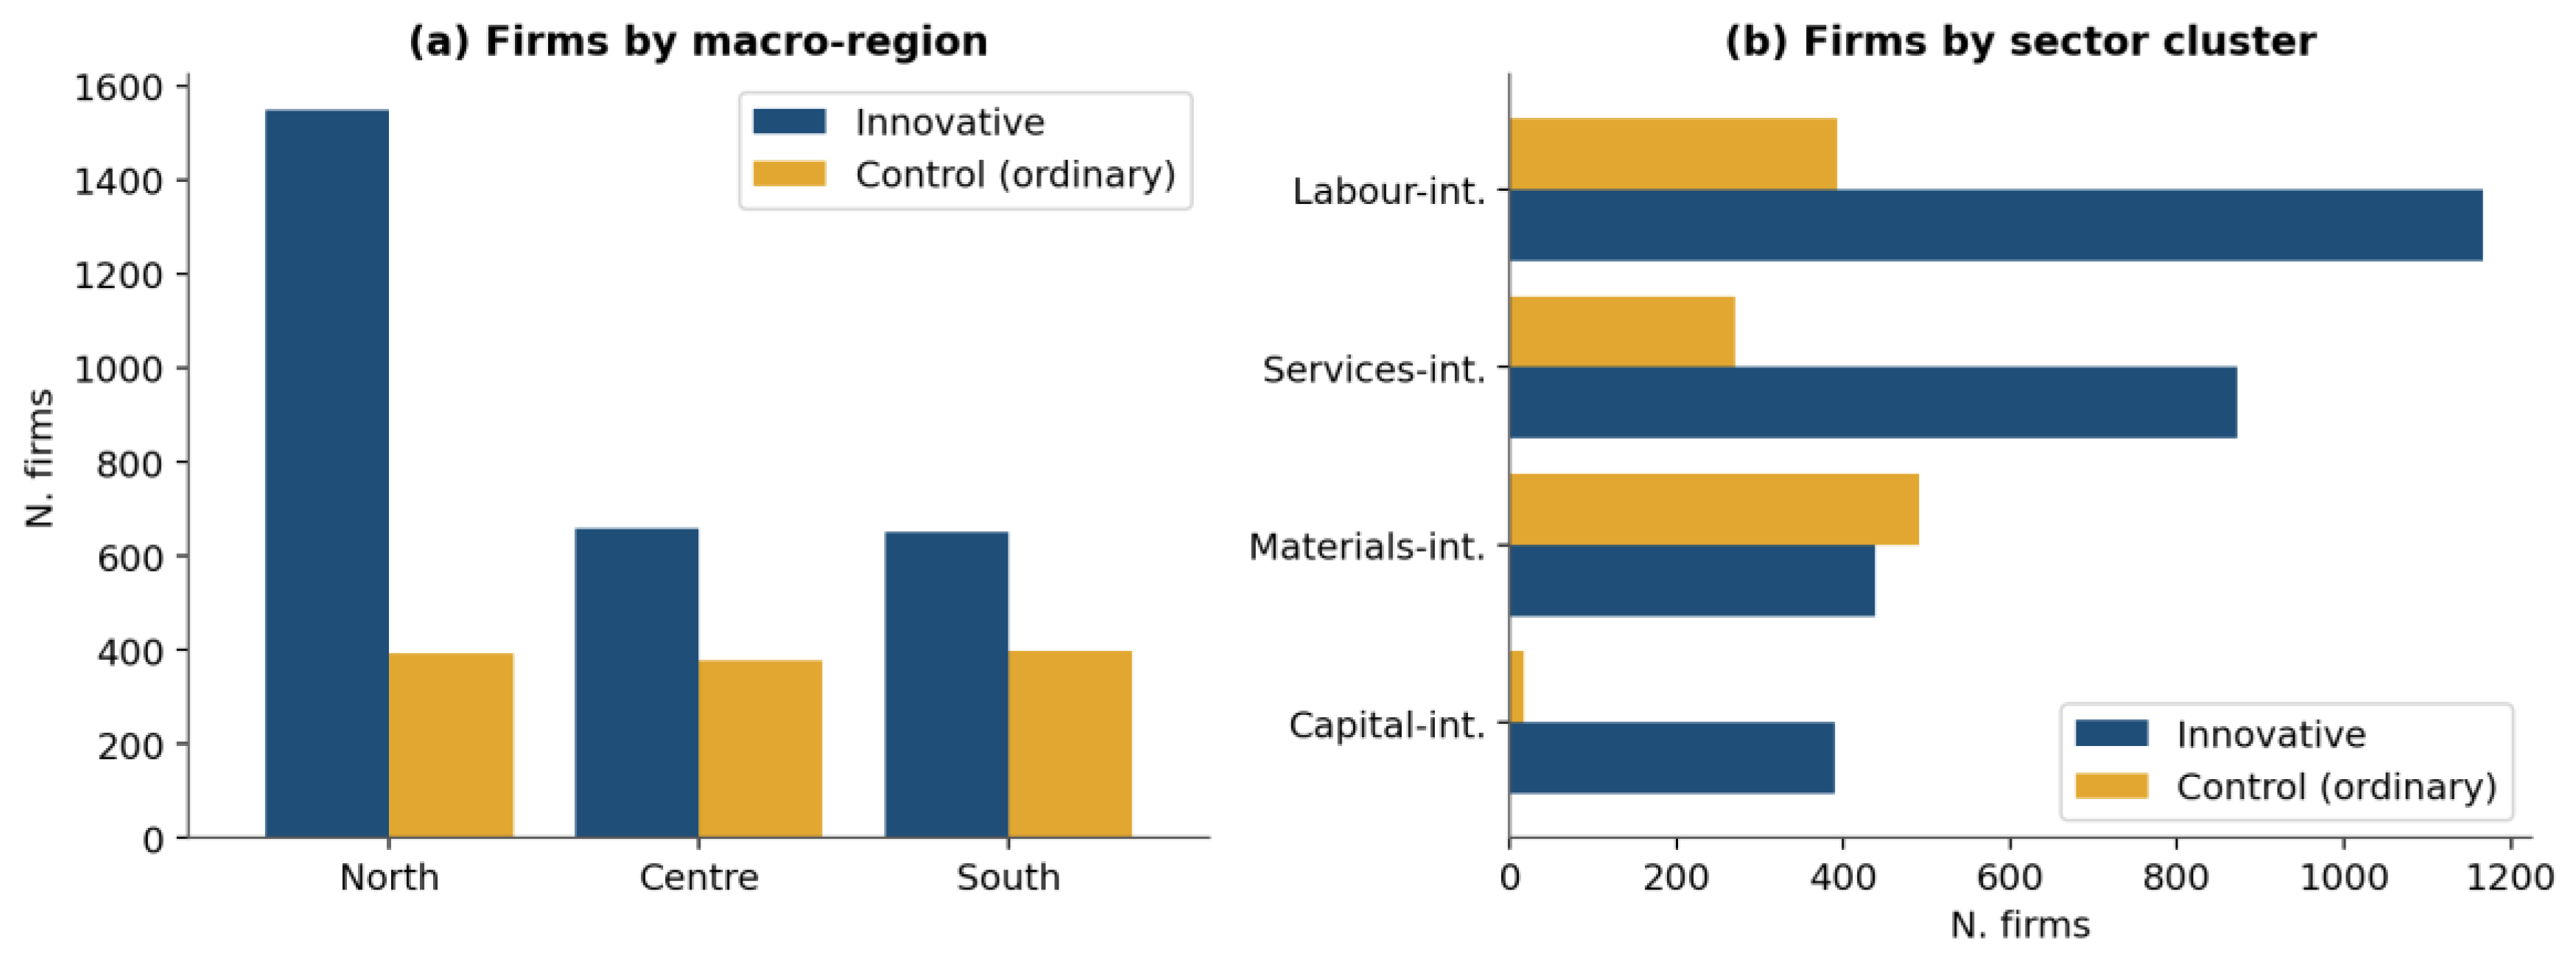
Table 1 summarises the two populations. The comparison immediately reveals why a naïve contrast would be misleading: ordinary firms in the raw sample are considerably larger (median 24 employees and €7.5 million of revenue, against 8 employees and €0.9 million for innovative firms), are more heavily concentrated in materials-intensive activities, and are more evenly spread across the three macro-regions, whereas innovative firms are disproportionately located in the North and tilted toward capital- and services-intensive sectors. These composition differences motivate the matching strategy of Section 4.

Table 1.
Composition and descriptive statistics of the two populations (full sample).
| Variable | Innovative (N = 2,873) | Control / ordinary (N = 1,170) |
| Median employees | 8 | 24 |
| Median revenue (€ thousand) | 873 | 7,515 |
| Median total assets (€ thousand) | 1,682 | 6,161 |
| Location — North | 54.2% | 33.7% |
| Location — Centre | 23.0% | 32.3% |
| Location — South & Islands | 22.8% | 34.0% |
| Sector — Capital-intensive | 13.6% | 1.5% |
| Sector — Labour-intensive | 40.7% | 33.5% |
| Sector — Materials-intensive | 15.3% | 42.0% |
| Sector — Services-intensive | 30.4% | 23.1% |
Notes. Medians reported for size variables; shares computed over non-missing observations within each group. Source: AIDA–Bureau van Dijk.
Figure 1.
Composition of the analytic sample by macro-region (a) and sector cluster (b), innovative versus ordinary firms.
Figure 1.
Composition of the analytic sample by macro-region (a) and sector cluster (b), innovative versus ordinary firms.
4. Empirical Strategy
Our objective is to compare the performance of innovative and ordinary SMEs while holding constant the structural characteristics along which the two populations differ. Because assignment to the innovative-firm register is not random, we adopt a propensity-score matching (PSM) design (Rosenbaum and Rubin, 1983; Caliendo and Kopeinig, 2008). We are explicit about the estimand it recovers. Matching balances the two groups on observable characteristics only; it therefore identifies a conditional association—the performance differential between innovative and ordinary firms of comparable size, sector and macro-region—rather than the causal effect of the innovative status itself, which would require exogenous variation in registration. We regard this conditional differential as the quantity of substantive interest: for investors, lenders and policymakers what matters is whether the innovative label demarcates a firm population with a distinct and predictable performance signature. Accordingly, we use the term innovative-status premium throughout as shorthand for this matched, conditional differential and not as a causal parameter. Under the conditional-independence assumption the differential would additionally carry a causal interpretation; we do not impose that assumption here and instead probe its plausibility directly through the event-study benchmark of Section 5.4.
We first estimate the propensity score—the conditional probability of carrying the innovative status—by a logistic regression of the innovative indicator on the (log) number of employees, (log) revenues, (log) total assets, macro-region fixed effects and sector-cluster fixed effects. We then match each ordinary firm to the nearest innovative firm on the estimated score using one-to-one nearest-neighbour matching without replacement and a calliper of 0.2 standard deviations of the score's logit, discarding unmatched observations outside the region of common support. This procedure yields 1,031 matched pairs.
A comment on the choice of matching covariates is warranted. The propensity score conditions on firm size (log employees, log revenues, log total assets), sector and macro-region—the structural dimensions along which the innovative and ordinary populations differ most sharply. We deliberately do not condition on R&D intensity, the share of qualified personnel, or the ownership of intellectual property: these are the statutory criteria that define innovative-firm status and the very channels through which it operates, so including them would amount to conditioning on the treatment itself and would bias the estimated differential toward zero (Angrist & Pischke, 2009). Other covariates common in the literature—founder human capital, ownership structure, leverage, export status and patent counts—are not recorded in the company-accounts archive for both groups, and we treat their omission as an explicit limitation. Two features of the design bound the residual risk of misspecification. First, the within-firm event study complements the matched comparison precisely here: its firm fixed effects absorb every time-invariant firm characteristic—age, ownership, founder human capital, baseline productivity and R&D propensity, patent stock—so time-invariant confounders that a static propensity score cannot capture cannot drive the panel estimates. Second, we gauge sensitivity to hidden bias through Rosenbaum bounds and coefficient-stability diagnostics (Oster, 2019).
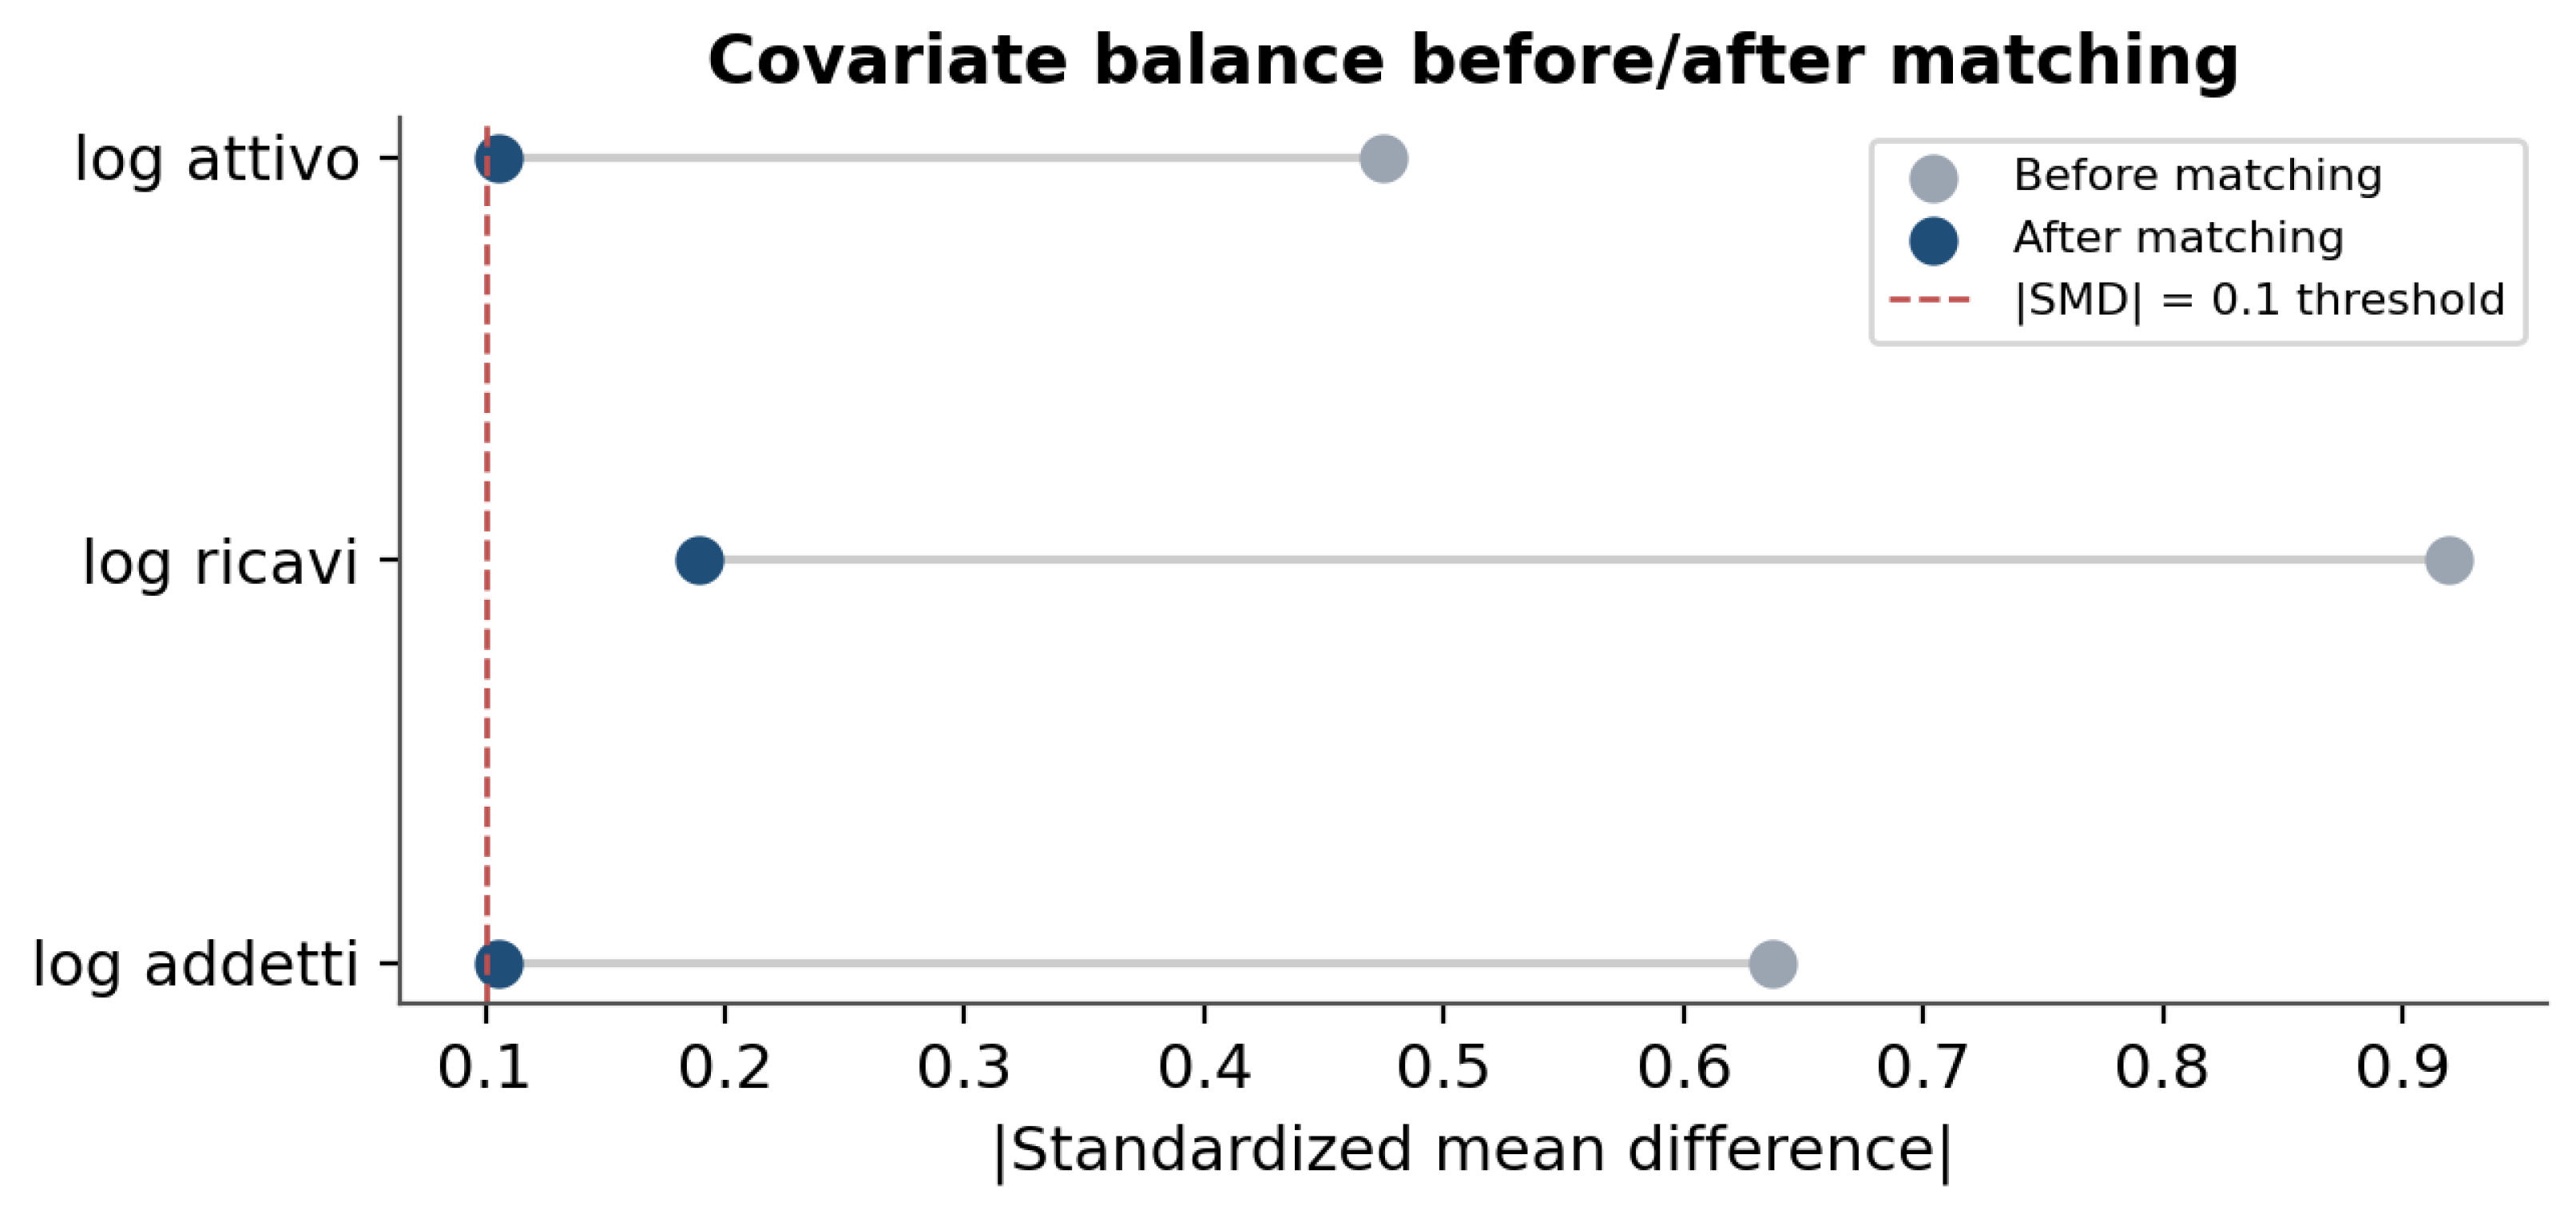
Matching quality is assessed through standardised mean differences (SMD) before and after matching. As Figure 5 shows, the raw sample is badly unbalanced on all three size covariates (|SMD| between 0.47 and 0.92); after matching, every covariate falls to or near the conventional |SMD| < 0.1 threshold, confirming that the matched innovative and ordinary firms are of comparable size, sector and location. Because the performance indicators are strongly skewed and contain heavy tails, we compare the matched groups using medians and the non-parametric Mann–Whitney U test, and we summarise effect magnitudes by the oriented percentage difference in medians (signed so that positive values always denote an innovative advantage) and by the rank-biserial correlation. Because we conduct these comparisons across six performance dimensions, both pooled and within three macro-regions, we guard against false discoveries from multiple testing by adjusting the full family of twenty-four Mann–Whitney p-values with the Benjamini–Hochberg false-discovery-rate procedure and, more conservatively, the Holm–Bonferroni correction. Every result significant at the conventional 5% level survives the FDR adjustment, and the headline findings—the revenue-growth premium, the higher earnings volatility and the lower financial stability—survive even the conservative Holm correction; the weaker pooled differentials (performance persistence, operating profitability and labour productivity) survive the FDR adjustment but not Holm, consistent with our reading of them as suggestive rather than robust, so the reported pattern of significance is not an artefact of multiple comparisons. We stress that these comparisons quantify conditional, matched differentials—associations net of observable composition—rather than treatment effects. All comparisons are additionally reproduced within each macro-region to test Proposition 3.
Figure 5.
Covariate balance before and after matching (absolute standardised mean differences). All covariates fall to or near the 0.1 threshold after matching.
Figure 5.
Covariate balance before and after matching (absolute standardised mean differences). All covariates fall to or near the 0.1 threshold after matching.
5. Results
5.1. Pooled Comparison
Before conditioning on structure, the raw comparison already hints at a two-sided story. Innovative firms display a much higher median revenue growth (0.234 versus 0.073) and a higher EBITDA margin (8.45% versus 6.20%), but lower labour productivity (€112,776 versus €181,579 of revenue per employee), higher earnings volatility (0.82 versus 0.53) and markedly lower financial stability (0.80 versus 1.36). Part of the productivity and stability gap, however, reflects the fact that ordinary firms in the raw sample are larger and more asset-heavy; the matched comparison isolates the innovation signal.
5.2. Matched Comparison
Table 2 and Figure 2 report the core result on the matched sample of 1,031 pairs. The growth premium is large and highly significant: the median revenue-growth rate of innovative SMEs is roughly three-and-a-half times that of comparable ordinary firms (0.244 versus 0.070; p < 0.001), corroborating Proposition 1. Operating profitability is also significantly higher for innovative firms (median EBITDA margin 9.59% versus 7.05%; +36%, p < 0.05), supporting Proposition 1, and performance persistence is marginally higher (+8%, p < 0.05).
To interpret this growth premium economically rather than rhetorically, note that the +246% figure is a ratio of medians; in absolute terms the median innovative SME grows at 24.4% per year against 7.0% for its matched ordinary counterpart, a gap of 17.3 percentage points of annual revenue growth. Compounded, this implies that the median innovative firm roughly triples its revenue over five years (×2.97) while the median ordinary firm grows by about 40% (×1.40)—an economically large but not implausible divergence for a population selected on innovation orientation. The premium is not an artefact of a few extreme firms: it is positive at every decile of the growth distribution from the 10th to the 90th, and 94% of innovative firms—against 88% of ordinary firms—record positive growth. It does, however, widen markedly in the upper tail, from +6.8 percentage points at the 25th percentile to +46.5 at the 75th and +87.9 at the 90th, because the innovative population contains far more hyper-growth firms: 30.6% grow faster than 50% per year, against only 2.6% of ordinary firms. This right-skewness—the innovative mean, 51%, far exceeds its median, 24%—is precisely why we rely throughout on medians and rank-based Mann–Whitney tests, which are robust to outliers, rather than on means; the reported differentials therefore describe the typical firm, not the tail.
At the same time, the fragility penalty anticipated by Proposition 1 is clearly visible. Innovative SMEs are significantly more volatile (earnings-volatility coefficient of variation 0.62 versus 0.56; +10% worse, p < 0.01) and significantly less financially stable (cash-flow stability 1.08 versus 1.30; −17%, p < 0.001). Labour productivity remains slightly lower for innovative firms even after matching (−10%, p < 0.01), consistent with their younger, more intangible-intensive and scale-constrained profile. The overall picture is therefore not one of unconditional superiority but of a distinctive performance architecture—growth- and margin-oriented, yet structurally more fragile.
Because statistical significance alone can mislead when samples are large, we read each differential as a magnitude with associated uncertainty, reporting in Table 2 a bootstrap 95% confidence interval and a rank-biserial effect size alongside every p-value. Seen this way, two effects are economically material. The revenue-growth premium is large by conventional benchmarks (rank-biserial correlation 0.53; median gap +17.3 percentage points of annual growth, 95% CI [+14.6, +20.2]), and the financial-stability penalty is moderate (rank-biserial 0.20; −0.22, 95% CI [−0.33, −0.14]). The remaining differentials, though several are statistically detectable, are small in effect-size terms—operating profitability (rank-biserial 0.06; +2.5 percentage points, 95% CI [+1.4, +3.5]), labour productivity (0.07) and performance persistence (0.06, whose confidence interval includes zero)—and we accordingly treat them as second-order rather than on a par with the growth and fragility results. Reading the evidence through effect sizes and interval estimates thus sharpens rather than softens the conclusion: the innovative-status signature is dominated by faster growth bought at the price of greater financial fragility, while the other dimensions are, at most, minor.
Figure 3 visualises the same tension in the productivity–profitability space that underlies the composite benchmarking tradition. The cloud of innovative firms sits higher on the profitability axis but slightly to the left on the productivity axis relative to ordinary firms, so that the innovation advantage is unambiguous in margins but not in revenue efficiency per worker.
5.3. Spatial Heterogeneity
Table 3 and Figure 4 disaggregate the matched comparison by macro-region and reveal pronounced spatial heterogeneity, supporting Proposition 3. In the South, innovative SMEs outperform comparable ordinary firms on almost every dimension: they grow far faster (+216%, p < 0.001), are markedly more persistent (+49%, p < 0.001) and, strikingly, are also more productive (+19%, p < 0.01) and no less financially stable than their ordinary peers. In the North and Centre, by contrast, the innovative-status premium is confined to growth and margins and is offset by significantly higher volatility and lower financial stability, together with lower labour productivity. In other words, the innovative-firm status delivers its broadest and most robust dividend precisely where the surrounding entrepreneurial ecosystem is thinnest. The regional subsamples remain sizeable, which mitigates concerns about statistical power: the matched sample divides into 775 firms in the North (383 innovative, 392 ordinary), 677 in the Centre (319 and 358) and 610 in the South (329 and 281), so that each regional comparison rests on several hundred matched firms per group rather than on thin cells. The significant regional effects are, moreover, far from marginal—most clear the p < 0.001 threshold—and the pooled region-by-status interaction reported below provides a higher-powered test of the same heterogeneity that does not split the sample at all.
To establish that this spatial heterogeneity is a genuine feature of the data rather than an artefact of splitting the sample, we test it formally by interacting the innovative-status indicator with macro-region dummies in the matched sample, taking the North as the reference category and using heteroskedasticity-robust standard errors. The interaction is statistically significant for three of the six dimensions: relative to the North, the innovative-status differential in the South is significantly larger for labour productivity (interaction +€108.6 thousand per employee, p < 0.001), for financial stability (+0.58, p < 0.001) and for operating profitability (+6.2 percentage points, p = 0.004), whereas the revenue-growth premium does not differ significantly across regions (p > 0.5) and is therefore uniformly large. The territorial pattern is thus statistically real, not merely narrated: the innovative-status premium broadens in the South on precisely those dimensions—productivity, financial stability and profitability—where the local ecosystem matters most. This ordering is, moreover, a directional prediction of the institutional-substitution mechanism rather than a post-hoc rationalisation: the Italian macro-regions are independently and consistently ranked by institutional quality, with the South below the Centre below the North on standard institutional-quality indices for Italian provinces (Nifo and Vecchione, 2014), so the observed widening of the premium exactly where institutions are weakest is what Proposition 3 predicts ex ante.
5.4. Selection Versus Treatment: An Event-Study Benchmark
The matched cross-sectional comparison recovers a conditional differential but, as we have stressed, does not by itself separate the effect of the innovative status from selection into it. This is the crux of the identification problem: registration is voluntary, and it is plausible that more able, more ambitious or more skilled entrepreneurs are precisely those who choose to register, so that matching on size, sector and location—which balances only observable structural characteristics—cannot rule out that the differential reflects unobserved entrepreneurial quality rather than the status itself. To confront this concern head-on we exploit the longitudinal structure of the data and the exact timing of entry into the innovative-firm register. For the 1,132 firms whose registration year can be identified, we reconstruct an annual panel of 11,275 firm-year observations and estimate a dynamic event study relating the outcome to indicators for years relative to registration, with firm and calendar-year fixed effects and standard errors clustered by firm. Identification rests on a within-firm before/after contrast in which firms that have not yet registered serve as the time-varying control group—a staggered-adoption design—so that the estimand is the effect of registration among registrants rather than the innovative-versus-ordinary differential of the matched comparison. The year immediately preceding registration (t − 1) is the reference period. Crucially for the selection concern, this specification speaks directly to the worry about unobserved entrepreneurial characteristics. Because founder ability, ambition, risk appetite and human capital are essentially fixed at the firm level, the firm fixed effects absorb them in full: the within-firm contrast nets out every time-invariant firm- and founder-level determinant of performance—exactly the unobservables that matching cannot remove—so these traits cannot mechanically generate the estimates. What identification still requires is only the weaker condition that no unobserved shock varying over time coincide systematically with the timing of registration, a possibility we probe directly through the pre-registration trend test.
Figure 6 reports the revenue (growth) channel, and two features stand out. First, revenues rise steeply and monotonically in the six years before registration—from roughly −1.6 log points at t − 6 up to the reference at t − 1—and the joint test of the pre-registration coefficients overwhelmingly rejects the parallel-trends assumption (p < 0.001). Firms therefore enter the register only after they have already embarked on a strong growth trajectory: rather than being hidden, self-selection is visible and measurable in the pre-registration path, and it is the dominant force in the revenue channel. Second, revenues keep rising after registration, but because the upward path clearly predates the event, this post-entry increase cannot be attributed to the status itself. The large matched growth differential documented earlier is thus, to a substantial degree, a manifestation of selection and anticipation rather than a causal effect of registration. Far from being ignored, then, selection is quantified here and identified as the principal driver of the raw growth premium—a finding that turns the central threat to a cross-sectional reading into an explicit empirical result.
Figure 7 reports the profitability (EBITDA-margin) channel, where the picture differs. The pre-registration coefficients are markedly flatter and the joint pre-trend test is not significant at conventional levels (p ≈ 0.09), so the parallel-trends assumption is considerably more defensible for margins than for revenues. The post-registration path is positive—of the order of five to six margin points—but individually imprecise and not statistically significant. The profitability differential is therefore more consistent with a modest post-registration change than with pure selection, although the evidence is weak.
Read together, the two designs are complementary rather than contradictory. The propensity-score-matched comparison recovers a robust conditional performance differential—the quantity of interest for benchmarking and signalling—while the event study clarifies its interpretation: the growth advantage is largely selective, reflecting the fact that firms register once they are already expanding, whereas the profitability advantage is more plausibly, if weakly, a post-registration phenomenon. This reconciliation is itself a contribution, delineating where the innovative-firm status is a descriptive marker of already-dynamic firms and where it may carry an incremental effect, and cautioning against a causal reading of cross-sectional innovation premia. Two caveats apply. The two-way fixed-effects event study can be biased under strongly heterogeneous, staggered treatment timing, so interaction-weighted estimators (Sun and Abraham, 2021; Callaway and Sant'Anna, 2021) are a natural robustness check; and the recent registration cohorts (2024–2026) contribute only short post-entry windows.
5.5. Robustness
To address the concern that our findings might hinge on a single, arbitrary matching specification, we subject the comparison to an extensive robustness battery: tighter and looser calipers (0.1 and 0.5 SD of the logit), 1:3 nearest-neighbour matching, matching with replacement, Mahalanobis-metric matching, and three weighting and doubly robust estimators—inverse-probability weighting, augmented IPW, and entropy balancing—on common support (Table 4). Reassuringly, the baseline specification reproduces the main matched estimates, and the qualitative pattern is stable across all nine estimators: the revenue-growth premium remains positive and statistically significant throughout (oriented differential 0.15–0.38), and the fragility penalty—lower financial stability—remains negative and significant. We further probe hidden bias directly. Rosenbaum bounds show that the growth result is insensitive to an unobserved confounder until it would raise the odds of registration by a factor of Γ ≈ 4.6, and the Oster (2019) coefficient-stability statistic for growth (|δ| ≈ 8.7, far above the |δ| > 1 benchmark) implies that selection on unobservables would have to exceed selection on observables several-fold to explain the differential away. The profitability premium is less robust: positive under every matching estimator, it attenuates and can reverse under weighting, and its sensitivity thresholds (Rosenbaum Γ ≈ 0.95; Oster δ ≈ 0.32) fall below conventional benchmarks—consistent with the event-study evidence that the profitability channel is weaker and more selection-prone than the growth channel. We report this heterogeneity transparently rather than privileging the specification most favourable to the innovative-firm status.
Finally, the pattern is not an artefact of relying on a rank-based test but is confirmed by the richer estimators one might prefer to a simple non-parametric comparison. A quantile regression of revenue growth on the innovative-status indicator, controlling for firm size, sector and macro-region, yields a positive and highly significant status coefficient at every decile of the conditional growth distribution—rising monotonically from +3.5 percentage points at the 10th percentile to +17.2 at the median, +46.0 at the 75th and +86.5 at the 90th (all p < 0.001)—which formally corroborates the upper-tail fan-out documented above, and a Huber robust regression on winsorised growth returns a status effect of +18.7 percentage points (z = 22.4). These cross-sectional estimators sit alongside the panel two-way fixed-effects event study of Section 5.4 and the inverse-probability-weighted, doubly robust and entropy-balancing estimators of Table 4, so that the innovative-status premium is robust across non-parametric, quantile, robust-regression, weighting and panel methods rather than resting on any single test. We retain the Mann–Whitney comparison in the main tables only as a transparent, outlier-robust summary of the matched medians, not as the sole basis for inference.
Oriented differential (positive = innovative advantage). Matched sample of 1,031 pairs drawn from 4,043 firms. * p < 0.05. Notes. Oriented so positive = innovative advantage (earnings-volatility sign reversed). Baseline = 1:1 nearest-neighbour, caliper 0.2 SD of the logit, no replacement — reproducing the main matched estimates. Matching estimators (rows 1–6): oriented difference in medians, Wilcoxon signed-rank test on matched pairs. Weighting/doubly robust estimators (rows 7–9): oriented mean difference on common support, outcomes winsorised at 2.5/97.5%. The revenue-growth premium and the financial-stability penalty are stable and significant across all nine estimators; the profitability premium is positive under matching but attenuates and reverses under weighting, and its Γ* and δ fall below the robustness benchmarks — consistent with the event-study evidence that the profitability channel is selection-prone. Source: AIDA–Bureau van Dijk. Author calculations.
6. Discussion
The results paint a coherent and theoretically intelligible picture. Once size, sector and location are held constant, the innovative-firm status is associated with a distinctive bundle of performance properties rather than with uniform superiority. Innovative SMEs grow substantially faster and, more tentatively, earn higher operating margins than comparable ordinary firms—consistent with the innovation-growth and innovation-profitability mechanisms documented for Italian SMEs by Hall et al., 2009 and for high-technology firms by Coad and Rao (2008); the growth differential is robust across estimators, whereas the margin differential is not, and we read it accordingly. Yet this dynamism is purchased at the price of greater earnings instability and weaker financial stability, exactly the fragility that the high-growth-firms literature associates with rapid, innovation-driven expansion (Coad et al., 2014; Daunfeldt and Halvarsson, 2015). The slightly lower labour productivity of innovative firms is consistent with their younger age, smaller scale and intangible-heavy asset base, whose returns accrue with a lag and are imperfectly captured by contemporaneous revenue-per-employee measures.
Several of these findings sit in tension with prominent alternative accounts, and it is in adjudicating that tension—rather than in restating our own results—that the evidence earns its interpretation. The most counterintuitive result is that innovative SMEs are, if anything, less productive per worker than matched ordinary firms, which runs against the Schumpeterian expectation that innovation raises measured productivity (Hall et al., 2009). We read this not as a refutation of that mechanism but as evidence that, for young and intangible-intensive firms, the returns to innovation accrue in growth options and future rents rather than in current revenue per employee—an interpretation the event study supports, since these firms are still on a steep expansion path. Second, the growth premium is largely selective rather than a behavioural effect of the status, which is uncomfortable for the policy-evaluation reading under which the Startup Act causally upgrades firm performance; our evidence instead favours a certification account, in which the register sorts and renders visible firms that are already dynamic. Third, and most striking, the premium is broadest precisely where the surrounding ecosystem is weakest—the opposite of what an agglomeration or "thick-ecosystem" account predicts, under which co-location with dense innovation resources should amplify, not compress, the advantage of innovative firms (Cavallo et al., 2021). That we observe compression in the resource-rich North and expansion in the resource-poor South is the discriminating signature of institutional substitution rather than agglomeration, and it is this ex-ante prediction—not a mere description of the regional gap—that the spatial interaction confirms. Finally, the profitability premium, sizeable in the raw comparison, does not survive our robustness battery; rather than suppress this, we treat the divergence between the durable growth advantage and the fragile margin advantage as itself informative about which elements of the innovative-status signature are structural and which are contingent.
The spatial pattern is the study's most policy-relevant contribution, and—following the formal region-by-status interaction reported above—a statistically significant one rather than a descriptive impression. The innovative-status premium is not a spatial constant: it is broad-based and robust in the South, where it extends even to labour productivity and financial stability, but narrows to a growth-and-margin advantage—shadowed by fragility—in the North and Centre. This ordering is what the institutional-substitution mechanism predicts ex ante rather than a post-hoc reading of the data: in thick ecosystems ordinary firms already appropriate part of the returns that, in thin ecosystems, remain the preserve of innovation leaders, so that the measured gap between innovative and ordinary firms compresses where agglomeration and local finance are abundant and widens where they are scarce (Iammarino et al., 2019); and the Italian macro-regions are independently ranked on institutional quality in precisely that order—South below Centre below North (Nifo and Vecchione, 2014). The innovative-firm status thus behaves as a stronger signal of latent quality in weaker regional environments.
A word on mechanisms is warranted, since a matched differential and its spatial pattern could in principle arise through several channels—selection into the register, differential access to credit, founder human capital, or innovation intensity—and we adjudicate the two distinctions the data can support while remaining explicit about the rest. First, the event study separates selection from a behavioural effect of the status: because the revenue-growth advantage largely predates registration, selection and certification of already-dynamic firms—rather than a post-registration change in conduct—is the dominant channel for growth, and the firm fixed effects absorb time-invariant founder human capital, ruling that channel out as a driver of the within-firm estimates. Second, the region-by-status interaction discriminates the certification and institutional-substitution mechanism from a pure innovation-to-productivity account: only the former predicts the premium to be largest where local institutions are weakest, which is precisely what we observe. What our accounting data cannot do is decompose the residual differential into finer sub-channels—differential bank credit, human-capital quality or realised innovation intensity—none of which is recorded at the firm level for both groups. Consistent with our reading of the status as a certification signal rather than a measure of innovation, we therefore treat these as open questions for a channel-decomposition study drawing on linked credit-register, patent and workforce data, rather than as interpretations we can adjudicate here.
7. Policy Implications
Because our design identifies a conditional association—an innovative-status premium—rather than the causal effect of the regime, and because the event study attributes much of the growth premium to selection, we frame the following implications around the diagnostic and informational value of the status, not around causal returns to the policy that our evidence cannot establish. Three implications follow, and each is deliberately of that kind. First, since the innovative population is systematically more volatile and less financially stable than observably similar ordinary firms, lenders, guarantee schemes and public support programmes that already channel resources to these firms should pair growth-oriented instruments with others that address financial fragility—patient equity, cash-flow-smoothing guarantees and working-capital support; this is a risk-management inference about a known population, and it does not require a causal interpretation of the status. Second, because the status operates as a more informative signal of latent quality precisely where local institutions are weakest, the screening and diagnostic tools that rely on it are most valuable in lagging regions such as the South; we deliberately stop short of asserting a higher causal marginal social return there, which would require the threshold-based or experimental evaluation we flag as future work, and we frame the point instead as one about where the signal carries the most information. Third, the multidimensional performance signature documented here can be embedded in the benchmarking and diagnostic instruments used by development agencies and lenders to flag innovative firms in need of capability-development or stabilisation support, complementing the composite performance-gap and reskilling tools developed elsewhere within the LUCE project. In short, our results license better use of the register as an information device; they do not, on their own, license strong claims about the causal returns to the regime, and we are explicit that any prescription to expand, contract or reweight it must await a design with exogenous variation in registration.
8. Limitations
Several limitations qualify our findings and delineate the boundaries within which they should be read. First, the matched comparison identifies a conditional association rather than a causal effect. Propensity-score matching balances the two groups only on observable characteristics—here size, sector and macro-region—so that unobserved determinants of both registration and performance, such as founder human capital, managerial quality or unmeasured technological opportunity, may contribute to the estimated differential. We take several steps to bound this concern rather than assume it away. The event-study benchmark of Section 5.4 exploits the panel and the timing of entry into the register to separate selection from any post-registration change, showing that the revenue-growth advantage largely predates registration, while the profitability differential is more consistent with a modest post-entry effect; its firm fixed effects, moreover, absorb all time-invariant unobserved heterogeneity—founder ability, human capital, ownership—directly relaxing the ignorability assumption rather than imposing it. That design carries its own limitations: it identifies the effect of registration among registrants rather than the innovative-versus-ordinary differential of the matched analysis; the two-way fixed-effects estimator can be biased under strongly heterogeneous, staggered adoption, so interaction-weighted estimators (Sun and Abraham, 2021; Callaway and Sant'Anna, 2021) are a natural robustness check; and the most recent registration cohorts (2024–2026) contribute only short post-entry windows. We further probe departures from ignorability directly through formal sensitivity analyses reported in Table 4: Rosenbaum bounds indicate that the revenue-growth differential is robust to substantial hidden bias—an unobserved confounder would have to raise the odds of registration by a factor of Γ ≈ 4.6 before the result loses significance—while the Oster (2019) coefficient-stability statistic (|δ| ≈ 8.7 for growth) implies that selection on unobservables would have to exceed selection on observables several-fold to explain the differential away. The same diagnostics show, transparently, that the profitability differential does not clear these thresholds and should be read as suggestive rather than robust. A design based on the objective eligibility thresholds—a regression discontinuity in R&D intensity or qualified-staff share—would sharpen identification further still, but requires running-variable information not available in our data.
Second, and conceptually prior to the identification question, our treatment variable is an administrative status and not a measure of realised innovation. Registration in the innovative-firm register certifies that a firm meets objective eligibility thresholds—R&D intensity, the share of qualified personnel, or the ownership of intellectual property—but it does not record innovation output such as patents granted, new-product sales or the productivity of R&D. The status is therefore a screened yet coarse public marker of innovation orientation, not the economic construct of innovation itself. We are deliberate about this distinction: throughout, we interpret our estimates as an innovative-status premium—the performance signature of the institutional label observed by lenders, investors and policymakers—rather than as a return to innovation as an activity, and we caution readers against reading the two as equivalent. The label is, moreover, internally heterogeneous, pooling firms that qualify through different channels; because these channels plausibly carry different performance profiles, our estimates represent an average across a composite category, and disaggregating by eligibility route—or complementing the status with direct innovation-output measures—would sharpen the construct and is a priority for future work.
Third, the sample, though large (4,043 firms), is not a probability sample of the universe of Italian innovative SMEs. Because the accounts are drawn from firms that survive long enough to file multi-year statements, survivorship may under-represent the weakest firms—those that exit early—plausibly attenuating the fragility we document and biasing the growth and profitability differentials upward. This direction of bias is worth emphasising: it makes the fragility penalty we report a conservative lower bound and gives an additional reason to discount the growth premium (already shown to be largely selective) and to treat the profitability differential as non-robust, so survivorship works against our headline claims rather than manufacturing them. Relatedly, a companion survival analysis of firm exit is the one temporal design we do not implement, alongside the fixed-effects event study and the staggered-adoption comparison that we do; it would complement the performance analysis by modelling firm mortality directly, but we leave it to future work for a concrete data reason. A well-identified duration model requires firm foundation and cessation dates for both the innovative and the ordinary populations, which the accounting archive underlying our sample does not record; an extraction that adds legal status and constitution and cessation dates for both groups would enable Kaplan–Meier, log-rank and Cox estimation, and we flag this as a priority for subsequent research. Fourth, our indicators capture financial and productivity performance but not the wider private and social returns to innovation—knowledge spillovers, patenting, product novelty, employment quality or environmental outcomes—so the analysis speaks to the accounting footprint of the innovative status, not to its full welfare content. Fifth, the evidence is specific to the Italian institutional setting and to the observation window. The magnitude of the differential, and especially its pronounced spatial heterogeneity, reflect features of Italy's regional divide and of the Startup-Act framework that may not transfer to other national schemes; cross-country replication is needed to establish external validity. Finally, all indicators derive from a single accounting archive (AIDA) and are therefore subject to the usual reporting, valuation and sector-comparability limitations of company-accounts data. None of these caveats overturns the paper's core contribution, because that contribution is a conditional, certification-based characterisation of the innovative-firm population and its spatial contingency—not a causal evaluation of the regime. The caveats bound the causal extension and the external generalisation of that characterisation, not the descriptive and diagnostic claims the design actually supports; several, indeed—selection, which is itself a documented result, and survivorship, which biases against our findings—are constitutive of the contribution rather than threats to it. Each therefore marks a direction for extension rather than a flaw that negates the result.
9. Conclusions
Drawing on ten years of balance-sheet data for 4,043 Italian SMEs and a propensity-score-matched comparison of innovative and ordinary firms, this paper shows that Italy's innovative-firm status is associated with a distinctive and spatially contingent performance architecture: a large and robust revenue-growth premium coexisting with higher earnings volatility, weaker financial stability and marginally lower labour productivity, together with a profitability advantage that is sizeable in the raw comparison but does not survive our robustness battery. A within-firm event study shows that the growth premium largely predates registration, so the status is best understood as certifying and rendering visible already-dynamic firms rather than as causally upgrading them; and a formal region-by-status interaction confirms that the premium is broadest where local institutions are weakest, consistent with an institutional-substitution boundary condition. Innovative SMEs are therefore not unconditionally superior firms but growth-oriented, structurally more fragile organisations whose measured advantage is largely selective and most pronounced in weaker regional environments. Read this way, the innovative-firm register is valuable primarily as an informative screening and monitoring device—flagging a firm population that is more dynamic but more fragile, and carrying most signal where local institutions are thin—rather than as a policy whose causal returns we have measured. Support instruments that already reach these firms should accordingly pair growth-oriented incentives with fragility-reducing finance, while any prescription to expand, contract or reweight the regime must await an evaluation exploiting exogenous variation in registration, which we flag as a priority for future research.
Acknowledgments
This research was supported by the project “LUtech Campus Ecosystem – LUCE”, Project Code 22ROJB5, funded under a subsidized financing scheme of the Puglia Region within the framework of a Program Agreement (Contratto di Programma). The authors gratefully acknowledge this financial support, which made this study possible.
References
- Ali, N., Cali, M., & Rijkers, B. (2025). Promoting innovative startups: Quasi-experimental evidence from Tunisia. Journal of Development Economics, 177, 103539. [CrossRef]
- Ali, N., Cali, M., & Rijkers, B. (2025). Promoting innovative startups: Quasi-experimental evidence from Tunisia. Journal of Development Economics, 177, 103539. [CrossRef]
- Anderloni, L., & Harasheh, M. (2025). Innovative startups and their traditional peers: Further evidence using performance and survival analysis. Review of Financial Economics, 43(3), 317-335. [CrossRef]
- Anderloni, L., & Harasheh, M. (2025). Innovative startups and their traditional peers: Further evidence using performance and survival analysis. Review of Financial Economics, 43(3), 317–335. [CrossRef]
- Angrist, J. D., & Pischke, J. S. (2009). Mostly harmless econometrics: An empiricist's companion. Princeton university press.
- Bellstam, G., Bhagat, S., & Cookson, J. A. (2021). A text-based analysis of corporate innovation. Management Science, 67(7), 4004–4031. [CrossRef]
- Benjamini, Y., & Hochberg, Y. (1995). Controlling the false discovery rate: a practical and powerful approach to multiple testing. Journal of the Royal statistical society: series B (Methodological), 57(1), 289-300. [CrossRef]
- Bhattacharjee, A., Maietta, O., & Mazzotta, F. (2023). Spatial agglomeration, innovation and firm survival for Italian manufacturing firms. Spatial Economic Analysis, 18(3), 318–345. [CrossRef]
- Biancalani, F., Czarnitzki, D., & Riccaboni, M. (2022). The Italian start up act: A microeconometric program evaluation. Small Business Economics, 58(3), 1699-1720.
- Boubakri, N., Chkir, I., Saadi, S., & Zhu, H. (2021). Does national culture affect corporate innovation? International evidence. Journal of Corporate Finance, 66, 101847. [CrossRef]
- Caliendo, M., & Kopeinig, S. (2008). Some practical guidance for the implementation of propensity score matching. Journal of economic surveys, 22(1), 31-72. [CrossRef]
- Callaway, B., & Sant’Anna, P. H. (2021). Difference-in-differences with multiple time periods. Journal of econometrics, 225(2), 200-230. [CrossRef]
- Cavallo, A., Ghezzi, A., & Rossi-Lamastra, C. (2021). Small-medium enterprises and innovative startups in entrepreneurial ecosystems: Exploring an under-remarked relation. International Entrepreneurship and Management Journal, 17(4), 1843–1866. [CrossRef]
- Coad, A., & Rao, R. (2008). Innovation and firm growth in high-tech sectors: A quantile regression approach. Research policy, 37(4), 633-648. [CrossRef]
- Coad, A., Daunfeldt, S. O., Hölzl, W., Johansson, D., & Nightingale, P. (2014). High-growth firms: introduction to the special section. Industrial and corporate change, 23(1), 91-112. [CrossRef]
- Colombo, M. G., & Grilli, L. (2010). On growth drivers of high-tech start-ups: Exploring the role of founders' human capital and venture capital. Journal of business venturing, 25(6), 610-626. [CrossRef]
- Daunfeldt, S. O., & Halvarsson, D. (2015). Are high-growth firms one-hit wonders? Evidence from Sweden. Small Business Economics, 44(2), 361-383.
- De Pascale, G., Pronti, A., & Zoboli, R. (2024). The role of local institutional quality for the digital and environmental transitions in Italy. Structural Change and Economic Dynamics, 71, 689–705. [CrossRef]
- Edeh, J. N., Obodoechi, D. N., & Ramos-Hidalgo, E. (2020). Effects of innovation strategies on export performance: New empirical evidence from developing market firms. Technological Forecasting and Social Change, 158, 120167. [CrossRef]
- Geroski, P. A., & Jacquemin, A. (1988). The persistence of profits: a European comparison. The economic journal, 98(391), 375-389. [CrossRef]
- Gimenez-Fernandez, E. M., Sandulli, F. D., & Bogers, M. (2020). Unpacking liabilities of newness and smallness in innovative start-ups: Investigating the differences in innovation performance between new and older small firms. Research Policy, 49(10), 104049. [CrossRef]
- Giraudo, E., Giudici, G., & Grilli, L. (2019). Entrepreneurship policy and the financing of young innovative companies: Evidence from the Italian Startup Act. Research Policy, 48(9), 103801. [CrossRef]
- Grilli, L., Mrkajic, B., & Giraudo, E. (2023). Industrial policy, innovative entrepreneurship, and the human capital of founders. Small Business Economics, 60(2), 707–728. [CrossRef]
- Guerzoni, M., Nava, C. R., & Nuccio, M. (2021). Start-ups survival through a crisis. Combining machine learning with econometrics to measure innovation. Economics of Innovation and New Technology, 30(5), 468–493. [CrossRef]
- Hall, B. H., Lotti, F., & Mairesse, J. (2009). Innovation and productivity in SMEs: empirical evidence for Italy. Small business economics, 33(1), 13-33. [CrossRef]
- Hoffmann, A. O. I., & Kleimeier, S. (2021). Financial disclosure readability and innovative firms' cost of debt. International Review of Finance, 21(2), 699–713. [CrossRef]
- Holm, S. (1979). A simple sequentially rejective multiple test procedure. Scandinavian journal of statistics, 65-70.
- Iammarino, S., Rodriguez-Pose, A., & Storper, M. (2019). Regional inequality in Europe: evidence, theory and policy implications. Journal of economic geography, 19(2), 273-298. [CrossRef]
- Istipliler, B., Bort, S., & Woywode, M. (2023). Flowers of adversity: Institutional constraints and innovative SMEs in transition economies. Journal of Business Research, 154, 113306. [CrossRef]
- Khanna, T., & Palepu, K. (2000). Is group affiliation profitable in emerging markets? An analysis of diversified Indian business groups. The journal of finance, 55(2), 867-891. [CrossRef]
- Le, D. V., Le, H. T. T., Pham, T. T., & Vo, L. V. (2023). Innovation and SMEs performance: Evidence from Vietnam. Applied Economic Analysis, 31(92), 90–108. [CrossRef]
- Matricano, D. (2020). The effect of R&D investments, highly skilled employees, and patents on the performance of Italian innovative startups. Technology Analysis and Strategic Management, 32(10), 1195–1208. [CrossRef]
- McGahan, A. M., & Porter, M. E. (1999). The persistence of shocks to profitability. Review of economics and statistics, 81(1), 143-153. [CrossRef]
- Menon, C., DeStefano, T., Manaresi, F., Soggia, G., & Santoleri, P. (2018). The evaluation of the Italian “Start-up Act”. OECD Science, Technology and Industry Policy Papers.
- Moro, A., Maresch, D., Fink, M., Ferrando, A., & Piga, C. (2020). Spillover effects of government initiatives fostering entrepreneurship on the access to bank credit for entrepreneurial firms in Europe. Journal of Corporate Finance, 62, 101603. [CrossRef]
- Mueller, D. C. (1977). The persistence of profits above the norm. Economica, 44(176), 369-380. [CrossRef]
- Mueller, D. C. (1986). Profits in the long run. Cambridge University Press.
- Nifo, A., & Vecchione, G. (2014). Do institutions play a role in skilled migration? The case of Italy. Regional studies, 48(10), 1628-1649. [CrossRef]
- Onesti, G., Monaco, E., & Palumbo, R. (2022). Assessing the Italian innovative start-ups performance with a composite index. Administrative Sciences, 12(4), 189. [CrossRef]
- Oster, E. (2019). Unobservable selection and coefficient stability: Theory and evidence. Journal of Business & Economic Statistics, 37(2), 187-204. [CrossRef]
- Pyo, H., & Park, M. (2020). Who benefits from the governmental support policy for innovative firms and for how long? Evidence from the Korean venture certification program. International Economic Journal, 34(4), 664–681. [CrossRef]
- Roche, M. P., Conti, A., & Rothaermel, F. T. (2020). Different founders, different venture outcomes: A comparative analysis of academic and non-academic startups. Research Policy, 49(10), 104062. [CrossRef]
- Rodríguez-Pose, A. (2013). Do institutions matter for regional development?. Regional studies, 47(7), 1034-1047. [CrossRef]
- Rosenbaum, P. R. (2002). Observational studies (2nd ed.). Springer.
- Rosenbaum, P. R., & Rubin, D. B. (1983). The central role of the propensity score in observational studies for causal effects. Biometrika, 70(1), 41-55. [CrossRef]
- Santos, A., & Cincera, M. (2022). Determinants of financing constraints. Small Business Economics, 58(3), 1427–1439. [CrossRef]
- Spence, M. (1978). Job market signaling. In Uncertainty in economics (pp. 281-306). Academic Press.
- Sun, L., & Abraham, S. (2021). Estimating dynamic treatment effects in event studies with heterogeneous treatment effects. Journal of econometrics, 225(2), 175-199. [CrossRef]
- Waring, G. F. (1996). Industry differences in the persistence of firm-specific returns. The american economic review, 86(5), 1253-1265.
Figure 2.
Innovation performance premium on the matched sample. Bars show the oriented median difference (innovative − ordinary); green denotes an innovative advantage, red a disadvantage.
Figure 2.
Innovation performance premium on the matched sample. Bars show the oriented median difference (innovative − ordinary); green denotes an innovative advantage, red a disadvantage.
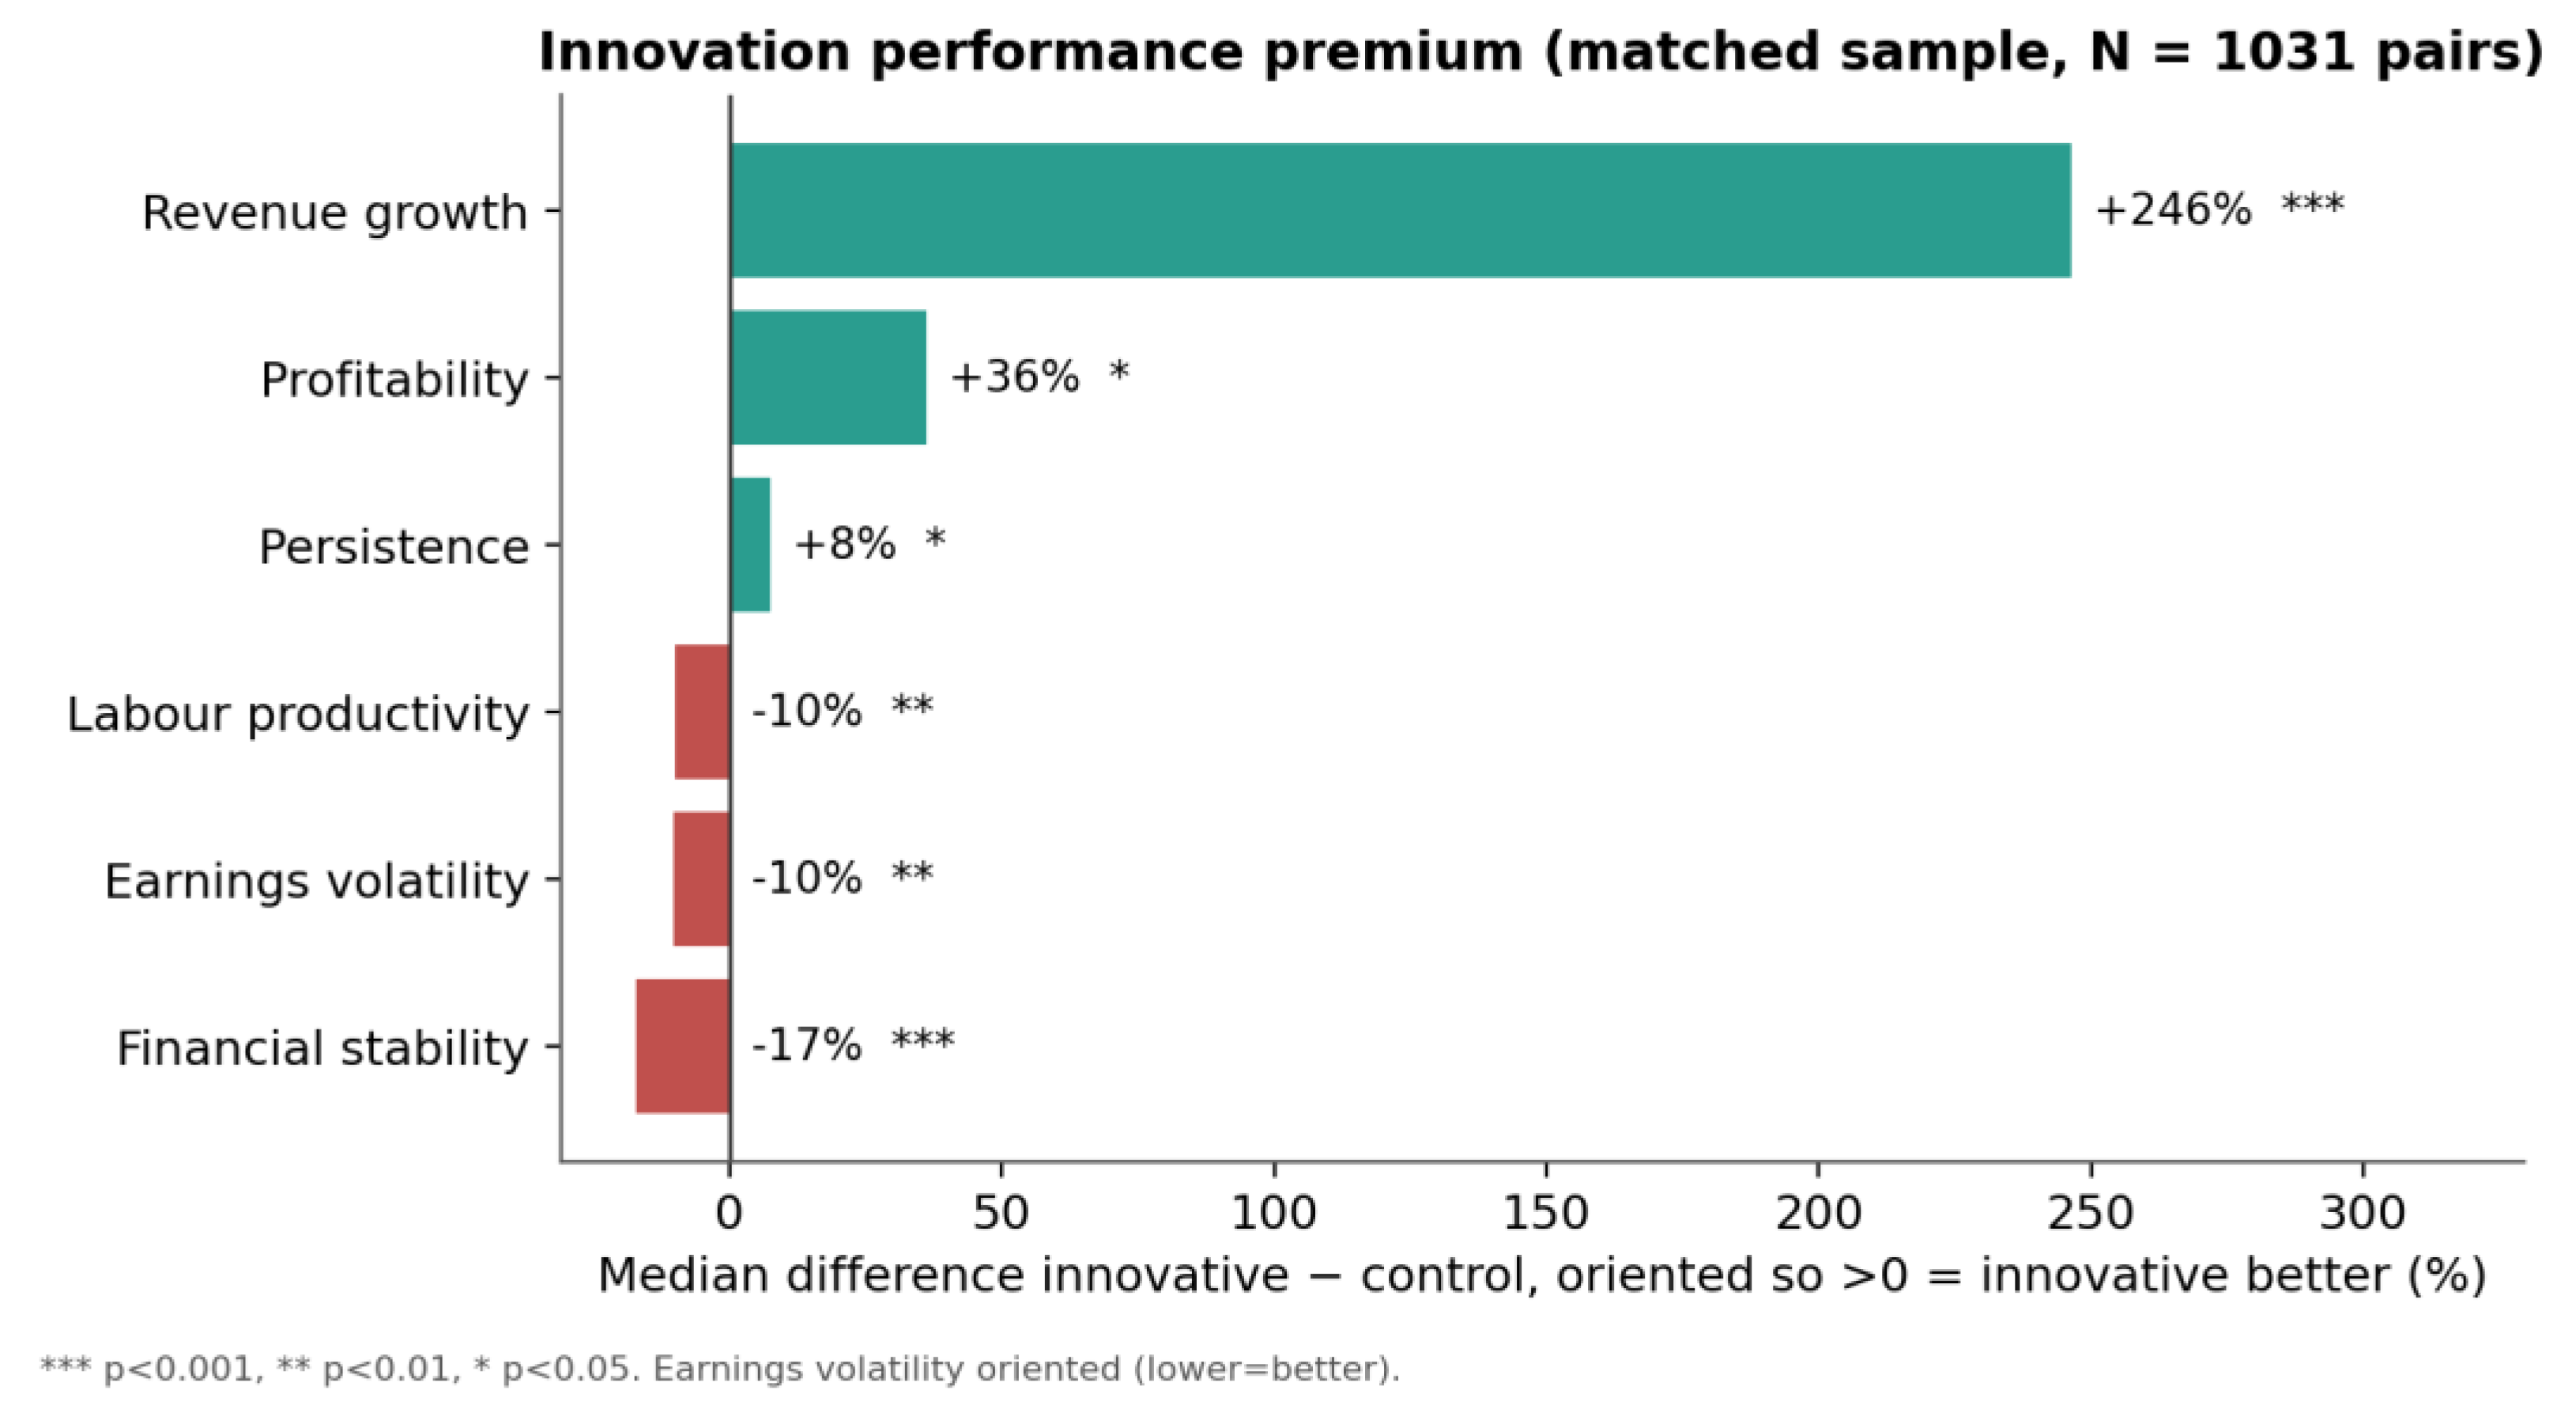
Figure 3.
Productivity–profitability positioning of matched innovative and ordinary SMEs. Large crosses mark group medians; dashed lines mark pooled medians.
Figure 3.
Productivity–profitability positioning of matched innovative and ordinary SMEs. Large crosses mark group medians; dashed lines mark pooled medians.
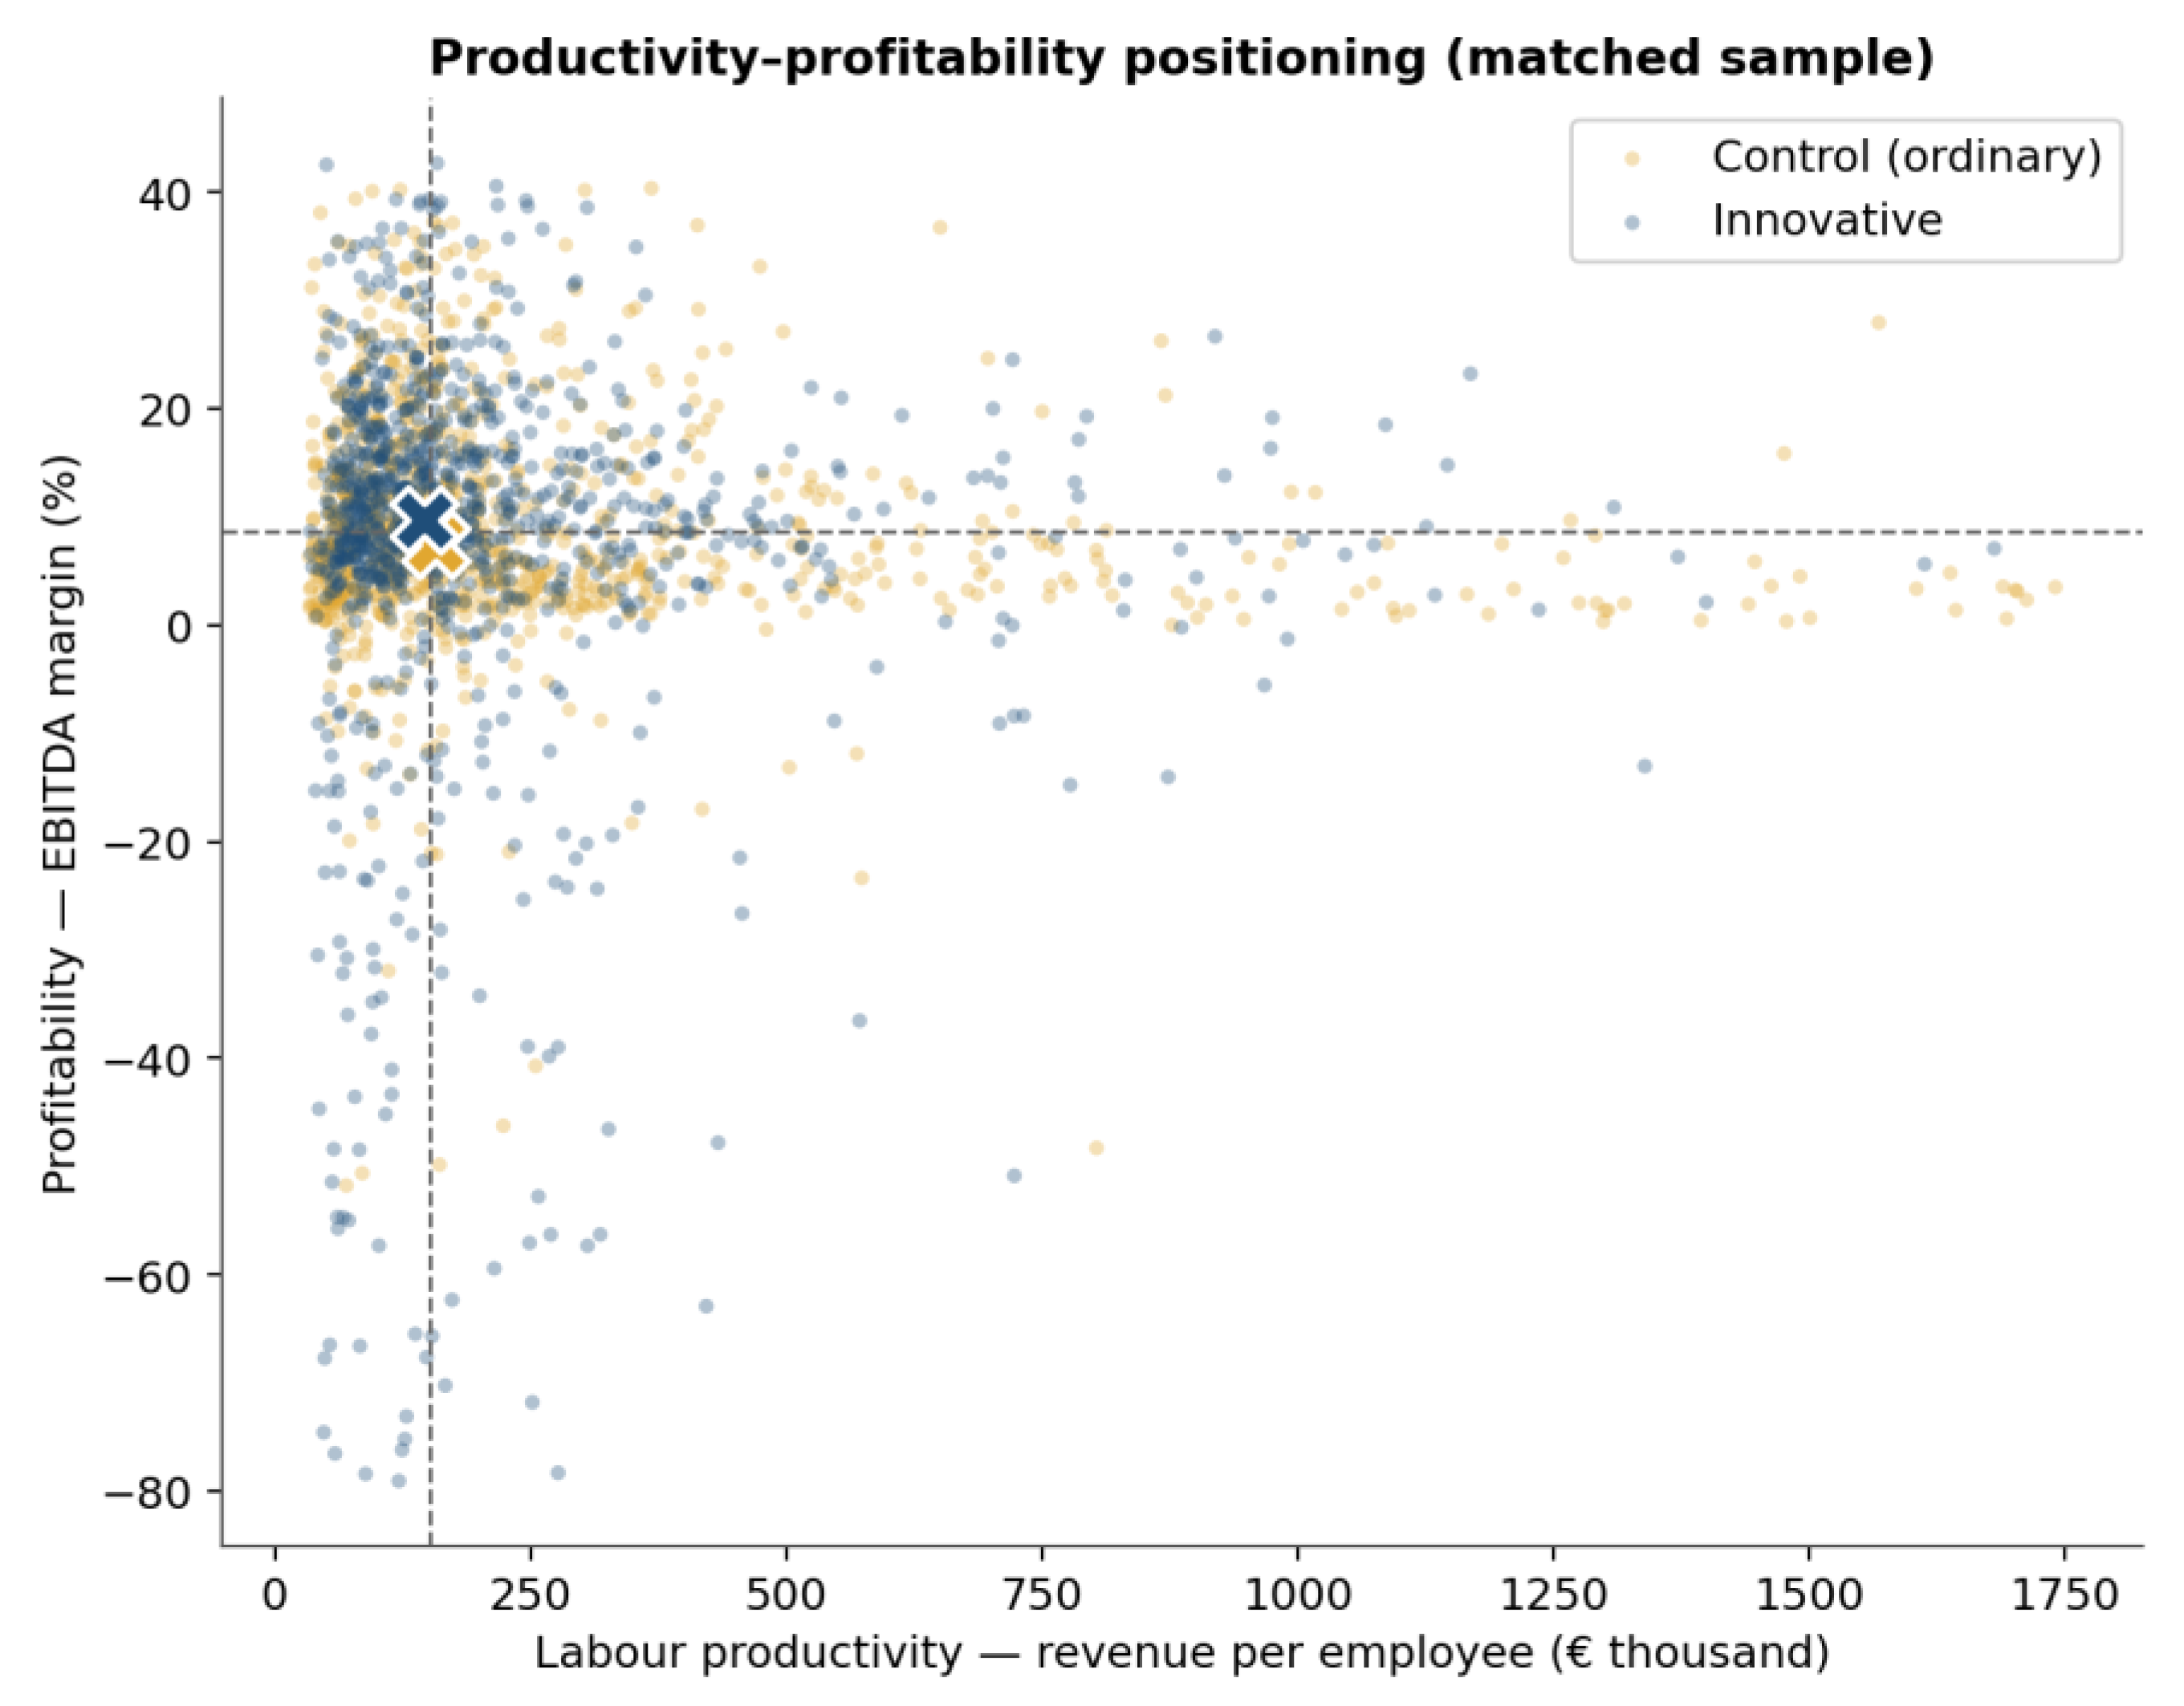
Figure 4.
Innovative-status premium by macro-region and performance dimension (oriented median difference). Green cells denote an innovative advantage, red a disadvantage.
Figure 4.
Innovative-status premium by macro-region and performance dimension (oriented median difference). Green cells denote an innovative advantage, red a disadvantage.
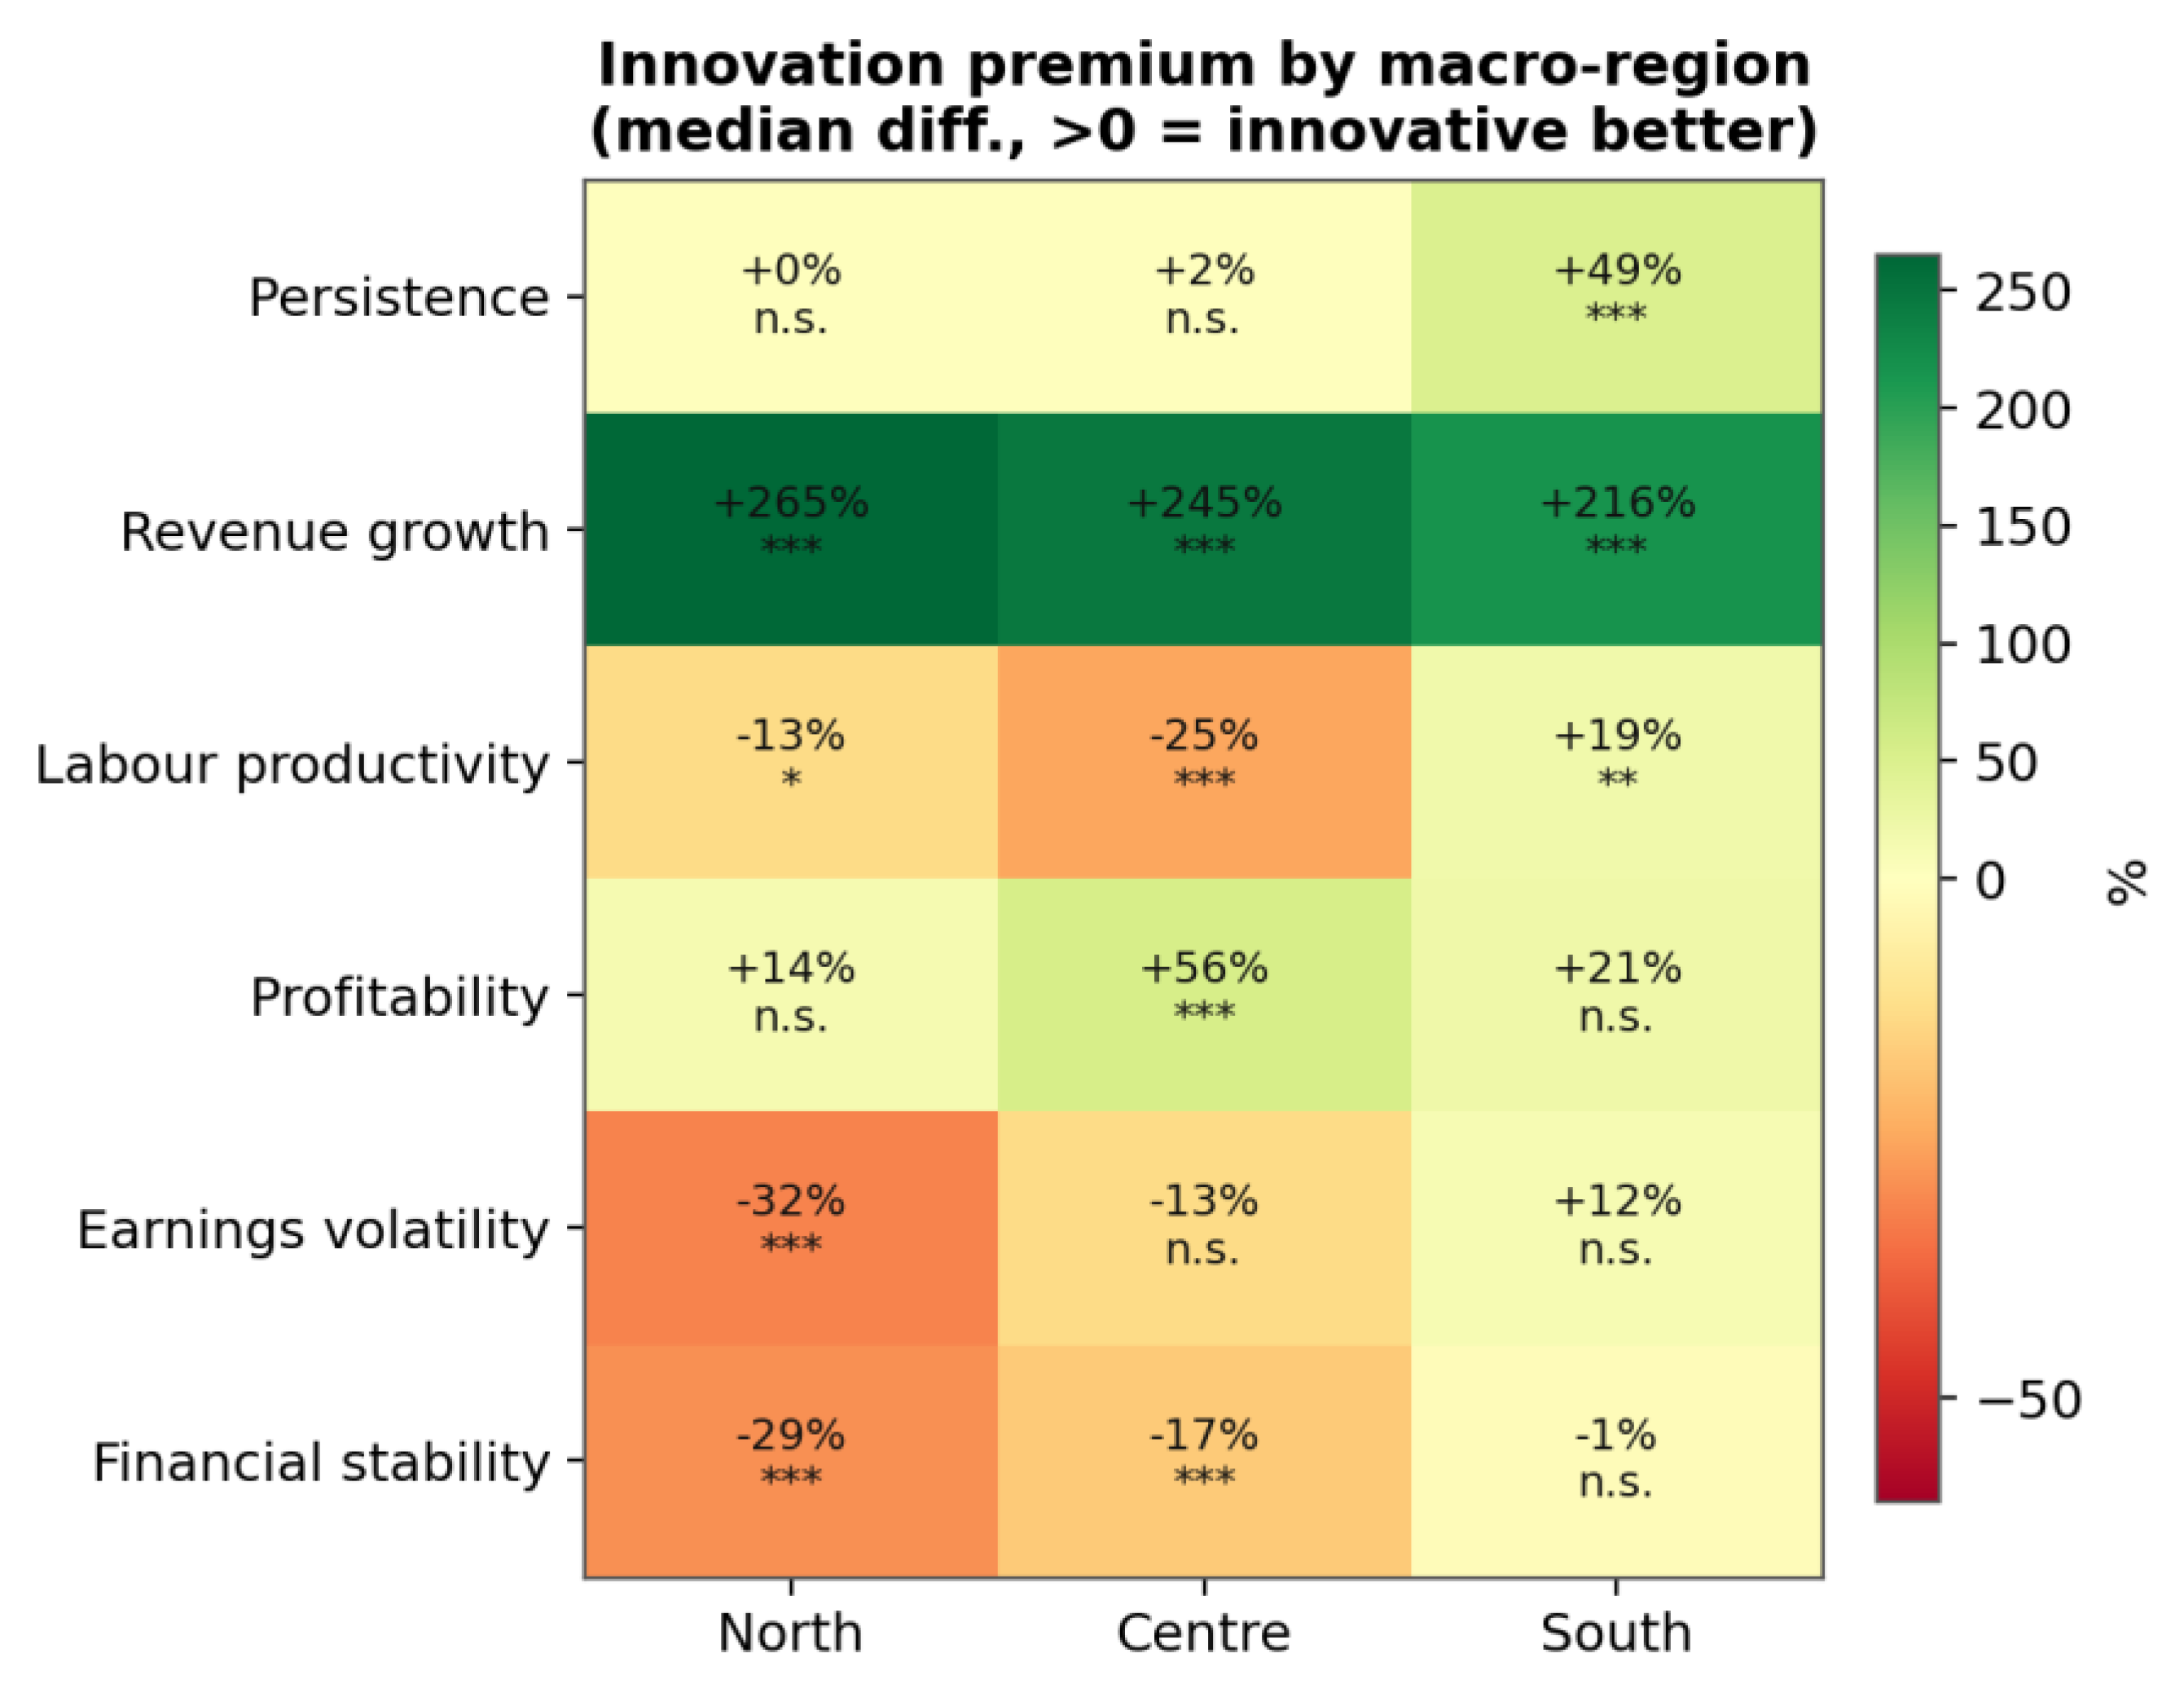
Figure 6.
Event study of (log) revenue around entry into the innovative-firm register. Coefficients are relative to t − 1; bands are 95% confidence intervals with firm-clustered standard errors. The pronounced pre-registration run-up indicates selection on prior growth.
Figure 6.
Event study of (log) revenue around entry into the innovative-firm register. Coefficients are relative to t − 1; bands are 95% confidence intervals with firm-clustered standard errors. The pronounced pre-registration run-up indicates selection on prior growth.
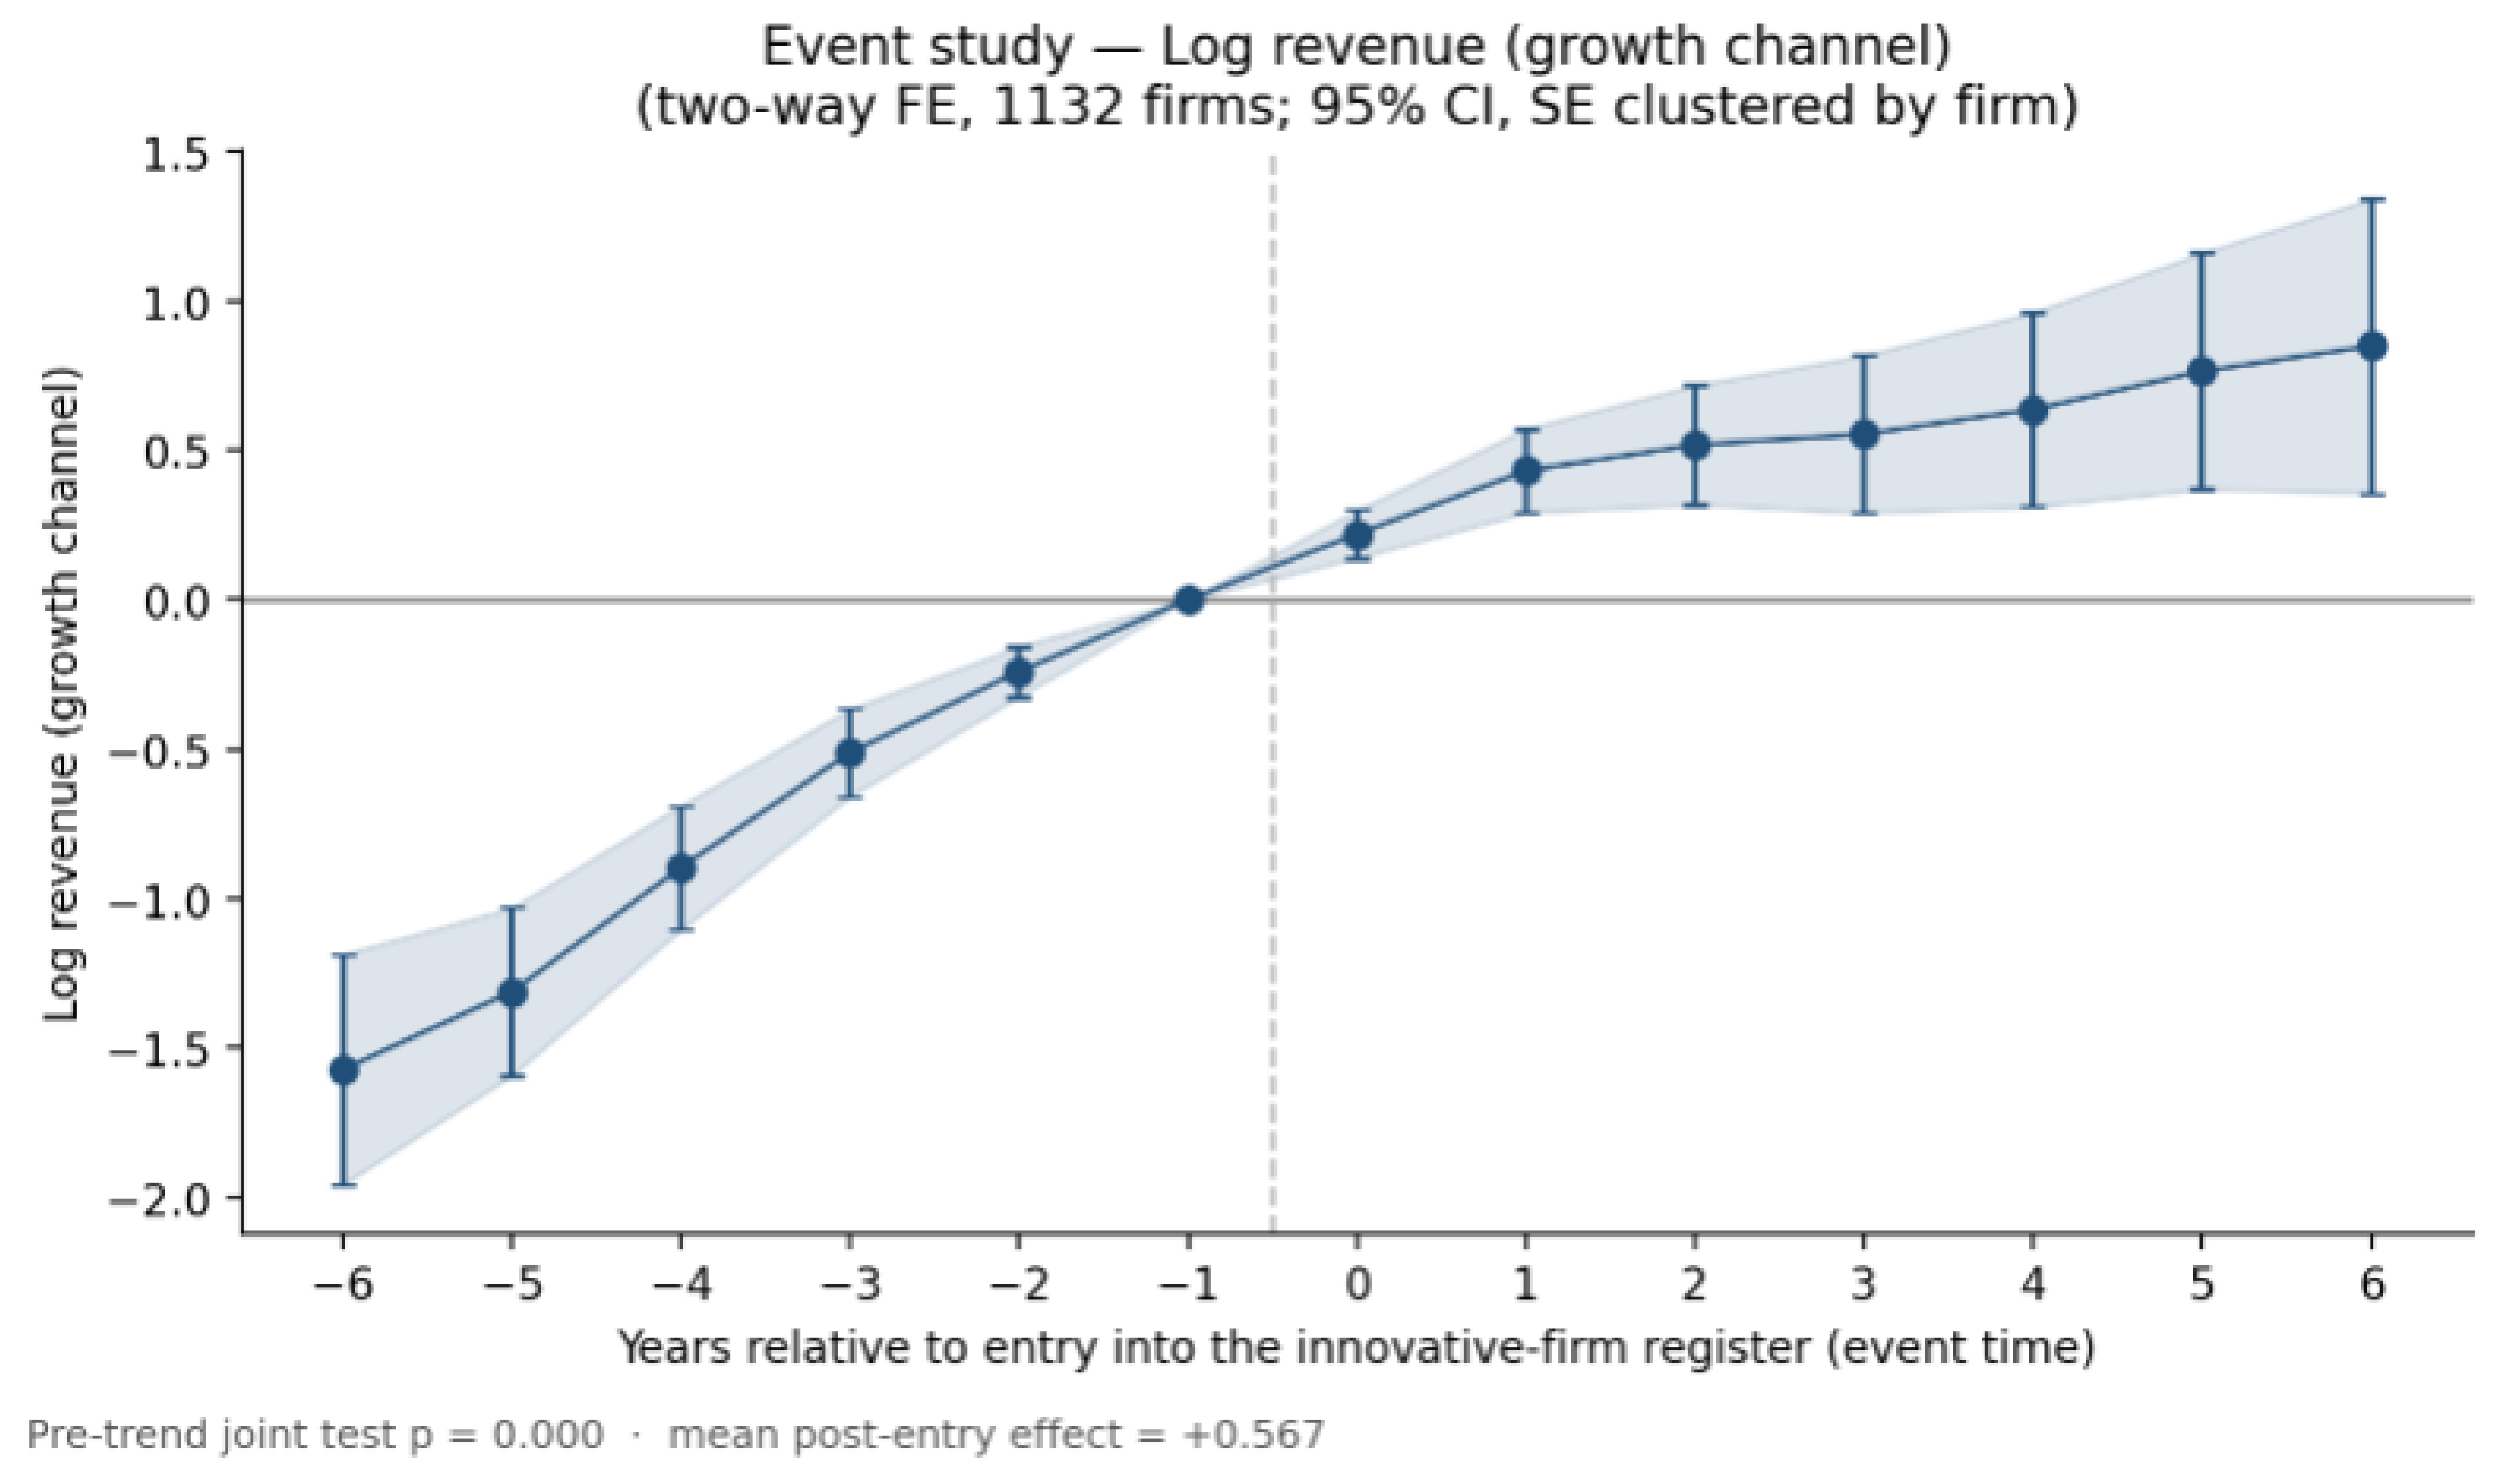
Figure 7.
Event study of the EBITDA margin around entry into the register. Flatter pre-trends (joint test p ≈ 0.09) make the parallel-trends assumption more defensible than for revenues; the positive post-entry path is imprecise.
Figure 7.
Event study of the EBITDA margin around entry into the register. Flatter pre-trends (joint test p ≈ 0.09) make the parallel-trends assumption more defensible than for revenues; the positive post-entry path is imprecise.
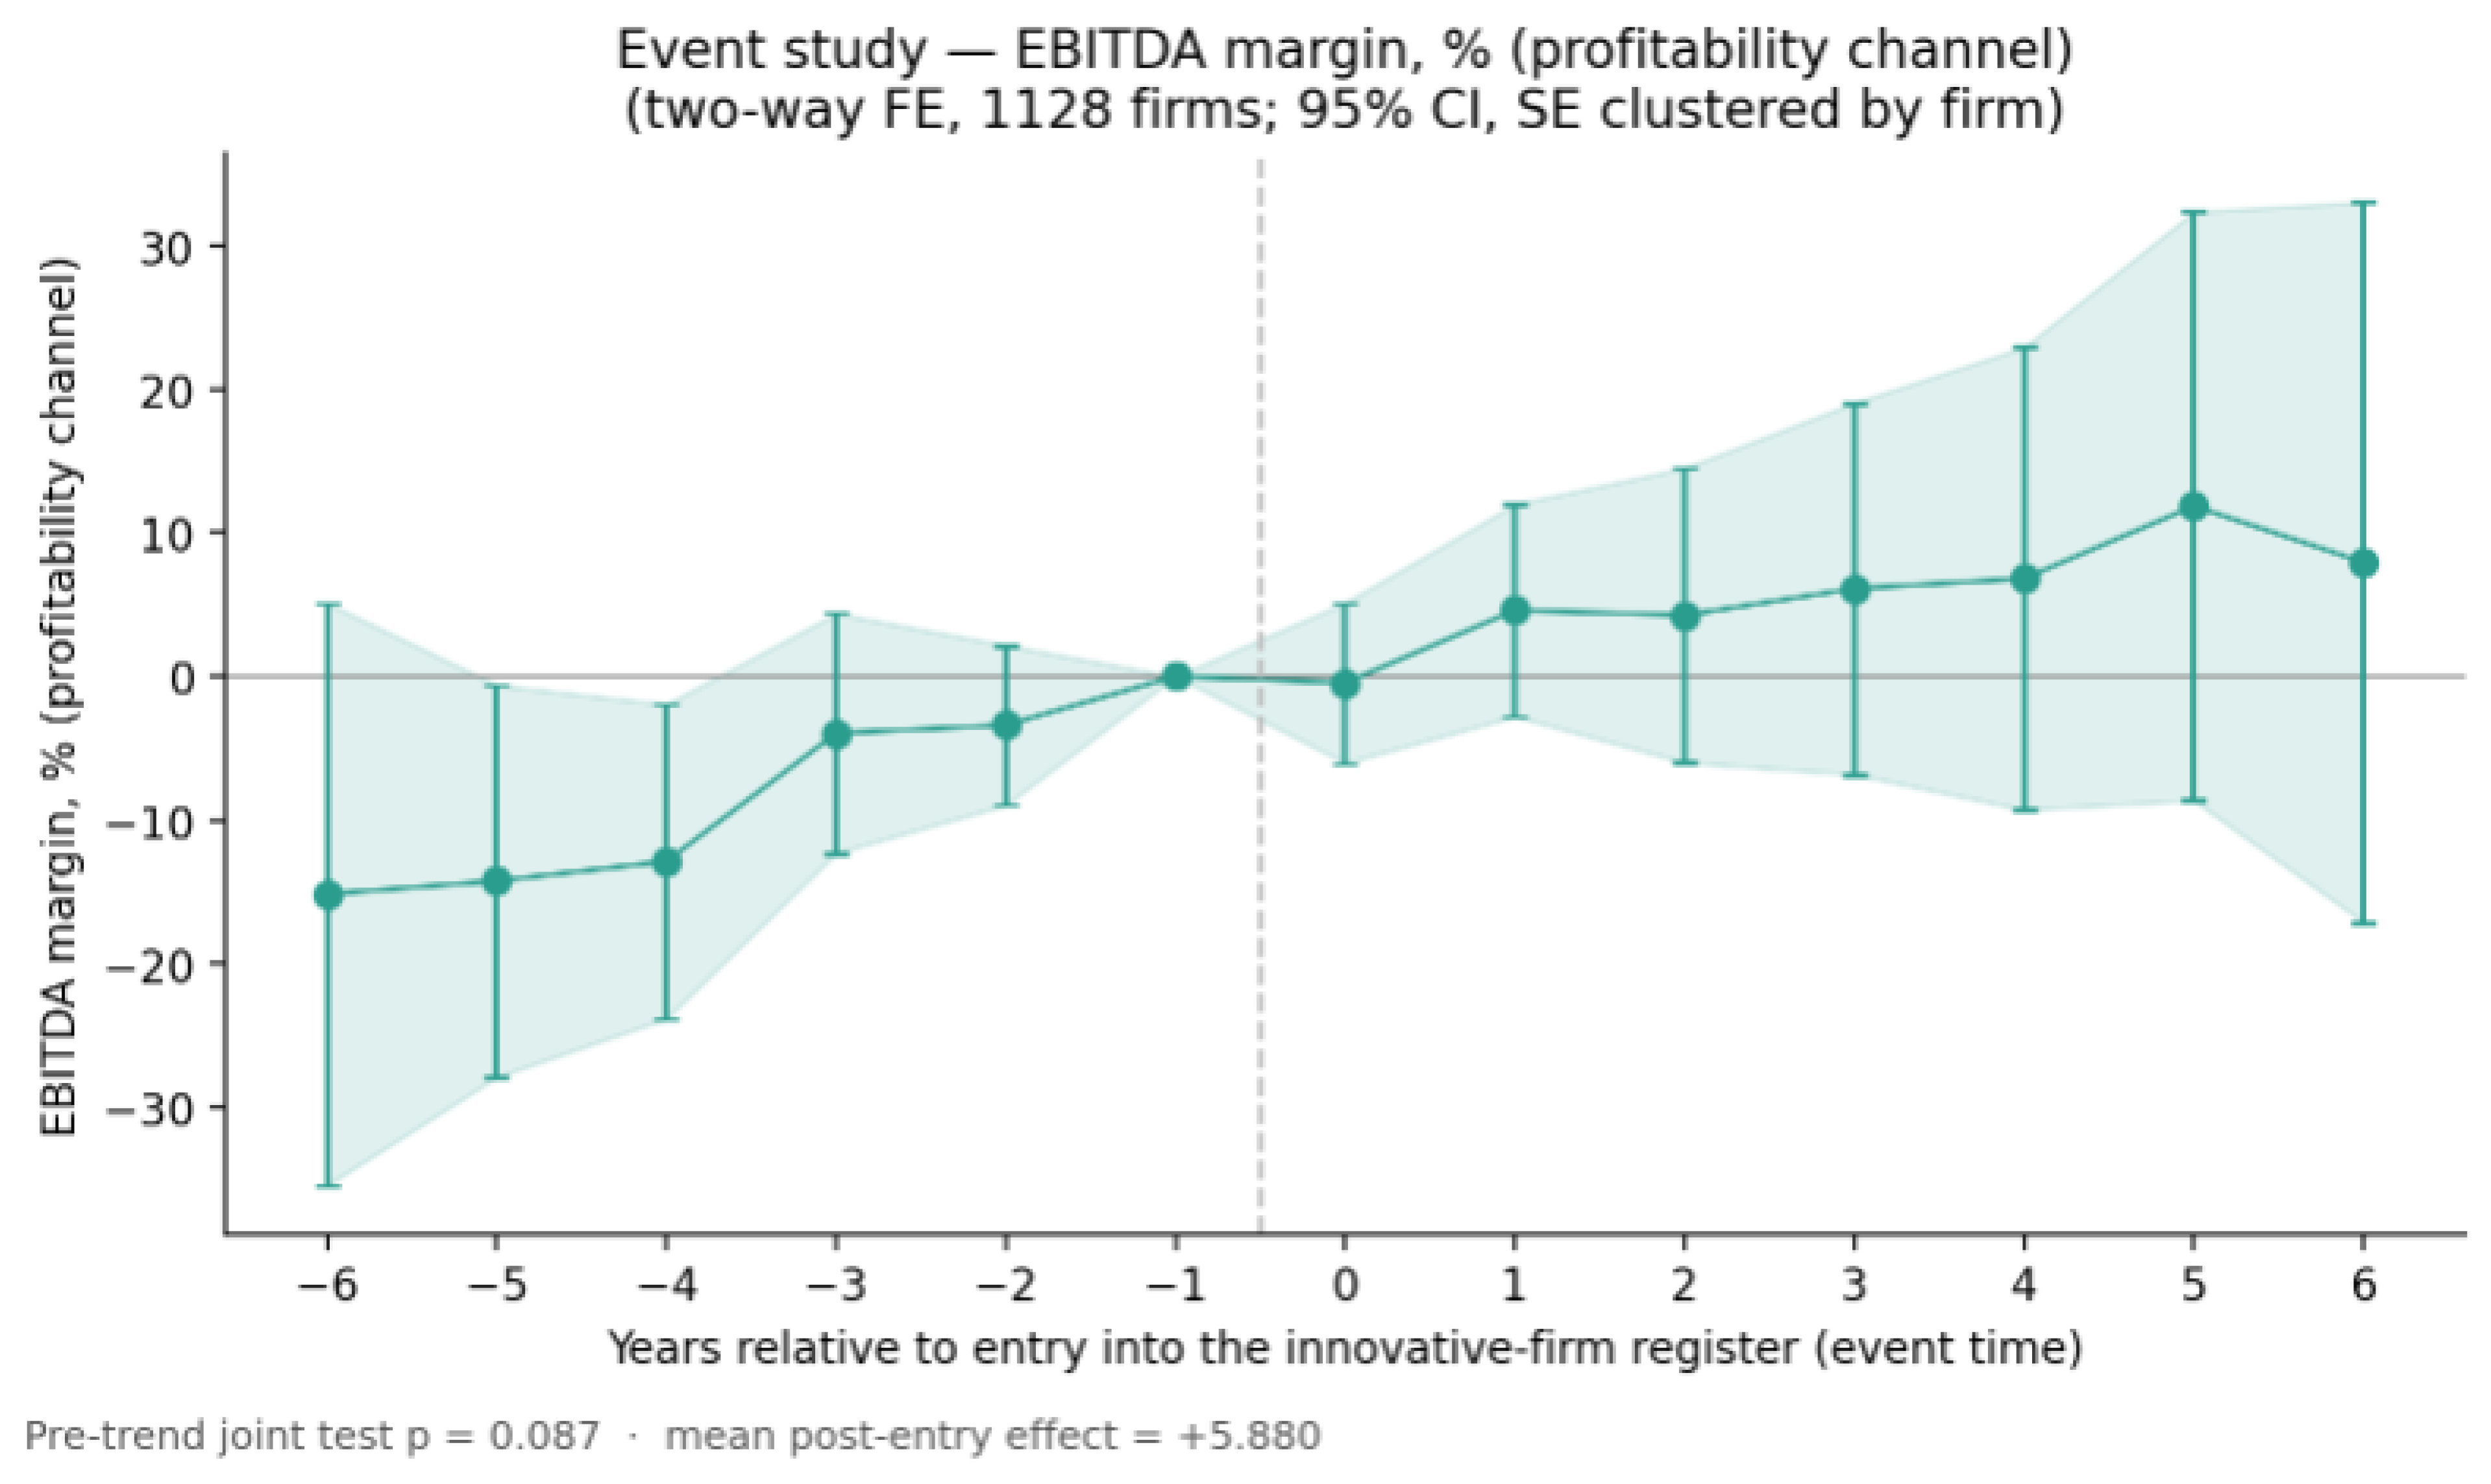
Table 2.
Innovative versus ordinary SMEs on the matched sample (1,031 pairs): medians, oriented difference, effect size and significance.
Table 2.
Innovative versus ordinary SMEs on the matched sample (1,031 pairs): medians, oriented difference, effect size and significance.
| Performance dimension | Median innovative | Median ordinary | Δ (oriented) | 95% CI (median difference) | Effect size (|rank-biserial|) | Mann–Whitney p |
| Revenue growth (CAGR) | 0.244 | 0.070 | 246% | [+0.146, +0.202] | 0.53 (large) | < 0.001 |
| Operating profitability (EBITDA margin) | 9.59% | 7.05% | 36% | [+1.4, +3.5] pp | 0.06 (small) | 0.018 |
| Performance persistence | 0.446 | 0.414 | 8% | [−0.008, +0.080] | 0.06 (small) | 0.021 |
| Labour productivity (€/employee) | 143,826 | 159,862 | −10% | [−27,927, −4,227] | 0.07 (small) | 0.007 |
| Earnings volatility (CV, lower better) | 0.620 | 0.561 | −10% | [−0.117, +0.008] | 0.08 (small) | 0.002 |
| Financial stability (cash-flow) | 1.082 | 1.304 | −17% | [−0.333, −0.139] | 0.20 (moderate) | < 0.001 |
Notes. Δ is the oriented percentage difference in medians (signed so that positive = innovative advantage; earnings-volatility sign reversed). 95% confidence intervals for the innovative−ordinary median difference are obtained by bootstrap (2,000 resamples), in each variable’s own units. Effect size is the absolute rank-biserial correlation from the Mann–Whitney U test (≈0.1 small, 0.3 medium, 0.5 large). p-values are two-sided and, across the full family of 24 tests, survive Benjamini–Hochberg FDR correction (see text). The two economically material effects—the revenue-growth premium (large) and the financial-stability penalty (moderate)—are shown in bold; the remaining differentials are statistically detectable but small in effect-size terms. Source: LUCE project, AIDA–Bureau van Dijk. Author calculations.
Table 3.
Innovative-status premium by macro-region (matched sample): oriented median difference and significance.
Table 3.
Innovative-status premium by macro-region (matched sample): oriented median difference and significance.
| Performance dimension | North | Centre | South |
| Revenue growth | +265% *** | +245% *** | +216% *** |
| Operating profitability | +14% n.s. | +56% *** | +21% n.s. |
| Performance persistence | +0% n.s. | +2% n.s. | +49% *** |
| Labour productivity | −13% * | −25% *** | +19% ** |
| Earnings volatility (lower better) | −31% *** | −13% n.s. | +12% n.s. |
| Financial stability | −29% *** | −17% *** | −1% n.s. |
Notes. Δ oriented so that positive = innovative advantage. *** p<0.001, ** p<0.01, * p<0.05, n.s. not significant (Mann–Whitney).
Table 4.
Robustness of the innovative-status differential to alternative estimators.
| Estimator | Revenue growth | Profitability (EBITDA margin, pp) | Labour productivity (€'000/emp) | Earnings volatility | Financial stability | Performance persistence |
| NN caliper .2 (baseline) | 0.17 * | 2.54 | -16.58 * | -0.06 | -0.22 * | 0.03 |
| NN caliper .1 | 0.18 * | 2.04 | -5.10 * | -0.05 | -0.20 * | 0.04 |
| NN caliper .5 | 0.16 * | 3.56 | -39.32 * | -0.08 * | -0.27 * | 0.02 |
| 1:3 nearest-neighbour | 0.18 * | 2.16 * | -24.61 * | -0.16 * | -0.34 * | -0.01 |
| NN with replacement | 0.23 * | 1.80 * | 7.62 | -0.16 * | -0.42 * | 0.04 * |
| Mahalanobis | 0.15 * | 3.06 | -35.56 * | -0.14 * | -0.35 * | -0.01 |
| IPW (ATT) | 0.33 * | -15.14 * | -27.35 * | -0.22 | -0.56 * | 0.01 |
| AIPW (doubly robust) | 0.33 * | -13.46 * | -35.61 | -0.20 | -0.51 * | 0.01 |
| Entropy balancing | 0.38 | -25.34 | -25.34 | 0.69 | -0.79 | 0.04 |
| Sensitivity to hidden bias | ||||||
| Diagnostic | Revenue growth | Profitability | Fin. stability | Persistence | Benchmark | |
| Rosenbaum bounds Γ* | ≈ 4.6 | ≈ 0.95 | ≈ 0.95 | ≈ 0.95 | higher = more robust | |
| Oster (2019) δ | ≈ 8.7 | ≈ 0.32 | – | – | |δ| > 1 = robust | |
Disclaimer/Publisher’s Note: The statements, opinions and data contained in all publications are solely those of the individual author(s) and contributor(s) and not of MDPI and/or the editor(s). MDPI and/or the editor(s) disclaim responsibility for any injury to people or property resulting from any ideas, methods, instructions or products referred to in the content. |
© 2026 by the authors. Licensee MDPI, Basel, Switzerland. This article is an open access article distributed under the terms and conditions of the Creative Commons Attribution (CC BY) license (http://creativecommons.org/licenses/by/4.0/).
Copyright: This open access article is published under a Creative Commons CC BY 4.0 license, which permit the free download, distribution, and reuse, provided that the author and preprint are cited in any reuse.


