

Submitted:
27 July 2026
Posted:
29 July 2026
You are already at the latest version
Abstract
Chromosome microarray analysis performed on 3,842 patients over 15 years (2009-2024), 92% with developmental disability/autism, yielded a total of 16,138 copy number variants (CNVs) averaging 4.2 per patient and qualified as benign (15,083 or 94%, most of size 11-99 kb), of uncertain significance (VUS, 216 or 1.3%, 0.5-0.75 Mb), or pathogenic (836 or 5.2%, 2-5 Mb). Despite considerable pathogenic-VUS size overlap in the 100kb-20Mb range, pathogenic variants provided diagnoses in 749 patients (20%). This increased to 21% among 2,470 patients (2015-2024) having karyotypes recorded, abnormal in 267 patients (11%) with microarray confirming/clarifying the abnormal karyotype in 187 (7.6%)/55 (2.2%). Diagnoses included 61 known chromosomal syndromes, 55 microdeletion/duplications occurring in 3 or more patients (61 in unique regions) with another 33 in 2 and 86 in 1. The 90 microdeletions averaged 6439 kb in length (chromosomes 6, 8, 17, 22 having most), the 90 microduplications 6895 kb (chromosomes 8, 14, 17, 22, X having most), conferring an average imbalance of 798,000 nucleotides per patient (0.75% of their genome). The demonstrated diagnostic efficacy of chromosome microarray analysis for neurodisabilities including autism, once improved by deep learning analyses of holistic variant-symptom databases, could eventually target predisposed newborns for presymptomatic therapies.
Keywords:
chromosome-microarray analysis
; array-comparative genomic hybridization
; copy number variants
; developmental disability
; autism
; genomic distribution of non-allelic homologous recombination
1. Introduction
Sequencing of the human genome,1 followed by the ability to characterize genomic variation across individuals and populations,2 has documented novel DNA changes in patients with intellectual-developmental disabilities3−8 and comorbid behaviors like autism.9−10 Chromosomal microarray analysis (CMA) enables genome-wide screening for subtle DNA excess/deficiency11−12 and adds copy number variants (CNVs) to the larger aneuploid segments detected by routine karyotype.13 These microdeletions or duplications, often created by non-allelic homologous recombination among repetitive elements, are now recognized as common individual variations that in some situations predispose to a unique type of genomic disease14 with special management implications.4 Microarray has improved diagnostic sensitivity from the 5 million base pair (5 Mb) resolution of high-resolution karyotyping to that of a few or several hundred nucleotides, here discussing the latter resolution obtained by microarray alone rather than the former that applies to combined microarray-exome sequencing.15 Diagnostic yield has increased from the 2-3% by karyotype to 20-25% by microarray analysis,3−9 recognition of over 50 new disorders13 and any chromosome imbalance endorsing microarray as a first-line test for patients with cognitive and neurobehavioral differences.11−12
This report adds another survey of chromosome-microarray analysis findings to many in the literature,3−10, 15−19 describing 15 years of results from a single laboratory. It highlights some of the problems in transitioning from microscopic characterization of a few hundred microscopic heteromorphisms13 to qualifying the significance (pathogenic,18 uncertain,6 not or benign16)2, 12, 20−23 of thousands of submicroscopic CNVs8, 13, 24 using their prevalence in ostensibly normal versus affected people,25−26 size,17 and gene content.20 Overlap of size between CNVs qualified as pathogenic versus of uncertain significance is here demonstrated as one indication of interpretative difficulties, the much higher diagnostic yield of microarray alone over karyotyping in children with disabilities and the finding of 180 novel CNVs as predispositions affirming prior endorsements of utility. Distribution of CNVs over all chromosomes with an average imbalance of almost 1% of the genome in these patients highlights their potential for early therapy-invoking screening for neurodisabilities including epilepsy or autism.
2. Materials and Methods
2.1. Sample Sources
Array-comparative genomic hybridization (chromosomal microarray analysis or CMA) was introduced at the Texas Tech Cytogenomics Laboratory in January 2009, supplementing long-standing cytogenetic testing. This study includes all non-oncology samples processed through June 2024. Whole-exome sequencing (WES) data from July 2022 to August 2025 were integrated with corresponding CMA results for comparative diagnostic analysis. Most samples were obtained from medical center and private practice physicians across the West Texas region extending from Amarillo to El Paso North-South and roughly to Abilene/Midland Odessa to the East. All testing was performed under the supervision of the authors (VJT and SC) within the Department of Pediatrics at Texas Tech University Health Science Center, Lubbock. All analyses adhered to CAP and CLIA guidelines, with compliance verified through biennial inspections.
2.2. Sample Analyses
Prior to 2009, the laboratory operated as a standard cytogenetic laboratory, performing chromosome analyses using conventional G-banding methods as previously described.27 Microarray analysis was introduced in 2009 as an added test, with karyotyping remaining the preferred initial analysis. Beginning in 2016, automated karyotyping of heparinized peripheral blood or fibroblast cultures was followed by DNA extraction and microarray analysis using validated protocols.28 Microarray platforms evolved as follows: from 2009 to 2015, the EmArray Cyto 6000 44k chip (Agilent Technologies, Santa Clara CA) with BlueGenome software (Illumina/Novagene, Sacramento CA) from February 2016 to June 2024, the Cytosure Constitutional 60k CGH array (Oxford Gene Technologies, Begbroke UK) with Cytosure® Interpret software; and from June 2024 onward, the Agilent GenetiSure Cyto CGH 60k Array with CytoGenomics software (Agilent Technologies, Santa Clara CA). Arrays were processed according to manufacturer specifications, including hybridization, washing, and scanning on Agilent SureScan systems. CNV detection and interpretation followed ACMG consensus guidelines,11, 20 incorporating probe-level quality metrics, log2 ratio thresholds, assessment for copy-neutral loss of heterozygosity, and correlation with ClinVar,23 DECIPHER,29 and the Database of Genomic Variants.30 Twenty-four CNVs classified as likely pathogenic in the 2016-24 results were grouped with pathogenic findings for reporting consistency.
3. Databases
All laboratory samples and reports were entered into a deidentified database under IRB approval (Texas Tech IRB-FY2025-128, exempt status granted March 12, 2025). The database was constructed from pre-existing laboratory systems used for patient-physician reports, billing, and accounting. Data were stored on password-protected computers with access restricted to IRB-authorized laboratory personal and approved student/faculty researchers, in compliance with CAP, CLIA, and HIPPA standards. Identifiable information was limited to laboratory accession number, sex, and age (grouped into 1- year intervals for children under five and five-year intervals for older patients). Karyotypes were entered in ISCN (2020,2022, 2024 format as applicable), and all CNVs were documented by chromosomal band location and base-pair coordinates, along with classifications as benign, VUS, or pathogenic according to ACMG guidelines.11−12, 21−23
4. Database Analysis and Statistics
Data tallies were generated using Microsoft Excel, employing search, find, and sort functions to organize CNV counts, classifications (pathogenic, VUS, benign). Descriptive statistics, including means, standard deviations, and frequency distributions, were calculated using Excel’s standard formulas. Statistical significance for group comparisons was assessed using two-tailed t-tests for continuous variables (e.g., mean CNV size per patient) and N-1 chi-squared tests for categorical variables (e.g., diagnostic yield differences between cohorts).31 A p-value <0.05 level was considered statistically significant.
5. Results
Table 1. summarizes 15 years of microarray analysis, results by patient in the left columns and by numbers of copy number variants to the right. The 16,138 total CNVs in 3832 total patients (data row 3) documented from 2009 to 2024 yielding an overall average of 4.2 variants per patient that will be further detailed in Fig. 1. There were 1524 patients receiving microarray results from 2009 to 2015 (data row 1, left), 264 having at least one CNV qualified as pathogenic, 58 or 1202 having only CNVs qualified as variants of uncertain significance (VUS) or benign (left columns, Table 1). Thus 264 or 17% of patients were judged to have a diagnostic result by microarray, the corresponding numbers 485 or 21% for the 2016-24 patients (row 2) and 749 or 20% for the combined groups (row 3). The number of CNVs in these patients is shown in the right columns of Table 1, those qualified as pathogenic comprising a respective 8.6, 4.2 and 5.2% of the 2009-15, 2016-24, and combined patient groups with benign CNVs being the vast majority (94% for the combined group, data rows 1-3). The higher percentage (8.6%) of pathogenic variants in the 2009-15 group, unaccompanied by more pathologic diagnoses (17%), suggests some selective entry of those variants or fewer defined syndromes when the 2009-15 database was compiled.
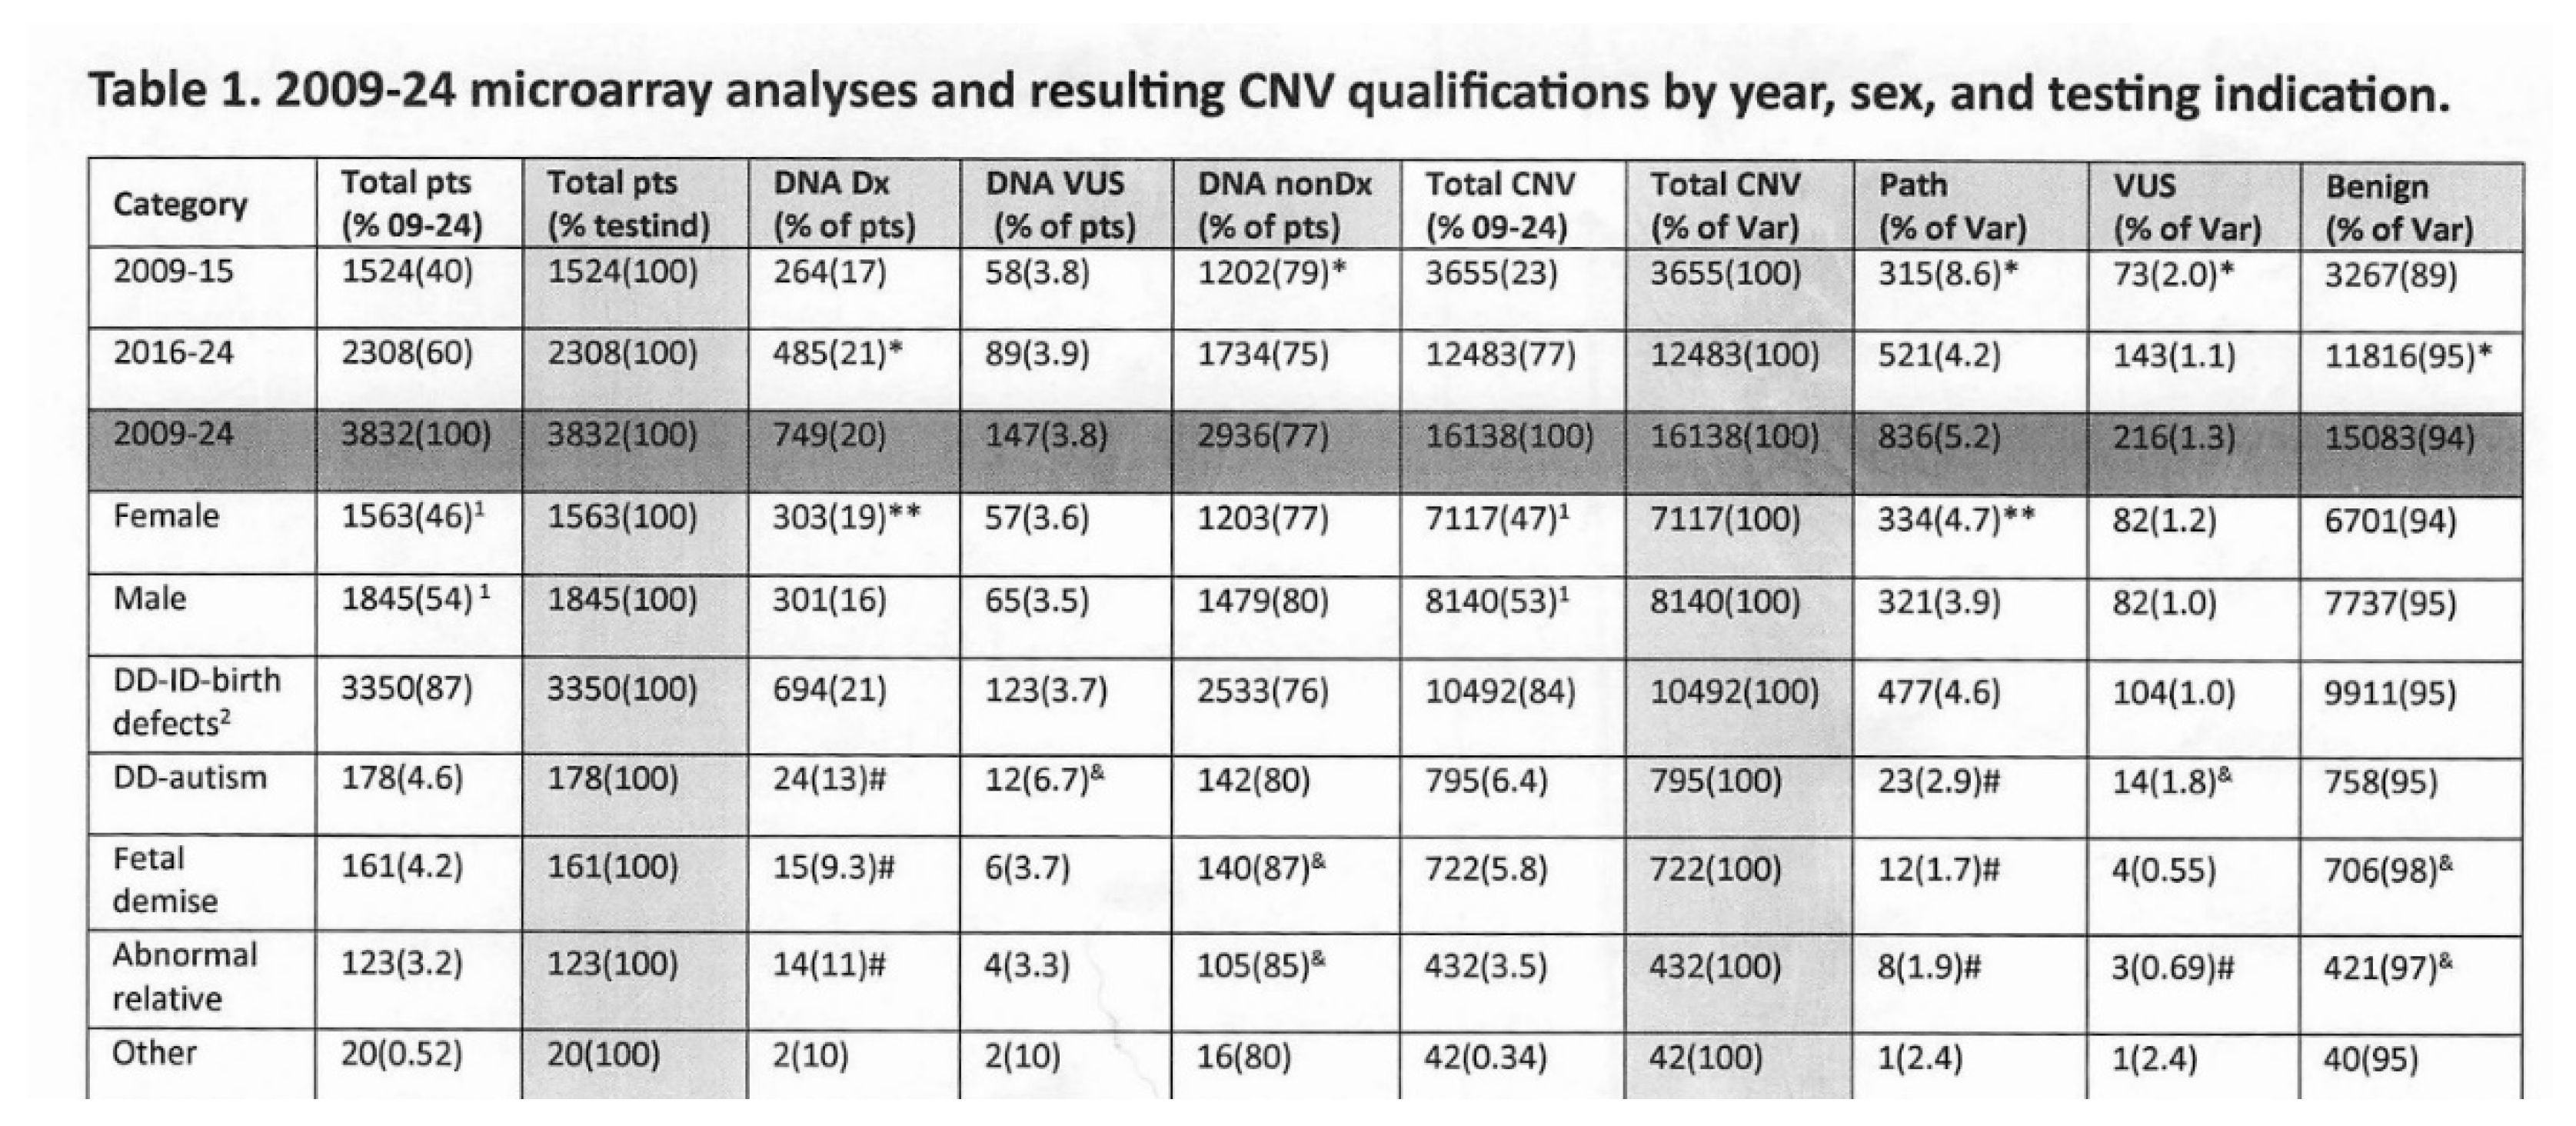
2009-15, 2016-24, and combined (darkly shaded) results of microarray analysis are shown in the top 3 rows, total patients (pts, 1st data column) and CNVs (6th column) converted to 100% in the lightly shaded 2nd and 7th columns so proportions of diagnoses or variant (var) qualifications could be indicated in columns 3-5 and 8-10.1Only 3408 patients and their associated 15257 variants were designated by sex, 424 patients in the 2009-2015 database entered as sex unknown; 2many patients had testing indications of developmental (DD) or intellectual (ID) disability and birth defects combined; “Other” includes non-disability diagnoses like Ehlers-Danlos syndrome, male infertility due to azoospermia, recurrent pregnancy loss. CNV or var, copy number variant; Dx, diagnostic; path, pathogenic; testind, test indication; VUS, variant of insignificance;*significantly larger (p <0.05) fithan percentage for years 2009-15 or 2016-24; **significantly larger than percentage for males; #significantly less than percentage for patients with DD-ID-birth defects testing indication; &significantly larger than percentage for patients with DD-ID-birth defects testing indication.
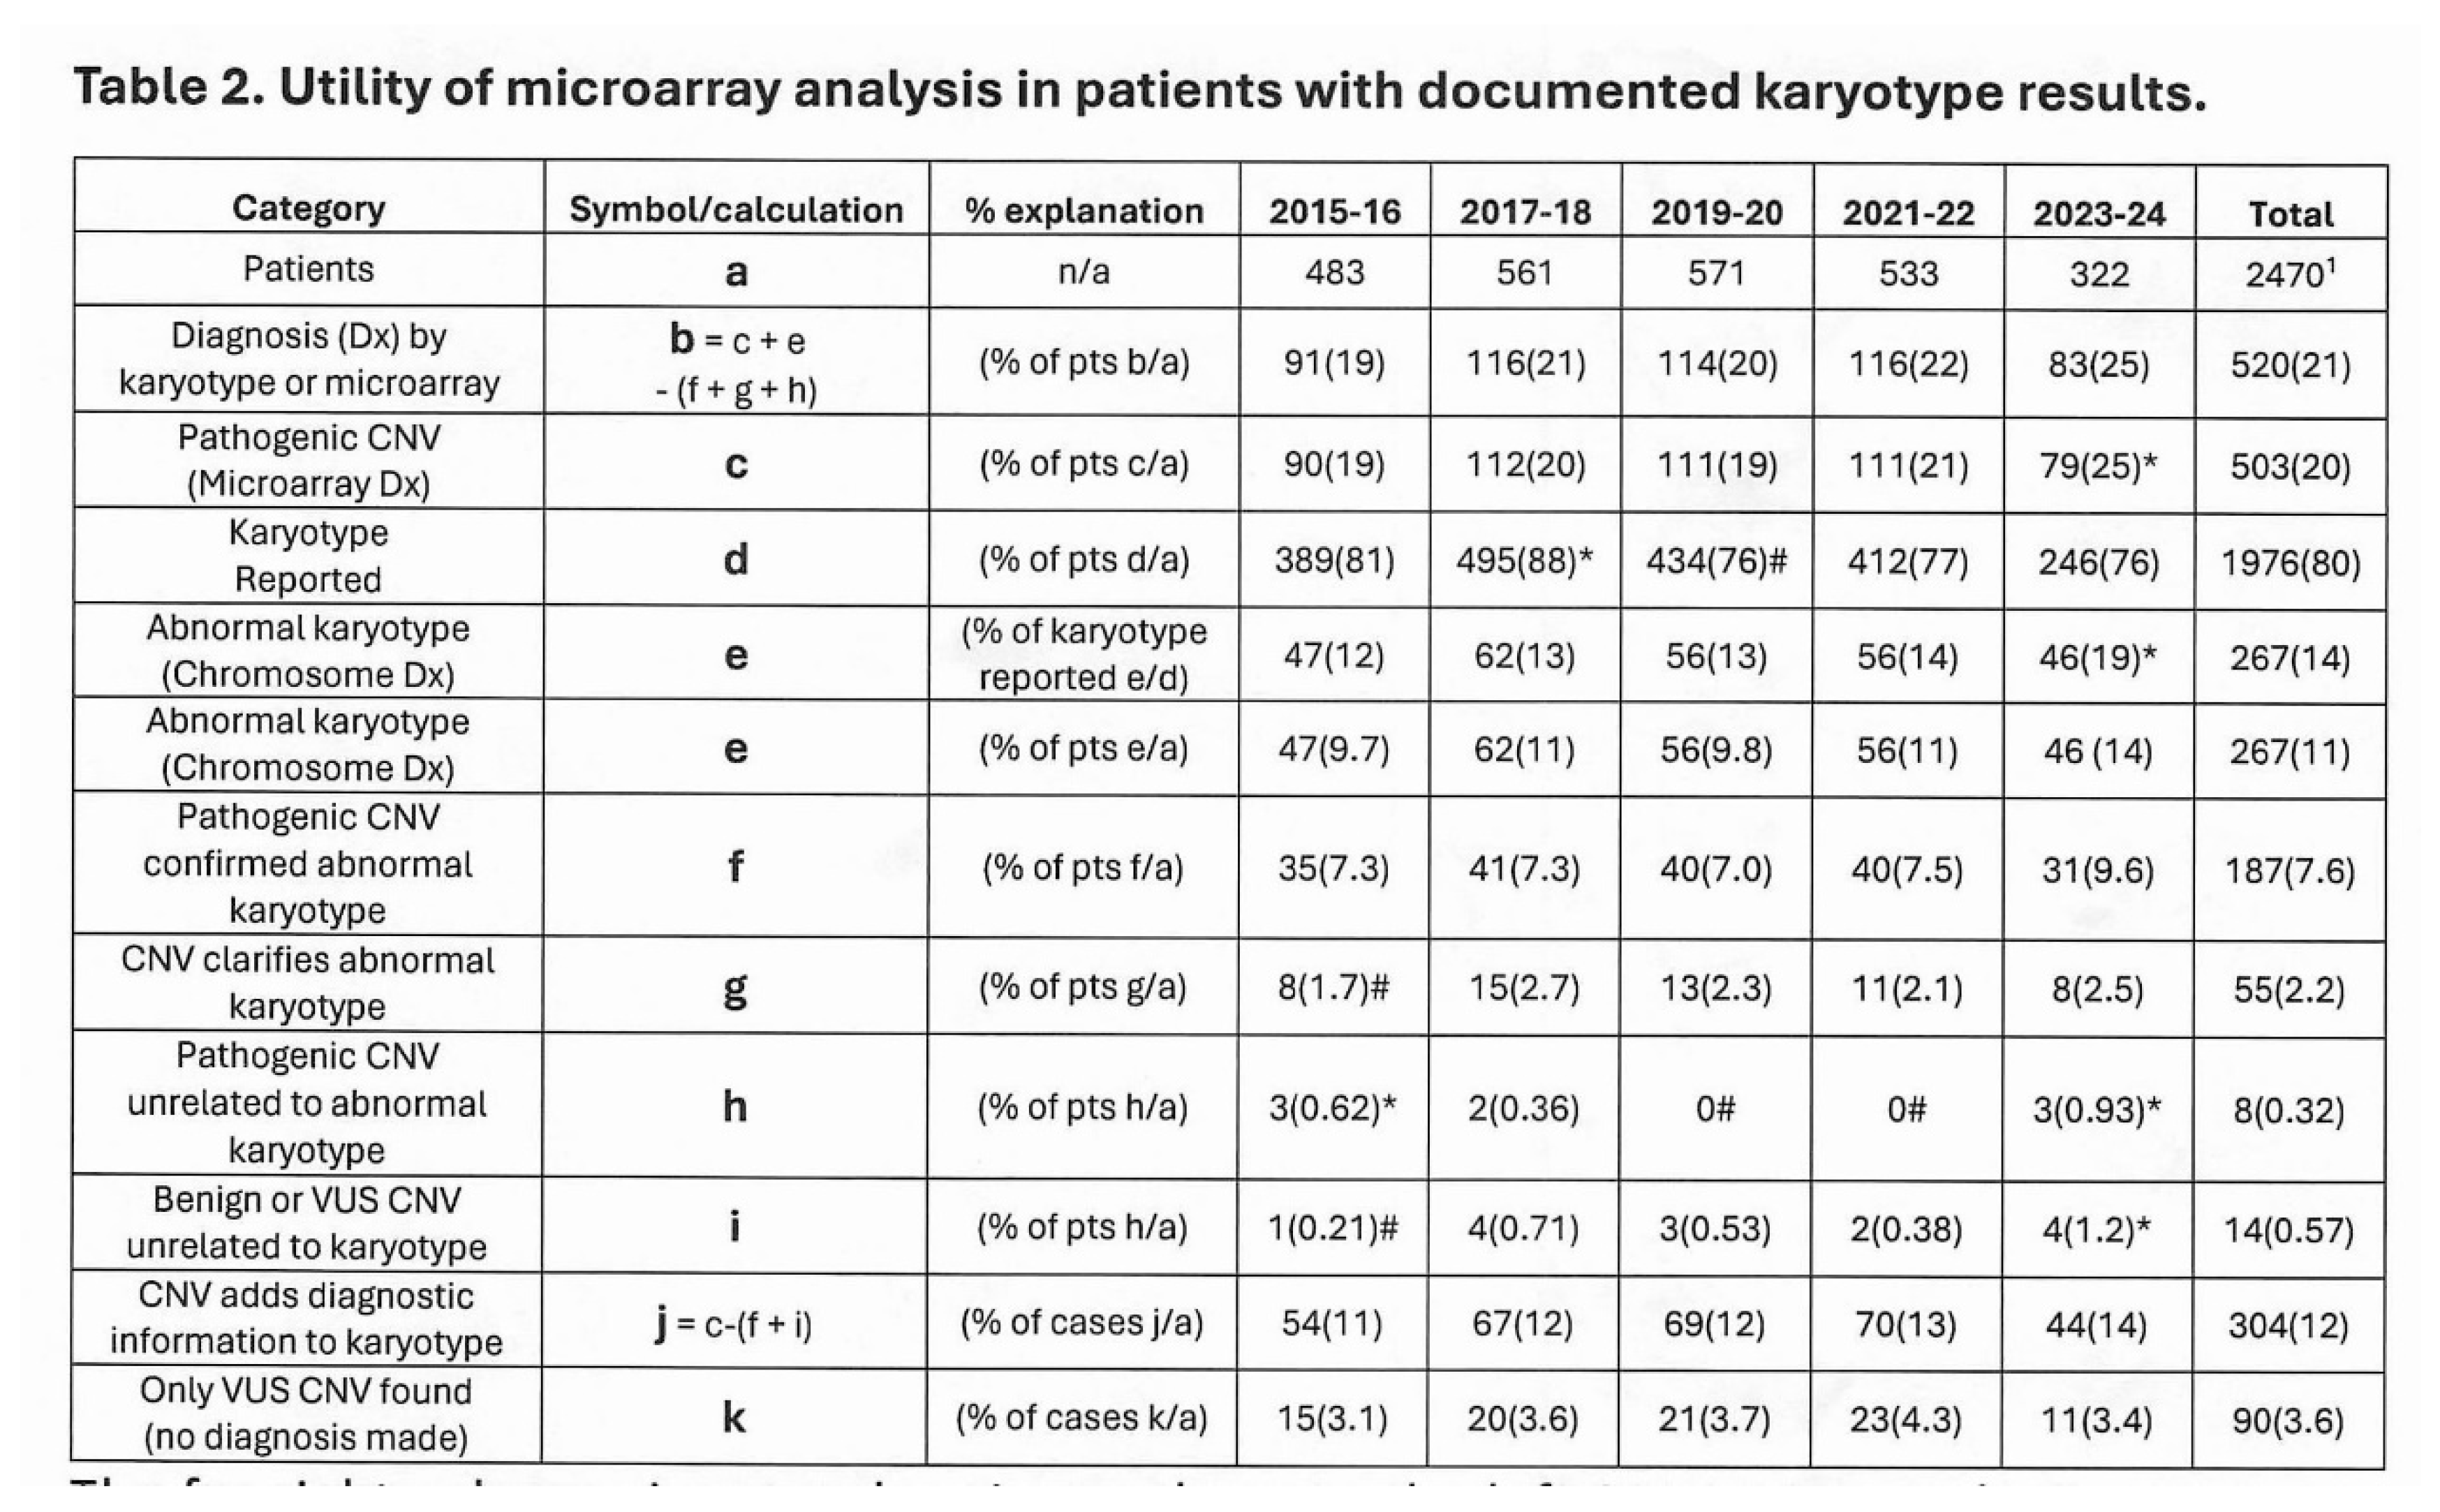
The far-right column gives total patients, those to the left 2015-24 cases by 2-year intervals, years 2015 and 2024 having data for the last and first six months respectively; 494 patients had microarray results only (138 with culture failure) and 1976 had chromosome results (data row 4); the second column assigns letters to total cases (a), those with a pathogenic copy number variant (CNV-c), those with an abnormal karyotype (e) and so forth, the third column explaining the percentages; VUS, variant of uncertain significance. *significantly higher or # significantly lower (p <0.05) biannual case percentage than that of all cases in the far-right column
Diagnoses by combined karyotype and microarray analysis as compared to those by either alone are shown in Table 2, these results taken from years 2015-24 when chromosome results were listed in the laboratory database. Total patients are in the far-right column, the 2470 patients with microarray or chromosome results equaling the 2308 for years 2016-24 in Table 1 plus another 162 patients from 2015 (including 119 with chromosome results and 3 with culture failure). Biannual patient numbers are listed in the 5 columns to the left of total patients, numbers and percentages of these total patients (top row) for various categories listed in successive rows (right columns, Table 2). Thus the patients given a diagnosis by karyotype or microarray (aCGH) are in the second row, their number (b) equaling the sum of patients with a pathogenic CNV (c) plus those with abnormal karyotypes (e) after subtracting patients where the pathogenic CNV confirmed (f--i. e., large 21 duplication paralleling karyotype of trisomy 21), clarified (g—i. e. microdeletion at breakpoints of an apparently balanced translocation), or added an unrelated CNV to the chromosomal diagnosis (h—i. e. a pathogenic 17q12 microdeletion in a patient with trisomy 21 karyotype). Patients diagnosed by karyotype and microarray analysis combined totaled 520 or 21% of total patients overall, with similar percentages for the two-year intervals from 2015-16 to 2023-24 (Table 2, second row).
Note that chromosome analysis alone gave diagnoses in 267 or 14% of patients overall (far right column, fifth data row) microarray adding diagnoses in 7% of patients for the 21% overall diagnosis rate. Microarray did add diagnostic information to cases with abnormal karyotypes in a higher 12% of patients, providing identities of marker chromosomes (too small for accurate band identification) or demonstrating that microduplications/deletions do or do not accompany translocations that by karyotype appear balanced. The ability of karyotyping to show polyploidy, translocations. and levels of mosaicism not demonstratable by microarray13 suggests consideration of a tiered approach to chromosome-microarray testing (see Discussion). Note also the increased yield that might come from qualifying more VUS-qualified CNVs (3.1-4.3% of totals in Table 2, last row) as pathogenic using point scores.20
Looking at the data for 2-year intervals shows some progression in diagnostic sensitivity as one goes from the 2015-16 (19%) to 2023-24 (25%) patients (second row, Table 2). Increased percentages of diagnosis are also shown for pathogenic microarray (19 to 25%) and abnormal karyotype results (12 to 19%) as one proceeds from those biannual cases (third and fifth data rows, Table 2), The additional pathogenic microarray findings unrelated to the abnormal karyotype vary from 0 to 6.5% over these years (8th data row), the percentage having a benign or VUS CNV accompanying the abnormal karyotype showing a 2.1 to 8.7% increase (9th data row). Similar percentages for CNVs adding diagnostic information and for VUS microarray results over the years (bottom 2 rows of Table 2) shows that resolving VUS qualifications as benign versus pathogenic has not improved with time.
Figure 1.
Number per patient and average sizes of CNVs found in 3832 patients from 2009 to 2016. A, number of variants per patient for total microarray results 2009 to 2015 (9-15), 2016 to 2024 (16-24), and 2009 to 2024 (9-24), the combined 9-24 results then tallied by benign, pathogenic, or VUS qualification. B, distribution of CNV average sizes, smaller ones (left) in kilobases (Kb), larger ones in megabases (Mb) on right. Microdeletions and duplications are grouped together in the indicated CNV size intervals.
Figure 1.
Number per patient and average sizes of CNVs found in 3832 patients from 2009 to 2016. A, number of variants per patient for total microarray results 2009 to 2015 (9-15), 2016 to 2024 (16-24), and 2009 to 2024 (9-24), the combined 9-24 results then tallied by benign, pathogenic, or VUS qualification. B, distribution of CNV average sizes, smaller ones (left) in kilobases (Kb), larger ones in megabases (Mb) on right. Microdeletions and duplications are grouped together in the indicated CNV size intervals.
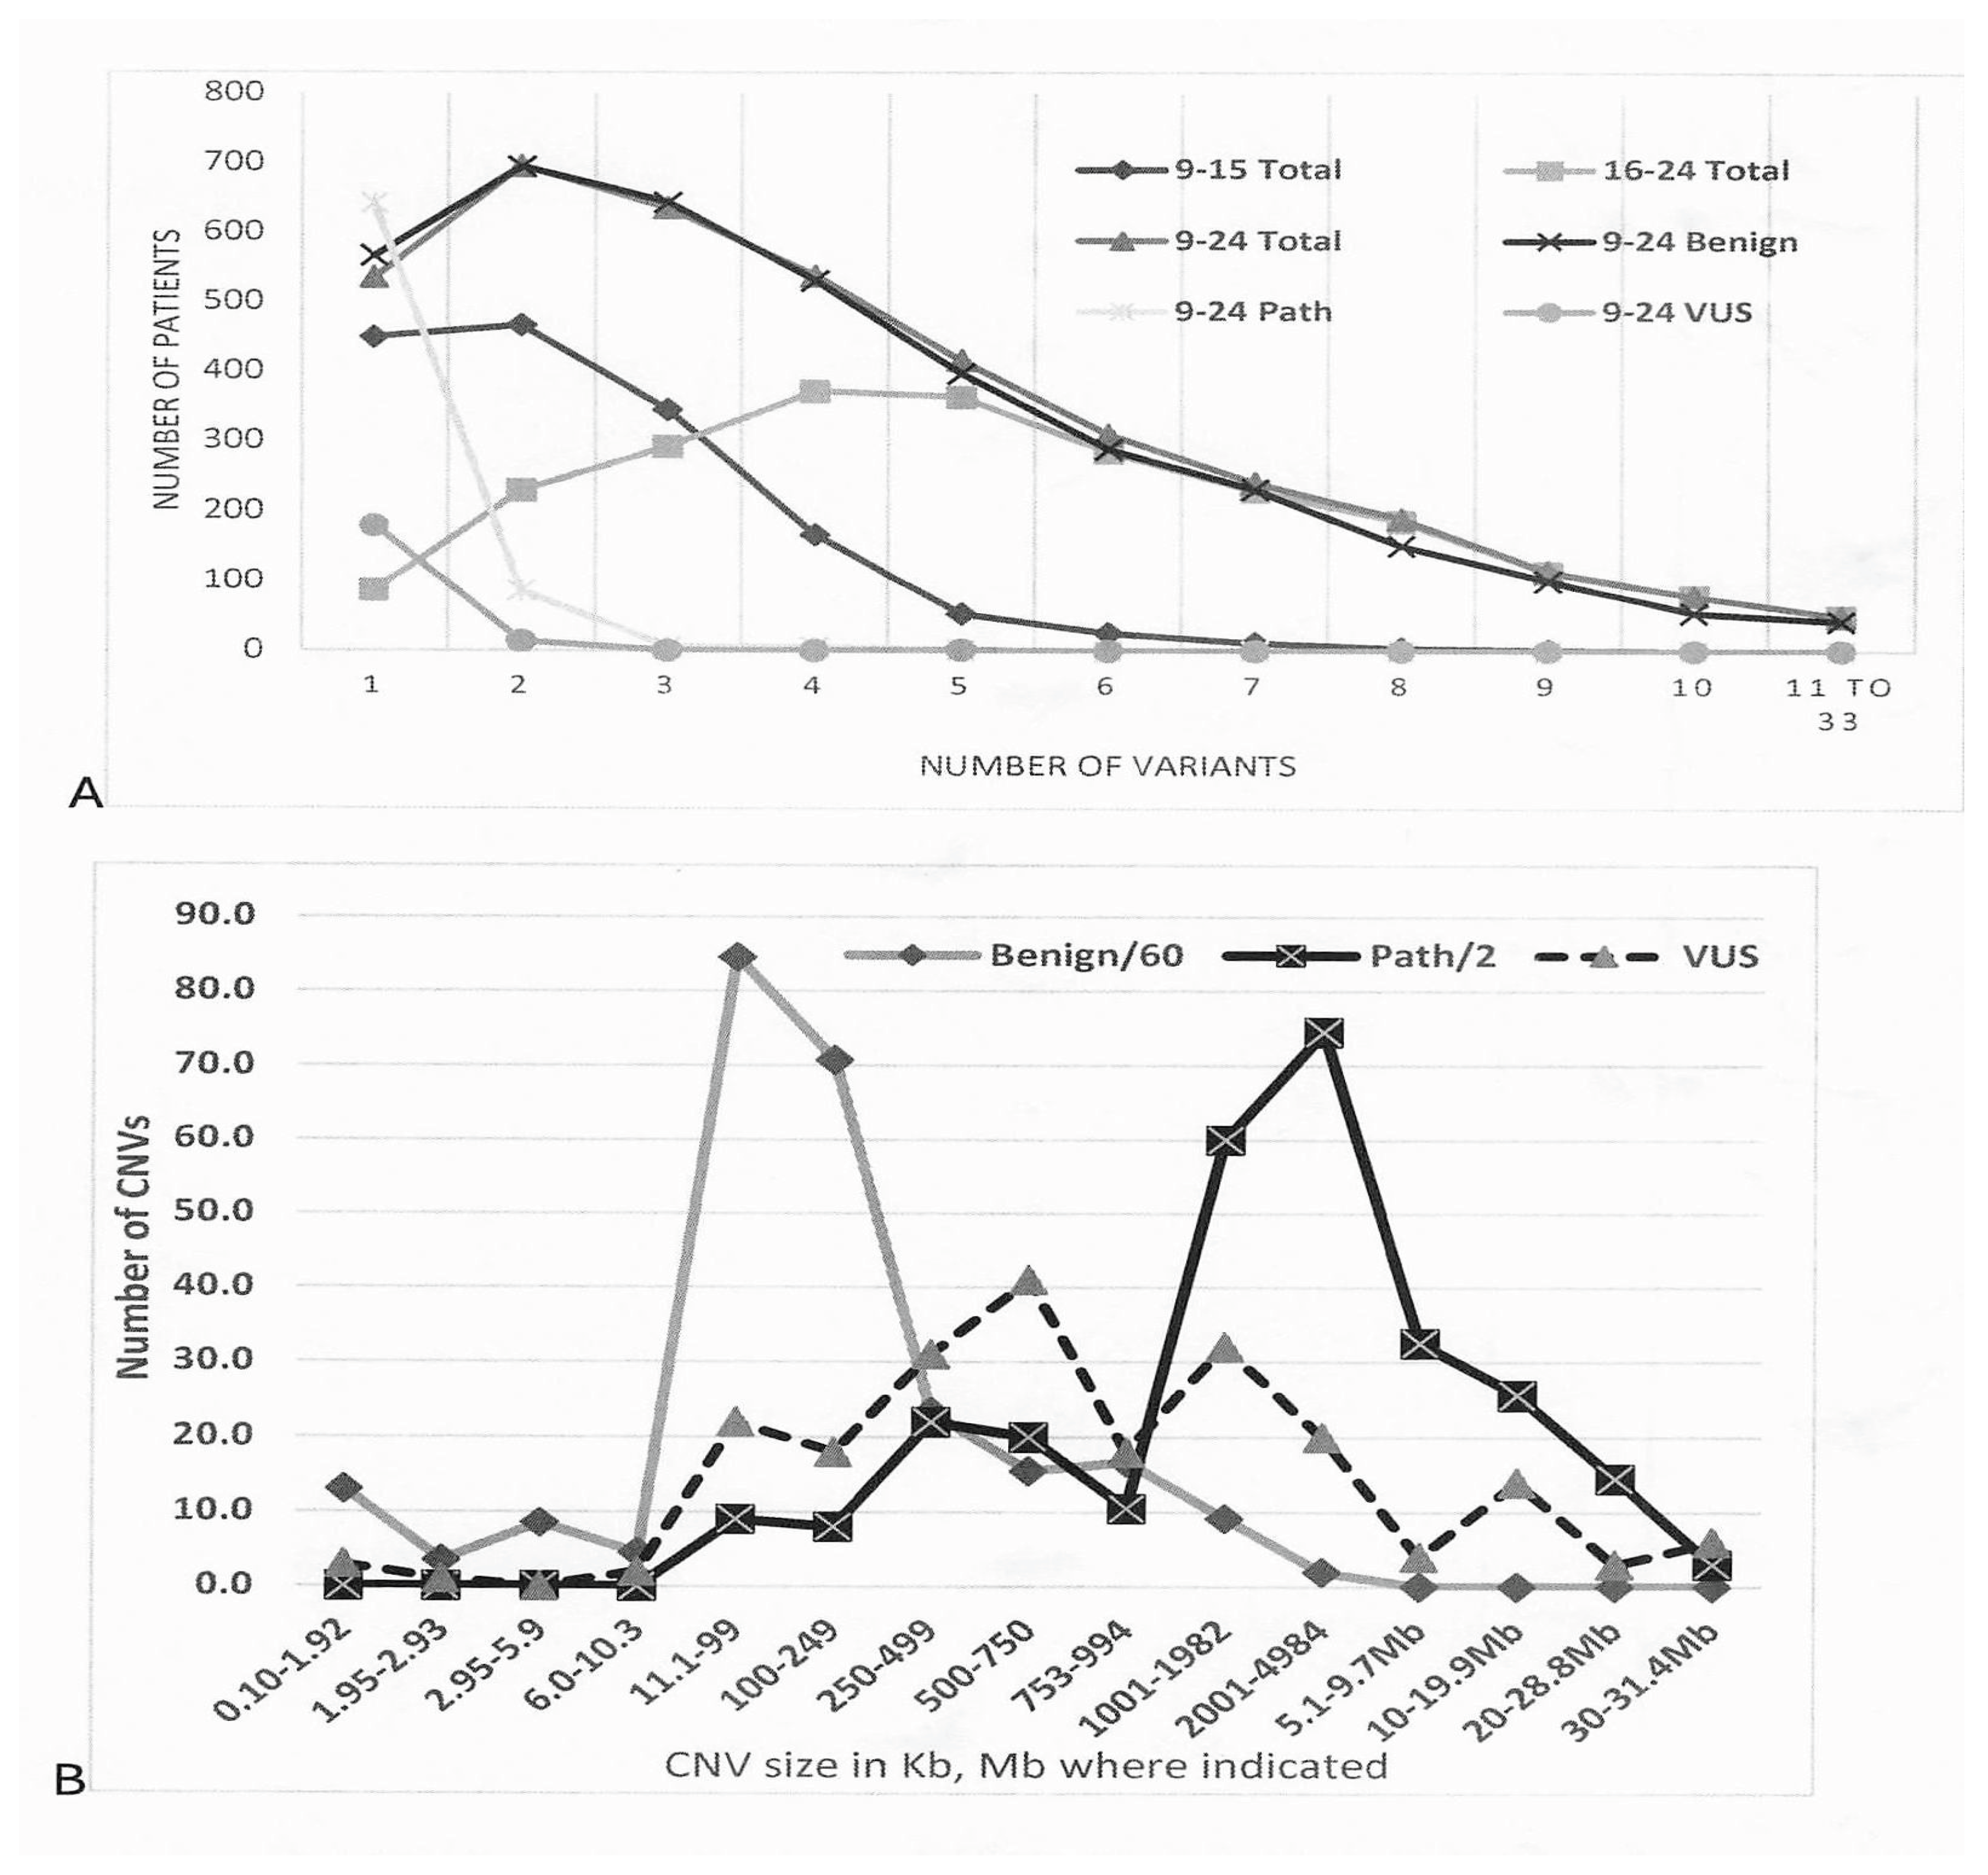
In Fig. 1A, the number of variants per patient is shown for the 2009 to 2015 microarray analyses (most having 2 CNVs per patient), those from 2016 to 2024 (most having 4 CNVs per patient), and the combined group (most having 2 CNVs per patient). The greater number of CNVs per patient for the 2016 to 2024 group reflects the change from the older EMArray 44,000 DNA probe chip to the newer Cytosure Constitutional 60,000 DNA probe chip (see Methods). Separate plotting of variants by qualification from the combined group shows the expected maximum of 2 per patient for benign variants (94% of all CNVs from Table 1), numbers of pathogenic or VUS variants declining sharply from a majority of 1 CNV per patient (Fig. 1A, left).
Fig. 1B shows the average size of CNVs, microdeletions and duplications grouped together, ranging from ~100 base pair microduplications or deletions to the ~5 megabase DNA segment size that would be detected by routine karyotype to the 30 megabase+ aneuploid segments that would be found in patients with traditional trisomy/monosomy syndromes. Note again the majority of benign variants (numbers divided by 60) and the substantial numbers of pathogenic variants (numbers divided by 2), the former peaking at sizes of 11-99 Kb in contrast to the latter at 2001-4984 Kb or about 2-5 Mb. A challenge for interpreting microarray results is shown by the overlap of CNV sizes for those qualified as VUS (~20 in the 2001-4984 Kb range, ~15 in the 10-19.9 Mb range) and those qualified as pathogenic (right side of Fig. 1B). Even a few CNVs qualified as benign had sizes in the 1001-4984 Kb range, reaffirming that size alone cannot be used to qualify CNVs as disease-contributing.11,20
Diagnoses made by routine karyotype, sometimes accompanied by fluorescent in situ hybridization (FISH), and/or by chromosome microarray analysis are shown in Table 3. Large CNVs that confirmed aberrations visualized by karyotype (full or mosaic trisomies, translocations producing large aneuploid segments) are not listed in the right columns, smaller ones that confirmed, clarified, or added novel microarray to karyotype findings as enumerated in Table 2 are listed. There were 61 chromosome disorders involving specific chromosomes or bands diagnosed by karyotyping, another 18 like triploidy not listed (see Table 3 legend). All of these were confirmed when microarray analysis was performed, 55 pathogenic CNVs (33 microdeletions, 22 microduplications) found in 3 or more patients (31 of them in 5 or more) shown in Table 3. Among these were 26 microdeletions and 17 microduplications recognized as known disorders.
Also correlating with the pathogenic CNVs listed in Table 3 are the lists of specific pathogenic or benign CNVs in S1 Table of the Supplemental Information, benign variants selected for display by 1) being in the same chromosome region as a pathogenic variant, and 2) recurring in more than 15 patients as a benign variant. S1 Table thus gives an overview of disease-associated human copy number variation, exact band loci and average CNV sizes provided in contrast to Table 3 where overlapping pathogenic variants are grouped (e. g., the one 4q32.1/.2 and three 4q32.2q35.2 microduplications in the lower left of S1 Table are grouped as four 4q32.1q35.2 microduplications in the right column of Table 3). S1 Table lists 62 CNVs (37 microdeletions and 25 microduplications) that met strong association criterion (in three or more patients) and 36 (24 microdeletions) occurring in five or more patients. Another 32 (14 microdeletions) almost meet criteria by occurring in two patients and 86 (39 microdeletions) in one, foreshadowing the large number of disorders with subtle chromosome imbalance that will be delineated by microarray analysis.
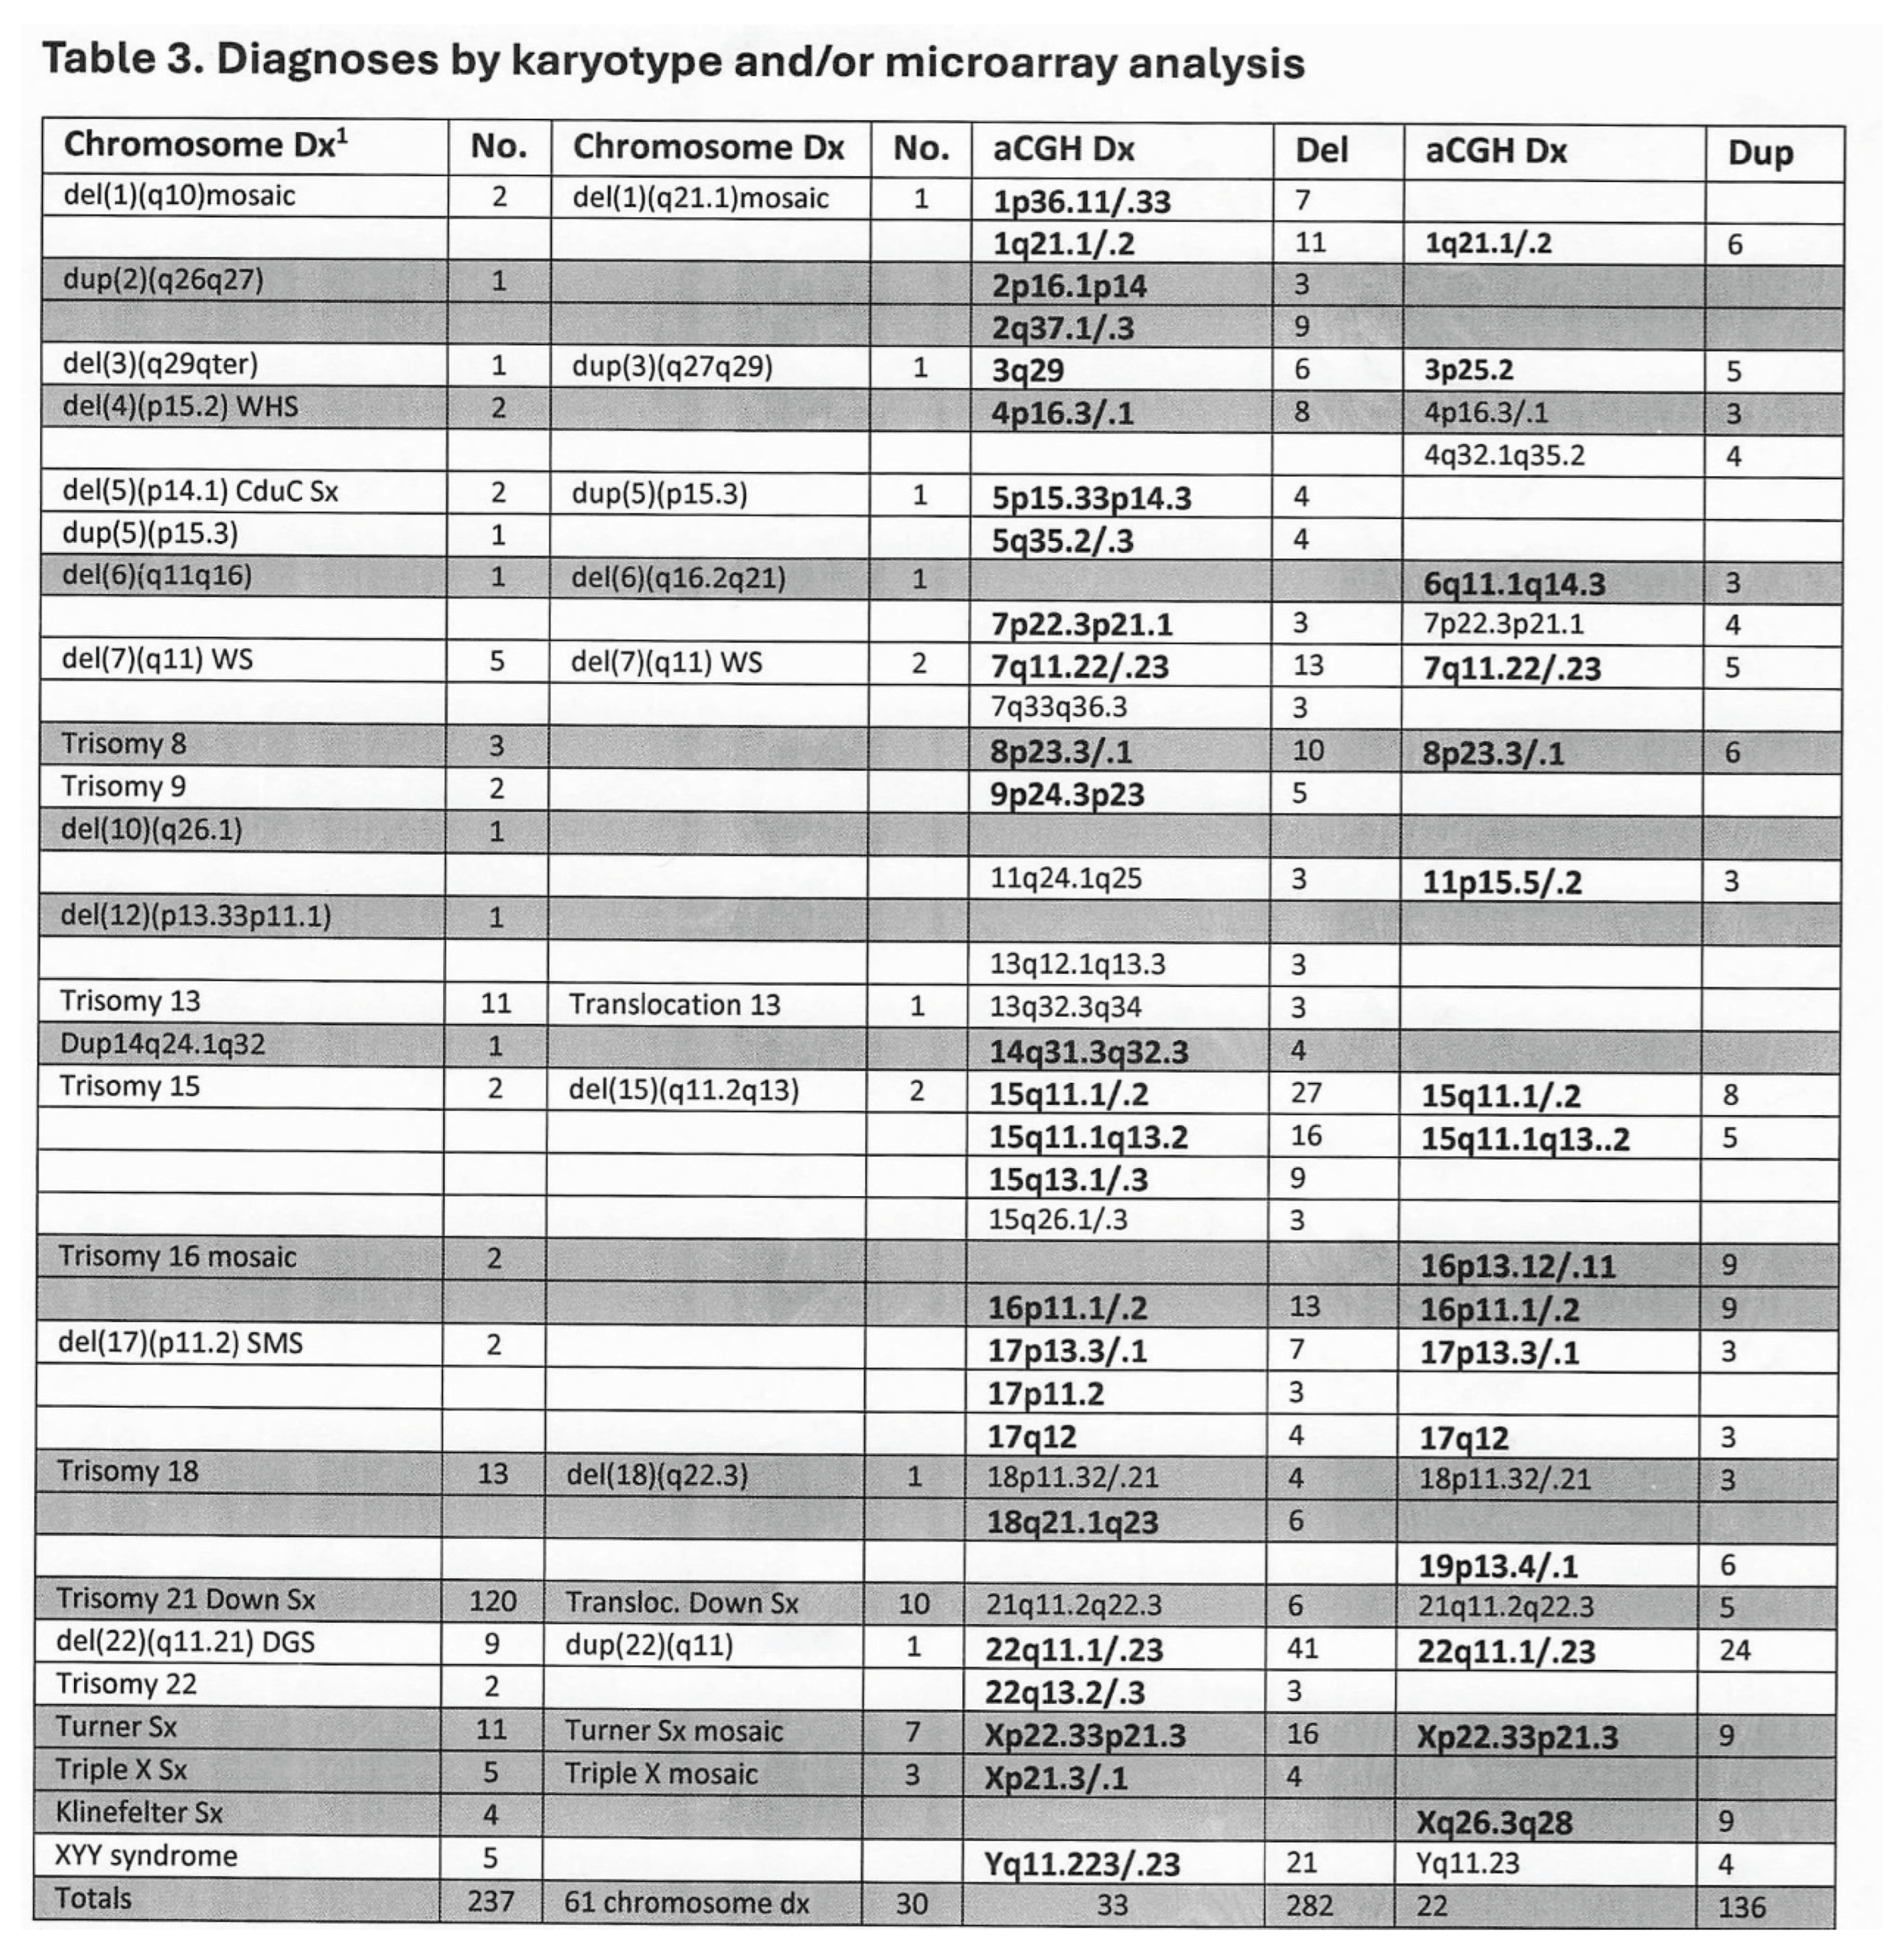
- 11.Not listed are patients with balanced translocations (11), marker chromosomes (4), pericentric inversions (2), or triploidy (10). Only the 54 microdeletions/duplications found in 3 or more patients are listed, recognized microdeletion/duplication syndromes in larger type and bolded; aCGH, array-comparative genomic hybridization or microarray analysis; CduC, cri-du-chat; DG, DiGeorge; Dx, diagnosis; PW/A, Prader-Willi/Angelman; SM, Smith-Magenis; Sx or S, syndrome; Transloc., translocation; W, Williams; WH, Wolf-Hirschhorn.
There are equal numbers (90 each) of loci with pathogenic microdeletions or microduplications in S1 Table, the former occurring in 362 patients and the latter in 222. Average sizes (including 1 CNV for each locus rather than multiple ones) are 6439 Kb for microdeletion CNVs and 6895 Kb for microduplication CNVs. Loci with 40 or more benign CNVs (shaded in S1 Table) included 23 with microdeletions and 26 with microduplications, their average lengths being a respective 263 and 277 Kb. Again the overlap of sizes is shown with CNVs qualified as pathogenic including a deletion of 329 Kb (12q23.1) and duplications of 267 Kb (2p22.1), 338 (4q12), and 387 (4q32.1), larger CNVs qualified as benign including a deletion at 5q13.2 (1400 Kb) and duplications at 5q13.2 (1100 Kb), 10q11.21 (1300 Kb), 18q21.1 (1100 Kb), and Xp22.2p21.3 (1300 Kb).
All of the pathogenic CNVs have loci in common with benign CNVs except for the 3 at 11q24.1q25 (middle right of S1 Table). A slight majority 35 of the 62 pathogenic CNVs occur in regions where there are 20 or more benign microdeletions and duplications, less than half (29 CNVs) sharing loci where there were 100 or more benign variants of either type. Of the loci with frequent benign CNVs, the 23 with multiple benign microdeletions accompanied by 15 with pathogenic microdeletions, the 26 with multiple benign microduplications accompanied by 13 with pathogenic microduplications. Locations of larger pathogenic CNVs did not significantly associate (p <0.05) with those having frequent smaller benign CNVs, indicating genesis of larger and thus likely pathogenic CNVs can be a primary event rather than further amplifications of benign CNVs.
Adding to the overview of CNVs detectable in the human genome by medical laboratory analysis is the data in S2 Table of the Supplementary Materials, first looking at the distribution by chromosome of benign microdeletions and duplications (columns A-0). CNVs qualified as VUS or pathogenic (216 or 836 variants in Table 1) are not included in these columns because they are a small proportion of the 15,083 benign variants; they are included in columns P-Q where the non-overlapping CNV nucleotide lengths and their fraction of chromosome length are listed. Although CNVs occur on all 24 chromosomes, we see from the conditional formatting in columns C and H that chromosomes 6, 8, 17, and 22 have more microdeletion CNVs (present in a respective 1224, 1016, 601, and 704 of the 3832 patients analyzed) and that chromosomes 8, 14, 17, 22, and X have more microduplication CNVs (present in a respective 1618, 947, 910, 836, and 1346 of patients analyzed).
Multiplying these numbers of CNVs (columns C and H) by their average length (columns D, I) gives the number of variant nucleotides in kilobases, which can then be divided by the 3832 patients to give the amount of nucleotide variation per patient (E, J). Dividing nucleotide variation by chromosome length (repeated in columns A, R for reference) gives the nucleotide variation per patient as a proportion of each chromosomal DNA strand (columns F and K). Once average CNV sizes are incorporated, there are more deleted nucleotides on chromosomes 1, 5, 8, and 14 (respective amounts of 33, 60, 21, and 14 Kb) and more duplicated nucleotides on chromosomes 8, 14, 17-15, 22, and X (respective amounts of 94, 98, 40-44, 39, and 50 Kb). Dividing these numbers of variant nucleotides by chromosome length then gives larger percentages of deleted nucleotides for chromosomes 1, 5, 8, 16, and Y (respective percentages of 0.013, 0.033, 0.014, 0.016, and 0.012% in column F) and of duplicated nucleotides for chromosomes 8, 14, 17-15, 22, and Y (respective percentages of 0.064, 0.092, 0.051-0.044, 0.078, 0.032,and 0.042). The bottom row totals of S2 Table indicate that the average patient in this study had 256,000 nucleotides of deleted DNA amounting to 0.19% of their genome (columns E, F), 542,000 nucleotides of duplicated DNA amounting to 0.56% of their genome (columns J, K).
Overall amounts of benign-qualified copy number variation are shown to the right of S2 Table, 798,000 nucleotides of copy number change (deletion plus duplication) occupying greater percentages of chromosomes 5, 8, 14-17, 21, X, and Y and constituting 0.72% of the average patient genome (column O). The excess of pathogenic microdeletions (362 versus 222 microduplications) shown in S1 Table is reversed for benign CNVs that total 5984 microdeletions and 9099 microduplications (bottom row of S2 Table).
Column N of S2 Table shows that the ratio of total benign microdeletions to microduplications varies widely by chromosome, numbers 5 and 6 having substantially more microdeletions (darker red conditional formatting), numbers 1, 2, 10, and 13 having slightly more or nearly as many, the other eighteen chromosomes having more duplications with numbers 9, 11, 12, and 21 having substantially more (dark blue formatting). When ratios of CNV nucleotides per patient per chromosome length are tallied, chromosomes 1-3, 5, 9, 11, 13, 18, and 20 have more deletions per strand of DNA with chromosomes 8, 14, 17, 22, and X having an excess of duplications. The contrasting excess of pathogenic microdeletions compared to that of benign duplications fits with the greater impact of deleted DNA known from chromosome aberrations and autosomal recessive conditions.
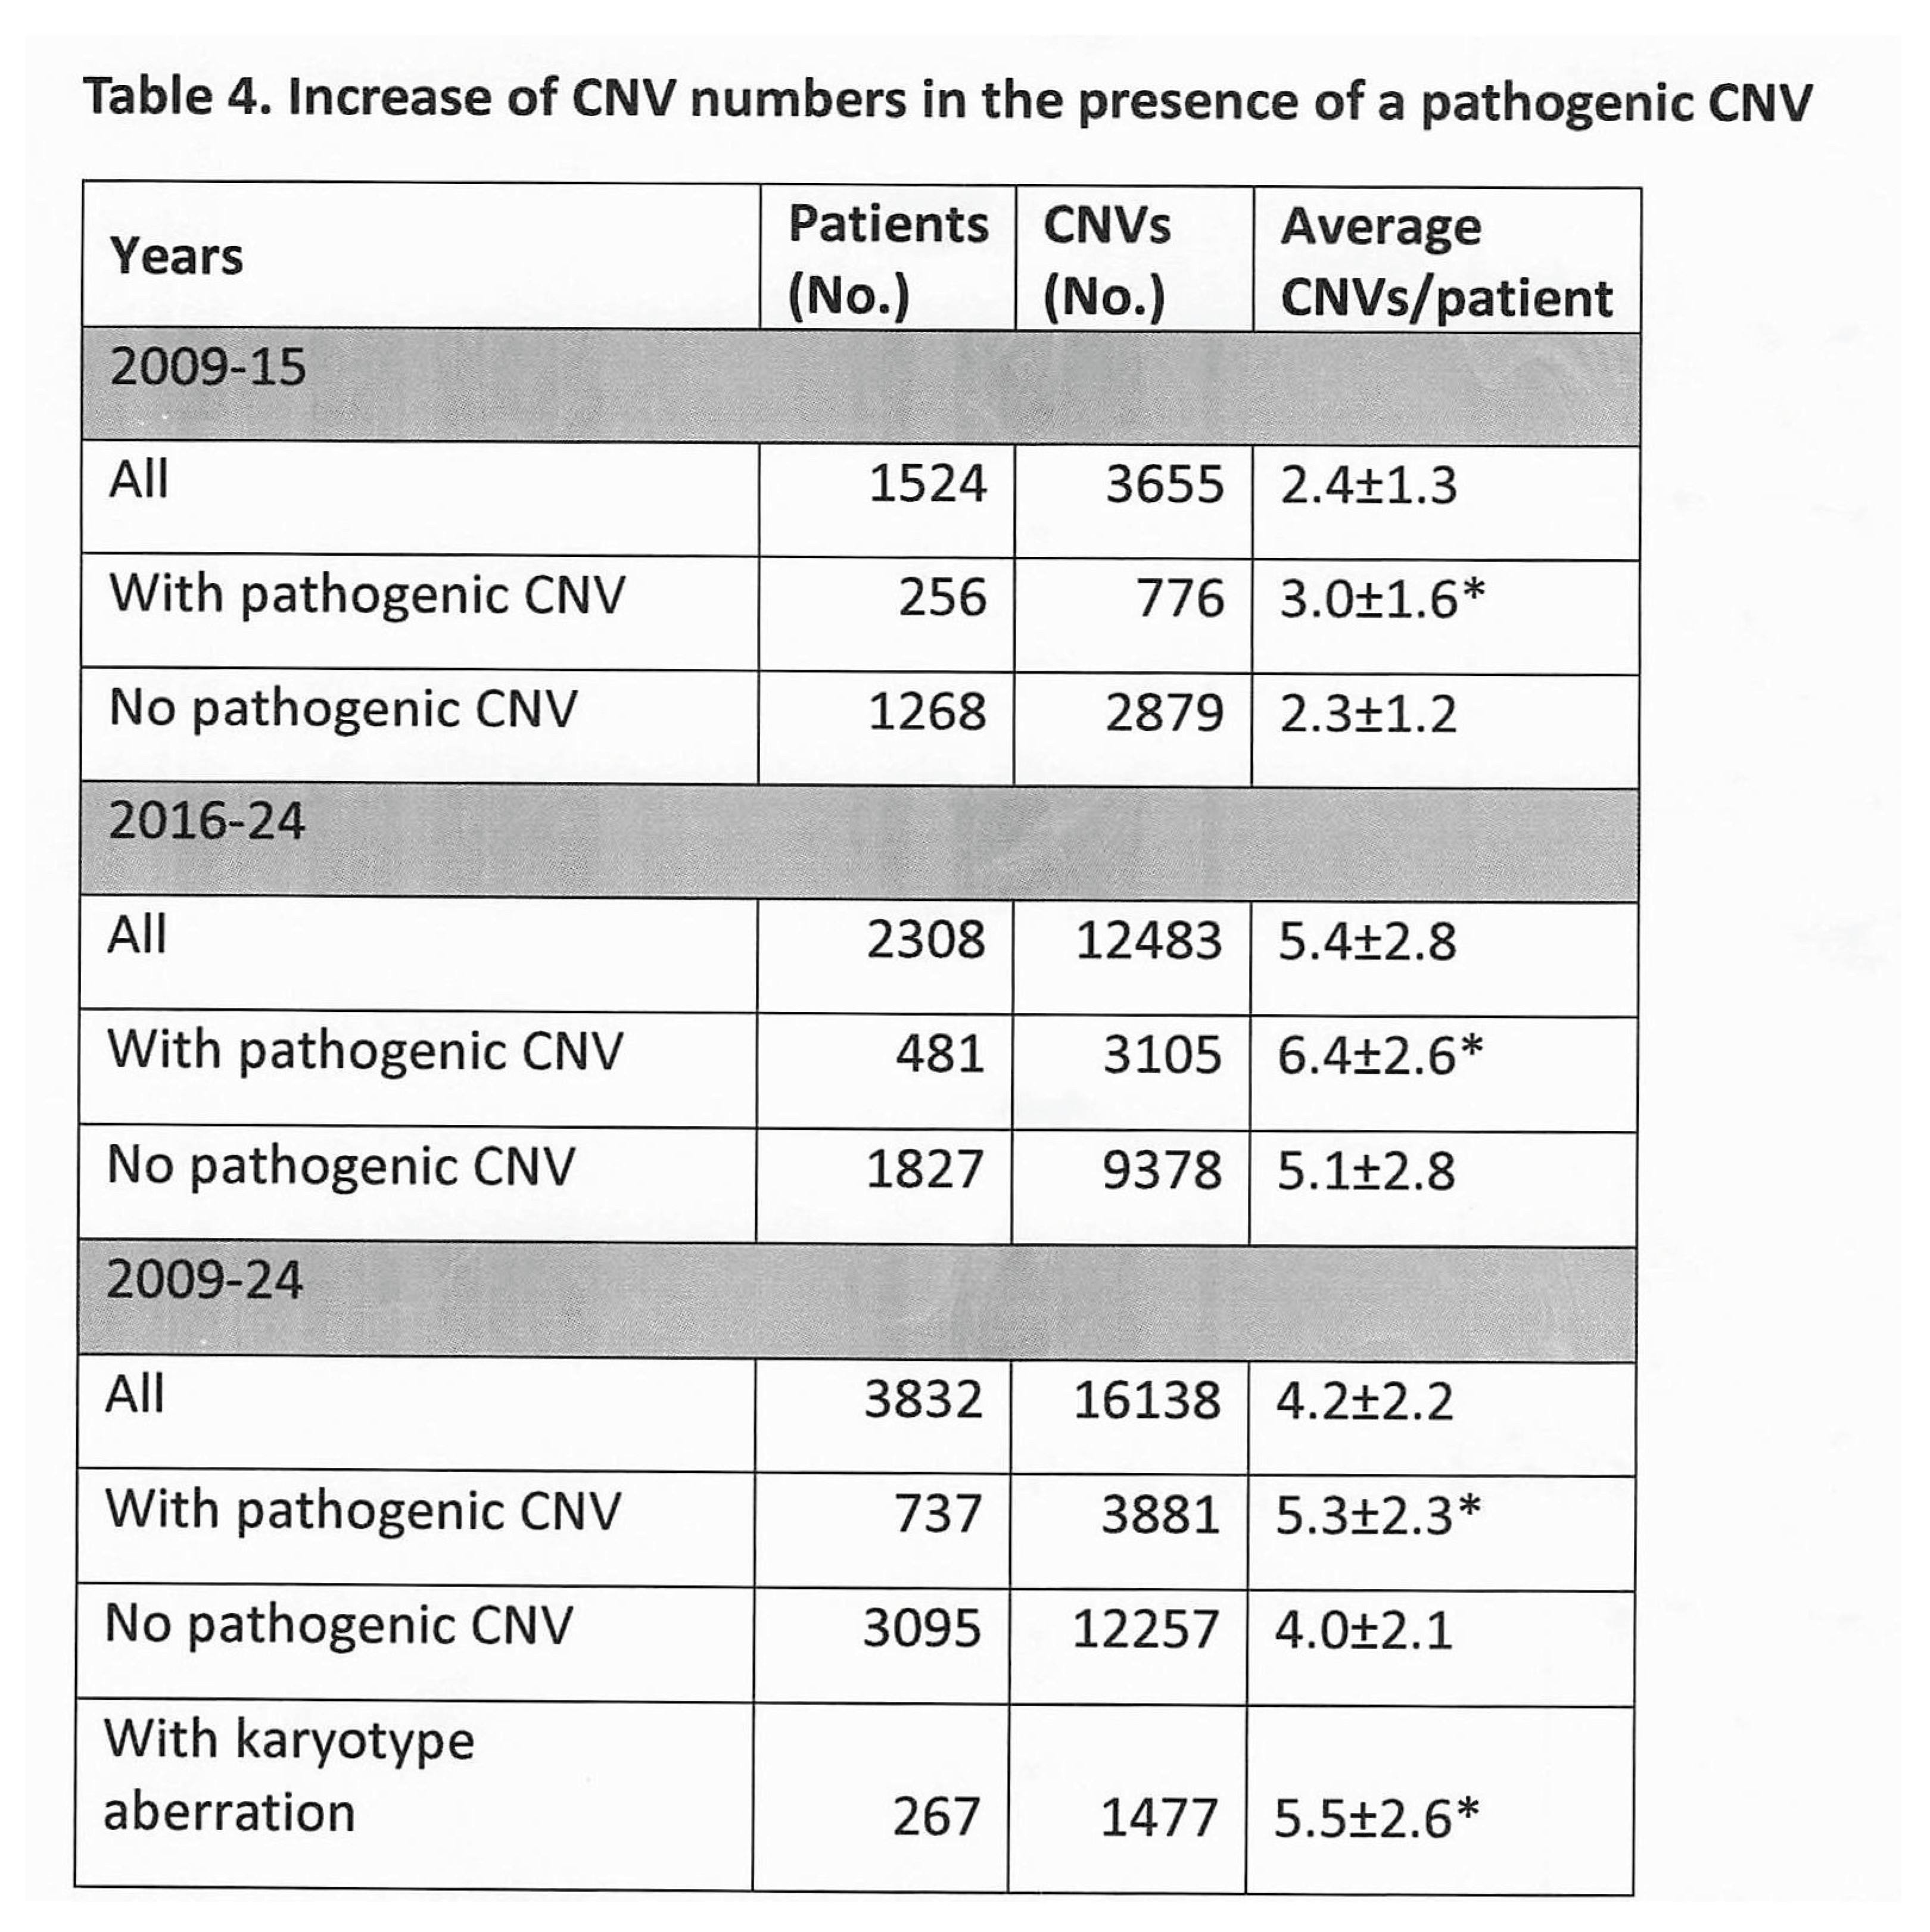
A different perspective on CNV genotype/clinical phenotype association is suggested by the data in Table 4, showing that the presence of a (typically larger) pathogenic CNV increases the average number of CNVs in the average patient. Recall from Fig. 1B that the different chips used for microarray analysis in the 2016-24 population versus the 2009-15 patients gave more average variants, numbers of CNVs in the presence or absence of a pathogenic variant given for each patient group and all patients. The 3.0, 6.4, and 5.3 mean variants per patient when a pathogenic CNV is present are significantly more than the 2.3, 5.1, and 4.0 when absent at the p <.0.001 level. Also increasing average numbers of CNVs per patient is the presence of a large chromosome aberration found by routine karyotype, raising the oft-discussed possibility that DNA imbalance decreases regulatory constraints on genes within and outside of aneuploid intervals (see Discussion).
CNV, 0001. level.
Discussion
Microarray analysis of 3832 patients identified 16,138 copy number variants (CNVs), reflecting genomic instability driven by multiple repetitive elements such as low-copy and Alu repeats that predispose to misalignment and structural rearrangements.14 Most CNVs were small and classified as having benign consequences2,11,13,20—here numbering 15,083 (Table 1) with sizes peaking at 11-99 kilobases (Fig. 1B). In contrast, pathogenic CNVs—typically larger and mostly in the 2 to 10 Mb range—were associated with developmental disability/autism spectrum disorders3−10, 15−19 and neurological phenotypes including epilepsy,18 schizophrenia,32 or obsessive-compulsive disorder.33 These pathogenic CNVs accounted for 836 variants and provided a diagnosis in 749 patients (20% of those analyzed).
Among 2,470 patients with both karyotype and microarray results (Table 2; S3 of Supplementary Materials), 1,976 (80%) underwent karyotyping as well as microarray analysis. Abnormal karyotypes were identified in 267 patients (14%), with microarray confirming the karyotype in 187 (70%) and clarifying them in 55 (21%) by revealing subtle imbalances at translocation breakpoints. Microarray results added diagnostic information in 304 patients (12%) and identified pathogenic CNVs in 503 (20%), resulting in a combined diagnostic yield of 21% that is consistent with other published studies.3−13
Although additional karyotype analysis added only 17 diagnoses to the 503 made by microarray when both analyses were used (Table 2), a tiered diagnostic strategy could be considered in certain situations (fetal demise, recurrent pregnancy loss, reimbursement difficulties): Begin with karyotyping, reflex to microarray for the 1772 (90%) with normal karyotypes or ambiguous findings (Table 2 and Table 3), including apparently balanced translocations, complex rearrangements, small deletions/duplications, or marker chromosomes. This combined approach also addresses rare abnormalities such as mosaicism and triploidy that typically yield normal microarray results--such changes were detected in 24 patients or 1.2% of those with karyotype results.
The high frequency of CNVs documented here and in prior studies highlights their role in genome fluidity and evolution.14 CNVs provide abundant opportunities for gene rearrangement and separate or clustered gene amplification with an average of 798,000 nucleotides (0.75% of the genome) deleted or duplicated in the 3832 patients described here. These changes were distributed across all chromosomes, with microdeletions more frequent on chromosomes 6, 8, 17, and 22 and microduplications on 8, 14, 17, 22, X (S1 and S2 Tables in the Supplementary Information). CNV burden per patient ranged from 4-5 variants on average to as many as 33 (Fig. 1A). Despite this complexity, definitive diagnoses meeting ACMG criteria11,20−23 were achieved for 55 recurrent microdeletion/duplication syndromes and 27 additional CNVs with emerging syndromes (Table 3). These microarray diagnoses complemented 61 karyotype-based diagnoses, including Down syndrome (120 cases), trisomy 13/18 (24 cases), and sex chromosome aneuploidies such as Turner, Triple X, Klinefelter, and XYY syndromes (11, 5, 4, and 5 cases, Table 3).
Diagnostic yield was similar between sexes, females averaging 4.6 CNVs per patient (19% diagnostic) and males averaging 4.4 CNVs (16% diagnostic; Table 1). Lower yields were found in cases of fetal demise (9.3% diagnostic), familial testing (11%), and infertility (10%). Notable ambiguity concerned Yq11.23 microdeletions in males--2 of them qualified as pathogenic, 2 others as of uncertain significance-- and 21 Yq11.223/.23 microduplications qualified as benign (Table 3) despite correlations with azoospermia when such duplications were in the chromosome Y AZFc region.34
Although chromosome microarray analysis identifies recurring haploinsufficiency or duplication of genes within CNV regions, difficulties with the interpretation persist as shown by the 147 patients with results qualified as VUS, corresponding to 216 CNVs (1.3% of all variants in Table 1) with sizes ranging from 11 kb to 30 Mb. Notably, about 70 (32%) of these fell within the 1-20 Mb range that contains most pathogenic CNVs (Fig. 1B). Step-wise qualification approaches focused on gene content and mechanism11−12, 13 may increase molecular understanding of chromosome imbalance mechanisms that continue to be poorly understood, genes that seem critical for CNV impact in some patients associated with milder effects in others.28 A striking limitation of this study and similar ones is the minimal clinical information that accompanies patient samples, very different from usual medical testing as with values of blood urea nitrogen or creatinine that are correlated with holistic multi-system results in multiple patients over multiple time intervals.
Another indication besides their congruent neurodisability phenotype that CNV impact may involve factors independent of their constituent genes is in Table 4, showing that patients with large pathogenic CNVs or chromosomal aberrations tend to harbor additional CNVs. The data suggest that large CNVs can occur as isolated rather than cumulative events, that their presence decreases constraints on CNV formation, and that CNVs singly or together can produce general as well as domain-specific clinical manifestations. Very susceptible to these general imbalance effects would be the most complex human functions, namely the cognitive abilities and social interactions that are almost always a part of CNV-associated conditions. Because any neurodisability disorder including Down syndrome can be associated with autistic behaviors,35 many of the 3350 patients with developmental disability (78% of the 3832 total in Table 1, 694 or 21% having pathogenic variants) might be grouped with the 178 having explicit autism (4.6% of 3832, 24 or 13% with pathogenic variants) if they had appropriate evaluations.9,10,36
Ambiguities emphasized by this and other studies argue for genotype-phenotype registries wherein CNV qualities (size, prevalence, included/external gene changes/actions) and their holistically documented clinical findings (neurobehavioral and corporal) are accumulated and analyzed for pathogenic consequence using large language models of artificial intelligence.37 As these syntactical correlations accumulate, neonatal genomic screening combined with laser-guided focus36 might target autism-predisposed infants for stimulation therapies analogous to the forcing of amblyopic eyes toward normal sensorineural perception.38
Supplementary Materials
The following supporting information can be downloaded at the website of this paper posted on Preprints.org. The Chavali et al. Supplementary Materials MS Excel file contains S1 and S2 Tables as referred to in the tex.
Author Contributions (by CRediT categories)
Conceptualization (S.C.; GW; V.T.), Data curation (S.C.; S.T.; G.W.; V.T.), Formal analysis (S.C.; S.T.; G.W.; V.T.), Methodology (S.C.; V.T.), Project administration (S.C.; V.T.), Resources (S.C.; V.T.), Software (S.C.; S.T.; V.T.), Supervision (S.C.; V.T.), Validation (S.C.; S.T.; V.T.), Visualization (S.C.; V.T.), Writing-original draft (S.C.; G.W.; V.T.), Writing review and editing (S.C.; S.T.; G.W.; V.T.).
Acknowledgments
The authors acknowledge the many physicians, particularly neonatologists, at Texas Tech centers (Amarillo, Lubbock, Midland, El Paso) who have contributed samples for CMA. Funding.
Conflicts of Interest
The authors declare no conflict of interest.
Data and Code Availability
The 2009-2024 CMA database with patient log numbers transposed for confidentiality is available by contacting the senior author at vijay.tonk@ttuhsc.edu.
Statement
Data was obtained through operation of an academic fee-for-service laboratory; No internal or external funding for data acquisition or analysis was obtained.
Ethics declaration
All laboratory samples and reports were entered into a deidentified database under IRB approval (Texas Tech IRB-FY2025-128, exempt status granted March 12, 2025). No informed consent was required, the only unique identifying data being the laboratory log number that was coded in the research database.
References
- Nurk, S.; Koren, S.; Rhie, A.; et al. The complete sequence of a human genome. Science 2022, 376, 44–53. [Google Scholar] [CrossRef]
- Olson, N.D.; Wagner, J.; Dwarshuis, N.; et al. Variant calling and benchmarking in an era of complete human genome sequences. Nat. Rev. Genet 2023, 24, 464–483. [Google Scholar] [CrossRef] [PubMed]
- Beaudet, A. The utility of chromosomal microarray analysis in developmental and behavioral pediatrics. Child Dev. 2013, 84, 121–132. [Google Scholar] [CrossRef] [PubMed]
- Coulter, M.E.; Miller, D.T.; Harris, D.J.; et al. Chromosomal microarray testing influences medical management. Genet Med. 2011, 13, 770–776. [Google Scholar] [CrossRef] [PubMed]
- Yuan, H.; Shangguan, S.; Li, Z.; et al. CNV profiles of Chinese pediatric patients with developmental disorders. Genet Med. 2021, 23, 669–678. [Google Scholar] [CrossRef] [PubMed]
- Mardy, A.H.; Wiita, A.P.; Wayman, B.V.; Drexler, K.; Sparks, T.N.; Norton, M.E. Variants of uncertain significance in prenatal microarrays: a retrospective cohort study. BJOG 2021, 128, 431–438. [Google Scholar] [CrossRef] [PubMed]
- Tao, Y.; Guo, H.; Han, D.; et al. Uncovering genetic contributors to developmental delay and intellectual disability: a focus on CNVs in pediatric patients. Front Genet 2025, 16, 1539902. [Google Scholar] [CrossRef] [PubMed]
- Pande, S.; Dawood, M.; Grochowski, C.M. Structural variants: Mechanisms; mapping; and interpretation in human genetics. Genes 2025, 16, 905. [Google Scholar] [CrossRef] [PubMed]
- Betancur, C. Etiological heterogeneity in autism spectrum disorders: More than 100 genetic and genomic disorders and still counting. Brain Res. 2011, 1380, 42–77. [Google Scholar] [CrossRef] [PubMed]
- Ceylan, A.C.; Citli, S.; Erdem, H.B.; Sahin, I.; Acar Arslan, E.; Erdogan, M. Importance and usage of chromosomal microarray analysis in diagnosing intellectual disability; global developmental delay; and autism; and discovering new loci for these disorders. Mol. Cytogenet 2018, 11, 54. [Google Scholar] [CrossRef] [PubMed]
- Miller, D.T.; Adam, M.P.; Aradhya, S.; et al. Consensus statement: Chromosomal microarray is a first-tier clinical diagnostic test for individuals with developmental disabilities or congenital anomalies. Am. J. Hum. Genet 2010, 86, 749–764. [Google Scholar] [CrossRef] [PubMed]
- Kaminsky, E.B.; Kaul, V.; Paschall, J.; et al. An evidence-based approach to establish the functional and clinical significance of copy number variants in intellectual and developmental disabilities. Genet Med. 2011, 13, 777–784. [Google Scholar] [CrossRef] [PubMed]
- Wyandt, H. E.; Wilson, G.N.; Tonk, V.S. Chromosome Structure and Variation: Heteromorphism; Polymorphism; and Pathogenesis; Springer, 2017. [Google Scholar]
- Lupski, J.R.; Liu, P.; Stankiewicz, P.; Carvalho, C.M.B.; Posey, J.E. Clinical genomics and contextualizing genome variation in the diagnostic laboratory. Expert Rev. Mol. Diagn. 2020, 20, 995–1002. [Google Scholar] [CrossRef] [PubMed]
- Coe, B.P.; Witherspoon, K.; Rosenfeld, J.A.; et al. Refining analyses of copy number variation identifies specific genes associated with developmental delay. Nat. Genet 2014, 46, 1063–1071. [Google Scholar] [CrossRef] [PubMed]
- Whitby, H.; Tsalenko, A.; Aston, E.; et al. Benign copy number changes in clinical cytogenetic diagnostics by array CGH. Cytogenet Genome Res. 2008, 123, 94–101. [Google Scholar] [CrossRef] [PubMed]
- Girirajan, S.; Brkanac, Z.; Coe, B.P.; et al. Relative burden of large CNVs on a range of neurodevelopmental phenotypes. PLoS Genet 2011, 7, e1002334. [Google Scholar] [CrossRef] [PubMed]
- Borlot, F.; Regan, B.M.; Bassett, A.S.; Stavropoulos, D.J.; Andrade, D.M. Prevalence of pathogenic copy number variation in adults with pediatric-onset epilepsy and intellectual disability. JAMA Neurol. 2017, 74, 1301–1311. [Google Scholar] [CrossRef] [PubMed]
- Cucinotta, F.; Lintas, C.; Tomaiuolo, P.; et al. Diagnostic yield and clinical impact of chromosomal microarray analysis in autism spectrum disorder. Mol. Genet Genom. Med. 2023, 11, e2182. [Google Scholar] [CrossRef] [PubMed]
- Riggs, E.R.; Andersen, E.F.; Cherry, A.M.; et al. Technical standards for the interpretation and reporting of constitutional copy-number variants: a joint consensus recommendation of the American College of Medical Genetics and Genomics (ACMG) and the Clinical Genome Resource (ClinGen). Genet Med. 2020, 22, 245–257. [Google Scholar] [CrossRef] [PubMed]
- Richards, S.; Aziz, N.; Bale, S.; et al. ACMG Laboratory Quality Assurance Committee. Standards and guidelines for the interpretation of sequence variants: a joint consensus recommendation of the American College of Medical Genetics and Genomics and the Association for Molecular Pathology. Genet Med. 2015, 17, 405–424. [Google Scholar] [CrossRef] [PubMed]
- MacArthur, D.G.; Manolio, T.A.; Dimmock, D.P.; Rehm, H.L.; Shendure, J.; Abecasis, G.R. Guidelines for investigating causality of sequence variants in human disease. Nature 2014, 24, 469–476. [Google Scholar] [CrossRef] [PubMed]
- Landrum, M.J.; Lee, J.M.; Benson, M.; et al. ClinVar: improving access to variant interpretations and supporting evidence. Nucleic Acids Res. 2018, 46, D1062–D1067. Available online: https://www.ncbi.nlm.nih.gov/clinvar/ (accessed on June 22; 2026). [CrossRef] [PubMed]
- Zarrei, M.; MacDonald, J.R.; Merico, D.; Scherer, S.W. A copy number variation map of the human genome. Nat. Rev. Genet 2015, 16, 172–83. [Google Scholar] [CrossRef] [PubMed]
- Hap Map Consortium. Integrating common and rare genetic variation in diverse human populations. Nature 2010, 4, 51-58. See the replacement 1000 genomes website at http://www.1000genomes.org/; for updated DNA variant information; accessed June 22; 2026.
- Lek, M.; Karczewski, K.J.; Minikel, E.V. Exome Aggregation Consortium. Analysis of protein-coding genetic variation in 60;706 humans. Nature 2016, 536, 285–291. [Google Scholar] [CrossRef] [PubMed]
- Tonk, V.S.; Wilson, G.N.; Yatsenko, A.S.; et al. Familial duplication dup(1)(p36.3) with minimal dysmorphism. Am. J. Med. Genet 2005, 139A, 136–140. [Google Scholar] [PubMed]
- Tonk, V.; Kyhm, J.H.; Gibson, C.E.; Wilson, G.N. Interstitial deletion 5q14.3q21.3 with MEF2C haploinsufficiency and mild phenotype: when more is less. Am. J. Med. Genet 2011, 155A, 1437–1441. [Google Scholar] [CrossRef] [PubMed]
- DECIPHER; mapping the clinical genome. Accessed June 22; 2026; DECIPHER v11.38: Mapping the clinical genome.
- Database of Genomic Variants (***dgv***). Accessed June 22; 2026; Database of Genomic Variants [*** dgv ***].
- MedCalc Software Ltd.; accessed June 22; 2026; https://www.medcalc.org/calc.
- Brah, H.S.; Sran, N.; Sanghani, S.; et al. Clinical genetic testing in schizophrenia: A systematic review and meta-analysis. Biol. Psychiatry 2026, 99, 541–549. [Google Scholar] [CrossRef] [PubMed]
- Grünblatt, E.; Oneda, B.; Ekici, A.B.; et al. High resolution chromosomal microarray analysis in paediatric obsessive-compulsive disorder. BMC Med. Genom. 2017, 10, 68. [Google Scholar] [CrossRef] [PubMed]
- Asanad, K.; Greenfeld, E.; Scherer, S. W.; et al. Uncovering the association between complete AZFc microduplications and spermatogenic ability: The first reported series. Cureus 2023, 15, e51140. [Google Scholar] [CrossRef] [PubMed]
- Wilson, G.N.; Tonk, V.S. Autism: A different vision. Open J. Psych. 2018, 8, 263–296. [Google Scholar] [CrossRef]
- Jones, W.; Klaiman, C.; Richardson, S.; et al. Eye-tracking-based measurement of social visual engagement compared with expert clinical diagnosis of autism. JAMA 2023, 330, 854–865. [Google Scholar] [CrossRef] [PubMed]
- Wu, Q.; Morrow, E.M.; Gamsiz Uzun, E.D. A deep learning model for prediction of autism status using whole-exome sequencing data. PLoS Comput Biol. 2024, 20, e1012468. [Google Scholar] [CrossRef] [PubMed]
- de Faber, J.T.; Kingma-Wilschut, C. Amblyopia. Curr. Opin. Ophthalmol. 1996, 7, 8–12. [Google Scholar] [CrossRef] [PubMed]
Disclaimer/Publisher’s Note: The statements, opinions and data contained in all publications are solely those of the individual author(s) and contributor(s) and not of MDPI and/or the editor(s). MDPI and/or the editor(s) disclaim responsibility for any injury to people or property resulting from any ideas, methods, instructions or products referred to in the content. |
© 2026 by the authors. Licensee MDPI, Basel, Switzerland. This article is an open access article distributed under the terms and conditions of the Creative Commons Attribution (CC BY) license (http://creativecommons.org/licenses/by/4.0/).
Copyright: This open access article is published under a Creative Commons CC BY 4.0 license, which permit the free download, distribution, and reuse, provided that the author and preprint are cited in any reuse.


