

Submitted:
26 July 2026
Posted:
29 July 2026
You are already at the latest version
Abstract
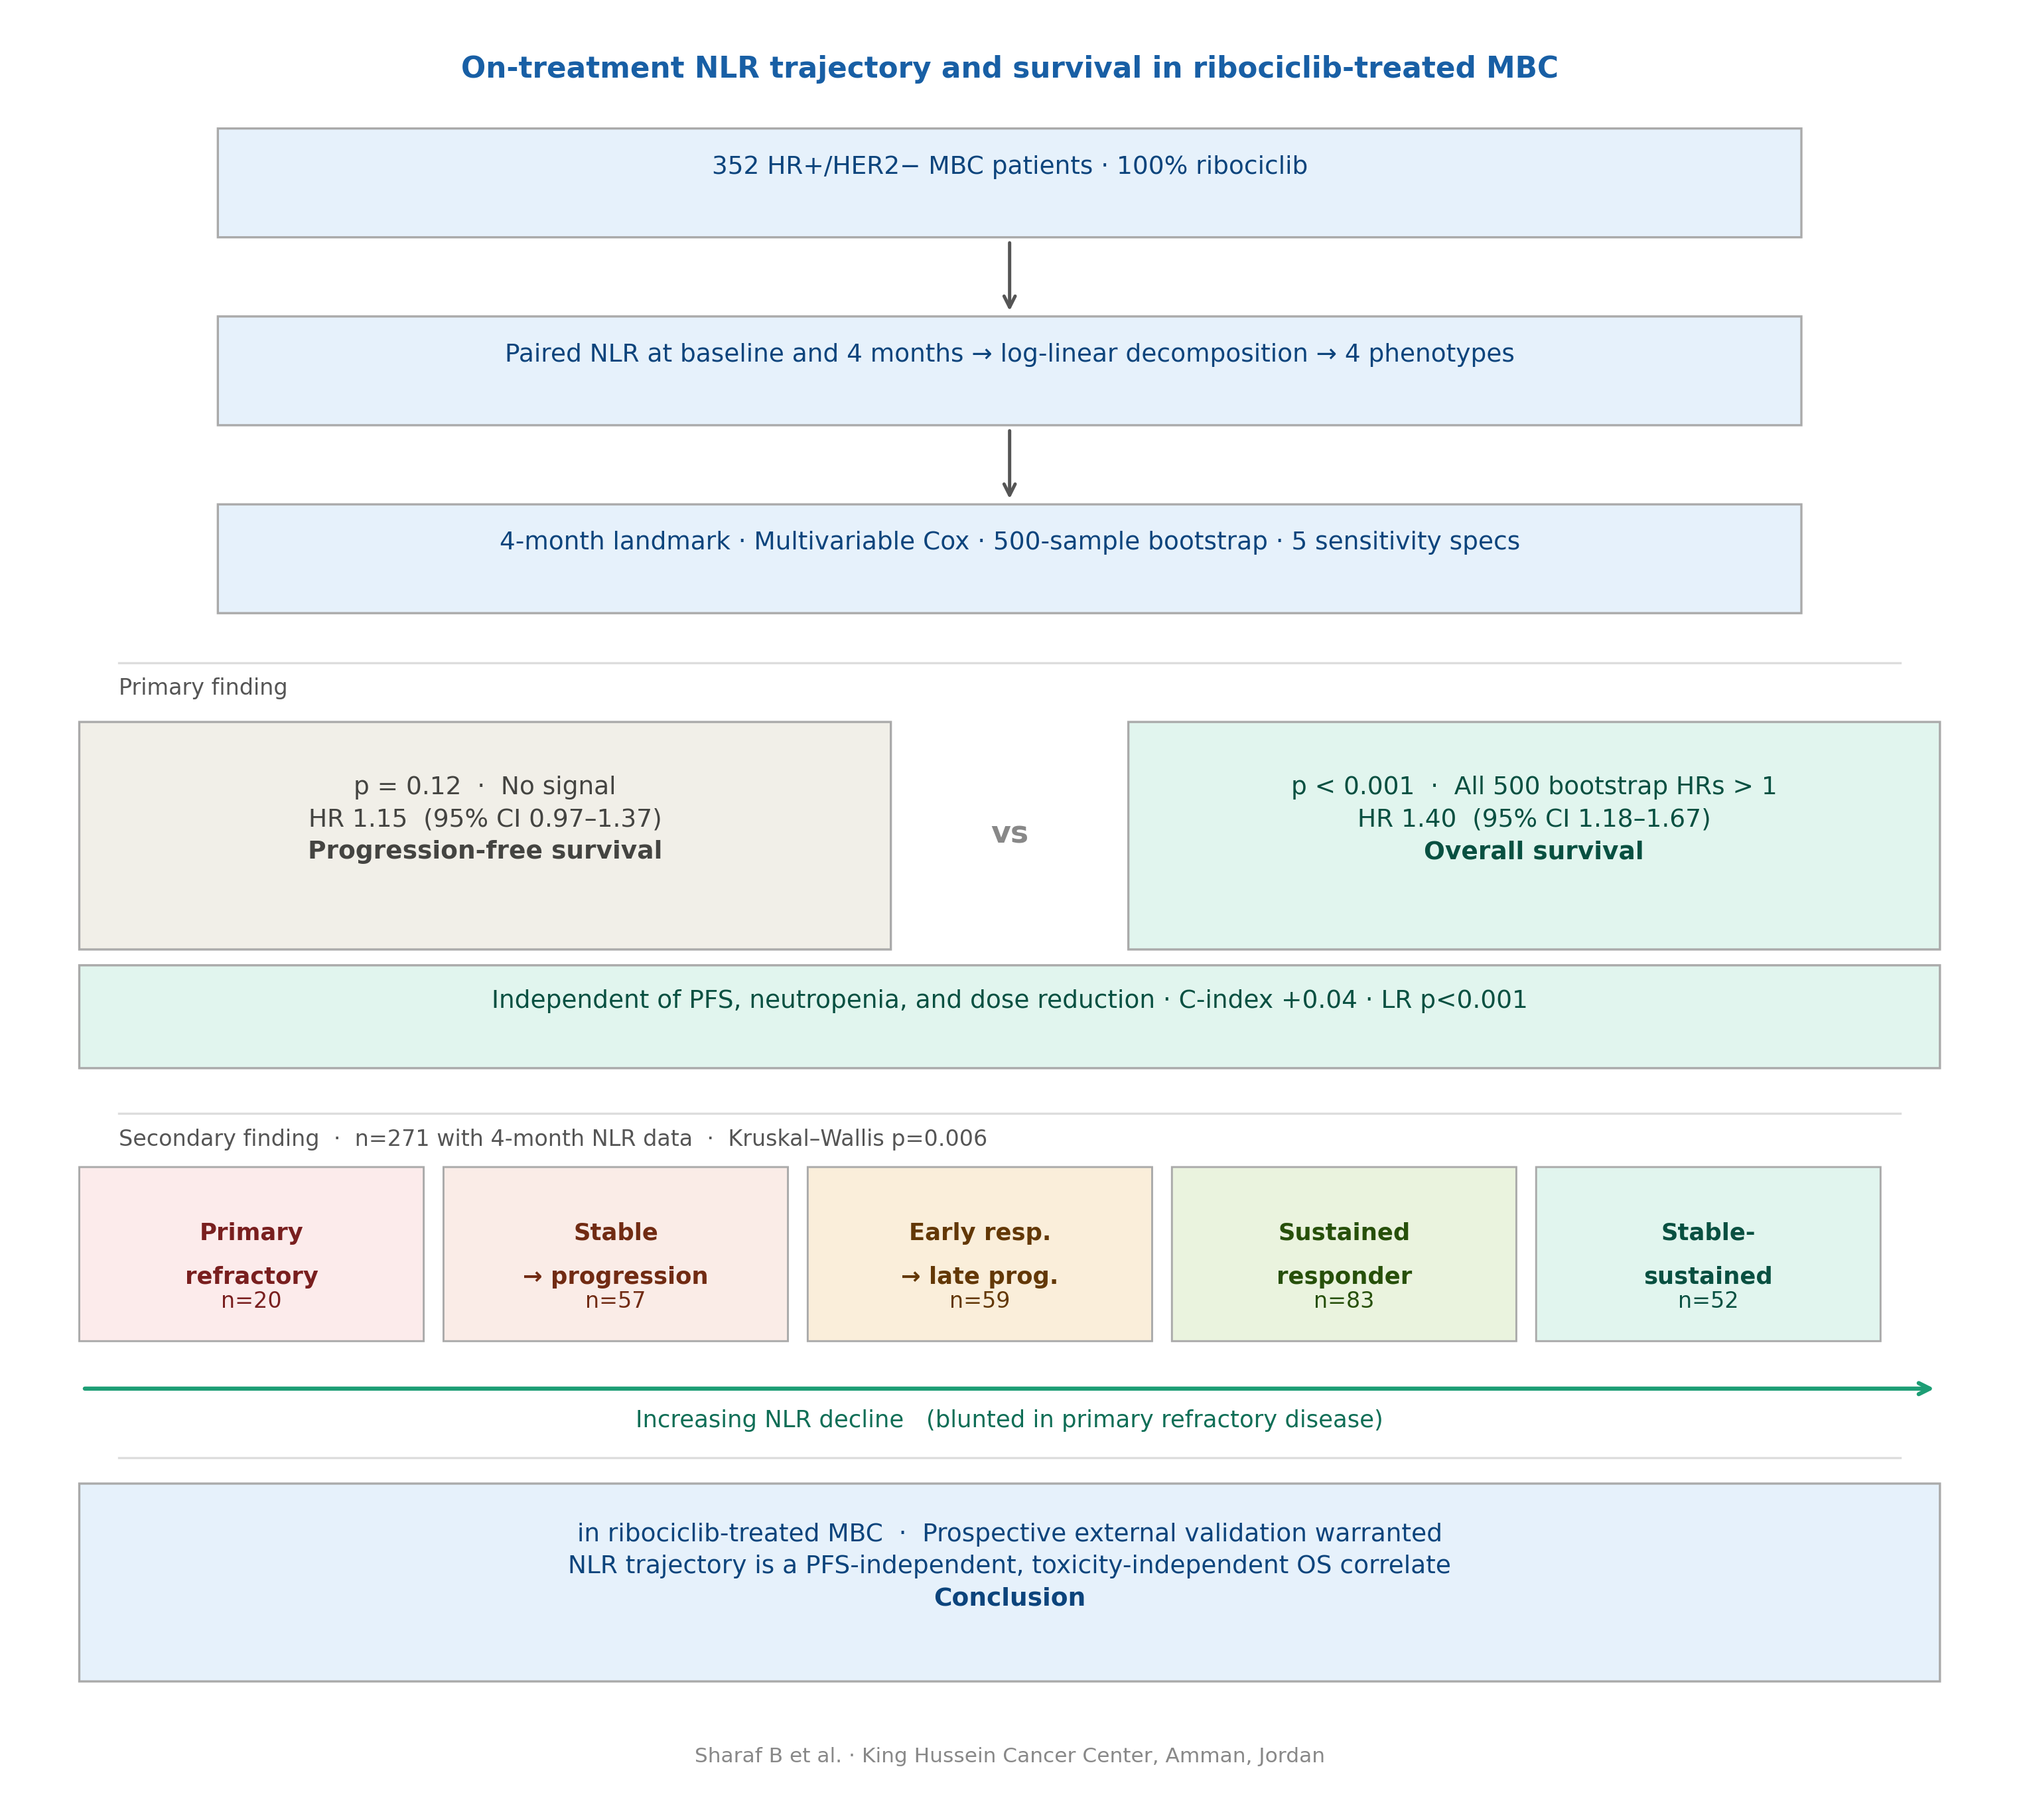
Background/Objectives: In metastatic breast cancer (MBC) treated with CDK4/6 inhibitors, baseline neutrophil-to-lymphocyte ratio (NLR) is an established prognostic marker. On-treatment NLR dynamics have shown inconsistent associations with survival, and no prior study has decomposed change into neutrophil-driven and lymphocyte-driven components.Methods: We retrospectively analyzed 352 patients with HR+/HER2− MBC treated with ribociclib. Using paired neutrophil and lymphocyte counts at baseline and 4 months, a log-linear decomposition classified patients into four NLR-trajectory phenotypes by dominant driver of change. Associations with progression-free survival (PFS) and overall survival (OS) were assessed using a 4-month landmark approach with multivariable Cox models, with robustness evaluated across four thresholds, tertiles, and a continuous model. Secondarily, NLR change was related to discordance between 3-month and best overall response.Results: NLR trajectory was not associated with PFS in any specification (multivariable hazard ratio [HR] 1.15 per standard deviation [SD], 95% CI 0.97–1.37, p=0.12), but was independently associated with OS: each 1-SD increment carried an HR of 1.40 (95% CI 1.18–1.67, p< 0.001), confirmed on bootstrap resampling. Adding NLR trajectory to a baseline clinical model improved discrimination (C-index +0.04) and fit (likelihood-ratio p< 0.001). Proportional hazards was violated for the phenotype term, indicating a time-varying effect within two years post-landmark. NLR trajectory was unrelated to dose-limiting neutropenia or dose reduction (both p>0.24). Primary refractory patients showed blunted NLR decline versus responding or stable patients (p=0.008), independent of baseline NLR.Conclusions: On-treatment NLR trajectory is a PFS-independent, toxicity-independent correlate of OS in ribociclib-treated MBC, distinct from direct tumor control. Prospective external validation is warranted.
Keywords:
: neutrophil-to-lymphocyte ratio
; CDK4/6 inhibitor
; ribociclib
; metastatic breast cancer
; landmark analysis
; tumor microenvironment
; biomarker
1. Introduction
Breast cancer is the most frequently diagnosed cancer and a leading cause of cancer death among women worldwide [1]. Cyclin-dependent kinase 4/6 inhibitors (CDK4/6i) combined with endocrine therapy are standard treatment for hormone receptor-positive (HR+), HER2-negative metastatic breast cancer (MBC) [2,3]. These agents act by blocking phosphorylation of the retinoblastoma (Rb) protein, arresting tumor cells in the G1 phase of the cell cycle [4], though acquired resistance to this mechanism remains common and clinically important [5]. Randomized trials of ribociclib, the CDK4/6 inhibitor used exclusively in this cohort [6,7], have demonstrated a significant overall survival benefit when added to endocrine therapy in both the first-line (MONALEESA-2) [2] and later-line (MONALEESA-3) [3] settings.
NLR serves as a low-cost, peripheral readout of the delicate, opposing forces in the cancer-immunity dynamic. Neutrophilia is largely driven by the tumor itself. By secreting cytokines like G-CSF, GM-CSF, IL-6, and IL-8/CXCL8, tumors actively expand and recruit neutrophils. These cells infiltrate the tissue as tumor-associated neutrophils (TANs) and, once inside the established breast tumor microenvironment (TME), predominantly polarize toward a pro-tumor phenotype. Rather than fighting the cancer, these TANs promote angiogenesis, suppress cytotoxic CD8+ T-lymphocyte function, and recruit myeloid-derived suppressor cells (MDSCs) to help the tumor evade the immune system. Lymphopenia represents the loss of the body’s active immune defense against the tumor. When combined with the systemic stress caused by the cancer, this drop in lymphocytes explains why a high NLR is not entirely tumor-specific—it also reflects physical stress.
Ultimately, a high NLR in the blood mirrors a suppressed immune environment inside the tumor itself. Across different cancers, a higher NLR directly correlates with a weakened immune state, associating with fewer cancer-fighting CD8+ T-cells and more immunosuppressive cells in pancreatic cancer [8], as well as a depleted profile of tumor-infiltrating lymphocytes (TILs) in lung cancer [9].
These TILs are incredibly critical. In breast cancer, their presence is a strong, independent predictor of better survival, a relationship clearly proven even in aggressive triple-negative disease [10].
Because of these dynamics, baseline NLR has been studied more extensively in breast cancer than in almost any other solid tumor.
Early data quickly established its clinical value. An initial meta-analysis of 12 studies linked a high baseline NLR to significantly shorter disease-free survival (DFS; HR 1.46, 95% CI 1.12–1.90) and overall survival (OS; HR 2.03, 95% CI 1.41–2.93) [11]. A subsequent meta-analysis of 15 studies involving 8,563 patients confirmed these findings, showing comparable pooled risks (OS HR 2.56, 95% CI 1.96–3.35; DFS HR 1.74, 95% CI 1.47–2.07). However, this larger analysis also highlighted a key challenge: substantial variation in NLR cutoff values (ranging from 1.9 to 5.0), driven partly by differences in tumor stage, receptor status, and grade [12]. Since then, even larger meta-analyses have expanded on these findings, collectively evaluating more than 17,000 patients [13,14].
We are also beginning to see how molecular subtypes influence this relationship. While one analysis identified NLR as an independent adverse marker specifically in luminal A disease [15], these subtype-specific effects are not yet consistently reproduced across different patient cohorts and cutoffs. Meanwhile, the clinical utility of NLR continues to expand into targeted therapies. Baseline NLR is now recognized as an independent prognostic marker for progression-free survival (PFS) and OS across multiple CDK4/6 inhibitor cohorts [16,17], and a large real-world series recently linked it directly to a patient’s risk of developing severe neutropenia [16].
While baseline measurements are well established, far fewer studies have explored how NLR changes during treatment, and the existing data point in conflicting directions. In patients treated with CDK4/6 inhibitors for metastatic breast cancer, one cohort showed a highly unexpected result where a decrease in related inflammatory ratios during the first cycle of therapy was paradoxically linked to shorter survival [18]. This finding directly challenges the straightforward clinical assumption that greater drug-induced myelosuppression represents higher drug exposure and ultimately better tumor control. Conversely, in the distinct clinical setting of triple-negative breast cancer where CDK4/6 inhibitors are not used, dynamic NLR shifts behave in a much more predictable manner. An initial cohort of 329 patients demonstrated that changes in NLR during therapy are strongly and independently prognostic of outcomes [19]. Furthermore, a larger analysis tracking 600 triple-negative breast cancer patients across four time points found that when NLR rose rather than fell, the risk of recurrence or death climbed significantly, showing an increased risk of 12% to 20% per assessment interval [20]. Mirroring this trend, patients with lower pretreatment NLRs also achieved significantly higher pathologic complete response rates following neoadjuvant chemotherapy [21]. In MBC specifically, evidence is more conflicting still: a 2024 meta-analysis of 29 NLR studies and 12 absolute-lymphocyte-count (ALC) studies found greater heterogeneity than in early-stage cohorts [22], and a single-center Spanish cohort of 263 MBC patients found NLR prognostic on univariate analysis but not independently significant after multivariable adjustment [23]. This directional and contextual inconsistency across studies has not been resolved, no study has separated the neutrophil (numerator) from the lymphocyte (denominator) contribution to NLR change to test whether doing so clarifies the picture, and no study has related on-treatment NLR change to two independent time-points of response assessment within the same cohort.
We addressed these gaps in a real-world MBC cohort with paired baseline/4-month blood counts, dose-limiting-neutropenia and dose-reduction flags, and 3-month plus best/last response data, using landmark methodology and pre-specified sensitivity analyses to test the robustness of any signal identified.
2. Materials and Methods
- Study Population
This retrospective, single-center cohort comprised 352 consecutive patients with HR+/HER2− MBC who received ribociclib in combination with endocrine therapy (aromatase inhibitor, 89.8%; fulvestrant, 10.2%). This registry has previously been reported in studies examining treatment outcomes [6] and the prognostic impact of HER2-low expression [7] in this patient population. Absolute neutrophil and lymphocyte counts were extracted at baseline and at 4 months on treatment. No neutrophil or lymphocyte count of zero was encountered, so the log-linear decomposition was defined for all patients with available paired counts. Dose reduction was recorded as a binary indicator. OS event was defined as death during follow-up; PFS event was defined as the earlier of documented disease progression (best/last response coded ‘DP’) or death.
- b. NLR Trajectory Phenotype Derivation
Among the 352 patients, 283 (80.4%) had paired absolute neutrophil (N) and lymphocyte (L) counts available at baseline and 4 months. For these patients, proportional changes in neutrophil and lymphocyte counts were calculated using natural-log transformations. The corresponding change in the neutrophil-to-lymphocyte ratio (NLR) was derived as the difference between the log changes in neutrophils and lymphocytes (Δlog[NLR] = Δlog[N] − Δlog[L]), allowing changes in the NLR to be attributed to the relative contributions of each cell type.
Patients were classified into four mutually exclusive trajectory phenotypes: NLR increase (≥10% increase from baseline), stable NLR (<10% increase or decrease), neutrophil-driven decrease (≥10% decrease primarily due to a reduction in neutrophils), or lymphocyte-driven decrease (≥10% decrease primarily due to an increase in lymphocytes). A neutrophil-driven decrease was defined by a decline in neutrophil count that contributed more to the NLR reduction than any change in lymphocyte count. All other decreases were classified as lymphocyte-driven.
The ±10% threshold for defining NLR stability was specified a priori to reduce misclassification caused by normal analytical variability around zero change. Its robustness was confirmed in prespecified sensitivity analyses.
- c. Landmark Analysis
Because NLR trajectory was defined using the 4-month on-treatment blood counts, including it as a baseline covariate in a conventional Cox model would introduce immortal time bias, as patients had to survive to 4 months for their trajectory phenotype to be determined [24,25]. To address this, we performed a 4-month landmark analysis as described by Anderson et al. [26], with survival time redefined from the landmark date. Patients were required to be alive and progression-free at 4 months for the progression-free survival (PFS) analysis, whereas only survival to 4 months was required for the overall survival (OS) analysis. Separate eligibility criteria were used because patients who progressed before 4 months remained eligible for the OS analysis if they were still alive. This resulted in a PFS landmark cohort of 264 patients (146 subsequent progression events) and an OS landmark cohort of 280 patients (122 subsequent deaths).
- d. Statistical Analysis
Continuous variables are presented as median (interquartile range [IQR]) and categorical variables as number (percentage). Progression-free survival (PFS) and overall survival (OS), measured from the respective 4-month landmark, were estimated using the Kaplan–Meier method and compared across NLR trajectory phenotypes using the log-rank test.
Separate multivariable Cox proportional hazards models were fitted for the PFS and OS landmark cohorts. The primary exposure was NLR trajectory phenotype (reference: stable NLR), adjusted for baseline NLR (≤2.5 vs. >2.5), ECOG performance status (0–1 vs. ≥2), visceral disease, line of CDK4/6 inhibitor therapy (first, second, or later), and menopausal status. Complete-case analysis was used for missing covariates.
Because the stable-NLR group was small (n=16–20), two pre-specified sensitivity analyses were performed by changing the reference category to the NLR-increase group and, separately, to a combined stable/increase group. To evaluate the robustness of the predefined ±10% stability threshold, trajectory phenotypes were reclassified using ±5%, ±15%, and ±20% thresholds and, independently, by tertiles of the continuous Δlog[NLR] distribution. As an additional sensitivity analysis, Δlog[NLR] was modelled as a standardized continuous variable rather than as a categorical phenotype.
The proportional hazards assumption was assessed using Schoenfeld residuals. When violations were identified, models were re-fitted separately during the early and late follow-up periods, divided at the cohort median. Internal validation of the continuous Δlog[NLR] OS model was performed using 500 bootstrap resamples, reporting the bootstrap mean, median, 95% percentile interval of the hazard ratio, and the proportion of resamples with an effect estimate in the same direction as the original model.
Incremental prognostic value was assessed by changes in Harrell’s concordance index (C-index), Akaike information criterion (AIC), and the likelihood ratio test.
Associations between NLR trajectory phenotype and clinically documented dose-limiting neutropenia or treatment dose reduction were evaluated using the χZ test or Fisher’s exact test, as appropriate. In secondary analyses, Δlog[NLR] was compared across five response-trajectory groups using the Kruskal–Wallis test, followed by Bonferroni-adjusted Mann–Whitney U tests for pairwise comparisons. Effect modification of baseline NLR by visceral disease was evaluated by including a multiplicative interaction term in a Cox model fitted to the full non-landmarked cohort.
All statistical tests were two-sided, with p<0.05 considered statistically significant for the primary analyses. Analyses were performed using Python 3.12 (pandas, lifelines, and scipy).
3. Results
- Cohort
Median age was 52.1 years (IQR 44.0–61.9); 182/351 (51.9%) had visceral disease (one patient had missing visceral status); 223 (63.4%) received ribociclib as first-line therapy (Table 1). Median baseline NLR was 2.15 (IQR 1.57–3.19). Median follow-up was 41 months (IQR 27–62); 211 PFS events and 160 deaths occurred; median PFS was 26 months and median OS 40 months.
- b. NLR trajectory and PFS
Among the 283 evaluable patients, 202 (71.4%) had a neutrophil-driven decrease in NLR, 43 (15.2%) an NLR increase, 19 (6.7%) stable NLR, and 19 (6.7%) a lymphocyte-driven decrease. In the PFS landmark cohort (n=264; 146 events), NLR trajectory phenotype was not associated with progression-free survival in either unadjusted (log-rank p=0.36) or adjusted analyses (continuous Δlog[NLR]: HR per SD 1.15, 95% CI 0.97–1.37; p=0.12; Table 2). Visceral disease (HR 1.72–1.78; p=0.002) and receipt of CDK4/6 inhibitor therapy beyond the second line (HR approximately 3.6; p<0.001) were the only independent predictors of shorter PFS.
- c. NLR trajectory and OS
In the OS landmark cohort (n=280; 122 deaths), NLR trajectory phenotype was significantly associated with overall survival (log-rank p=0.0022). In the adjusted Cox model (n=275; 120 deaths), both a neutrophil-driven decrease (HR 0.44, 95% CI 0.23–0.84; p=0.01) and a lymphocyte-driven decrease (HR 0.35, 95% CI 0.14–0.88; p=0.03) were associated with a lower hazard of death than stable NLR, whereas the NLR-increase phenotype was not (HR 0.88, 95% CI 0.43–1.80; p=0.72) (Figure 1; Table 2).
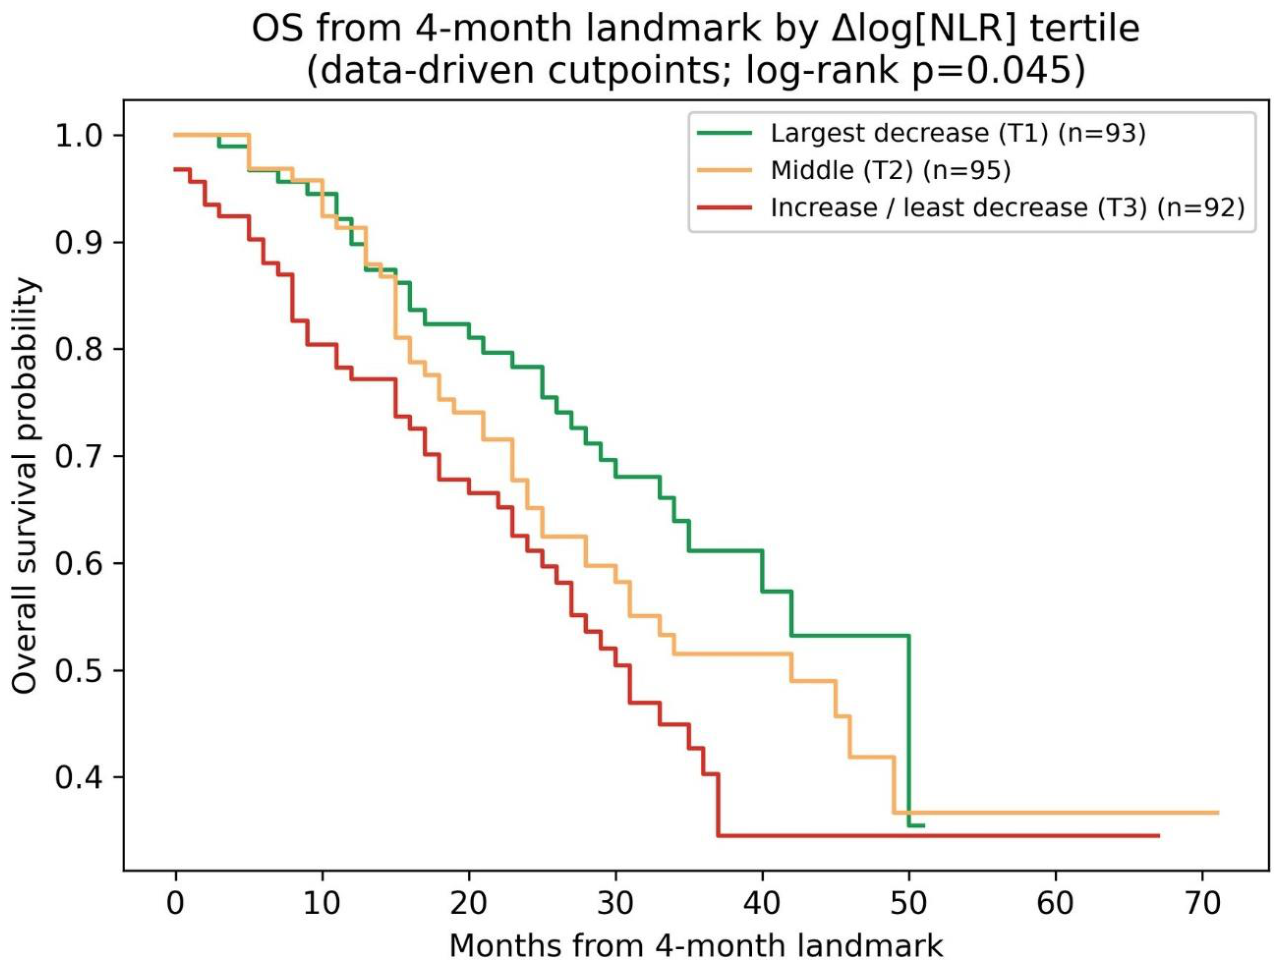
These findings were supported by the continuous Δlog[NLR] analysis (HR per SD 1.40, 95% CI 1.18–1.67; p<0.001). The association with OS remained significant across all predefined stability thresholds (±5%, ±10%, ±15%, and ±20%; log-rank p=0.002–0.014) and in a threshold-free tertile analysis, which demonstrated a monotonic gradient in median OS (50, 42, and 31 months; log-rank p=0.045) (Figure 2). In contrast, no consistent association was observed with PFS, with significance reached only at the widest stability threshold (±20%; p=0.041). NLR trajectory phenotype was not associated with dose-limiting neutropenia or treatment dose reduction (both p=0.54).
- d. Reference-group sensitivity, model diagnostics, and validation
Because the stable-NLR reference group was small (n=16–20), we performed pre-specified sensitivity analyses using alternative reference categories. Re-fitting the OS model with the NLR-increase group as the reference, and subsequently with a combined stable/increase group, produced nearly identical hazard ratios and statistical significance, confirming that the association between NLR trajectory phenotype and OS was robust to reference-group selection (Table 3).
The proportional hazards assumption was satisfied for all covariates in the PFS model but was violated for NLR trajectory phenotype in the OS model. Exploratory time-stratified analyses showed that the survival benefit associated with neutrophil- and lymphocyte-driven decreases was greatest during the first 25 months after the landmark and attenuated thereafter, indicating that the overall hazard ratios represent time-averaged effects.
Internal validation using 500 bootstrap resamples yielded results consistent with the primary model, with a mean hazard ratio of 1.44 (median 1.42; bootstrap 95% percentile interval 1.21–1.73), closely matching the original estimate (HR 1.40, 95% CI 1.18–1.67). In all bootstrap samples, the hazard ratio remained greater than 1. Adding continuous Δlog[NLR] to the baseline clinical model improved both discrimination (Harrell’s C-index, 0.626 to 0.665) and model fit (AIC, 1186.3 to 1175.0; likelihood ratio χZ=13.3, 1 degree of freedom, p<0.001) (Table 3).
3.1. Response-Trajectory Discordance
3.2. Visceral Disease as Effect Modifier
In the full cohort (n=317), the interaction between baseline NLR and visceral disease was not significant (HR 1.07, 95% CI 0.80–1.42, p=0.66).
4. Discussion
This analysis set out to resolve a directional inconsistency in the dynamic-NLR literature by mechanistically decomposing NLR change into neutrophil- and lymphocyte-driven components in a CDK4/6i-treated MBC cohort, and to test the robustness of any signal identified across multiple analytic specifications rather than a single arbitrary cutoff.
4.1. The Primary Finding: An OS-Specific, PFS-Independent Signal
The decomposed categorical NLR-trajectory phenotype did not predict PFS at any specification tested, but was independently and dose-dependently associated with OS across five operationalizations (four thresholds, tertiles, and a continuous exposure). Bootstrap validation and improved discrimination and fit on adding Δlog[NLR] to the baseline clinical model (C-index +0.04; AIC −11; likelihood ratio p<0.001; Table 3) indicate this is not an artifact of an arbitrarily chosen cutoff or reference category. Proportional-hazards testing showed the effect is concentrated in the first two years from the landmark and attenuates thereafter, so the reported hazard ratio should be read as a time-averaged effect rather than a constant one.
This OS-specific, toxicity-independent dissociation is mechanistically informative: if NLR decline reflected primarily on-target ribociclib-induced marrow suppression, we would expect the signal in PFS and a correlation with dose-limiting neutropenia; neither occurred. This pattern instead parallels the phase 3 EMBRACE trial of eribulin (a microtubule inhibitor, not a CDK4/6i), in which NLR behaved as a general prognostic marker of host status across treatment arms rather than a drug-specific predictive biomarker [27]. These findings suggest the host-status interpretation is not confined to any one drug class, consistent with the CDK4/6i-specific glucose-to-lymphocyte ratio findings of Yilmaz and colleagues [17]. The underlying biological mechanism remains uncertain and cannot be resolved from these data.
Our qualitative direction, in which a falling NLR was favorable and a rising NLR unfavorable, is directionally concordant with the TNBC dynamic-NLR literature and general breast-cancer meta-analyses discussed above [11,12,13,19,20,21], but contrasts with the one existing CDK4/6i-specific dynamic-ratio study, which found a paradoxical, opposite-direction association over a shorter (4-week), differently composed (platelet/monocyte-based) window [18], a specific and testable target for external validation. Baseline NLR itself was not independently significant in either fully adjusted model (Table 2), consistent with a single-center Spanish MBC cohort that similarly found NLR’s prognostic value substantially confounded by other factors [23], though this diverges from larger, mostly early-stage meta-analyses [11,12,13].
4.2. The response-Trajectory Finding
The response-trajectory analysis provides a complementary, more PFS-proximal signal: primary refractory patients (progression by 3 months) showed significantly blunted NLR decline independent of baseline NLR. This is consistent with persistence of an immunosuppressive, myeloid-dominant TME despite CDK4/6 inhibition [8], and extends the baseline-NLR-as-resistance-marker literature [19,20,23] by suggesting the early trajectory, not just the starting value, may better separate primary resistance from response. To our knowledge this has not previously been reported in CDK4/6i-treated MBC.
Figure 3.
On-treatment Δlog[NLR] by response-trajectory discordance phenotype. Box plots show the distribution of Δlog[NLR] (baseline to 4 months) across five response-trajectory groups, derived by combining 3-month interim response with best overall response. Data are shown for the 271 patients who had both response-trajectory classification and 4-month NLR data available. Group sizes: primary refractory (n=20), stable disease with subsequent progression (n=57), early response with late progression (n=59), sustained responders (n=83), and sustained stable disease (n=52). The dashed line indicates no change (Δlog[NLR] = 0). Boxes represent the interquartile range; the horizontal line within each box represents the median; whiskers extend to 1.5 times the interquartile range. Kruskal-Wallis p=0.006. Δlog[NLR], log-linear change in the neutrophil-to-lymphocyte ratio.
Figure 3.
On-treatment Δlog[NLR] by response-trajectory discordance phenotype. Box plots show the distribution of Δlog[NLR] (baseline to 4 months) across five response-trajectory groups, derived by combining 3-month interim response with best overall response. Data are shown for the 271 patients who had both response-trajectory classification and 4-month NLR data available. Group sizes: primary refractory (n=20), stable disease with subsequent progression (n=57), early response with late progression (n=59), sustained responders (n=83), and sustained stable disease (n=52). The dashed line indicates no change (Δlog[NLR] = 0). Boxes represent the interquartile range; the horizontal line within each box represents the median; whiskers extend to 1.5 times the interquartile range. Kruskal-Wallis p=0.006. Δlog[NLR], log-linear change in the neutrophil-to-lymphocyte ratio.
5. Limitations
Strengths: this is, to our knowledge, the first study to mechanistically decompose on-treatment NLR change into neutrophil- and lymphocyte-driven components in CDK4/6i-treated MBC, and the first to relate on-treatment NLR trajectory to an independent, two-timepoint response-discordance phenotype in this treatment setting. The finding was stress-tested across five independent threshold and exposure specifications, two alternative reference-group choices, 500-sample bootstrap resampling, and incremental discrimination/fit metrics rather than relying on a single model specification. Event numbers were adequate for the multivariable models presented (142 PFS and 120 OS events in the respective landmark cohorts).
Limitations: This study is retrospective and single-center, with unblinded, non centrally reviewed response assessments. Because all patients received ribociclib, the findings may not be generalizable to other CDK4/6 inhibitors, such as palbociclib or abemaciclib, which have different hematologic toxicity profiles. The attribution of NLR changes to neutrophil or lymphocyte dynamics was based on paired measurements at baseline and 4 months rather than serial assessments, limiting evaluation of temporal changes. Although the 4-month landmark approach was necessary to avoid immortal time bias, it excluded patients who progressed or died before the landmark and therefore conditioned all survival analyses on surviving to that time point. Two trajectory groups remained relatively small, reducing the precision of subgroup specific estimates despite consistent findings in sensitivity analyses. The proportional hazards assumption was not met for the trajectory phenotype in the OS model, indicating that its prognostic effect varied over time and that the reported hazard ratios represent average effects across follow up. Missing covariate data were handled using complete-case analysis, and potential confounders affecting circulating neutrophil and lymphocyte counts, including infection, corticosteroid use, and granulocyte colony-stimulating factor administration, were not available. Additionally, residual confounding from unmeasured clinical or biological factors cannot be excluded. Finally, although the association between NLR trajectory and OS remained consistent across multiple prespecified sensitivity analyses, these findings do not establish causality and require external validation before clinical application.
6. Conclusions
On-treatment NLR trajectory was consistently associated with overall survival, but not progression-free survival, in patients with ribociclib treated metastatic breast cancer across multiple prespecified analytic approaches. In addition, failure of NLR to decline early during treatment was associated with primary refractory disease. These findings are consistent with previous studies of dynamic NLR in breast cancer and with evidence that peripheral NLR reflects the tumor immune environment. However, they are based on a single retrospective cohort and should be considered hypothesis-generating. Prospective external validation, ideally incorporating serial blood sampling, is needed before these observations can be translated into clinical practice. Accordingly, no treatment recommendations can be made on the basis of the present findings.
Author Contributions
Conceptualization, B.S. and N.O.; Methodology, B.S.; Formal Analysis, B.S.; Investigation, B.S., Z.A., Q.A., A.Z., F.T., A.K., M.H. and S.J.; Resources, N.O.; Data Curation, B.S., Z.A., Q.A., A.Z., F.T., A.K., M.H. and S.J.; Writing—Original Draft Preparation, B.S.; Writing—Review and Editing, Z.A., Q.A., A.Z., F.T., A.K., M.H., S.J. and N.O.; Supervision, N.O. All authors have read and agreed to the published version of the manuscript.
Funding
This research received no specific grant from any funding agency in the public, commercial, or not-for-profit sectors.
Institutional Review Board Statement
The study was conducted in accordance with the Declaration of Helsinki, and approved by the Institutional Review Board of King Hussein Cancer Center, Amman, Jordan. IRB approval number and date: [Insert IRB number and date of approval].
Informed Consent Statement
Informed consent was waived by the Institutional Review Board of King Hussein Cancer Center due to the retrospective nature of the study and the de-identification of all patient data. This research was conducted in accordance with the ethical standards of the institutional and international research standards and with the 1964 Helsinki Declaration and its later amendments. The study was approved by the King Hussein Cancer Center Institutional Review Board (IRB). Because of the retrospective nature of the study and the lack of personal details of participants that would compromise anonymity, informed consent was waived.
Data Availability Statement
The datasets generated during and/or analyzed during the current study are available from the corresponding author on reasonable request.
Conflicts of Interest
The authors declare no conflicts of interest.
References
- Bray, F.; Laversanne, M.; Sung, H.; Ferlay, J.; Siegel, R.L.; Soerjomataram, I.; Jemal, A. Global cancer statistics 2022: GLOBOCAN estimates of incidence and mortality worldwide for 36 cancers in 185 countries. CA A Cancer J. Clin. 2024, 74, 229–263. [Google Scholar] [CrossRef] [PubMed]
- Hortobagyi, G.N.; Stemmer, S.M.; Burris, H.A.; Yap, Y.-S.; Sonke, G.S.; Hart, L.; Campone, M.; Petrakova, K.; Winer, E.P.; Janni, W.; et al. Overall Survival with Ribociclib plus Letrozole in Advanced Breast Cancer. New Engl. J. Med. 2022, 386, 942–950. [Google Scholar] [CrossRef] [PubMed]
- Neven, P.; Fasching, P.A.; Chia, S.; Jerusalem, G.; De Laurentiis, M.; Im, S.-A.; Petrakova, K.; Bianchi, G.V.; Martín, M.; Nusch, A.; et al. Updated overall survival from the MONALEESA-3 trial in postmenopausal women with HR+/HER2− advanced breast cancer receiving first-line ribociclib plus fulvestrant. Breast Cancer Res. 2023, 25, 1–10. [Google Scholar] [CrossRef] [PubMed]
- Piezzo, M.; Chiodini, P.; Riemma, M.; et al. Targeting cell cycle in breast cancer: CDK4/6 inhibitors. Int. J. Mol. Sci. 2020, 21, 6479. [Google Scholar] [CrossRef] [PubMed]
- Alves, C.L.; Ditzel, H.J. CDK4/6 inhibitor resistance in estrogen receptor-positive breast cancer, a 2023 perspective. Front Cell Dev. Biol. 2023, 11, 1148792. [Google Scholar] [CrossRef] [PubMed]
- Abdel-Razeq, H.; Sharaf, B.; Khater, S.; Baidoun, H.J.; Hani, H.B.; Taqash, A.; El Khatib, O.; Edaily, S.; Abunasser, M.; Tamimi, F.; et al. Clinical Outcomes of Patients Treated with Ribociclib in Combination with Aromatase Inhibitors or Fulvestrant for HR-Positive, HER2-Negative Metastatic Breast Cancer, Real-World Data from a Low-Resourced Country. ImmunoTargets Ther. 2024, ume 13, 501–512. [Google Scholar] [CrossRef] [PubMed]
- Sharaf, B.; Abu-Fares, H.; Tamimi, F.; Al-Sawajneh, S.; Salama, O.; Daoud, R.; Alhajahjeh, A.; Al-Lababidi, S.; Abdel-Razeq, H. Differences in Treatment Outcomes Between Patients with HER2-Low versus HER2-Zero, Hormone Receptor-Positive Advanced-Stage Breast Cancer Treated with Ribociclib. Breast Cancer Targets Ther. 2023, ume 15, 541–548. [Google Scholar] [CrossRef] [PubMed]
- Li, J.; Wang, J.; Li, Y.; Jiang, W.; Zuo, D.; Zhang, X.; Xiao, J.; Inamura, K.; Giovannetti, E.; Ren, L. Peripheral blood neutrophil-to-lymphocyte ratio as a prognostic marker and its association with the tumor-immune microenvironment in pancreatic cancer: a retrospective cohort study. J. Gastrointest. Oncol. 2025, 16, 1248–1257. [Google Scholar] [CrossRef] [PubMed]
- Ohashi, K.; Nishito, Y.; Fukuda, H.; Sadahiro, R.; Yoshida, Y.; Watanabe, S.-I.; Motoi, N.; Sonobe, Y.; Mizuno, H.; Tsunoda, H.; et al. Neutrophil-to-lymphocyte ratio is a prognostic factor reflecting immune condition of tumor microenvironment in squamous cell lung cancer. Sci. Rep. 2024, 14, 1–10. [Google Scholar] [CrossRef] [PubMed]
- Adams, S.; Gray, R.J.; Demaria, S.; Goldstein, L.; Perez, E.A.; Shulman, L.N.; Martino, S.; Wang, M.; Jones, V.E.; Saphner, T.J.; et al. Prognostic Value of Tumor-Infiltrating Lymphocytes in Triple-Negative Breast Cancers From Two Phase III Randomized Adjuvant Breast Cancer Trials: ECOG 2197 and ECOG 1199. J. Clin. Oncol. 2014, 32, 2959–2966. [Google Scholar] [CrossRef] [PubMed]
- Wei, B.; Yao, M.; Xing, C.; Wang, W.; Yao, J.; Hong, Y.; Liu, Y.; Fu, P.; Center, D.A.T.O.B.D. The neutrophil lymphocyte ratio is associated with breast cancer prognosis: an updated systematic review and meta-analysis. OncoTargets Ther. 2016, ume 9, 5567–5575. [Google Scholar] [CrossRef] [PubMed]
- Ethier, J.-L.; Desautels, D.; Templeton, A.; Shah, P.S.; Amir, E. Prognostic role of neutrophil-to-lymphocyte ratio in breast cancer: a systematic review and meta-analysis. Breast Cancer Res. 2017, 19, 1–13. [Google Scholar] [CrossRef] [PubMed]
- Guo, W.; Lu, X.; Liu, Q.; Zhang, T.; Li, P.; Qiao, W.; Deng, M. Prognostic value of neutrophil-to-lymphocyte ratio and platelet-to-lymphocyte ratio for breast cancer patients: An updated meta-analysis of 17079 individuals. Cancer Med. 2019, 8, 4135–4148. [Google Scholar] [CrossRef] [PubMed]
- Koh, C.-H.; Bhoo-Pathy, N.; Ng, K.-L.; Jabir, R.S.; Tan, G.-H.; See, M.-H.; Jamaris, S.; A Taib, N. Utility of pre-treatment neutrophil–lymphocyte ratio and platelet–lymphocyte ratio as prognostic factors in breast cancer. Br. J. Cancer 2015, 113, 150–158. [Google Scholar] [CrossRef] [PubMed]
- Xiang, Y.; Zhang, N.; Lei, H.; Wu, J.; Wang, W.; Zhang, H.; Zeng, X. Neutrophil-to-lymphocyte ratio is a negative prognostic biomarker for luminal A breast cancer. Gland. Surg. 2023, 12, 415–425. [Google Scholar] [CrossRef] [PubMed]
- Badran, O.; Darawshe, A.; Sharif, S.; Yosef, S.; Bar-Sela, G. Baseline neutrophil-lymphocyte ratio (NLR) predicts toxicity and survival in HR+/HER-2 breast cancer patients treated with CDK4/6 inhibitors. Breast 2025, 83, 104568. [Google Scholar] [CrossRef] [PubMed]
- Yilmaz, H.; Nigdelioglu, B.; Aytac, A.; Turan, M.; Oktay, E.; Yersal, O.; Barutca, S. The prognostic importance of glucose-to-lymphocyte ratio and uric acid in metastatic breast cancer patients treated with Cdk 4/6 inhibitors. Futur. Oncol. 2022, 18, 3043–3053. [Google Scholar] [CrossRef] [PubMed]
- Moukas, S.I.; Kasimir-Bauer, S.; Tewes, M.; Kolberg, H.-C.; Hoffmann, O.; Kimmig, R.; Keup, C. Ratios of monocytes and neutrophils to lymphocytes in the blood predict benefit of CDK4/6 inhibitor treatment in metastatic breast cancer. Sci. Rep. 2023, 13, 1–17. [Google Scholar] [CrossRef] [PubMed]
- Moldoveanu, D.; Pravongviengkham, V.; Best, G.; Martínez, C.; Hijal, T.; Meguerditchian, A.N.; Lajoie, M.; Dumitra, S.; Watson, I.; Meterissian, S. Dynamic Neutrophil-to-Lymphocyte Ratio: A Novel Prognosis Measure for Triple-Negative Breast Cancer. Ann. Surg. Oncol. 2020, 27, 4028–4034. [Google Scholar] [CrossRef] [PubMed]
- Kim, J.-H.; Son, N.-H.; Lee, J.-S.; Mun, J.-E.; Kim, J.-Y.; Park, H.-S.; Park, S.; Kim, S.-I.; Park, B.-W. Time-Sequencing of the Neutrophil-to-Lymphocyte Ratio to Predict Prognosis of Triple-Negative Breast Cancer. Cancers 2021, 13, 3472. [Google Scholar] [CrossRef] [PubMed]
- Chae, S.; Kang, K.M.; Kim, H.J.; Kang, E.; Park, S.Y.; Kim, J.H.; Kim, S.H.; Kim, S.W.; Kim, E.K. Neutrophil–Lymphocyte Ratio Predicts Response to Chemotherapy in Triple-Negative Breast Cancer. Curr. Oncol. 2018, 25, 113–119. [Google Scholar] [CrossRef] [PubMed]
- Sang, B.; Fan, Y.; Wang, X.; Dong, L.; Gong, Y.; Zou, W.; Zhao, G.; He, J. The prognostic value of absolute lymphocyte count and neutrophil-to-lymphocyte ratio for patients with metastatic breast cancer: a systematic review and meta-analysis. Front. Oncol. 2024, 14, 1360975. [Google Scholar] [CrossRef] [PubMed]
- de la Peña, F.A.; et al. Neutrophil-lymphocyte ratio in metastatic breast cancer is not an independent predictor of survival, but depends on other variables. Sci. Rep. 2019, 9, 16979. [Google Scholar] [CrossRef] [PubMed]
- Gleiss, A.; Oberbauer, R.; Heinze, G. An unjustified benefit: immortal time bias in the analysis of time-dependent events. Transpl. Int. 2017, 31, 125–130. [Google Scholar] [CrossRef] [PubMed]
- Agarwal, P.; Moshier, E.; Ru, M.; Ohri, N.; Ennis, R.; Rosenzweig, K.; et al. Immortal time bias in observational studies of time-to-event outcomes: assessing effects of postmastectomy radiation therapy using the National Cancer Database. Am. J. Clin. Oncol. 2020, 43, 610–7. [Google Scholar]
- Anderson, J.R.; Cain, K.C.; Gelber, R.D. Analysis of survival by tumor response. J. Clin. Oncol. 1983, 1, 710–9. [Google Scholar] [CrossRef] [PubMed]
- Miyoshi, Y.; Yoshimura, Y.; Saito, K.; Muramoto, K.; Sugawara, M.; Alexis, K.; Nomoto, K.; Nakamura, S.; Saeki, T.; Watanabe, J.; et al. High absolute lymphocyte counts are associated with longer overall survival in patients with metastatic breast cancer treated with eribulin—but not with treatment of physician’s choice—in the EMBRACE study. Breast Cancer 2020, 27, 706–715. [Google Scholar] [CrossRef] [PubMed]
Figure 1.
Kaplan-Meier survival curves from the 4-month landmark, stratified by NLR-trajectory phenotype. (A) Progression-free survival (PFS) in the PFS landmark cohort (n=264; 146 events). (B) Overall survival (OS) in the OS landmark cohort (n=280; 122 deaths). Trajectory phenotypes were derived by log-linear decomposition of paired neutrophil and lymphocyte counts at baseline and at 4 months: neutrophil-driven decrease (n=194 PFS / 201 OS), lymphocyte-driven decrease (n=19 / 19), NLR increase (n=36 / 41), and stable NLR (n=15 / 19). Log-rank p-values are shown in panel titles. Survival time is measured from the 4-month landmark date. NLR, neutrophil-to-lymphocyte ratio.
Figure 1.
Kaplan-Meier survival curves from the 4-month landmark, stratified by NLR-trajectory phenotype. (A) Progression-free survival (PFS) in the PFS landmark cohort (n=264; 146 events). (B) Overall survival (OS) in the OS landmark cohort (n=280; 122 deaths). Trajectory phenotypes were derived by log-linear decomposition of paired neutrophil and lymphocyte counts at baseline and at 4 months: neutrophil-driven decrease (n=194 PFS / 201 OS), lymphocyte-driven decrease (n=19 / 19), NLR increase (n=36 / 41), and stable NLR (n=15 / 19). Log-rank p-values are shown in panel titles. Survival time is measured from the 4-month landmark date. NLR, neutrophil-to-lymphocyte ratio.
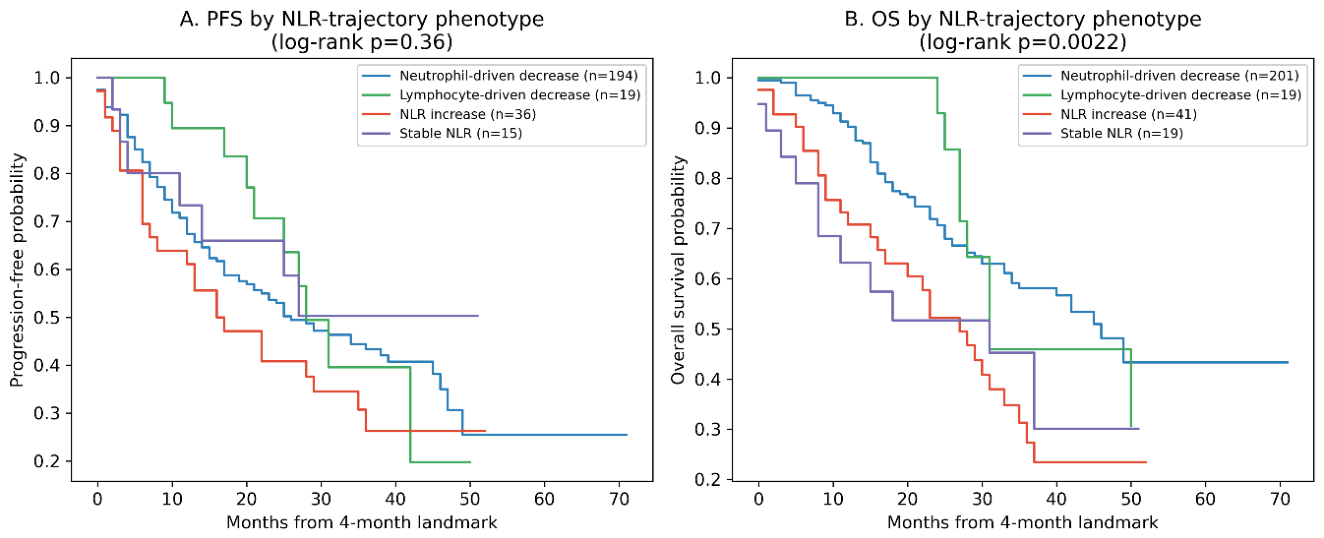
Figure 2.
OS from the 4-month landmark by data-driven Δlog[NLR] tertile. Patients with available 4-month NLR data were divided into tertiles of Δlog[NLR] (change from baseline to 4 months) without use of a pre-specified threshold. Tertile 1 (T1; largest decrease, n=93), Tertile 2 (T2; middle, n=95), and Tertile 3 (T3; increase or least decrease, n=92). Log-rank p=0.045. Survival time is measured from the 4-month landmark date. Δlog[NLR], log-linear change in the neutrophil-to-lymphocyte ratio; OS, overall survival.
Figure 2.
OS from the 4-month landmark by data-driven Δlog[NLR] tertile. Patients with available 4-month NLR data were divided into tertiles of Δlog[NLR] (change from baseline to 4 months) without use of a pre-specified threshold. Tertile 1 (T1; largest decrease, n=93), Tertile 2 (T2; middle, n=95), and Tertile 3 (T3; increase or least decrease, n=92). Log-rank p=0.045. Survival time is measured from the 4-month landmark date. Δlog[NLR], log-linear change in the neutrophil-to-lymphocyte ratio; OS, overall survival.
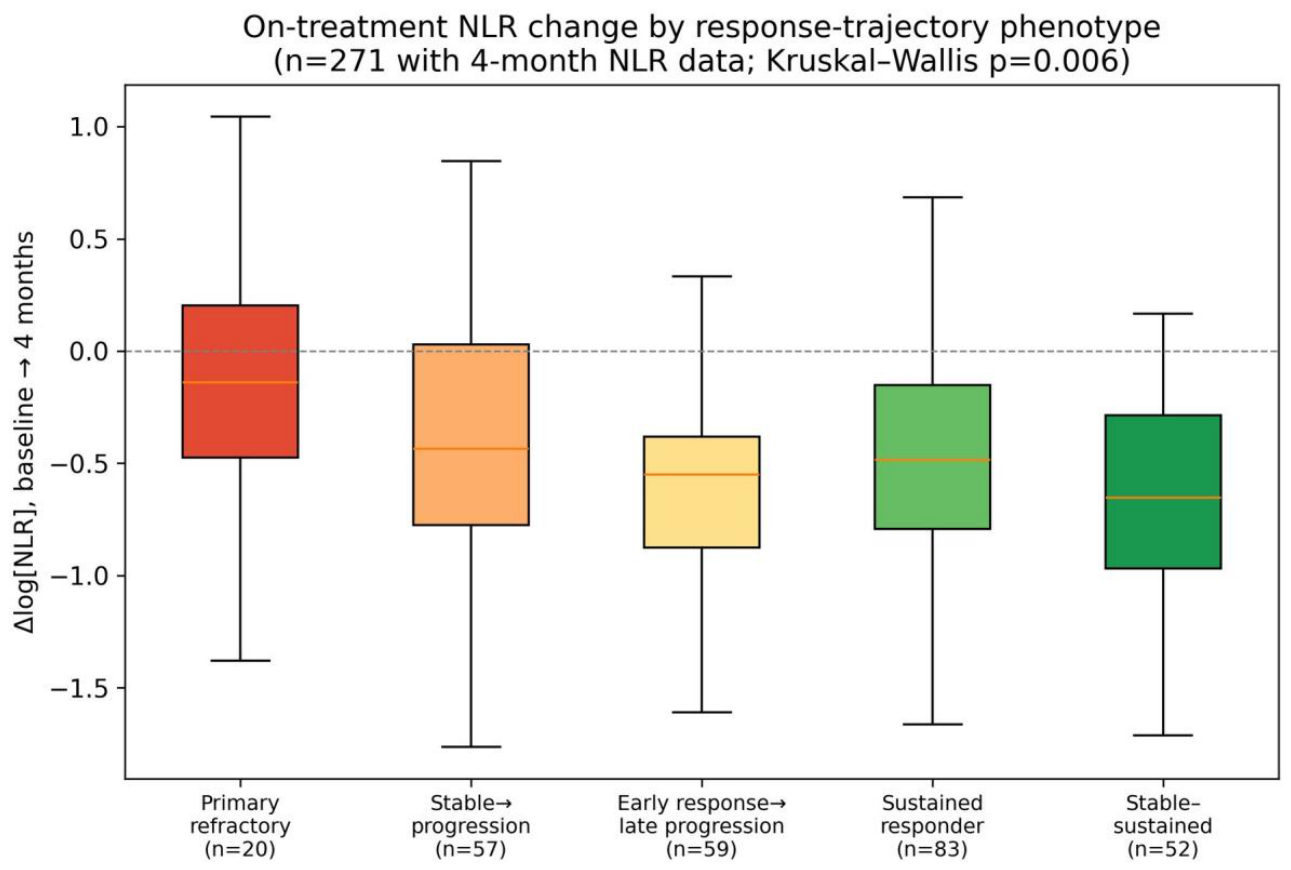

Table 1.
Cohort characteristics (n=352 unless otherwise noted). Denominators below 352 reflect missing baseline data: visceral status (n=1 missing) and ECOG performance status (n=8 missing).
Table 1.
Cohort characteristics (n=352 unless otherwise noted). Denominators below 352 reflect missing baseline data: visceral status (n=1 missing) and ECOG performance status (n=8 missing).
| Characteristic | Value |
|---|---|
| Age, years, median (IQR) | 52.1 (44.0–61.9) |
| Postmenopausal | 188 (53.4%) |
| ECOG ≥2 | 15/344 (4.4%) |
| Visceral disease | 182/351 (51.9%) |
| First-line ribociclib | 223 (63.4%) |
| Baseline NLR, median (IQR) | 2.15 (1.57–3.19) |
| Dose-limiting neutropenia | 75 (21.2%) |
| Dose reduction | 100 (28.3%) |
| Median follow-up, months (IQR) | 41 (27–62) |
| PFS events / median PFS | 211 (59.8%) / 26 mo |
| Deaths / median OS | 160 (45.3%) / 40 mo |
Table 2.
Full multivariable Cox models, 4-month landmark, complete-case (PFS n=259/142 events, concordance 0.62; OS n=275/120 events, concordance 0.67). Complete-case reduction from the respective landmark cohorts (n=264 PFS, n=280 OS) is due to missing ECOG performance status (n=5 in each); all other covariates were complete. For the OS model, the trajectory-phenotype hazard ratios are time-averaged: the proportional-hazards assumption was violated for this variable (Schoenfeld p=0.02 for neutrophil-driven and p=0.001 for lymphocyte-driven decrease), and the effect is concentrated in the first ~2 years from the landmark; see time-split analysis in Table 3.
Table 2.
Full multivariable Cox models, 4-month landmark, complete-case (PFS n=259/142 events, concordance 0.62; OS n=275/120 events, concordance 0.67). Complete-case reduction from the respective landmark cohorts (n=264 PFS, n=280 OS) is due to missing ECOG performance status (n=5 in each); all other covariates were complete. For the OS model, the trajectory-phenotype hazard ratios are time-averaged: the proportional-hazards assumption was violated for this variable (Schoenfeld p=0.02 for neutrophil-driven and p=0.001 for lymphocyte-driven decrease), and the effect is concentrated in the first ~2 years from the landmark; see time-split analysis in Table 3.
| Covariate | PFS HR (95% CI), p | OS HR (95% CI), p |
|---|---|---|
| Baseline NLR ≥2.5 | 1.16 (0.81–1.65), 0.42 | 1.40 (0.96–2.06), 0.08 |
| Neutrophil-driven decrease (vs stable) | 1.19 (0.54–2.61), 0.66 | 0.44 (0.23–0.84), 0.01 |
| Lymphocyte-driven decrease (vs stable) | 0.80 (0.29–2.20), 0.67 | 0.35 (0.14–0.88), 0.03 |
| NLR increase (vs stable) | 1.58 (0.67–3.70), 0.29 | 0.88 (0.43–1.80), 0.72 |
| ECOG ≥2 (vs 0–1) | 1.35 (0.62–2.98), 0.45 | 1.93 (0.92–4.05), 0.08 |
| Visceral disease | 1.72 (1.22–2.41), 0.002 | 1.68 (1.15–2.45), 0.007 |
| Line beyond 2nd (vs 1st) | 3.59 (2.23–5.81), <0.001 | 3.70 (2.23–6.14), <0.001 |
| Line 2nd (vs 1st) | 1.23 (0.82–1.85), 0.31 | 1.27 (0.81–1.98), 0.30 |
| Premenopausal (vs postmenopausal) | 0.83 (0.59–1.18), 0.30 | 0.84 (0.58–1.22), 0.36 |
Table 3.
Reference-group sensitivity, proportional hazards diagnostics, and internal validation for the OS model.
Table 3.
Reference-group sensitivity, proportional hazards diagnostics, and internal validation for the OS model.
| Analysis | Result |
|---|---|
| Reference = increase phenotype (n=41) | Neutrophil-driven decrease HR 0.50 (0.31–0.79), p=0.003; lymphocyte-driven decrease HR 0.40 (0.18–0.89), p=0.03 |
| Reference = stable+increase combined (n=61) | Neutrophil-driven decrease HR 0.48 (0.32–0.73), p<0.001; lymphocyte-driven decrease HR 0.38 (0.17–0.84), p=0.02 |
| Schoenfeld residuals, OS model | Violated for phenotype (neutrophil-driven p=0.02; lymphocyte-driven p=0.001); held for all other covariates |
| Early vs. late follow-up split (median 25 mo) | Effect concentrated in first 25 months; attenuated to non-significance thereafter |
| 500-sample bootstrap, continuous ΔNLR OS model | Mean HR 1.44, 95% percentile CI 1.21–1.73; 100% same-direction |
| Discrimination/fit, adding ΔNLR to baseline model | C-index 0.626→0.665; AIC 1186.3→1175.0; LR p<0.001 |
Disclaimer/Publisher’s Note: The statements, opinions and data contained in all publications are solely those of the individual author(s) and contributor(s) and not of MDPI and/or the editor(s). MDPI and/or the editor(s) disclaim responsibility for any injury to people or property resulting from any ideas, methods, instructions or products referred to in the content. |
© 2026 by the authors. Licensee MDPI, Basel, Switzerland. This article is an open access article distributed under the terms and conditions of the Creative Commons Attribution (CC BY) license (http://creativecommons.org/licenses/by/4.0/).
Copyright: This open access article is published under a Creative Commons CC BY 4.0 license, which permit the free download, distribution, and reuse, provided that the author and preprint are cited in any reuse.