

Submitted:
27 July 2026
Posted:
28 July 2026
You are already at the latest version
Abstract
This study evaluated the performance of the Mindray BC-60 R differential WBC count (AD) in comparison with manual method (MD) in rabbits. Diagnostic blood samples were analyzed within 1 h of collection, and MD was performed by counting 100 leukocytes. Leukocyte scatterplots were visually inspected and samples showing overlapping cell populations or the presence of abnormal cell clusters were removed. After their exclusion, the Spearman’s rank correlation between AD and MD was excellent for heterophils (r=0.93, p<0.0001), lymphocytes (r=0.92, p<0.0001), moderate for monocytes (r=0.74, p<0.0001) and basophils (r=0.72, p<0.0001), but not significant for eosinophils, due to insufficient spread of values. Passing–Bablok regression revealed no statistically significant constant or proportional bias for heterophils, lymphocytes, or monocytes, whereas basophils showed both. The Bland–Altman analysis showed a significant underestimation of heterophils and overestimation of lymphocytes and basophils, while monocyte and eosinophil biases were not significant. Abnormal scattergram patterns were indicative of morphologically abnormal leukocytes. The Mindray BC-60R analyzer showed good-to-excellent overall accuracy for leukocyte differentiation in rabbits, except in cases with severe toxic changes in heterophils or blasts. Evaluation of blood smear in rabbits is required to identify the atypical cell population on scatterplot.
Keywords:
rabbit
; Mindray BC-60 R
; method comparison
; scatter plot
; leucocytes differentiation
1. Introduction
Rabbits are kept worldwide in multiple contexts, including as companion animals, laboratory models, and production animals, each sector presenting specific health and welfare challenges. Health and welfare concerns, including infectious disease, digestive disorders, and stress-related conditions, require objective diagnostic tools to support clinical assessment and monitoring [1]. Hematologic evaluation represents a fundamental component of such diagnostic workups, providing essential information on inflammatory, infectious, and systemic conditions. In the companion animal sector, pet rabbit ownership has grown substantially, and welfare awareness among owners is evolving. However, preventive healthcare measures, including vaccination and early disease detection, are not consistently applied, and veterinary consultation often occurs only after clinical signs develop [2]. Therefore, increasingly precise and accurate laboratory and diagnostic methods are needed.
The Mindray BC-60R VET is a recently introduced automated hematology analyzer that utilizes laser-based flow cytometry technology. Its evaluation in veterinary medicine was first reported in 2024 in dogs and cats [3]. The instrument software includes species-specific settings for multiple domestic and exotic species: dogs, cats, horses, cattle, sheep, goats, llamas, alpacas, rabbits, rats, mice, ferrets, pigs, pandas, monkeys. Its predecessor (BC-5000Vet) demonstrated good analytical performance in dogs and cats [4]. Although species-dependent differences have been reported between these species [3], data regarding its performance in rabbits remain limited.
Given the distinct characteristics of rabbit leukocytes, species-specific validation is necessary. The predominant leukocyte population in rabbits consists of lymphocytes, followed by heterophils, the rabbit equivalent of neutrophils. In Romanowsky-stained blood smears, the secondary granules of rabbit heterophils stain pink, in contrast to the pale blue cytoplasm typically observed in canine and feline neutrophils [5]. These hematological particularities may influence leukocyte classification in automated analyzers, potentially affecting analytical performance.
The aim of the present study was to evaluate the analytical performance of the Mindray BC-60R VET hematology analyzer in differentiating leukocyte types in rabbits, using manual microscopic differential counts as the reference method
2. Materials and Methods
Blood samples were collected from client-owned rabbits (n = 31) presented to the New Companion Animals Clinic, Faculty of Veterinary Medicine, Cluj-Napoca, between September 2024 and October 2025. The rabbits represented different ages, sexes, breeds, and a wide range of clinical conditions. Approximately 0.5 mL of whole blood was collected from either the marginal auricular vein or the lateral saphenous vein into 2 mL K3-EDTA tubes for routine hematological evaluation and diagnostic purposes. In critically ill or dehydrated rabbits, when venipuncture was limited, blood samples collected in lithium heparin tubes for biochemical analysis were also considered for hematological evaluation, provided that leukocyte morphology was adequately preserved. Written informed consent for the use of anonymized clinical data for research purposes was routinely obtained from all owners at the time of presentation, in accordance with the standard institutional procedures of the Faculty of Veterinary Medicine, Cluj-Napoca.
Complete blood counts (CBC) were performed on BC-60 R hematology analyzer (Mindray, China) within 1 hour of sampling, although a small number of samples were analyzed within 4 hours. Blood smears were prepared during the same time interval. Mindray BC-60 R is a new laser-based hematology analyzer that performs leukocyte enumeration and differential in DIFF channel. In this channel, erythrocytes are lysed, and a fluorochrome dye (asymmetric cyanine fluorochrome) selectively binds to intracellular nucleic acids (DNA and RNA) of leukocytes. A five-part differential (neutrophils/heterophils, lymphocytes, monocytes, eosinophils, and basophils) is obtained through fluorescence-based flow cytometry. Cell populations are differentiated based on fluorescence intensity (FL), reflecting the relative nucleic acid content, and side scatter (SS), indicating cytoplasmic granularity and structural complexity.
The analytical approach of the BC-60R is comparable to that used by the ProCyte analyzer (IDEXX), making comparisons with previously published validation studies relevant. In addition to standard CBC parameters, the analyzer also provides advanced platelet and reticulocyte indices, including P-LCC (platelet-large cell count), P-LCR (platelet-large cell ratio), IPF (immature platelet fraction), IRF (immature reticulocyte fraction), and low-, medium-, and high-fluorescence reticulocyte fractions (LFR, MFR, and HFR).
Manual differential count was carried out on quick May-Grunwald-Giemsa (Optica, Italy) by one observer counting 100 leukocytes. The observer was blinded to Mindray BC-60 R results. Samples were excluded from the study if any of the following criteria were met: 1-visible clots in samples; 2-poor quality slides (extensive WBC lysis, trapping of WBC in platelets aggregates).
Statistical analyses were performed using MedCalc (version 19.2.6, MedCalc Software Ltd., Mariakerke, Belgium). Graphs were prepared using GraphPad Prism (version 11.0.2, GraphPad Software, Boston, MA, USA). Spearman’s rank correlation, Passing-Bablok regression, and Bland-Altman analysis were used to assess agreement and accuracy between methods. P<0.05 was considered statistically significant.
Leukocytes scatter plots were visually inspected and samples showing overlapping cell populations or the presence of abnormal cell clusters were removed. After exclusion of outliers, the statistical analysis was performed on the new data set as described in other study [6].
3. Results
3.1. General Characteristics of Population
A total of 31 blood samples were initially included in the study. Three samples were excluded because of visible clot formation and one because of marked hemolysis, leaving 27 samples for statistical analysis. Among these, two samples had been collected in heparin tubes for biochemical testing because the patients were critically ill and dehydrated; however, as leukocyte morphology was well preserved, these samples were considered suitable and were retained for the hematological analysis.
The study population included 27 rabbits with different pathologies, with a slightly higher proportion of males (56%, 15/27) compared to females (44%, 12/27). The mean age was 4.5 years (range: 2 months to 8 years). The most represented breed was Lionhead (30%, 8/27), followed by mixed breed (26%, 7/27) and dwarf rabbits (19%, 5/27).
Normally distributed data were observed for heterophils (both analyzer and manual method), lymphocytes (analyzer), and eosinophils (analyzer). Non-normal distribution was observed for lymphocytes, monocytes, eosinophils, and basophils in the manual method, as well as for monocytes and basophils measured by the analyzer. For the BC-60R analyzer, mean (± SD) values were 53.3 ± 21.1 for heterophils, 32.8 ± 20.6 for lymphocytes, and 0.9 ± 0.6 for eosinophils. Median (range) values for monocytes and basophils were 5.0% (3.9–7.5%) and 3.3% (1.9–4.1%), respectively. For the manual differential count, the mean (± SD) value for heterophils was 61.7 ± 21.8. Median (range) values were 26% (17.8–38.2%) for lymphocytes, 4% (3–6%) for monocytes, 1% (1%) for eosinophils, and 1% (0–1.5%) for basophils.
3.2. Method Comparison
The correlation between analyzer differential (AD) and manual differential (MD) was moderate for heterophils (r=0.79, p<0.005), lymphocytes (r=0.78, p<0.005), monocytes (r=0.79, p<0.005); and basophils (r=0.77, p<0.005) and low for eosinophils (r=0.36, p<0.005).
Passing–Bablok regression analysis revealed no statistically significant constant or proportional bias for heterophils. Lymphocytes showed a significant constant bias, while monocytes and basophils demonstrated significant proportional bias, the latter being more pronounced. Eosinophils showed no evidence of constant or proportional bias (Table 1).
Bland–Altman analyses identified a statistically significant negative bias of −8.35 for heterophils. No statistically significant bias was observed for lymphocytes (1.81), monocytes (2.65), eosinophils (−0.23), or basophils (4.38). Wide 95% limits of agreement were observed for heterophils, lymphocytes, monocytes, and basophils, whereas eosinophils exhibited comparatively narrower limits of agreement (Table 1).
3.3. Description of Outliers
Scatter plot investigation revealed 4 cases with abnormal leukocytes population which were subsequently excluded from analysis. In first case, a rightward displacement of the monocyte cluster was observed, characterized by a marked increase in side scatter and expansion of the population area due to variable fluorescence intensity (Figure 1b). In the second case, the basophil cluster was displaced to the left, showing low side scatter and low to moderate fluorescence intensity. The lymphocyte population appeared split into two distinct clusters: one located between the basophil and heterophil clusters, characterized by moderate side scatter and low fluorescence intensity, and a second cluster positioned above this population, with moderate side scatter and high fluorescence intensity. The neutrophil cluster was displaced upward (high fluorescence intensity) (Figure 1c). In the third case, the lymphocyte cluster appeared divided into two populations. The first population was shifted upward and to the right, showing high fluorescence intensity and moderate side scatter. The second population was dispersed along the X-axis, with low to high side scatter and variable fluorescence intensity. The basophil cluster was displaced to the left and upward, showing low side scatter and low to moderate fluorescence intensity. The neutrophil cluster was displaced upward, showing moderate to high fluorescence intensity (Figure 1d). In the fourth case, an additional lymphocyte-like population was identified to the left of the heterophil cluster, characterized by moderate side scatter and low fluorescence intensity (Figure 1e).
These abnormal scattergram patterns were associated with marked cytological abnormalities on blood smear evaluation. The evaluation of the first three cases revealed severe toxic changes, including basophilic cytoplasm, intracytoplasmic vacuolation, abnormal granulation, and left shift (Figure 2 b, c, f). In the fourth case, round cells larger than lymphocytes, occasionally containing pink-magenta granules, were observed (Figure 2 d, e). The patient was diagnosed with thymoma.
3.4. Evolution of Agreement After Outliers’ Exclusion
After outlier exclusion (n=23), correlation between AD and MD improved to excellent for heterophils (r=0.94, p<0.0001), lymphocytes (r=0.92, p<0.0001), and remained moderate for monocytes (r=0.71, p<0.0001) and basophils (r=0.71, p<0.0001), while remaining low for eosinophils (r=0.29, p>0.005).
Passing–Bablok regression revealed no statistically significant constant or proportional bias for heterophils, lymphocytes, monocytes, or eosinophils. In contrast, basophils demonstrated both significant constant and proportional bias (Figure 3a–7a).
Bland–Altman analysis showed a statistically significant negative bias for heterophils (−6.8; 95% CI −9.0 to −4.6; p < 0.0001) and significant positive biases for lymphocytes (4.6; 95% CI 2.0 to 7.3; p = 0.0015) and basophils (2.1; 95% CI 1.4 to 2.7; p < 0.0001). No statistically significant bias was observed for monocytes (0.7; p = 0.155) or eosinophils (−0.1; p = 0.381) (Figure 3, Figure 4, Figure 5, Figure 6 and Figure 7). The exclusion of outliers markedly narrowed the 95% limits of agreement across all leukocyte subsets.
4. Discussion
The current study demonstrate the good analytical performance of BC-60 R hematology analyzer for leukocytes differentiation in rabbits, when compared with manual differential counts. Moreover, the analyzer was able to identify abnormal scattergram patterns associated with left shift, severe toxic changes, and immature cells, indicating the need for blood smear review.
Preanalytical factors may significantly influence hematological results; therefore, only fresh samples analyzed within 4 hours of collection were included, and samples with visible clots were excluded. Hemolysis and platelet clumping are among the most common preanalytical errors affecting hematology analyzers. Marked hemolysis can decrease hematocrit (HCT) and red blood cell (RBC) counts and may spuriously increase mean corpuscular hemoglobin concentration (MCHC), whereas clot formation can reduce platelets counts and, if substantial, both red blood cells and leukocytes counts [7]. Additionally, leukocytes may become entrapped in platelet aggregates or be affected by storage conditions. Monocytes appear to be particularly sensitive to storage, showing significant decreases after 24 hours, likely due to cellular deterioration [8]. A total of 27 samples were included in the study, two of which were collected in heparin due to better preservation of leukocyte morphology. Heparin has not been shown to significantly affect total leukocyte counts or differentials in dogs and horses, although in cats it has been associated with lower monocyte and lymphocyte counts compared with EDTA [9]. Further studies are required to evaluate the effects of different anticoagulants on hematological parameters in rabbits.
Heterophils and lymphocytes showed a moderate correlation between the Mindray BC-60R analyzer and the manual differential count. Passing–Bablok regression revealed a significant constant bias for lymphocytes, while no significant bias was identified for heterophils. Bland–Altman analysis demonstrated a negative bias for heterophils (−8.35) and a positive bias for lymphocytes (1.81). After exclusion of outliers, the correlation improved to excellent for both cell types. No significant constant or proportional bias was detected by Passing–Bablok regression, while Bland–Altman analysis showed a reduced negative bias for heterophils (−6.98) and an increased positive bias for lymphocytes (4.70). Similar findings have been reported in previous studies. A study evaluating the ADVIA 2120 analyzer in rabbits demonstrated good agreement between automated and manual leukocyte differentials, both before and after outlier exclusion [10]. Likewise, a large study using Sysmex analyzers in healthy (n = 120) and diseased (n = 505) rabbits reported good to excellent correlations for heterophils (r = 0.89 and 0.94) and lymphocytes (r = 0.91 and 0.92), respectively [11]. The observed positive bias for lymphocytes may be partially explained by limitations of the manual differential count, which can underestimate lymphocyte numbers due to the relatively low number of cells evaluated (100 leukocytes), thereby increasing counting variability. Heterophils and lymphocytes represent the predominant leukocyte populations in adult rabbits, with an approximate heterophil-to-lymphocyte (H:L) ratio of 45:45 under physiological conditions. This ratio is known to change in response to stress and inflammatory processes, making accurate differentiation of these cell types clinically relevant [5].
Monocytes, eosinophils, and basophils are low-abundance leukocyte populations, and their results showed greater variability compared with more prevalent cell types such as heterophils and lymphocytes. This observation is consistent with previous studies demonstrating reduced analytical performance for low-frequency leukocyte populations in veterinary hematology analyzers [12]. The moderate agreement observed for monocytes may also be influenced by limitations of the manual differential count. Monocytes, being among the largest circulating leukocytes, tend to migrate toward the margins and feathered edge of the blood smear during slide preparation. As these regions are not always systematically evaluated during microscopic examination, manual counts may underestimate the true monocyte proportion. In addition, overlap in scatter characteristics between monocytes and other leukocyte populations may further contribute to reduced analytical agreement [13].
The low correlation observed for eosinophils can be attributed primarily to their low circulating numbers. Similar findings have been reported in rabbits using both the ADVIA 2120 [10] and Sysmex analyzer [11], particularly in clinically affected animals, whereas a moderate correlation has been described in healthy rabbits. In contrast, species-related differences have been reported in the literature. In cats, eosinophil counts show good agreement between automated and manual methods when analyzed using both ADVIA and Sysmex analyzers. In dogs, correlation ranges from moderate (ADVIA) to good (Sysmex), whereas in horse, eosinophils generally demonstrate moderate agreement across both platforms [9].
A moderate correlation was observed for basophils, with both constant and proportional bias identified after outlier exclusion. Although basophils are present in very low numbers in most domestic species such as dogs and cats, rabbits typically exhibit higher baseline proportions, reaching up to approximately 5% in healthy individuals [5]. Automated hematology analyzers generally show limited performance in identifying basophils in dogs and cats; however, ADVIA analyzers can more reliably detect this population due to their unique cytochemical properties, as basophils are resistant to lysis in the BASO channel [14]. Accordingly, good agreement between automated and manual methods has been reported in rabbits using ADVIA systems [10]. In contrast, the results obtained in the present study are comparable to those reported for Sysmex analyzers, which, similarly to the BC-60R, rely on flow cytometric principles for leukocyte differentiation. In these systems, leukocytes are permeabilized and stained with fluorescent dyes, and classification is based on a combination of fluorescence intensity (reflecting nucleic acid content) and side scatter signals (reflecting cellular granularity) [11]. These methodological characteristics may contribute to the observed variability in basophil identification.
Scatter plot evaluation was performed for all samples, and those lacking clear separation of leukocyte populations or showing the presence of atypical cell clusters were excluded from analysis. Specifically, two samples exhibiting left shift and toxic changes and one sample containing myeloid precursors were removed. Similar observations have been reported in previous studies. In a validation study of the Sysmex analyzer in dogs, cats, and horses, incomplete or inaccurate differential counts were associated with samples showing left shift and toxic changes [6]. In such cases, increased RNA content in immature or toxic neutrophils leads to enhanced fluorescence signals, causing an upward shift in scattergrams and overlap with lymphocyte clusters. This phenomenon may result in misclassification or incomplete leukocyte differentiation. A comparable mechanism was described in a study evaluating neutrophil misclassification in the ProCyte analyzer, where altered cellular properties caused neutrophils to shift into lymphocyte or monocyte regions, leading to erroneous classification [15].
Interestingly, in the present study, in one case, heterophils with severe toxic changes (Figure 2. C,D) were misclassified as basophils rather than lymphocytes or monocytes. In another case, heterophils with toxic changes and immature forms were misclassified as lymphocytes and basophils. Misclassification of toxic heterophils as basophils differs from previous reports in dogs and cats and may reflect species-specific properties of rabbit heterophils under pathological conditions. Furthermore, leukocyte classification based solely on scatter properties has been shown to be feasible in rabbits, with high accuracy for granulocytes and lymphocytes; however, the close proximity of gating regions, particularly between monocytes and large lymphocytes, may lead to misclassification in automated systems [13]. These limitations are inherent to flow cytometry–based techniques, as cells are classified according to their optical properties, which can be altered by activation, disease, or cellular immaturity [16]. This pattern of misclassification has not been previously described and warrants further study. These findings highlights the importance of scatter plot evaluation and manual smear review in samples with suspected abnormal leukocyte populations.
Most veterinary hematology analyzers were initially developed for human medicine and subsequently adapted for use in animals. A validation study conducted on its predecessor, the BC-5000, which included 853 samples and followed ICSH and CLSI guidelines, demonstrated excellent accuracy for leukocyte differentiation [17]. Furthermore, studies in dogs and cats have shown that this type of analyzer is suitable for routine hematological analysis, including in patients with various hematologic abnormalities [4].
The present study has several limitations that should be acknowledged. First, the relatively small sample size may limit the statistical power of the analysis, as method comparison studies generally recommend a minimum of 40 samples to ensure robust evaluation of agreement [18]. However, the number of samples included in the present study was above the minimum suggested by CLSI for verification of performance studies, where approximately 20 specimens may be sufficient for an initial evaluation, provided that samples span the clinically relevant measurement range [19]. Therefore, the present results should be interpreted as preliminary but clinically relevant evidence supporting further validation.
Second, manual differential counts were performed by a single observer due to the retrospective nature of the study. Although this approach ensures internal consistency, it does not allow assessment of inter-observer variability, which is known to be a significant source of error in manual leukocyte differentiation [20]. In addition, the inherent imprecision of manual leukocyte differential counts represents an important limitation. Differential counts follow a binomial distribution, and their variability is determined by both the proportion of the cell population and the finite number of cells evaluated. Consequently, low-frequency leukocyte populations exhibit substantially higher variability, particularly when based on counts of 100 cells, which does lead to apparent discrepancies between manual and automated methods [21].
5. Conclusions
The Mindray BC-60 R analyzer showed good-to-excellent overall accuracy for leukocyte differentiation in rabbits, especially for heterophils and lymphocytes, except in cases involving severe toxic changes in heterophils and immature leukocytes. Basophil identification remained less reliable than that of heterophils and lymphocytes. Specific scattergram patterns were associated with morphological patterns. Blood smear evaluation remains essential, especially when abnormal scattergram patterns are present, to ensure correct identification of atypical cells.
Author Contributions
Conceptualization, IMM.; methodology, IMM and PJO.; validation, IMM and PJO.; formal analysis, IMM and PJO.; investigation, IMM, MCT, MO, LB, AIMD, OS and BS.; resources, MCT, MO, LB, AIMD, OS, BS and IM; data curation, IMM, MCT and MO; writing—original draft preparation, IMM.; writing—review and editing, IMM, MCT, AIMD, OS, BS, PJO and IM.; visualization, IMM and PJO; supervision, PJO and IM.; project administration, IMM and IM. All authors have read and agreed to the published version of the manuscript.
Funding
This research received no external funding.
Institutional Review Board Statement
Written informed consent for the use of anonymized clinical data for research purposes was routinely obtained from all owners at the time of presentation, in accordance with the standard institutional procedures of the Faculty of Veterinary Medicine, Cluj-Napoca.
Data Availability Statement
The data related to this study are available and can be obtained by contacting the corresponding author.
Conflicts of Interest
The authors declare no conflicts of interest.
Acknowledgments
Parts of this study were presented at the ESVCP Congress in Bristol, United Kingdom in October 1-4 2025. A special thank you is extended to the staff of the New Companion Animal Clinic for their constant support and for always being receptive and open to collaboration throughout this study. I.M.M. also gratefully acknowledges Professor O’Brien for his guidance throughout this study and in earlier academic work.
Abbreviations
The following abbreviations are used in this manuscript:
| CBC | Complete blood count |
| AD | Analyzer differential |
| MD | Manual method |
References
- Fels, M.; Benato, L.; Whittaker, A. Health and Welfare of Rabbits (on a Farm, in the Laboratory or as a Pet). Front. Vet. Sci. 2024, 11, 1522420. [Google Scholar] [CrossRef] [PubMed]
- Boglárka, S.; Bodnar, K.; Marta, P.; Katalin, S. Study of Animal Welfare Aspects Among Pet Rabbit Owners. Lucr. Stiint. Ser. I 2019, 21, 108–112. [Google Scholar]
- Cheng, X. Comparison of Mindray BC-60R Vet with Sysmex XT-2000iV Analyzer Using Total Observed Error, Total Allowable Error, and QC Rules Defined in the American Society for Veterinary Clinical Pathology (ASVCP) Guidelines. PhD Thesis, University of Veterinary Medicine Budapes, Budapest, 2024. [Google Scholar]
- Thongsahuan, S.; Fonghoi, L.; Kaewfai, S.; Srinoun, K. Precision and Accuracy of the Mindray BC-5000Vet Hematology Analyzer for Canine and Feline Blood. Vet. Clin. Pathol. 2020, 49, 207–216. [Google Scholar] [CrossRef] [PubMed]
- Campbell, T.W.; Grant, K.R. Exotic Animal Hematology and Cytology; Fifth Edition; John Wiley & Sons: Hoboken, USA, 2022; ISBN 9781119660231. [Google Scholar]
- Lilliehöök, I.; Tvedten, H. Validation of the Sysmex XT-2000iV Hematology System for Dogs, Cats, and Horses. II. Differential Leukocyte Counts. Vet. Clin. Pathol. 2009, 38, 175–182. [Google Scholar] [CrossRef] [PubMed]
- DeNicola, D.B. Advances in Hematology Analyzers. Top. Companion Anim. Med. 2011, 26, 377–386. [Google Scholar] [CrossRef] [PubMed]
- Ameri, M.; Schnaars, H.A.; Sibley, J.R.; Honor, D.J. Stability of Hematologic Analytes in Monkey, Rabbit, Rat, and Mouse Blood Stored at 4°C in EDTA Using the ADVIA 120 Hematology Analyzer. Vet. Clin. Pathol. 2011, 40, 188–193. [Google Scholar] [CrossRef] [PubMed]
- Bauer, N.; Nakagawa, J.; Dunker, C.; Failing, K.; Moritz, A. Evaluation of the Automated Hematology Analyzer Sysmex XT-2000iVTM Compared to the ADVIA® 2120 for Its Use in Dogs, Cats, and Horses. Part II: Accuracy of Leukocyte Differential and Reticulocyte Count, Impact of Anticoagulant and Sample Aging. J. Vet. Diagn. Investig. 2012, 24, 74–89. [Google Scholar] [CrossRef] [PubMed]
- Oikonomidis, I.L.; Milne, E.; Piccinelli, C. Differential White Blood Cell Counts in Rabbits: A Comparison of the Advia 2120 and a Manual Method. J. Vet. Diagn. Investig. 2021, 33, 670–676. [Google Scholar] [CrossRef] [PubMed]
- Weiß, J. Veränderungen des weißen Blutbildes bei Kaninchen (Oryctolagus cuniculus) mit verschiedenen Erkrankungen. PhD Thesis, Freie Universität Berlin, Berlin, 2019. [Google Scholar]
- Rishniw, M.; Pion, P.D. Evaluation of Performance of Veterinary In-Clinic Hematology Analyzers. Vet. Clin. Pathol. 2016, 45, 604–614. [Google Scholar] [CrossRef] [PubMed]
- Munga, A.; Beqiraj, D.; Brecchia, G.; Postoli, R.; Mencchetti, L.; Ozuni, E.; Agradi, S.; Zalla, P.; Castrica, M.; Muça, G.; et al. Identification of Rabbit Main Leukocyte Populations Based on Scatter Properties: A Flow Cytometric Approach. Int. J. Vet. Sci. 2023, 12, 887–891. [Google Scholar] [CrossRef] [PubMed]
- Lilliehöök, I.; Tvedten, H.W. Errors in Basophil Enumeration with 3 Veterinary Hematology Systems and Observations on Occurrence of Basophils in Dogs. Vet. Clin. Pathol. 2011, 40, 450–458. [Google Scholar] [CrossRef] [PubMed]
- Bergstrand, E.; Tvedten, H.W.; Lilliehöök, I. Detection of Frequent Neutrophil Misclassification by the ProCyte Dx in Sick Dogs and How to Avoid It. J. Small Anim. Pract. 2022, 63, 603–608. [Google Scholar] [CrossRef] [PubMed]
- Davis, W.C.; Hamilton, M.J. Use of Flow Cytometry to Develop and Characterize a Set of Monoclonal Antibodies Specific for Rabbit Leukocyte Differentiation Molecules. J. Vet. Sci. 2008, 9, 51–66. [Google Scholar] [CrossRef] [PubMed]
- Xiang, D.; Yue, J.; Lan, Y.; Sha, C.; Ren, S.; Li, Y.; Li, M.; Wang, C. Evaluation of Mindray BC-5000 Hematology Analyzer: A New Miniature 5-Part WBC Differential Instrument. Int. J. Lab. Hematol. 2015, 37, 597–605. [Google Scholar] [CrossRef] [PubMed]
- Jensen, A.L.; Kjelgaard-Hansen, M. Method Comparison in the Clinical Laboratory. Vet. Clin. Pathol. 2006, 35, 276–286. [Google Scholar] [CrossRef] [PubMed]
- Carey, R.; Anderson, F.; George, H.; Hartmann, A.; Janzen, V.; Kallner, A.; Levine, J.; Schiffgens, J.; Srinivasan, A.; Tholen, D. User Verification of Performance for Precision and Trueness; Approved Guideline—Second Edition. CLSI Document EP15-A2. CLSI Document EP15-A2 2006, 25.
- Fuentes-Arderiu, X.; García-Panyella, M.; Dot-Bach, D. Between-Examiner Reproducibility in Manual Differential Leukocyte Counting. Accredit. Qual. Assur. 2007, 12, 643–645. [Google Scholar] [CrossRef]
- Peng, C. Recommendations for Methods and Criteria for Evaluating the Imprecision of Leukocyte (WBC) Differential Count (Proportional). J. Appl. Lab. Med. 2025, 10, 1333–1346. [Google Scholar] [CrossRef] [PubMed]
Figure 1.
Scattergrams of outlier cases from BC-60 R . X-axis: side scatter (SS) – intracellular complexity, Y-axis: intensity of fluorescence (FL) – content of nuclei acid; ● green – lymphocytes population, ● light-blue – heterophils, ● purple – monocytes, ● red - eosinophils, ● yellow – basophils, ● deep-blue – unclassified cells; A) Scatter plot from a clinically healthy rabbit B) Immature heterophils with severe toxic changes were misclassified as monocytes (Figure 2 b); C) Heterophils with marked toxic changes, especially toxic granulation, were most likely counted as basophils (Figure 2 c, d); D) Immature cells, most likely myeloblast, were classified as lymphocytes (Figure 2. e, f).
Figure 1.
Scattergrams of outlier cases from BC-60 R . X-axis: side scatter (SS) – intracellular complexity, Y-axis: intensity of fluorescence (FL) – content of nuclei acid; ● green – lymphocytes population, ● light-blue – heterophils, ● purple – monocytes, ● red - eosinophils, ● yellow – basophils, ● deep-blue – unclassified cells; A) Scatter plot from a clinically healthy rabbit B) Immature heterophils with severe toxic changes were misclassified as monocytes (Figure 2 b); C) Heterophils with marked toxic changes, especially toxic granulation, were most likely counted as basophils (Figure 2 c, d); D) Immature cells, most likely myeloblast, were classified as lymphocytes (Figure 2. e, f).
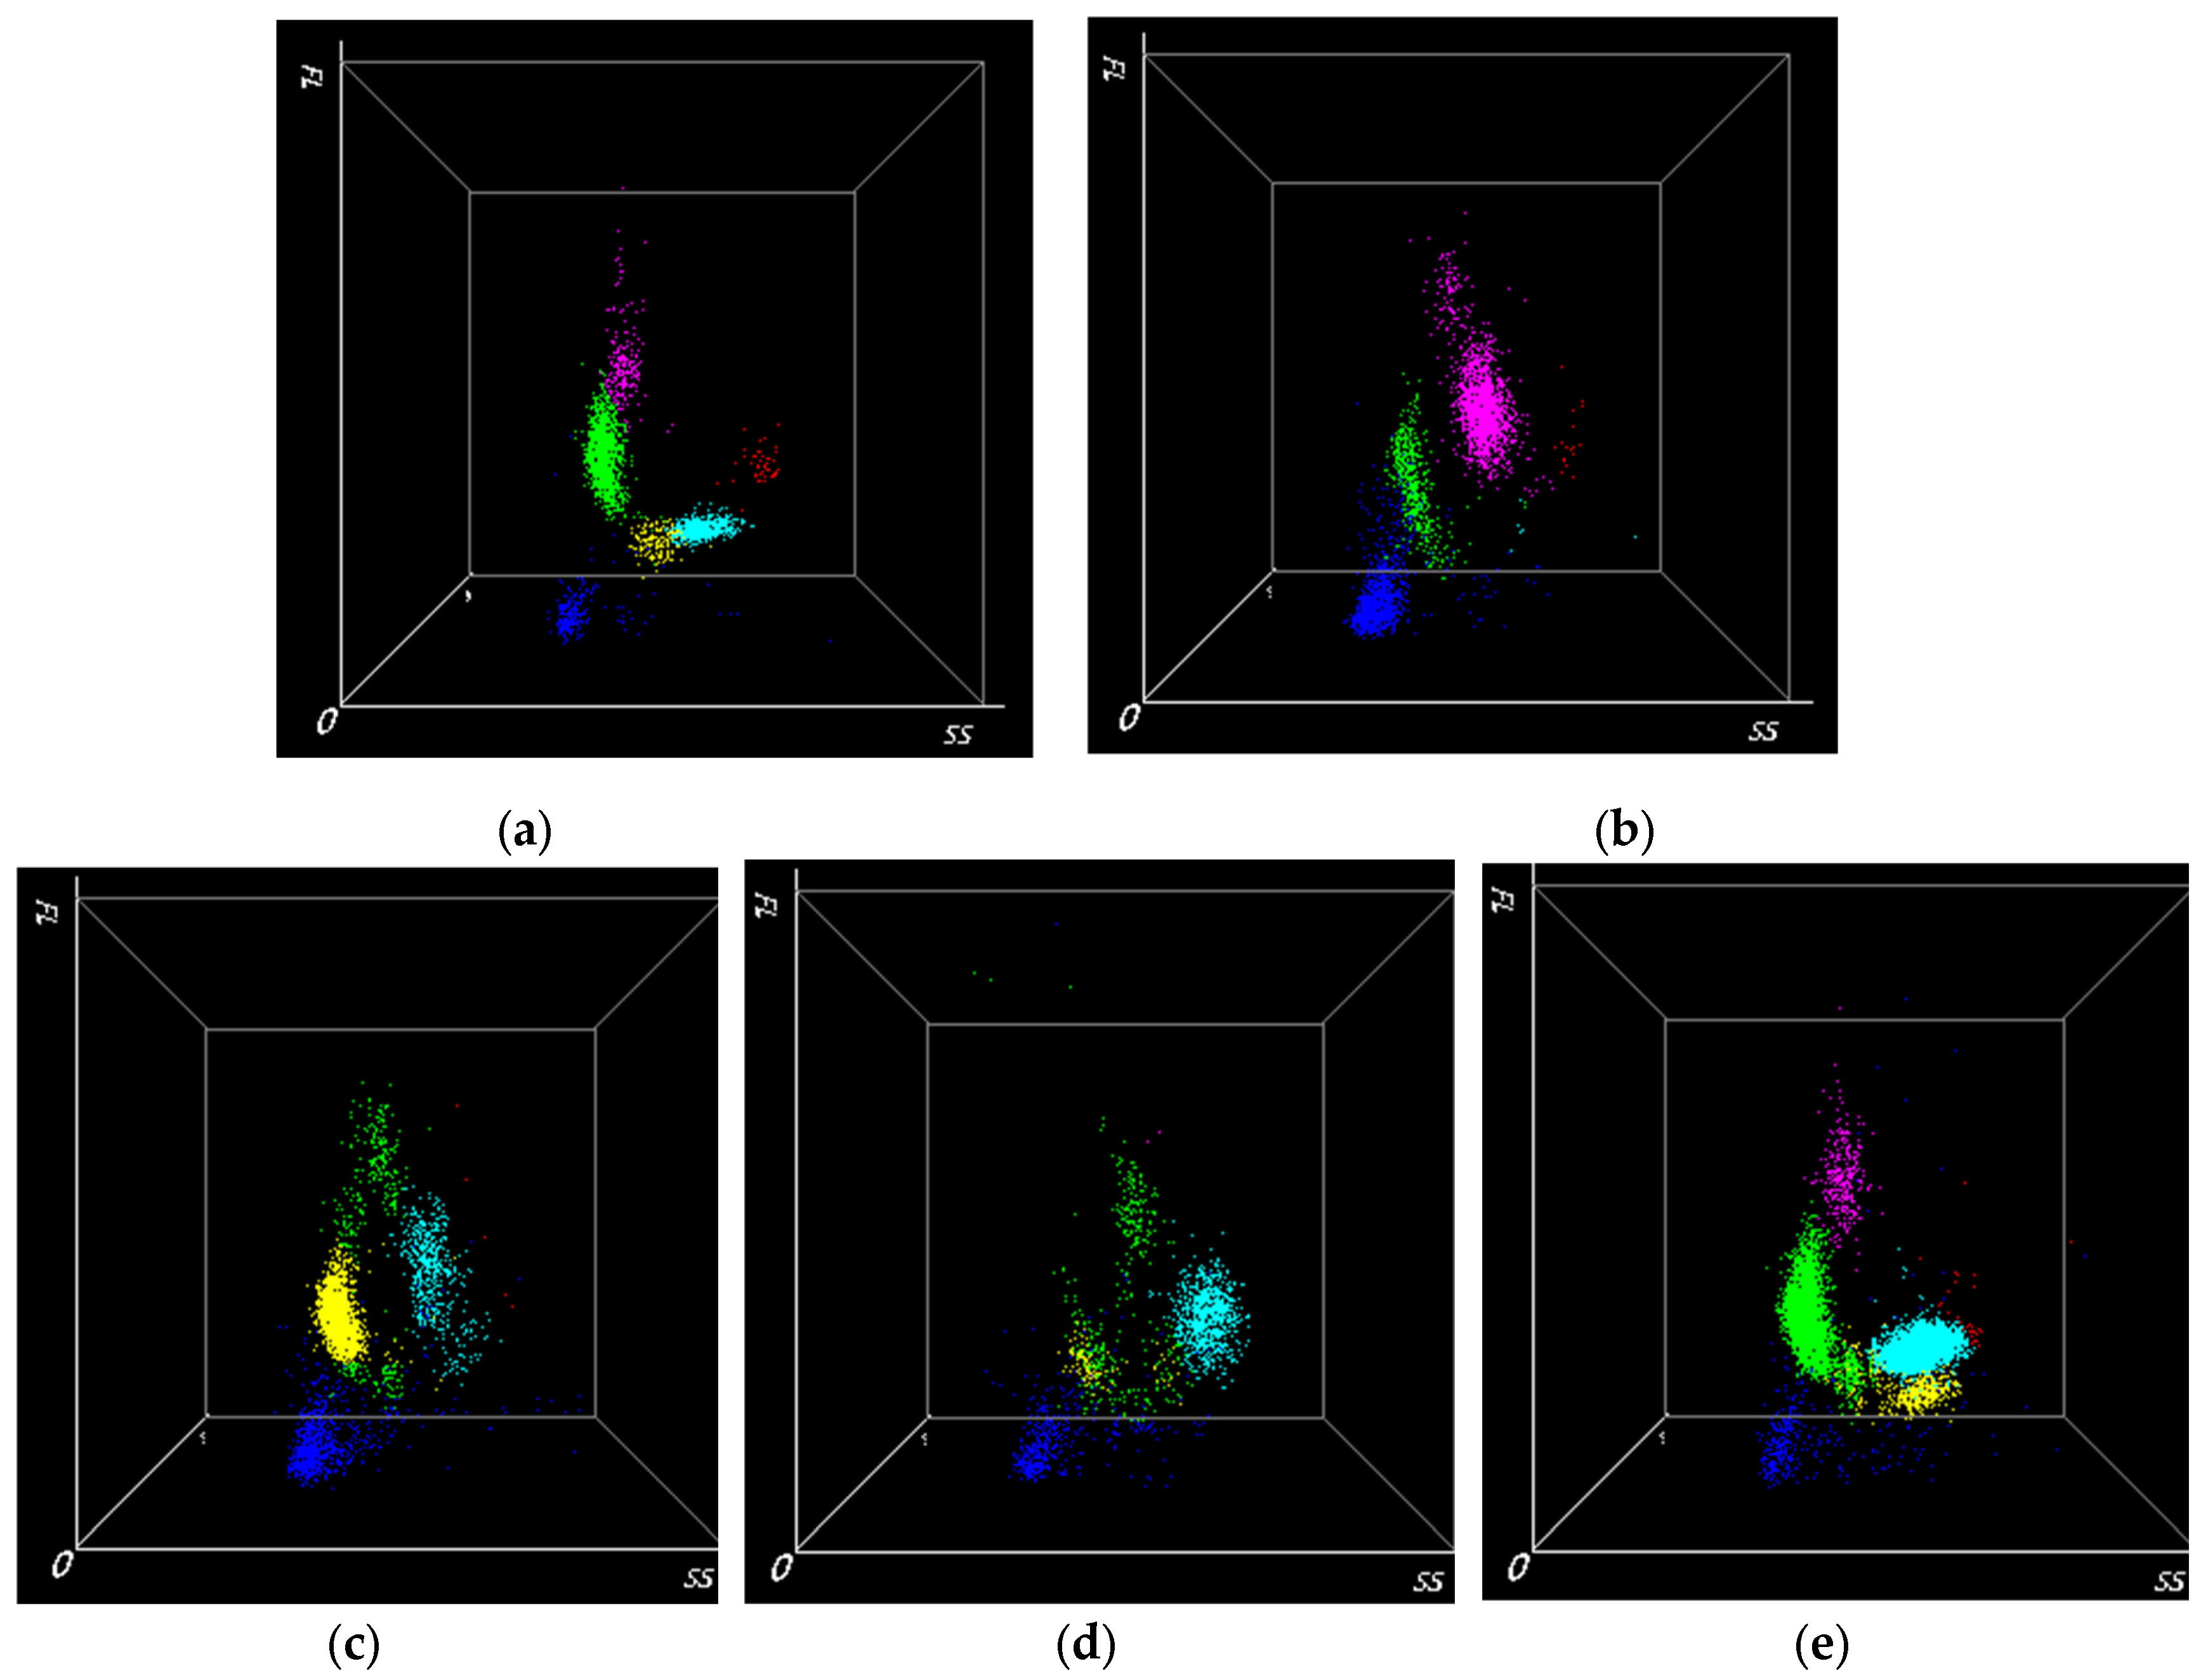
Figure 2.
Morphology of normal and abnormal heterophils. a) Heterophil in healthy rabbit; b) Below - Band heterophil with marked toxic changes (basophilic cytoplasm, less granulation), Upper - metamyelocyte; c) Markedly-toxic mature heterophils: cytoplasmic basophilia, less granulation than normal, and toxic granulation; d) Immature cells, most likely metamyelocytes; e) left - metamyelocytes (deep-blue cytoplasm and pinkish granules and reniform nucleus), right – myeloblast (moderate amount of basophilic cytoplasm, oval nucleus); f) Markedly-toxic metamyelocytes: cytoplasmic basophilia, vacuolization, and less granulation than normal. May-Grunwald-Giemsa stain, x1000.
Figure 2.
Morphology of normal and abnormal heterophils. a) Heterophil in healthy rabbit; b) Below - Band heterophil with marked toxic changes (basophilic cytoplasm, less granulation), Upper - metamyelocyte; c) Markedly-toxic mature heterophils: cytoplasmic basophilia, less granulation than normal, and toxic granulation; d) Immature cells, most likely metamyelocytes; e) left - metamyelocytes (deep-blue cytoplasm and pinkish granules and reniform nucleus), right – myeloblast (moderate amount of basophilic cytoplasm, oval nucleus); f) Markedly-toxic metamyelocytes: cytoplasmic basophilia, vacuolization, and less granulation than normal. May-Grunwald-Giemsa stain, x1000.
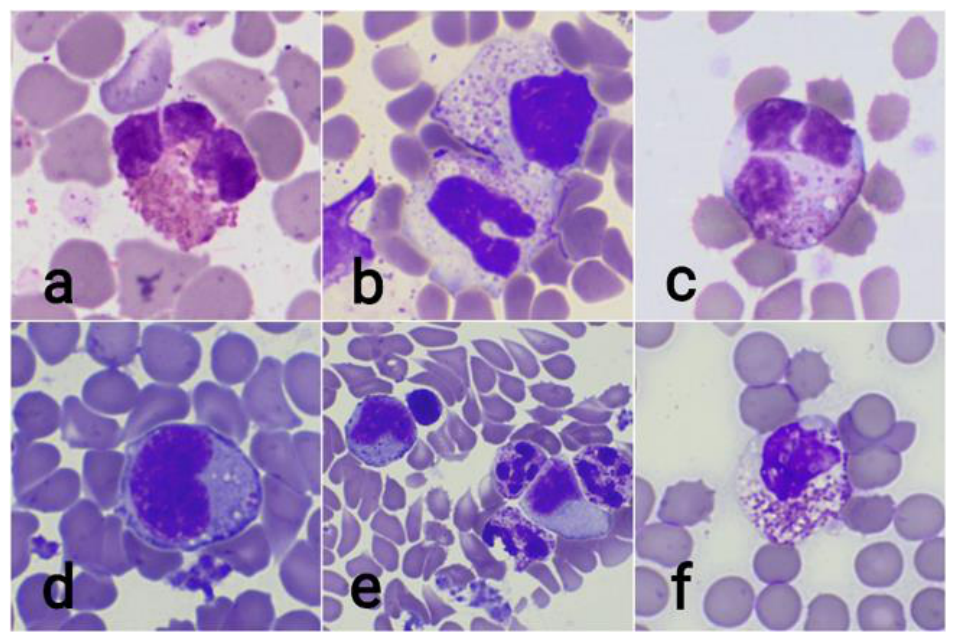
Figure 3.
Passing-Bablok regression analysis and Bland-Altman plot for heterophils percentage obtained by BC-60 R compared to manual method after the outlier exclusion (n=23). (a) The black, dasehed diagonal line in the Passing–Bablok regression analysis plot is the line of identity, and the black line is the calculated line of regression. Black circles represent samples included in the regression analysis; red diamonds indicate samples identified as outliers and excluded from the Passing–Bablok regression. (b) In the Bland–Altman plot, the difference between the 0 and the black line indicates the bias of the Mindray BC-60 R minus the manual differential counts. The 95% CIs of the calculated bias are represented by the 2 red dashed lines.
Figure 3.
Passing-Bablok regression analysis and Bland-Altman plot for heterophils percentage obtained by BC-60 R compared to manual method after the outlier exclusion (n=23). (a) The black, dasehed diagonal line in the Passing–Bablok regression analysis plot is the line of identity, and the black line is the calculated line of regression. Black circles represent samples included in the regression analysis; red diamonds indicate samples identified as outliers and excluded from the Passing–Bablok regression. (b) In the Bland–Altman plot, the difference between the 0 and the black line indicates the bias of the Mindray BC-60 R minus the manual differential counts. The 95% CIs of the calculated bias are represented by the 2 red dashed lines.
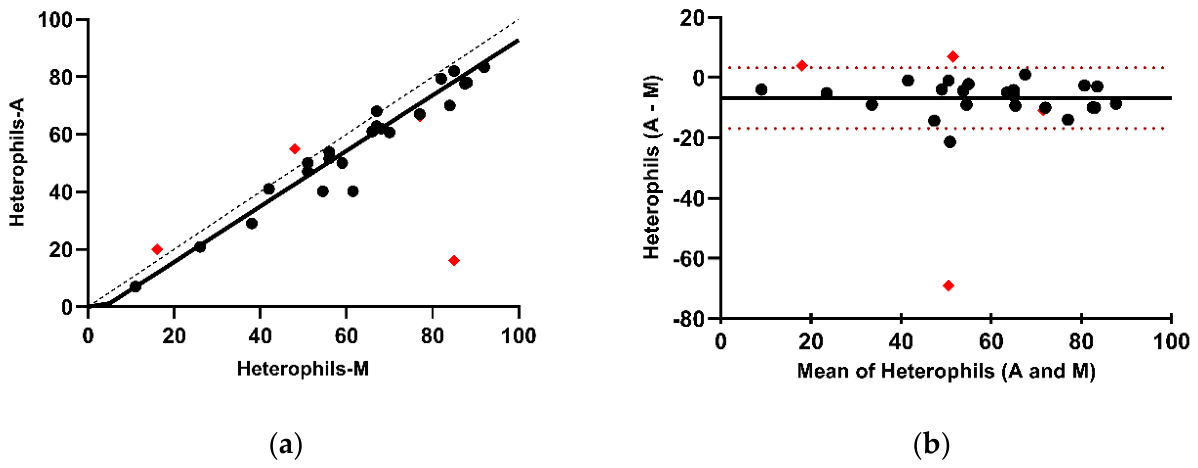
Figure 4.
Passing-Bablok regression analysis and Bland-Altman plot for lymphocytes percentage obtained by BC-60 R compared to manual method after outlier exclusion (n=23).
Figure 4.
Passing-Bablok regression analysis and Bland-Altman plot for lymphocytes percentage obtained by BC-60 R compared to manual method after outlier exclusion (n=23).
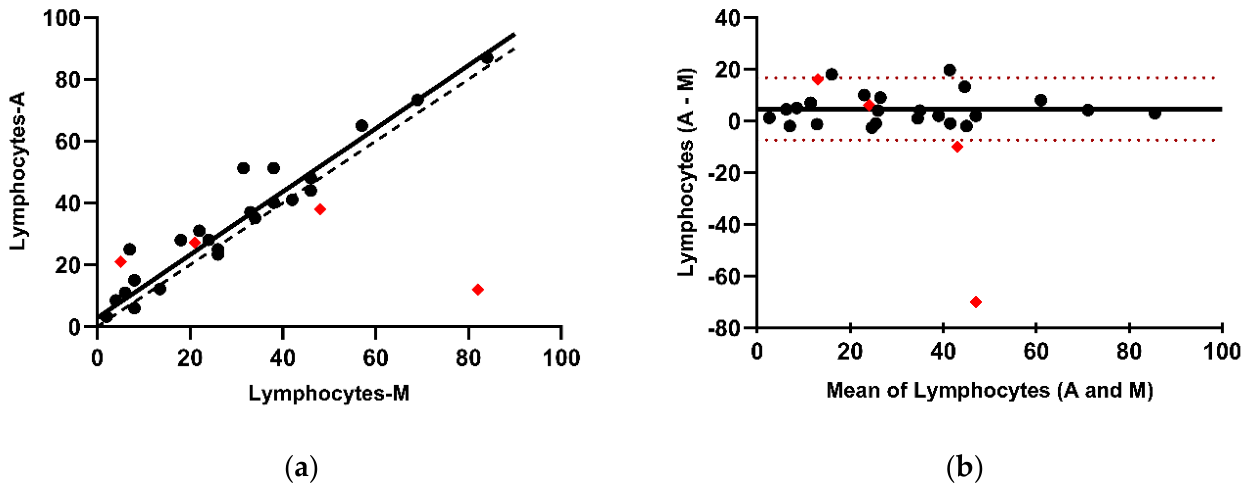
Figure 5.
Passing-Bablok regression analysis and Bland-Altman plot for monocytes percentage obtained by BC-60 R compared to manual method after outlier exclusion (n=23).
Figure 5.
Passing-Bablok regression analysis and Bland-Altman plot for monocytes percentage obtained by BC-60 R compared to manual method after outlier exclusion (n=23).
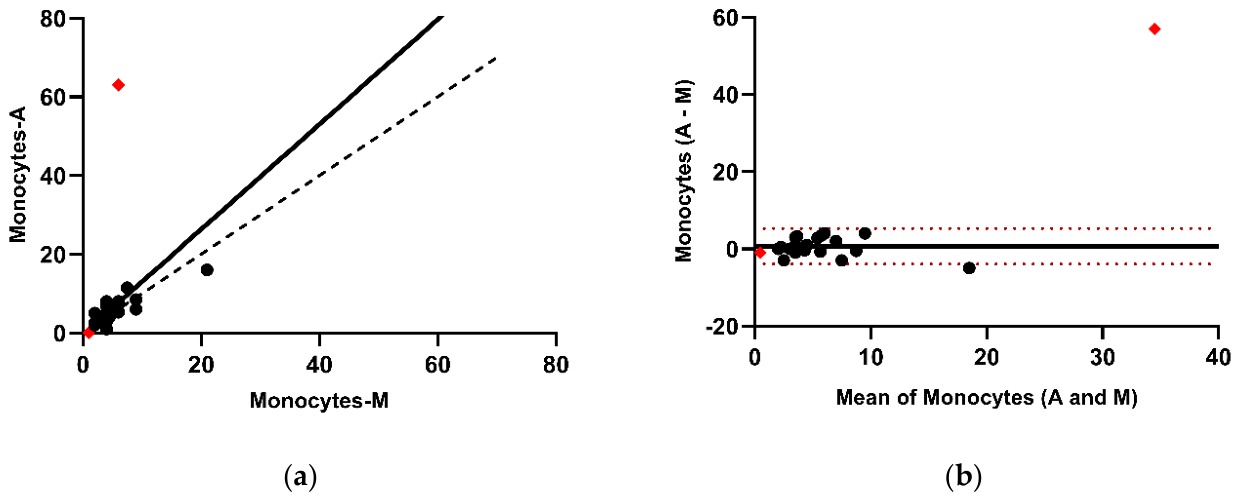
Figure 6.
Passing-Bablok regression analysis and Bland-Altman plot for eosinophils percentage obtained by Mindray BC-60 R compared to manual method after outlier exclusion (n=23).
Figure 6.
Passing-Bablok regression analysis and Bland-Altman plot for eosinophils percentage obtained by Mindray BC-60 R compared to manual method after outlier exclusion (n=23).
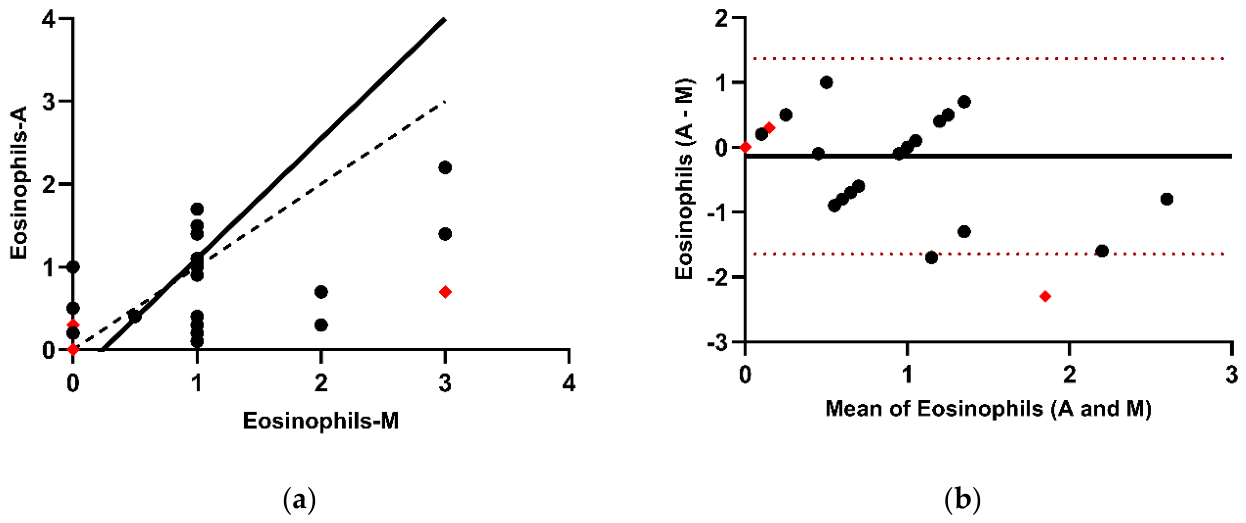
Figure 7.
Passing-Bablok regression analysis and Bland-Altman plot for basophils percentage obtained by Mindray BC-60 R compared to manual method after outlier exclusion (n=23).
Figure 7.
Passing-Bablok regression analysis and Bland-Altman plot for basophils percentage obtained by Mindray BC-60 R compared to manual method after outlier exclusion (n=23).
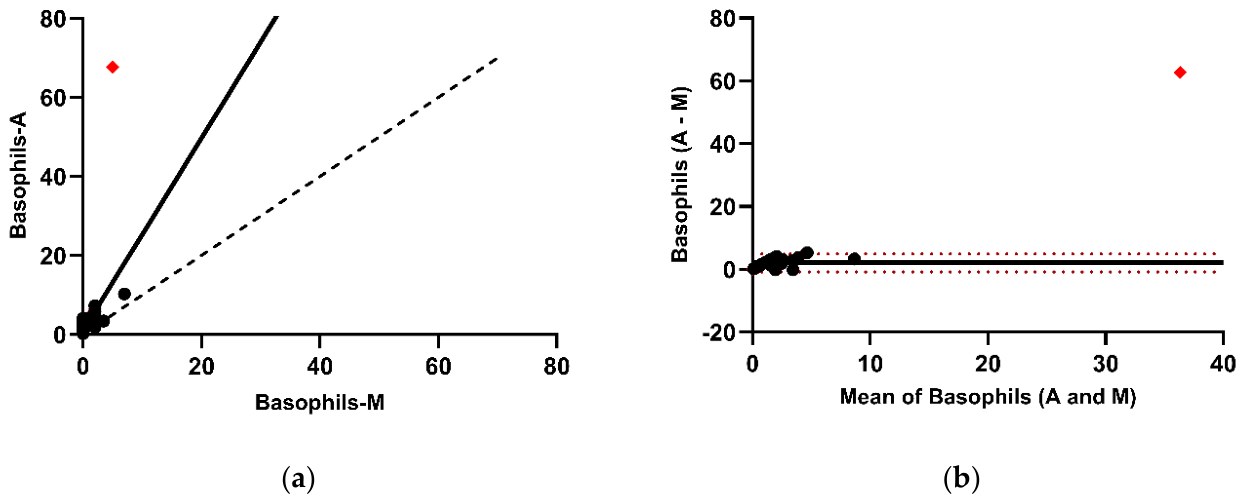

Table 1.
Results of the Passing–Bablok and Bland–Altman analyses comparing the differential WBC counts obtained by the Mindray BC-60 R and the manual method in 27 leporide blood samples.
Table 1.
Results of the Passing–Bablok and Bland–Altman analyses comparing the differential WBC counts obtained by the Mindray BC-60 R and the manual method in 27 leporide blood samples.
| Bias | Lower limit | Upper limit | Intercept | Slop | |
|---|---|---|---|---|---|
| Heterophils | −8.4 (−13.7, −3.0) | −34.7 (−44.0, −25.5) | 18.0 (8.8, 27.3) | −2.8 (−8.0, 6.9) | 0.9 (0.8, 1.1) |
| Lymphocytes | 1.8 (−4.5, 8.1) | −29.3 (−40.1, −18.4) | 32.9 (22.0, 43.7) | 4.9 (0.7, 9.4) | 0.96 (0.8, 1.1) |
| Monocytes | 2.7 (−1.7, 7.0) | −19.1 (−26.7, −11.5) | 24.4 (16.8, 32.0) | −1.0 (−4.3, 0.5) | 1.5 (1.0, 2.3) |
| Eosinophils | −0.2 (−0.6, 0.1) | −1.9 (−2.4, −1.3) | 1.4 (0.8, 2.0) | 0.00 | 1.0 |
| Basophils | 4.4 (−0.3, 9.0) | −18.7 (−26.7, −10.6) | 27.4 (19.4, 35.5) | 0.6 (0.0, 1.4) | 3.0 (2.1, 13.4) |
Disclaimer/Publisher’s Note: The statements, opinions and data contained in all publications are solely those of the individual author(s) and contributor(s) and not of MDPI and/or the editor(s). MDPI and/or the editor(s) disclaim responsibility for any injury to people or property resulting from any ideas, methods, instructions or products referred to in the content. |
© 2026 by the authors. Licensee MDPI, Basel, Switzerland. This article is an open access article distributed under the terms and conditions of the Creative Commons Attribution (CC BY) license (http://creativecommons.org/licenses/by/4.0/).
Copyright: This open access article is published under a Creative Commons CC BY 4.0 license, which permit the free download, distribution, and reuse, provided that the author and preprint are cited in any reuse.


