

Submitted:
27 July 2026
Posted:
28 July 2026
You are already at the latest version
Abstract
Evaluating multiple-object trackers is challenging due to the variable number of quantities involved and the mixed discrete--continuum nature of the problem. Existing methodologies primarily address detection and tracking challenges. These challenges aim at whole computer-vision pipelines as opposed to isolated tracker algorithms. However, modern tracker algorithms have become sufficiently sophisticated to merit a stand-alone analysis. The most critical component of a tracker is the association procedure, as its outcome strongly affects the overall tracking quality.
We propose a straightforward quality assessment framework to evaluate the association quality of trackers. The framework relies on a minimal, query-oriented instrumentation of the tracker. This instrumentation exposes the tracker's internal association decisions, allowing for a binary classification of detection-target matches. The proposed methodology is simple to implement, introduces minimal computational overhead, and agrees with the well-known ClearMOT metrics. The comparison is implemented through our accompanying open-source software packages.
Keywords:
tracking
; binary classification
; evaluation
1. Introduction
Tracking-by-detection is a standard paradigm in computer vision, radar technology, surveillance and autonomous driving. Tracking is a post-processing stage that follows detection. It is used to extend the applicability of automatic systems. Often, tracking and detection are considered complementary procedures within the same computer-vision pipeline. The quality of such pipelines is paramount. Consequently, several detection and tracking benchmark challenges exist to identify the most accurate algorithms. However, even in the tracking challenges, the organizers focus on an integral assessment of the entire computer-vision pipeline. This objective leads to cumbersome evaluation procedures in which both parts (detection and tracking) are effectively evaluated simultaneously.
Although detection and tracking are interconnected, they can be separated and optimized independently. This separation is often desirable and sometimes required in complex projects. Motivated by this need, we developed a lightweight evaluation technique dedicated specifically to tracking algorithms.
The proposed evaluation technique:
- focuses exclusively on tracking algorithms,
- relies on an instrumentation of the association procedure of the evaluated tracker,
- avoids an evaluation-scoped association procedure entirely,
- is equally simple to implement in 2D or 3D trackers,
- offers the standard binary classification of tracker output,
- enables experimentation with absent detections and clutter,
- serves as a complement to established evaluation methodologies.
In Section 2, we present the state-of-the-art tracking evaluation approaches in more detail. In Section 3, we review a prototypical tracker, analyze possible outcomes and develop a method to classify the result of the association procedure. In Section 4, we consider several toy scenarios to demonstrate the proposed evaluation procedure. To facilitate the practical adoption of this framework, we provide several software packages described in Section 5. Section 6 details a baseline use-case scenario of the proposed framework. Finally, we discuss potential directions for further work in Section 7 and conclude in Section 8.
2. Related Work
Several methodologies for evaluating tracking algorithms are established in the current literature. The most mathematically rigorous frameworks are derived from the optimal sub-pattern assignment (OSPA) family, notably the generalized (GOSPA) [1] and trajectory-generalized (T-GOSPA) [2] metrics. Although fully compatible with the demands of tracking challenges, these metrics have not been adopted by major mobility datasets.
Instead, the evaluation methodologies favored in autonomous mobility challenges originate from the CLassification of Events, Activities, and Relationships (CLEAR) project [3]. The application of CLEAR to autonomous driving yielded the ClearMOT metric [4], which was later revised into the Higher Order Tracking Accuracy (HOTA) framework [5], a practical solution for 2D tracking. Consequently, these CLEAR-derived metrics represent the established standard across widely used mobility datasets, including KITTI [6], nuScenes [7], and Waymo [8].
The goal of these evaluation procedures is to determine the best-performing computer-vision pipeline. For this purpose, each dataset is divided into training and evaluation splits. The training split contains raw sensor data (images and point clouds) along with annotations, while the evaluation split contains only raw, unannotated data. Contributors submit their tracking outputs to the challenge organizers. The organizers compare these outputs against the withheld ground truth and compute the quality metrics.
In the tracking challenges, the trackers are provided with raw detections, while the tracker output is ultimately compared with ground-truth annotations. In order to match annotations and tracked targets, an association procedure is employed. Given the probabilistic nature of this association, matching is evaluated at different parameter thresholds to select the maximal number of matches. Finally, various quality metrics are computed. These metrics include the binary classification of the tracker output as well as the deviations of the target characteristics.
This design has two key advantages: (i) developers do not need to disclose their algorithms, and (ii) the separation of annotations helps prevent a possible data-specific tuning. On the other hand, the evaluation must be performed on the entire computer-vision pipeline. The end-to-end evaluation objective increases the number of tunable parameters. Moreover, the evaluation becomes cumbersome. The association procedure employed during evaluation is similar to the tracker’s own association logic. This similarity introduces fundamental uncertainty and complicates the analysis of tracker shortcomings.
In many scenarios, particularly during the initial phases of development, end-to-end evaluation of tracking systems proves excessively complex. It is often more pragmatic to validate individual pipeline components prior to holistic testing. Furthermore, the stringent requirements of double-blind evaluation are typically unnecessary when the tracking algorithm remains fully accessible and subject to ongoing adjustment. Driven by these conditions, we introduce a streamlined evaluation methodology. Our solution circumvents probabilistic association in favor of directly analyzing the tracking algorithm, thereby facilitating immediate binary classification of the output. Notably, despite the inherent simplicity of this approach, we are unaware of any analogous proposals within the existing technical literature.
3. Methodology
A generic multiple-object tracker processes the detector output to generate a scene of moving targets (tracks).1 Targets include vehicles, pedestrians, houses, trees, and other obstacles. The objects are often represented by rectangles or cuboids located in space and possessing kinematic characteristics such as velocity and acceleration. The detector reports typically include the location and dimension of objects, but do not provide any identification. Detectors work on a timely schedule, providing time-stamped batches of measurements. The time stamps allow for the derivation of the kinematic characteristics of the targets.
A generic tracker corroborates a correspondence between the time-stamped measurements in the form of consistent, unique target IDs. The assignment of IDs occurs as a result of an association procedure. The association is a probabilistic procedure designed to establish a bipartite matching between registered targets and fresh measurements. In the simplest case, there is only one set of registered targets corresponding to the latest time stamp. The association procedure addresses several detector deficiencies. The deficiencies include slight imperfections such as regular measurement noise, as well as more serious discrete shortcomings such as absent detection and clutter.
The performance of the association procedure is crucial for the tracking quality, a fact well established and reflected in existing evaluation approaches [5]. We seek to evaluate the association quality as well. At a more technical level, we propose adding query-oriented instrumentation to the association procedure. As a result, the instrumentation allows for a binary classification of the bipartite matching. Hence, we term this approach Classification via Instrumented Association (ClavIA).
3.1. Association Outcomes and Their Classification
A typical tracker algorithm maintains an identified set of target descriptions. When provided with a current set of detections, the tracker propagates the targets according to their kinematic characteristics and starts a detection–target matching. There are several approaches and algorithms to realize such matching. Regardless of the specific approach, the tracker must provide a consistent identification of the targets immediately upon the arrival of the new detections. This requirement obligates any association algorithm to precisely link the detection reports and targets at every time step. After the correspondence of the detection reports and targets is established, an update step finalizes the tracking procedure until the next time stamp. The update step is important for the tracking quality as such. However, we should focus on the possible outcomes of the preceding association procedure to design the evaluation of its qualities.
Ideally, the association finds an accurate correspondence between each target and report. However, this is frequently unachievable because the number of detected objects varies across time steps. If there are more detection reports than targets, the association should mark new reports as unmatched and initialize corresponding targets after the update step. This occurs when new targets enter the field of view or when the detector malfunctions, producing spurious reports (clutter). Conversely, if there are fewer detection reports than targets, then the association should leave the appropriate targets unmatched while correctly associating the remaining targets. This arises when targets exit the field of view or when the detector misses objects. To allow a sufficiently complete classification of the association outcomes, we must distinguish between accurate (true positive and negative) and inaccurate (false positive and negative) associations, explicitly accounting for cases where an ideal outcome is impossible. For example, when an object leaves the field of view, the detector yields no reports; consequently, the tracker should keep the corresponding target dissociated (a true negative) until the target is terminated.
3.2. Instrumenting Association
The number of association outcomes is readily countable and classifiable, provided that the detections are appropriately identified, the tracker is suitably instrumented, and the classification procedure has sufficient information on the input and output of the tracker.
We propose to annotate true objects with unique non-negative IDs. To model detectors more realistically, we consider missing detections and clutter. We simulate missing detections by excluding some of the reports from the tracker input. This could be done randomly starting from an ideal ground truth. Beyond detector failures, the objects could leave the field of view. Both situations should ideally produce the same effect at the current step: an unmatched target. However, in the event of a detector failure, the detection reappears at the next time step and the tracker should correctly match this detection with the maintained target. Conversely, when an object exits the scene, the target should be deleted from the tracker output after a predefined number of steps. To ensure a correct classification, the detection IDs should not be reused when objects leave the tracking scene.
We represent clutter reports by assigning them a detection ID of . Multiple detection reports may be annotated as clutter all sharing the detection ID. These clutter reports can be generated randomly. In this work, we consider only transient clutter. Transient clutter manifests as spurious reports that appear for a single time step and vanish in the subsequent one. Because our focus is on non-persistent clutter, it is sufficient to assign a single annotation ID of to all clutter reports. Furthermore, even in scenarios involving persistent clutter, this inherent ambiguity would not lead to misclassification, as the annotation ID remains constant.
By design, all detection IDs are strictly greater than . These IDs are transmitted to the tracker via detection reports alongside the state measurements. The detection IDs are used to instantiate targets, at which point they become annotation IDs. Neither the detection nor the annotation IDs participate in the association procedure itself; however, the annotation IDs are essential for subsequent classification.
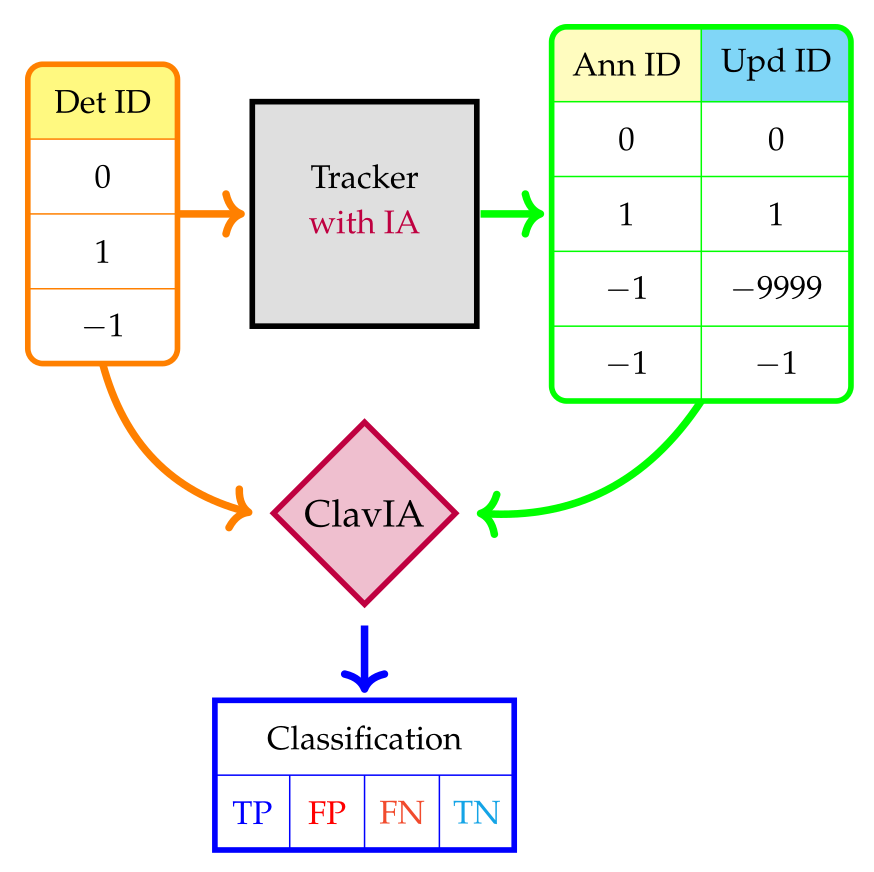
The instrumentation of the tracker includes processing the detection IDs. Upon the creation of a new target, it is assigned an annotation ID equal to the corresponding detection ID. This annotation ID is strictly preserved throughout the target’s lifetime. After each association, the target is assigned an update ID. If a target is associated, then its update ID is set to the ID of the associated detection. Ideally, the update ID is equal to the annotation ID, but this is not always guaranteed. If a target is not associated, then its update ID is assigned a special unmatched value. We denote the unmatched value by L to prevent misinterpretation as a standard update ID. By convention, we use to indicate unmatched targets. When a target is first instantiated in the tracker, the update ID is initialized to the annotation ID. The annotation and update IDs are instrumentation-only identifiers and do not interfere with the tracker’s native object identification mechanisms. We depict the data flow in Figure 1.
Once the targets are extended with annotation and update IDs, the classification procedure processes the output of the instrumented tracker on a target-by-target basis. Furthermore, since detections may be missed, the classifier must be informed about the supply of each annotation ID. This supply information is readily available because all detection IDs provided to the tracker are known. The supply condition is defined as .
The classification procedure analyzes the annotation and update IDs stored in targets according to Table 1. The table summarizes the combinations of the supply condition, annotation IDs, and update IDs. Any conditions not explicitly mentioned in the table, as well as Case 5, are impossible by construction and will cause the classification procedure to abort. The cases listed in the table represent an exhaustive set of conditions necessary for the unequivocal classification of the association outcomes. Below, we discuss the cases in Table 1 individually.
The first case represents the only true-positive (TP) outcome. In this scenario, the annotation ID is non-negative, indicating a real object as opposed to clutter. The update ID is equal to the annotation ID, confirming an accurate association outcome. Finally, the annotation ID must be present in the set of current detection IDs to satisfy the supply condition.
The second case is one of the three false-negative (FN) outcomes. Indeed, although the annotation ID is supplied to the tracker and is non-negative (i.e. real object), the update ID differs from the annotation ID. This discrepancy indicates an incorrect association; specifically, the target is erroneously matched with a detection belonging to a different real object.
Cases 3 and 4 are similar to Case 2. However, unlike the second case, the association erroneously matches the target with a clutter detection (Case 3) or fails to provide any match (Case 4). Cases 2, 3, and 4 are all classified as false negatives (FN) because the association procedure produces a faulty result despite the availability of a correct match.
Cases 5 through 8 represent scenarios involving missing detections. In these instances, the corresponding annotation ID is not supplied to the tracker, despite representing a real target. Case 5 describes an outcome that is impossible by construction: the update ID equals the annotation ID even though that ID was absent from the supplied detections. This case is included in the table primarily to maintain the sequential order of conditions within the Update-ID column.
Cases 9 through 12 represent scenarios involving clutter detections, indicated by the clutter annotation IDs (). Since individual clutter detections are not differentiated, monitoring their supply is unnecessary. Case 9 occurs when a clutter detection is provided to the tracker, but the association procedure correctly avoids matching it with any tracked targets. Case 10 represents an erroneous association between a clutter detection and a real-object target. While Case 11 is functionally identical to Case 9, it is listed separately to maintain the sequential order of the Update-ID column. Finally, Case 12 occurs when a clutter detection remains unassociated due to the correct execution of the association procedure.
In this section, we have clearly defined all components of the confusion matrix, including the traditionally challenging identification of true-negative outcomes. Within the ClavIA framework, we overcome this limitation by defining TNs exhaustively and unequivocally, as detailed in Table 1. This rigorous classification scheme ensures that no tracking state remains unaccounted for within our evaluation framework.
3.3. Limitations of ClavIA
We emphasize that ClavIA is not designed to supersede existing evaluation frameworks, such as ClearMOT, HOTA, or T-GOSPA [2,4,5]. The fundamental limitation of this approach lies in its dependence on identified detections. Although easily acquired during developmental evaluation, these detections are inherently unavailable in production scenarios, rendering the requirement restrictive. Furthermore, ClavIA necessitates the use of specially instrumented trackers. Consequently, this methodology is unsuitable for competitive tracking challenges, which typically mandate blind evaluations with black-box tracker implementations. Nonetheless, the inherent benefits of ClavIA make it a practical tool for the broader research community.
4. Thought Scenarios of the Instrumented Tracking
Before discussing ClavIA’s implementation in Section 5, we analyze several toy examples to build a deeper intuition for our classification framework. Readers may skip this section without disrupting the paper’s flow.
We consider three simple tracking examples featuring identified detections and an instrumented tracker. Specifically, we examine toy scenarios involving two time steps and two objects reported at both steps. Furthermore, we assume an initially empty tracker (i.e., prior to the arrival of the first detection reports), thereby executing only a single association procedure per scenario. In addition to counting the classified targets, we compute standard binary quality metrics such as accuracy, precision, and recall [9].
4.1. Perfect Detection Sequence
In this example, the detection sequence contains neither clutter nor missing detections. Figure 2a illustrates the outcome at the initial time step for the majority of these scenarios. By construction, the positions of the detections and targets remain identical following the first time step. If all detections are correctly associated with their corresponding targets, all targets are classified as true positives, resulting in ideal accuracy, precision, and recall values of 1. This scenario is illustrated in Figure 2b. Because the prediction step in a tracker is seldom perfect, the detections and targets are depicted with a slight spatial offset for visual clarity.
If an association error occurs, it becomes evident at the second time step. For example, if a detection remains unassociated, the tracker generates a third target for that time step, resulting in five total targets across the scenario. The newly initialized target, spawned from the unassociated detection, is classified as a true-positive (TP) outcome. However, the unmatched target is assigned an unassociated update ID (represented by ’L’ in the figures) and categorized as a false negative (Case 4 in Table 1). In this scenario, the accuracy and recall both reduce to , while the precision remains 1. This outcome is illustrated in Figure 2c.
If both detections fail to associate during the second time step, the tracker generates four targets, resulting in a total of six targets for the scenario. This outcome yields a reduced accuracy and recall of , while maintaining a precision of 1. This scenario is illustrated in Figure 2d.
Another plausible outcome in two-object tracking occurs when the targets are erroneously associated with each other’s detections (an identity switch). In this scenario, the tracker produces two targets at the second time step, both of which are categorized as false negatives (Case 2 in Table 1). Consequently, the accuracy and recall both decrease to , while precision remains 1. This scenario is illustrated in Figure 2e.
Finally, a scenario may occur where one target remains unassociated while the other is erroneously associated with the incorrect detection. In this instance, the tracker generates three targets at the second time step. This results in two false-negative associations, categorized under Cases 2 and 4 in Table 1, respectively. Consequently, the accuracy and recall decrease to , while the precision remains 1. This scenario is illustrated in Figure 2f.
4.2. Sequences with Missing Detections
Consider a scenario where one of the real objects remains undetected at the initial time step but is subsequently reported at the second time step. The system state at the first time step is depicted in Figure 3a. Consequently, the tracker maintains only a single target upon the arrival of the second set of detections. If this target is correctly associated at the second time step, the procedure yields 3 true-positive outcomes out of 3 total targets. This ideal scenario is illustrated in Figure 3b.
It remains possible for the target to become unassociated. In this scenario, the classification yields one false-negative (FN) and two true-positive (TP) outcomes, resulting in an accuracy and recall of while maintaining a precision of 1. This association failure is illustrated in Figure 3c.
In another scenario, when two real-object reports arrive at the initial time step (see Figure 2a), one of the detections may remain undetected at the second time step. In this situation, the tracker yields a total of four correct classifications only if Case 8 (TN) from Table 1 is satisfied. This ideal outcome is illustrated in Figure 4a.
If the tracker erroneously associates the single detection, the outcome yields two true positives at the initial time step and two false negatives at the second time step, resulting in a reduced recall of . This association failure is illustrated in Figure 4b.
Finally, if the tracker fails to associate either target, an additional true positive is generated at the second time step because the tracker is required to initialize a new target, resulting in a recall of . This outcome is depicted in Figure 4c.
4.3. Detection Sequence with Clutter
Consider a scenario where, in addition to two real-object detections, a clutter detection appears at the initial time step and is absent at the second time step. Consequently, the tracker receives three detection reports at the first time step and two at the second. The system state at the initial time step is illustrated in Figure 5a.
Achieving perfect accuracy in this scenario requires satisfying Cases 9 and 12 from Table 1. At the initial time step, all targets yield correct classifications (a TP via Case 1 and a TN via Case 9). At the second time step, if both real-object reports are correctly matched and the clutter target remains unassociated, Case 12 dictates a correct true-negative (TN) classification. This yields 4 true positives and 2 true negatives, resulting in ideal values of 1 for accuracy, precision, and recall. This optimal outcome is illustrated in Figure 5b.
Any mismatched or unassociated targets will result in reduced quality metrics. For example, if the clutter target is erroneously associated with one of the two detection reports, Case 10 (FP) from Table 1 occurs. In this scenario, if the remaining detection report is correctly matched with its target (Case 1, TP), the remaining target inevitably remains unassociated (Case 4, FN). Consequently, this scenario encompasses all binary classification types among the reported targets: two TPs and one TN from the initial time step, alongside one TP, one FN, and one FP from the second time step. This classification yields an accuracy of , with precision and recall both equal to . This complex outcome is illustrated in Figure 5c.
If the clutter target is erroneously associated with one of the two detection reports, while a real-object target is incorrectly associated with the remaining detection report, no correct target associations occur at the second time step (yielding two FNs and one FP). This scenario results in an accuracy of , a precision of , and a recall of . This worst-case outcome is illustrated in Figure 5d.
5. ClavIA in Open-Source Trackers
In practice, ClavIA implies modifications of the evaluated tracker. These modifications are strictly observational in nature; they are designed to probe the association result as non-invasively as possible, ensuring no interference with the underlying logic.
To demonstrate the instrumentation required by ClavIA, we surveyed several open-source trackers. The proposed framework is designed to be broadly applicable to both simple heuristic trackers, such as SORT [10], EagerMOT [11], and MCTrack [12], and to complex architectures like DeepMOT [13] and recent transformer-based models [14]. Ultimately, we selected AB3DMOT [15] for our experimental validation. This decision was driven by its architectural simplicity, its inclusion of a built-in ClearMOT evaluation module, and its established use with the widely adopted nuScenes dataset [7].
We integrated ClavIA into two open-source trackers: pure-ab-3d-mot [16] and kinematic-tracker [17]. Both trackers rely on Kalman filters and implement similar algorithms. The kinematic-tracker is designed to deliver a computationally efficient and generalized solution. In contrast, pure-ab-3d-mot was specifically adapted to demonstrate the instrumentation-related modifications within a well-established software solution. Consequently, we focus on pure-ab-3d-mot for the sake of clarity.
pure-ab-3d-mot is a simplified and refactored version of the standard 3D multiple-object tracking baseline (AB3DMOT). AB3DMOT is used as a reference tracker [15] for the nuScenes dataset [7]. The simplification involves the removal of the center-of-motion (COM) compensation module; this component does not directly affect target association, but significantly increases deployment complexity. Additionally, several structural refactoring changes were implemented within pure-ab-3d-mot. These modifications improve code clarity and maintainability without altering the underlying tracking results.
The ClavIA-specific modifications were introduced after the refactoring. We kept a protected branch without-clavia to facilitate a complete view of the instrumentation changes. Here, we briefly summarize the instrumentation changes. The Target class is extended to hold the attributes ann_id and upd_id. Within the Ab3dMot tracker class, new Target instances are created with their annotation IDs assigned in the Ab3dMot.birth() method. Furthermore, the update ID (upd_id) is updated within the Ab3dMot.update() method. In addition to these core extensions, minor tracker-specific adjustments were implemented to facilitate data transfer.
The scripts to run the tracker pure-ab-3d-mot and evaluate its output quality are consolidated within a separate package, eval-ab-3d-mot [18]. We designed the package eval-ab-3d-mot to analyze the tracker pure-ab-3d-mot according to both the ClearMOT and ClavIA methodologies on the KITTI dataset. The ClearMOT evaluation module is a refactored version from the original AB3DMOT repository [15]. Meanwhile, the ClavIA evaluation logic is encapsulated within a standalone, lightweight package, association-quality-clavia [19], to facilitate its integration into external projects.
6. Results
In order to demonstrate the utility of the proposed approach, we ran the pure-ab-3d-mot tracker on the training split of the KITTI tracking benchmark [6]. We utilized the package eval-ab-3d-mot [18] to conduct all computational experiments discussed in this work. The training subset consists of 21 scenes. In accordance with the KITTI challenge guidelines, objects within each scene are classified into three categories: car, cyclist and pedestrian. Several tracker parameters vary depending on the object category: the matching algorithm and threshold, the association metric, the minimum number of detections required for confirmation min_hits, and the maximum number of steps without a match max_age. Conversely, the Kalman-filter covariances remain constant across all categories. Keeping the covariances the same aligns well with our goals by reducing the dimensionality of the optimization space. Instead of optimizing these parameters, we intentionally apply minor perturbations to the measurement covariance in a stability study detailed in Section 6.3.
We compare ClearMOT and ClavIA evaluation methods. Although sharing a common objective, these methodologies are defined by distinct specifications and exhibit different limitations. Discrepancies make it impossible to reproduce the same numbers even in the best case scenario. The primary distinction between the two approaches lies in their input requirements. In ClearMOT, the detections remain unidentified as in real-world execution. In ClavIA, the detections must be identified. Creating anonymous detections from annotations is trivial, but doing the opposite is next to impossible.
To account for this discrepancy, we evaluate ClearMOT in two modes: first, using real detections as originally intended; and second, using ground-truth annotations with identity labels removed. The first mode enables a comparison of the methods under realistic operating conditions, without expecting strict quantitative agreement. The second configuration aims to provide a closer quantitative comparison by reducing differences in the input data. Despite the substantial methodological differences between ClearMOT and ClavIA, the qualitative conclusions obtained from both evaluation protocols remain consistent.
We opted not to compare our method against the more recent HOTA evaluation metric [5] due to practical considerations. While HOTA is largely an extension of ClearMOT, its official implementation is restricted to 2D tracking. Although ClavIA can evaluate both 2D and 3D tracking with equal ease, we chose to focus our experiments on the 3D domain for two primary reasons. Firstly, 3D tracking is arguably more important in the mobility context. Second, AB3DMOT is difficult to adapt for 2D tracking, and we want to avoid the discussion of yet another tracker.
6.1. Input by Design: Consuming Detections in ClearMOT
In the case of ClearMOT evaluator, the tracker is provided with the recommended R-CNN detections [20], as was ClearMOT designed to operate. In the case of ClavIA, the tracker processes the KITTI annotations.
The computed F1 scores are presented in Table 2. Despite the differences between ClearMOT and ClavIA, the F1 scores exhibit a similar trend: performance is highest for the car category and lowest for the pedestrian category. The scores are generally higher for ClavIA due to the higher quality of annotations compared to detections.
Reviewing the optimal parameters established in the AB3DMOT project [15], the matching algorithm is set to Hungarian for the car and cyclist categories, whereas a greedy algorithm is utilized for pedestrians. This inconsistency is unexpected and may contribute to the suboptimal performance observed in the pedestrian category. To evaluate the optimality of this configuration, we evaluated the tracker’s F1 scores across varying association thresholds. The results, obtained with instrumented association, are presented in Table 3. The data demonstrates that the optimal association threshold and matching algorithm are (, Hungarian), as opposed to the (, greedy) configuration recommended in the AB3DMOT project.
To further verify this result, we evaluated the tracker using ClearMOT with the optimal parameters derived from ClavIA (, Hungarian) and observed an improvement in the metrics (e.g., an F1 score of 0.8408 compared to 0.8292 with the recommended parameters). In contrast to ClavIA, ClearMOT performance peaks at a threshold of , yielding the highest F1 score of 0.8412 among the considered thresholds for the Hungarian algorithm. Other threshold values exhibit similar trends, as demonstrated in Table 4. Indeed, the use of greedy matching is ultimately justified, as the maximum overall F1 score is achieved using the greedy algorithm at a threshold of .
6.2. Ingesting Annotations in ClearMOT
In order to exclude the effect of detector quality, we performed a ClearMOT evaluation of the AB3DMOT tracker utilizing annotations. This comparison is closest to the ClavIA methodology because the tracker receives the same input. We present the ClearMOT F1 scores obtained using annotations in Table 5. As expected, the values are much closer to the corresponding ClavIA results (Table 3). Similar to ClavIA, the annotation-based ClearMOT scores demonstrate a slight advantage of the Hungarian matching algorithm over the greedy algorithm. Indeed, greedy matching may outperform the Hungarian approach when detection quality is poor.
Two primary differences remain. First, ClearMOT uses a probabilistic association procedure prone to numerical instability, whereas ClavIA establishes associations unequivocally using discrete IDs. Second, concerning target processing, ClavIA analyzes targets directly within the tracker, whereas ClearMOT uses the tracker’s output, which is withheld pending target confirmation.
In summary, while ClavIA is not intended as a direct replacement for ClearMOT, our computational experiments demonstrate that both frameworks yield qualitatively comparable performance patterns.
6.3. Sensitivity Analysis of F1 Scores
In this section, we analyze the stability of the previously reported F1 scores. To evaluate the sensitivity of the evaluation, we introduce minor perturbations to the measurement-noise covariance within the Kalman filters, generating slight variations in the target-state time series. These variations affect the scores, allowing us to assess the robustness of the tracking evaluation.
In the original AB-3D-MOT tracker, the measurement covariance is fixed to an identity matrix across all object categories [15]. We maintain a diagonal measurement covariance but scale it by factors of and . These scaling factors correspond to a 1% decrease and increase in the standard deviation, respectively. For the remaining tracking parameters, we adopt the category-specific optimal values established in the original publication [15].
The resulting differences in F1 scores are summarized in Table 6. No variations are observed in the cyclist category, whereas for cars and pedestrians, the differences manifest only in the fourth or fifth decimal place. The small magnitude of these variations indicates the stability of both the ClavIA and ClearMOT evaluation methods.
7. Future Directions for Instrumented Association
In Section 6, we demonstrated the baseline application of ClavIA by supplying the instrumented tracker directly with annotations. However, utilizing annotations directly leaves several real-world scenarios untested. Specifically, this approach omits evaluations of clutter, missing detections, and varying detector-noise levels. To rigorously evaluate a tracker’s robustness against these detector shortcomings, one could systematically generate non-ideal, yet identified, synthetic detections.
We outline two possibilities for generating identified detections of controllable quality.
The first possibility involves starting with ground-truth annotations and introducing detector shortcomings to them. Indeed, random deviations can be easily added to the coordinates, sizes, and orientations of the annotated cuboids. Similarly, missing detections can be generated by randomly dropping specific annotations. Finally, it is straightforward to randomly generate cuboids within the field of view and assign them an annotation ID of .
A second approach to rigorously testing trackers is to generate ground-truth annotations using an analytical model and then randomly introduce simulated detector errors. Compared to real-world annotations, this method is advantageous because time derivatives are known precisely to any order. This is particularly useful for thoroughly assessing the precision of the tracker output [12] when derived variables, such as velocities and accelerations, are of interest. However, the primary challenge of this approach lies in generating analytical models that accurately reflect relevant end-use scenarios.
In addition to its role in evaluation, ClavIA instrumentation could be useful in other applications. Within the CAPACITY project [21], we used the ClavIA-enabled tracker [17] in a semi-automatic annotation tool. In this application, ClavIA verified the annotation quality by providing information on the established target-annotation matches.
8. Conclusion
We presented ClavIA, a method for evaluating tracker association quality. The proposed approach relies on a targeted modification of the tracking algorithm, enabling direct inspection of the association procedure’s results. Ultimately, this allows for a binary classification of the tracker output. The simplicity of the proposed method makes it widely applicable across a range of tracking applications, with the optimization of tracker parameters being the most straightforward use case. To demonstrate its practical utility, we instrumented the well-known AB3DMOT tracker—the baseline for the nuScenes dataset—and evaluated its performance on the KITTI dataset.
Author Contributions
Conceptualization, P.K.; methodology, P.K.; software, P.K.; validation, P.J.R., and A.M.A.; formal analysis, P.J.R., and A.M.A.; investigation, P.K.; resources, N.N.A.; data curation, P.K.; writing—original draft preparation, P.K.; writing—review and editing, N.N.A.; visualization, P.K.; supervision, N.N.A.; project administration, N.N.A.; funding acquisition, N.N.A. All authors have read and agreed to the published version of the manuscript.
Funding
This work was partially supported by the Basque Government under the project CAPACITY — Research on High-Capacity Technologies for the Railway Sector (Project No. ZE-2024/00012), funded through the HAZITEK 2024 program
Institutional Review Board Statement
Not applicable.
Informed Consent Statement
Not applicable.
Data Availability Statement
The code used in this work, together with the input data, is available at https://github.com/kovalp/ and via the PyPI package registry [16,17,18,19].
Conflicts of Interest
The authors declare that they have no conflict of interest.
Abbreviations
The following abbreviations are used in this manuscript:
| AB3DMOT | A baseline 3 Dimensional Multiple-Object Tracker |
| CAF | Construcciones y Auxiliar de Ferrocarriles |
| ClavIA | Classification via Instrumented Association |
| ClearMOT | CLassification of Events, Activities, and Relationships Multiple-Object tracking |
| HOTA | Higher Order Tracking Accuracy |
| KITTI | Karlsruhe Institute of Technology and Toyota Technological Institute dataset |
| MDPI | Multidisciplinary Digital Publishing Institute |
| T-GOSPA | Trajectory-Generalized Optimal Sub-Pattern Assignment |
| TP, FP, FN, TN | true positive, false positive, false negative, true negative |
References
- Rahmathullah, A.S.; García-Fernández, A.F.; Svensson, L. Generalized optimal sub-pattern assignment metric. In Proceedings of the 2017 20th International Conference on Information Fusion (Fusion), 2017; pp. 1–8. [Google Scholar] [CrossRef]
- Garcá-Fernández, A.F.; Gu, J.; Svensson, L.; Xia, Y.; Krejčí, J.; Kost, O.; Straka, O. GOSPA and T-GOSPA quasi-metrics for evaluation of multi-object tracking algorithms. IEEE Trans. Aerosp. Electron. Syst. 2026, 1–13. [Google Scholar] [CrossRef]
- Stiefelhagen, R.; Bernardin, K.; Bowers, R.; Garofolo, J.; Mostefa, D.; Soundararajan, P. The CLEAR 2006 Evaluation. In Proceedings of the Multimodal Technologies for Perception of Humans; Stiefelhagen, R., Garofolo, J., Eds.; Berlin, Heidelberg, 2007; pp. 1–44. [Google Scholar]
- Bernardin, K.; Stiefelhagen, R. Evaluating Multiple Object Tracking Performance: The CLEAR MOT Metrics. EURASIP J. Image Video Process. 2008, 2008, 1–10. [Google Scholar] [CrossRef]
- Luiten, J.; Ošep, A.; Dendorfer, P.; Torr, P.; Geiger, A.; Leal-Taixé, L.; Leibe, B. HOTA: A Higher Order Metric for Evaluating Multi-object Tracking. Int. J. Comput. Vis. 2021, 129, 548–578. [Google Scholar] [CrossRef] [PubMed]
- Geiger, A.; Lenz, P.; Urtasun, R. Are we ready for autonomous driving? The KITTI vision benchmark suite. In Proceedings of the 2012 IEEE Conference on Computer Vision and Pattern Recognition, 2012; pp. 3354–3361. [Google Scholar] [CrossRef]
- Caesar, H.; Bankiti, V.; Lang, A.H.; Vora, S.; Liong, V.E.; Xu, Q.; Krishnan, A.; Pan, Y.; Baldan, G.; Beijbom, O. nuScenes: A Multimodal Dataset for Autonomous Driving. In Proceedings of the 2020 IEEE/CVF Conference on Computer Vision and Pattern Recognition (CVPR), Los Alamitos, CA, USA, 2020; pp. 11618–11628. [Google Scholar] [CrossRef]
- Sun, P.; Kretzschmar, H.; Dotiwalla, X.; Chouard, A.; Patnaik, V.; Tsui, P.; Guo, J.; Zhou, Y.; Chai, Y.; Caine, B.; et al. Scalability in Perception for Autonomous Driving: Waymo Open Dataset. In Proceedings of the 2020 IEEE/CVF Conference on Computer Vision and Pattern Recognition (CVPR), 2020; pp. 2443–2451. [Google Scholar] [CrossRef]
- Foody, G.M. Challenges in the real world use of classification accuracy metrics: From recall and precision to the Matthews correlation coefficient. PLoS ONE 2023, 18, e0291908. [Google Scholar] [CrossRef]
- Wojke, N.; Bewley, A.; Paulus, D. Simple online and realtime tracking with a deep association metric. In Proceedings of the 2017 IEEE International Conference on Image Processing (ICIP), 2017; pp. 3645–3649. [Google Scholar] [CrossRef]
- Kim, A.; Ošep, A.; Leal-Taixé, L. EagerMOT: 3D Multi-Object Tracking via Sensor Fusion. In Proceedings of the 2021 IEEE International Conference on Robotics and Automation (ICRA), 2021; pp. 11315–11321. [Google Scholar] [CrossRef]
- Wang, X.; Qi, S.; Zhao, J.; Zhou, H.; Zhang, S.; Wang, G.; Tu, K.; Guo, S.; Zhao, J.; Li, J.; et al. MCTrack: A Unified 3D Multi-Object Tracking Framework for Autonomous Driving. arXiv 2024, arXiv:cs. [Google Scholar]
- Xu, Y.; Ošep, A.; Ban, Y.; Horaud, R.; Leal-Taixé, L.; Alameda-Pineda, X. How to Train Your Deep Multi-Object Tracker. In Proceedings of the 2020 IEEE/CVF Conference on Computer Vision and Pattern Recognition (CVPR), 2020; pp. 6786–6795. [Google Scholar] [CrossRef]
- Khoshnevis, S.A.; Amirkhani, A. Tracking with attention: A review of transformer-based object tracking. Eng. Sci. Technol. An. Int. J. 2026, 73, 102263. [Google Scholar] [CrossRef]
- Weng, X.; Wang, J.; Held, D.; Kitani, K. 3D Multi-Object Tracking: A Baseline and New Evaluation Metrics. In Proceedings of the 2020 IEEE/RSJ International Conference on Intelligent Robots and Systems (IROS), 2020; pp. 10359–10366. [Google Scholar] [CrossRef]
- Koval, P. Pure AB3DMOT: a base of 3D multiple-object tracking. 2025. Available online: https://pypi.org/project/pure-ab-3d-mot/ https://github.com/kovalp/pure-ab-3d-mot.
- Koval, P. Kinematic tracker: yet another generalized tracker based on kinematic Kalman filters. 2025. Available online: https://pypi.org/project/kinematic-tracker/.
- Koval, P. Eval AB3DMOT: evaluation part of the original AB3DMOT. 2025. Available online: https://pypi.org/project/eval-ab-3d-mot/ https://github.com/kovalp/eval-ab-3d-mot.
- Koval, P. Python implementation of the ClavIA classifier. 2025. Available online: https://pypi.org/project/association-quality-clavia/ https://github.com/kovalp/association-quality-clavia.
- Shi, S.; Wang, X.; Li, H. PointRCNN: 3D Object Proposal Generation and Detection From Point Cloud. In Proceedings of the 2019 IEEE/CVF Conference on Computer Vision and Pattern Recognition (CVPR), 2019; pp. 770–779. [Google Scholar] [CrossRef]
- CAPACITY - Research on High Capacity Technologies for the Railway Sector / Project no. ZE-2024/00012. 2025. Available online: https://www.cafmobility.com/en/press-room/capacity-en/.
- SYNERGIES CCAM - Horizon Europe program of the European Union, under grant agreement 101146542. 2026. Available online: https://synergies-ccam.eu/the-project/.
| 1 | We prefer the term target over track because the word track implies a sequence (time series) of objects to be processed, while most trackers store the characteristics only at the current time step. |
Figure 1.
Classification via instrumented association (ClavIA) for tracking evaluation. The ClavIA module processes the dedicated IDs (detection, annotation and update) from current detections and targets. We classify each target using a decision tree defined in Table 1. The illustrated IDs result in true-positive for the first two and true-negative classification for the latter two targets, respectively. By construction, every detection ID is present among update IDs. By design, all annotation IDs are constrained to values greater than .
Figure 1.
Classification via instrumented association (ClavIA) for tracking evaluation. The ClavIA module processes the dedicated IDs (detection, annotation and update) from current detections and targets. We classify each target using a decision tree defined in Table 1. The illustrated IDs result in true-positive for the first two and true-negative classification for the latter two targets, respectively. By construction, every detection ID is present among update IDs. By design, all annotation IDs are constrained to values greater than .
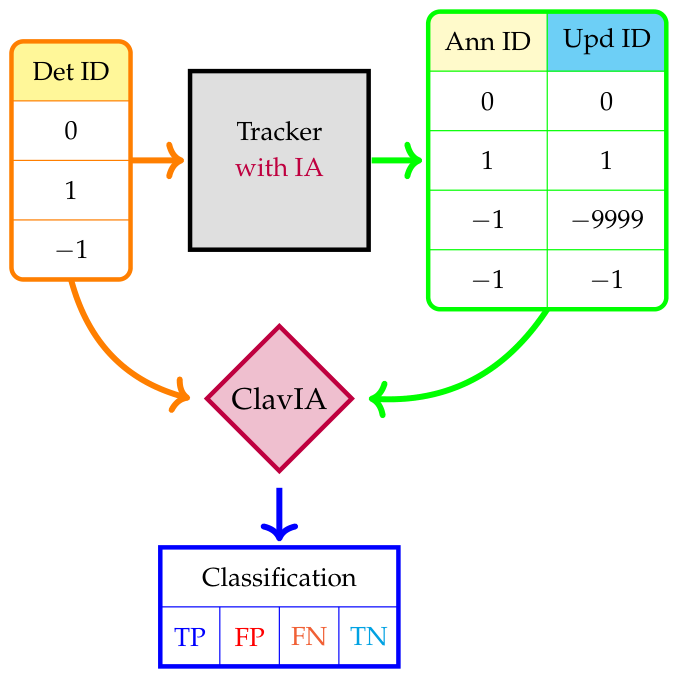
Figure 2.
Detection-target states in different scenarios under perfect detection conditions. We show detections as gray squares with annotation IDs inside. Targets are depicted as color-coded rounded rectangles; annotation IDs are located at the bottom within a ’A’-style inset, while the update IDs are enclosed in a ’U’-style inset at the upper-right corner. Targets with true positive associations are colored blue. False negatives due to Cases 2 and 4 in Table 1 are colored orange and red, respectively.
Figure 2.
Detection-target states in different scenarios under perfect detection conditions. We show detections as gray squares with annotation IDs inside. Targets are depicted as color-coded rounded rectangles; annotation IDs are located at the bottom within a ’A’-style inset, while the update IDs are enclosed in a ’U’-style inset at the upper-right corner. Targets with true positive associations are colored blue. False negatives due to Cases 2 and 4 in Table 1 are colored orange and red, respectively.
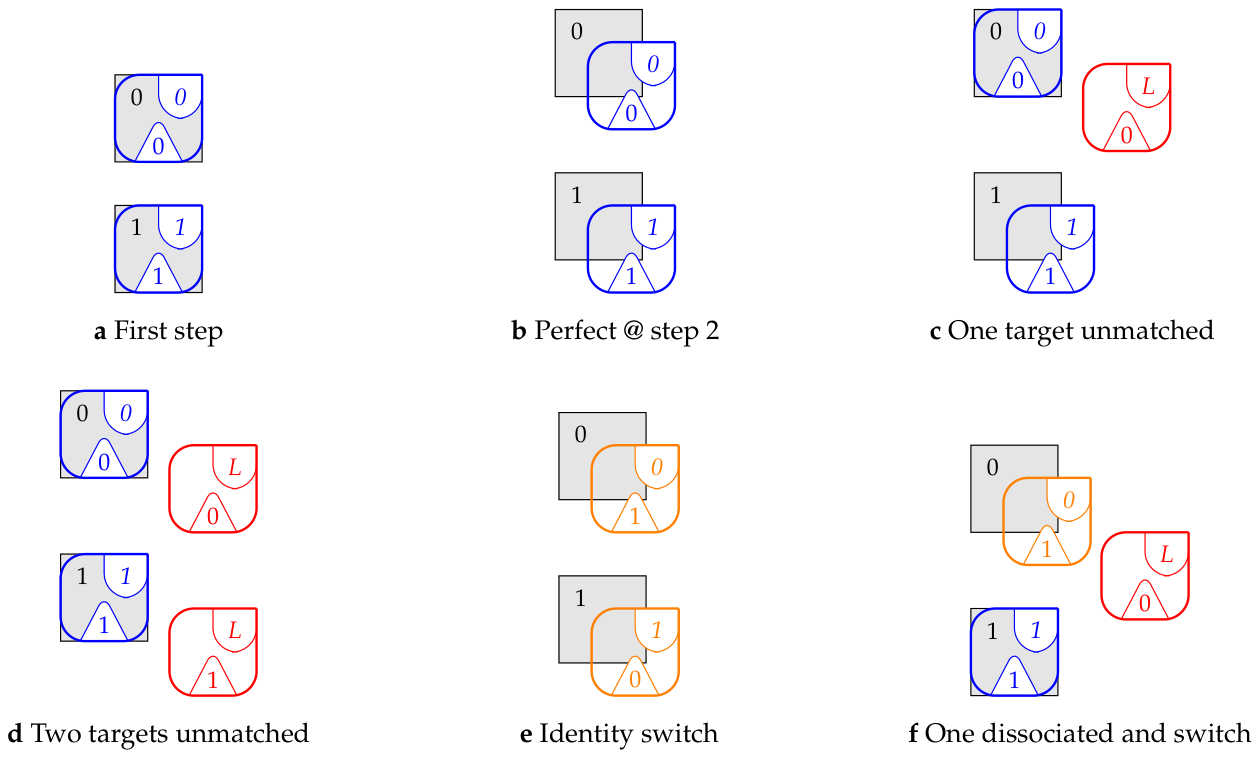
Figure 3.
Detection-target states where a single detection is missing at the initial time step (panel a). An ideal association is achieved when both detections are properly matched at the second time step (panel b). If the single target becomes unassociated, a single false-negative outcome occurs at the second time step (panel c).
Figure 3.
Detection-target states where a single detection is missing at the initial time step (panel a). An ideal association is achieved when both detections are properly matched at the second time step (panel b). If the single target becomes unassociated, a single false-negative outcome occurs at the second time step (panel c).
Figure 4.
Detection-target states when a detection is missing at the second time step. The ideal outcome at the second time step is illustrated in panel (a). If the tracker erroneously associates one of its targets, two false-negative outcomes occur at the second time step (panel b). If both targets become unassociated, it yields an initial true-positive outcome at the second time step (panel c).
Figure 4.
Detection-target states when a detection is missing at the second time step. The ideal outcome at the second time step is illustrated in panel (a). If the tracker erroneously associates one of its targets, two false-negative outcomes occur at the second time step (panel b). If both targets become unassociated, it yields an initial true-positive outcome at the second time step (panel c).
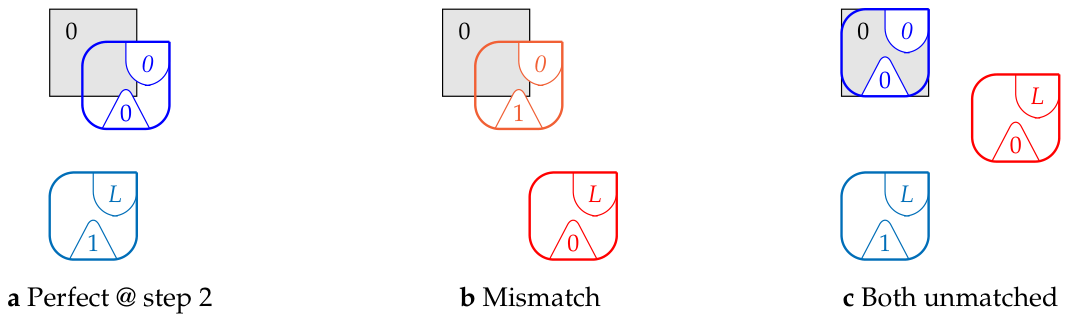
Figure 5.
Detection-target states featuring a clutter detection at the first time step.
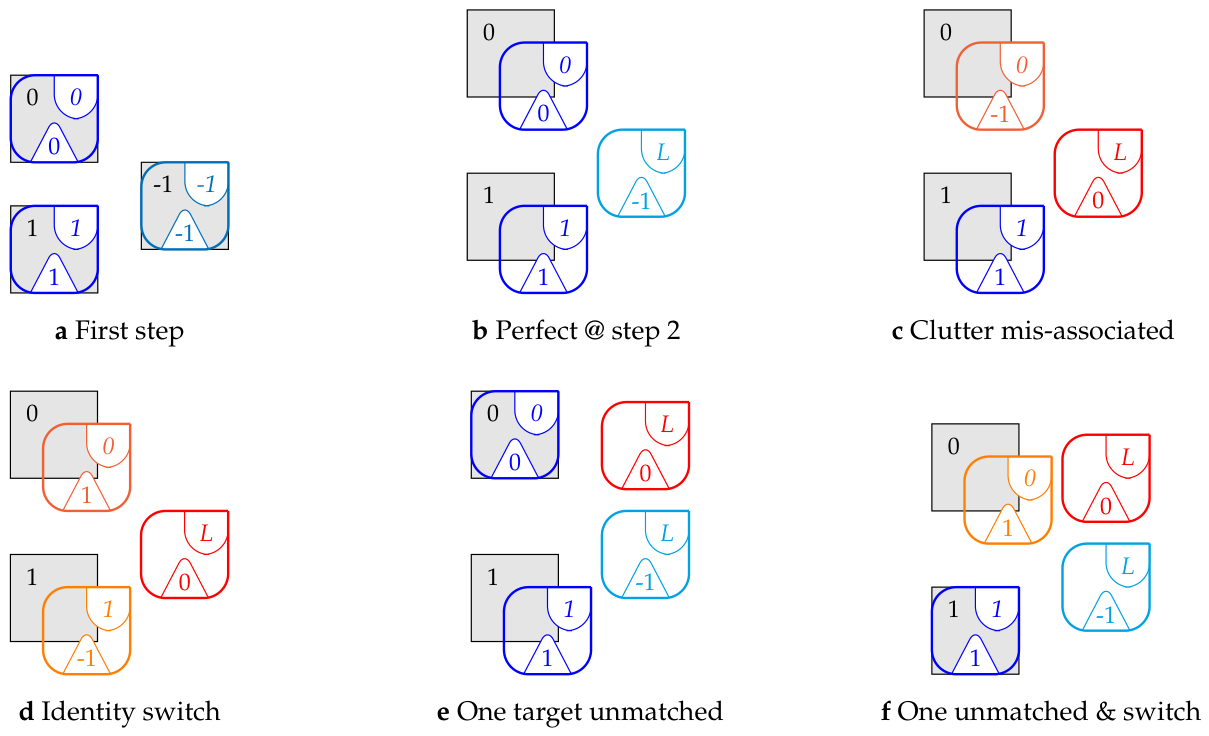

Table 1.
Classification of the instrumented-tracker output. The twelve cases exhaust all relevant combinations of the supply state and conditions on the annotation and update IDs. The classification labels true-positive (TP), true-negative (TN), false-positive (FP) and false-negative (FN) are given in the last column. The fifth case is marked invalid because it is impossible by construction, although it should be listed in the table to maintain the order in the column of update IDs. Any condition not listed in the table indicates an implementation error. See the main text for a more detailed explanation.
Table 1.
Classification of the instrumented-tracker output. The twelve cases exhaust all relevant combinations of the supply state and conditions on the annotation and update IDs. The classification labels true-positive (TP), true-negative (TN), false-positive (FP) and false-negative (FN) are given in the last column. The fifth case is marked invalid because it is impossible by construction, although it should be listed in the table to maintain the order in the column of update IDs. Any condition not listed in the table indicates an implementation error. See the main text for a more detailed explanation.
| Case | Ann ID | Supply | Update ID | Class |
|---|---|---|---|---|
| 1 | yes | = Ann ID | TP | |
| 2 | ≠ Ann ID & | FN | ||
| 3 | FN | |||
| 4 | FN | |||
| 5 | no | = Ann ID | invalid | |
| 6 | ≠ Ann ID & | FP | ||
| 7 | FP | |||
| 8 | TN | |||
| 9 | irrelevant | = Ann ID | TN | |
| 10 | ≠ Ann ID & | FP | ||
| 11 | TN | |||
| 12 | TN |
Table 2.
F1 scores of the pure-ab-3d-mot tracker on the KITTI training split.
| Category | ClavIA | ClearMOT |
|---|---|---|
| Car | 0.9989 | 0.9167 |
| Cyclist | 0.9969 | 0.8390 |
| Pedestrian | 0.9461 | 0.8292 |
Table 3.
F1 scores obtained with ClavIA and the pure-ab-3d-mot tracker on pedestrians within KITTI training split.
Table 3.
F1 scores obtained with ClavIA and the pure-ab-3d-mot tracker on pedestrians within KITTI training split.
| Threshold | Greedy | Hungarian |
|---|---|---|
| 0.9219 | 0.9404 | |
| 0.9273 | 0.9625 | |
| 0.9461 | 0.9786 | |
| 0.9502 | 0.9830 | |
| 0.9477 | 0.9803 | |
| 0.9464 | 0.9791 |
Table 4.
F1 scores achieved by the pure-ab-3d-mot tracker for the pedestrian category on the KITTI training split, using R-CNN detections as input and evaluated with the ClearMOT framework.
Table 4.
F1 scores achieved by the pure-ab-3d-mot tracker for the pedestrian category on the KITTI training split, using R-CNN detections as input and evaluated with the ClearMOT framework.
| Threshold | Greedy | Hungarian |
|---|---|---|
| 0.8047 | 0.8048 | |
| 0.8165 | 0.8127 | |
| 0.8292 | 0.8303 | |
| 0.8422 | 0.8408 | |
| 0.8408 | 0.8412 | |
| 0.8286 | 0.8368 |
Table 5.
Pedestrian F1 scores for the pure-ab-3d-mot tracker, utilizing KITTI annotations and evaluated via ClearMOT.
Table 5.
Pedestrian F1 scores for the pure-ab-3d-mot tracker, utilizing KITTI annotations and evaluated via ClearMOT.
| Threshold | Greedy | Hungarian |
|---|---|---|
| 0.9382 | 0.9409 | |
| 0.9556 | 0.9576 | |
| 0.9718 | 0.9723 | |
| 0.9742 | 0.9747 | |
| 0.9798 | 0.9804 | |
| 0.9799 | 0.9804 |
Table 6.
Sensitivity analysis of the tracking evaluation: Variation in F1 scores resulting from a 1% change to the measurement noise standard deviation of the Kalman filters.
Table 6.
Sensitivity analysis of the tracking evaluation: Variation in F1 scores resulting from a 1% change to the measurement noise standard deviation of the Kalman filters.
| Category | ClavIA | ClearMOT | |
|---|---|---|---|
| @ detections | @ annotations | ||
| Car | 0.000028 | 0.000016 | 0.000017 |
| Cyclist | 0.000000 | 0.000000 | 0.000000 |
| Pedestrian | 0.000000 | 0.000157 | 0.000084 |
Disclaimer/Publisher’s Note: The statements, opinions and data contained in all publications are solely those of the individual author(s) and contributor(s) and not of MDPI and/or the editor(s). MDPI and/or the editor(s) disclaim responsibility for any injury to people or property resulting from any ideas, methods, instructions or products referred to in the content. |
© 2026 by the authors. Licensee MDPI, Basel, Switzerland. This article is an open access article distributed under the terms and conditions of the Creative Commons Attribution (CC BY) license (http://creativecommons.org/licenses/by/4.0/).
Copyright: This open access article is published under a Creative Commons CC BY 4.0 license, which permit the free download, distribution, and reuse, provided that the author and preprint are cited in any reuse.