

Submitted:
27 July 2026
Posted:
28 July 2026
You are already at the latest version
Abstract
This study presents a data-driven Digital Twin framework designed to optimize closed-loop Adaptive Cruise Control (ACC) operational parameters for eco-driving without modifying electronic control unit (ECU) firmware. High-frequency telematics data (OBD-II and GPS) were recorded from a production vehicle over an 11.57 km test corridor to engineer and calibrate a virtual Digital Twin in PTV Vissim using Wiedemann 99 car-following logic. The validated model demonstrated high empirical fidelity, achieving a mean velocity error of 2.84 km/h, a GEH statistic of 2.67, and an absolute fuel consumption variance of just 0.01 L/100 km. An iterative parametric optimization (~100 simulation runs) was executed to tune acceleration limits, convergence time constants, and target velocity bounds while maintaining strict safety constraints. The optimized Eco configuration achieved a 12% reduction in fuel consumption (4.91 to 4.33 L/100 km) alongside a 14% increase in trip duration (893 to 1019 s). Bivariate state-space analysis confirmed the complete elimination of high-intensity accelerations and a 0.48 percentage point reduction in hard braking. The framework serves as an algorithmic decision support tool for energy-aware fleet management and adaptive vehicle control.
Keywords:
digital twin
; decision support systems
; adaptive cruise control
; telematics processing
; ptv vissim
; microscale simulation
1. Introduction
Addressing global warming and strict decarbonization targets in the transport sector relies heavily on a multi-layered approach involving alternative vehicle powertrains (e.g., EVs and PHEVs [1,2,3]), intelligent urban mobility management via Vehicle-to-Everything (V2X) connectivity [4,5], and optimized vehicle-level longitudinal control. Among these, Advanced Driver Assistance Systems (ADAS)—particularly Adaptive Cruise Control (ACC)—play a key role in improving energy efficiency across all propulsion types, from conventional internal combustion engines to fully electric powertrains [6,7]. Quantifying the impact of Advanced Driver Assistance Systems (ADAS) on vehicle energy consumption and exhaust emissions represents a core challenge in modern automotive and transportation engineering [8,9]. Among longitudinal control systems, Adaptive Cruise Control (ACC) is widely deployed in commercial passenger vehicles to maintain driver-selected velocities and safe headway gaps using radar, LiDAR, or vision-based sensors [10,11]. However, factory ACC control loops are predominantly calibrated by Original Equipment Manufacturers (OEMs) to maximize passenger comfort, acceleration responsiveness, and lane capacity [12,13]. Consequently, aggressive speed convergence strategies and frequent transient acceleration shifts often induce elevated engine loads, leading to sub-optimal volumetric fuel efficiency during real-world driving cycles [14,15].
To mitigate these inefficiencies, substantial research has been devoted to Eco-Driving Adaptive Cruise Control (Eco-ACC) strategies [16,17,18]. In existing literature, energy-aware control architectures primarily rely on Model Predictive Control (MPC), dynamic programming, or reinforcement learning algorithms [19,20]. While these methods achieve theoretical fuel savings by anticipating downstream speed profiles and constraining jerk, their practical deployment faces severe engineering constraints. Most advanced control strategies require direct modification or replacement of the vehicle’s low-level Electronic Control Unit (ECU) firmware [21,22]. Furthermore, many Eco-ACC frameworks demand continuous real-time communication via Vehicle-to-Everything (V2X) infrastructure or Signal Phase and Timing (SPaT) data, which remain unavailable in most current road networks [23,24]. Thus, there is a clear practical necessity for non-invasive optimization strategies that extract energy reductions directly from factory-installed, closed-source ACC systems without altering underlying controller software.
Evaluating and optimizing vehicle control strategies across heterogeneous traffic environments requires robust testing platforms [25,26]. While physical road trials provide critical baseline telematics, conducting iterative parameter evaluations on public roads introduces significant financial costs, safety risks, and unrepeatable traffic conditions [27,28]. To overcome these operational limits, the Digital Twin (DT) concept has emerged as an effective computational paradigm in intelligent transportation systems [29,30]. In microscale vehicle modeling, a Digital Twin acts as a validated virtual counterpart of a physical asset, continuously driven by real-world telemetry time-series [31,32]. By combining On-Board Diagnostics (OBD-II) stream measurements—such as instantaneous engine speed, vehicle velocity, and mass fuel rates—with Global Positioning System (GPS) spatial trajectories, a vehicle Digital Twin can replicate transient engine loads and car-following interactions within microsimulation software like PTV Vissim [33,34].
Despite extensive research in car-following physics and traffic microsimulation, a noticeable gap remains in literature regarding the systematic calibration of psycho-physical driver models (e.g., Wiedemann 99) using high-frequency, real-world OBD telemetry to optimize standard production ACC systems [35,36]. Existing studies rarely isolate the internal operational parameters of factory-installed ACC controllers—such as target velocity distributions, maximum longitudinal acceleration bounds, and speed convergence time constants—to evaluate their specific trade-offs regarding volumetric fuel consumption and trip execution times [37,38].
To bridge this operational gap, this study proposes a data-driven Digital Twin methodology to optimize closed-loop factory ACC parameters within the PTV Vissim microsimulation engine. The primary objective is to achieve a measurable reduction in volumetric fuel consumption strictly by re-parameterizing the existing longitudinal control boundaries, completely bypassing the need for custom ECU firmware overrides or exogenous control loops. The Digital Twin was engineered and validated using synchronous 1 Hz OBD-II diagnostic telemetry and GPS position logging gathered from a production passenger vehicle across an 11.57 km mixed urban-suburban test corridor.
The primary scientific contribution of this work is demonstrating that treating factory ACC logic as a constrained parametric search space within a validated Digital Twin yields quantifiable eco-driving benefits. This provides transport operators, fleet managers, and automotive engineers with an empirical, non-invasive decision support framework to implement route-specific eco-driving configurations on standard production vehicles.
2. Materials and Methods
The computational workflow integrates empirical vehicle telematics with microscale traffic simulation to develop a Digital Twin for multi-parameter optimization without altering physical vehicle software. The methodology consists of five phases:
- Real-world diagnostic data acquisition via On-Board Diagnostics (OBD-II) and Global Positioning System (GPS) telematics.
- Spatial and operational network modeling of the testing corridor within the PTV Vissim simulation engine.
- Calibration and validation of the virtual vehicle model using psycho-physical car-following parameters.
- Iterative multi-parameter optimization within a virtual testing environment.
- Comparative quantitative evaluation of transient vehicle dynamics and volumetric fuel consumption.
2.1. Geographic Test Corridor and Boundary Conditions
Empirical data collection was conducted on a dual-direction roadway segment spanning the southern sector of Rzeszów and the Boguchwała municipality. The physical trajectory originated at Podkarpackia Street (Rzeszów), extended through Boguchwała and Lutoryż, executed a loop sequence near the local rail infrastructure, and returned via the identical route to the initial node. The total baseline distance of the corridor was 11.57 km.
The selected spatial corridor contains a heterogeneous operational layout, integrating mixed urban and suburban road classifications. The link architecture features signalized intersections, channelized roundabouts, and uninterrupted suburban stretches characterized by higher free-flow velocities. This geometric diversity forces the closed-source factory ACC system into varied longitudinal operational phases, including:
- Free-flow cruising at target velocities;
- Transient car-following deceleration and acceleration phases dictated by leading vehicles;
- Complete deceleration to standstill governed by external traffic control devices.
2.2. Vehicle Telematics Architecture and Data Acquisition
The empirical platform was a passenger car powered by a 2.0 TDI diesel engine (140 kW, internal code: DFHA) paired with a 7-speed dual-clutch transmission (DSG DQ381) and front-wheel drive (FWD) (Figure 1). Longitudinal control was maintained by the factory ACC system. To ensure reproducibility, baseline ACC targets (cruise speed and gap settings) remained fixed during all physical test runs.
Data were collected from the vehicle’s Controller Area Network (CAN bus) using a high-frequency OBD-II interface and a dedicated GPS receiver at a synchronous sampling frequency of 1 Hz. The telemetry vector Tt at second t is expressed as:
Where denotes instantaneous vehicle velocity (km/h), nt represents engine rotational speed (rpm), is the volumetric fuel consumption rate (L/100 km), at represents longitudinal acceleration (m/s2), and ϕt, λt correspond to the geographic coordinates (latitude and longitude) derived from the telematics unit.
2.3. Digital Twin Geometric and Operational Virtualization
The Digital Twin spatial environment was constructed in PTV Vissim using cartographic layers and spatial trajectories recorded during field tests (Figure 2). Network virtualization required:
- Link and connector geometries matching lane configurations and intersection layouts;
- Placement of traffic signals and speed zones;
- Traffic volume distributions from field counts to replicate background traffic interactions.
Vehicle behavior within the simulation was governed by the Wiedemann 99 psycho-physical car-following model, whose ten parameters (CC0–CC9) dictate longitudinal control during car-following interactions.
2.4. Microscale Model Calibration and Mathematical Validation
The simulation model was calibrated by adjusting parameters to minimize residuals between simulated outputs and empirical OBD/GPS time-series data. Calibration targets included speed profiles, acceleration envelopes, trip duration, and fuel consumption.
Macroscale traffic consistency was evaluated using the GEH statistic:
Where M is the traffic flow rate generated by the microscale simulation model (825 vehicles/h), and C represents the empirical baseline flow rate observed during the real-world trials (750 vehicles/h).
The resulting GEH value of 2.67 is below the standard validation threshold of 5.0, confirming representative background traffic conditions. The microscopic validation parameters comparing the baseline OBD telemetry streams against the calibrated Digital Twin outputs are detailed in Table 1.
The comparative data validates the high fidelity of the Digital Twin architecture. The mean velocity variance was bounded to 2.84 km/h, and the net trip duration delta was limited to 5 s. Crucially, the volumetric fuel consumption model exhibited an absolute variance of just 0.01 L/100 km relative to the physical OBD data streams, proving the framework’s capacity to serve as a reliable platform for parametric optimization.
2.5. Parametric Optimization Framework
The validated Digital Twin was used to evaluate eco-driving parameter configurations. The goal was to minimize volumetric fuel consumption (L/100 km) without introducing unacceptable delays in travel time.
The parametric search space was bounded to isolate parameters governing target cruise velocities, maximum acceleration rates, and convergence time constants within the vehicle follow-logic. Safety-critical parameters—specifically the standstill safety distance (acc_StandSafDist), minimum time gap (acc_MinGapTime), and comfortable deceleration limits (acc_a_s)—were explicitly locked to maintain strict safety standards.
Approximately 100 simulation runs were conducted to map the trade-off along a Pareto front between fuel efficiency and travel time. The optimized configuration is compared against the factory baseline in Table 2.
3. Results
The empirical evaluation of the data-driven Digital Twin framework centers on analyzing changes in transient vehicle dynamics and energetic efficiency metrics caused by modifying the closed-loop parameters of the ACC system. The following sub-sections provide a comparative analysis of the baseline empirical run (OBD), the validated model, and the optimized Eco configuration.
3.1. Kinematic Profile and Longitudinal Acceleration Analysis
The transient longitudinal velocity profiles and corresponding acceleration vectors across a continuous 1000 s operational window are detailed in Figure 3.
As illustrated in Figure 3, the validated model tracks the behavioral trajectory of the empirical OBD test run, capturing the stochastic velocity transitions dictated by the test route’s geometry and traffic conditions. In contrast, the Eco configuration exhibits lower peak velocities, which matches the reduced boundaries set for the target cruise speed distribution (v_med = 48.0 km/h, v_max = 58.0 km/h).
Crucially, the transient acceleration graph shows a significant dampening of acceleration amplitudes for the Eco model. The acceleration profile for the Eco configuration stabilizes near 0.0 m/s2 for extended periods. This behavior occurs because the speed convergence time constant (acc_tau_cc) was extended from 3.0 s to 5.0 s and the maximum acceleration limit (acc_a_cc_max) was reduced to 1.2 m/s2. These changes prevent the aggressive throttle adjustments seen in the baseline OBD telemetry.
3.2. Bivariate Velocity-Acceleration Density Profiles
To assess the vehicle’s dynamic behavior across its entire operational envelope, the joint probability distributions are mapped into a two-dimensional v–a state-space. Figure 4 illustrates the bivariate sample density distribution, where the color scale indicates the percentage share of total operational time steps within specific velocity and acceleration ranges.
The empirical OBD dataset displays a wide distribution across the v-a space, reflecting the varied acceleration and braking adjustments typical of human drivers managing standard ACC systems under real-world conditions. While the validated model retains a similar distribution shape, it exhibits less variance at extreme values.
The Eco configuration shows a structural shift in its operational density. The primary cluster of data points concentrates at lower velocity intervals (30–50 km/h), and the spread along the acceleration axis (y-axis) contracts sharply. High-intensity acceleration states are eliminated, and high-intensity deceleration states are significantly reduced. This compression proves that the optimized parameters restrict the vehicle’s operation to steady-state cruise phases, minimizing energy dissipation from frequent, unnecessary transitions between throttle and braking systems.
3.3. Statistical Analysis of Deceleration Profiles
To evaluate the impact of parameter tuning on braking dynamics, the time-series deceleration data steps are isolated and analyzed using a threshold of -1.5 m/s2 to identify strong braking events. The deceleration distribution across all three models is presented in Figure 5.
The dot-plot distribution in Figure 5 confirms that the baseline OBD run exhibits the widest deceleration spread, including multiple hard braking events dropping below -3.0 m/s2. The validated model closely replicates this overall spread, capturing some extreme braking behaviors caused by background traffic interactions.
In the Eco configuration, the density of deceleration data shifts toward lower values closer to zero. The proportion of data points crossing the -1.5 m/s2 hard-braking threshold drops from 1.16% in the validated model to 0.68% in the Eco configuration. This shift indicates that smoothing out acceleration phases upstream helps the vehicle anticipate downstream speed drops more effectively, allowing it to rely on smoother, low-intensity decelerations rather than abrupt braking maneuvers.
3.4. Multi-Criteria Trade-Off Evaluation (Pareto Optimization Analysis)
The overall technical trade-offs between the validated factory ACC model and the optimized Eco configuration are summarized in Table 3.
The statistical data in Table 3 highlights a clear operational trade-off. Limiting the peak longitudinal acceleration and lowering the target velocity thresholds reduced the average velocity by 6.45 km/h. This kinematic stabilization eliminated aggressive acceleration maneuvers (0.0% share in the Eco model) and reduced hard braking by 0.48 percentage points.
This reduction in kinematic transient states directly improves volumetric fuel efficiency, as visualized in the trade-off diagram in Figure 6.
As shown in Figure 6, the Eco configuration achieves a 12% reduction in mean volumetric fuel consumption, dropping from 4.91 L/100 km to 4.33 L/100 km. This efficiency gain requires a 14% increase in total trip duration, which rises from 893 s to 1019 s.
From an information engineering and decision support perspective, this relationship defines a clear Pareto optimal boundary. Fleet management systems can leverage this data-driven model to adjust ACC parameters dynamically, selecting configurations that balance time constraints against energy reduction goals based on operational priorities.
4. Discussion
The quantitative findings of this study demonstrate that integrating high-frequency telematics data with a validated Digital Twin architecture enables effective eco-driving optimization of factory-installed Adaptive Cruise Control (ACC) systems. By adjusting closed-loop longitudinal control parameters, the proposed methodology achieved a 12.0% reduction in volumetric fuel consumption without requiring structural modifications to the underlying vehicle control software or hardware. To contextualize the performance and engineering viability of the proposed Digital Twin framework, Table 4 presents a comparative benchmark against prominent eco-driving ACC methodologies reported in recent literature.
A critical comparison with the MPC-based ACC architecture formulated by Nie and Farzaneh [39] reveals an important engineering insight. Nie and Farzaneh achieved a 12–13% improvement in fuel economy by implementing an explicit MPC framework that continuously solves an online quadratic programming (QP) problem to constrain acceleration and jerk rates. Remarkably, the methodology presented in this study yields a virtually identical fuel reduction 12.0% strictly through the parameter tuning of the closed-loop Wiedemann 99 psycho-physical model inside a validated Digital Twin. This proves that complex, high-overhead control algorithms (such as MPC or neural networks) may not be strictly necessary to realize meaningful eco-driving gains on production platforms. Treating the closed-source factory ACC logic as a parametric search space allows vehicle operators to extract equivalent efficiency benefits without overriding low-level ECU code.
Furthermore, the work of Xin et al. [41] demonstrated that incorporating V2I Signal Phase and Timing (SPaT) data can reduce fuel consumption by up to 25.5% by completely eliminating idling time at red lights. However, such high-efficiency gains heavily depend on continuous V2X communication channels and predictable queue discharge behaviors. In contrast, our Digital Twin approach operates effectively within existing road infrastructure and stochastic urban-suburban traffic. The 12.0% volumetric fuel savings achieved in our test corridor 4.91 to 4.33 L/100 km represent a realistic baseline for real-world deployments where real-time traffic signal broadcasting is unavailable.
The bivariate state-space analysis (v–a density mapping in Section 3.2) confirmed that the primary driver of fuel efficiency is the dampening of transient kinetic states. Bounding the maximum acceleration rate (acc_cc_max = 1.2 m/s2) and increasing the speed convergence time constant (τcc= 5.0s) eliminated aggressive throttle inputs and compressed the acceleration distribution near 0.0 m/s2.
This dampening mechanism aligns directly with the theoretical findings of Fleming and Midgley [40], who demonstrated that smoothing the ego-vehicle’s velocity trajectory reduces energy losses for trailing traffic by 2.0–3.4% through the attenuation of shockwaves. In our microscale simulation network, maintaining a GEH network statistic of $2.67$ while dampening longitudinal acceleration vectors confirms that optimizing factory ACC parameters stabilizes local traffic flow without inducing bottlenecks.
A rigorous evaluation must address the Pareto trade-off between energetic efficiency and operational throughput. The 12.0% reduction in fuel consumption was accompanied by a 14.0% increase in total trip execution time (893 s to 1019s, representing a net delay of +126s over an 11.57 km corridor). In commercial freight and passenger transport, travel time directly dictates operational costs. Therefore, the choice of ACC parameter sets must be treated as a dynamic decision support problem:
- In time-critical logistics, baseline factory settings (vmed = 57 km/h) preserve maximum velocity.
- In energy-constrained or long-haul scenarios, optimized Eco settings (vmed = 48km/h) maximize volumetric fuel efficiency.
While the proposed Digital Twin framework demonstrates high empirical fidelity and quantifiable energy savings, several operational limitations must be acknowledged. First, although the virtual model was validated using high-frequency OBD-II diagnostic streams from a standard internal combustion engine passenger vehicle, variations in engine displacement, transmission dynamic maps, baseline kerb weight, and powertrain topologies across broader fleet classifications—such as heavy-duty commercial vehicles, hybrid systems, or battery electric vehicles—may alter the absolute percentage of volumetric fuel reduction. Second, the parametric optimization of the closed-loop Wiedemann 99 car-following model was executed offline through an iterative 100-run search space based on a single, fixed spatial trajectory. Consequently, the framework currently operates under static optimized parameters rather than real-time, dynamic parameter switching governed by adaptive edge computing nodes. Finally, the microscale simulation environment assumes fully compliant background traffic interactions and consistent pavement friction conditions, thereby abstracting extreme environmental variables such as severe weather, dynamic road gradient shifts, or erratic human driving maneuvers that could temporarily force the factory adaptive cruise control system out of its eco-driving bounds.
5. Conclusions
This study presented a data-driven Digital Twin framework for optimizing the closed-loop operational parameters of factory-installed Adaptive Cruise Control (ACC) systems. By integrating high-frequency telematics data (OBD-II and GPS) with microscale traffic simulation engines (PTV Vissim), the proposed architecture establishes a virtual testing framework capable of executing multi-parameter optimization without requiring physical fleet interventions or custom control firmware overrides.
The primary technical and scientific findings are summarized as follows:
- Model Calibration and Empirical Validation: The calibrated microscale model successfully replicated real-world operational states, achieving an absolute variance of 2.84 km/h in mean velocity, 5 s in net trip duration, and an absolute delta of just 0.01 L/100 km in volumetric fuel consumption relative to physical OBD baseline data. The GEH network statistic of 2.67 confirmed high macroscale traffic flow fidelity.
- Kinematic Stabilization: Bounding the maximum acceleration rate (acc_a_cc_max = 1.2 m/s2), extending the speed convergence time constant (τcc= 5.0 s), and adjusting cruise target distributions completely eliminated high-intensity acceleration events (> 1.5 m/s2) and reduced strong braking instances (< -1.5 m/s2) by 0.48 percentage points.
- Quantitative Efficiency Trade-Off: The optimized Eco configuration achieved a 12% reduction in mean fuel consumption (from 4.91 to 4.33 L/100 km), accompanied by a 14% increase in total cumulative trip duration (from 893 to 1019 s). This relationship formalizes a quantitative Pareto trade-off between energy conservation and trip execution time.
From an information systems perspective, this methodology provides a decision support tool for intelligent transport operators and fleet managers. Future developments will focus on expanding the virtual simulation architecture to incorporate dynamic, real-time telemetry streaming over vehicle-to-everything (V2X) communication channels, as well as evaluating multi-class vehicle fleets across varied geographic road networks.
Author Contributions
For research articles with several authors, a short paragraph specifying their individual contributions must be provided. The following statements should be used “Conceptualization, M. L. and M.M.; methodology, M.L.; software, M.L.; validation, M.M.; formal analysis, M.M.; investigation, M.L.; resources, M.L.; data curation, M.L. writing—original draft preparation, M.L.; writing—review and editing, M.M.; visualization, M.L.; supervision, M.M; project administration, M.M.; funding acquisition, M.M. All authors have read and agreed to the published version of the manuscript.” Please turn to the CRediT taxonomy for the term explanation. Authorship must be limited to those who have contributed substantially to the work reported.
Funding
This research received no external funding.
Data Availability Statement
The original contributions presented in this study are included in the article. Further inquiries can be directed to the corresponding author.
Conflicts of Interest
The authors declare no conflicts of interest.
Abbreviations
The following abbreviations are used in this manuscript:
ACC – Adaptive Cruise Control
ADAS – Advanced Driver Assistance Systems
BEV – Battery Electric Vehicle
CAN – Controller Area Network
CBM – Carbon Balance Method
DT – Digital Twin
ECU – Electronic Control Unit
FWD – Front-Wheel Drive
GEH – Geoffrey E. Havers (Traffic Model Validation Statistic)
GPS – Global Positioning System
ICE – Internal Combustion Engine
ICT – Information and Communication Technologies
ITS – Intelligent Transportation Systems
MPC – Model Predictive Control
MVPM – Mean Value Phenomenological Model
OBD – On-Board Diagnostics
OEM – Original Equipment Manufacturer
PID – Proportional-Integral-Derivative (Controller)
PTV – Planung Transport Verkehr
QP – Quadratic Programming
SPaT – Signal Phase and Timing
TDI – Turbocharged Direct Injection
V2I – Vehicle-to-Infrastructure
V2X – Vehicle-to-Everything
References
- Veza, I.; Asy’ari, M. Z.; Idris, M.; Epin, V.; Fattah, I. R.; Spraggon, M. Electric vehicle (EV) and driving towards sustainability: Comparison between EV, HEV, PHEV, and ICE vehicles to achieve net zero emissions by 2050 from EV. Alex. Eng. J. 2023, 82, 459–467. [Google Scholar] [CrossRef]
- Mądziel, M.; Kulasa, P.; Campisi, T. Determinants of Test-to-Reality CO2 Gaps in European PHEVs: The Limited Role of Battery Capacity. Vehicles 2026, 8, 60. [Google Scholar] [CrossRef]
- Mądziel, M. Phase-Specific Mixture of Experts Architecture for Real-Time NOx Prediction in Diesel Vehicles: Advancing Euro 7 Compliance. Energies 2025, 18, 5853. [Google Scholar] [CrossRef]
- Rehman, M. A.; Numan, M.; Tahir, H.; Rahman, U.; Khan, M. W.; Iftikhar, M. Z. A comprehensive overview of vehicle to everything (V2X) technology for sustainable EV adoption. J. Energy Storage 2023, 74, 109304. [Google Scholar] [CrossRef]
- Huang, T., Liu, J., Zhou, X., Nguyen, D. C., Azghadi, M. R., Xia, Y., ... & Sun, S. (2023). V2X cooperative perception for autonomous driving: Recent advances and challenges. arXiv preprint arXiv:2310.03525.
- Asher, Z. D.; Tunnell, J. A.; Baker, D. A.; Fitzgerald, R. J.; Banaei-Kashani, F.; Pasricha, S.; Bradley, T. H. No. 2018-01-1015; Enabling prediction for optimal fuel economy vehicle control. SAE Technical Paper, 2018.
- Mądziel, M.; Campisi, T. Real-World CO2 Emissions of Plug-In Hybrid Vehicles: European Assessment Using On-Board Fuel Consumption Monitoring Data. Energies 2026, 19, 1165. [Google Scholar] [CrossRef]
- Tunnell, J.; Asher, Z. D.; Pasricha, S.; Bradley, T. H. Toward improving vehicle fuel economy with ADAS. SAE Int. J. Connect. Autom. Veh. 2018, 1(12-01-02-0005), 81–92. [Google Scholar] [CrossRef]
- Qian, G.; Fu, T.; Sun, L. Research on the fuel consumption conservation potential of ADAS on passenger cars. E3S Web of Conferences, 2021; EDP Sciences; Vol. 268, p. 01035. [Google Scholar]
- Damsara, K. D. P.; de Barros, A. G. A systematic review on user acceptance of advanced driver assistance systems (ADAS). Transp. Res. Procedia 2025, 82, 3472–3482. [Google Scholar] [CrossRef]
- El Akadi, N.; Slimani, I.; Zaarane, A.; Atouf, I. A concise survey on ADAS: advances in vehicle and pedestrian detection with a focus on the AUTOSAR automotive standard. In Embedded Systems in Automotive Applications; Elsevier, 2026; pp. 77–105. [Google Scholar]
- Ding, Z.; Gong, Y.; Lin, J.; Jiang, J.; Zhang, J. A vehicle coordinate system reconstruction method for end of line calibration applications. Sci. Rep. 2025, 15(1), 20806. [Google Scholar] [CrossRef] [PubMed]
- Rövid, A.; Vincze, Z.; Pálinkás, T.; Kocsis, M.; Serrano, V.; Szalay, Z. Reference Platform for ADAS Camera System Evaluation. Sensors 2025, 25(6), 1690. [Google Scholar] [CrossRef] [PubMed]
- Paul, S.; Goyal, V.; Joshi, S.; Franke, M.; Tomazic, D.; Zeman, J. Evaluation of longitudinal ADAS functions for fuel economy improvement of class 8 long haul trucks. WCX SAE World Congress Experience, 2023, April; SAE Technical Paper. [Google Scholar]
- Manjunath, T. K.; Kumar, P. A. Monitoring fuel-efficient driving patterns to augment ADAS to regulate the fuel dynamically using machine learning. J. Electr. Syst. 2024, 20(6s), 2625–2645. [Google Scholar] [CrossRef]
- Borhan, H.; Lammert, M.; Kelly, K.; Zhang, C.; Brady, N.; Yu, C. S.; Liu, J. Advancing platooning with ADAS control integration and assessment test results. SAE Int. J. Adv. Curr. Pract. Mobil. 2021, 3, 1969–1975. [Google Scholar] [CrossRef]
- Mahdy, M. A.; Abdellatif, A.; El-Khatib, M. F. A Systematic Review of Eco-Adaptive Cruise Control for Electric Vehicles: Control Strategies, Computational Challenges, and the Simulation-to-Reality Gap. Appl. Syst. Innov. 2026, 9(5), 96. [Google Scholar] [CrossRef]
- Li, J.; Yi, Q.; Zhu, P.; Hu, J.; Yi, S. Data-driven co-optimization method of eco-adaptive cruise control for plug-in hybrid electric vehicles considering risky driving behaviors. Appl. Energy 2025, 392, 126039. [Google Scholar] [CrossRef]
- Ruan, S.; Ma, Y.; Yang, N.; Xiang, C.; Li, X. Real-time energy-saving control for HEVs in car-following scenario with a double explicit MPC approach. Energy 2022, 247, 123265. [Google Scholar] [CrossRef]
- Sharkawy, A. E.; Ali, A. M.; Asfoor, M. S.; Yacoub, M. I. Adaptive cruise control for electric vehicles using hybrid-mode MPC. Sci. Rep. 2026, 16(1), 17528. [Google Scholar] [CrossRef] [PubMed]
- Naqvi, S. S. A.; Jamil, H.; Iqbal, N.; Khan, S.; Khan, M. A.; Qayyum, F.; Kim, D. H. Evolving electric mobility energy efficiency: In-depth analysis of integrated electronic control unit development in electric vehicles. Ieee Access 2024, 12, 15957–15983. [Google Scholar] [CrossRef]
- Bavalatti, S.; Kangralkar, Y.; Pattar, S.; Badiger, V. P. Adaptive Cruise Control in Autonomous Vehicles: Challenges, Gaps, Comprehensive Review, and, Future Directions. arXiv 2025, arXiv:2510.03300. [Google Scholar]
- Antony, M. M.; Whenish, R. Advanced driver assistance systems (ADAS). In Automotive embedded systems: Key technologies, innovations, and applications; Springer International Publishing: Cham, 2021; pp. 165–181. [Google Scholar]
- Zeng, J.; Han, J.; Khalatbarisoltani, A.; Cui, H.; Zhang, F.; Liu, C. Z.; Hu, X. Interaction-Aware Eco-Driving of Connected Hybrid Electric Vehicles Based on Safe Deep Reinforcement Learning: Speed Planning and Lane Changing. IEEE Transactions on Intelligent Transportation Systems, 2026. [Google Scholar]
- Aittoniemi, E. Evidence on impacts of automated vehicles on traffic flow efficiency and emissions: Systematic review. IET Intell. Transp. Syst. 2022, 16(10), 1306–1327. [Google Scholar] [CrossRef]
- Mehraban, Z.; Zadeh, A. Y.; Khayyam, H.; Mallipeddi, R.; Jamali, A. Fuzzy adaptive cruise control with model predictive control responding to dynamic traffic conditions for automated driving. Eng. Appl. Artif. Intell. 2024, 136, 109008. [Google Scholar] [CrossRef]
- Korbmacher, R.; Khound, P.; Tordeux, A. Understanding collective stability of ACC systems: From theory to real-world observations. In 2025 IEEE 64th Conference on Decision and Control (CDC); IEEE, December 2025; pp. 8371–8378. [Google Scholar]
- Garg, M.; Bouroche, M. Can connected autonomous vehicles improve mixed traffic safety without compromising efficiency in realistic scenarios? IEEE Trans. Intell. Transp. Syst. 2023, 24(6), 6674–6689. [Google Scholar] [CrossRef]
- Lis, M.; Mądziel, M. A Simulation-Based Decision-Support Framework for EV Charging Infrastructure Development Along a TEN-T Corridor. Appl. Sci. 2026, 16, 4902. [Google Scholar] [CrossRef]
- Durukal, B.; Kınay, S.; Zengin, N.; Günaydm, B.; Öztürk, B.; Yetkin, S. K. A digital twin study: Particle swarm optimization of acc controller for follow acceleration maneuver. In 2022 IEEE 21st international Ccnference on Sciences and Techniques of Automatic Control and Computer Engineering (STA); IEEE, December 2022; pp. 146–153. [Google Scholar]
- Lis, M.; Mądziel, M. Green Transportation Planning for Smart Cities: Digital Twins and Real-Time Traffic Optimization in Urban Mobility Networks. Appl. Sci. 2026, 16, 678. [Google Scholar] [CrossRef]
- Wang, Z.; Gupta, R.; Han, K.; Wang, H.; Ganlath, A.; Ammar, N.; Tiwari, P. Mobility digital twin: Concept, architecture, case study, and future challenges. IEEE Internet Things J. 2022, 9(18), 17452–17467. [Google Scholar] [CrossRef]
- Fang, X.; Li, H.; Tettamanti, T.; Eichberger, A.; Fellendorf, M. Effects of automated vehicle models at the mixed traffic situation on a motorway scenario. Energies 2022, 15(6). [Google Scholar] [CrossRef]
- Kumarasamy, V. K.; Saroj, A. J.; Liang, Y.; Wu, D.; Hunter, M. P.; Guin, A.; Sartipi, M. Integration of decentralized graph-based multi-agent reinforcement learning with digital twin for traffic signal optimization. Symmetry 2024, 16(4), 448. [Google Scholar] [CrossRef]
- Michailidis, E. T.; Panagiotopoulou, A.; Papadakis, A. A review of OBD-II-based machine learning applications for sustainable, efficient, secure, and safe vehicle driving. Sensors 2025, 25(13), 4057. [Google Scholar] [CrossRef] [PubMed]
- Pan, C.; Huang, A.; Chen, L.; Cai, Y.; Chen, L.; Liang, J.; Zhou, W. A review of the development trend of adaptive cruise control for ecological driving. Proc. Inst. Mech. Eng. Part D. J. Automob. Eng. 2022, 236(9), 1931–1948. [Google Scholar] [CrossRef]
- Mohammed, D.; Horváth, B. Comparative analysis of following distances in different adaptive cruise control systems at steady speeds. World Electr. Veh. J. 2024, 15(3), 116. [Google Scholar] [CrossRef]
- Yang, M., Chon-Kan Munoz, P., Lapardhaja, S., Gong, Y., Imran, M. A., Murshed, M. T., ... & Lee, C. (2026). Microsimacc: an open database for field experiments on the potential capacity impact of commercial adaptive cruise control (acc). Transportmetrica A: Transport Science, 22(1), 2349921. [CrossRef]
- Nie, Z.; Farzaneh, H. Adaptive cruise control for eco-driving based on model predictive control algorithm. Appl. Sci. 2020, 10(15), 5271. [Google Scholar] [CrossRef]
- Fleming, J.; Midgley, W. J. Energy-efficient automated driving: Effect of a naturalistic eco-ACC on a following vehicle. In 2023 IEEE International Conference on Mechatronics (ICM); IEEE, March 2023; pp. 1–6. [Google Scholar]
- Xin, Q.; Fu, R.; Yuan, W.; Liu, Q.; Yu, S. Predictive intelligent driver model for eco-driving using upcoming traffic signal information. Phys. A Stat. Mech. Its Appl. 2018, 508, 806–823. [Google Scholar] [CrossRef]
Figure 1.
The vehicle under test.
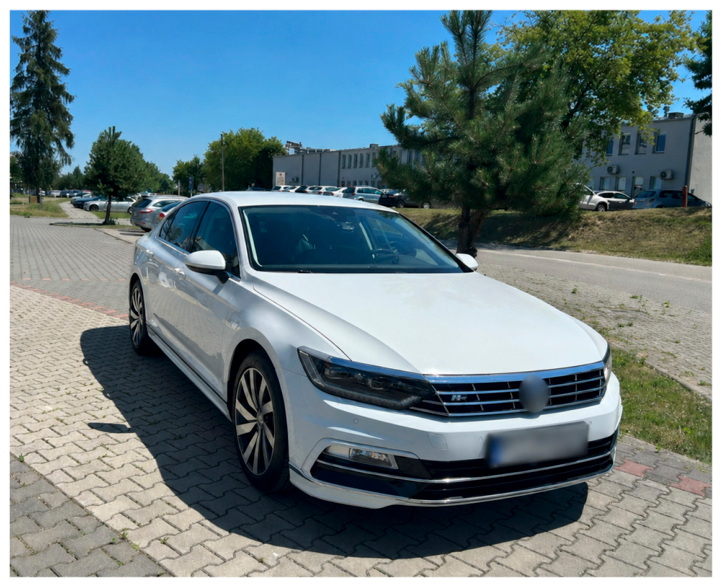
Figure 2.
The road section under study (a) along with its digital twin created using PTV Vissim software (b).
Figure 2.
The road section under study (a) along with its digital twin created using PTV Vissim software (b).
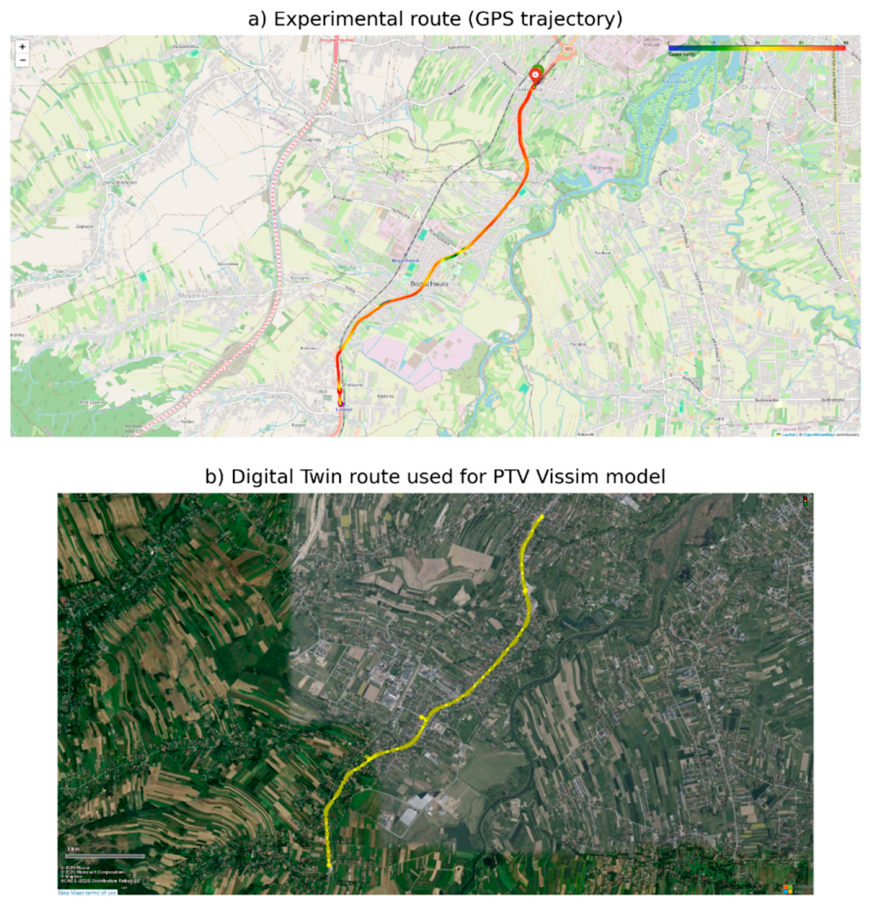
Figure 3.
Speed comparison: OBD drives vs validated model vs eco model.
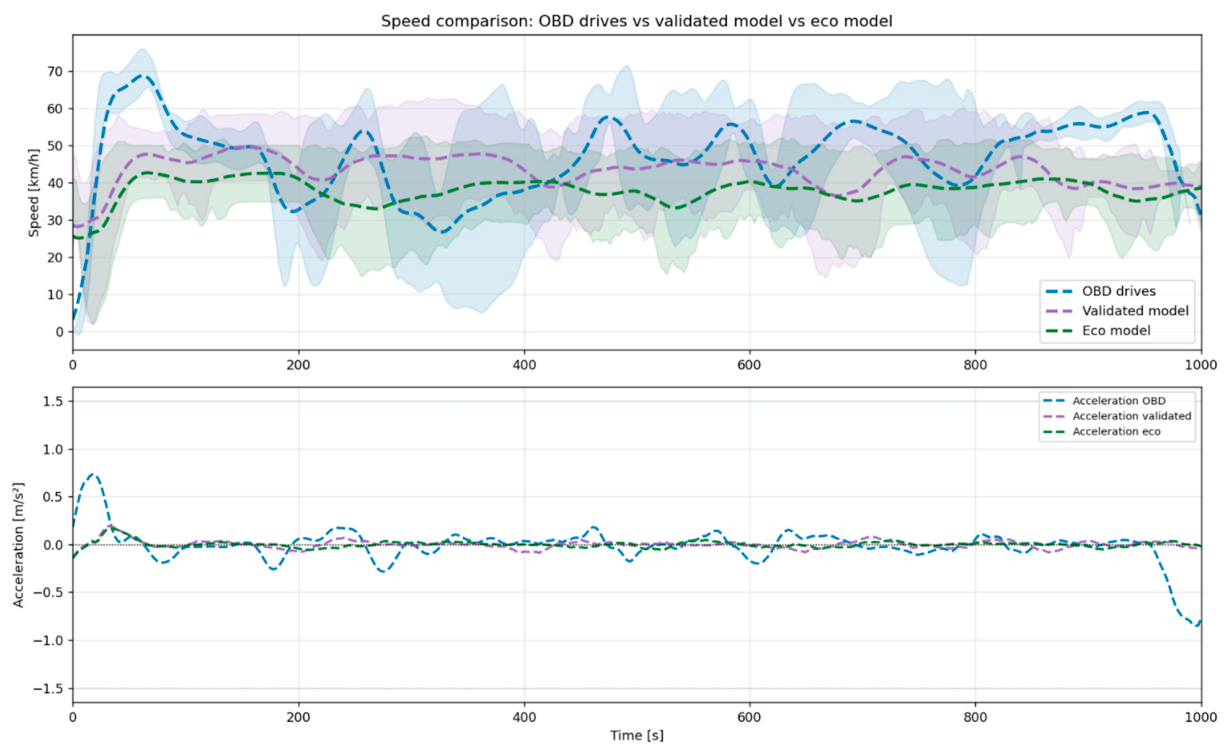
Figure 4.
Speed vs acceleration density: OBD, validated model, eco model.
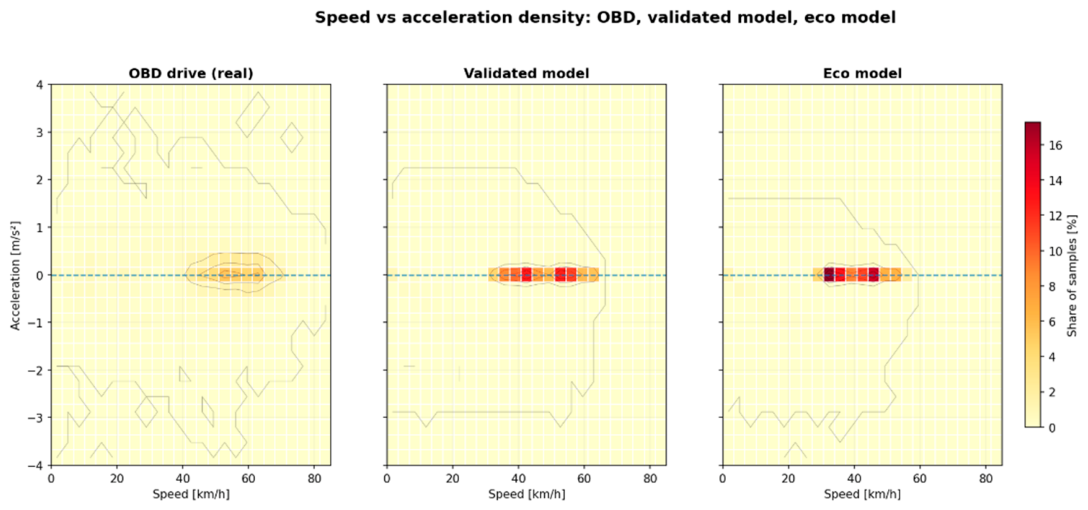
Figure 5.
Braking distribution (dot plot, n=2214 per group).
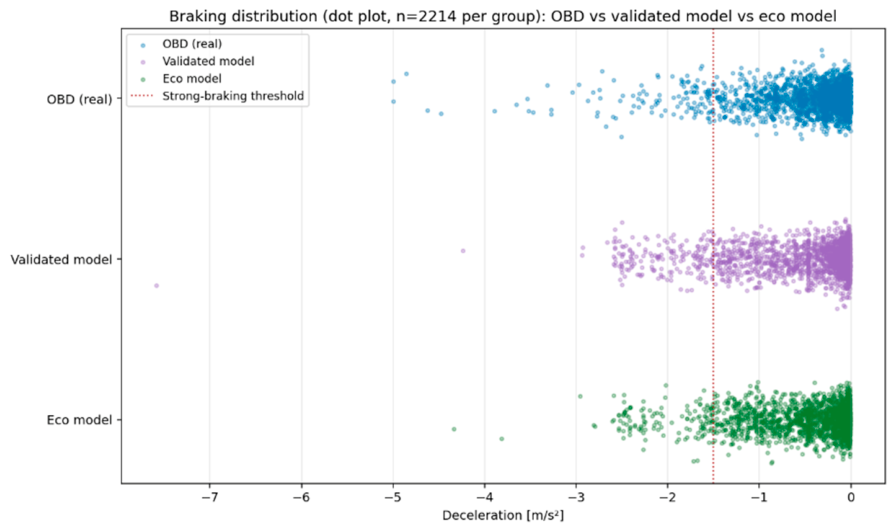
Figure 6.
Trade-off: trip duration vs fuel consumption).
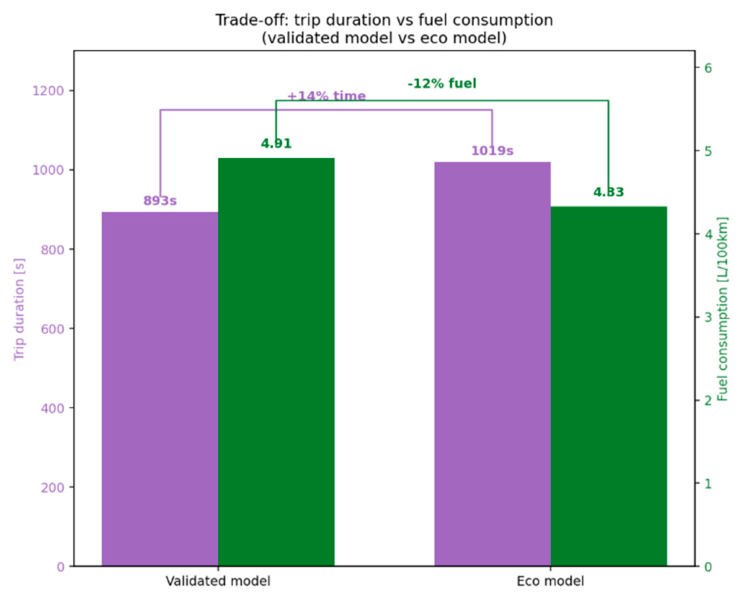

Table 1.
Quantitative validation metrics: Empirical OBD data vs. Calibrated Digital Twin framework.
| Operational Parameter | Empirical OBD Stream | Calibrated Digital Twin | Absolute Variance |
| Mean Velocity (vmean) [km/h] | 47.31 | 44.47 | 2.84 |
| 75th Percentile Velocity (v75) [km/h] | 60.26 | 53.36 | 6.9 |
| 90th Percentile Velocity (v90) [km/h] | 66 | 59.12 | 6.88 |
| 95th Percentile Velocity (v95) [km/h] | 69.7 | 61.38 | 8.32 |
| 99th Percentile Velocity (v99) [km/h] | 77.44 | 62.89 | 14.55 |
| Maximum Velocity (vmax) [km/h] | 83.32 | 64.36 | 18.96 |
| High-Intensity Acceleration Share (a>1.5 m/s2) [%] | 1.72 | 1.58 | 0.14 |
| High-Intensity Deceleration Share (a<−1.5 m/s2) [%] | 2.27 | 1.16 | 1.11 |
| Total Virtual Trajectory Length [km] | 11.57 | 10.76 | 0.81 |
| Total Cumulative Trip Duration [s] | 898 | 893 | 5 |
| Mean Volumetric Fuel Consumption [L/100 km] | 4.9 | 4.91 | 0.01 |
Table 2.
Closed-loop longitudinal control parameters: Baseline factory ACC vs. Optimized Eco Configuration.
Table 2.
Closed-loop longitudinal control parameters: Baseline factory ACC vs. Optimized Eco Configuration.
| Mathematical Model Parameter | Variable Identifier | Baseline Factory Model | Optimized Eco Configuration | Status |
| Desired Velocity Median (fx=0.67) [km/h] | vmed | 57 | 48 | Modified |
| Desired Velocity Maximum (fx=1.0) [km/h] | vmax | 68 | 58 | Modified |
| Desired Velocity Minimum (fx=0) [km/h] | vmin | 31 | 27 | Modified |
| Maximum ACC Acceleration Bound [m/s2] | acc_a_cc_max | 1.9 | 1.2 | Modified |
| Speed Convergence Time Constant [s] | acc_tau_cc | 3 | 5 | Modified |
| Minimum Operational Time Gap [s] | acc_MinGapTime | 2 | 2 | Unchanged |
| Standstill Safety Distance [m] | acc_StandSafDist | 8 | 8 | Unchanged |
| Comfortable Deceleration Limit [m/s2] | acc_a_s | −3.5 | −3.5 | Unchanged |
Table 3.
Comprehensive operational and energetic metrics comparison.
| Metric Group | Specific Parameter | Validated Model | Eco Model | Net Variance (ΔEco−Val) |
| Velocity Profiles | Mean Velocity (vmean) [km/h] | 44.47 | 38.02 | −6.45 |
| 75th Percentile Velocity (v75) [km/h] | 53.36 | 46.08 | −7.28 | |
| 90th Percentile Velocity (v90) [km/h] | 59.12 | 50.85 | −8.27 | |
| 95th Percentile Velocity (v95) [km/h] | 61.38 | 51.85 | −9.53 | |
| 99th Percentile Velocity (v99) [km/h] | 62.89 | 54.9 | −7.99 | |
| Maximum Velocity (vmax) [km/h] | 64.36 | 54.9 | −9.46 | |
| Transient Dynamics | Strong Acceleration Share (a>1.5 m/s2) [%] | 1.58 | 0 | −1.58 p.p. |
| Strong Braking Share (a<−1.5 m/s2) [%] | 1.16 | 0.68 | −0.48 p.p. | |
| Operational Efficiency | Distance Traveled [km] | 10.76 | 10.54 | −0.22 |
| Total Trip Duration [s] | 893 | 1019 | +126 (14%) | |
| Mean Fuel Consumption [L/100 km] | 4.91 | 4.33 | −0.58 (12%) | |
| Network Traffic | GEH Network Statistic [−] | 2.67 | 2.67 | 0 |
Table 4.
Methodological benchmarking against existing eco-driving ACC control strategies.
| Study / Reference | Control Architecture | Data Source / Environment | Fuel / Energy Reduction | Trade-Offs & Limitations |
| [39] | Model Predictive Control (MPC) with QP solver | MATLAB/Simulink synthetic car-following cycles | 12.0–13.0% | High computational complexity; requires replacement of ECU firmware. |
| [40] | Optimal Control + Intelligent Driver Model (IDM) | OpenOCL numerical solver (Synthetic profiles) | 13.0–49.0% (Ego + Follower) | Assumes full knowledge of leader/follower dynamics; non-convex optimization. |
| [41] | Extended IDM + SPaT V2X Speed Advisory | 4-8 Signalized intersections (Runge-Kutta simulation) | 25.5% | Requires active V2X infrastructure; susceptible to queue discharge errors. |
| This Work (Proposed DT Framework) | Calibrated Wiedemann 99 / Factory ACC Parameter Tuning | Real-World OBD-II & GPS Streams / PTV Vissim | 12.0% | $+14.0\%$ trip duration; non-invasive deployment on production vehicles. |
Disclaimer/Publisher’s Note: The statements, opinions and data contained in all publications are solely those of the individual author(s) and contributor(s) and not of MDPI and/or the editor(s). MDPI and/or the editor(s) disclaim responsibility for any injury to people or property resulting from any ideas, methods, instructions or products referred to in the content. |
© 2026 by the authors. Licensee MDPI, Basel, Switzerland. This article is an open access article distributed under the terms and conditions of the Creative Commons Attribution (CC BY) license (http://creativecommons.org/licenses/by/4.0/).
Copyright: This open access article is published under a Creative Commons CC BY 4.0 license, which permit the free download, distribution, and reuse, provided that the author and preprint are cited in any reuse.