

Submitted:
27 July 2026
Posted:
28 July 2026
You are already at the latest version
Abstract
Olivine, as (Mg, Fe)2SiO4 solid solution, governs the plastic flow of the Earth's upper mantle. While extensive studies exist on natural olivine-rich rocks, the rheology of its Mg-end member, forsterite (Fo), remains less constrained, particularly for diffusion creep. Here we synthesize high-purity (≥98 vol.%), iron-free forsterite aggregates via pressureless sintering and perform axial compression experiments in a high-stress-precision Paterson gas-medium apparatus at 300 MPa, temperatures of 1423–1523 K, and differential stresses of 50–380 MPa. Our results reveal a stress exponent n = 1.0 ± 0.08, an activation energy Q = 365 ± 22.7 kJ/mol, and a grain size exponent p = 2.9 ± 0.23, demonstrating that forsterite deforms by diffusion creep under these conditions. The grain size exponent, close to the theoretical value of 3 for Coble creep, indicates that grain boundary diffusion is the rate-controlling mechanism. Compared to previous studies on forsterite and natural olivine, our flow law shows good agreement with the activation energy for olivine diffusion creep but provides a significantly better-constrained grain size exponent. Critically, because our samples are chemically synthesized and iron-free, and lack the trace impurities that facilitate defect generation in natural olivine, they exhibit higher strength than natural Fe-bearing olivine. Our flow law therefore defines the Mg-end member for the olivine solid solution system and represents the viscosity upper bound for olivine-dominated mantle rocks deformed dominantly by diffusion creep. These findings not only fill a critical gap in the rheological data for the olivine solid solution end-members but also provide a robust basis for modeling viscosity variations in the upper mantle as functions of grain size, temperature, and iron content.
Keywords:
forsterite
; diffusion creep
; grain size effect
; coble creep
; upper mantle rheology
1. Introduction
Olivine, the most abundant (50‒60 vol.%) [1,2] and rheologically weakest major mineral in the upper mantle, governs its plastic flow [3,4]. Consequently, extensive experimental studies have investigated the rheology of olivine single-crystal [5,6,7,8], polycrystalline olivine aggregates (eg., [9,10]), and olivine-rich rocks [11,12,13,14] and hot-pressed polycrystalline aggregates [15,16]. Early work focused on natural dunites, while recent studies utilize synthetic or separated natural mineral aggregates. Two primary flow regimes are recognized: grain-size-insensitive dislocation creep and grain-size-sensitive diffusion creep. Both are described by a constitutive flow law:
Where is strain rate (s-1), A is a pre-exponential constant, d is grain size (μm), p is the grain size exponent (p=0 for dislocation creep), σ is differential stress (MPa), n is the stress exponent, Q is apparent activation energy (J*mol-1), R is the gas constant (J*mol-1*K-1), T is absolute temperature (K), is water fugacity (MPa), r is the water fugacity exponent, is oxygen fugacity (MPa), and m is the oxygen fugacity exponent.
Based on well-constrained data, especially obtained by gas or molten salt medium deformation apparatus, flow parameters for olivine have been determined. For dry conditions, dislocation creep yields n = 3–5 and Q = 500–540 kJ/mol [11,12,14,17,18,19], while diffusion creep is characterized by n≈1, Q = 240–375 kJ/mol and p=2-3.4 [20,21]. Under wet conditions, the activation energy for dislocation creep decreases significantly (Q= 334–520 kJ/mol) [11,12,13,17], with a water fugacity exponent r = 0.69–1.25 [10,18], while for diffusion creep, the water fugacity exponent r = 0.7–1 [9,17,19].
While experiments on natural olivine-rich rocks and hot-pressed olivine aggregates have constrained flow laws for upper mantle conditions, olivine's rheology is compositionally dependent. As a solid solution between forsterite (Fo) and fayalite (Fa), its properties vary with iron content, with Fe-rich olivine generally exhibiting lower viscosity but higher activation energy. [22,23,24]. Therefore, determining the rheology of its end-members is essential for a complete understanding of upper mantle rheology. This requires high-purity, iron-free forsterite samples, which must be prepared via chemical synthesis (e.g., using MgO and SiO₂ as starting materials), as natural samples inevitably contain Fe and other impurities. For instance, McDonnell et al. [25] reported grain boundary sliding in synthetic wet (0.5 wt.% H2O) Fo aggregates (n = 1.7 ± 0.4, Q = 302 ± 22 kJ/mol). Nishihara et al. [26], using a D-DIA on sintered nano-powder aggregates, reported parameters for Fo diffusion creep (Q = 506 ± 34 kJ/mol) and dislocation-accommodated grain boundary sliding (n = 3, Q = 519 ± 53 kJ/mol), though stress uncertainties in such experiments necessitate caution. These prior studies, while valuable, exhibit significant scatter in key parameters like activation energy and stress exponent, partly due to experimental challenges (e.g., porosity, stress resolution, water content) and a lack of systematic investigation of grain size effects.
To better constrain forsterite rheology and resolve these discrepancies, we synthesized high-purity (≥98 vol.%), iron-free Fo aggregates via pressureless sintering and deformed them in a high-stress-precision gas-medium Paterson apparatus at ~300 MPa and 1423–1523 K. Our experimental design prioritizes three key improvements: (1) the use of a Paterson apparatus, which offers superior stress resolution compared to D-DIA, (2) systematic variation of initial grain size to directly constrain the grain size exponent, and (3) strict control of dryness to avoid the confounding effects of water. Our results confirm diffusion creep with a well-constrained stress exponent n = 1.0 ± 0.08, an activation energy Q = 365 ± 22.7 kJ/mol, and, most importantly, a precise grain size exponent p = 2.9 ± 0.23, providing strong evidence for Coble creep. As chemically synthesized, iron-free, and high-purity samples lack the Fe and trace impurities that weaken natural olivine, our flow law defines the Mg-end member of the olivine solid solution system and represents the viscosity upper bound for upper mantle peridotites deformed dominantly by diffusion creep.
2. Experimental Methods
2.1. Starting Material and Sample Preparation
Based on the method for synthesizing forsterite aggregates via pressureless sintering reported by Koizumi et al. [27] and Hiraga et al. [28], we appropriately modified the procedure [29] to prepare initial samples for deformation experiments: forsterite cylinders measuring ~7 mm in diameter and ~14 mm in length. First, nano-sized powders of Mg(OH)2 (~50 nm) and SiO2 (~30 nm) bought from American Elements Inc. were mixed in an agate mortar on a ball mill at a molar ratio of 1.95:1, and then subjected to a temperature of 1273 K for ~4 hours to synthesize the mineral mixture. The reaction powder was incrementally cold compacted under 100 MPa into a three-piece split mold with a central bore diameter of 13 mm to form a green body. The resulting cylinder was then encased in a rubber sleeve and further consolidated under a cold isostatic pressure of ~170 MPa. After 30 minutes, the compacted cylinder was retrieved, with dimensions of ~10.5 mm in diameter and ~21.0 mm in length. The compacted cylinder was then vacuum-sintered in a tube furnace at approximately 1630 K for either 4 or 8 hours to produce forsterite aggregates of different grain sizes. After sintering, a ~1 mm thick disk was cut from the cylinder for Raman spectroscopy and SEM-BSE analysis. No distinct orthopyroxene peaks were detected in the Raman spectra (Figure 1a), and no second phase with obvious contrast differences was observed in BSE images (Figure 1b), indicating a high purity of the synthesized forsterite, estimated to be ≥98 vol.%. The Raman spectrum of the synthesized forsterite (Figure 1a) is consistent with that reported in our previous study on sample synthesis and characterization [29]. Finally, the sintered cylinder was machined on a lathe to the standard dimensions required for deformation experiments: approximately 7 mm in diameter and 14 mm in length. The density of the forsterite cylinder, calculated from accurate measurements of its mass and volume, is approximately 3.0 g/cm³, which is lower than its theoretical density of 3.2 g/cm³, indicating a porosity of ≤ 7%. To obtain denser samples and eliminate the influence of porosity on rheological properties, the samples were hot-pressed in a Paterson apparatus at ~300 MPa and 1423 – 1523 K for 1–2 hours before each deformation test. Scanning electron microscopy (SEM) analysis shows that the porosity of the samples after hot-pressing was effectively reduced to <2% (Figure 2b).
2.2. Deformation Experiments
Axial compression experiments on forsterite were performed in a Paterson gas medium apparatus at the Guangzhou Institute of Geochemistry, Chinese Academy of Sciences. The sample assembly generally followed the design of Li et al. [30,31], but employed a different sample geometry (~7 mm in diameter × ~14 mm in length) and slightly longer alumina pistons (54 mm) at both ends. Direct contact between the sample and the iron jacket buffered oxygen fugacity close to the Fe–FeO phase boundary during deformation. Temperature was maintained and measured using an R-type thermocouple (Pt–13%Rh/Pt) located adjacent to the upper alumina spacer surface directly above the sample. Pre-run calibrations revealed a stable thermal environment, with temperature variations along the specimen of less than ±2 K. A servo-controlled system applied the differential stress, monitored by an internal load cell, and axial displacement was tracked with a linear variable differential transformer (LVDT) inside the pressure vessel. For more details, please refer to Li et al. [30]. To eliminate potential high porosity arising from pressureless sintering, the sample was held at the target pressure and temperature for ≥1 hour before deformation commenced.
The deformation experiments were carried out under stepwise loading. At each step, a constant load—and therefore an approximately constant differential stress, as axial shortening was limited to <3 % per step—was maintained. Once steady state flow was reached, the corresponding strain rate was recorded. Each loading step can thus be treated as a constant stress creep test.
2.3. Microstructural Analysis
Due to the fine grain size of the synthesized forsterite (~1 μm), which is much smaller than the conventional thin-section thickness of 30 μm, microstructural characterization via traditional optical microscopy was not feasible. We therefore relied on scanning electron microscopy (SEM) to examine grain size, porosity, and related features before and after deformation. The procedure for SEM sample preparation was as follows: a ~1 mm thick disk was cut from one end of either the pressureless-sintered or the deformed sample cylinder using a slow-speed diamond saw. Both surfaces of the disk were polished successively up to 8000-grit sandpaper, followed by a final polish with a ~0.05 μm colloidal silica suspension on a polishing cloth for 3 hours. To enhance the visibility of grain boundaries, the polished surface was etched for 10 seconds using a diluted HF solution (HF: H2O = 1:100), which preferentially dissolves grain boundary regions and produces topographic contrast under SEM. Both backscattered electron (BSE) and secondary electron (SE) imaging were performed using a TESCAN MIRA3 field-emission SEM operated at an accelerating voltage of 20 kV and a working distance of 15 mm. BSE imaging was primarily used to identify whether any secondary mineral phases (e.g., enstatite) were present in addition to forsterite, whereas SE imaging was employed to examine grain morphology, porosity, and for grain size measurement. The average chord length, obtained by applying the linear intercept method [32] to at least 200 forsterite grains in the acquired images, was determined as the two-dimensional grain size of forsterite.
Given that diffusion creep typically does not induce significant microstructural evolution, additional micro-analytical techniques such as electron backscatter diffraction (EBSD) or transmission electron microscopy (TEM) were not employed in this study.
2.4. Mechanical Data Analysis
During axial compression, the Paterson gas-medium apparatus continuously records parameters such as axial displacement and applied load. After corrections for machine distortion, strength of the iron jacket, and changes in the sample cross-sectional area, the mechanical data can be reduced to strain rate versus differential stress.
Both theoretical models and experimental observations indicate that when a mineral aggregate undergoes plastic deformation, its rheological behavior—whether deformation is governed by dislocation or diffusion creep—can be described by a flow law of the following form:
where is the strain rate (s-1), A is a material-dependent parameter, d is the grain size (μm), p is the grain size exponent, σ is the differential stress (MPa), n is the stress exponent, Q is the activation energy (kJ/mol), R is the gas constant with a value of 8.314 J/(mol·K), and T is the absolute temperature (K).
During high-temperature deformation, forsterite grains coarsen with time. The initial (before deformation) and final (after deformation) grain sizes can be determined statistically from SEM images. For the real-time grain size, as it is impractical to remove a specimen from the apparatus to measure the grain size after each creep stage, it must be estimated from the initial and final grain sizes according to a grain-growth law [20,21]:
Here, is the grain size (μm) at time t, is the initial grain size (μm), k is a rate constant (μm2∙s-1), and t is the time (s). The constant k follows an Arrhenius relation, k =k0 exp(-Qgg/RT), with Qgg = 160 kJ/mol for olivine [33]. For each experiment, we first calculated the average k from the total duration and the measured initial and final grain sizes. Then, using the known Qgg and the experimental temperature, we determined the pre-exponential factor k0 from that k value. This k0 was subsequently applied to compute the real-time grain size dt for each deformation step at its corresponding elapsed time.
Finally, we fitted the steady-state flow data (strain rate vs. differential stress along with the real-time grain size corresponding to each loading step) to flow law (2) to determine the corresponding rheological parameters.
3. Results
3.1. Microstructures-Grain Size
Scanning electron microscopy (SEM) observations reveal that the initially sintered sample without hot pressing consists of equant polygonal forsterite grains with a grain size of approximately 0.7 or 1 μm (Figure 2a,f). The polished sample surface exhibits ~5% porosity (Figure 2a), which is effectively reduced to <2% after 1–2 hours of hot pressing (Figure 2b). Forsterite grain sizes measured by the linear intercept method are approximately 0.7 μm (Figure 2a; Figure 3a) after 4 hours of sintering and approximately 1 μm (Figure 2f; Figure 3e) after 8 hours of sintering; detailed results are presented in Table 1. Preliminary mechanical data indicate that the dominant deformation mechanism under the experimental conditions is diffusion creep, which typically does not significantly alter the microstructure. Therefore, microstructural analysis of the deformed samples focuses primarily on grain growth relative to the initial grain size. SEM analysis shows that forsterite grains remain equant and polygonal, with grain sizes measured by the linear intercept method ranging from approximately 1.0 to 1.1 μm (Figure 2c‒e; Figure 3b‒d) for 4-hour sintered samples, and 1.2 to 1.3 μm for 8-hour sintered samples (Figure 2g,h; Figure 3f‒h), respectively (Table 1), indicating noticeable grain growth compared to the initial grain sizes. Grain growth rates (Equation (3)) were fitted to the initial and finial grain sizes versus duration time, yield Qgg ≈ 152 kJ/mol and k0 ≈ 5 μm2*s-1. The value of Qgg is consistent with that suggested by Karato [33] within the error range.
Therefore, the growth constants at different experimental temperatures: k = 1.25×10⁻⁵ μm2·s-1 at 1423 K, k = 1.94×10⁻⁵ μm2·s-1 at 1473 K, and k = 2.92×10⁻⁵ μm2·s-1 at 1523 K. Subsequently, the real-time grain sizes at each stage of data acquisition were calculated, and the results are presented in Table 2.
3.2. Mechanical Results
A total of 6 stress-stepwise deformation experiments (each step can be regarded approximately as a constant-stress creep test) were conducted on 3 samples sintered for 4 h and 3 samples sintered for 8 h (Table 2). Representative stress-time and strain-time curves are shown in Figure 4. The deformation experiments were performed at a confining pressure of ~300 MPa, temperatures of 1423 K, 1473 K, and 1523 K, and applied stresses ranging from 50 to 380 MPa. The measured strain rates ranged from 8 × 10⁻⁷ s-1 to 1.2 × 10⁻⁵ s-1. The mechanical data are plotted in a strain rate vs. stress diagram (Figure 5a) and show that the samples sintered for 8 h are overall stronger than those sintered for 4 h, which is attributed to their larger grain sizes. A global fit using the power-law flow law including grain size term (Equation (2)) yields a stress exponent n = 1.0 ± 0.09, an activation energy Q = 365 ± 22.7 kJ/mol, a grain size exponent p = 2.9 ± 0.23, and a material-dependent parameter A = 105.4±0.73. The coefficient of determination R2=0.896 indicates a good fit. Accordingly, under the experimental conditions, the sintered forsterite obeys the following flow law:
To illustrate separately the dependence of strain rate on differential stress, temperature, and grain size, the mechanical data were normalized using the relevant parameters in equation (4). The normalized data are then plotted as log vs. log σ, log vs. 1000/T, and log vs. log d, as shown in the Figure 5b–d. A good linear relationship is observed in each case. The parameters n, Q, and p obtained from these individual fits are in good agreement with those derived from the global fit, with the exception of n value at 1423 K (0.7 ± 0.1), which is slightly lower than the global value. This minor discrepancy may reflect the narrower stress range covered at this temperature.
4. Discussion
4.1. Deformation Mechanism
Scanning electron microscopy (SEM) observations indicate that forsterite remains equant and polyhedral after deformation, with no significant deformation microstructures, such as undulatory extinction or lattice preferred orientation. This is consistent with diffusion creep not significantly altering the material's microstructure. During deformation of forsterite, the strain rate exhibits a near-linear dependence on the applied differential stress (stress exponent n = 1.0 ± 0.09) and a clear grain size dependence (grain size exponent m = 2.9 ± 0.23). The obtained activation energy Q = 365 ± 22.7 kJ/mol, is consistent with values reported for diffusion creep of olivine (Q = 300 kJ/mol [17]; Q = 347 kJ/mol [20]). These features collectively indicate that diffusion creep is the dominant deformation mechanism of forsterite under the experimental conditions.
4.2. Grain Size Effect
Under the experimental conditions, the dominant deformation mechanism of forsterite is diffusion creep, and the strain rate exhibits a strong grain size dependence. To better investigate this dependence, samples with different initial grain sizes were prepared by controlling the high-temperature sintering time. Linear intercept measurements on scanning electron microscopy (SEM) images indicate that the initial grain size of samples sintered for 4 hours is ~0.7 μm, while that of samples sintered for 8 hours is ~1 μm. In the plot of log vs. log σ (Figure 5a), under otherwise identical conditions, the strain rate of the 8-hour sintered samples is significantly lower than that of the 4-hour sintered samples, indicating that samples with larger initial grain sizes exhibit higher flow strength. Furthermore, the mechanical data for the 8-hour sintered samples shown considerable scatter: under otherwise identical conditions, later stages of the deformation experiments, which involve larger grain sizes due to grain growth, result in higher flow strength of forsterite. In summary, both the initial grain size and grain growth during deformation significantly influence the rheological behavior of forsterite. Therefore, the real-time grain sizes at each mechanical data acquisition point during deformation were calculated based on the grain growth rates. The power-law flow law was then fitted to analyze the grain size dependence of the strain rate, yielding a high-precision grain size exponent p =2.9±0.23. This value is very close to the theoretical value of 3 for Coble creep, where diffusion occurs along grain boundaries, and clearly distinguishes it from Nabarro‒Herring creep (p=2, lattice diffusion). The grain size dependence of the strain rate can be more directly observed in the plot of log vs. log d (Figure 5d), after normalizing for deformation temperature and differential stress.
4.3. Compare with Previous Studies and Geological Implication
4.3.1. Comparison with Previous Forsterite Diffusion Creep Studies
Our results provide a refined and robust flow law for diffusion creep in forsterite. A direct comparison with previous studies reveals both agreements and significant advances. McDonnell et al. [25] studied synthetic forsterite aggregates containing ~0.5 wt.% H2O and reported a stress exponent n = 1.7 ± 0.4 and an activation energy Q = 302 ± 22 kJ/mol. Their higher stress exponent, which deviates from the theoretical value of 1 for diffusion creep, suggests that their deformation mechanism might have been influenced by a component of grain boundary sliding or minor dislocation activity, likely facilitated by the presence of water. In contrast, our experiments were conducted under strictly dry conditions, yielding n = 1.0 ± 0.08, which is a much cleaner signature of pure diffusion creep.
Nishihara et al. [26] used a D-DIA apparatus on sintered forsterite nano-powders and reported a much higher activation energy of Q = 506 ± 34 kJ/mol for what they interpreted as diffusion creep. However, as the authors themselves noted, most of their mechanical data were acquired at a single temperature (1573 K), with only two data points at 1473 K and 1423 K from one run; this limited temperature coverage inevitably leads to substantial uncertainty in the derived activation energy. In addition, the inherent stress uncertainties in D-DIA experiments may also contribute to errors in flow law parameters. In contrast, our study, using a Paterson apparatus known for its superior stress resolution and stability, provides a more reliable activation energy of Q = 365 ± 22.7 kJ/mol.
Theoretical and experimental studies have established that diffusional creep in olivine is rate-controlled by the diffusion of the slowest species, silicon [34,35]. Jaoul. [34] proposed a multicomponent diffusion model in which the activation energy for creep is the sum of that for silicon diffusion and that for the formation of octahedral vacancies (VMe). For lattice (volume) diffusion of Si in forsterite, the reported activation energy is ~410 kJ/mol [35], whereas Si grain-boundary diffusion exhibits a significantly lower activation energy of 245 ± 10 kJ/mol [36] or 220 ± 30 kJ/mol [37]. Our determined Q = 365 ± 22.7 kJ/mol lies between these two values—higher than that for Si grain-boundary diffusion but lower than that for Si lattice diffusion. This observation suggests that the diffusion creep of our forsterite aggregates is not purely controlled by Si lattice diffusion (which would yield a higher Q approaching ~410 kJ/mol), nor is it exclusively governed by Si grain-boundary diffusion (which would yield a lower Q of ~220–245 kJ/mol). Instead, the intermediate Q value may reflect a combination of grain-boundary and lattice diffusion contributions, or it may indicate that the diffusion of Si is coupled with the formation and migration of other defects (e.g., octahedral vacancies) during creep [34]. This is also consistent with the fact that our experimentally determined grain size exponent (p = 2.9) strongly supports Coble creep (grain-boundary diffusion control), yet the activation energy is somewhat elevated relative to pure grain-boundary diffusion values, possibly due to the contribution from vacancy formation or other defect-related processes. This value is in excellent agreement with the activation energy for grain boundary diffusion in olivine and is consistent with the Coble creep mechanism inferred from our grain size exponent.
To further compare the diffusion creep flow laws of forsterite, we normalized our results and those of Nishihara et al. [26] to common conditions of P = 300 MPa, T = 1573 K, and d = 1 μm, and plotted strain rate against differential stress on a logarithmic diagram (Figure 6). At a given differential stress, the strain rate predicted by the flow law of Nishihara et al. [26] is approximately 3‒4 times higher than that predicted by our flow law, indicating that their forsterite aggregates are significantly weaker. We attribute this discrepancy to the presence of ~10 vol.% enstatite in the starting material of Nishihara et al. [26]; McDonnell et al. [25] reported that increasing enstatite content from 0 to 2.5 vol.% reduces aggregate strength by a factor of 3‒4.
4.3.2. Comparison with Studies on Natural Olivine (Fo₉₀) and Other Compositions
Our forsterite flow law is a critical end-member for understanding the rheology of natural olivine, which typically contains ~10 mol% fayalite (Fo₉₀). Previous studies on diffusion creep in natural olivine aggregates (e.g., [9,20]) have reported similar activation energies (e.g., Q ≈ 347 kJ/mol) and stress exponents (n ≈ 1). However, our study provides a more precise constraint on the grain size exponent for the Mg-rich end-member.
The most significant compositional difference between our pure forsterite and natural olivine is the effect of iron. Zhao et al. [22,23] demonstrated that Fe-rich olivine exhibits lower viscosity but higher activation energy for both diffusion and dislocation creep. Figure 6 confirms that natural San Carlos olivine (~Fo₉₀) is considerably weaker than our pure forsterite, with strain rates approximately two orders of magnitude faster at equivalent conditions. This substantial weakening cannot be solely attributed to the iron effect documented by Zhao et al. [22,23]; other factors are also likely to contribute. First, natural minerals generally contain more trace impurities, which facilitate the generation of lattice defects and thereby enhance diffusivity. Second, natural San Carlos olivine aggregates inevitably contain secondary mineral phases—for instance, spinel [21] that is difficult to eliminate, or enstatite [20] that is purposely added to buffer Si fugacity during sample preparation. Finally, differences in sample fabrication procedures may result in distinct material characteristics, including crystallographic preferred orientation, grain boundary structure, and trace water content. Nevertheless, the iron-induced viscosity reduction observed in olivine solid solutions implies that upper mantle rheology is compositionally heterogeneous; regions with contrasting iron content (e.g., due to melt extraction or metasomatism) will exhibit corresponding viscosity variations.
Critically, because our samples are chemically synthesized, iron-free, and of high purity (≥98 vol.%), they lack not only Fe but also the trace impurities that would otherwise promote defect generation and enhance diffusion in natural olivine. Consequently, our forsterite aggregates exhibit significantly higher strength than natural Fe-bearing olivine. Our pure forsterite flow law therefore represents the highest-viscosity end-member for a given grain size and temperature under dry conditions—defining the viscosity upper bound for olivine-dominated mantle rocks. This end-member is essential for constructing accurate composite rheological models of the upper mantle, particularly for simulating the mechanical behavior of depleted, Mg-rich harzburgites in the lithospheric mantle.
4.3.3. Geological Implications
Our findings carry several profound implications for the dynamics and rheological stratification of the Earth’s upper mantle.
First, our flow law defines a rigorous viscosity upper bound for diffusion creep in olivine-dominated mantle rocks. Extrapolation of our flow law, together with published diffusion-creep laws for olivine and orthopyroxene, to mantle conditions using the 60-Ma oceanic geotherm of Turcotte and Schubert [38] (p. 221) and a reference grain size of 1 mm (Figure 7) shows that our pure forsterite consistently exhibits the highest viscosity at depths >100 km—approximately 2–3 orders of magnitude higher than the San Carlos olivine flow law of Hirth and Kohlstedt [20], and about 5 orders of magnitude higher than that of Karato et al. [21]. The orthopyroxene diffusion flow law [39] yields viscosities comparable to the San Carlos olivine of Hirth and Kohlstedt [20], i.e., ~2 orders of magnitude lower than our pure forsterite. This upper-bound framework provides a baseline for quantitatively evaluating the weakening effects of iron, water, trace impurities, and secondary phases in geodynamic models [40].
Second, the precisely determined grain size exponent (p = 2.9 ± 0.23) provides robust experimental evidence that Coble creep (grain-boundary diffusion) is the rate-controlling mechanism for diffusion creep in forsterite under upper-mantle conditions. This confirms that grain-boundary diffusion, rather than lattice diffusion (Nabarro–Herring creep), dominates in fine-grained mantle regions such as mylonite zones or domains undergoing dynamic recrystallization, resolving a long-standing debate in olivine rheology.
Third, the strong grain-size sensitivity ( ∝ d-2.9) implies that modest grain-size reduction can dramatically enhance strain rates—for example, decreasing grain size from 10 mm to 1 mm increases the creep rate by nearly three orders of magnitude. This positive feedback, whereby deformation promotes recrystallization and grain refinement, which in turn facilitates grain-size-sensitive diffusion creep, is a key mechanism for shear-zone localization and lithospheric weakening.
Fourth, the interplay between temperature and grain size governed by our flow law can explain the mechanical transition at the lithosphere–asthenosphere boundary (LAB). In cold, coarse-grained lithospheric mantle, dislocation creep is expected to dominate. However, with increasing temperature and potentially finer grain sizes (due to melt–rock interaction or recrystallization) near the LAB, a switch to Coble creep could occur, creating a low-viscosity zone that facilitates plate decoupling. Using our flow law and a reference grain size of 1 mm, we obtain viscosities on the order of ~10²² Pa·s at LAB depths (Figure 7), about three orders of magnitude higher than the geophysically inferred low-viscosity layer (~1019 Pa·s) beneath 50-Ma oceanic seafloor [41]. This discrepancy implies that either asthenospheric grain size must be substantially smaller than 1 mm (e.g., tens of micrometers) or that additional weakening mechanisms—such as iron content, water, partial melt, or secondary phases—are required to reconcile our end-member flow law with geophysical observations.
Fifth, our end-member flow law provides a key reference for understanding the compositional dependence of olivine rheology. While a complete description of Fe-induced weakening requires further systematic work on intermediate compositions and careful decoupling of Fe effects from those of impurities and secondary phases, the contrast between our Fo100 data and existing results on Fe-bearing olivine [22,23] highlights the substantial role of iron content. This end-member comparison offers a useful starting point for future efforts to parameterize Fe effects in diffusion-creep flow laws, though such parameterization will need to account for the complexity of natural systems. Moreover, integrating our end-member law with grain-growth kinetics and second-phase effects [28,42] will allow geodynamic models to incorporate lateral and vertical variations in mantle composition, moving beyond uniform rheological assumptions.
In summary, our study not only provides a well-constrained diffusion creep law for the Mg-end member of olivine but also establishes a quantitative upper-bound reference for mantle viscosity. This framework is indispensable for evaluating the relative contributions of iron, water, impurities, and grain size to upper-mantle weakening, and for constructing next-generation, compositionally aware rheological models.
5. Conclusions
- We have successfully synthesized high-purity (≥98 vol.%), iron-free, fine-grained (~0.7–1.0 μm) forsterite aggregates and deformed them under dry conditions in a high-precision Paterson gas-medium apparatus. Our experiments confirm that diffusion creep is the dominant deformation mechanism at 300 MPa, 1423–1523 K, and 50–380 MPa.
- robust flow law was determined: . The low stress exponent (n ≈ 1) and activation energy (Q ≈ 365 kJ/mol) are characteristic of diffusion creep.
- 3.
- The precisely determined grain size exponent (p = 2.9 ± 0.23) is in excellent agreement with the theoretical value for Coble creep (grain boundary diffusion), providing the first direct experimental evidence that grain boundary diffusion, not lattice diffusion, is the rate-controlling mechanism for diffusion creep in forsterite under upper mantle conditions.
- 4.
- Our chemically synthesized, iron-free, high-purity forsterite defines the Mg-end member flow law for the olivine solid solution system and represents the viscosity (diffusion creep dominant) upper bound for olivine-dominated mantle rocks under dry conditions. This end-member flow law, combined with the strong grain-size sensitivity of diffusion creep, provides a necessary constitutive framework for modeling shear zone formation, lithospheric weakening, and the rheological stratification of the Earth's mantle, with direct implications for large-scale geodynamic processes.
Author Contributions
Conceptualization, M.S. and J.L.; methodology, J.L. and H.W.; validation, J.L., X.Z. and Z.J.; formal analysis, J.L., H.W. and Z.J.; investigation, J.L., X.Z. and Z.J.; resources, M.S.; data curation, X.Z. and H.W.; writing—original draft preparation, J.L.; writing—review and editing, J.L. and M.S.; visualization, J.L. and X.Z.; supervision, M.S. and J.L.; project administration, M.S. and J.L.; funding acquisition, M.S. and J.L. All authors have read and agreed to the published version of the manuscript.
Funding
This research was funded by the National Natural Science Foundation of China grant 42374122, the Strategic Priority Research Program (B) of the Chinese Academy of Sciences, grant No. XDB0840200, the National Natural Science Foundation of China grant 42172243, 42372152, and the Guangdong Basic and Applied Basic Research Foundation, China grant 2022A1515012181.
Data Availability Statement
The data for this study are available from Li, Jianfeng; Zheng, Xiaodong; Wang, Hao; Jiang, Zhexuan; Song, Maoshuang (2026), “Diffusion Creep of Forsterite and its Grain Size Effects: New Constraints from High-Precision Gas-Medium Deformation Experiments”, Mendeley Data, V1, doi: 10.17632/8gvkhpynsz.1 (accessed on 21 July 2026).
Conflicts of Interest
The authors declare no conflicts of interest.
References
- Anderson, D.L.; Bass, J.D. Mineralogy and Composition of the Upper Mantle. Geophys. Res. Lett. 1984, 11, 637–640. [Google Scholar] [CrossRef]
- Ringwood, A.E. Composition and Petrology of the Earth's Mantle; McGraw-Hill: New York, NY, USA, 1975. [Google Scholar]
- Kohlstedt, D.L.; Evans, B.; Mackwell, S.J. Strength of the Lithosphere: Constraints Imposed by Laboratory Experiments. J. Geophys. Res. 1995, 100, 17587–17602. [Google Scholar] [CrossRef]
- Li, Z.; Gerya, T.V. Polyphase Formation and Exhumation of High- To Ultrahigh-Pressure Rocks in Continental Subduction Zone: Numerical Modeling and Application to the Sulu Ultrahigh-Pressure Terrane in Eastern China. J. Geophys. Res. 2009, 114, B09406. [Google Scholar] [CrossRef]
- Bai, Q.; Mackwell, S.J.; Kohlstedt, D.L. High-temperature Creep of Olivine Single Crystals, 1. Mechanical Results for Buffered Samples. J. Geophys. Res. 1991, 96, 2441–2463. [Google Scholar] [CrossRef]
- Bai, Q.; Kohlstedt, D.L. High-temperature Creep of Olivine Single Crystals, 2. Dislocation Structures. Tectonophysics 1992, 206, 1–29. [Google Scholar] [CrossRef]
- Mackwell, S.J.; Kohlstedt, D.L.; Paterson, M.S. The Role of Water in the Deformation of Olivine Single Crystals. J. Geophys. Res. 1985, 90, 11319–11333. [Google Scholar] [CrossRef]
- Demouchy, S.; Schneider, S.E.; Mackwell, S.J.; Zimmerman, M.E.; Kohlstedt, D.L. Experimental Deformation of Olivine Single Crystals at Lithospheric Temperatures. Geophys. Res. Lett. 2009, 36, L04304. [Google Scholar] [CrossRef]
- Mei, S.; Kohlstedt, D.L. Influence of Water on Plastic Deformation of Olivine Aggregates: 1. Diffusion Creep Regime. J. Geophys. Res. 2000a, 105, 21457–21469. [Google Scholar] [CrossRef]
- Mei, S.; Kohlstedt, D.L. Influence of Water on Plastic Deformation of Olivine Aggregates: 2. Dislocation Creep Regime. J. Geophys. Res. 2000b, 105, 21471–21481. [Google Scholar] [CrossRef]
- Carter, N.L.; Ave’Lallenmant, H.G. High Temperature Flow of Dunite and Peridotite. Geol. Soc. Am. Bull. 1970, 81, 2181–2202. [Google Scholar] [CrossRef]
- Post, R.L. High-temperature Creep of Mt. Burnet Dunite. Tectonophysics 1977, 42, 75–110. [Google Scholar] [CrossRef]
- Chopra, P.N.; Paterson, M.S. The Experimental Deformation of Dunite. Tectonophysics 1981, 78, 453–473. Available online: https://. [CrossRef]
- Chopra, P.N.; Paterson, M.S. The Role of Water in the Deformation of Dunite. J. Geophys. Res. 1984, 89, 7861–7876. [Google Scholar] [CrossRef]
- Tasaka, M.; Zimmerman, M.E.; Kohlstedt, D.L. Rheological Weakening of Olivine + Orthopyroxene Aggregates Due to Phase Mixing: 1. Mechanical Behavior. J. Geophys. Res. Solid Earth 2017a, 122, 7584–7596. [Google Scholar] [CrossRef]
- Tasaka, M.; Zimmerman, M.E.; Kohlstedt, D.L.; Stünitz, H.; Heilbronner, R. Rheological Weakening of Olivine + Orthopyroxene Aggregates Due to Phase Mixing: Part 2. Microstructural Development. J. Geophys. Res. Solid Earth 2017b, 122, 7597–7612. [Google Scholar] [CrossRef]
- Karato, S.; Wu, P. Rheology of the Upper Mantle: A Synthesis. Science 1993, 260, 771–778. [Google Scholar] [CrossRef]
- Karato, S.; Jung, H. Effects of Pressure on High-Temperature Dislocation Creep in Olivine. Philos. Mag. 2003, 83, 401–414. [Google Scholar] [CrossRef]
- Hirth, G.; Kohlstedt, D.L. Rheology of the Upper Mantle and the Mantle Wedge: A View from the Experimentalists. Geophys. Monogr. Ser. 2004, 138, 83–105. [Google Scholar] [CrossRef]
- Hirth, G.; Kohlstedt, D.L. Experimental Constraints on the Dynamics of the Partially Molten Upper Mantle: 2. Deformation in the Diffusion Creep Regime. J. Geophys. Res. 1995, 100, 15441–15449. [Google Scholar] [CrossRef]
- Karato, S.; Paterson, M.S.; Fitzgerald, J.D. Rheology of Synthetic Olivine Aggregates: Influence of Grain Size and Water. J. Geophys. Res. 1986, 91, 8151–8176. [Google Scholar] [CrossRef]
- Zhao, Y.H.; Zimmerman, M.E.; Kohlstedt, D.L. Effect of Iron Content on the Creep Behavior of Olivine: 1. Anhydrous Conditions. Earth Planet. Sci. Lett. 2009, 287, 229–240. [Google Scholar] [CrossRef]
- Zhao, Y.H.; Zimmerman, M.E.; Kohlstedt, D.L. Effect of Iron Content on the Creep Behavior of Olivine: 2. Hydrous Conditions. Phys. Earth Planet. Inter. 2018, 278, 26–33. [Google Scholar] [CrossRef]
- Tasaka, M.; Hiraga, T.; Kohlstedt, D.L. Creep Behavior of Fe-Bearing Olivine under Hydrous Conditions. J. Geophys. Res. Solid Earth 2015, 120, 6039–6057. [Google Scholar] [CrossRef]
- McDonnell, R.D.; Peach, C.J.; van Roermund, H.L.M.; Spiers, C.J. Effect of Varying Enstatite Content on the Deformation Behavior of Fine-Grained Synthetic Peridotite under Wet Conditions. J. Geophys. Res. 2000, 105, 13535–13553. [Google Scholar] [CrossRef]
- Nishihara, Y.; Ohuchi, T.; Kawazoe, T.; Spengler, D.; Tasaka, M.; Kikegawa, T.; Suzuki, A.; Ohtani, E. Rheology of Fine-Grained Forsterite Aggregate at Deep Upper Mantle Conditions. J. Geophys. Res. Solid Earth 2014, 119, 253–273. [Google Scholar] [CrossRef]
- Koizumi, S.; Hiraga, T.; Tachibana, C.; Tasaka, M.; Miyazaki, T.; Kobayashi, T.; Takamasa, A.; Ohashi, N.; Sano, S. Synthesis of Highly Dense and Fine-Grained Aggregates of Mantle Composites by Vacuum Sintering of Nano-Sized Mineral Powders. Phys. Chem. Miner. 2010, 37, 505–518. [Google Scholar] [CrossRef]
- Hiraga, T.; Tachibana, C.; Ohashi, N.; Sano, S. Grain Growth Systematics for Forsterite ± Enstatite Aggregates: Effect of Lithology on Grain Size in the Upper Mantle. Earth Planet. Sci. Lett. 2010, 291, 10–20. [Google Scholar] [CrossRef]
- Zheng, X.D.; Jiang, Z.X.; Li, J.F.; Xiao, P.; Song, M.S. Synthesis and preparation of forsterite polycrystalline aggregates and preliminary experimental study on their rheology. Geotecton. Metallog. (in Chinese with English abstract). 2024, 48, 1232–1239. [Google Scholar] [CrossRef]
- Li, J.F.; Shao, T.B.; Song, M.S.; Wang, H. Low-Temperature Plasticity and Dislocation Creep of Fangshan Dolomite. J. Geophys. Res. Solid Earth 2021, 126, e2020JB021439. [Google Scholar] [CrossRef]
- Li, J.F.; Song, M.S.; Shao, T.B.; Zheng, X.D.; Jiang, Z.X. Mechanical Data Corrections for Triaxial Compression Testing at High Pressures and High Temperatures with a Paterson Gas-Medium Mechanical Testing Apparatus. Rev. Sci. Instrum. 2023, 94, 083907. [Google Scholar] [CrossRef] [PubMed]
- Underwood, E.E. Quantitative Stereology; Addison-Wesley: Reading, MA, USA, 1969. [Google Scholar] [CrossRef]
- Karato, S. Grain Growth Kinetics in Olivine Aggregates. Tectonophysics 1989, 168, 255–273. [Google Scholar] [CrossRef]
- Jaoul, O. Multicomponent Diffusion and Creep in Olivine. J. Geophys. Res. 1990, 95, 17631–17642. [Google Scholar] [CrossRef]
- Fei, H.; Hegoda, C.; Yamazaki, D.; Wiedenbeck, M.; Yurimoto, H.; Shcheka, S.; Katsura, T. High Silicon Self-Diffusion Coefficient in Dry Forsterite. Earth Planet. Sci. Lett. 2012, 345–348, 95–103. [Google Scholar] [CrossRef]
- Fei, H.; Koizumi, S.; Sakamoto, N.; Hashiguchi, M.; Yurimoto, H.; Marquardt, K.; Miyajima, N.; Yamazaki, D.; Katsura, T. Silicon Grain Boundary Diffusion in Forsterite and Implications to Upper Mantle Rheology. AGU Fall Meet. Abstr. 2014, MR51A–03. [Google Scholar]
- Fei, H.; Koizumi, S.; Sakamoto, N.; Hashiguchi, M.; Yurimoto, H.; Marquardt, K.; Miyajima, N.; Yamazaki, D.; Katsura, T. New Constraints on Upper Mantle Creep Mechanism Inferred from Silicon Grain-Boundary Diffusion Rates. Earth Planet. Sci. Lett. 2016, 433, 350–359. Available online: http://. [CrossRef]
- Turcotte, D.L.; Schubert, G. Geodynamics, 3rd ed.; Cambridge University Press: Cambridge, UK, 2014. [Google Scholar]
- Zhang, G.N.; Mei, S.H.; Song, M.S.; Kohlstedt, D.L. Diffusion Creep of Enstatite at High Pressures Under Hydrous Conditions. J. Geophys. Res. Solid Earth 2017, 122, 7718–7728. [Google Scholar]
- Jain, C.; Korenaga, J.; Karato, S. On the Grain Size Sensitivity of Olivine Rheology. J. Geophys. Res. Solid Earth 2015, 120, 674–688. [Google Scholar] [CrossRef]
- Yabe, K.; Hiraga, T. Grain-Boundary Diffusion Creep of Olivine: 2. Solidus Effects and Consequences for the Viscosity of the Oceanic Upper Mantle. J. Geophys. Res. Solid Earth 2020, 125, e2020JB019416. [Google Scholar] [CrossRef]
- Tasaka, M.; Hiraga, T.; Kohlstedt, D.L. Influence of Mineral Fraction on the Rheological Properties of Forsterite + Enstatite during Grain-Size-Sensitive Creep: 2. Deformation Experiments. J. Geophys. Res. Solid Earth 2013, 118, 3991–4012. [Google Scholar] [CrossRef]
Figure 1.
Characterization of synthesized forsterite aggregates. (a) Raman spectra of the synthesized forsterite sample, consistent with that reported by Zheng et al. [29], showing characteristic forsterite peaks; no distinct orthopyroxene peaks were detected. (b) Back-scattered electron (BSE) image of the polished sample surface after sintering, showing uniform contrast without detectable second phases, indicating a purity of ≥98 vol.%.
Figure 1.
Characterization of synthesized forsterite aggregates. (a) Raman spectra of the synthesized forsterite sample, consistent with that reported by Zheng et al. [29], showing characteristic forsterite peaks; no distinct orthopyroxene peaks were detected. (b) Back-scattered electron (BSE) image of the polished sample surface after sintering, showing uniform contrast without detectable second phases, indicating a purity of ≥98 vol.%.
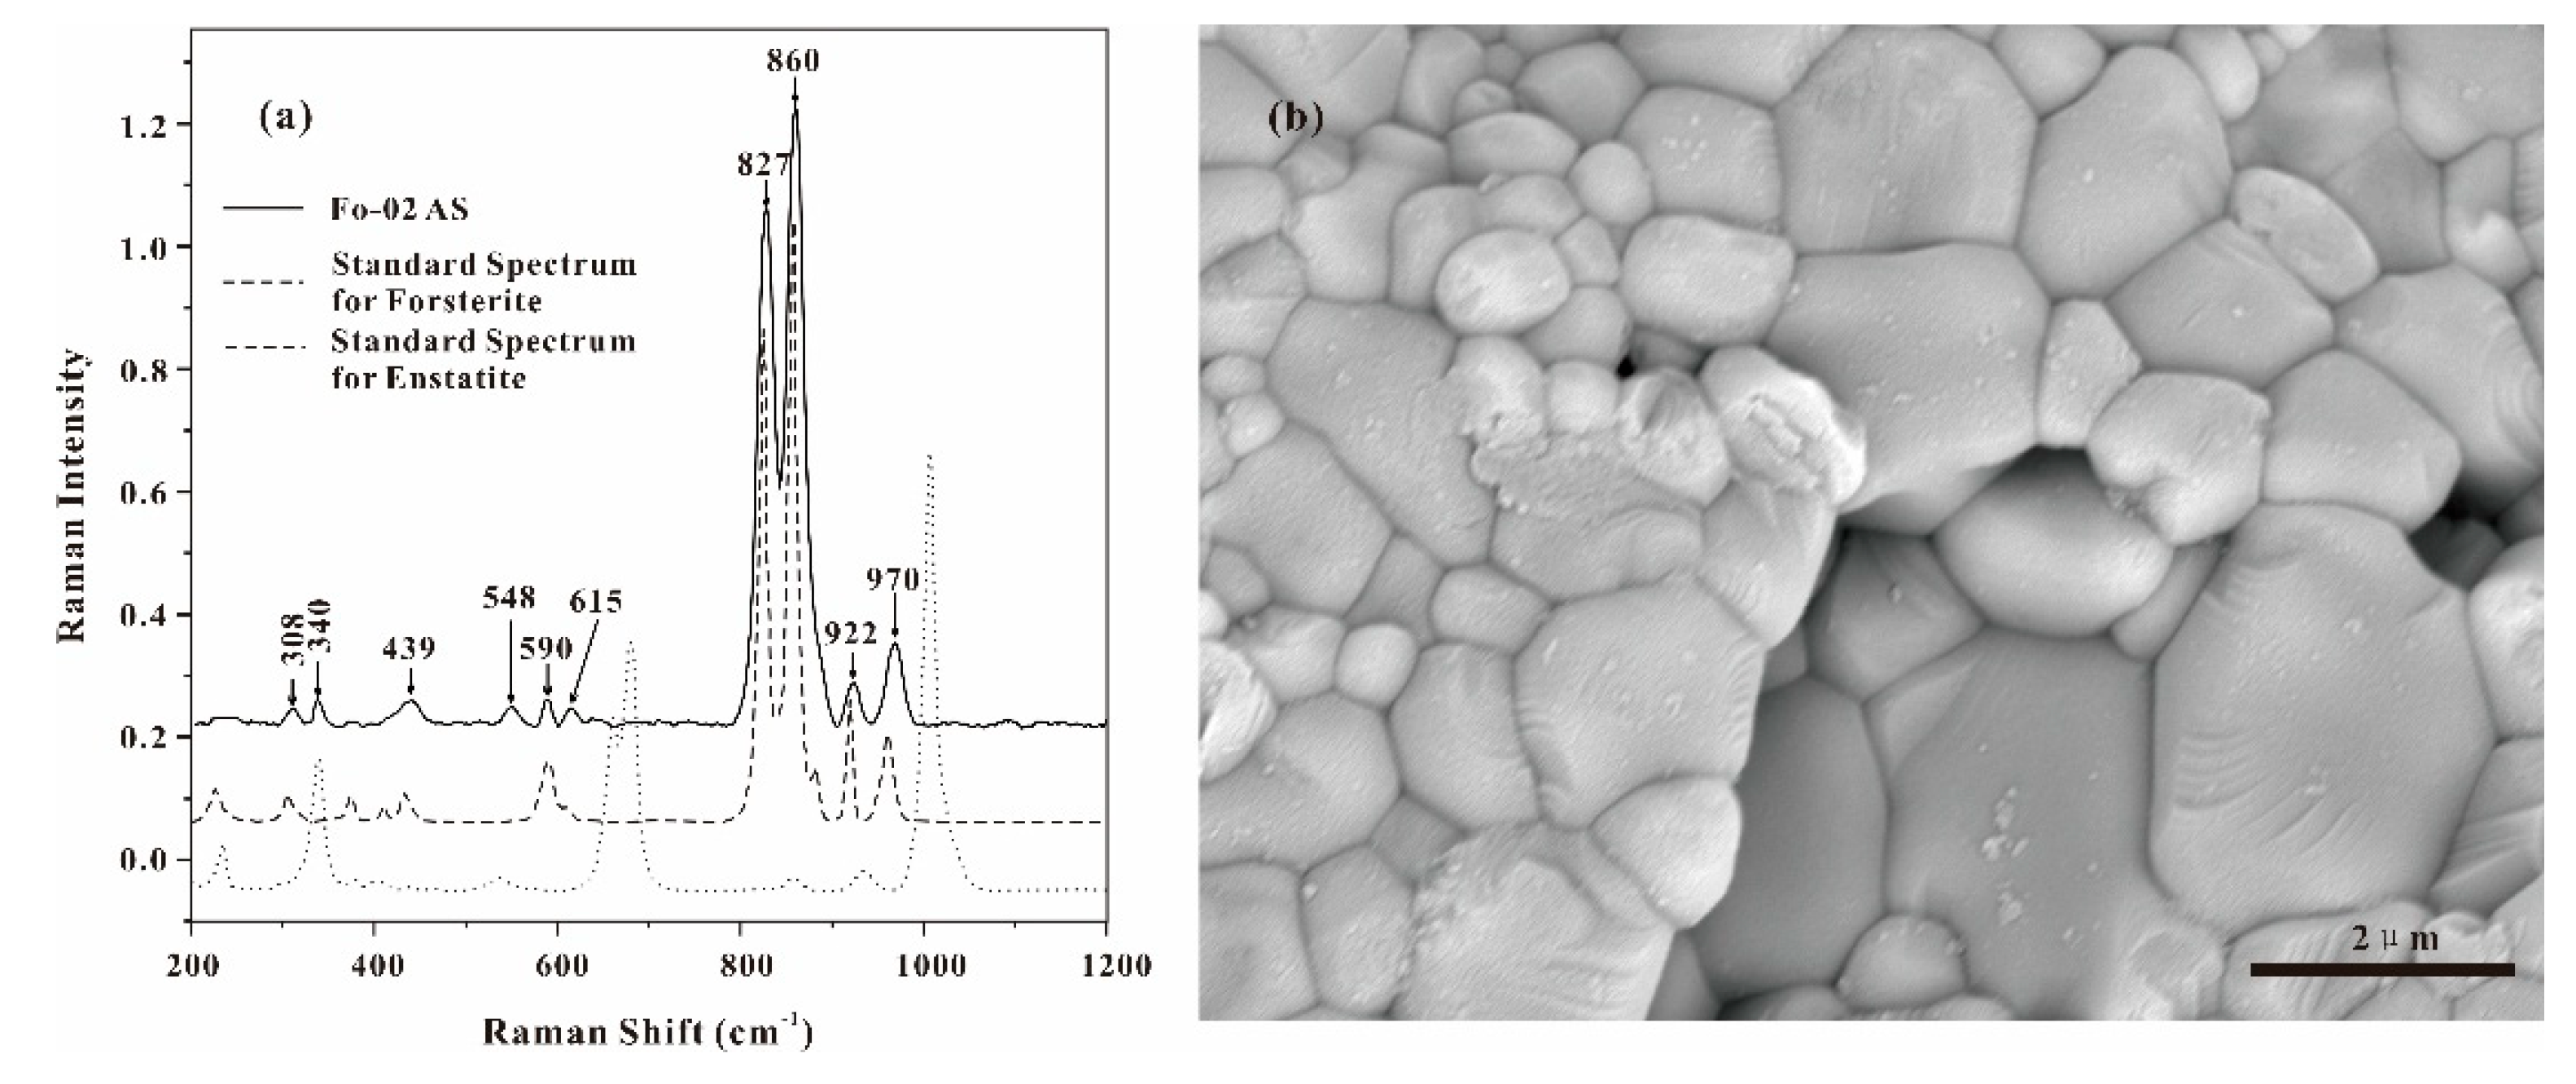
Figure 2.
Representative secondary electron (SE) images of forsterite aggregates as sintered (AS), after hot-pressing and before deformation (BD), and after deformation (AD), respectively. (a) As-sintered sample (4 h; Fo‒02 AS) showing ~5% porosity (possible pores are outlined by yellow dashed lines) and equant polygonal grains. (b) After hot-pressing at 300 MPa and 1423–1523 K for 1–2 h, porosity of Fo‒02 BD is reduced to <2% (yellow dashed lines indicate residual pores). (c–e) Deformed samples (4 h sintered, Fo‒01 AD, Fo‒02 AD and Fo‒03 AD) showing grain growth and preserved equant morphology. (f) As-sintered sample (8 h Fo‒11 AS) with larger initial grain size (~1 μm). (g–h) Deformed samples (8 h sintered, Fo‒09 AD and Fo‒11 AD) showing further grain growth. Grains remain equant and polygonal with no evidence of dislocation-related microstructures.
Figure 2.
Representative secondary electron (SE) images of forsterite aggregates as sintered (AS), after hot-pressing and before deformation (BD), and after deformation (AD), respectively. (a) As-sintered sample (4 h; Fo‒02 AS) showing ~5% porosity (possible pores are outlined by yellow dashed lines) and equant polygonal grains. (b) After hot-pressing at 300 MPa and 1423–1523 K for 1–2 h, porosity of Fo‒02 BD is reduced to <2% (yellow dashed lines indicate residual pores). (c–e) Deformed samples (4 h sintered, Fo‒01 AD, Fo‒02 AD and Fo‒03 AD) showing grain growth and preserved equant morphology. (f) As-sintered sample (8 h Fo‒11 AS) with larger initial grain size (~1 μm). (g–h) Deformed samples (8 h sintered, Fo‒09 AD and Fo‒11 AD) showing further grain growth. Grains remain equant and polygonal with no evidence of dislocation-related microstructures.
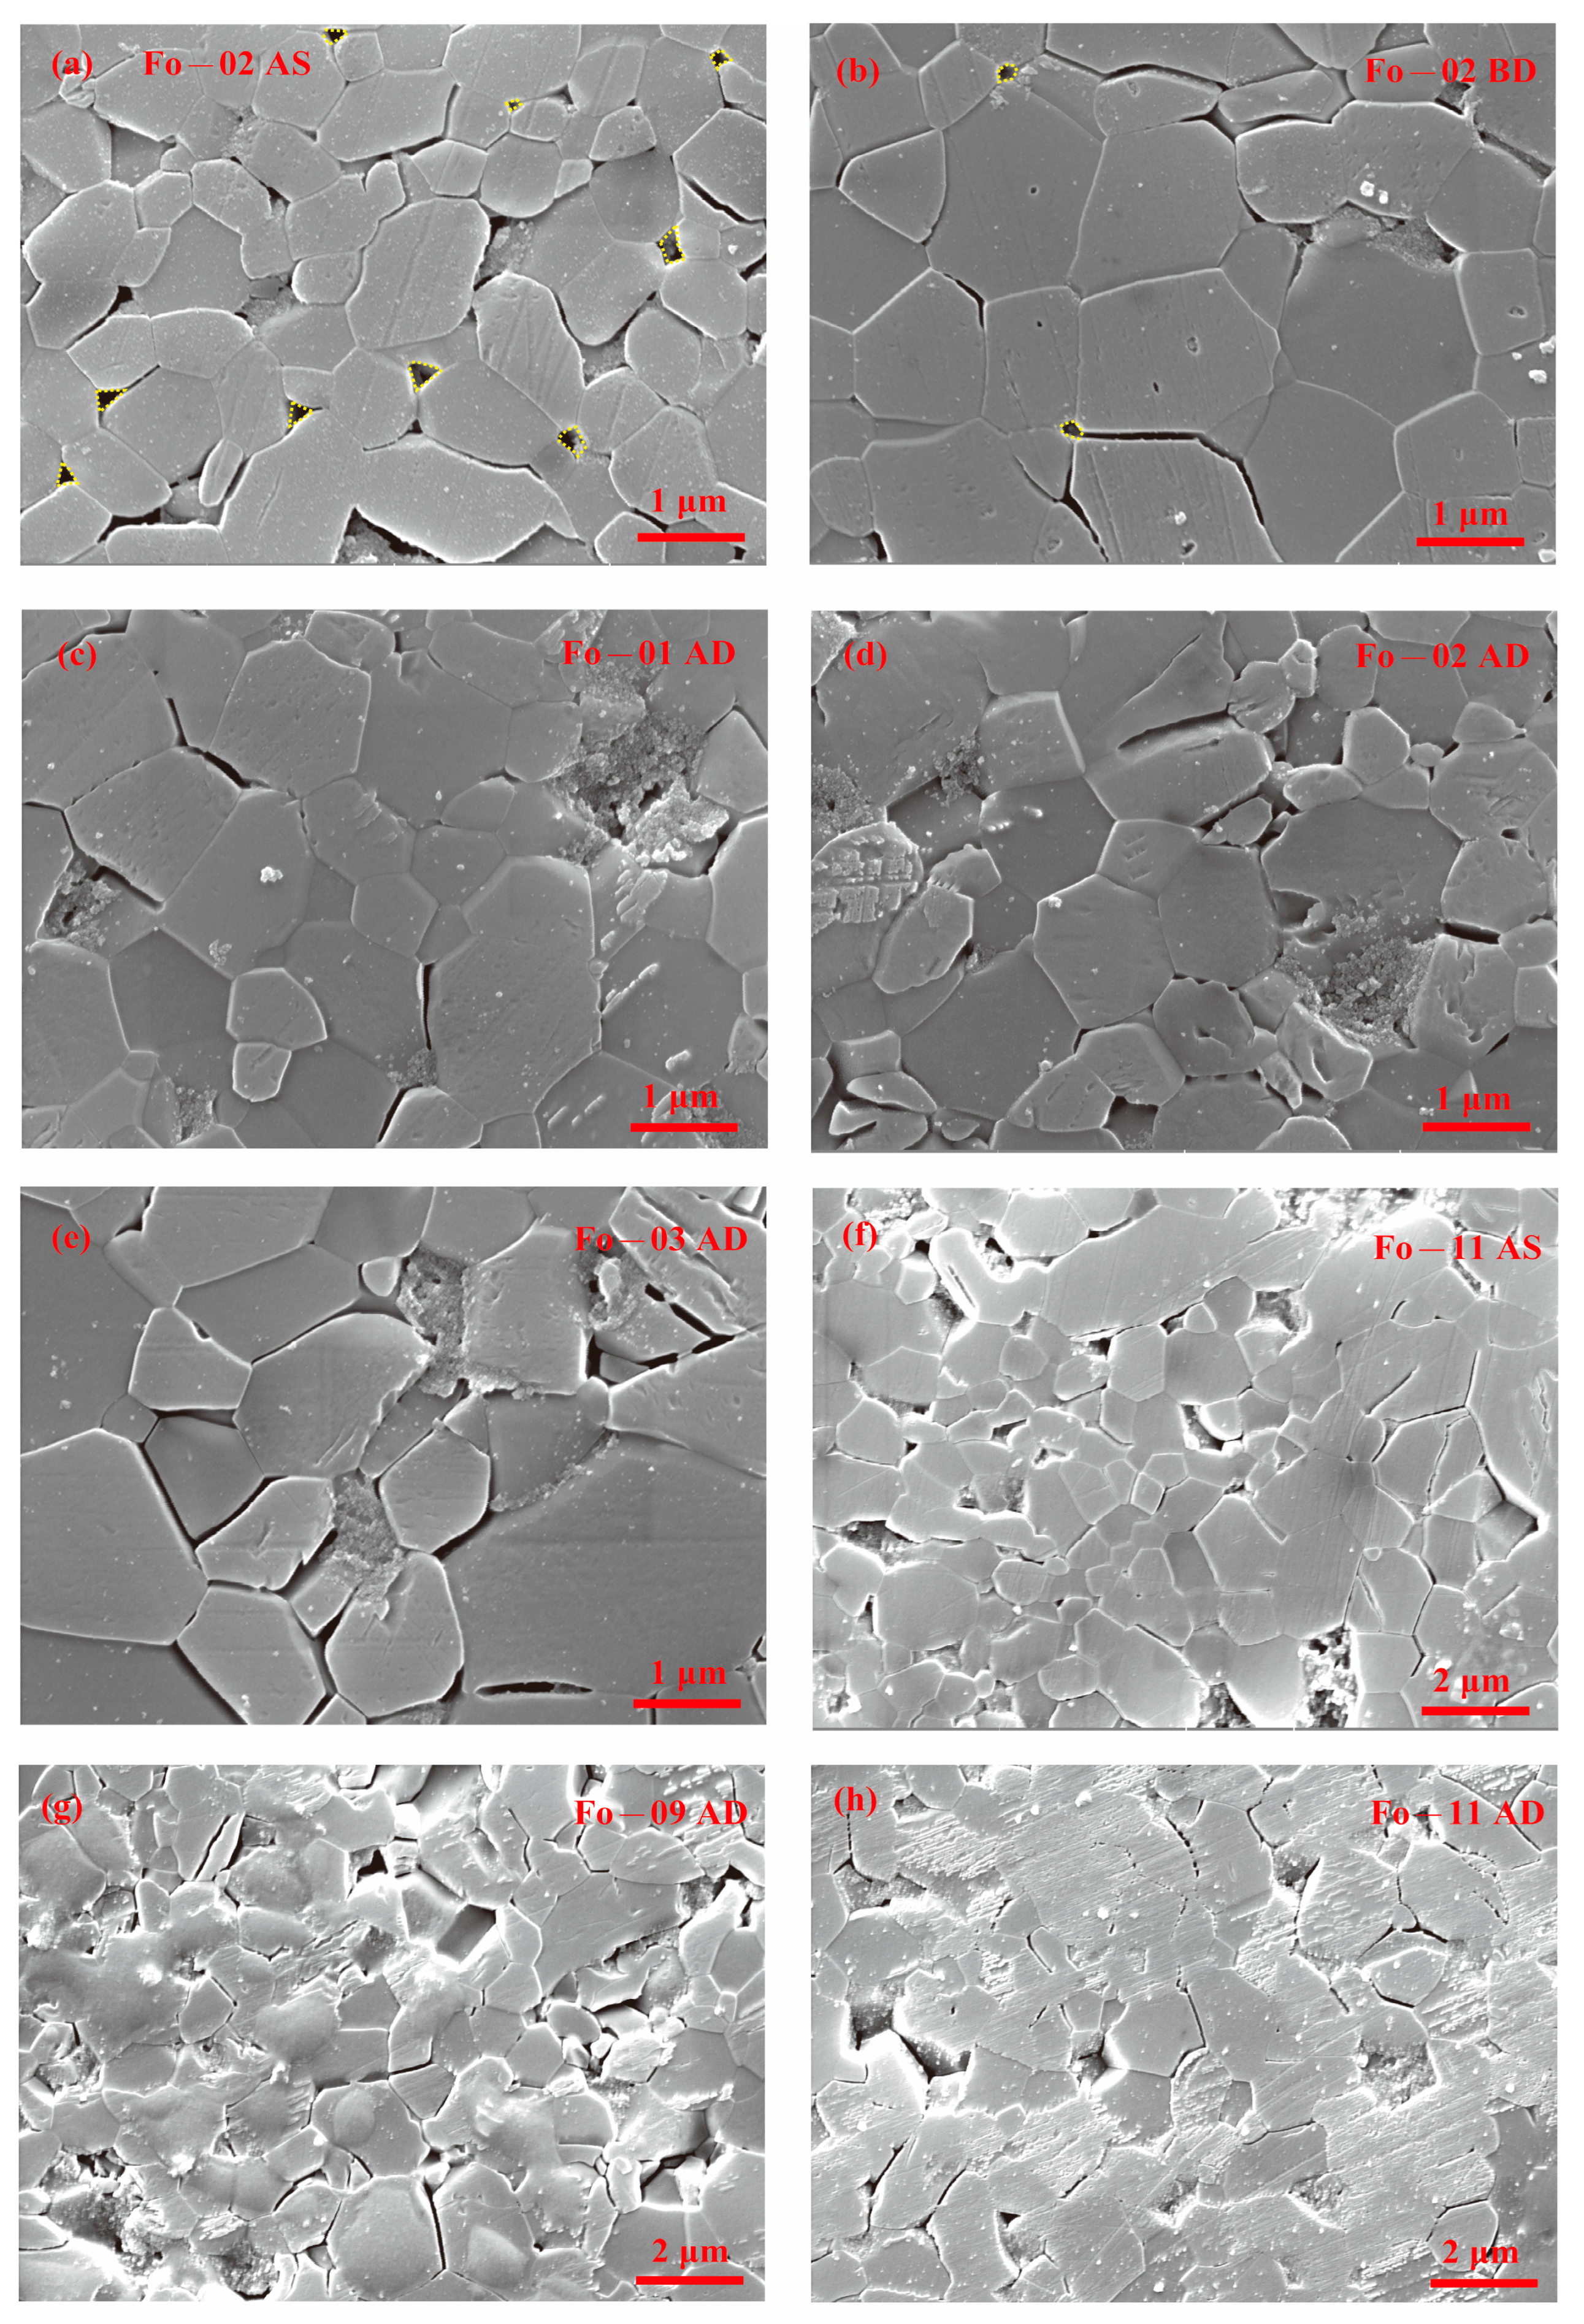
Figure 3.
Grain size distributions of forsterite aggregates measured by the linear intercept method. (a) As-sintered sample (4 h; Fo‒02 AS), (b-d) deformation samples from forsterite aggregates sintered for 4 h, (b) Fo‒01 AD, (c) Fo‒02 AD, and (d) Fo‒03 AD; (e) As-sintered sample (8 h; Fo‒11 AS), (f–h) deformation samples from forsterite aggregates sintered for 8 h, (f) Fo‒09 AD, (g) Fo‒10 AD, and (h) Fo‒11 AD. Each histogram is based on measurements of about 200 grains. Mean grain sizes are indicated in each panel.
Figure 3.
Grain size distributions of forsterite aggregates measured by the linear intercept method. (a) As-sintered sample (4 h; Fo‒02 AS), (b-d) deformation samples from forsterite aggregates sintered for 4 h, (b) Fo‒01 AD, (c) Fo‒02 AD, and (d) Fo‒03 AD; (e) As-sintered sample (8 h; Fo‒11 AS), (f–h) deformation samples from forsterite aggregates sintered for 8 h, (f) Fo‒09 AD, (g) Fo‒10 AD, and (h) Fo‒11 AD. Each histogram is based on measurements of about 200 grains. Mean grain sizes are indicated in each panel.
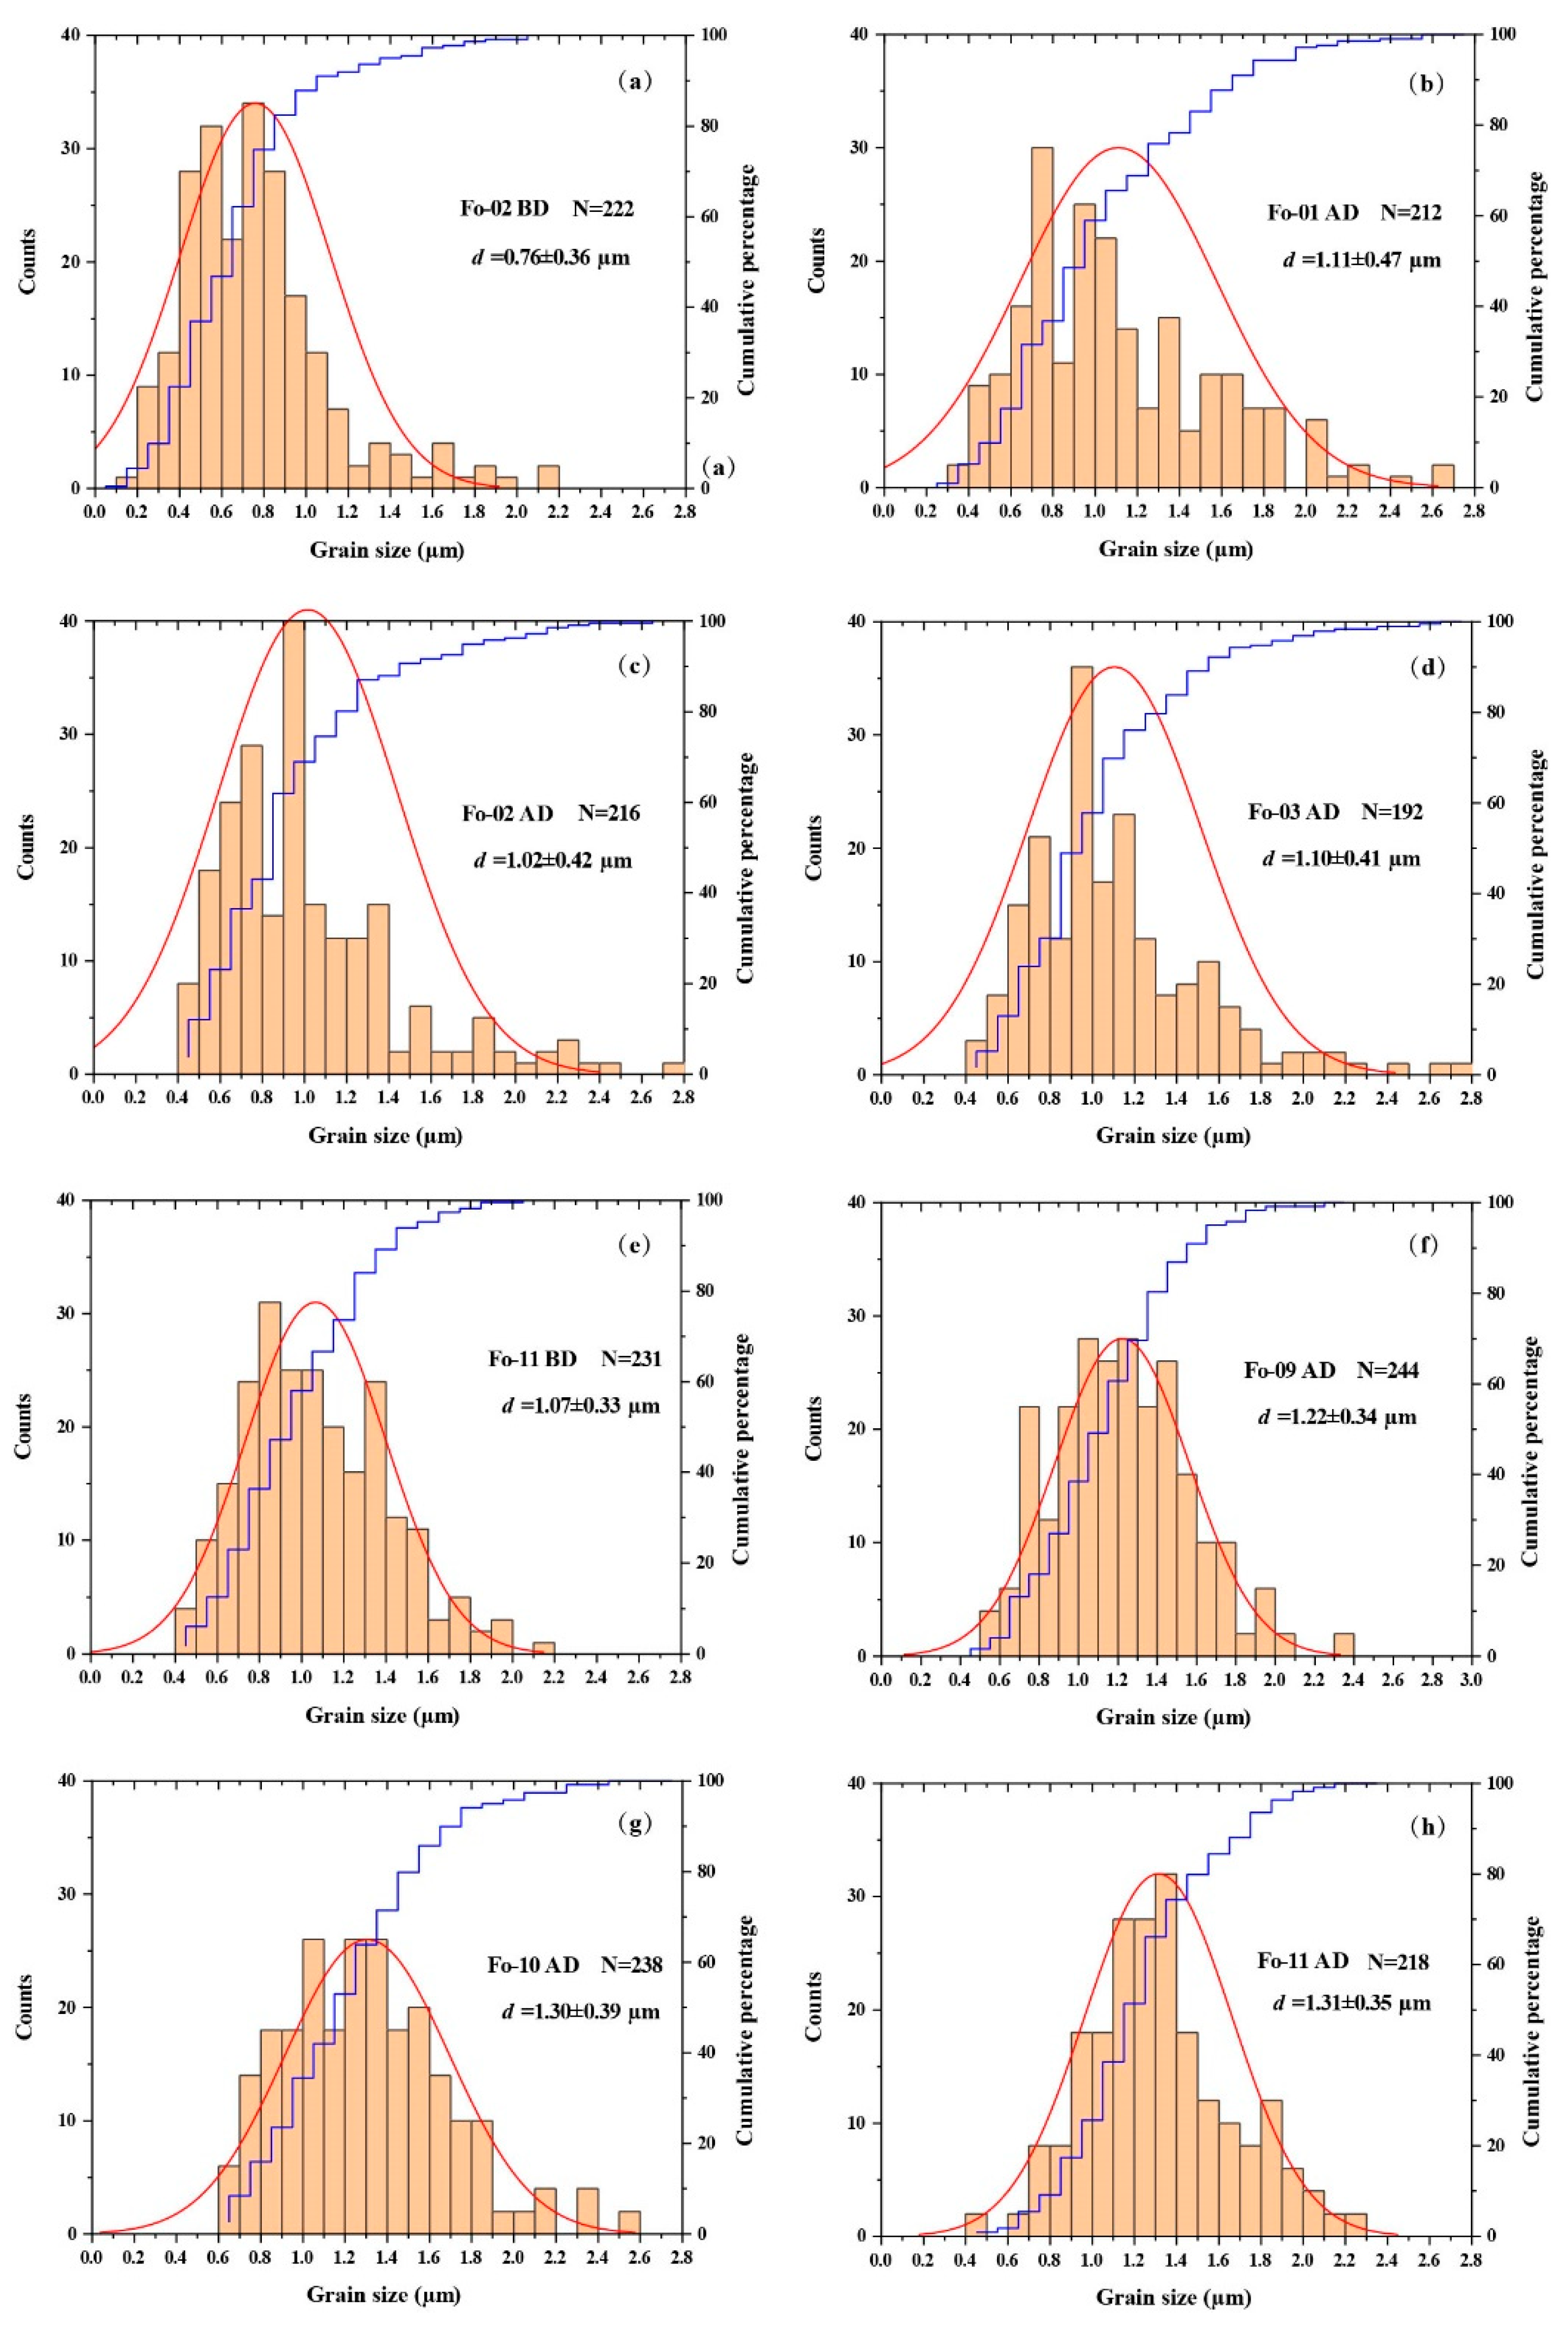
Figure 4.
Representative stress–time and strain–time curves from stepwise constant-stress creep experiments. (a) Fo‒03. (b) Fo‒10. Solid lines indicate the applied differential stress at each loading stage, while dashed lines show the corresponding axial strain. The differential stress and strain rate values are annotated adjacent to the respective solid and dashed lines for each stage. Different colors denote deformation temperatures: black for 1423 K, blue for 1473 K, and red for 1523 K.
Figure 4.
Representative stress–time and strain–time curves from stepwise constant-stress creep experiments. (a) Fo‒03. (b) Fo‒10. Solid lines indicate the applied differential stress at each loading stage, while dashed lines show the corresponding axial strain. The differential stress and strain rate values are annotated adjacent to the respective solid and dashed lines for each stage. Different colors denote deformation temperatures: black for 1423 K, blue for 1473 K, and red for 1523 K.
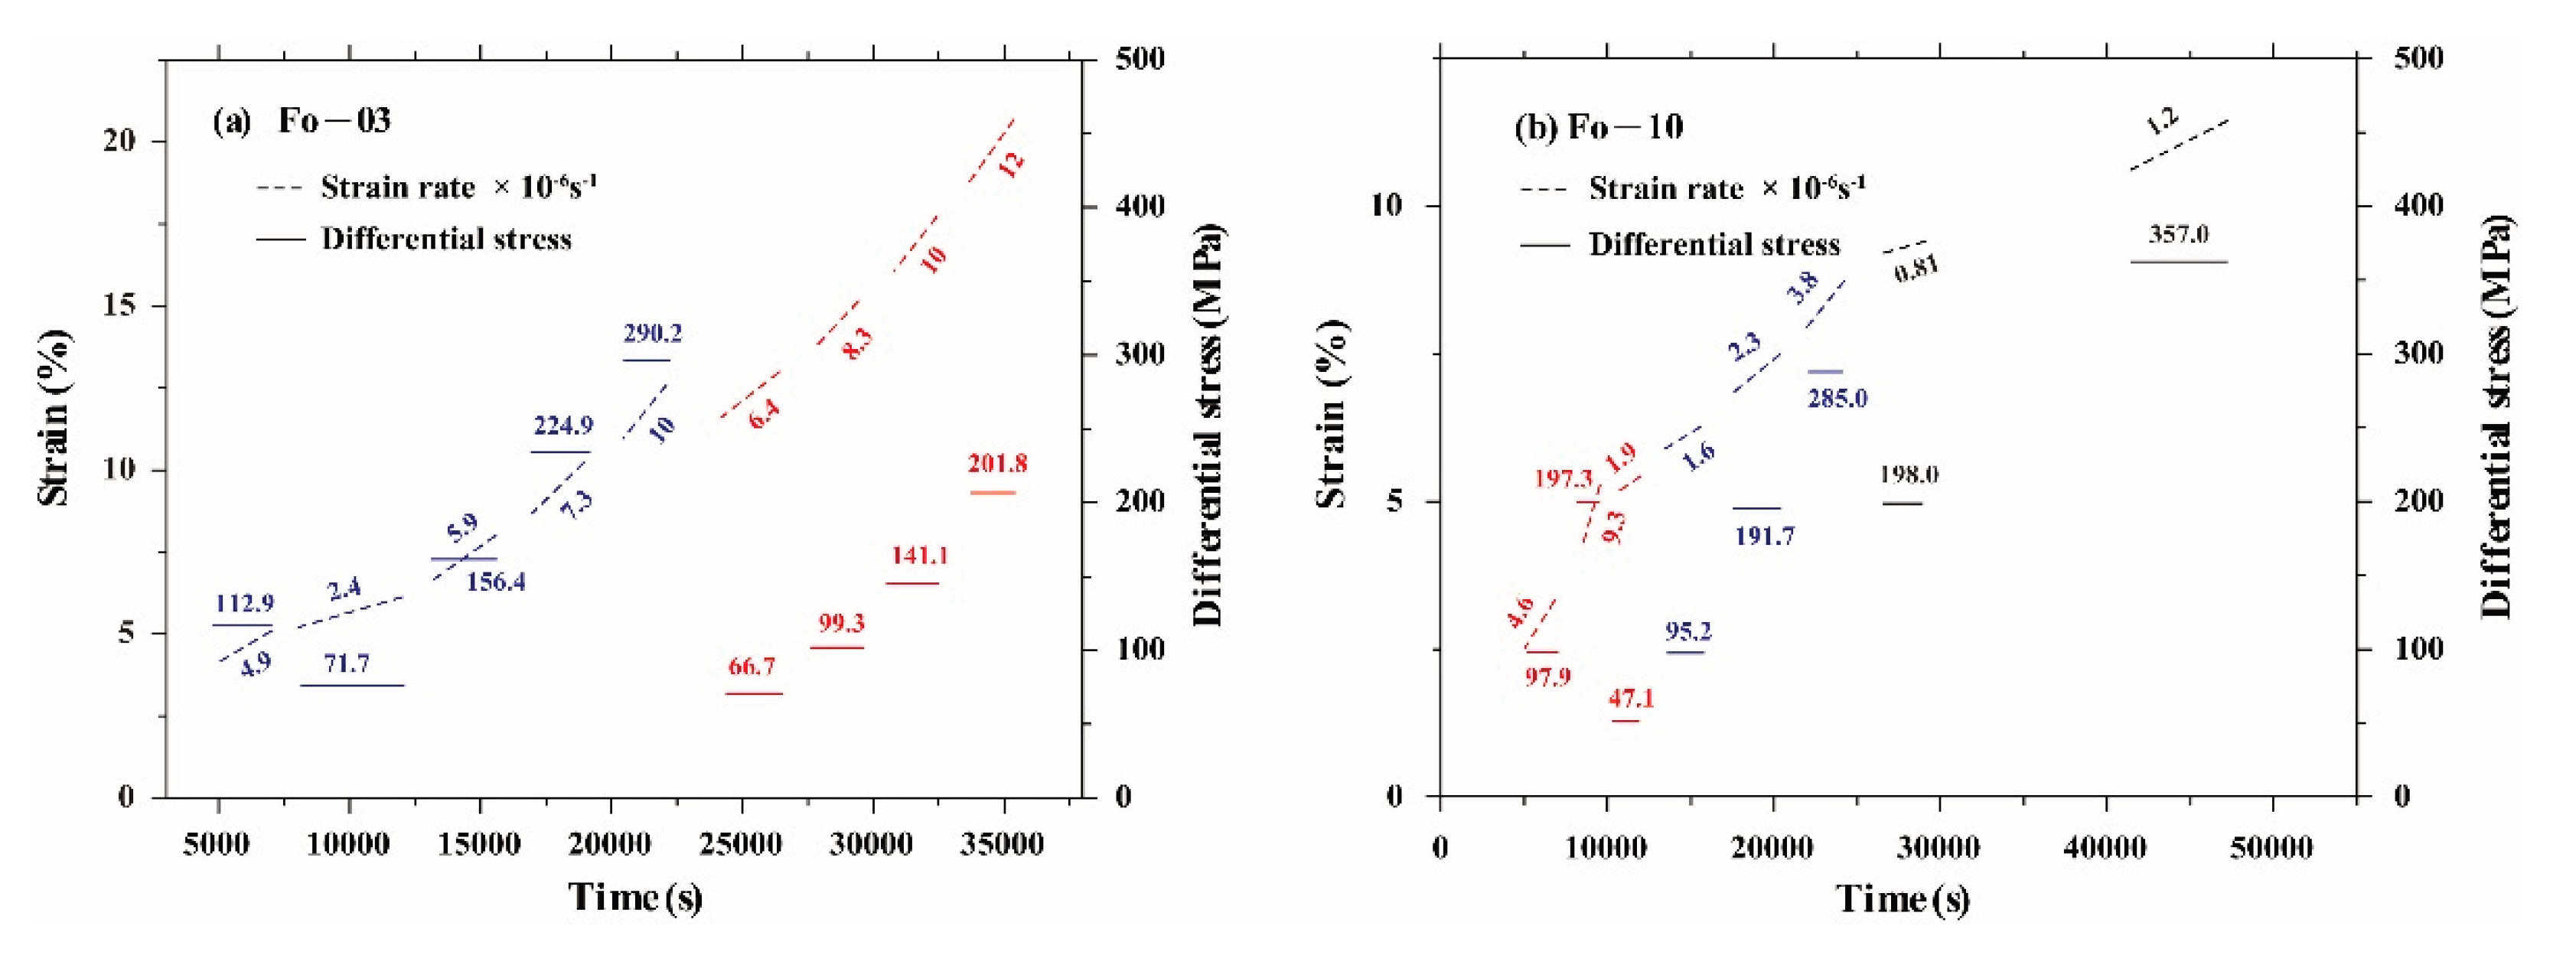
Figure 5.
Mechanical results and flow law determination for forsterite diffusion creep. (a) Strain rate versus differential stress for all experiments; samples sintered for 8 h (larger grain size; open symbols) are systematically stronger than those sintered for 4 h (solid symbols). (b) Strain rate normalized by grain size terms versus differential stress, yielding separated fitting stress exponents of n = 1.1 ± 0.2 at 1523 K, n = 1.1 ± 0.1 at 1473 K and n = 0.7 ± 0.1 at 1423 K, respectively. (c) Strain rate normalized by grain size and stress terms versus 1000/T, yielding an activation energy Q = 365 ± 18.6 kJ/mol. (d) Strain rate normalized by temperature and stress terms versus grain size, yielding a grain size exponent p = 2.9 ± 0.2.
Figure 5.
Mechanical results and flow law determination for forsterite diffusion creep. (a) Strain rate versus differential stress for all experiments; samples sintered for 8 h (larger grain size; open symbols) are systematically stronger than those sintered for 4 h (solid symbols). (b) Strain rate normalized by grain size terms versus differential stress, yielding separated fitting stress exponents of n = 1.1 ± 0.2 at 1523 K, n = 1.1 ± 0.1 at 1473 K and n = 0.7 ± 0.1 at 1423 K, respectively. (c) Strain rate normalized by grain size and stress terms versus 1000/T, yielding an activation energy Q = 365 ± 18.6 kJ/mol. (d) Strain rate normalized by temperature and stress terms versus grain size, yielding a grain size exponent p = 2.9 ± 0.2.
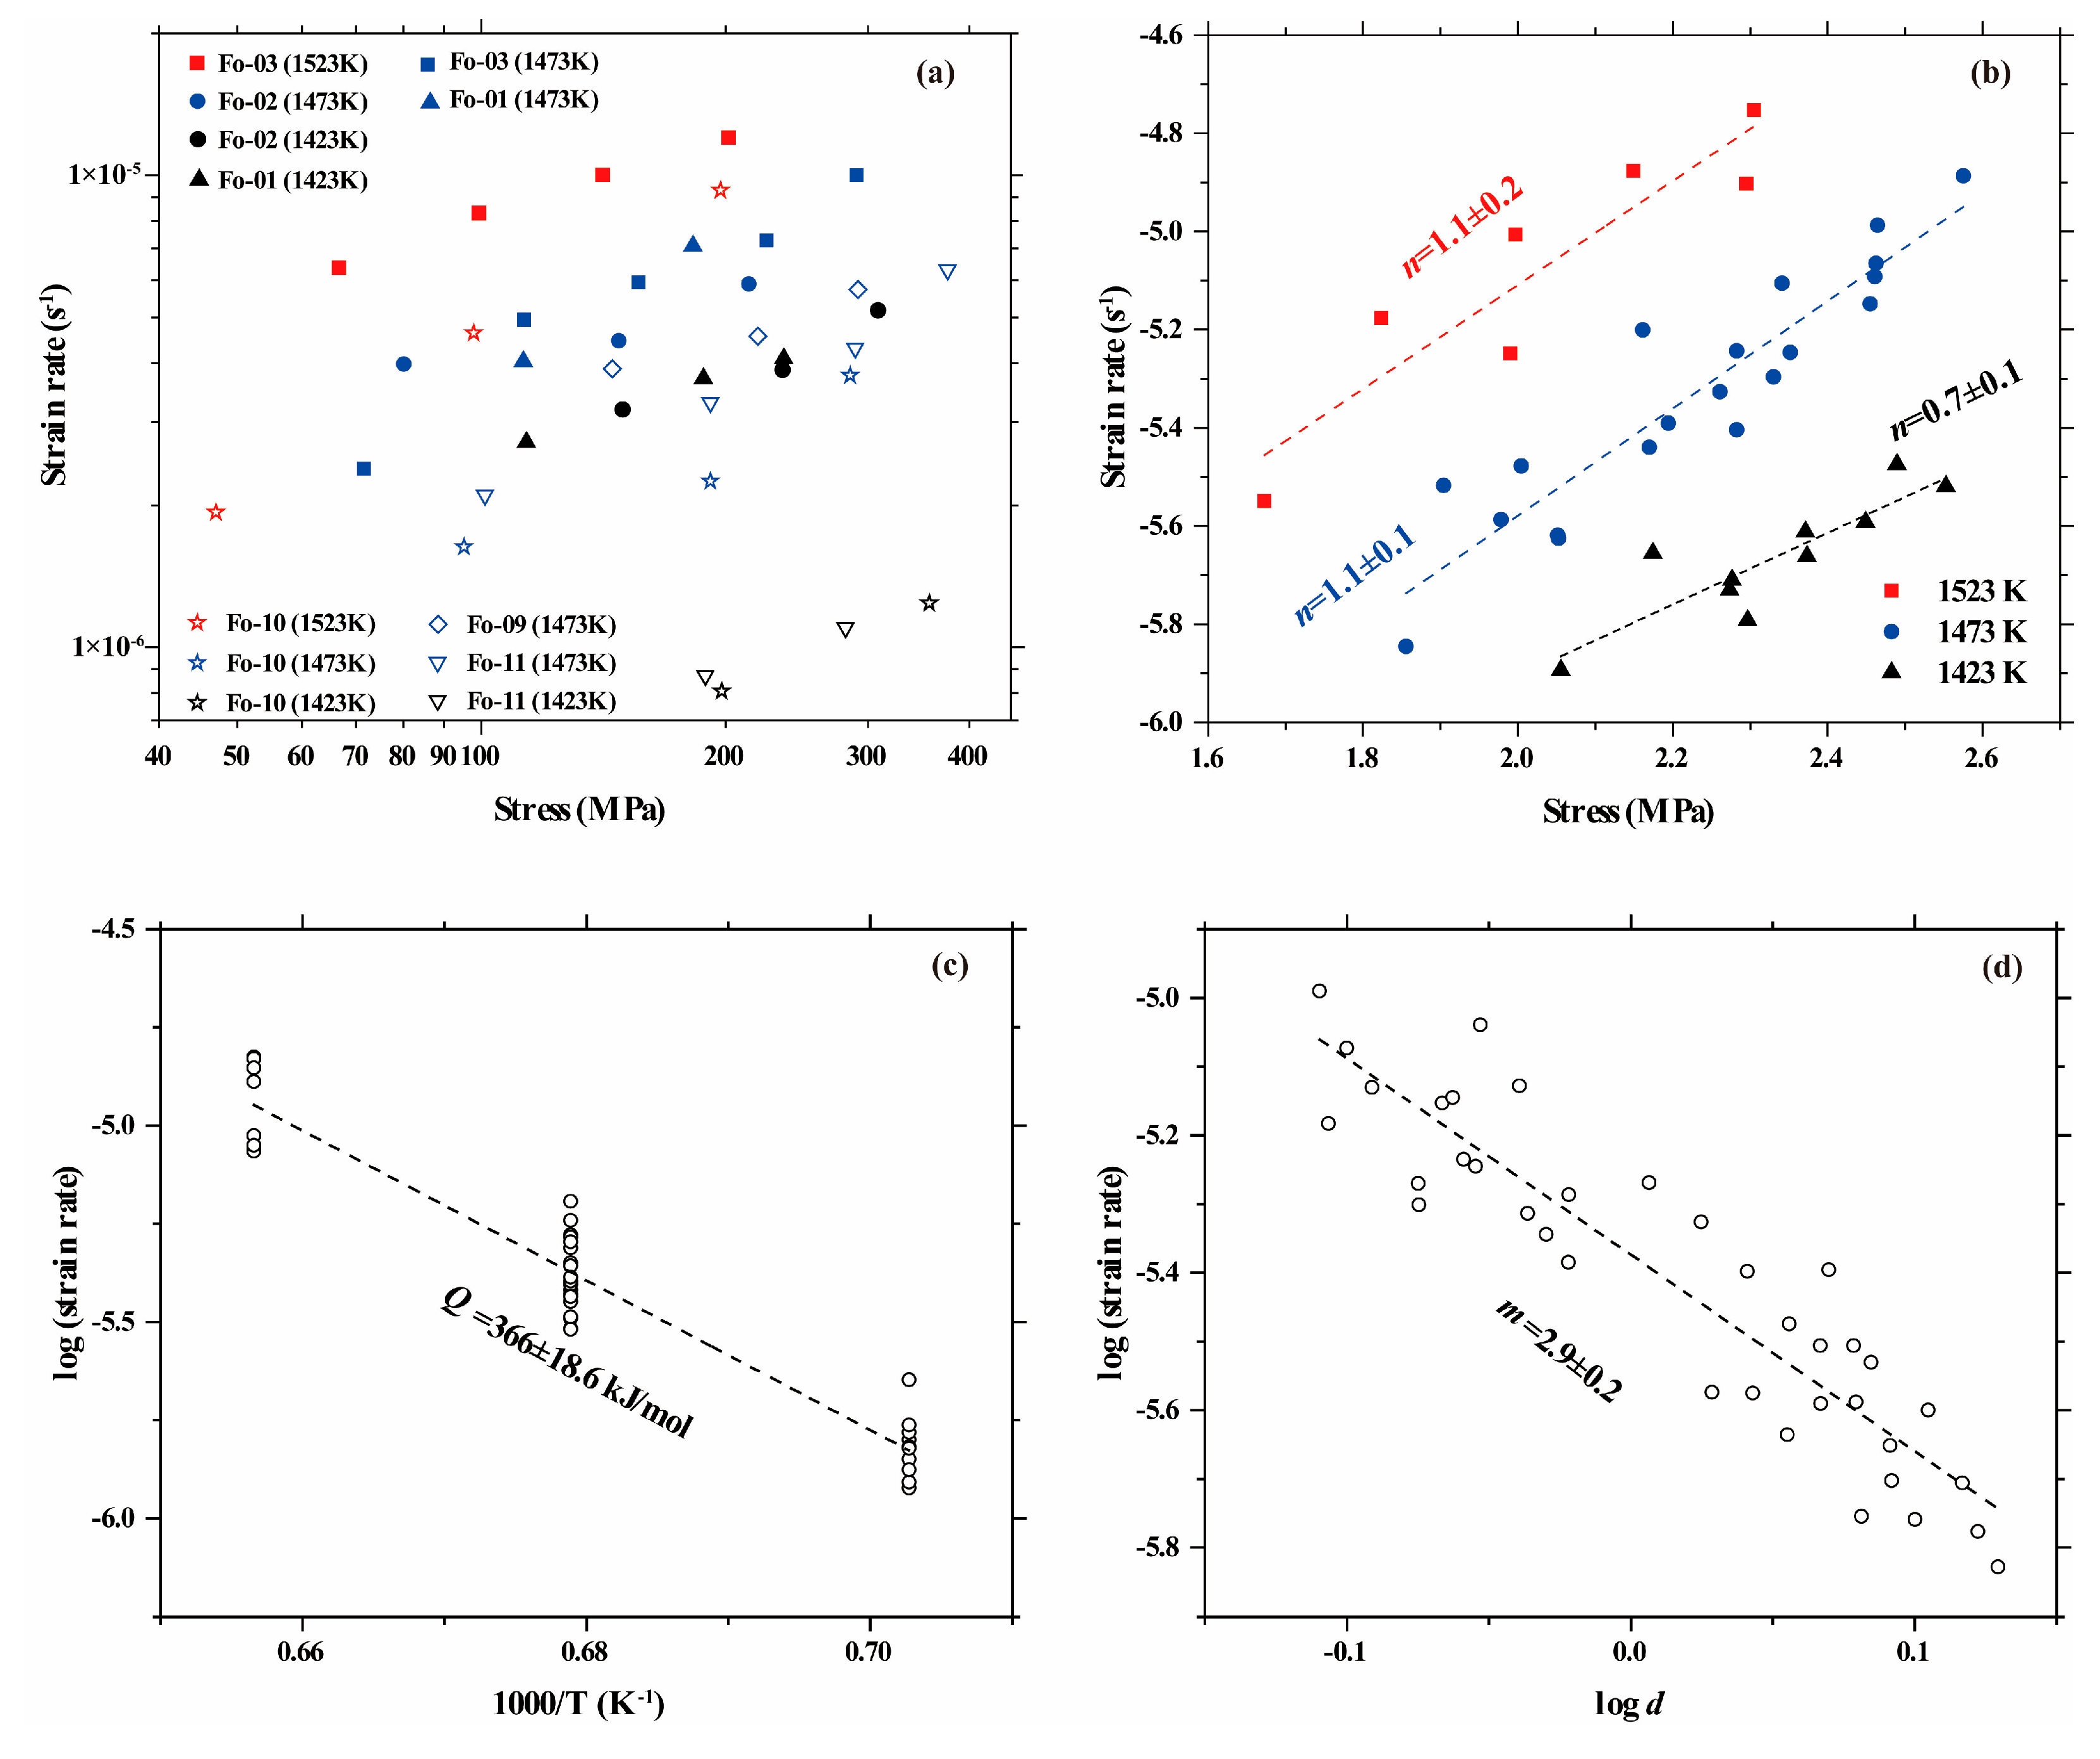
Figure 6.
Comparison of diffusion creep flow laws for forsterite and natural olivine aggregates. All data are normalized to P = 300 MPa, T = 1573 K, and d = 1 μm. Red solid line: our forsterite flow law (this study). Red dashed line: flow law of Nishihara et al. [26] for forsterite aggregates containing ~10 vol.% enstatite. Blue solid and dash lines: flow laws for natural San Carlos olivine (Fo₉₀) from Karato et al. [21], and Hirth and Kohlstedt [20], respectively. Our pure forsterite exhibits the highest strength among the four, representing the viscosity upper bound for olivine-dominated mantle rocks. The weaker behavior of natural olivine reflects the combined effects of iron content, secondary phases, and impurities.
Figure 6.
Comparison of diffusion creep flow laws for forsterite and natural olivine aggregates. All data are normalized to P = 300 MPa, T = 1573 K, and d = 1 μm. Red solid line: our forsterite flow law (this study). Red dashed line: flow law of Nishihara et al. [26] for forsterite aggregates containing ~10 vol.% enstatite. Blue solid and dash lines: flow laws for natural San Carlos olivine (Fo₉₀) from Karato et al. [21], and Hirth and Kohlstedt [20], respectively. Our pure forsterite exhibits the highest strength among the four, representing the viscosity upper bound for olivine-dominated mantle rocks. The weaker behavior of natural olivine reflects the combined effects of iron content, secondary phases, and impurities.
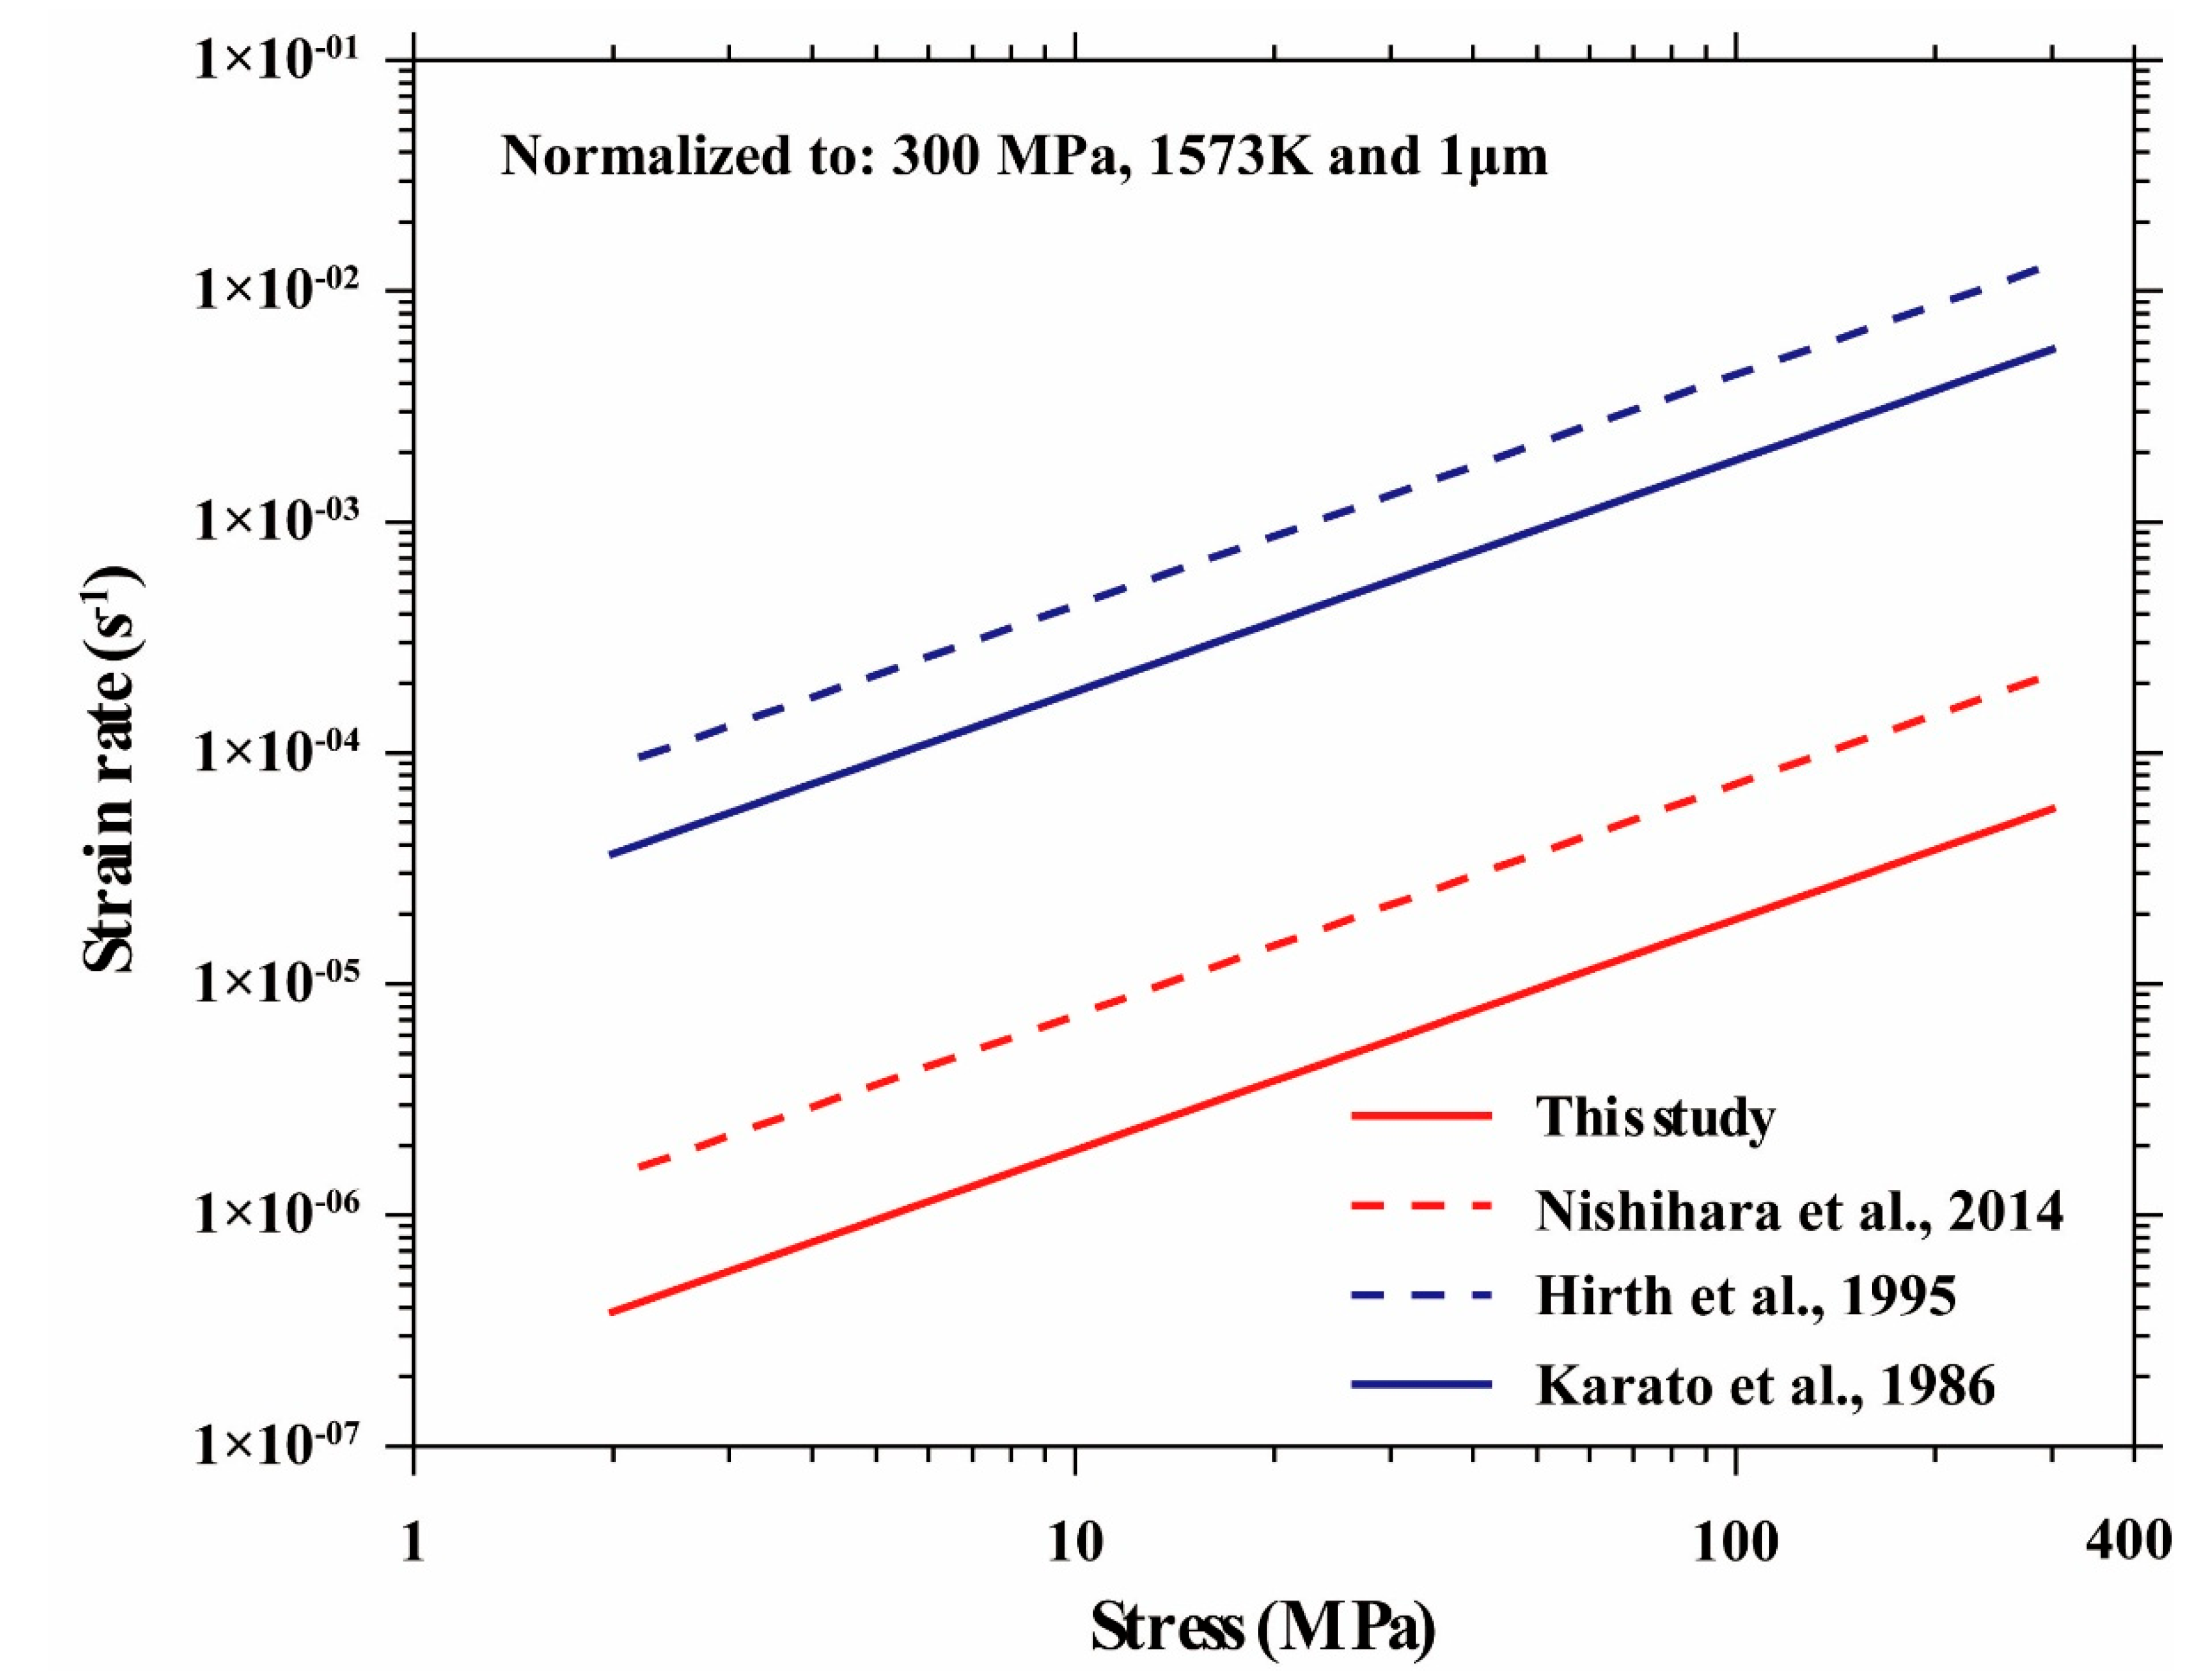
Figure 7.
Viscosity–depth profiles for forsterite and related mantle phases extrapolated to upper mantle conditions. All viscosities are calculated for a reference grain size of 1 mm, using the 60-Ma oceanic geotherm of Turcotte and Schubert [38] (p. 221) and the respective diffusion creep flow laws under dry conditions. Red solid line: this study (pure forsterite, Fo₁₀₀). Red dashed line: Nishihara et al. [26] for forsterite + 10 vol.% enstatite. Black dotted line: Karato et al. [21] for San Carlos olivine (Fo₉₀). Black dashed line: Hirth and Kohlstedt [20] for San Carlos olivine. Blue dashed line: Zhang et al. [39] for orthopyroxene. Our pure forsterite consistently exhibits the highest viscosity at depths >100 km, defining the viscosity upper bound for diffusion-creep-dominated olivine-rich peridotites. The lower viscosities of natural compositions reflect the weakening effects of Fe content, trace impurities, secondary phases (e.g., enstatite, spinel), and differences in grain-boundary characteristics. This upper-bound framework provides a baseline for quantifying the relative weakening contributions of various mantle components in geodynamic models.
Figure 7.
Viscosity–depth profiles for forsterite and related mantle phases extrapolated to upper mantle conditions. All viscosities are calculated for a reference grain size of 1 mm, using the 60-Ma oceanic geotherm of Turcotte and Schubert [38] (p. 221) and the respective diffusion creep flow laws under dry conditions. Red solid line: this study (pure forsterite, Fo₁₀₀). Red dashed line: Nishihara et al. [26] for forsterite + 10 vol.% enstatite. Black dotted line: Karato et al. [21] for San Carlos olivine (Fo₉₀). Black dashed line: Hirth and Kohlstedt [20] for San Carlos olivine. Blue dashed line: Zhang et al. [39] for orthopyroxene. Our pure forsterite consistently exhibits the highest viscosity at depths >100 km, defining the viscosity upper bound for diffusion-creep-dominated olivine-rich peridotites. The lower viscosities of natural compositions reflect the weakening effects of Fe content, trace impurities, secondary phases (e.g., enstatite, spinel), and differences in grain-boundary characteristics. This upper-bound framework provides a baseline for quantifying the relative weakening contributions of various mantle components in geodynamic models.
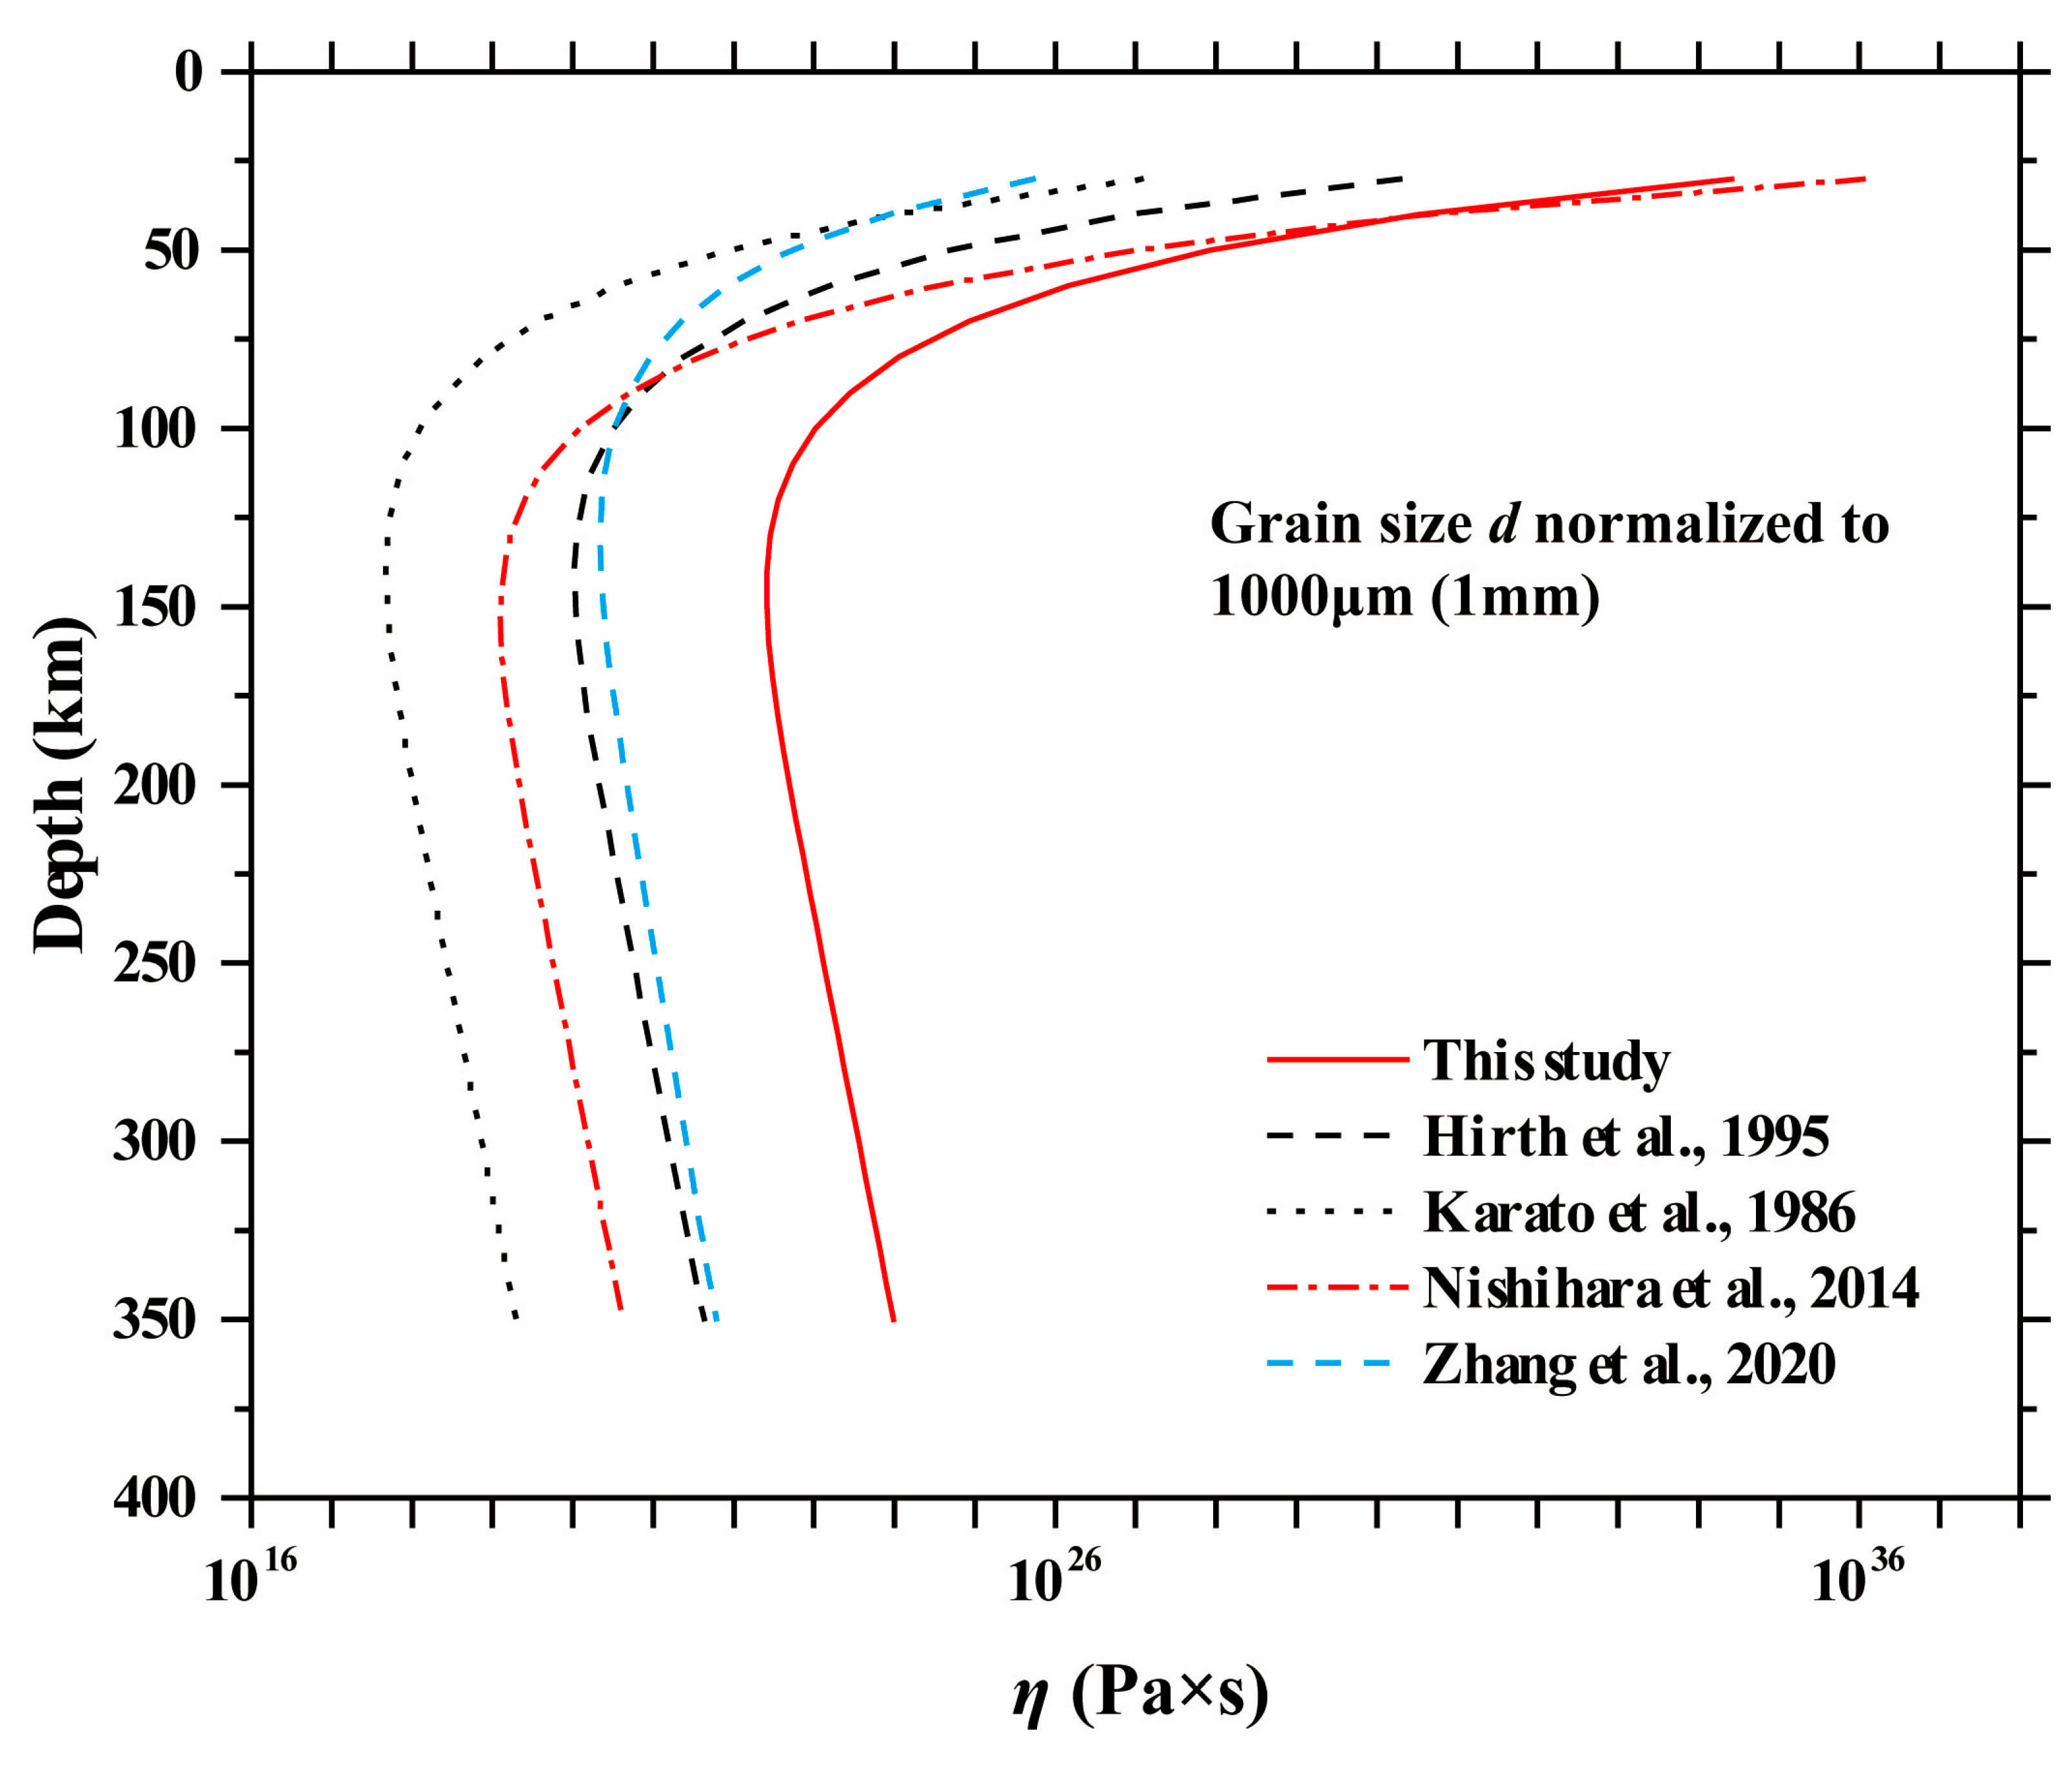

Table 1.
Detail information of samples for HPT experiments.
| Sample No. | Diameter | Length | Mass | Sinter time | Grain size | |||
| ϕ (mm) | l (mm) | m (g) | (h) | di(μm) a | df(μm) b | |||
| Fo‒01 | 6.95 | 14.48 | 1.60 | 4 | 0.71 | ±0.31 | 1.11 | ±0.47 |
| Fo‒02 | 6.95 | 13.40 | 1.48 | 4 | 0.76 | ±0.36 | 1.02 | ±0.42 |
| Fo‒03 | 6.90 | 13.60 | 1.47 | 4 | 0.69 | ±0.29 | 1.10 | ±0.41 |
| Fo‒09 | 6.90 | 14.80 | 1.62 | 8 | 1.08 c | — | 1.22 | ±0.34 |
| Fo‒10 | 6.93 | 14.40 | 1.57 | 8 | 0.97 c | — | 1.30 | ±0.39 |
| Fo‒11 | 6.95 | 13.15 | 1.43 | 8 | 1.07 | ±0.33 | 1.31 | ±0.35 |
a Initial grain size, measured by the linear intercept method on SEM images of sintered samples before deformation; b Final grain size, measured by the linear intercept method on SEM images of deformed forsterite aggregates; c For samples Fo‒09 and Fo‒10, the initial grain size was not directly measured; it was back-calculated from the final grain size, experimental duration, and temperature using the grain-growth law (Equation (3)).
Table 2.
Testing conditions and mechanical results for HPT experiments.
| Test/Sample No. | Confining pressure | Temperature | Stress | Strain rate | Reading strain a | Reading time b | dc |
| MPa | K | MPa | s-1 | % | s | μm | |
| DHPT59 Fo-03 |
0.69 d | ||||||
| 300 | 1473 | 112.9 | 4.9 × 10⁻⁶ | 5.1 | 7036 | 0.78 | |
| 300 | 1473 | 71.7 | 2.4 × 10⁻⁶ | 6.1 | 12032 | 0.84 | |
| 300 | 1473 | 156.4 | 5.9 × 10⁻⁶ | 8.0 | 15556 | 0.88 | |
| 300 | 1473 | 224.9 | 7.3 × 10⁻⁶ | 10.2 | 19082 | 0.92 | |
| 300 | 1473 | 290.2 | 1.0 × 10⁻⁵ | 12.5 | 22096 | 0.95 | |
| 300 | 1523 | 66.7 | 6.4 ×1 0-6 | 13.0 | 26386 | 1.01 | |
| 300 | 1523 | 99.3 | 8.3 × 10⁻⁶ | 15.1 | 29494 | 1.06 | |
| 300 | 1523 | 141.1 | 1.0 × 10⁻⁵ | 17.7 | 32500 | 1.10 | |
| 300 | 1523 | 201.8 | 1.2 × 10⁻⁵ | 20.6 | 35400 | 1.14 | |
| 1.10 e | |||||||
| DHPT60 Fo-02 |
0.76 d | ||||||
| 300 | 1423 | 235.2 | 3.9×10⁻⁶ | 5.0 | 12720 | 0.86 | |
| 300 | 1423 | 308.5 | 5.2×10⁻⁶ | 5.6 | 13732 | 0.87 | |
| 300 | 1423 | 149.3 | 3.2×10⁻⁶ | 13.1 | 16470 | 0.89 | |
| 300 | 1473 | 80.2 | 4.0 × 10⁻⁶ | 13.1 | 19136 | 0.91 | |
| 300 | 1473 | 147.8 | 4.5 × 10⁻⁶ | 14.2 | 21050 | 0.93 | |
| 300 | 1473 | 213.9 | 5.9 × 10⁻⁶ | 15.4 | 22668 | 0.95 | |
| 1.02 e | |||||||
| DHPT61 Fo-01 |
0.71 d | ||||||
| 300 | 1423 | 113.6 | 2.7 × 10⁻⁶ | 4.5 | 7990 | 0.78 | |
| 300 | 1423 | 187.8 | 3.7 × 10⁻⁶ | 5.2 | 10150 | 0.79 | |
| 300 | 1423 | 236.1 | 4.1 × 10⁻⁶ | 5.9 | 12256 | 0.81 | |
| 300 | 1473 | 112.6 | 4.0 × 10⁻⁶ | 5.9 | 14892 | 0.84 | |
| 300 | 1473 | 182.4 | 7.1 × 10⁻⁶ | 7.4 | 17690 | 0.87 | |
| 1.11 e | |||||||
| DP256 Fo-09 |
1.08 d | ||||||
| 300 | 1473 | 145.0 | 3.9 × 10⁻⁶ | 4.5 | 10940 | 1.17 | |
| 300 | 1473 | 219.3 | 4.6 × 10⁻⁶ | 5.6 | 13895 | 1.20 | |
| 280 | 1473 | 291.4 | 5.7 × 10⁻⁶ | 7.0 | 16020 | 1.22 | |
| 1.22 e | |||||||
| DP257 Fo-10 |
0.97 d | ||||||
| 300 | 1523 | 97.9 | 4.6 × 10⁻⁶ | 3.3 | 6860 | 1.07 | |
| 300 | 1523 | 197.3 | 9.3 × 10⁻⁶ | 5.2 | 9515 | 1.10 | |
| 300 | 1523 | 47.1 | 1.9 × 10⁻⁶ | 5.4 | 11935 | 1.14 | |
| 300 | 1473 | 95.2 | 1.6 × 10⁻⁶ | 6.3 | 15635 | 1.17 | |
| 300 | 1473 | 191.7 | 2.3 × 10⁻⁶ | 7.5 | 20395 | 1.21 | |
| 300 | 1473 | 285.0 | 3.8 × 10⁻⁶ | 8.7 | 24190 | 1.24 | |
| 300 | 1423 | 198.0 | 8.1 × 10⁻⁶ | 9.4 | 28880 | 1.26 | |
| 300 | 1423 | 357.0 | 1.2 × 10⁻⁶ | 11.4 | 47125 | 1.35 | |
| 1.35 e | |||||||
| DP258 Fo-11 |
1.07 d | ||||||
| 300 | 1473 | 101.0 | 2.1 × 10⁻⁶ | 6.0 | 11080 | 1.17 | |
| 300 | 1473 | 191.7 | 3.3 × 10⁻⁶ | 7.0 | 15260 | 1.20 | |
| 300 | 1473 | 289.0 | 4.3 × 10⁻⁶ | 8.9 | 19520 | 1.23 | |
| 300 | 1473 | 376.1 | 6.3 × 10⁻⁶ | 11.0 | 24480 | 1.27 | |
| 300 | 1423 | 189.0 | 8.7 × 10⁻⁷ | 11.6 | 31900 | 1.31 | |
| 300 | 1423 | 281.2 | 1.1 × 10⁻⁶ | 12.0 | 35380 | 1.33 | |
| 1.33 e |
a &b Reading strain and reading time are the cumulative axial strain and the elapsed time, respectively, at which the steady-state flow data (strain rate and differential stress) were recorded for each constant-stress creep stage; c Real-time grain size corresponding to mechanical data reading time (see b), initial and final grain sizes are marked by d and e, respectively; d Initial grain size measured measured by the linear intercept method on SEM images of sintered samples before deformation; e Final grain size, measured by the linear intercept method on SEM images of deformed forsterite aggregates.
Disclaimer/Publisher’s Note: The statements, opinions and data contained in all publications are solely those of the individual author(s) and contributor(s) and not of MDPI and/or the editor(s). MDPI and/or the editor(s) disclaim responsibility for any injury to people or property resulting from any ideas, methods, instructions or products referred to in the content. |
© 2026 by the authors. Licensee MDPI, Basel, Switzerland. This article is an open access article distributed under the terms and conditions of the Creative Commons Attribution (CC BY) license (http://creativecommons.org/licenses/by/4.0/).
Copyright: This open access article is published under a Creative Commons CC BY 4.0 license, which permit the free download, distribution, and reuse, provided that the author and preprint are cited in any reuse.