

Submitted:
24 July 2026
Posted:
27 July 2026
You are already at the latest version
Abstract
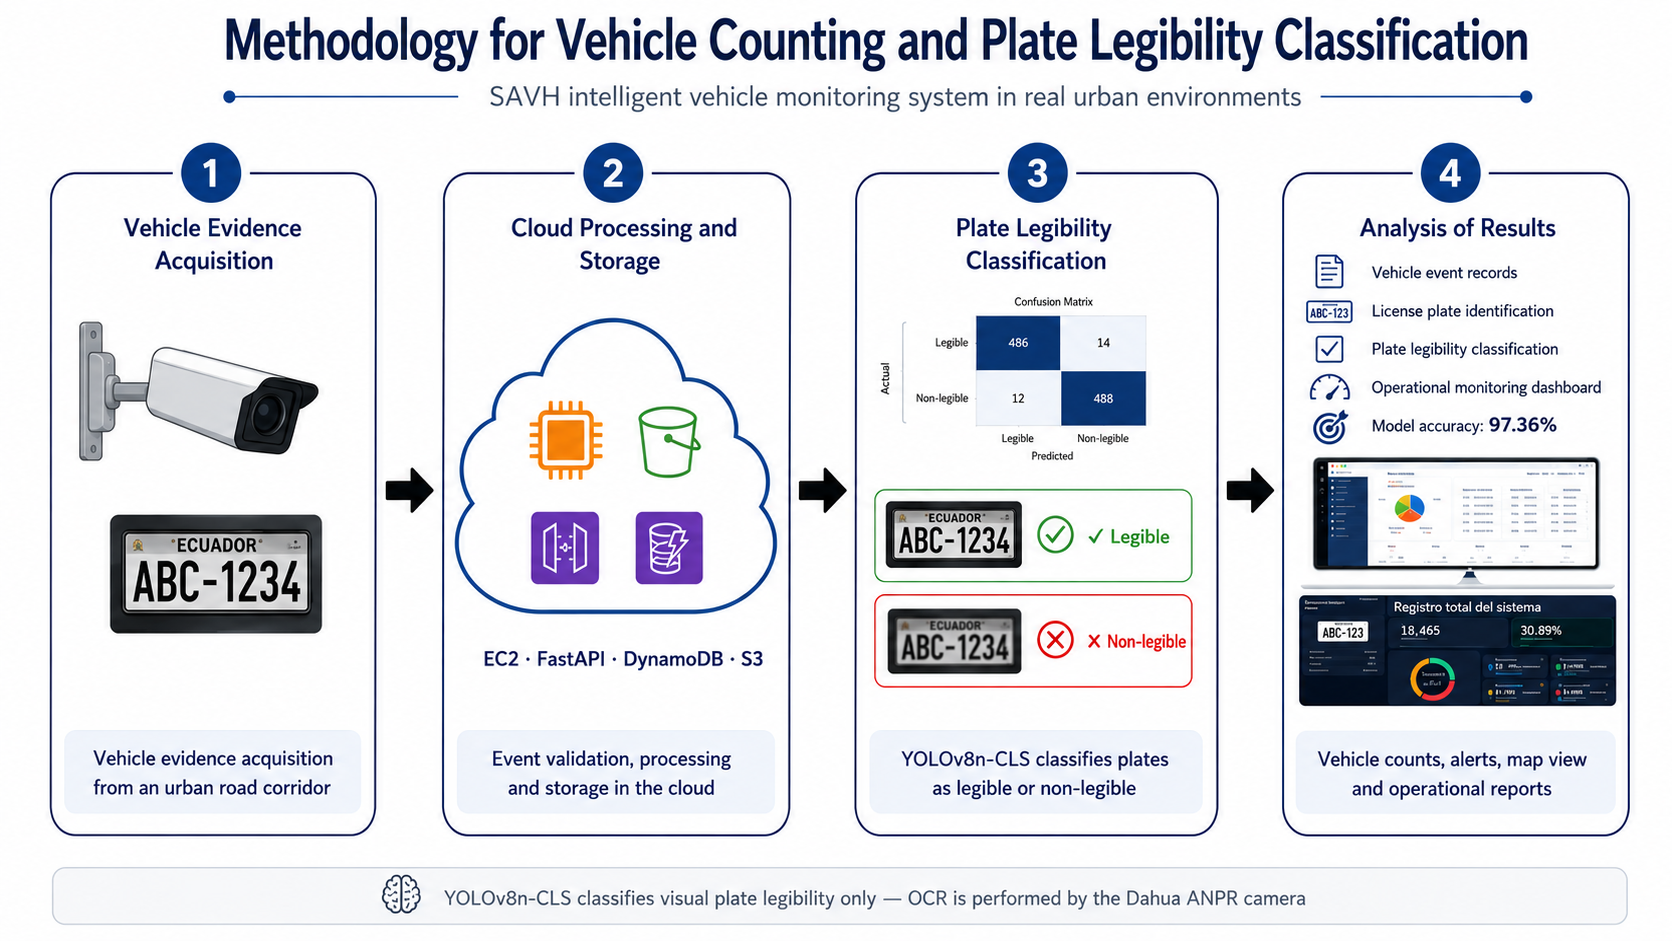
Automated vehicular traffic management in Latin American cities requires solutions capable of capturing, processing, and visualizing events in near real time. Automatic number plate recognition (ANPR) systems continuously generate vehicle records; however, the visual quality of the evidence associated with each capture can vary considerably under real field conditions, affecting the reliability of subsequent monitoring. This work presents a three-phase methodology, applied to the SAVH system (Sistema de Aforo Vehicular, Vehicle Counting System), which integrates a Dahua ANPR camera with a cloud architecture on Amazon Web Services. The camera captures the vehicle and performs textual reading of the license plate, sending vehicle notifications directly to the FastAPI service deployed on Amazon EC2. This service extracts the visual evidence and runs a YOLOv8n–CLS model that classifies the legibility of the plate crop into two classes: placa_legible (legible plate) and placa_no_legible (non-legible plate). Structured events and visual evidence are persisted in managed storage services, and a serverless function serves the web dashboard queries through Amazon API Gateway. The model was trained on a relabeled dataset derived from the public LPLCv2 collection, split into training, validation, and test subsets. Evaluation on 720 independent images from the test set achieved 97.36% overall accuracy, with 97.33% macro precision, 97.42% macro recall, and a 97.36% macro F1-score. Additionally, external validation on 2,000 images captured with the Dahua camera in locations across Guayaquil achieved 95.05% accuracy, showing the moderate degradation expected from domain shift. The results suggest the methodological viability of integrating lightweight deep learning models with managed cloud services for automated plate quality assessment in real-world application scenarios.
Keywords:
automatic number plate recognition
; ANPR
; YOLOv8n–CLS
; image classification
; license plate legibility
; deep learning
; computer vision
; cloud architecture
; serverless computing
; vehicle monitoring
; vehicle counting
; smart cities
1. Introduction
The sustained growth of the vehicle fleet in Ecuadorian cities has intensified pressure on urban road infrastructure, generating recurring congestion problems, difficulties in operational traffic control, and the need for reliable information for vehicular analysis. In this context, vehicle counting and automated monitoring systems represent a technological alternative to manual counting processes, visual inspection, or isolated event logging.
Automatic number plate recognition cameras, known as ANPR, capture vehicles, generate plate events, and associate each record with visual evidence. However, a device’s successful plate reading does not always guarantee that the captured evidence is visually adequate for subsequent review. Factors such as lighting, installation angle, distance, vehicle motion, blur, reflections, shadows, or occlusions can affect the quality of the plate crop and reduce its visual legibility [1].
To address this issue, a cloud-based methodology for vehicle detection and classification is proposed, applied to the SAVH system. The prototype integrates a Dahua ANPR camera with a cloud architecture on Amazon Web Services. The camera captures the vehicle and performs textual reading of the license plate, sending vehicle notifications directly to the FastAPI service deployed on Amazon EC2. This service validates the incoming information, extracts the visual evidence, and runs a YOLOv8n–CLS model that classifies the legibility of the plate crop. Structured events and their associated evidence are stored in managed persistence services, and a serverless function serves frontend queries for operational visualization through Amazon API Gateway.
The system does not replace the ANPR reading performed by the camera. Textual license plate recognition (OCR) is carried out by the Dahua ANPR device, while the deep learning model is used as a complementary layer that classifies the visual condition of the plate crop into two classes: placa_legible and placa_no_legible. Consequently, YOLOv8n–CLS does not extract text or recognize characters; it only assesses the visual quality of the evidence, which makes it possible to distinguish between plate recognition and the visual reliability assessment of the captured evidence.
In addition to event processing, the system incorporates a web frontend built with modern development technologies and deployed as a static site through managed content storage and distribution services [15,16,22]. The main dashboard refreshes its metrics every 30 seconds, while the events, alerts, and side-counter modules query periodically every 10 seconds, enabling operational monitoring with periodic dashboard updates, without claiming strict instantaneous measurement.
1.1. Contributions of This Work
The main contributions of this work, ordered by scientific relevance, are as follows:
- Main contribution: a reproducible three-phase cloud-based methodology for integrating Dahua ANPR cameras with visual plate quality assessment via YOLOv8n–CLS and cloud-native services for intelligent traffic monitoring.
- Secondary contribution (architecture): a cloud architecture that clearly separates two paths: (i) the ingestion path, where the Dahua camera sends vehicle notifications directly to the FastAPI service on EC2 for processing and classification, and (ii) the query path, where the frontend communicates through API Gateway with a serverless Lambda function for data visualization. DynamoDB and S3 persist events and visual evidence, respectively.
- Secondary contribution (dataset): a relabeled, open dataset derived from LPLCv2, adapted for binary legibility classification, published on Zenodo under a CC BY 4.0 license.
- Secondary contribution (model): a YOLOv8n–CLS model for binary classification of visual plate legibility, distinguishing between placa_legible and placa_no_legible, without replacing the textual ANPR reading performed by the camera.
- Secondary contribution (contextual enrichment): a module that associates each event with operational information: camera, zone, date, time, time slot, day/night condition, visual evidence, classification result, and model confidence level.
- Empirical validation: model performance with 97.36% overall accuracy on 720 images from the internal test set and 95.05% on 2,000 external validation images captured with the Dahua camera in locations across Guayaquil.
2. Related Work
Recent research in intelligent transportation systems supports the use of deep learning architectures and cloud processing for near-real-time urban monitoring. For example, deep reinforcement learning has been applied to adaptive traffic signal control using open traffic data, evidencing growing interest in AI-based vehicle monitoring solutions [23]. In a complementary sense, recent reviews have identified edge computing as a component that can reduce the latency and cost of traditional cloud architectures in large-scale vehicular sensing systems [30], reinforcing the relevance of evaluating hybrid cloud-edge schemes for SAVH as future work.
In line with this work, members of the research group have previously developed artificial intelligence methods aimed at analyzing vehicle trajectories and identifying congestion patterns in cities such as Guayaquil, Rome, and Beijing, using clustering algorithms applied to GPS data collected by intelligent transportation systems [33,34]. These proposals have been extended toward dynamic trajectory clustering [36], the identification of vehicular congestion through dynamic clustering applied to an Ecuadorian context [35], the simplification of trajectories over road networks to reduce the volume of processed data [37], vehicular flow analysis through clustering [38], GPS trajectory compression [39], and the design of a reference architecture for intelligent transportation systems [42]. Additionally, data mining and text mining techniques applied to large volumes of information [40] and affective computing for analyzing user behavior from digital data [41] have also been explored.
2.1. Vehicle Detection and Classification with YOLO Architectures
The YOLO family has become one of the most widely used architectures in computer vision tasks applied to vehicular traffic [6]. YOLOv8 provides implementations for different computer vision tasks, including image classification [4]. In traffic applications, different YOLO variants have been used for multiclass vehicle detection, intersection analysis, and urban monitoring [3]. YOLO-based architectures combined with pretrained convolutional networks have been used to classify vehicle type and color [24]. Deep classification architectures such as VGGNet [11], ResNet [10], and MobileNets [12] have laid the theoretical groundwork for visual recognition tasks under computational constraints. YOLO variants fine-tuned through transfer learning have been used to detect and classify vehicles under congested traffic conditions [27], while combining YOLO with multi-object tracking algorithms has enabled per-lane vehicular flow estimation [26]. Small object detection has motivated specific modifications to the YOLO architecture [32].
In SAVH, the YOLOv8n–CLS model is used specifically to classify the visual condition of the plate crop. This task is formulated as a binary classification problem: placa_legible or placa_no_legible. The choice of YOLOv8n–CLS responds to the need to integrate a lightweight model within a cloud-deployed backend.
2.2. Vehicle Filtering and Monitoring from ANPR Data
ANPR systems generate vehicle records associated with license plates, dates, times, cameras, and visual evidence. In multi-point systems, this data can be used for trajectory analysis, travel time estimation, and traffic filtering [2]. ANPR systems focused on plate recognition have incorporated deep learning architectures to improve detection under adverse conditions [8]. End-to-end models such as LPRNet [9] demonstrate that neural network-based plate reading can run in real time. More recent proposals integrate state-of-the-art YOLO detectors with OCR engines [25]. Other works have specifically addressed plate reading under adverse lighting, angle, and partial occlusion conditions [28]. Computer vision techniques have also been applied to road infrastructure monitoring under changing weather conditions [29]. In multi-camera scenarios, vehicle re-identification methods based on multi-level feature extraction have been proposed [31].
In the case of SAVH, the focus is on recording, persisting, and analyzing events generated by a Dahua ANPR camera at a checkpoint. Each event is enriched with visual evidence and the result of the plate legibility classification.
Table 1 presents a methodological comparison between related works and the SAVH system.
Among the works analyzed in Table 1, SAVH presents a combination that simultaneously integrates a physical ANPR device, deep learning-based visual evidence classification, a cloud-based architecture with separated ingestion and query paths, and an operational dashboard.
3. Materials and Methods
3.1. Methodology Overview
The proposed methodology is structured into three sequential and complementary phases. The first phase corresponds to the integration of the Dahua ANPR camera with the web monitoring dashboard. The second phase comprises the cloud architecture and processing with periodic updates of vehicle events. The third phase incorporates the contextual enrichment of the captured data, considering operational information associated with the checkpoint, the time slot, and the visual quality of the evidence.
Unlike an architecture based exclusively on software detection, SAVH uses the Dahua ANPR camera as the initial capture and identification device. The camera generates the vehicle notification associated with the ANPR event and sends it directly via an HTTP POST request to the processing service deployed on Amazon EC2 [17], based on FastAPI [14]. This service validates the received information, extracts the visual evidence, runs the YOLOv8n–CLS model to classify plate legibility, and persists the structured data in Amazon DynamoDB [20] and the visual evidence in Amazon S3 [19]. Amazon API Gateway [21] is used exclusively as the access point for frontend queries through serverless functions (AWS Lambda [18]) and does not participate in the ANPR event ingestion path.
Figure 1 presents an overview of the system architecture.
The flow validated in this work can be summarized as follows:
Dahua ANPR Camera → FastAPI on EC2 → YOLOv8n–CLS → DynamoDB / S3 ← API Gateway / Lambda ← Web Dashboard
The savh-anpr-query-api serverless function handles frontend queries exclusively —authentication, users, dashboard, map, alerts, metrics, and model evaluation—, separating these operations from the event ingestion path [18,21]. ANPR event ingestion occurs directly from the camera to the FastAPI service on EC2, without API Gateway involvement.
3.2. Phase 1: ANPR Integration and Web Dashboard
3.2.1. Dahua ANPR Camera Configuration
The Dahua ANPR camera was selected as the main field capture device. Its role within the system is to detect the vehicle, perform textual recognition (OCR) of the license plate, generate the corresponding snapshot, and produce the associated ANPR event. This event contains information relevant to downstream processing, including camera identifier, date, time, plate number recognized by the device, and visual evidence of the vehicle.
Figure 2 shows a representative view of the Dahua ANPR camera capturing a vehicle under daytime conditions, the recommended configuration for prototype operation.
The Dahua ANPR camera used incorporates a 2.7–12 mm lens, whose plate recognition distance ranges from 18 ft to 54 ft (approximately 5.5 m to 16.5 m), a configuration suitable for access or local-street scenarios such as the checkpoint evaluated in this work. Table 2 presents this configuration in comparison with a longer-range lens (8–32 mm), typically used in road traffic applications requiring greater recognition distance. Optimal camera performance is favored under daytime conditions with sufficient natural lighting; nighttime conditions, while operational, represent a more demanding complementary scenario for the recognition system.
Figure 3 complements the previous one, showing a representative view of the Dahua ANPR camera capturing a vehicle under real nighttime operating conditions of the prototype.
Communication between the camera and the SAVH system takes place through an HTTP POST notification sent directly to the FastAPI service deployed on Amazon EC2. This design allows the field device to communicate directly with the processing service, eliminating intermediaries and reducing latency in the event ingestion path.
Operating capture conditions.
During prototype testing, operating conditions that directly influence the visual quality of the plate were considered. Natural lighting favors sharpness, contrast, and character definition, provided there is no direct overexposure on the plate’s reflective surface. For this reason, daytime captures with sufficient sunlight were considered favorable conditions for obtaining higher-quality visual evidence.
The recommended reading zone for field testing was located approximately 10 to 15 meters from the capture point, adjusting the camera’s optical zoom to center the plate crop. This distance is not to be interpreted as a universal value, but as an operational reference for the prototype. Vehicle speed is considered an operating condition that may affect capture sharpness, but it does not constitute a legal or certified measurement. Nighttime or low-light conditions are considered a complementary scenario and are reported as an operational challenge and a future line of robustness work.
3.2.2. Web Dashboard with Periodic Updates
The web dashboard was designed to enable operational visualization of vehicle events, counting metrics, visual evidence, classification results, and configurable alerts. The frontend was developed with React/Vite [15,16] and deployed via Amazon S3 and CloudFront [22].
Figure 4 shows the operational dashboard interface of the system.
The main dashboard refreshes its metrics every 30 seconds, while the events, alerts, and side-counter modules perform periodic queries every 10 seconds. This strategy keeps the visualization of vehicular behavior up to date without claiming that the system performs strict instantaneous processing.
Figure 5 presents the geographic visualization of events captured by the system.
The interface allows users to query recorded events, review evidence associated with each capture, observe plate classification status, and analyze aggregated metrics. The system incorporates user- and role-based access control, allowing views and functionality to differ according to the assigned profile: administrator, analyst, or operator.
3.2.3. Configurable Alert System
The alert system was designed as an operational support mechanism to identify events requiring attention or additional review. The conditions considered for triggering alerts include:
- absence of plate or plate not detected in the event;
- processing error during ingestion or classification;
- plate classified as non-legible;
- event without classification;
- missing visual evidence;
- low model confidence level.
The confidence threshold can be configured from within the system, allowing alert sensitivity to be adjusted.
3.2.4. Validation of the Visual Classification Model
For internal model validation, the dataset_final/test set was used, derived from the research dataset and composed of 720 independent images. Additionally, a separate external set of 2,000 images was built, captured with the Dahua ANPR camera at real locations in Guayaquil during June 2026. This external set was acquired after model training and did not participate in the training or internal validation phases.
The research dataset was built from LPLCv2 [7], adapted to the system’s goal through a relabeling process for binary legibility classification. The original classes were reorganized: classes 0 and 1 were treated as placa_no_legible, class 2 was excluded for not aligning directly with the defined binary criterion, and class 3 was treated as placa_legible. The final distribution is shown in Table 3.
3.3. Phase 2: Cloud Architecture and Processing
3.3.1. Cloud Solution Architecture
The SAVH cloud architecture was designed to separate event capture, backend processing, data persistence, evidence storage, and web visualization. The main components are:
- FastAPI [14]: receives the ANPR event directly from the camera, validates the payload, processes evidence, runs inference, and exposes internal services.
- Amazon API Gateway [21]: acts as the entry point for frontend queries. It authenticates requests, applies rate-limiting policies, and routes requests to Lambda. It does not participate in the ingestion path.
- AWS Lambda [18]: hosts the savh-anpr-query-api function, which serves frontend queries.
- Amazon DynamoDB [20]: stores vehicle events, system metrics, users, and camera configuration.
- Amazon S3 [19]: stores snapshots, plate crops, visual evidence, and model evaluation results.
- Amazon S3 and CloudFront [22]: enable deployment and distribution of the React/Vite frontend as a static site.
3.3.2. Main ANPR Event Processing Flow
The main flow validated in the prototype consists of the following steps:
- 1.
- Vehicle capture and generation of the ANPR event by the Dahua camera, including textual reading (OCR).
- 2.
- Sending the vehicle notification via HTTP POST directly to the FastAPI service deployed on Amazon EC2.
- 3.
- Reception of the notification by the FastAPI service on EC2, without API Gateway involvement in this path.
- 4.
- Reception, validation, and enrichment of the payload by the processing service.
- 5.
- Extraction or association of the snapshot and plate crop.
- 6.
- Classification of the visual evidence using the YOLOv8n–CLS model integrated into the processing service.
- 7.
- Persistence of structured events in Amazon DynamoDB.
- 8.
- Persistence of visual evidence in Amazon S3.
- 9.
- Query and visualization of results from the web dashboard, served by the savh-anpr-query-api serverless function through API Gateway.
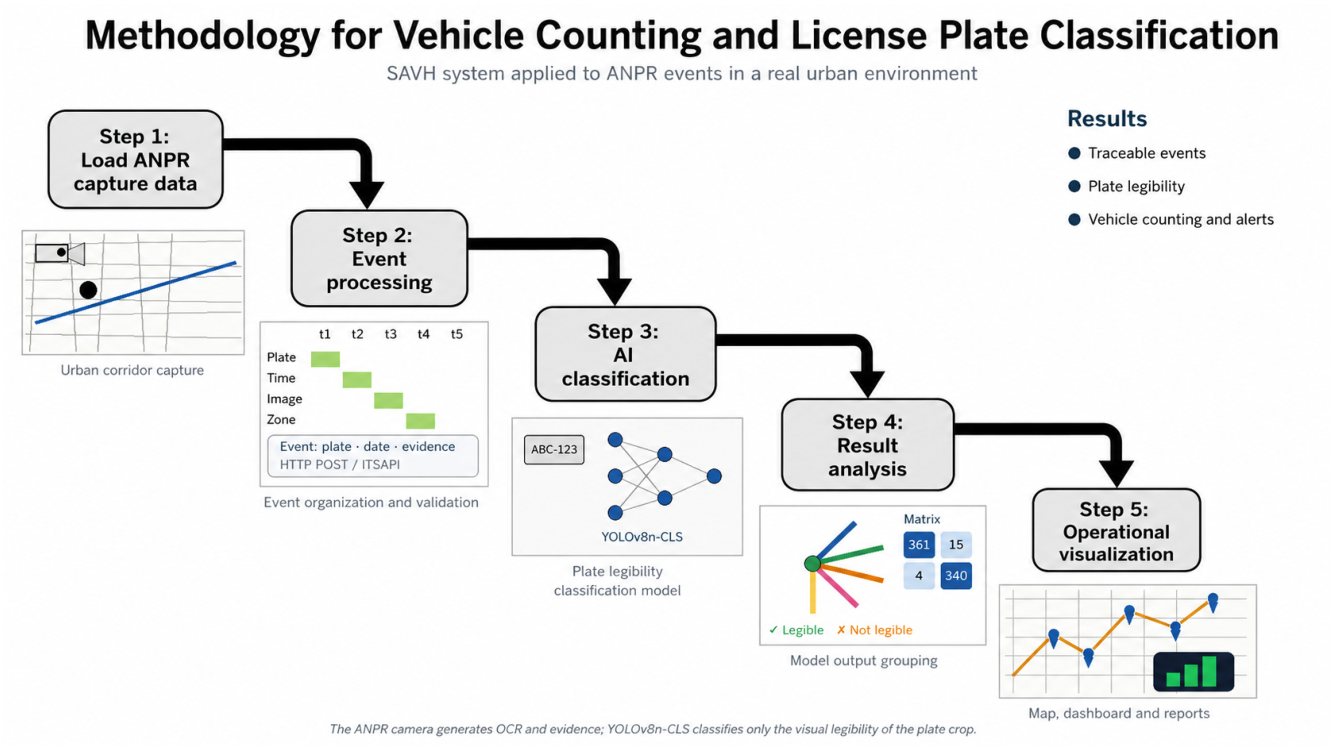
Figure 6.
Methodological flow of ANPR event processing in the SAVH system. The sequence of five main stages is shown: (1) loading ANPR data from the camera, (2) event processing and validation, (3) legibility classification via YOLOv8n–CLS, (4) result analysis with a confusion matrix, and (5) operational visualization on the dashboard.
Figure 6.
Methodological flow of ANPR event processing in the SAVH system. The sequence of five main stages is shown: (1) loading ANPR data from the camera, (2) event processing and validation, (3) legibility classification via YOLOv8n–CLS, (4) result analysis with a confusion matrix, and (5) operational visualization on the dashboard.
3.3.3. Classification Model: YOLOv8n-CLS
The selected model was YOLOv8n–CLS [4]. The task is defined as binary classification of the visual quality of the evidence, without character reading. The classes are:
- placa_legible: visual evidence in which the plate shows sufficient sharpness, lighting, and framing to be reviewed.
- placa_no_legible: visual evidence in which the plate shows low sharpness, poor lighting, a deficient crop, occlusion, blur, or another condition that hinders its review.
Training was carried out using Ultralytics [4,5], with initial weights pretrained on ImageNet. Table 4 summarizes the experimental configuration.
The complete reproducibility parameters, extracted directly from the args.yaml file generated by Ultralytics during actual training, are summarized in Table 5.
It is important to clarify the correspondence between the args.yaml file and the model whose results are reported. The args.yaml file and the results.csv curves summarized in Table 5 correspond to the June 2026 training run, used for deploying the backend service. The checkpoint (best.pt) that produced the results reported in this work (97.36% on the internal test set and 95.05% on the Guayaquil external validation) comes from an earlier run, from April 2026, executed with the same training protocol, verified against Table 7 of the thesis (50 epochs, batch 16, lr0=0.01, Ultralytics/PyTorch, NVIDIA Tesla T4 GPU). Both runs share identical hyperparameters; the differences between the final checkpoints are attributed to the stochastic component of training (weight initialization and batch order), since an identical seed was not documented between the two runs.
Model complexity and measured inference times are presented in Table 6. The trained model has 1,440,850 parameters (1,437,442 in its fused version) and 3.4 GFLOPs. Inference was measured over 100 runs with batch=1 and imgsz=224: 1.7 ms/image on the Tesla T4 GPU (recorded during Colab training) and 8.8 ms/image of pure inference (end-to-end average 9.6 ms) on CPU (AMD, local machine, no GPU available).
3.4. Phase 3: Contextual Enrichment of the Dataset
3.4.1. Motivation for Contextual Enrichment
Contextual enrichment ensures that each vehicle event is not stored merely as an isolated plate number or image, but as a record associated with the operating conditions of the capture point. This information is relevant because the visual legibility of the plate can depend on factors external to the model.
3.4.2. Captured Contextual Parameters
The SAVH system incorporates contextual information associated with each vehicle event. The parameters considered include:
- camera identifier;
- checkpoint name or zone;
- event date and time;
- time slot;
- day/night condition;
- available visual evidence;
- legibility classification result;
- model confidence level;
- event processing status.
3.4.3. Operational Consideration of Speed, Time, and Lighting
Vehicle speed is not interpreted in SAVH as a certified, legal, or metrological measurement. In the context of this prototype, it is considered only as an operating condition that may affect capture quality. Similarly, time of day and lighting directly influence evidence quality. Daytime captures with sufficient sunlight tend to offer better conditions. Nighttime or low-light captures are considered for future robustness work.
4. Results
4.1. Internal Evaluation with the Test Set
The first evaluation was performed on the internal dataset_final/test set, composed of 720 images not used during training. This set contains 376 images of the placa_legible class and 344 images of the placa_no_legible class. The goal was to measure the performance of the YOLOv8n–CLS model on data separate from training and validation.
Table 7 presents the confusion matrix obtained on the internal test set.
Figure 7.
Confusion matrices of the YOLOv8n–CLS model on the internal test set (dataset_final/test). (a) Absolute counts. (b) Proportions by true class.
Figure 7.
Confusion matrices of the YOLOv8n–CLS model on the internal test set (dataset_final/test). (a) Absolute counts. (b) Proportions by true class.
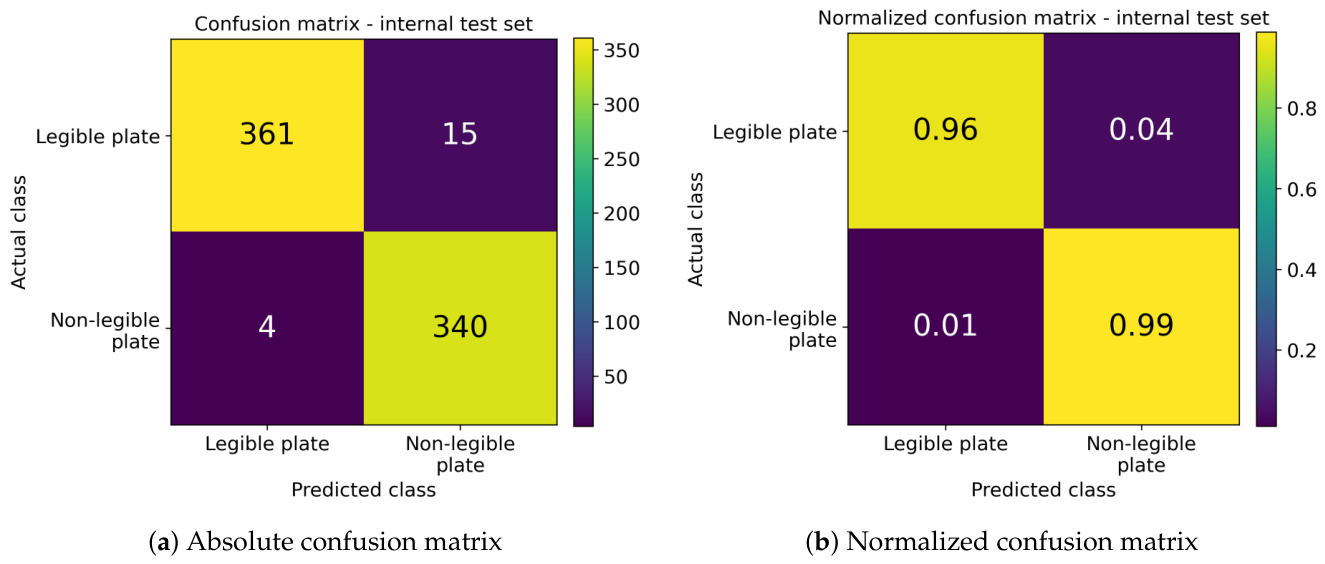
The model correctly classified 701 images and made 19 errors, achieving an overall accuracy of 97.36%. In the placa_legible class, 361 of 376 images were correctly classified. In the placa_no_legible class, 340 of 344 images were correctly classified.
Table 8 summarizes the per-class metrics.
The results show balanced performance between both classes, with a macro-precision of 97.33%, a macro-recall of 97.42%, and a macro F1-score of 97.36%. The 98.84% recall in the placa_no_legible class indicates that the model correctly identified most visually deficient plates.
4.2. Visual Classification Examples
4.3. Validation on Test Batches
4.4. External Validation: Guayaquil Custom Set
To characterize model performance in real-world scenarios, an external set of 2,000 images was evaluated, captured directly with the Dahua ANPR camera at real locations in Guayaquil during June 2026. This set was acquired post-training and did not participate in the training or internal validation phases.
The external evaluation achieved an overall accuracy of 95.05%, representing a moderate degradation relative to the internal set (97.36%), expected due to the domain shift between relabeled research data and real vehicle evidence.
Figure 12.
Confusion matrices of the YOLOv8n–CLS model on the external validation set (2,000 Dahua Guayaquil images). (a) Absolute counts. (b) Proportions by true class.
Figure 12.
Confusion matrices of the YOLOv8n–CLS model on the external validation set (2,000 Dahua Guayaquil images). (a) Absolute counts. (b) Proportions by true class.
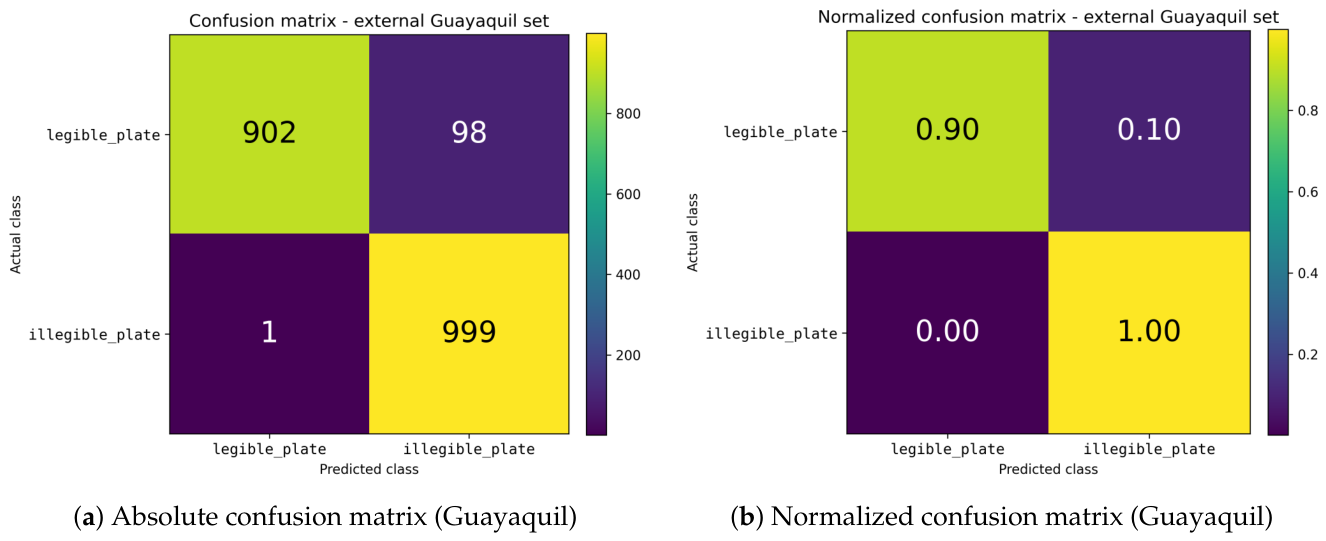
Table 9 presents the comparison of metrics between internal and external validation.
Figure 13 presents a visual comparison of accuracy between both validations.
This result supports the model’s generalization to real urban scenarios, showing that although an expected performance drop occurs, visual plate legibility can be classified with reasonable reliability under field conditions.
4.5. Processing Latency Instrumentation
The processing service records, for each event, the total_processing_ms attribute, which measures end-to-end processing time in the backend (event validation, visual evidence extraction, YOLOv8n–CLS inference, and persistence). At the time of this version, 3,602 events instrumented with this attribute are available in the savh-anpr-events DynamoDB table.
Table 10 summarizes the processing latency measured over the 3,602 instrumented events. Average end-to-end total latency was 181.94 ms (median 173.65 ms; P95 296.37 ms; minimum 66.36 ms; maximum 1,201.84 ms), while YOLOv8n–CLS model inference accounted for an average of 18.08 ms (median 14.80 ms), i.e., a small fraction of total processing time. The exact time range of the events (first and last dates) was not determined in this version. No latency value has been estimated or assumed: all values come from real measurements of the total_processing_ms attribute.
5. Discussion
The results show that the proposed methodology successfully integrates ANPR capture, cloud processing, visual plate classification, and operational visualization within a single prototype. The performance of the YOLOv8n–CLS model on 720 independent images from the internal test set reached 97.36% overall accuracy, with 97.33% macro-precision, 97.42% macro-recall, and a 97.36% macro F1-score. In addition, external validation on 2,000 images captured with the Dahua camera in Guayaquil achieved 95.05% accuracy. These metrics suggest that binary visual legibility classification can effectively complement the events generated by an ANPR camera, without replacing the textual reading of the license plate.
Although the evaluated baseline architectures achieved higher accuracy on the same internal test set (MobileNetV2 98.47%, EfficientNet-B0 98.75%, and ResNet18 99.03%; Table 6), the choice of YOLOv8n–CLS reflects a favorable trade-off between size, speed, and accuracy. With only 1,440,850 parameters —up to 7.8 times fewer parameters than ResNet18 and between 1.5 and 2.8 times fewer parameters than MobileNetV2 and EfficientNet-B0— and the fastest GPU inference (1.7 ms/image versus 5.05–11.22 ms for the baseline models). In terms of GFLOPs, the trade-off is less uniform: YOLOv8n–CLS (3.4) is comparable to ResNet18 (3.65), but higher than MobileNetV2 (0.65) and EfficientNet-B0 (0.83); relative to these last two, YOLOv8n–CLS’s higher theoretical compute does not translate into higher real-world latency, since its smaller number of parameters allows for noticeably faster GPU inference. Overall, the model sacrifices only about 1.7 percentage points of accuracy relative to the best baseline (ResNet18), making it well suited for lightweight deployment in the prototype’s backend.
5.1. Classification Error Analysis
Of the 720 images in the internal test set, the model made 19 errors (2.64% of the total):
- 15 false negatives (FN): plates that were actually legible, classified as non-legible. This type of error is conservative and beneficial for a monitoring system, as it reduces the risk of accepting deficient evidence as reliable.
- 4 false positives (FP): plates that were actually non-legible, classified as legible. These carry the risk of accepting low-quality evidence; however, their low number (less than 0.6% of the test set) suggests that the model maintains an appropriate balance between sensitivity and specificity.
The normalized confusion matrix (Figure 7b) evidences this behavior: the model tends to be more conservative for the non-legible class (98.84% recall), prioritizing the reduction of false positives. For a vehicle monitoring system, this profile is preferable.
5.2. Comparison with Related Work
Among the works analyzed in Table 1, SAVH simultaneously integrates: a physical ANPR device as the capture source, deep learning-based visual evidence classification, an AWS cloud architecture with direct ingestion to EC2 and separate queries through API Gateway and Lambda, and an operational dashboard with periodic updates. The works of Richter et al. [2] and Rodríguez et al. [1] use ANPR data for traffic analysis without evaluating the visual quality of the evidence. Laroca et al. [8] propose a YOLO-based ALPR system without cloud integration or evidence quality assessment.
5.3. Advantages of the Implemented Architecture
The implemented architecture offers operational advantages. The separation of paths allows ANPR event ingestion to be direct and low-latency, while frontend queries are managed through API Gateway with centralized security and access control policies. The EC2/FastAPI processing service directly controls ANPR event validation and execution of the classification model. Structured persistence and object storage services separate transactional data from visual evidence [19,20].
5.4. Limitations
The prototype has clearly delimited limitations:
- The model does not perform OCR or textual plate reading; this function is carried out by the Dahua ANPR camera.
- Processing latency was characterized on 3,602 real production events (Table 10), although the exact time range of the sample was not determined in this version. The term “periodic dashboard update” refers to the frontend refresh frequency (10–30 seconds), not strict instantaneous processing.
- Vehicle speed is considered only as an operating condition that may affect capture quality, not as a certified or legally valid measurement.
- Nighttime or low-light conditions are not included in the model’s main validation and are reported as an operational challenge.
- The incorporation of an asynchronous messaging layer based on Amazon SQS and a decoupled worker process is contemplated as a future scalability improvement.
These limitations do not reduce the value of the prototype; rather, they delimit its scope as an academic and functional solution for vehicle monitoring and evidence quality assessment, without positioning it as a certified production system.
6. Conclusions
This work presented a cloud-based methodology for vehicle detection and classification, applied to the SAVH system as a validated academic prototype. The proposal articulates a field ANPR capture device that sends events directly to a cloud processing service (FastAPI on EC2), responsible for event validation and visual plate classification via YOLOv8n–CLS. Managed structured storage (DynamoDB) and visual evidence storage (S3) services persist the data, while a serverless function (Lambda) serves frontend queries through API Gateway.
The methodology was structured into three phases: ANPR integration and web dashboard, cloud architecture with processing and periodic updates, and contextual enrichment of the dataset. This organization makes it possible to describe the system from event capture through to result visualization, maintaining a clear separation between the textual reading (OCR) performed by the camera and the visual classification performed by the deep learning model.
The results suggest the methodological viability of the proposal. The model achieved an overall accuracy of 97.36% on 720 images from the internal test set, and 95.05% on 2,000 external validation images captured with the Dahua camera in Guayaquil. These values suggest that binary visual legibility classification can be used as a complementary layer to improve the interpretation of ANPR events.
It is important to note that the reported performance should be interpreted within the scope of the validated academic prototype. Fully characterizing the system in production will require evaluation under adverse conditions and larger-scale validation.
Future work is proposed to: (1) expand the external dataset with nighttime images, rainy conditions, different installation points, a wider variety of angles, and new time slots; (2) extend the comparison with baseline models (MobileNetV2, EfficientNet-B0, and ResNet18) to the Guayaquil external validation, beyond the internal test set; (3) strengthen the evaluation of security, privacy, and data retention; and (4) incorporate an asynchronous messaging layer based on Amazon SQS as a scalability improvement.
Author Contributions
Conceptualization, G.R., J.B.-M., A.C.V. and J.D.C.A.; methodology, A.C.V., J.D.C.A. and G.R.; software, A.C.V. and J.D.C.A.; validation, A.C.V., J.D.C.A. and R.T.-B.; formal analysis, A.C.V., J.D.C.A. and G.R.; investigation, A.C.V. and J.D.C.A.; resources, G.R., J.B.-M., R.T.-B., D.R. and C.G.-R.; data curation, A.C.V. and J.D.C.A.; writing—original draft preparation, A.C.V. and J.D.C.A.; writing—review and editing, G.R., L.L., W.H., C.G.-R., A.C.V. and J.D.C.A.; visualization, A.C.V. and J.D.C.A.; supervision, G.R. and J.B.-M.; project administration, G.R. and C.G.-R.; funding acquisition, G.R. and C.G.-R. All authors have read and agreed to the published version of the manuscript.
Funding
The authors gratefully acknowledge the financial support provided by the Vicerrectoría de Investigación e Innovación Social (Vice-Rectorate for Research and Social Innovation) of Universidad Bolivariana del Ecuador, whose support contributed to the development and publication of this work.
Institutional Review Board Statement
Not applicable.
Informed Consent Statement
Not applicable.
Data Availability Statement
The image dataset supporting this article, corresponding to the relabeled research dataset derived from LPLCv2 for binary plate legibility classification, has been deposited in Zenodo and is publicly available under the Creative Commons Attribution 4.0 International (CC BY 4.0) license. The dataset can be accessed via the following DOI: https://doi.org/10.5281/zenodo.21120307.
Acknowledgments
The authors thank the Instituto Latinoamericano de Futuros de la Educación (Latin American Institute for the Futures of Education) for its methodological support through the WISE: AI Literacy Hub research network (PROY-INB-UBE-030) of Universidad Bolivariana del Ecuador. The authors also thank the Artificial Intelligence Research Group of Universidad Bolivariana del Ecuador (GIIA) for its technical support.
Use of Artificial Intelligence Tools Statement
During the preparation of this manuscript, the authors used Claude (Anthropic) for language editing, text organization, and improvements in clarity and readability. The authors carefully reviewed and edited the generated content and take full responsibility for the content of this publication.
Conflicts of Interest
The authors declare no conflicts of interest.
References
- Rodríguez-Rangel, H.; Morales-Rosales, L.A.; Imperial-Rojo, R.; Roman-Garay, M.A.; Peralta-Peñuñuri, G.E.; Lobato-Báez, M. Analysis of Statistical and Artificial Intelligence Algorithms for Real-Time Speed Estimation Based on Vehicle Detection with YOLO. Appl. Sci. 2022, 12, 2907. [Google Scholar] [CrossRef]
- Richter, P.; Matowicki, M.; Kumpošt, P. Transit Traffic Filtration Algorithm from Cleaned Matched License Plate Data. Appl. Sci. 2024, 14, 8182. [Google Scholar] [CrossRef]
- Niu, C.; Song, Y.; Zhao, X. SE-Lightweight YOLO: Higher Accuracy in YOLO Detection for Vehicle Inspection. Appl. Sci. 2023, 13, 13052. [Google Scholar] [CrossRef]
- Jocher, G.; Chaurasia, A.; Qiu, J. Ultralytics YOLOv8, 2023. Available online: https://github.com/ultralytics/ultralytics.
- Ultralytics. Ultralytics YOLOv8 Documentation . 2024. Available online: https://docs.ultralytics.com/.
- Redmon, J.; Divvala, S.; Girshick, R.; Farhadi, A. You Only Look Once: Unified, Real-Time Object Detection. In Proceedings of the IEEE Conference on Computer Vision and Pattern Recognition (CVPR), Las Vegas, NV, USA, 27–30 June 2016; pp. 779–788. [Google Scholar] [CrossRef]
- Wojcik, L.; Machoski, E.A.F.; Nascimento, E., Jr.; Laroca, R.; Menotti, D. LPLCv2: An Expanded Dataset for Fine-Grained License Plate Legibility Classification. arXiv. 2026. Available online: https://arxiv.org/abs/2604.08741.
- Laroca, R.; Severo, E.; Zanlorensi, L.A.; Oliveira, L.S.; Gonçalves, G.R.; Schwartz, W.R.; Menotti, D. A Robust Real-Time Automatic License Plate Recognition Based on the YOLO Detector. In Proceedings of the International Joint Conference on Neural Networks (IJCNN), Rio de Janeiro, Brazil, 8–13 July 2018; pp. 1–10. [Google Scholar] [CrossRef]
- Zherzdev, S.; Gruzdev, A. LPRNet: License Plate Recognition via Deep Neural Networks. arXiv. 2018. Available online: https://arxiv.org/abs/1806.10447.
- He, K.; Zhang, X.; Ren, S.; Sun, J. Deep Residual Learning for Image Recognition. CVPR 2016, 770–778. [Google Scholar] [CrossRef]
- Simonyan, K.; Zisserman, A. Very Deep Convolutional Networks for Large-Scale Image Recognition. ICLR, San Diego, CA, USA, 7–9 May 2015; Available online: https://arxiv.org/abs/1409.1556.
- Howard, A.G.; Zhu, M.; Chen, B.; Kalenichenko, D.; Wang, W.; Weyand, T.; Andreetto, M.; Adam, H. MobileNets: Efficient Convolutional Neural Networks for Mobile Vision Applications. arXiv. 2017. Available online: https://arxiv.org/abs/1704.04861.
- Tan, M.; Le, Q.V. EfficientNet: Rethinking Model Scaling for Convolutional Neural Networks. ICML 2019, 6105–6114. Available online: https://arxiv.org/abs/1905.11946.
- Ramírez, S. FastAPI — High Performance, Easy to Learn . Available online: https://fastapi.tiangolo.com.
- Meta Platforms; Inc. React — The Library for Web and Native User Interfaces . Available online: https://react.dev.
- Vite. Vite — Next Generation Frontend Tooling . Available online: https://vitejs.dev.
- Amazon Web Services. Amazon EC2 User Guide . Available online: https://docs.aws.amazon.com/ec2/.
- Amazon Web Services. AWS Lambda Developer Guide . Available online: https://docs.aws.amazon.com/lambda/.
- Amazon Web Services. Amazon S3 User Guide . Available online: https://docs.aws.amazon.com/s3/.
- Amazon Web Services. Amazon DynamoDB Developer Guide . Available online: https://docs.aws.amazon.com/dynamodb/.
- Amazon Web Services. Amazon API Gateway Developer Guide . Available online: https://docs.aws.amazon.com/apigateway/.
- Amazon Web Services. Amazon CloudFront Developer Guide . Available online: https://docs.aws.amazon.com/cloudfront/.
- Greguríć, M.; Vujić, M.; Alexopoulos, C.; Miletić, M. Application of Deep Reinforcement Learning in Traffic Signal Control. Appl. Sci. 2020, 10, 4011. [Google Scholar] [CrossRef]
- Kim, J. Deep Learning-Based Vehicle Type and Color Classification. Appl. Sci. 2024, 14, 1600. [Google Scholar] [CrossRef]
- Automatic License Plate Recognition System Using YOLOv12 and PaddleOCR. Appl. Sci. 2025, 15, 7833. [CrossRef]
- Liu, C.-M.; Juang, J.-C. Estimation of Lane-Level Traffic Flow Using a Deep Learning Technique. Appl. Sci. 2021, 11, 5619. [Google Scholar] [CrossRef]
- Farid, A.; Hussain, F.; Khan, K.; Shahzad, M.; Khan, U.; Mahmood, Z. A Fast and Accurate Real-Time Vehicle Detection Method Using Deep Learning. Appl. Sci. 2023, 13, 3059. [Google Scholar] [CrossRef]
- Sultan, F.; Khan, K.; Shah, Y.A.; Shahzad, M.; Khan, U.; Mahmood, Z. Towards Automatic License Plate Recognition in Challenging Conditions. Appl. Sci. 2023, 13, 3956. [Google Scholar] [CrossRef]
- Elwahsh, H.; Allakany, A.; Alsabaan, M.; Ibrahem, M.I.; El-Shafeiy, E. A Deep Learning Technique to Improve Road Maintenance Systems. Appl. Sci. 2023, 13, 8899. [Google Scholar] [CrossRef]
- Zhou, X.; Ke, R.; Yang, H.; Liu, C. When Intelligent Transportation Systems Sensing Meets Edge Computing. Appl. Sci. 2021, 11, 9680. [Google Scholar] [CrossRef]
- Zakria; Cai, J.; Deng, J.; Aftab, M.U.; Khokhar, M.S.; Kumar, R. Efficient and Deep Vehicle Re-Identification Using Multi-Level Feature Extraction. Appl. Sci. 2019, 9, 1291. [Google Scholar] [CrossRef]
- Han, T.; Sun, L.; Dong, Q. An Improved YOLO Model for Traffic Signs Small Target Image Detection. Appl. Sci. 2023, 13, 8754. [Google Scholar] [CrossRef]
- Reyes, G.; Lanzarini, L.; Hasperúe, W.; Bariviera, A.F. GPS Trajectory Clustering Method for Decision Making on Intelligent Transportation Systems. J. Intell. Fuzzy Syst. 2020, 38, 5529–5535. [Google Scholar] [CrossRef]
- Reyes, G.; Lanzarini, L.; Hasperúe, W.; Bariviera, A.F. Proposal for a Pivot-Based Vehicle Trajectory Clustering Method. Transp. Res. Rec. 2022, 2676, 281–295. [Google Scholar] [CrossRef]
- Reyes, G.; Tolozano-Benites, R.; Lanzarini, L.; Estrebou, C.; Bariviera, A.F.; Barzola-Monteses, J. Methodology for the Identification of Vehicle Congestion Based on Dynamic Clustering. Sustainability 2023, 15, 16575. [Google Scholar] [CrossRef]
- Reyes, G.; Lanzarini, L.; Estrebou, C.; Fernandez Bariviera, A. Dynamic Grouping of Vehicle Trajectories. J. Comput. Sci. Technol. 2022, 22, e11. [Google Scholar] [CrossRef]
- Reyes, G.; Estrada, V.; Tolozano-Benites, R.; Maquilón, V. Batch Simplification Algorithm for Trajectories over Road Networks. ISPRS Int. J. Geo-Inf. 2023, 12, 399. [Google Scholar] [CrossRef]
- Reyes, G.; Lanzarini, L.C.; Estrebou, C.A.; Maquilón, V. Vehicular Flow Analysis Using Clusters. XXVII CACIC, 2021. [Google Scholar]
- Reyes Zambrano, G. GPS Trajectory Compression Algorithm. In ICCCE 2018; Springer: Cham, 2019; pp. 57–69. [Google Scholar] [CrossRef]
- Lanzarini, L.C.; Hasperúe, W.; Villa Monte, A.; et al. Minería de Datos, Minería de Textos y Big Data. In XXI WICC; San Juan, Argentina, 2019. [Google Scholar]
- Zambrano, G.R.; Banchón, J.M. Computación Afectiva y Análisis del Comportamiento del Consumidor. Int. J. Innov. Appl. Stud. 2017, 20, 551–559. [Google Scholar]
- Zambrano, G.R.; Vera, L.O. Reference Architecture for an Intelligent Transportation System. Int. J. Innov. Appl. Stud. 2016, 15, 175. [Google Scholar]
Figure 1.
Cloud architecture of the SAVH system. The ingestion path (Dahua ANPR camera to FastAPI on EC2, with YOLOv8n–CLS classification and persistence in DynamoDB and S3) is distinguished from the frontend query and hosting path (API Gateway, Lambda, S3, and CloudFront).
Figure 1.
Cloud architecture of the SAVH system. The ingestion path (Dahua ANPR camera to FastAPI on EC2, with YOLOv8n–CLS classification and persistence in DynamoDB and S3) is distinguished from the frontend query and hosting path (API Gateway, Lambda, S3, and CloudFront).
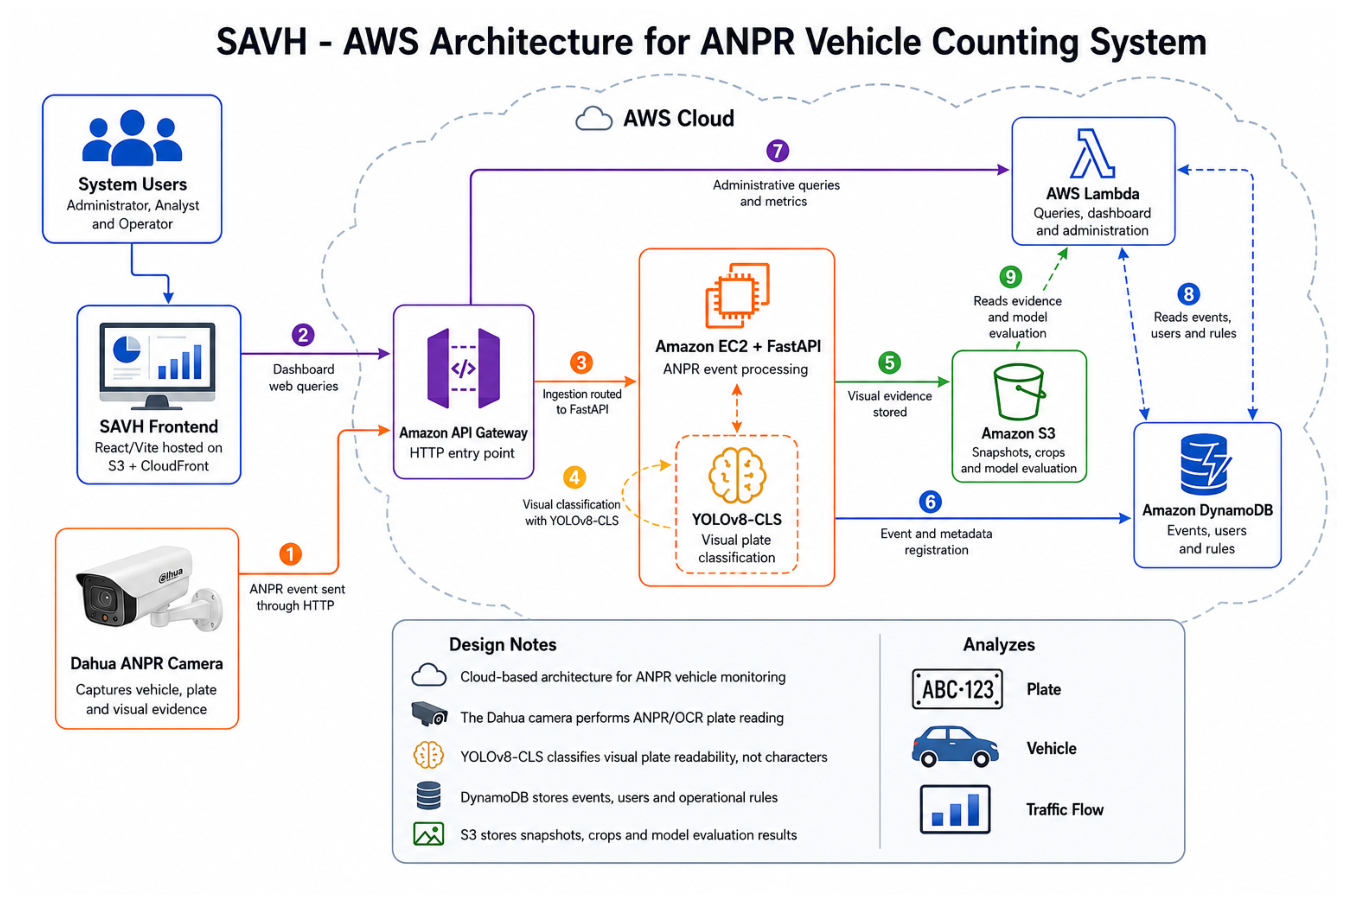
Figure 2.
View of the Dahua ANPR camera during daytime capture of a vehicle, the recommended operating configuration for the prototype. The vehicle framing and the license plate reading zone at the checkpoint can be observed.
Figure 2.
View of the Dahua ANPR camera during daytime capture of a vehicle, the recommended operating configuration for the prototype. The vehicle framing and the license plate reading zone at the checkpoint can be observed.
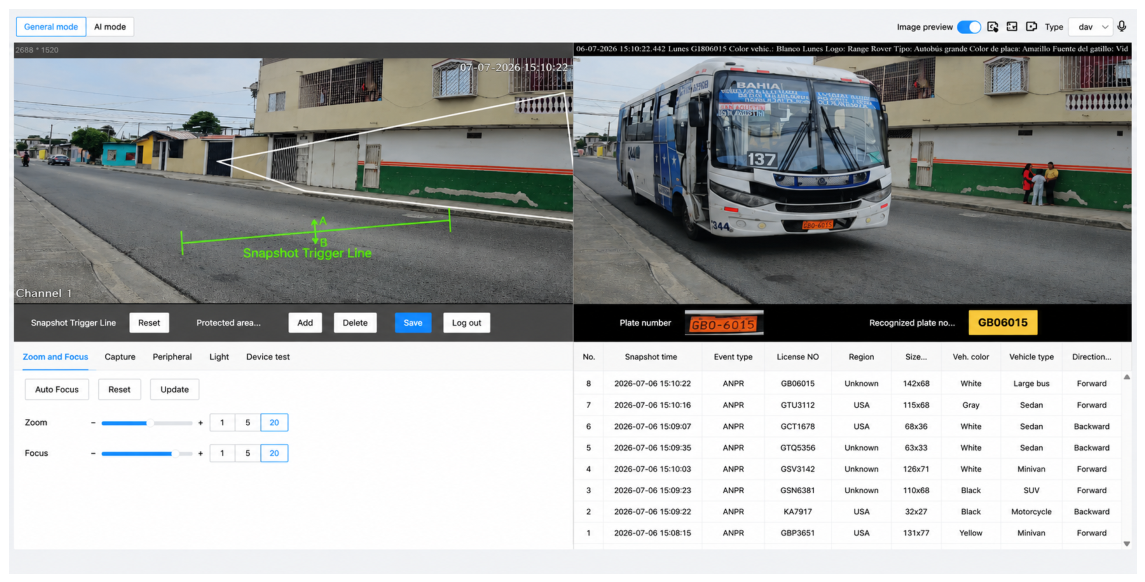
Figure 3.
View of the Dahua ANPR camera during nighttime capture of a vehicle under real prototype operating conditions. The vehicle framing and the license plate reading zone at the checkpoint can be observed.
Figure 3.
View of the Dahua ANPR camera during nighttime capture of a vehicle under real prototype operating conditions. The vehicle framing and the license plate reading zone at the checkpoint can be observed.
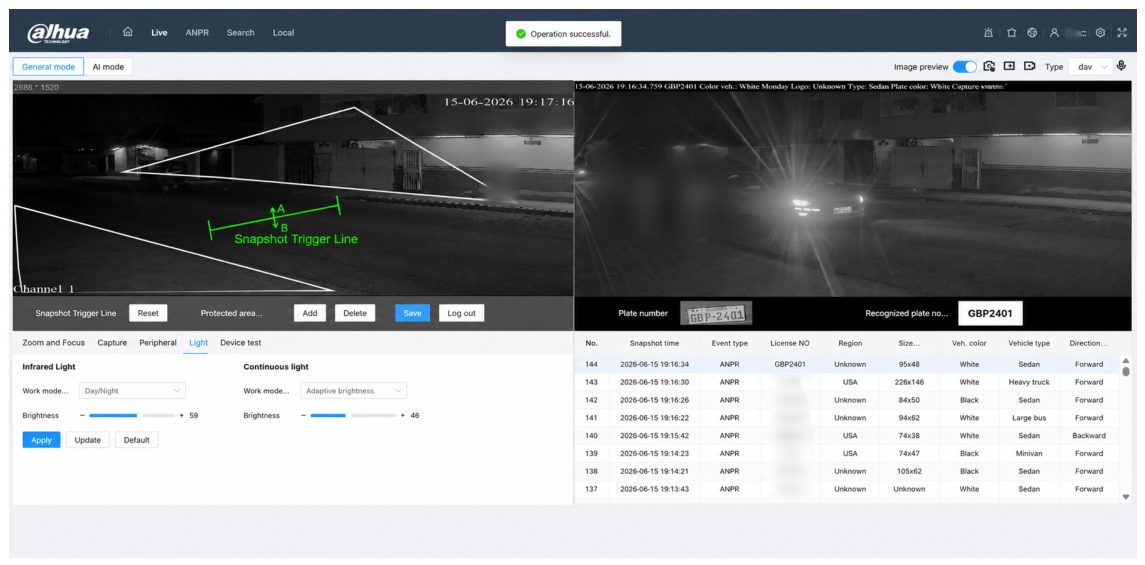
Figure 4.
Operational dashboard of the SAVH system. Counting metrics, the consolidated event history (19,780 events recorded, with 31.39% overall legibility), plate classification status, alerts, and vehicle monitoring controls can be observed.
Figure 4.
Operational dashboard of the SAVH system. Counting metrics, the consolidated event history (19,780 events recorded, with 31.39% overall legibility), plate classification status, alerts, and vehicle monitoring controls can be observed.
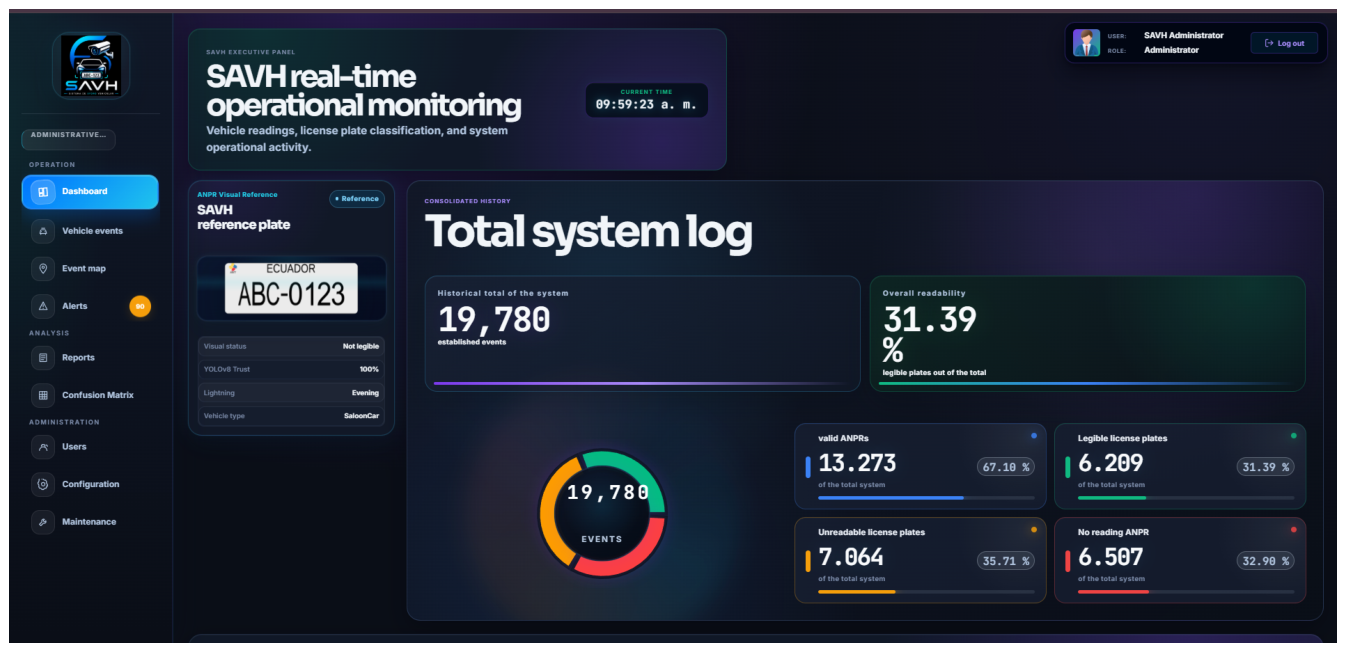
Figure 5.
Event map of the SAVH system. Geographic visualization of capture points and vehicle events recorded during prototype operation.
Figure 5.
Event map of the SAVH system. Geographic visualization of capture points and vehicle events recorded during prototype operation.
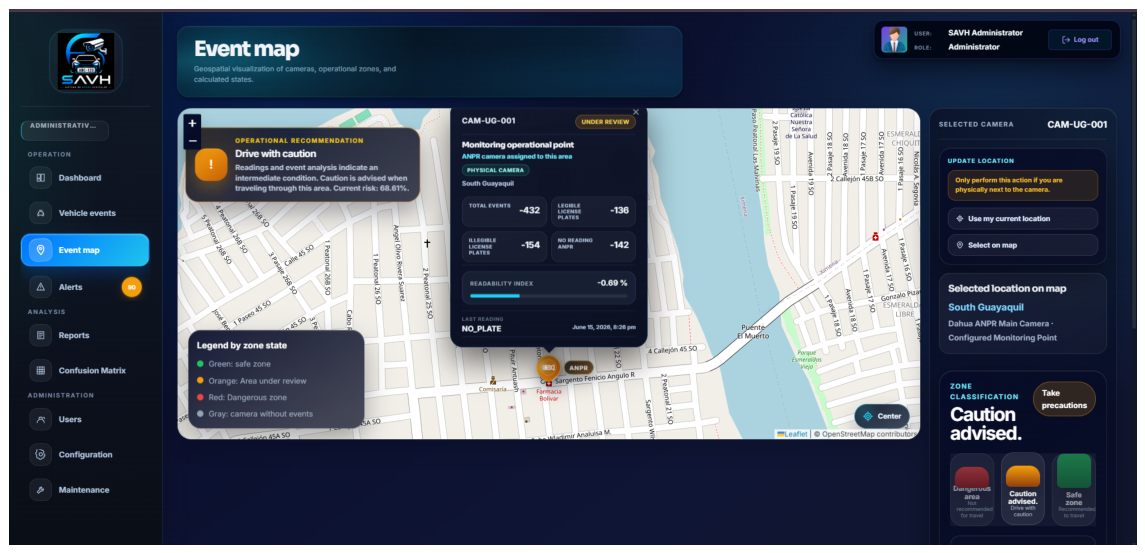
Figure 8.
Example of a plate classified as placa_legible by the YOLOv8n–CLS model. The image shows adequate sharpness, contrast, and framing for subsequent visual review.
Figure 8.
Example of a plate classified as placa_legible by the YOLOv8n–CLS model. The image shows adequate sharpness, contrast, and framing for subsequent visual review.
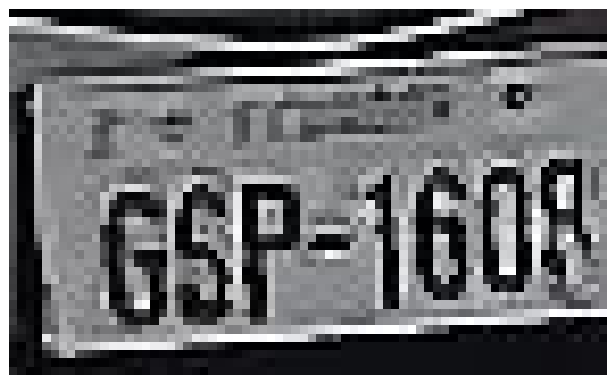
Figure 9.
Example of a plate classified as placa_no_legible by the YOLOv8n–CLS model. Significant occlusion prevents reliable character reading.
Figure 9.
Example of a plate classified as placa_no_legible by the YOLOv8n–CLS model. Significant occlusion prevents reliable character reading.
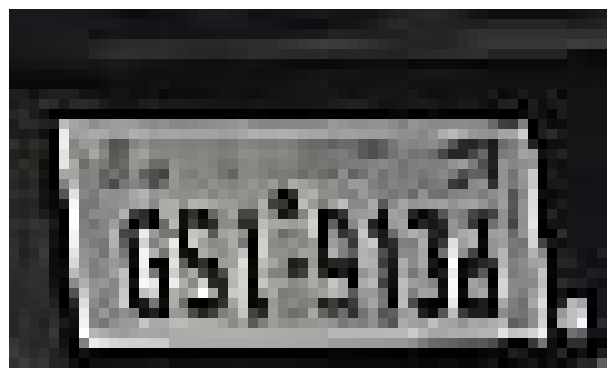
Figure 10.
Batch of 16 images from the validation set with ground-truth labels ( pixels). Light background: legible plate; dark background: non-legible plate. Samples from the relabeled LPLCv2 dataset.
Figure 10.
Batch of 16 images from the validation set with ground-truth labels ( pixels). Light background: legible plate; dark background: non-legible plate. Samples from the relabeled LPLCv2 dataset.
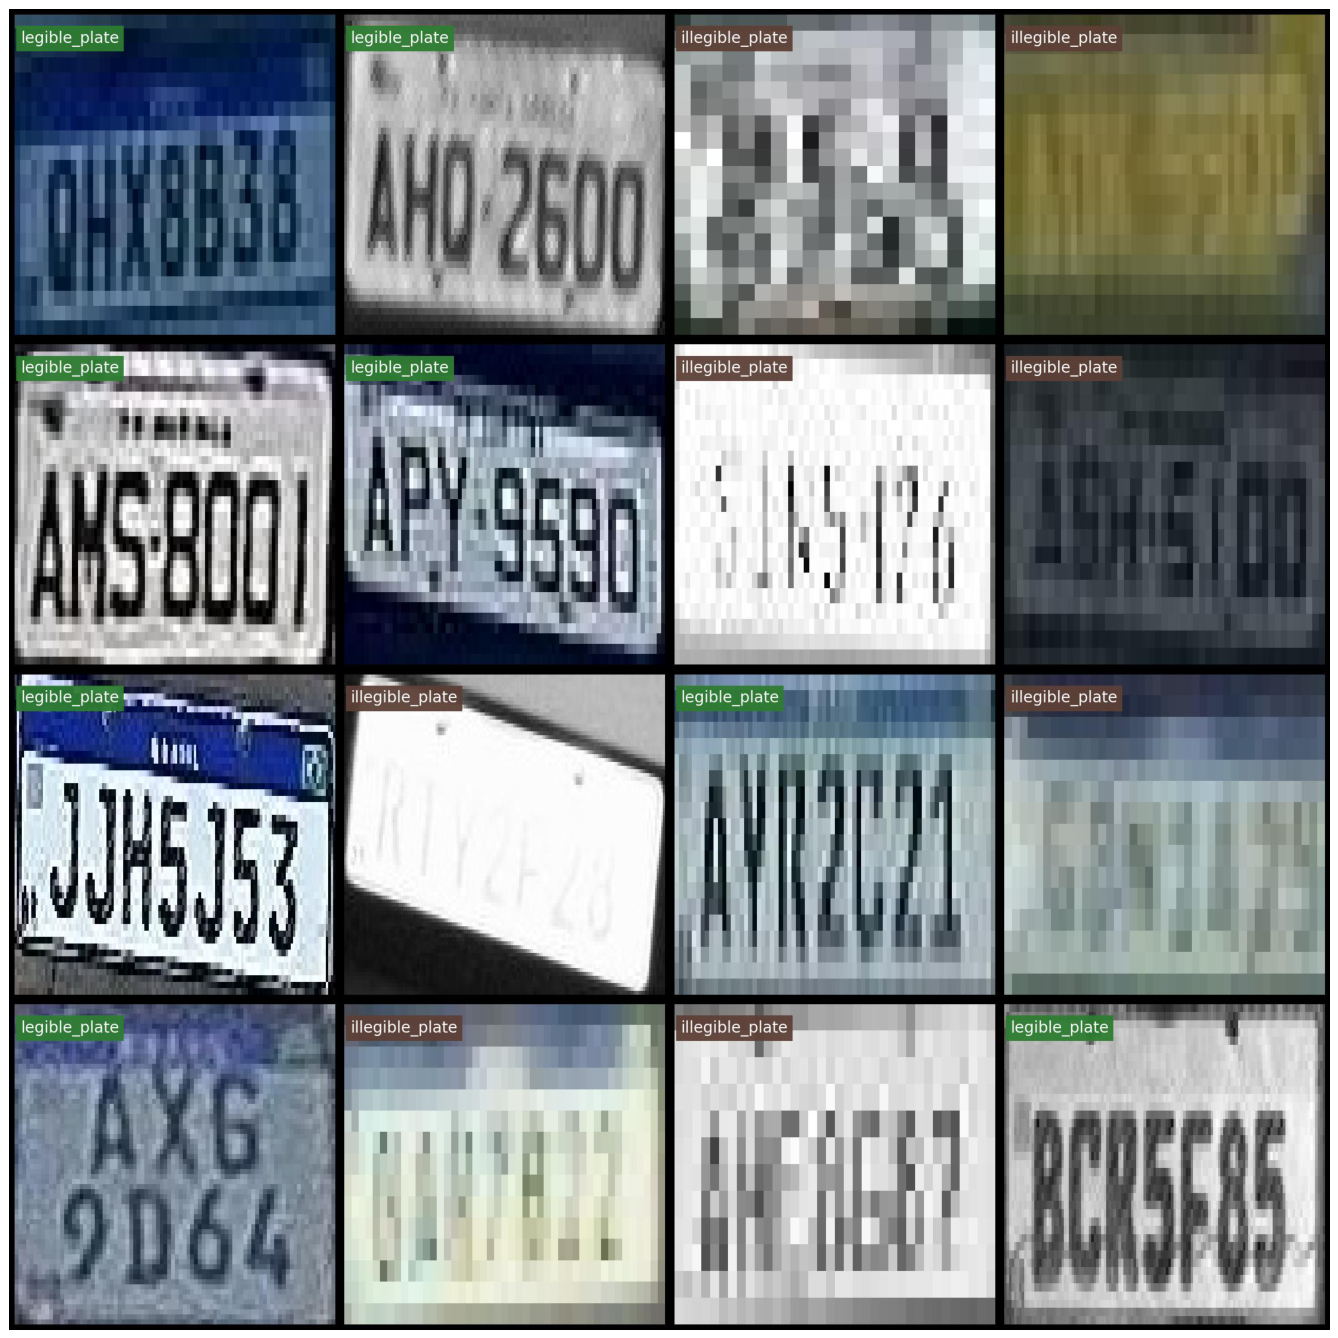
Figure 11.
Predictions of the YOLOv8n–CLS model on the same batch as Figure 10. Light background: predicted legible; dark background: predicted non-legible. Agreement: 97.4% with the manual labels.
Figure 11.
Predictions of the YOLOv8n–CLS model on the same batch as Figure 10. Light background: predicted legible; dark background: predicted non-legible. Agreement: 97.4% with the manual labels.
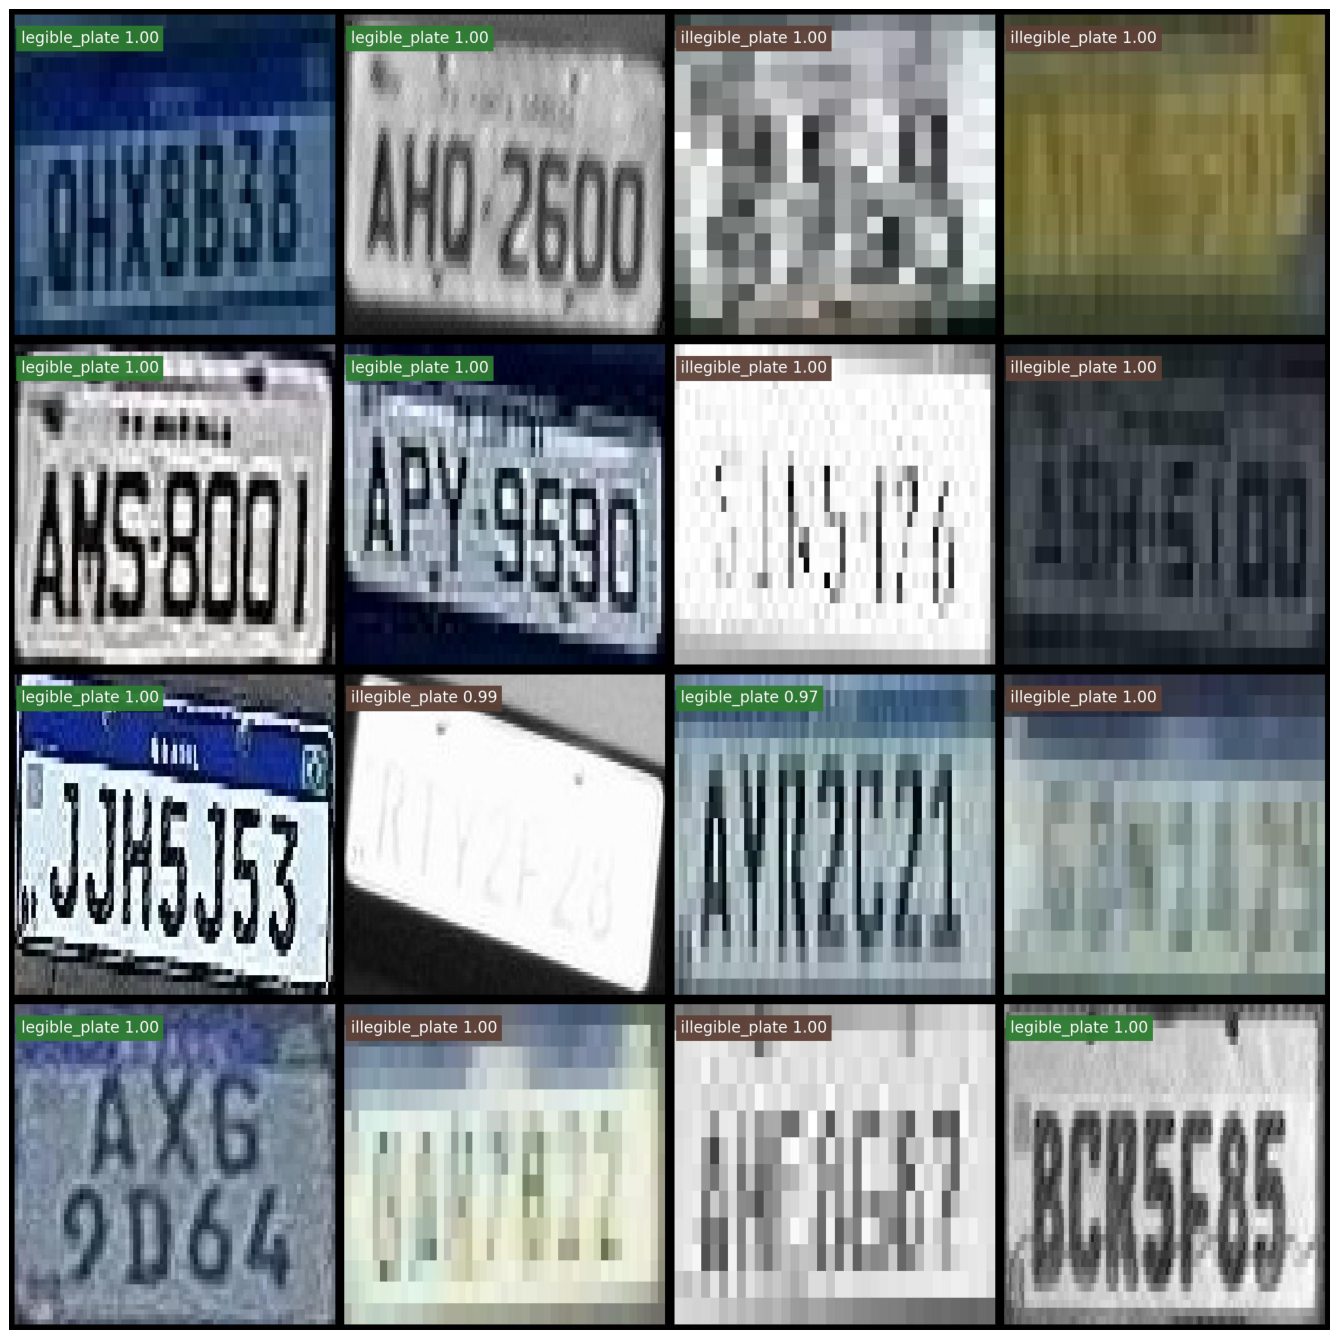
Figure 13.
Comparison of model accuracy between internal validation (test set, ) and external validation (custom Guayaquil dataset, ). The 2.31 percentage-point difference reflects the moderate degradation expected from domain shift.
Figure 13.
Comparison of model accuracy between internal validation (test set, ) and external validation (custom Guayaquil dataset, ). The 2.31 percentage-point difference reflects the moderate degradation expected from domain shift.
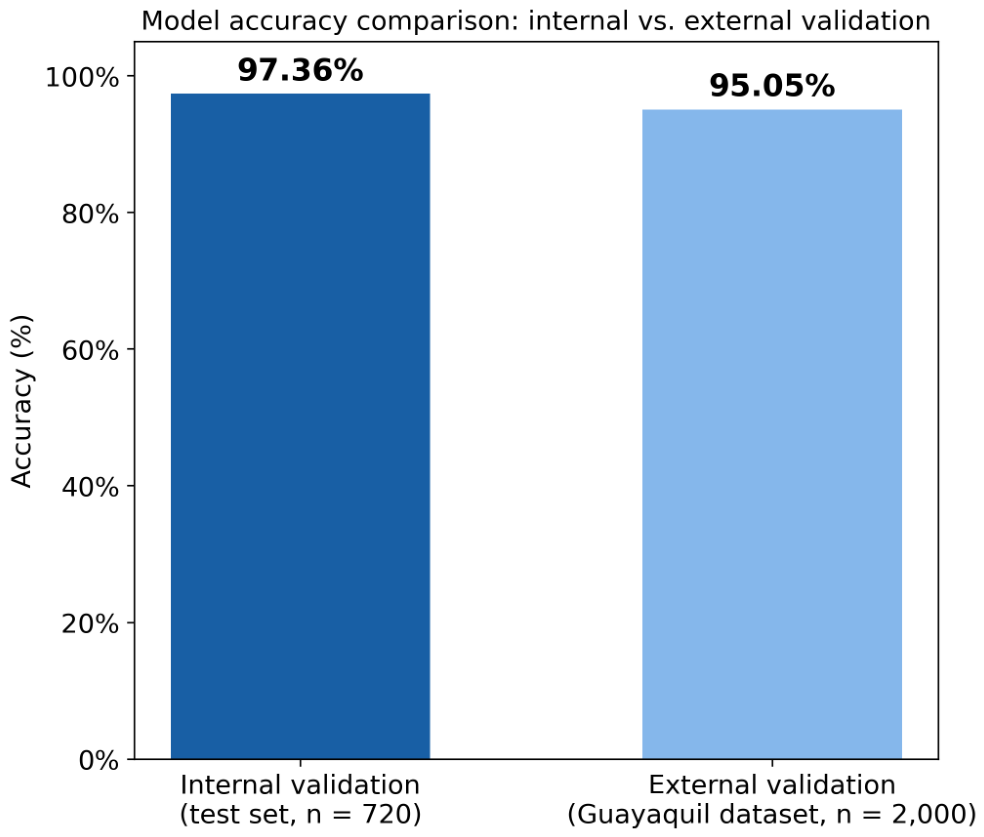

Table 1.
Methodological comparison with related work.
| Work | Main task | ANPR | Cloud | Near RT | Visual | Dashboard |
|---|---|---|---|---|---|---|
| quality | ||||||
| Richter et al. [2] | Transit filtering | Yes | Partial | Yes | No | No |
| Rodríguez et al. [1] | Speed estimation | Yes | No | Yes | No | No |
| Niu et al. [3] | Multiclass detection | No | No | Yes | No | No |
| Laroca et al. [8] | ALPR recognition | Yes | No | Yes | No | No |
| Zherzdev & Gruzdev [9] | End-to-end ALPR | Yes | No | Yes | No | No |
| SAVH (proposed) | Counting + visual classif. | Yes | Yes (AWS) | Yes | Yes | Yes |
Table 2.
Comparison of lens configurations for ANPR cameras by plate recognition distance.
| Lens (mm) | Min. dist. | Max. dist. | Application | Note |
|---|---|---|---|---|
| 2.7–12 | 18 ft (≈5.5 m) | 54 ft (≈16.5 m) | Access / local street | Configuration matching the installed camera |
| 8–32 | 45 ft (≈13.7 m) | 150 ft (≈45.7 m) | Road traffic | Comparative reference |
Table 3.
Distribution of the research dataset used for training, validation, and testing.
| Subset | Legible plate | Non-legible plate | Total |
|---|---|---|---|
| Training | 2,632 | 2,400 | 5,032 |
| Validation | 752 | 685 | 1,437 |
| Test | 376 | 344 | 720 |
| Total | 3,760 | 3,429 | 7,189 |
Table 4.
Verifiable experimental configuration of the classification model.
| Element | Specification |
|---|---|
| Model | YOLOv8n–CLS [4] |
| Task | Binary visual legibility classification |
| Classes | placa_legible, placa_no_legible |
| Framework | Ultralytics YOLOv8 |
| Initial weights | yolov8n-cls.pt (pretrained on ImageNet) |
| Epochs | 50 |
| Batch size | 16 |
| Image size | 224 × 224 |
| Optimizer | auto (Ultralytics automatic selection) |
| Patience | 100 |
| Seed | 0 |
| Training dataset | LPLCv2 [7] relabeled |
| External validation dataset | 2,000 Dahua Guayaquil images (Jun. 2026) |
| Backend integration | FastAPI on Amazon EC2 |
Table 5.
Reproducibility parameters extracted from the args.yaml file of the actual training run (Ultralytics YOLOv8n–CLS).
Table 5.
Reproducibility parameters extracted from the args.yaml file of the actual training run (Ultralytics YOLOv8n–CLS).
| Parameter | Value (args.yaml) |
|---|---|
| Base model / initial weights | yolov8n-cls.pt (pretrained on ImageNet) |
| Task | classify |
| Epochs | 50 |
| Batch size | 16 |
| Image size | 224 × 224 |
| Optimizer | auto (Ultralytics) |
| Initial learning rate (lr0) | 0.01 |
| Final learning rate (lrf) | 0.01 |
| Momentum | 0.937 |
| Weight decay | 0.0005 |
| Warmup epochs | 3.0 |
| Warmup momentum | 0.8 |
| Patience | 100 |
| Seed | 0 |
| Deterministic | true |
| AMP (mixed precision) | true |
| Augmentation — HSV (h, s, v) | 0.015, 0.7, 0.4 |
| Augmentation — horizontal flip (fliplr) | 0.5 |
| Augmentation — translate / scale | 0.1 / 0.5 |
| Augmentation — mosaic / erasing | 1.0 / 0.4 |
| Auto augment | randaugment |
| Test-time augmentation (augment) | false |
| Training environment | Google Colab, NVIDIA Tesla T4 GPU |
| Total duration | ∼1,539 s (∼25.6 min) |
Table 6.
Complexity, accuracy, and inference times of YOLOv8n–CLS versus baseline architectures. The three baseline models (MobileNetV2, EfficientNet-B0, and ResNet18) were trained and evaluated on the same internal test set of 720 images; accuracy, macro F1-score, and inference times (ms/image) correspond to real measurements on an NVIDIA Tesla T4 GPU.
Table 6.
Complexity, accuracy, and inference times of YOLOv8n–CLS versus baseline architectures. The three baseline models (MobileNetV2, EfficientNet-B0, and ResNet18) were trained and evaluated on the same internal test set of 720 images; accuracy, macro F1-score, and inference times (ms/image) correspond to real measurements on an NVIDIA Tesla T4 GPU.
| Model | Parameters | GFLOPs | Accuracy | Macro F1 | Inference (ms/image) |
|---|---|---|---|---|---|
| YOLOv8n–CLS (this work) | 1,440,850 | 3.4 | 97.36% | 97.36% | 1.7 (GPU T4) / 8.8 (CPU) |
| MobileNetV2 [12] | 2,226,434 | 0.65 | 98.47% | 98.47% | 8.11 (GPU T4) |
| EfficientNet-B0 [13] | 4,010,110 | 0.83 | 98.75% | 98.75% | 11.22 (GPU T4) |
| ResNet18 [10] | 11,177,538 | 3.65 | 99.03% | 99.02% | 5.05 (GPU T4) |
Table 7.
Confusion matrix of the internal test set.
| True class | Predicted legible | Predicted non-legible | Total |
|---|---|---|---|
| Legible plate | 361 | 15 | 376 |
| Non-legible plate | 4 | 340 | 344 |
| Total | 365 | 355 | 720 |
Table 8.
Classification metrics for the internal test set.
| Class | Precision | Recall | F1-score | Support |
|---|---|---|---|---|
| Legible plate | 98.90% | 96.01% | 97.44% | 376 |
| Non-legible plate | 95.77% | 98.84% | 97.28% | 344 |
| Macro average | 97.33% | 97.42% | 97.36% | 720 |
| Overall accuracy | 97.36% | |||
Table 9.
Performance comparison: internal validation vs. external validation.
| Dataset | N | Accuracy |
|---|---|---|
| LPLCv2 internal (test) | 720 | 97.36% |
| Guayaquil external (real) | 2,000 | 95.05% |
| Difference | — | −2.31% |
Table 10.
Processing latency of ANPR events, measured on the total_processing_ms attribute ( events).
Table 10.
Processing latency of ANPR events, measured on the total_processing_ms attribute ( events).
| Metric | Value |
|---|---|
| Events with total_processing_ms | 3,602 |
| Total latency — average (ms) | 181.94 |
| Total latency — median (ms) | 173.65 |
| Total latency — P95 (ms) | 296.37 |
| Total latency — min / max (ms) | 66.36 / 1,201.84 |
| YOLOv8n–CLS inference — average (ms) | 18.08 |
| YOLOv8n–CLS inference — median (ms) | 14.80 |
| Date range | not determined in this version |
Disclaimer/Publisher’s Note: The statements, opinions and data contained in all publications are solely those of the individual author(s) and contributor(s) and not of MDPI and/or the editor(s). MDPI and/or the editor(s) disclaim responsibility for any injury to people or property resulting from any ideas, methods, instructions or products referred to in the content. |
© 2026 by the authors. Licensee MDPI, Basel, Switzerland. This article is an open access article distributed under the terms and conditions of the Creative Commons Attribution (CC BY) license (http://creativecommons.org/licenses/by/4.0/).
Copyright: This open access article is published under a Creative Commons CC BY 4.0 license, which permit the free download, distribution, and reuse, provided that the author and preprint are cited in any reuse.