

Submitted:
24 July 2026
Posted:
27 July 2026
You are already at the latest version
Abstract
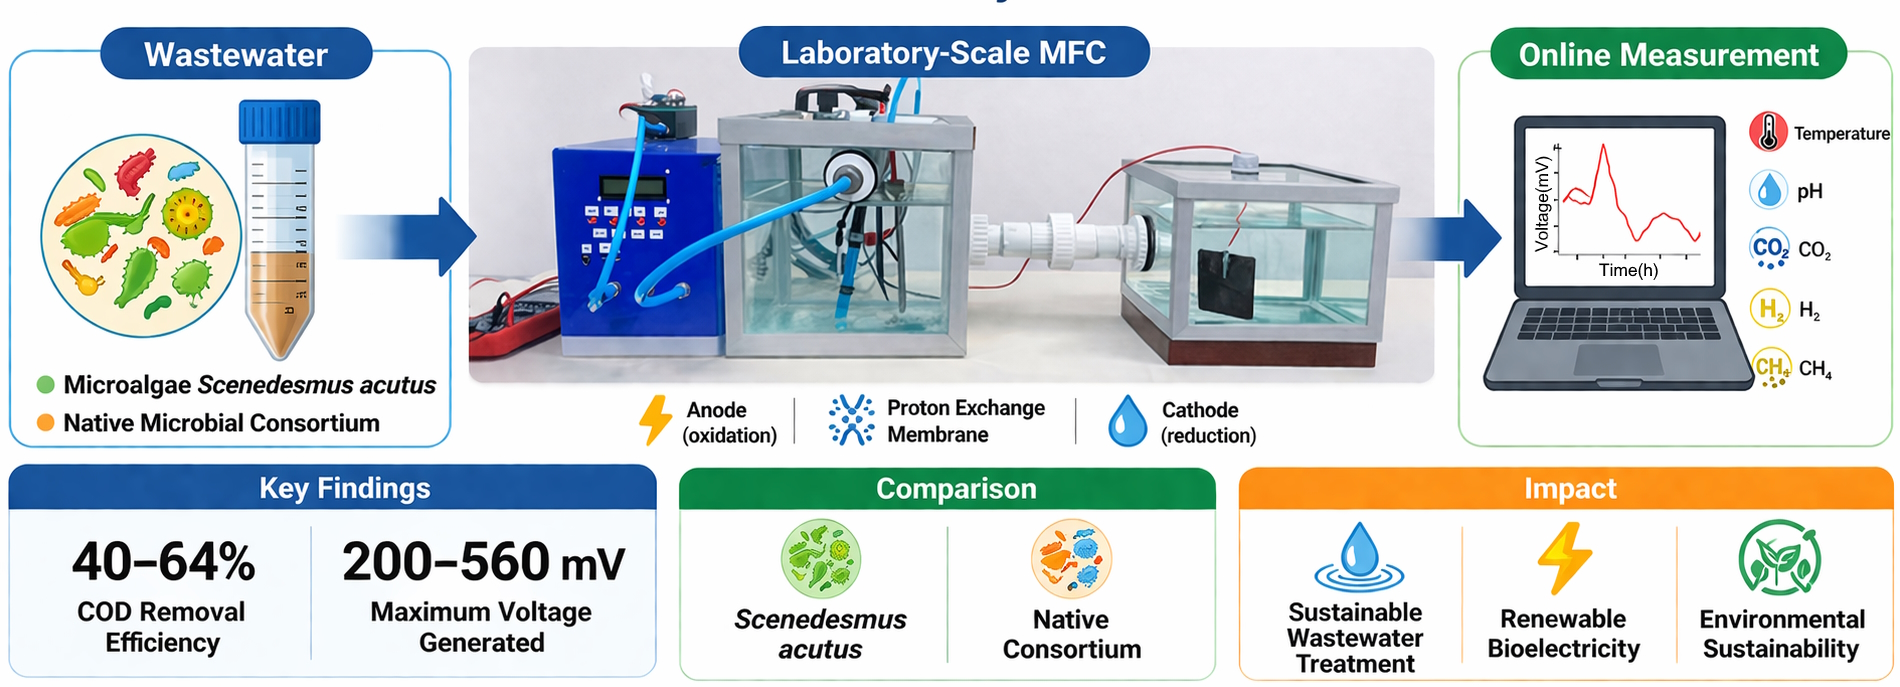
The growing deterioration of water resources and the energy requirements of conven-tional wastewater treatment technologies have increased interest in systems that combine organic matter removal with bioelectrochemical conversion. This study evaluated a la-boratory-scale dual-chamber microbial fuel cell (MFC) operated with real wastewater using Scenedesmus acutus (S. acutus) and a native microbial consortium as anodic bio-catalysts at 25 and 30 °C. The system was assessed through continuous monitoring of voltage, pH, temperature, and CH₄, H₂, and CO₂ signals in the anodic headspace, together with physicochemical characterization and COD removal.COD removal efficiencies of 33.7 and 30.3% were obtained for S. acutus at 25 and 30 °C, respectively, whereas the native microbial consortium achieved 29.8 and 43.4% removal under the same conditions. The consortium at 30 °C showed the most favorable combi-nation of COD removal and electrical response, whereas S. acutus at 30 °C reached the highest maximum voltage and stored energy, although with greater signal variability. The CH₄, H₂, and CO₂ signals differed among conditions and were consistent with the possible participation of fermentative and methanogenic processes alongside electrogenic activity, although gas production rates and the contribution of individual pathways were not quantified. Overall, the results demonstrate the operational feasibility of the pro-posed MFC for coupling wastewater treatment with a measurable electrical response and support further evaluation of native microbial consortia as anodic biocatalysts.
Keywords:
microbial fuel cell
; real wastewater
; Scenedesmus acutus
; native microbial consortium
; chemical oxygen demand
; bioelectrochemical treatment
1. Introduction
Wastewater management remains a major environmental and technological challenge because conventional treatment processes are generally designed to remove pollutants but often require substantial energy inputs. At the same time, wastewater contains organic matter that can serve as a substrate for biological conversion processes. This has encouraged the development of technologies that combine wastewater treatment with resource recovery and the generation of useful energy carriers.
Microbial fuel cells (MFCs) are bioelectrochemical systems in which microorganisms oxidize organic compounds and transfer electrons to an anode. These electrons flow through an external circuit toward the cathode, producing a measurable electrical response as the substrate’s organic load is reduced [1,2]. MFC performance depends on the interaction of several factors, including reactor configuration, electrode properties, membrane characteristics, substrate composition, microbial community, pH, temperature, and external electrical conditions [3,4,5,6].
The biocatalyst plays a central role in the degradation of organic matter and in the transfer of electrons within the anodic compartment. Pure or defined cultures can be used to investigate specific microbial functions, whereas mixed communities obtained from wastewater or sludge contain microorganisms with different metabolic capabilities [7,8]. Native microbial consortia may include fermentative, electrogenic, and methanogenic populations that use the original substrate or the intermediate products formed during its degradation. Their prior exposure to the wastewater matrix may also facilitate their establishment under the reactor’s physicochemical conditions. However, competition among microbial groups can divert part of the available substrate toward pathways that do not contribute directly to electron transfer to the anode.
Microalgae have also been evaluated in bioelectrochemical and wastewater treatment systems because of their capacity to assimilate nutrients and transform compounds present in aqueous matrices [9,10,11]. Most microalgae-based MFC studies have focused on photosynthetic cathodic configurations, in which oxygen produced under controlled illumination supports the cathodic reaction. Their use in the anodic compartment represents a different experimental configuration, particularly when illumination, photoperiod, biomass growth, and dissolved oxygen are not controlled as independent variables. Under these conditions, the observed response cannot be attributed exclusively to photosynthetic activity and must be evaluated within the overall biological system in the anodic chamber.
Among freshwater microalgae, S. acutus has been investigated for its ability to grow in nutrient-rich media and its potential applications in wastewater-related processes [11]. Nevertheless, its performance as an anodic biocatalyst in real wastewater may differ from that of a native microbial consortium composed of microorganisms already present in or obtained from the same wastewater source. Comparing these biological systems under the same reactor configuration can provide information on their respective physicochemical and electrical responses.
Operating temperature is also relevant because it affects microbial metabolism, substrate transformation, biofilm development, and electrochemical processes. Changes within a moderate temperature range may influence the rate of organic compound degradation and the distribution of metabolic products. In mixed microbial systems, temperature may also alter the relative activity of fermentative, electrogenic, and methanogenic populations [12,13,14]. However, the response to temperature depends on the characteristics of the biocatalyst and the wastewater matrix and therefore cannot be generalized across MFC configurations.
Although numerous studies have evaluated MFCs using synthetic substrates or controlled wastewater formulations, real wastewater presents greater variability in organic matter, suspended solids, nutrients, salts, and native microorganisms [15,16,17]. This complexity can affect both wastewater treatment and electrical behavior. Furthermore, limited information is available on the comparative response of an anodically incorporated microalgal culture and a native microbial consortium evaluated in the same dual-chamber MFC under different operating temperatures. Continuous monitoring of the gas-phase response may also provide complementary information on the transformations occurring in the anodic compartment, provided that these measurements are not interpreted as direct gas-production yields.
Accordingly, this exploratory study evaluated a laboratory-scale dual-chamber MFC operated with real wastewater using S. acutus and a native microbial consortium as anodic biocatalysts at 25 and 30 °C. The four experimental conditions were compared with respect to wastewater physicochemical changes, COD removal, voltage response, capacitor-stored energy, pH and temperature stability, and CH4, 2₂, and 2O₂ signals recorded in the anodic headspace. The study aimed to describe the responses associated with each biocatalyst–temperature combination and to identify the conditions that provided the most favorable balance between organic matter removal and electrical performance.
2. Materials and Methods
2.1. Study Design
Figure 1 illustrates the experimental workflow followed in this study, which comprised wastewater collection and characterization, preparation of the selected biocatalysts, operation of the dual-chamber microbial fuel cell, continuous monitoring of the operating variables, and physicochemical evaluation of the system before and after treatment.
The study was designed as an exploratory and comparative investigation. Each combination of biocatalyst and temperature was evaluated as an independent experimental condition operated in batch mode using the same laboratory-scale MFC prototype. This design enabled direct comparison of system performance as a function of biocatalyst type and operating temperature.
2.2. Wastewater Collection and Preservation
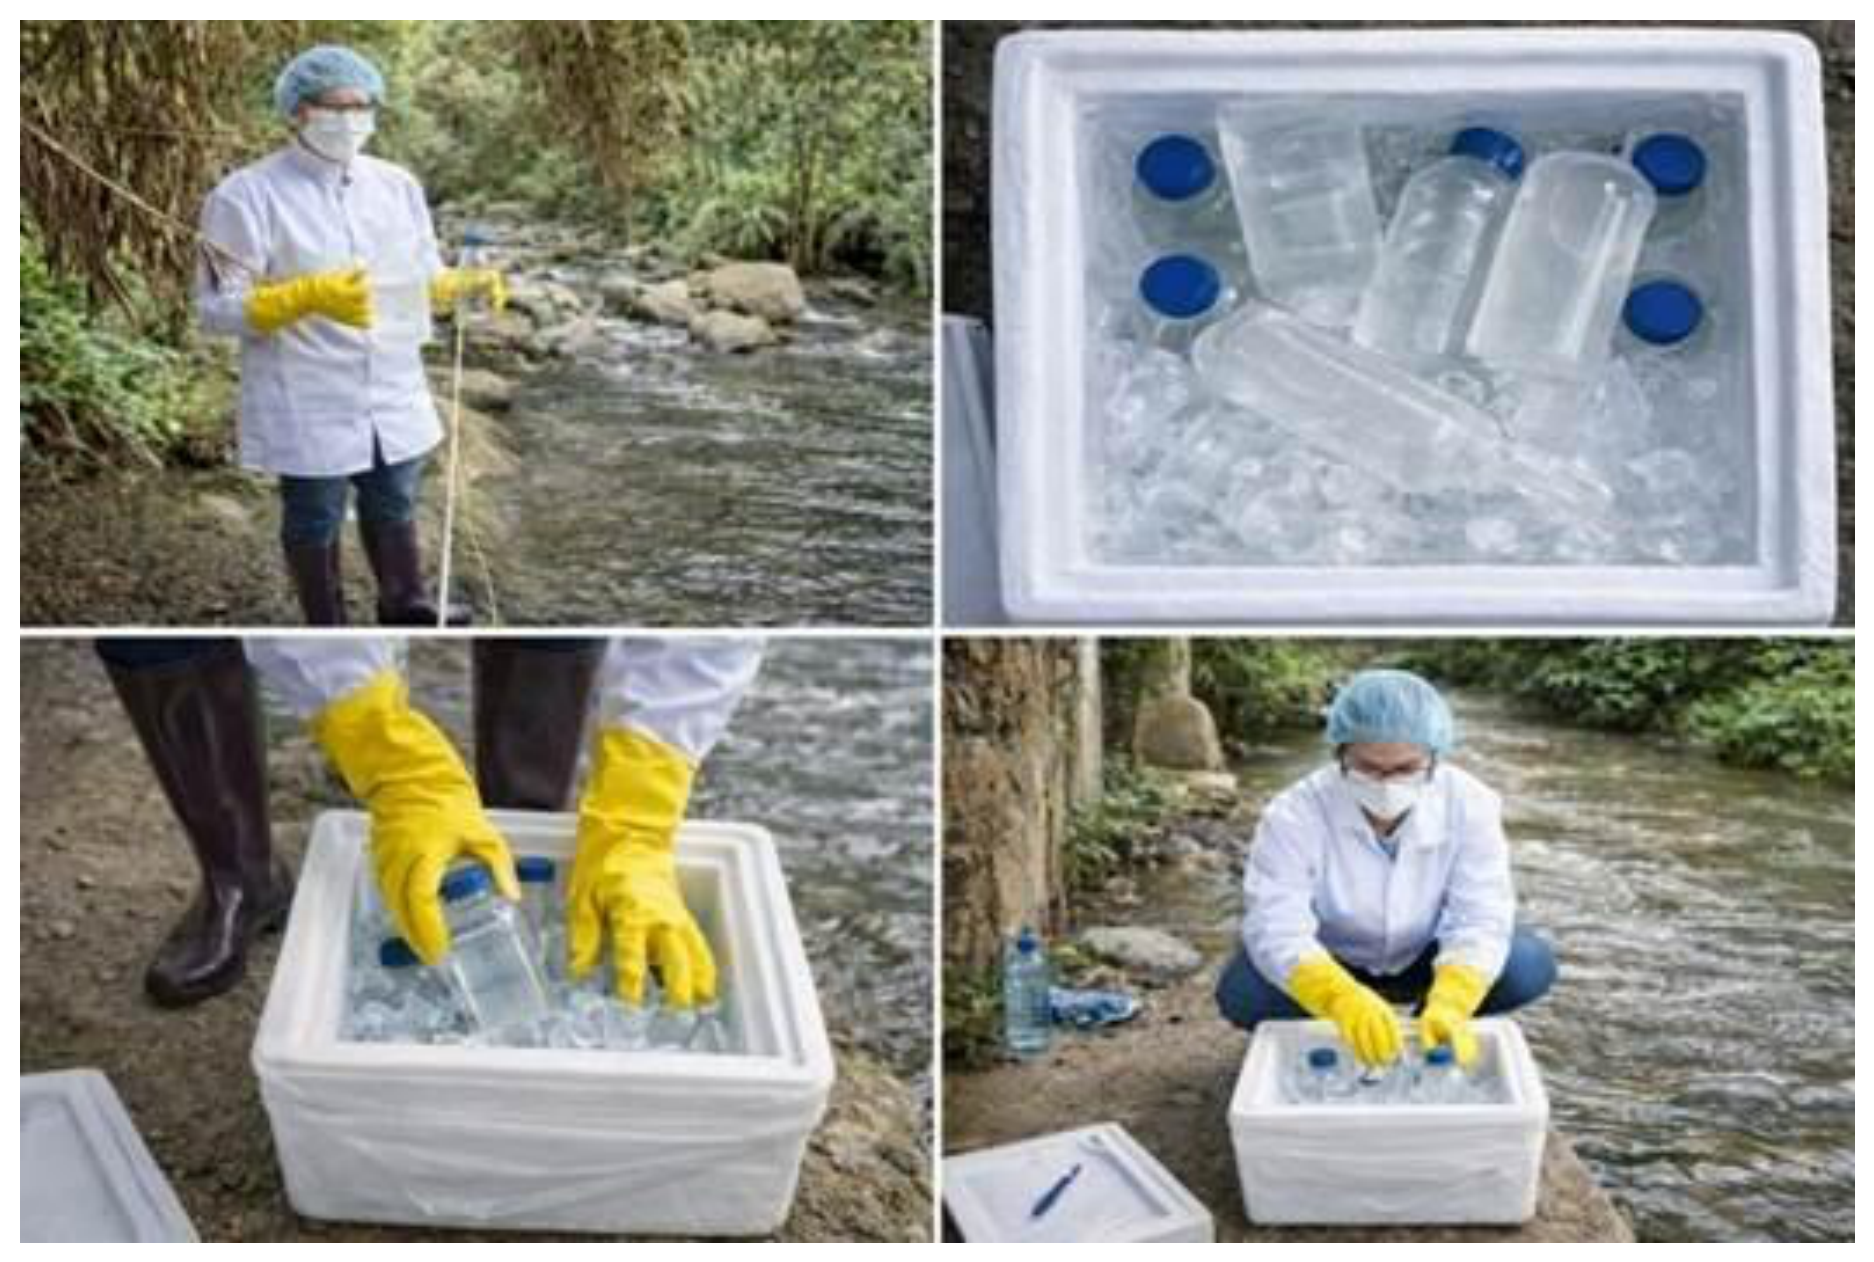
The wastewater used as the substrate was collected from a site in the Pamplonita River basin in Norte de Santander, Colombia, which is influenced by urban wastewater discharges. Sample collection, handling, and preservation were carried out in accordance with the guidelines established in NTC ISO 5667-2:1995 and NTC ISO 5667-3:2006.
Previously conditioned and rinsed plastic containers were used for sample collection. Approximately 1.5 L of wastewater was collected for the isolation and enrichment of the native microbial consortium, and 9 L was collected per experimental run, corresponding to the operating volume of the anodic chamber.
After collection, the samples were transported to the laboratory under refrigerated conditions at approximately 4 °C to minimize changes in their physicochemical and microbiological characteristics prior to processing and experimental use.
Figure 2.
Wastewater collection, preservation, and refrigerated transport procedures were used for the experimental assays.
Figure 2.
Wastewater collection, preservation, and refrigerated transport procedures were used for the experimental assays.
2.3. Wastewater Characterization
The physicochemical characterization of the wastewater was performed at the beginning and end of each experimental run to establish the matrix’s initial characteristics and evaluate treatment-related changes in the microbial fuel cell. The parameters analyzed were pH, apparent color, electrical conductivity, turbidity, phosphates, nitrites, sulfates, hardness, alkalinity, iron, and chemical oxygen demand (COD).
The analyses were conducted in accordance with the procedures established in the Standard Methods for the Examination of Water and Wastewater. Table 1 summarizes the parameters evaluated, their respective units, and the analytical methods employed.
2.4. Biocatalysts
To evaluate the influence of biocatalyst type on microbial fuel cell performance, two biological systems were used: a culture of the microalga Scenedesmus acutus and a native microbial consortium obtained from the same wastewater source used as the substrate. The use of these two biocatalysts enabled comparison between a defined microalgal culture and a complex microbial community previously exposed to the physicochemical characteristics of the wastewater matrix.
2.4.1. Scenedesmus acutus
Scenedesmus acutus was supplied by the Biotechnological Research Laboratory of the University of Pamplona. Prior to inoculation, the microalga was propagated in a synthetic culture medium under laboratory conditions and maintained under continuous illumination for 36 hours, reaching an approximate concentration of 50 × 1015⁵ cells/mL. The inoculum was subsequently introduced into the anodic chamber containing the synthetic wastewater and operated under the same experimental conditions applied to the other biocatalysts. This microorganism was selected because of its photosynthetic metabolism and reported potential in bioelectrochemical systems, enabling comparison of its performance with that of fermentative and bacterial biocatalysts under identical operating conditions. Because light intensity and photoperiod were not evaluated as independent experimental factors, the results are interpreted as differences associated with the biocatalyst rather than as a photoelectrochemical assessment.
2.4.2. Indigenous Microbial Consortium
The native microbial consortium was obtained from domestic wastewater collected at the Pamplonita River discharge point (Pamplona, Colombia), which was also used as the substrate during the microbial fuel cell validation stage. After collection, the wastewater was transported to the Biotechnological Research Laboratory of the University of Pamplona, where it underwent an enrichment stage under laboratory conditions to favor the growth of the native microbial community naturally adapted to the wastewater matrix. The enriched inoculum was subsequently introduced into the anodic chamber following the same start-up procedure used for the other experimental treatments. This approach made it possible to evaluate the performance of a microbial community previously adapted to the physicochemical characteristics of the substrate and to compare it directly with that obtained using pure cultures under the same operating conditions.
2.5. MFC Configuration
The experimental system consisted of a laboratory-scale dual-chamber microbial fuel cell designed to evaluate bioelectrochemical performance under controlled conditions. The prototype comprised an anodic chamber and a cathodic chamber separated by a Nafion® 117 proton-exchange membrane, which enabled ionic transport between the two compartments while helping maintain the separation of oxidation and reduction reactions.
The anodic chamber had a prismatic geometry, with internal dimensions of 27.5 × 23.5 × 25.5 cm and an approximate geometric volume of 16.48 L. The cathodic chamber, with dimensions of 19.5 × 22.5 × 22.5 cm, had an approximate geometric volume of 9.87 L. Both chambers were constructed from glass, selected for its high electrical resistivity, thermal stability, and chemical inertness, and were reinforced with aluminum elements positioned at the corners to improve mechanical stability.
During the experimental runs, the system operated with a working volume of 9 L in the anodic chamber and 5.5 L in the cathodic chamber. The anodic chamber contained domestic wastewater inoculated with either Scenedesmus acutus or the native microbial consortium, depending on the experimental condition, whereas the cathodic chamber contained a phosphate buffer solution maintained at approximately pH 7.0.
The upper section of the anodic chamber housed sensors for continuous pH and temperature monitoring, together with a heating element for thermal control, all installed through hermetically sealed fittings. The prototype also incorporated lateral ports for substrate loading and discharge, gas evacuation and monitoring, and connection to the cathodic compartment.
For the experimental runs, carbon electrodes with a surface area of 54 cm2 were installed in each compartment, ensuring sufficient contact with the liquid medium to support the bioelectrochemical processes in the system.
The prototype also incorporated a gas chamber equipped with a multisensor system based on MQ-series gas sensors for the continuous monitoring of CH4, 2₂, and 2O₂ in the headspace of the anodic chamber. The signals generated by the sensors were continuously acquired and recorded through the electronic data acquisition platform, enabling the generation of temporal response profiles for each gas throughout the seven-day operating period of each experimental run. In addition, the system continuously monitored cell pH, temperature, and voltage (Figure 3).
Before each experimental run, the proton exchange membrane was conditioned, and the sealing of the chambers, electrical connections, temperature-control system, and data-acquisition channels was verified.
2.6. Experimental Conditions and Operation
The microbial fuel cell was operated in batch mode for seven days under controlled anaerobic conditions. Four experimental configurations were established to evaluate the effects of biocatalyst type and operating temperature on system performance.
Two biocatalysts were investigated: the microalga S. acutus and a native microbial consortium, each tested at 25 and 30 °C. Accordingly, experiments L1 and L2 were conducted with S. acutus at 25 and 30 °C, respectively, whereas experiments L3 and L4 were performed with the native microbial consortium under the same temperature conditions.
This experimental design enabled direct comparison of the two biocatalysts and assessment of the influence of temperature on MFC performance. The experimental configurations are summarized in Table 2.
2.7. Monitoring and Experimental Data Management
The performance of the MFC was monitored using a data acquisition system that continuously recorded the key operating variables during each experimental run. The platform enabled real-time monitoring of cell pH, temperature, and voltage, as well as the signals from sensors that tracked CH4, 2₂, and 2O₂ in the headspace of the anodic chamber.
Data from the different sensors were transmitted through a communication network based on the MQTT protocol. The measurements were sent to a central server responsible for receiving, routing, and storing the experimental information. This configuration enabled real-time access to the recorded variables while preserving the complete dataset for subsequent processing and analysis.
Temperature control was performed using a proportional-integral-derivative (PID) algorithm that automatically regulated the heating element. The controller continuously compared the measured temperature with the setpoint established for each experimental condition and adjusted the heating power according to the observed deviation.
The data generated during each experimental run were stored in a MariaDB database. The storage structure was organized to associate each experiment with its corresponding operating variables and gas-sensor signals. In this way, records of pH, temperature, voltage, and other system-state variables were linked to the CH4, 2₂, and 2O₂ measurements through the identifier and time reference assigned to each experiment.
This data-management structure ensured traceability of the information generated throughout the seven-day operating period and facilitated the subsequent reconstruction of temporal profiles for each experimental condition. The recorded data could also be exported as flat files for further processing, analysis, and backup.
2.8. COD Sampling, Removal Efficiency, and Electrical Performance Analysis
COD was determined at three stages of each experimental run: before biocatalyst inoculation, immediately after inoculation at the beginning of MFC operation, and after seven days of treatment.
At each sampling stage, three aliquots were collected from the same reactor sample and analyzed independently. These measurements therefore represented analytical replicates rather than independent experimental replicates.
COD removal efficiency was calculated using the mean post-inoculation COD concentration as the operational baseline:
where COD0 is the mean COD concentration measured immediately after inoculation at the beginning of MFC operation, and CODf is the mean COD concentration measured after seven days of treatment.
The post-inoculation COD concentration was selected as the operational baseline because the addition of the biocatalyst altered the initial organic load of the wastewater. This approach therefore reflects the change in COD occurring specifically during MFC operation.
The electrical performance of the MFC was evaluated from the voltage continuously recorded throughout each seven-day experimental run.
The electrical energy stored in the 10 F capacitor was calculated as:
where E is the stored electrical energy (J), C is the capacitance (10 F), and V is the measured voltage (V). For presentation in the comparative electrical performance table, energy values were expressed as mW·s.
The resulting electrical variables and normalized performance indicators were used to compare the bioelectrochemical performance of S. acutus and the native microbial consortium at 25 and 30 °C.
3. Results
3.1. Wastewater Physicochemical Response
The initial and final physicochemical parameters of the wastewater are summarized in Table 3. The evaluated parameters included pH, color, conductivity, turbidity, phosphates, nitrites, sulfates, hardness, alkalinity, iron, and COD across the four experimental configurations.
The pH remained within an approximate range of 6.9 to 8.9. In L1, it increased from 7.06 to 8.12, whereas in L2 it decreased from 8.87 to 7.28. More moderate variations were observed in the treatments containing the native microbial consortium, with final values remaining close to neutrality. Overall, these results indicate that the MFC operated without developing extreme acidic or alkaline conditions during the periods evaluated.
Turbidity decreased under all four experimental conditions. The greatest reduction was observed in L4, where turbidity decreased from 249 to 57.1 NTU, corresponding to an approximate 77.1% reduction. L2 showed a reduction of approximately 50.8%, whereas decreases of 14.1% and 9.8% were observed in L1 and L3, respectively. These results indicate that the effect of treatment on suspended particulate matter varied among the experimental conditions.
Color removal was particularly pronounced in L2, where the value decreased from 483 to 143 Pt-Co units, corresponding to an approximate 70.4% reduction. A slight increase was observed in L1, whereas only minor changes occurred in L3 and L4. Therefore, color reduction did not follow a consistent pattern across the experimental conditions.
Electrical conductivity also showed different trends among the treatments. In L3, it decreased from 212 to 136.7 µS cm−1¹, whereas increases were observed in L1, L2, and particularly L4. The increase recorded in L4, from 136.7 to 396 µS −1m⁻¹, suggests a substantial change in the concentration of dissolved ionic species during treatment. These variations may be associated with organic matter degradation, metabolite release, mineral species transformation, and changes in the ionic balance of the wastewater matrix.
Iron concentration decreased in L1 and L3 by approximately 43.5% and 57.5%, respectively, whereas increases were observed in L2 and L4. Consequently, no consistent iron removal pattern was identified across all experimental conditions. Similarly, the variations observed in nitrite, sulfate, phosphate, hardness, and alkalinity indicate that the physicochemical response depended on the specific combination of biocatalyst, operating temperature, and initial wastewater composition.
3.2. pH and Temperature Stability
Continuous monitoring of pH and temperature made it possible to track the behavior of these variables throughout the seven-day duration of each experimental run. Monitoring these parameters was particularly relevant because both influence microbial metabolic activity, organic matter degradation, and the electron-transfer processes associated with the bioelectrochemical operation of the MFC.
The thermal control system brought the temperature to the setpoint defined for each treatment and maintained it close to either 25 or 30 °C during most of the operating period. As shown in Figure 4a, the experiments conducted at 25 °C displayed relatively stable behavior after an initial adjustment phase. Similarly, the conditions established at 30 °C reached and maintained the target temperature, although a transient deviation was observed in the experiment with the native microbial consortium before the system returned to the programmed operating condition.
Continuous pH recording also enabled its evolution to be followed throughout the entire experimental period. As shown in Figure 4b, after the initial fluctuations, the pH values tended to stabilize near neutrality. This behavior indicates that during most of the experiments, no extreme acidic or alkaline conditions developed that could have significantly affected the system’s biological activity.
Overall, the evolution of pH and temperature indicates that the MFC operated under relatively stable conditions across the four experimental configurations. The observed variations were mainly transient, and the system generally maintained or recovered the established operating conditions. These results provide a basis for interpreting the electrical response, COD removal, and variations in CH4, 2₂, and 2O₂ recorded during the experiments.
3.3. Voltage Response
Figure 5 shows the evolution of the voltage recorded during the seven-day operating period of the MFC under the four experimental conditions. A progressive increase in voltage was observed across all experiments; however, the shape of the response, the magnitude of fluctuations, and the values reached varied with the biocatalyst and operating temperature.
Experiment L1 showed a gradual increase in voltage. During the first four days, the signal rose from near zero to approximately 70 mV. Thereafter, the voltage increased more rapidly and exhibited some fluctuations, reaching values close to 225 mV. This behavior indicates a slow initial electrical response followed by greater voltage generation during the second half of the operating period.
L2 showed the greatest signal variability among the conditions evaluated. The voltage increased during the first few days but exhibited larger fluctuations throughout the experiment. Peaks above 250 mV and a maximum value of approximately 280 mV were recorded, alternating with periods in which the signal remained between approximately 110 and 200 mV. Thus, this condition reached the highest maximum voltage but showed a less stable response than the other experimental configurations.
Experiment L3 showed a progressive increase in voltage throughout the seven days of operation. The signal increased in stages, with intervals of relative stability between the different levels reached. After the fourth day, the voltage continued to increase, exceeding 200 mV and reaching a maximum of approximately 220 mV. Compared with L2, this condition showed smaller fluctuations and a more uniform electrical response.
L4 showed a faster electrical response during the first day of operation. The voltage subsequently continued to increase gradually, with intermediate periods of relative stability. During the final days of the experiment, the signal exceeded 200 mV, reaching a maximum near 250 mV. This condition combined an early electrical response with high voltages for a substantial portion of the experimental period.
Comparison of the four conditions revealed distinct electrical response patterns. L2 reached the highest maximum voltage but also exhibited the largest fluctuations. L3 showed a more uniform evolution, whereas L4 combined a rapid initial response with high voltage values during the final days of operation. In contrast, L1 showed the slowest increase during the initial stage, followed by greater voltage generation during the second half of the experiment. These results indicate that both biocatalyst type and operating temperature influenced the electrical response of the MFC.
The differences observed in the voltage response were also reflected in the maximum energy stored by the system. As shown in Table 4, L2 exhibited the highest value, approximately 0.392 J, associated with a maximum voltage close to 280 mV. The second-highest value was obtained for L4, with 0.313 J and a maximum voltage of approximately 250 mV. L1 and L3 showed maximum stored energy values of 0.253 and 0.242 J, respectively.
The highest maximum stored energy value observed in L2 was associated with the voltage peaks recorded during the experiment. However, this condition also showed the greatest signal variability. In contrast, L4 reached a lower maximum energy value but maintained high voltage levels for a longer portion of the operating period. L1 and L3 showed similar maximum energy values, although their electrical responses evolved differently.
Overall, the conditions operated at 30 °C reached the highest maximum stored energy values for both biocatalysts. The results also show that the maximum magnitude reached and the signal’s stability did not necessarily follow the same pattern. Whereas L2 achieved the highest maximum voltage and stored energy, L4 exhibited a high electrical response with lower variability for a substantial portion of the experiment. Therefore, the combined analysis of voltage and stored energy revealed clear differences in the electrical performance of the four experimental conditions.
3.4. Headspace Gas-Concentration Dynamics
As shown in Figure 6a, the highest CH4 concentrations were recorded in L4 and L3, reaching approximately 315 and 290 ppm, respectively. L2 reached nearly 260 ppm, whereas L1 showed the lowest value, at approximately 227 ppm. For both biocatalysts, conditions at 30 °C produced higher C4₄ concentrations than at 25 °C, with a more pronounced difference in experiments conducted with the native microbial consortium.
H2 exhibited a different response, as shown in Figure 6b. The highest concentration was recorded in L3 at approximately 560 ppm, followed by L4 and L2 at 505 and 500 ppm, respectively. L1 showed the lowest value, at nearly 200 ppm. Therefore, increasing the temperature did not produce the same effect on 2₂ as that observed for 4H₄. In experiments with the native microbial consortium, the highes2 H₂ concentration was observed at 25 °C, whereas the highes4 CH₄ concentration was observed at 30 °C.
The H2 and C4₄ signals may be associated with different pathways of organic matter transformation within the anodic chamber. In bioelectrochemical systems containing mixed microbial communities,2H₂ may be formed as an intermediate during the degradation of fermentative substrates and subsequently consumed by electrogenic or methanogenic microorganisms. The detection of4CH₄ suggests that a fraction of the available substrates or metabolic intermediates may have been utilized through methanogenic pathways. Previous studies on MFC anodes have reported that fermentatio2, H₂ formation, methanogenesis, and electricity generation may occur within the same system and compete for the available substrates [18,19].
However, the measurements obtained in this study do not allow the predominant metabolic pathways to be established, the microorganisms responsible to be identified, or the proportion of organic matter transformed through each process to be quantified. Accordingly, the association of the H2 and C4₄ signals with fermentative and methanogenic activity is presented as a possible explanation for the observed behavior rather than as confirmation of a specific metabolic mechanism.
The CO2 signal, shown in Figure 6c, exhibited periodic oscillations throughout the four experiments. The regularity of this pattern suggests that the response may have been influenced by gas dynamics in the headspace, the sensor response time, or the operation of the data acquisition system. Therefore, the C2₂ record was used to describe changes during MFC operation and was not interpreted as a direct quantification of the amount of gas generated.
Overall, the native microbial consortium produced the highest CH4 and 2₂ concentrations, although the maximum values for each gas were reached at different temperatures. This indicates that the gas-phase response did not follow a single trend and depended on the experimental condition evaluated.
The reported values correspond to concentrations recorded by the sensors in the anodic headspace. They therefore allow comparison of the magnitude and evolution of the signals among the experiments but do not represent accumulated gas volumes, production rates, or volumetric yields of CH4, 2₂, or 2O₂.
3.5. COD Removal
Organic matter removal was evaluated by comparing the COD measured at the start of each experiment, after the addition of the biocatalyst, with the COD measured at the end of the seventh day of operation. The post-inoculation measurement was used as the initial value because the addition of the biocatalyst could modify the organic load in the anodic chamber. Therefore, the removal efficiency represents the decrease in COD that occurred during the seven-day operation of the MFC.
At each sampling point, three sampling replicates were collected directly from the anodic chamber. The samples were collected at the same time and analyzed independently. The results are expressed as mean ± standard deviation (n = 3). As shown in Table 5. COD decreased under all four experimental conditions, although the magnitude of the reduction varied among the experiments.
L4 showed the greatest COD reduction among the conditions evaluated. The concentration decreased from 160.7 ± 2.0 to 91.0 ± 1.5 mg O2 −1⁻¹, corresponding to an absolute reduction of 69.7 m2 −1₂ L⁻¹ and a removal efficiency of 43.4%.
In L1, COD decreased from 98.0 ± 1.8 to 65.0 ± 2.0 mg O2 −1⁻¹, corresponding to a reduction of 33.0 m2 −1₂ L⁻¹ and a removal efficiency of 33.7%. In L2, the concentration decreased from 81.3 ± 1.2 to 56.7 ± 2.2 −1g O₂ L⁻¹, representing a reduction of 24−16 mg O₂ L⁻¹ and a removal efficiency of 30.3%.
L3 showed an absolute reduction of 49.0 mg O2 −1⁻¹, with COD decreasing from 164.7 ± 1.6 to 115.7 ± 2.2 m2 −1₂ L⁻¹. Because of its higher initial concentration, this reduction corresponded to a removal efficiency of 29.8%, the lowest percentage among the four conditions.
The effect of temperature differed between the two biocatalysts. In the experiments with S. acutus, COD removal was slightly higher at 25 °C than at 30 °C, with efficiencies of 33.7% and 30.3%, respectively. In contrast, for the native microbial consortium, increasing the temperature from 25 to 30 °C was associated with an increase in removal efficiency from 29.8% to 43.4%. These results indicate that the influence of temperature on COD reduction depended on the biocatalyst used.
The greatest dispersion among the sampling replicates was observed for the final COD concentration in L2, with a standard deviation of 21.4 mg O2 −1⁻¹. L4 showed a final standard deviation of 12.5 m2 −1₂ L⁻¹, whereas L1 and L3 exhibited lower variability among the three samples analyzed.
Overall, COD decreased under all four experimental conditions during the seven-day operating period. L4 achieved the highest removal efficiency, whereas L1, L2, and L3 showed efficiencies ranging from 29.8% to 33.7%. Because each condition was evaluated in a single reactor experiment, these results should be interpreted as descriptive trends among the experimental configurations rather than as statistically significant differences between treatments.
4. Discussion
The results showed that the performance of the microbial fuel cell was influenced by the combined effects of biocatalyst type and operating temperature. The highest values of the evaluated indicators were distributed across different conditions: L2 exhibited the highest maximum voltage and maximum stored energy, L4 achieved the greatest COD removal and the highest CH4 concentration, and L3 recorded the highest 2₂ concentration. Accordingly, the system was evaluated by relating organic matter removal to the electrical response and the gas concentrations measured in the anodic headspace.
Figure 7 integrates these indicators through a normalized comparison. At 25 °C, the native microbial consortium produced higher concentrations of H2 and C4₄, whereas S. acutus achieved greater COD removal. At 30 °C, S. acutus reached the highest maximum voltage, while the native consortium showed the greatest COD removal and a higher 4H₄ concentration. The figure, therefore, highlights the specific electrical, physicochemical, and gas-phase responses associated with each experimental configuration.
Continuous pH and temperature monitoring showed that all four configurations maintained relatively stable operating conditions throughout the seven-day experiments. Following the initial variations, pH remained close to neutrality, and the thermal control system maintained the temperature near the setpoint established for each condition. A transient temperature deviation occurred in L4, after which the system returned to the programmed value. These records verified the operating conditions under which the electrical, physicochemical, and gas-phase responses were obtained.
In experiments with S. acutus, increasing the temperature from 25 to 30 °C was accompanied by increases in maximum voltage from approximately 225 to 280 mV and in maximum stored energy from 0.253 to 0.392 J. In contrast, COD removal was slightly lower at 30 °C, reaching 30.3%, compared with 33.7% at 25 °C. L2 also exhibited wider voltage fluctuations than L1. Under the conditions evaluated, operating at 30 °C favored the maximum electrical response of S. acutus but did not improve COD removal.
The native microbial consortium showed a different response. Increasing the temperature from 25 to 30 °C increased COD removal from 29.8% to 43.4%, maximum voltage from approximately 220 to 250 mV, and maximum stored energy from 0.242 to 0.313 J. Among the conditions evaluated, the native consortium operated at 30 °C, which combined the greatest COD reduction with a high electrical response.
The behavior of the native consortium can be interpreted in the context of the functional diversity of mixed microbial communities. Such systems may contain fermentative, electrogenic, and methanogenic microorganisms that use either the primary substrate or intermediates generated during its transformation. Freguia et al. [18] observed in glucose-fed MFC anodes that a substantial fraction of the substrate was initially converted through fermentation into H2 and acetate, which were subsequently used in electricity-generating processes. Jung and Regan [19] further demonstrated that electrogenic and methanogenic microorganisms may compete for the electron donors available in the anodic compartment. These studies provide a framework for interpreting the 2₂ and 4H₄ signals obtained here, although they do not establish the specific contribution of each microbial group in the present system.
L4 simultaneously achieved the highest COD removal and the highest maximum CH4 concentration, approximately 315 ppm. The occurrence of both responses suggests that part of the transformed organic matter may have followed pathways associated with methane formation, in addition to the processes contributing to the electrical response. Jung and Regan [19] reported that methanogenesis may compete with electrogenesis for available substrates and that electrical operating conditions can influence electron distribution between these pathways. Because electron balances and microbial analyses were not performed in the present study, the fraction of organic matter contributing to current generation or C4₄ formation could not be quantified.
L3 recorded the highest H2 concentration, approximately 560 ppm, but exhibited the lowest COD removal efficiency, 29.8%, and a maximum stored energy of 0.242 J. Thus, the highest 2₂ concentration in the anodic headspace did not coincide with the highest organic matter removal, voltage, or stored energy. According to Freguia et al. [18],2H₂ may be generated as an intermediate during substrate fermentation and subsequently consumed by other microorganisms within the system. In the present study, however, the amount o2 H₂ produced or consumed could not be determined because the measurements corresponded to headspace concentrations rather than accumulated gas volumes or flow rates.
The CH4, 2₂, and 2O₂ signals must therefore be interpreted according to the type of measurement performed. The sensors enabled comparison of gas concentrations and their evolution among the experimental conditions, but they did not provide production rates or volumetric yields. In particular,2CO₂ showed an oscillatory pattern that may have been associated with actual variations in headspace concentration, the sensor response time, or the data acquisition system. The available information does not allow these effects to be distinguished; consequently, th2 CO₂ signal was used only for comparative purposes.
The experiments with S. acutus also showed COD removal and measurable voltage generation. However, these responses cannot be attributed exclusively to microalgal activity because non-sterile wastewater was used, and the microorganisms present in the anodic chamber were not characterized. The results should also not be explained according to the operation of a photosynthetic biocathode, since S. acutus was introduced into the anodic compartment and illumination was not evaluated as an independent experimental variable.
Angioni et al. [20] investigated a different configuration in which domestic wastewater was used as the anolyte, and S. acutus was incorporated into the catholyte under continuous illumination. In that system, the microalga contributed to cathodic operation. Comparison with that study helps distinguish the two configurations and prevents the response observed in the present anodic chamber from being directly attributed to photosynthetic activity.
The physicochemical changes provided additional information regarding MFC performance. Turbidity decreased under all four conditions, with the largest reduction in L4, from 249 to 57.1 NTU. The same condition also achieved the greatest COD removal. Although both parameters decreased during the experiment, a direct relationship between them cannot be established because turbidity is mainly associated with suspended particles, whereas COD includes both suspended and dissolved organic matter.
Color showed its largest reduction in L2, whereas only minor changes occurred in L1, L3, and L4. Electrical conductivity decreased in L3 but increased in the other conditions, particularly in L4, where it rose from 136.7 to 396 µS cm−1¹. This change indicates a modification in the concentration or composition of dissolved ionic species. However, because no detailed ionic characterization was performed, the compounds responsible for this increase could not be identified. Iron concentration also showed different responses, decreasing in L1 and L3 but increasing in L2 and L4; therefore, no common iron-removal trend was observed across the four configurations.
Using the COD measured at the beginning of each experiment, after addition of the biocatalyst, made it possible to calculate the removal achieved during the full seven-day operating period. This criterion was important because inoculation could modify the organic load in the anodic chamber. L3 showed an absolute COD reduction of 49.0 mg O2 −1⁻¹, corresponding to a removal efficiency of 29.8%, whereas L4 showed a reduction of 69.7 m2 −1₂ L⁻¹ and an efficiency of 43.4%. Reporting both the absolute decrease and the percentage removal allowed the changes to be interpreted in relation to the initial COD concentration of each experiment.
Regarding the energy response, L2 reached the highest maximum stored energy, 0.392 J, associated with the highest voltage peak. L4 reached a maximum stored energy of 0.313 J and maintained high voltages for a substantial portion of the experiment. The calculated energy represents the capacitor charge state at a specific voltage and does not correspond to the total energy generated over the seven-day period. The maximum values therefore enable comparison of specific storage states but do not quantify cumulative energy recovery.
When the evaluated indicators were considered together, L4 exhibited the greatest COD removal, a high electrical response, and the highest CH4 concentration. L2 reached the highest maximum voltage and stored energy values, although its electrical signal showed wider fluctuations, and its COD removal was lower than that of L4. L3 recorded the highest 2₂ concentration and a more uniform voltage increase, whereas L1 showed intermediate COD removal, voltage, and energy values. This comparison highlights the specific characteristics of each configuration based on the physicochemical, electrical, and gas-phase variables measured.
Future studies should include independent replicates of each experimental configuration and longer operating periods to evaluate the reproducibility and long-term stability of the MFC. Electrical characterization should also be extended to include current, power, current density, power density, internal resistance, and coulombic efficiency. In addition, calibrated measurements of gas flow and composition would allow production rates and gas yields to be calculated. Characterization of the microbial communities and electrode biofilms would help relate the microorganisms present to the observed electrical and gas-phase responses. For experiments involving S. acutus, monitoring irradiance, photoperiod, biomass growth, and dissolved oxygen would enable a more precise assessment of the contribution of the microalga.
5. Conclusions
The dual-chamber microbial fuel cell enabled domestic wastewater treatment to be combined with the generation of an electrical response using Scenedesmus acutus and a native microbial consortium as anodic biocatalysts. During operation, the system maintained relatively stable pH and temperature conditions, allowing continuous evaluation of its physicochemical, electrical, and gas-phase behavior.
The effect of temperature depended on the biocatalyst employed. In the experiments with S. acutus, increasing the temperature favored the maximum voltage and stored energy values, although it did not improve COD removal and was accompanied by greater variability in the electrical signal. In contrast, the native microbial consortium operated at 30 °C combined greater organic load reduction with a high electrical response, indicating more favorable performance under this condition.
The differences observed in the H2 and C4₄ concentrations suggest that organic matter transformation may have involved fermentative and methanogenic processes alongside electrogenic activity. However, because the measurements corresponded to concentrations in the anodic headspace, gas production could not be quantified, nor could the specific contribution of each metabolic pathway be established.
Overall, the native microbial consortium operated at 30 °C exhibited the most favorable performance for organic matter removal while maintaining a high electrical response. Conversely, S. acutus at 30 °C achieved the highest maximum electrical response. These findings indicate that the selection of the biocatalyst and operating temperature should be based on the primary objective of the system, whether to prioritize wastewater treatment, enhance the electrical response, or achieve a balance between both processes.
These findings provide a basis for further optimization of the proposed MFC configuration. Future studies should extend the operating period, incorporate independent experimental replicates, and complement the electrical characterization by determining current, power, power density, internal resistance, and coulombic efficiency. In addition, calibrated gas quantification and characterization of microbial communities and electrode biofilms would provide a more detailed understanding of the processes underlying organic matter removal and electricity generation.
Author Contributions
Conceptualization, S.O.C., Y.R.P., J.C.G., C.M.D.A. and A.L.R.P.; methodology, S.O.C., Y.R.P., C.M.D.A., J.C.G. and A.L.R.P.; software and instrumentation, Y.R.P.; validation, S.O.C., Y.R.P. and J.C.G.; formal analysis, S.O.C., Y.R.P., G.A.Q.N., J.M.G.M and J.C.G.; investigation, S.O.C. and Y.R.P.; resources, C.M.D.A. and A.L.R.P.; data curation, S.O.C. and Y.R.P.; writing—original draft preparation, S.O.C.; writing—review and editing, J.C.G., G.A.Q.N., J.M.G.M., C.M.D.A. and A.L.R.P.; visualization, S.O.C. and Y.R.P.; supervision, J.C.G., C.M.D.A. and A.L.R.P.; project administration, C.M.D.A.; funding acquisition, S.O.C., J.M.G.M., G.A.Q.N., Y.R.P. and C.M.D.A. All authors have read and agreed to the published version of the manuscript.
Funding
This research was supported by the University of Pamplona through internal research funding under the project “Evaluation of the performance of a microbial fuel cell for the treatment of domestic wastewater and the generation of electrical energy at the laboratory level” (2023–2024).
Institutional Review Board Statement
Not applicable. The study did not involve humans or animals.
Informed Consent Statement
Not applicable.
Data Availability Statement
The raw data supporting the conclusions of this article will be made available by the authors on request.
Acknowledgments
The authors used OpenAI only for language editing and to improve the clarity and overall quality of the manuscript. OpenAI was not used to generate scientific data, conduct the analysis, design the study, or interpret the results. All scientific content, interpretations, and conclusions remain the sole responsibility of the authors.
Conflicts of Interest
The authors declare no conflicts of interest.
Abbreviations
The following abbreviations are used in this manuscript:
| MFC | Microbial fuel cell |
| COD | Chemical oxygen demand |
| PID | Proportional-integral-derivative |
| MQTT | Message Queuing Telemetry Transport |
| NTU | Nephelometric turbidity units |
| SD | Standard deviation |
References
- Obileke, K.; Onyeaka, H.; Meyer, E. L.; Nwokolo, N. Microbial fuel cells, a renewable energy technology for bio-electricity generation: A mini-review. Electrochem. Commun. 2021, 125, 107003. [Google Scholar] [CrossRef]
- Wang, J.; Ren, K.; Zhu, Y.; Huang, J.; Liu, S. A review of recent advances in microbial fuel cells: Preparation, operation, and application. BioTech 2022, 11(4), 44. [Google Scholar] [CrossRef] [PubMed]
- Hidayat, A. R. P., Widyanto, A. R., Asranudin, A., Ediati, R., Sulistiono, D. O., Putro, H. S., ... & Caralin, I. S. Recent development of double chamber microbial fuel cell for hexavalent chromium waste removal. J. Environ. Chem. Eng. 2022, 10(3), 107505. [CrossRef]
- Zhu, H.; Niu, T.; Shutes, B.; Wang, X.; He, C.; Hou, S. Integration of MFC reduces CH4, N2O and NH3 emissions in batch-fed wetland systems. Water Res. 2022, 226, 119226. [Google Scholar] [CrossRef] [PubMed]
- Ida, T. K.; Mandal, B. Microbial fuel cell design, application and performance: A review. Mater. Today Proc. 2023, 76, 88–94. [Google Scholar] [CrossRef]
- Zafar, H.; Ishaq, S.; Peleato, N.; Roberts, D. Meta-analysis of operational performance and response metrics of microbial fuel cells (MFCs) fed with complex food waste. J. Environ. Manag. 2022, 315, 115152. [Google Scholar] [CrossRef]
- Li, C., Liu, Y., Luo, M., Cao, J., Fang, F., Feng, Q., ... & Wang, C. Enhancing simultaneous electrosynthesis of CO2 and nitrogen removal in microbial fuel cell (MFC) cathode compartment by adding Fe–C/biochar compound substrates. J. Power Sources 2023, 560, 232707. [CrossRef]
- Singh, S.; Pandey, K.; Verma, N. Degradation of phenolic compounds in wastewater using a conical-shaped packed-bed microbial fuel cell in continuous flow with recycling. J. Mater. Chem. A 2023, 11(8), 3942–3948. [Google Scholar] [CrossRef]
- Chakraborty, I.; Sathe, S. M.; Khuman, C. N.; Ghangrekar, M. M. Bioelectrochemically powered remediation of xenobiotic compounds and heavy metal toxicity using microbial fuel cell and microbial electrolysis cell. Mater. Sci. Energy Technol. 2020, 3, 104–115. [Google Scholar] [CrossRef]
- Thapa, B. S., Pandit, S., Patwardhan, S. B., Tripathi, S., Mathuriya, A. S., Gupta, P. K., ... & Tusher, T. R. Application of microbial fuel cell (MFC) for pharmaceutical wastewater treatment: An overview and future perspectives. Sustainability 2022, 14(14), 8379. [CrossRef]
- Rashid, T.; Sher, F.; Hazafa, A.; Hashmi, R. Q.; Zafar, A.; Rasheed, T.; Hussain, S. Design and feasibility study of novel paraboloid graphite based microbial fuel cell for bioelectrogenesis and pharmaceutical wastewater treatment. J. Environ. Chem. Eng. 2021, 9(1), 104502. [Google Scholar] [CrossRef]
- Jadhav, D. A.; Das, I.; Ghangrekar, M. M.; Pant, D. Moving towards practical applications of microbial fuel cells for sanitation and resource recovery. J. Water Process Eng. 2020, 38, 101566. [Google Scholar] [CrossRef]
- Wang, H.; Qi, X.; Chen, S.; Wang, X. The efficient treatment of breeding wastewater by an electroactive microbial community in microbial fuel cell. J. Environ. Chem. Eng. 2022, 10(2), 107187. [Google Scholar] [CrossRef]
- Andriukonis, E.; Celiesiute-Germaniene, R.; Ramanavicius, S.; Viter, R.; Ramanavicius, A. From microorganism-based amperometric biosensors towards microbial fuel cells. Sensors 2021, 21(7), 2442. [Google Scholar] [CrossRef] [PubMed]
- Garbini, G. L.; Barra Caracciolo, A.; Grenni, P. Electroactive bacteria in natural ecosystems and their applications in microbial fuel cells for bioremediation: A review. Microorganisms 2023, 11(5), 1255. [Google Scholar] [CrossRef] [PubMed]
- Vidal Morales, L. V.; Zambrano Barón, L. D. Performance of a microbial fuel cell system for the treatment of and bioelectricity generation from tannery industry effluents in the municipality of Villapinzón, Cundinamarca [In Spanish; 2021. [Google Scholar]
- Angioni, S.; Millia, L.; Bruni, G.; Tealdi, C.; Mustarelli, P.; Quartarone, E. Improving the performances of Nafion™-based membranes for microbial fuel cells with silica-based, organically-functionalized mesostructured fillers. J. Power Sources 2016, 334, 120–127. [Google Scholar] [CrossRef]
- Freguia, S.; Rabaey, K.; Yuan, Z.; Keller, J. Syntrophic Processes Drive the Conversion of Glucose in Microbial Fuel Cell Anodes. Environ. Sci. Technol. 2008, 42, 7937–7943. [Google Scholar] [CrossRef] [PubMed]
- Jung, S.; Regan, J.M. Influence of External Resistance on Electrogenesis, Methanogenesis, and Anode Prokaryotic Communities in Microbial Fuel Cells. Appl. Environ. Microbiol. 2011, 77, 564–571. [Google Scholar] [CrossRef] [PubMed]
- Angioni, S.; Millia, L.; Mustarelli, P.; Doria, E.; Temporiti, M.E.E.; Mannucci, B.; Corana, F.; Quartarone, E. Photosynthetic Microbial Fuel Cell with Polybenzimidazole Membrane: Synergy between Bacteria and Algae for Wastewater Removal and Biorefinery. Heliyon 2018, 4, e00560. [Google Scholar] [CrossRef] [PubMed]
Figure 1.
Methodological overview of the evaluation of the dual-chamber MFC using real wastewater, S. acutus, and an indigenous microbial consortium.
Figure 1.
Methodological overview of the evaluation of the dual-chamber MFC using real wastewater, S. acutus, and an indigenous microbial consortium.
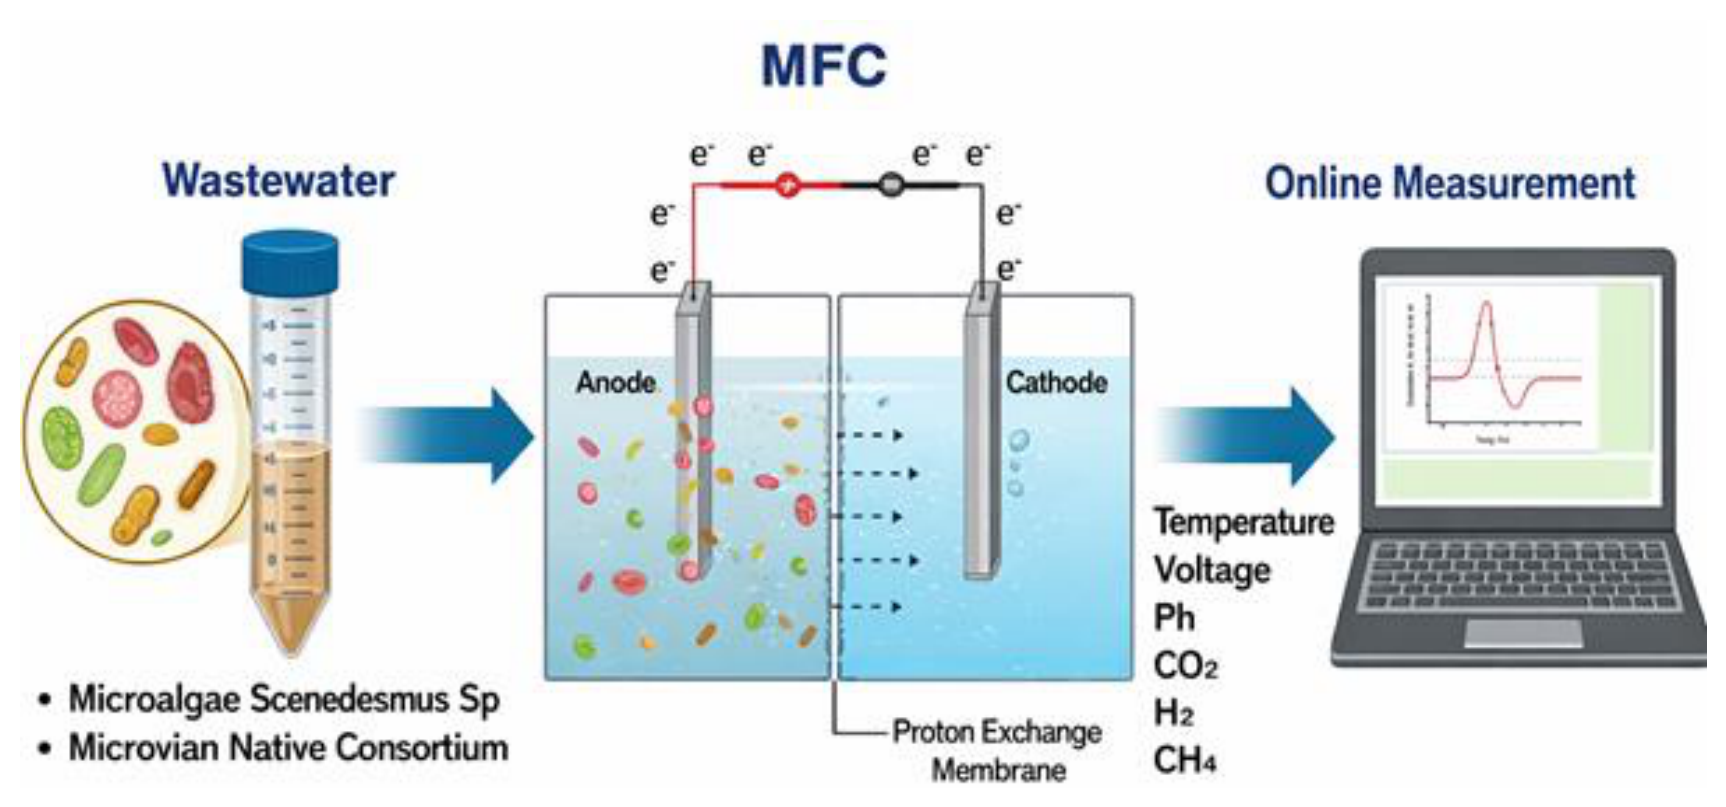
Figure 3.
Schematic and photographic view of the dual-chamber MFC prototype, including the control panel, anodic chamber, Nafion® 117 membrane, cathodic chamber, carbon electrodes, gas headspace, and external circuit.
Figure 3.
Schematic and photographic view of the dual-chamber MFC prototype, including the control panel, anodic chamber, Nafion® 117 membrane, cathodic chamber, carbon electrodes, gas headspace, and external circuit.
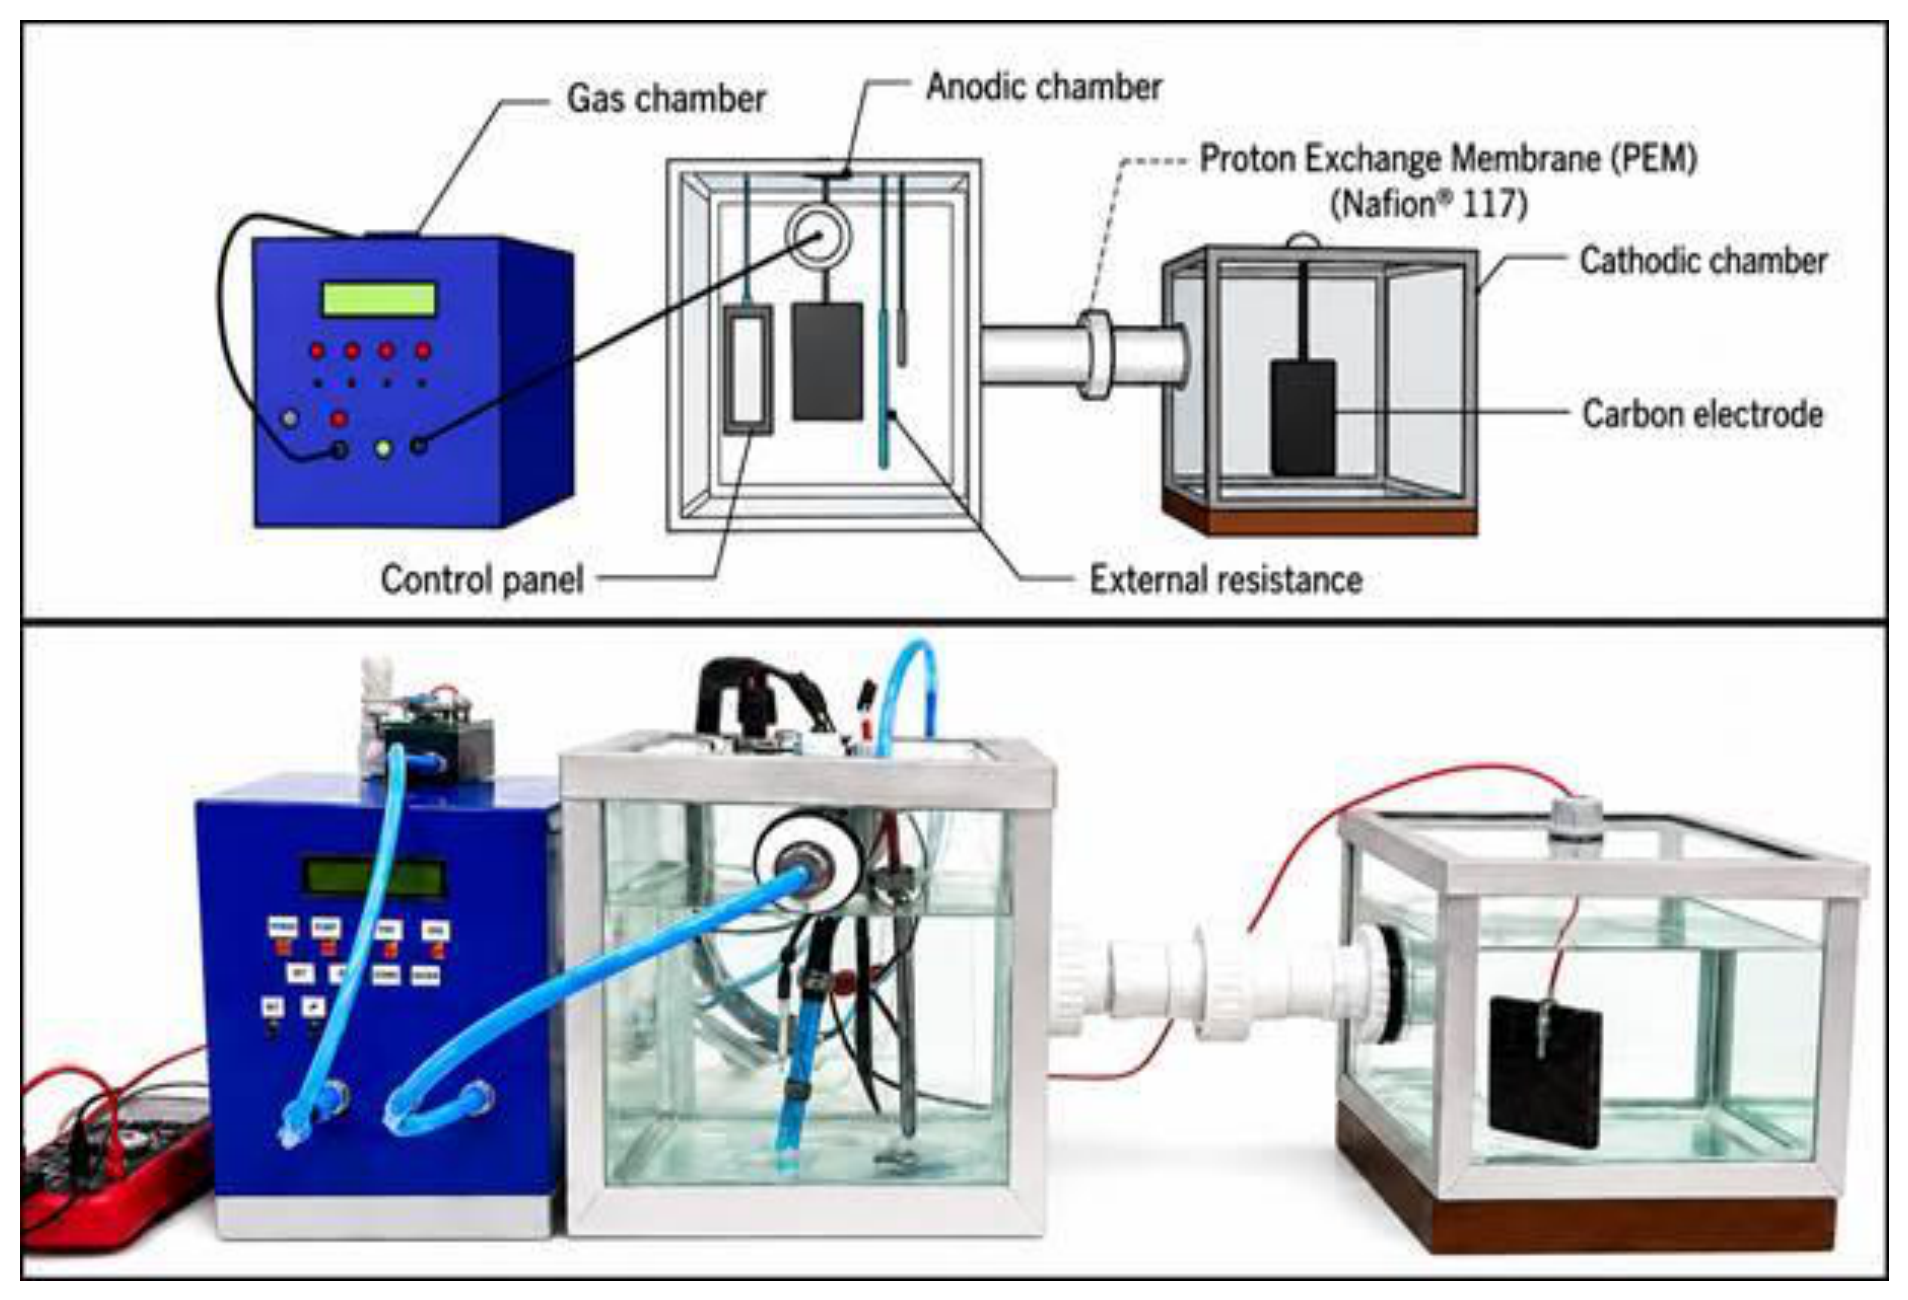
Figure 4.
Evolution of temperature and pH during the four seven-day microbial fuel cell experiments: (a) temperature and (b) pH.
Figure 4.
Evolution of temperature and pH during the four seven-day microbial fuel cell experiments: (a) temperature and (b) pH.
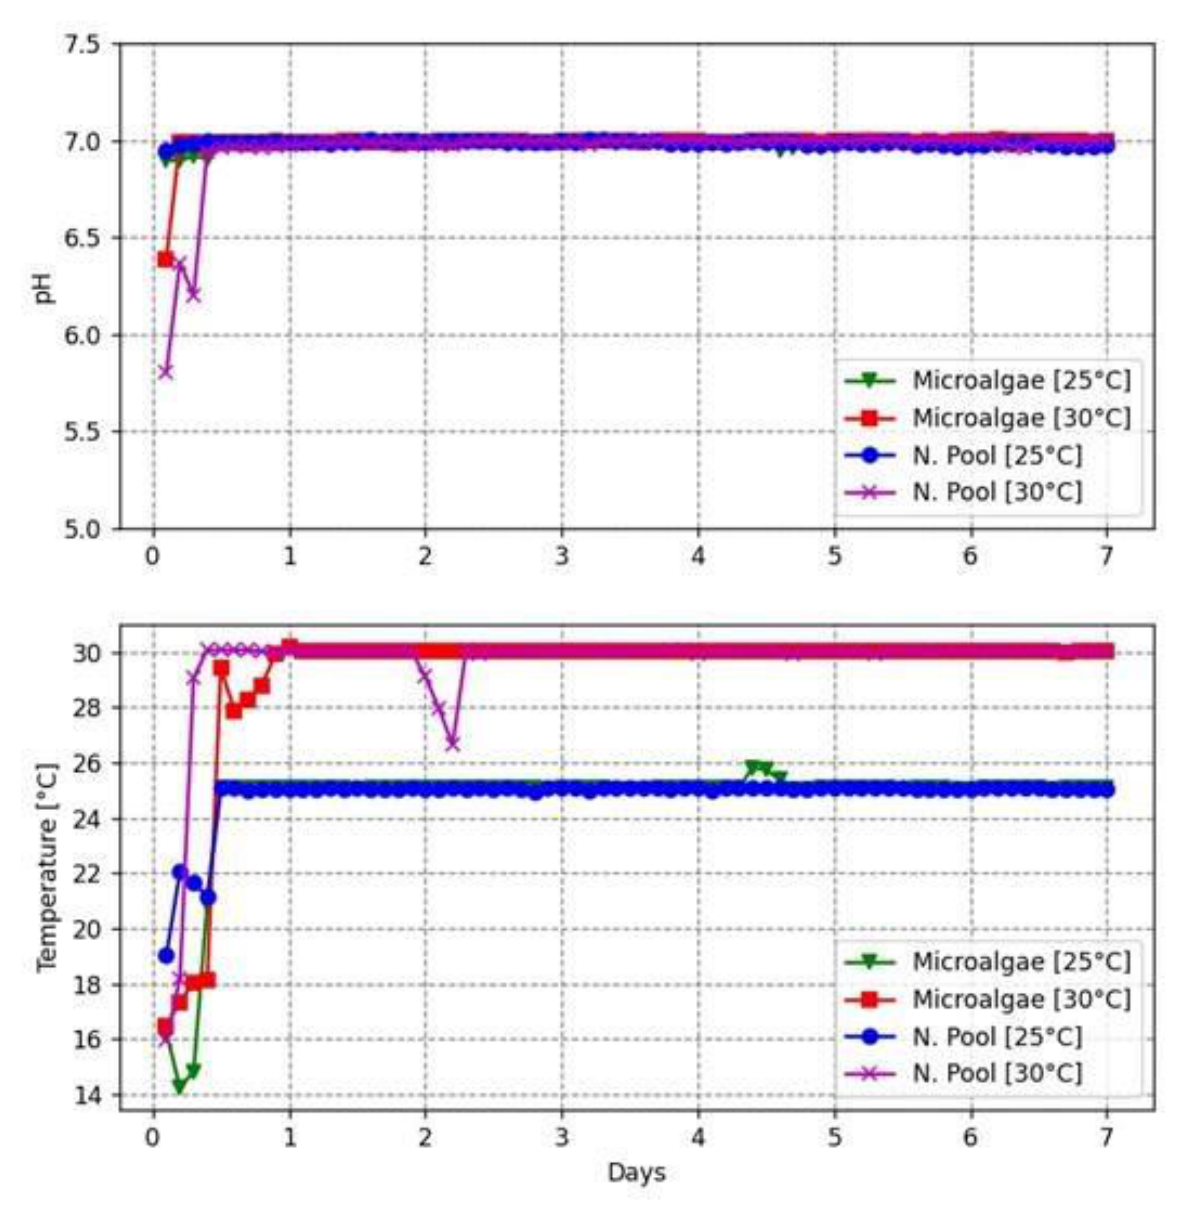
Figure 5.
Evolution of voltage during the four seven-day microbial fuel cell experiments.
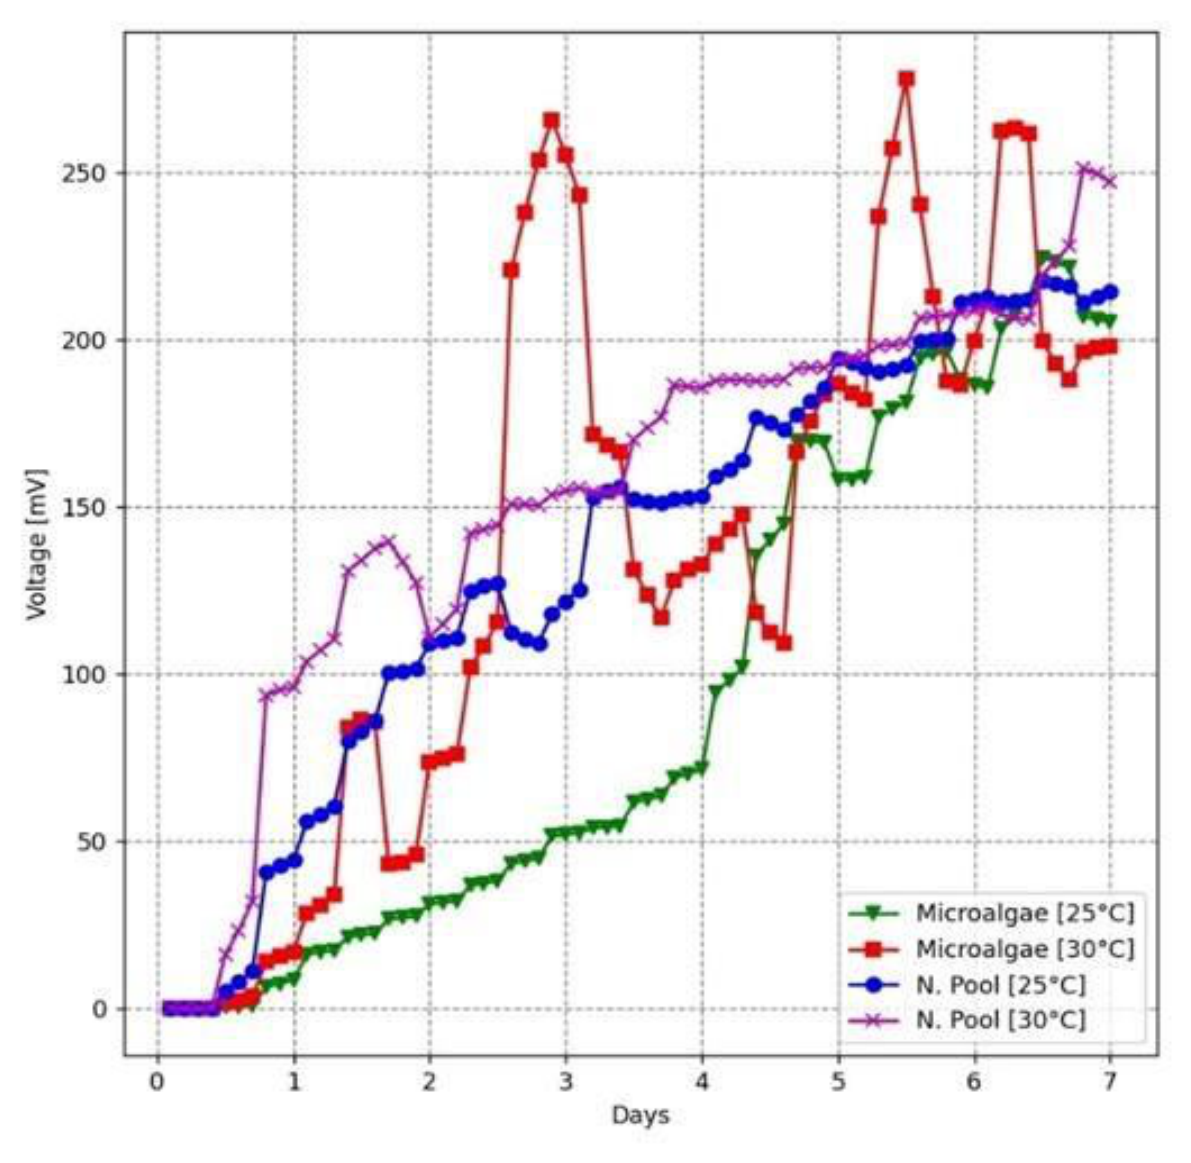
Figure 6.
Variation in gas concentrations recorded in the anodic headspace during the four seven-day microbial fuel cell experiments: (a) CH4, (b) 2₂, and (c) 2O₂.
Figure 6.
Variation in gas concentrations recorded in the anodic headspace during the four seven-day microbial fuel cell experiments: (a) CH4, (b) 2₂, and (c) 2O₂.
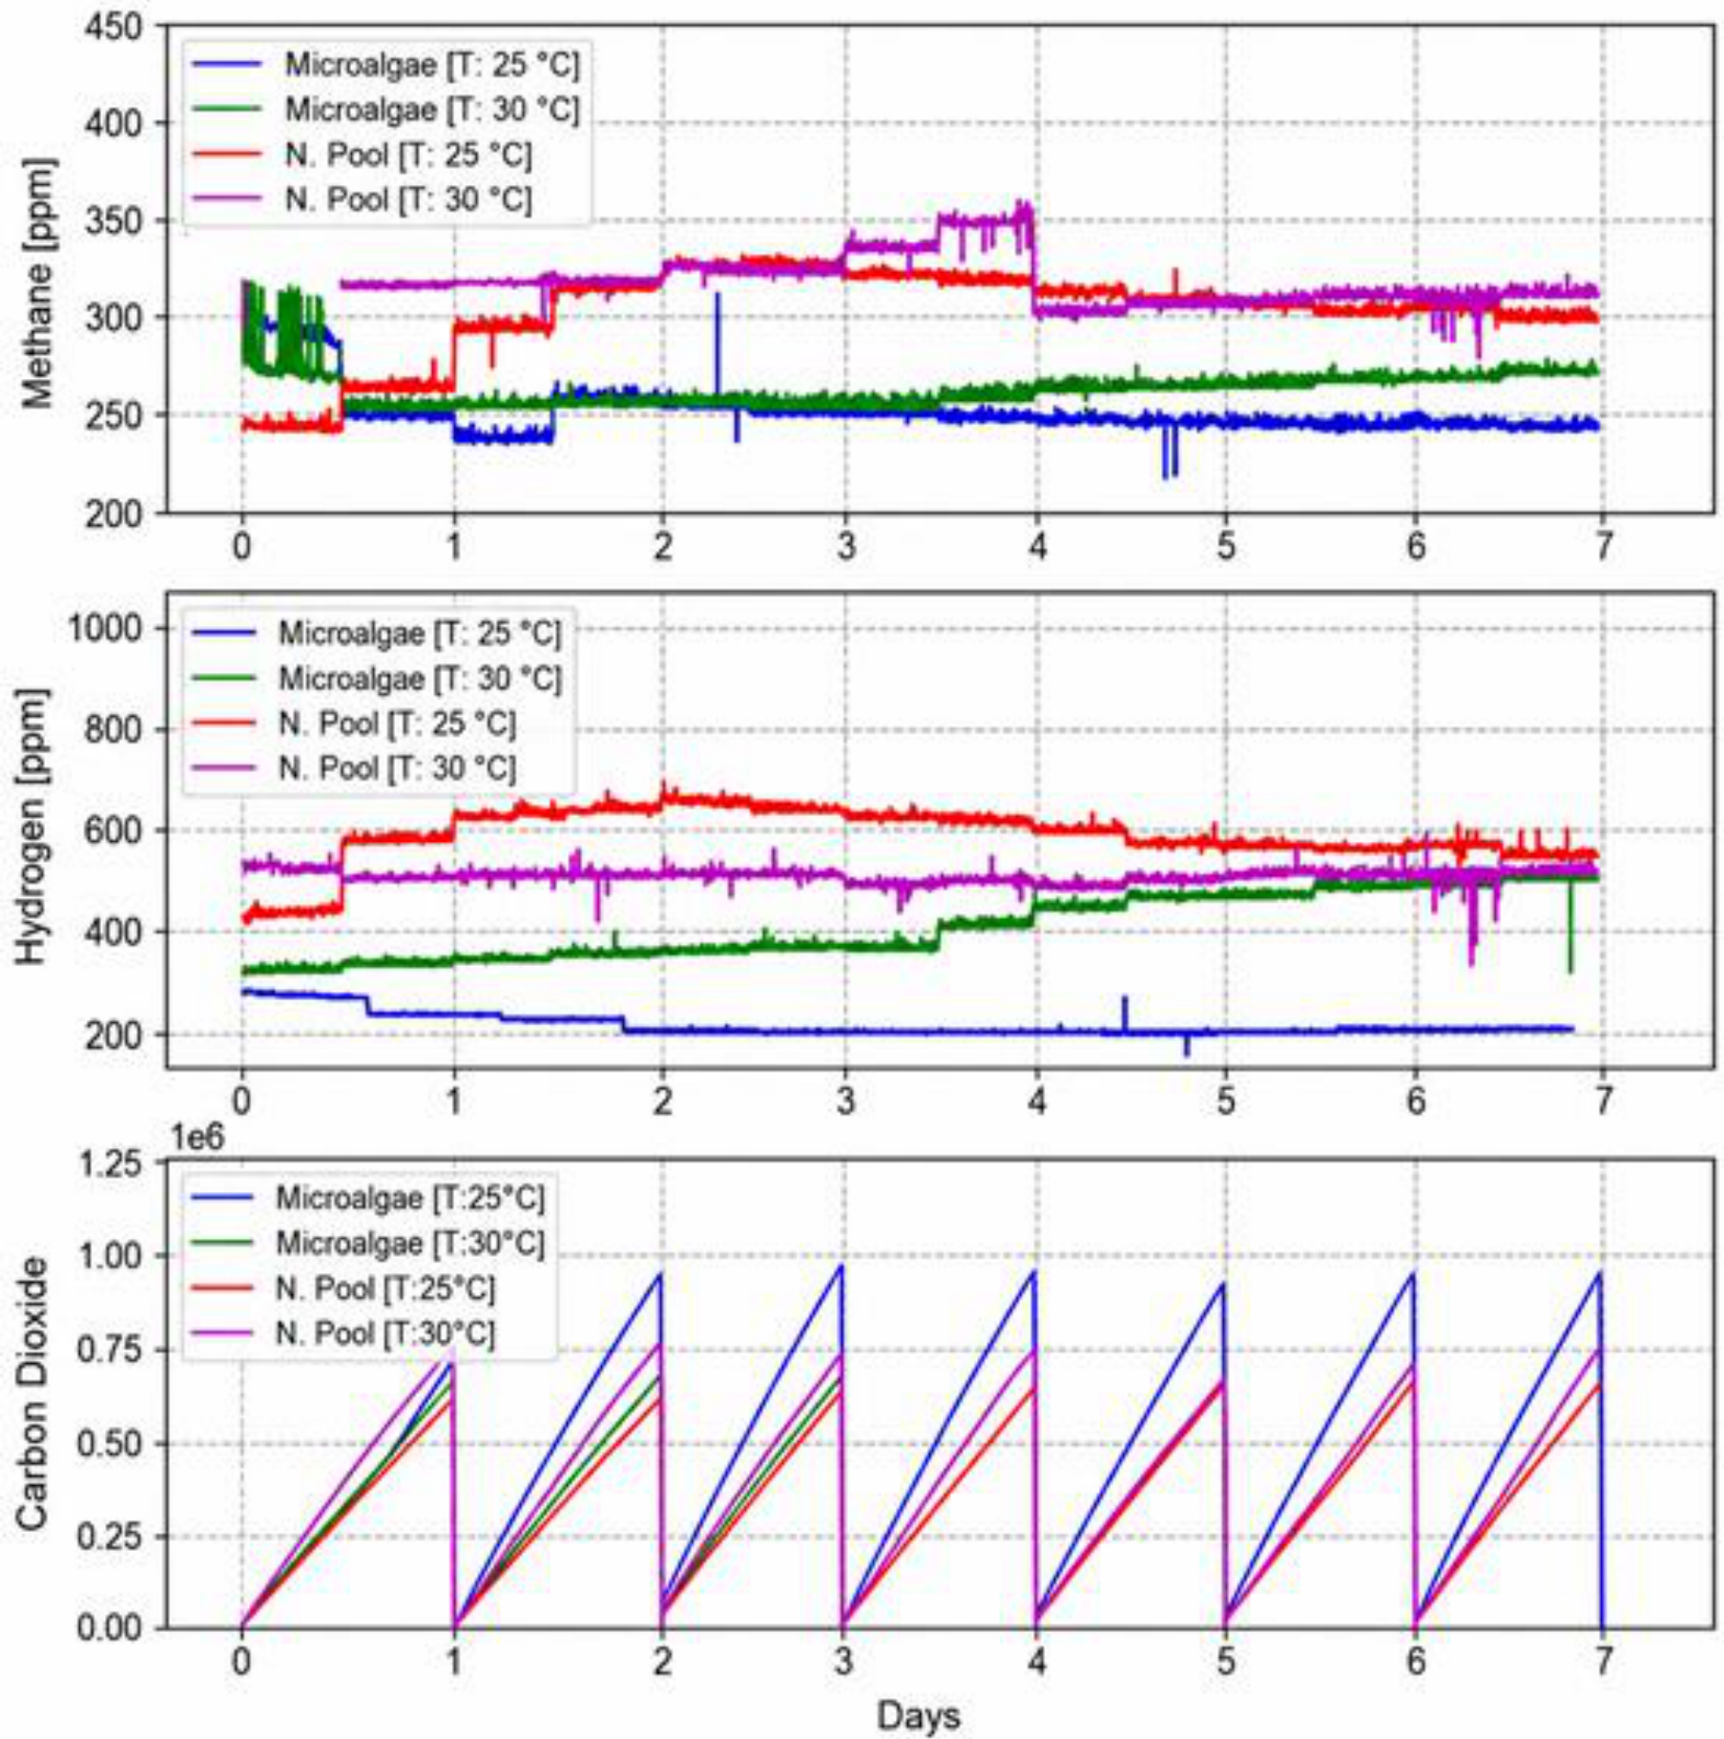
Figure 7.
Normalized comparison of maximum voltage, COD removal efficiency, and maximum H2, C4₄, and 2O₂ concentrations recorded for S. acutus and the native microbial consortium at (a) 25 °C and (b) 30 °C.
Figure 7.
Normalized comparison of maximum voltage, COD removal efficiency, and maximum H2, C4₄, and 2O₂ concentrations recorded for S. acutus and the native microbial consortium at (a) 25 °C and (b) 30 °C.
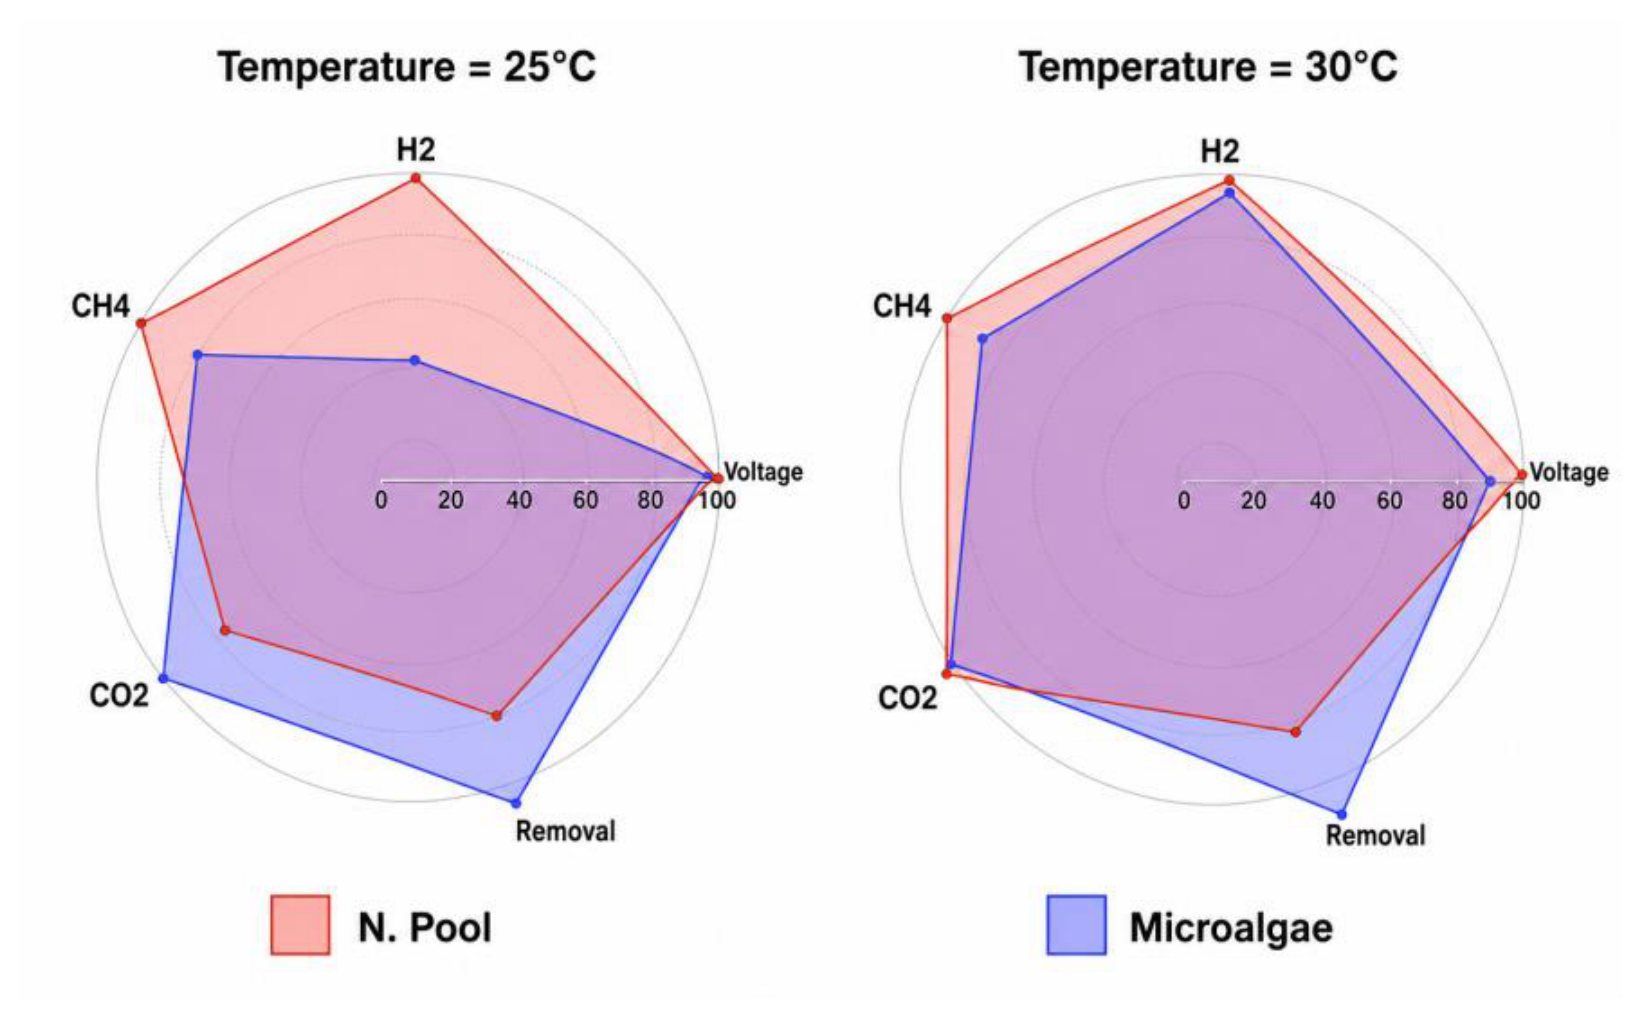

Table 1.
Analytical methods used for wastewater characterization.
| Parameter | Unit | Analytical method |
|---|---|---|
| pH | pH units | SM 4500-H+, electrometric |
| Apparent color | Pt-Co units | SM 2120 C, spectrophotometric |
| Electrical conductivity | µS cm−1¹ | SM 2510 B, electrometric |
| Turbidity | NTU | SM 2130 B, nephelometric |
| Phosphates | mg L−1¹ 43−O₄³⁻ | SM 4500-P, vanadomolybdate colorimetric |
| Nitrites | mg L−1¹ N-2−O₂⁻ | SM 4500-NO2−⁻ B, colorimetric |
| Sulfates | mg L−1¹ 42−O₄²⁻ | SM 4500-SO42−²⁻ E, turbidimetric |
| Hardness | mg L−1¹ Ca3O₃ | SM 2340 C, EDTA titration |
| Alkalinity | mg L−1¹ Ca3O₃ | SM 2320 B, volumetric |
| Iron | mg L−1¹ Fe | SM 3500-Fe B, phenanthroline colorimetric |
Table 2.
Experimental configurations evaluated in the MFC.
| Assay | biocatalyst type | Temperature () |
|---|---|---|
| L1 | S. acutus | 25 |
| L2 | S. acutus | 30 |
| L3 | Native microbial consortium | 25 |
| L4 | Native microbial consortium | 30 |
Table 3.
Initial and final physicochemical characteristics of wastewater in the four assays.
| L1 | L2 | L3 | L4 | ||||||
|---|---|---|---|---|---|---|---|---|---|
| Parameter | Unit | Initial | Final | Initial | Final | Initial | Final | Initial | Final |
| pH | pH units | 7.06 | 8.12 | 8.87 | 7.28 | 6.90 | 7.05 | 7.05 | 7.35 |
| Color | Pt-Co | 117 | 123 | 483 | 143 | 322 | 320 | 320 | 320 |
| Conductivity | µS cm−1¹ | 233 | 240 | 190.2 | 251 | 212 | 136.7 | 136.7 | 396 |
| Turbidity | NTU | 108 | 92.8 | 98 | 48.2 | 276 | 249 | 249 | 57.1 |
| Phosphates | mg L−1¹ 43−O₄³⁻ | 0.03 | 0.08 | 0.04 | 0.21 | 0.06 | 0.06 | 0.06 | 0.06 |
| Nitrites | mg L−1¹ N-2−O₂⁻ | 0.014 | 0.508 | 0.098 | 0.111 | 0.037 | 0.016 | 0.016 | 0.009 |
| Sulfates | mg L−1¹ 42−O₄²⁻ | 13 | 11 | 9 | 20 | 23 | 12 | 12 | 22 |
| Hardness | mg L−1¹ Ca3O₃ | 48 | 48 | 80 | 44 | 52 | 44 | 44 | 48 |
| Alkalinity | mg L−1¹ Ca3O₃ | 86 | 90 | 96 | 96 | 94 | 72 | 72 | 144 |
| Iron | mg L−1¹ Fe | 0.92 | 0.52 | 0.21 | 0.46 | 0.40 | 0.17 | 0.17 | 0.37 |
| COD | mg O2 −1⁻¹ | 126 | 90 | 89 | 32 | 68 | 116 | 116 | 78 |
Note: L1 = S. acutus at 25 °C; L2 = S. acutus at 30 °C; L3 = native microbial consortium at 25 °C; L4 = native microbial consortium at 30 °C.
Table 4.
Maximum voltage and maximum stored energy under the four experimental conditions.
| Condition | Biocatalyst | Temperature (°C) | Approximate Maximum Voltage (mV) | Approximate Maximum Stored Energy (J) | Approximate Maximum Stored Energy (mW·s) |
|---|---|---|---|---|---|
| L1 | S. acutus | 25 | 225 | 0.253 | 253 |
| L2 | S. acutus | 30 | 280 | 0.392 | 392 |
| L3 | Native microbial consortium | 25 | 220 | 0.242 | 242 |
| L4 | Native microbial consortium | 30 | 250 | 0.313 | 313 |
Table 5.
COD concentrations and removal efficiencies under the four experimental conditions.
| Condition | Biocatalyst | Temperature (°C) | Initial COD, mean ± SD (mg O2 −1⁻¹) | Final COD, mean ± SD (mg O2 −1⁻¹) | COD removal (%) |
|---|---|---|---|---|---|
| L1 | S. acutus | 25 | 98.0 ± 1.8 | 65.0 ± 2.0 | 33.7 |
| L2 | S. acutus | 30 | 81.3 ± 1.2 | 56.7 ± 2.4 | 30.3 |
| L3 | Native microbial consortium | 25 | 164.7 ±1.6 | 115.7 ± 2.2 | 29.8 |
| L4 | Native microbial consortium | 30 | 160.7 ± 2.0 | 91.0 ± 1.5 | 43.4 |
Disclaimer/Publisher’s Note: The statements, opinions and data contained in all publications are solely those of the individual author(s) and contributor(s) and not of MDPI and/or the editor(s). MDPI and/or the editor(s) disclaim responsibility for any injury to people or property resulting from any ideas, methods, instructions or products referred to in the content. |
© 2026 by the authors. Licensee MDPI, Basel, Switzerland. This article is an open access article distributed under the terms and conditions of the Creative Commons Attribution (CC BY) license.
Copyright: This open access article is published under a Creative Commons CC BY 4.0 license, which permit the free download, distribution, and reuse, provided that the author and preprint are cited in any reuse.