

Submitted:
24 July 2026
Posted:
27 July 2026
You are already at the latest version
Abstract
Background/Objectives: Patients with persistent postural perceptual dizziness (PPPD) have a balance discrepancy between their perceived and actual body movements. Quantifying this discrepancy would enable effective treatment of PPPD aimed at reducing perceived and actual body sway, and monitoring treatment improvement. Methods: 14 PPPD patients and 12 age-matched (age range 29 to 67) healthy controls (HCs) participated in this study. A SwayStarTM system measured, at lumbar 3, trunk pitch and roll sway, during 14 stance and gait tasks. For 3 stance tasks and 2 gait tasks subjects were asked to replicate the peak-to-peak roll and pitch trunk sway that they thought had occurred during the previous trial. The resulting amplitudes of peak-to-peak trunk sway were used to represent “measured” and “perceived” sway, respectively. To help improve balance control, PPPD patients received vibro-tactile balance-feedback of trunk sway (VT-fb) training 2 times a week for 2 weeks. Results: Linear regression slopes between mean peak-to-peak measured and perceived sway amplitudes were approximately 0.55 for HCs and 0.15 for PPPD patients, and similar in the pitch and roll directions for both HC and PPPD subjects. However, the intercept values were significantly larger for pitch (5x) and roll (6.7x) for PPPD subjects compared to HCs. At onset of VT-fb training, most (14 out 20) sway variables of PPPD patients had mean “measured” and, more significantly, “perceived” amplitudes which were greater than those of HCs. After 2 weeks of VT-fb training, PPPD patients had decreased mean sway amplitudes only greater than those of HCs for only 7 out of 20 variables, again with greater significance for perceived variables. amplitudes decreased by 35%. Conclusions: Comparisons with pitch intercept values for the linear regression between measured and perceived trunk sway indicated that these intercepts provide both a marker for PPPD as well as a measure of its improvement with training. Further, these results indicate that measured and perceived trunk sway of PPPD patients during stance and gait is greater than HCs but can be reduced with VT-fb training. The greatest difference with respect to that of HCs occurs for pitch sway standing eyes closed on foam and walking tandem steps, suggesting that pitch measures from these tests may also serve as markers for PPPD. The relationship between measured and perceived sway is dominated by large pitch and roll offsets in PPPD patients.
Keywords:
persistent postural perceptual dizziness
; PPPD
; truncal sway
; vibro-tactile biofeedback training
; functional dizziness
1. Introduction
Persistent postural perceptual dizziness (PPPD) is a chronic functional vestibular disorder characterized by sensations of dizziness, non-spinning vertigo, and a perception of unsteadiness. The characteristics of PPPD have been described by an international expert committee [1]. According to this definition, to be diagnosed with PPPD, an individual must experience chronic dizziness and/or unsteadiness, persisting for over three months, occurring on at least 15 days per month, and be exacerbated by upright posture [1]. Staab et al. [1] recommended using the term PPPD to encompass various previous concepts of functional dizziness, such as phobic postural vertigo [2], visual vertigo [3], space-motion discomfort [4], and chronic subjective dizziness [5]. The trigger for PPPD is typically an acute peripheral vestibular disorder of semi-circular canal afferent function caused by vestibular neuritis [6] or BPPV, as well as central vestibular disorders with vestibular migraine being the most common neurologically [7]. In benign paroxysmal positional vertigo (BPPV), the peripheral dysfunction is typically caused by conglomerates of freely floating otoconia within a semicircular canal that induce abnormal endolymph flow and deflect the cupula during head movements [6]. Anxiety and other traumatic life events can also initiate PPPD [1], indicating that the disorder can also occur without a somatic trigger [7]. PPPD thus represents a failure to re-adapt to a perceived postural threat that no longer exists, hence why this becomes maladaptive or contextually inappropriate. Normally, alternative neuro-physiological sensory systems, such as those driven by proprioceptive and visual reflexes, compensate for the vestibular loss until normal function is restored [8,9]. In PPPD however, this compensation is typically insufficient, resulting in a persistent, uncompensated state that is usually provoked by upright posture, complex visual stimuli, and walking [6].
PPPD is among the most common type of dizziness seen across outpatient neurological settings as well as in general practice [10,11,12]. Nonetheless, PPPD is a relatively new disease classification concept [1] and remains under-recognised. Over the past decade, there has been significant progress in understanding the symptoms, physiological mechanisms, and treatment approaches for PPPD [13]. Influential studies, such as those by Dieterich and Staab [14], have explored the impact of PPPD on patients with and without sensory deficits, and have shown that both groups can potentially have impaired balance control.
Defining PPPD as suggested by Staab et al. [1], clarifies the clinical boundaries of the disease. However, the clinical-neurophysiological presentation of PPPD patients can be heterogeneous. For example, approximately, 50% of PPPD patients exhibit impaired postural control of balance when assessed using body-mounted gyroscopes [15]. These patients often display different functional patterns of balance control [16,17,18] alongside differences in perceived balance control and measured body sway [14,18]. Given the heterogeneous nature of PPPD, the question arises which biomarkers are most effective in identifying PPPD [18] and which treatment approach is most effective in reducing dizziness and the accompanying deficits in balance control [19].
Recently, San Pedro Murillo et al [18], provided evidence that the perceived amplitude of postural sway, being larger than that which was actually measured, might be a marker for PPPD. That is, they noted that PPPD patients had much greater perceived sway deviations (as measured using centre of foot pressure recordings) during 2-legged eyes closed (s2ec) stance on a firm surface than was actually the case for the measured values. Rather, when asked to reproduce their actual sway deviations during the s2ec test but with eyes open, the sway was up to 8 times larger than the actual measured sway deviations [18]. By providing patients with a training environment, involving showing the patients videos of their observed sway, the patients learned to reduce their perceived sway to within the range of normal measured values. This observation indicated that PPPD patients could be trained to reduce their perceived sway, and compliments recent work [19] showing that balance training with vibro-tactile feedback of trunk sway improves balance control for stance and gait tasks of PPPD subjects. The question that arises with these studies is whether it is the measured or perceived sway, or both, that PPPD patients are reducing with training over time. If the latter, then focusing on perceived and measured trunk sway and would provide a new focus for improving balance control in PPPD patients. That is, once dizziness and its impact on daily living is reduced by treatment, it becomes important for future optimization studies to determine whether the treatment improved actual or perceived body sway, or both, similarly during balance tasks [19,20] and whether these improvements are similar across both stance and gait tasks, and across body sway directions, pitch and roll. The work of San Pedro Murillo et al [18] indicates that perceived sway of PPPD patients is greater in the pitch than in the roll direction when standing on a firm surface with eyes closed. In contrast, McCaslin and colleagues [20] found that the differences with respect to healthy controls were greater in the roll direction. As the differences of perceived sway with respect to HC subjects were measured under different stance conditions in these 2 studies, it follows that there is also a need to standardize stance test conditions when the perceived sway is measured. An attempt at additional standardization could be made by incorporating results from gait tests into the data analysis with stance tests in order to have a wider range of perceived versus measured sway amplitudes thereby presumably improving the significance of regressions between these variables.
2. Materials and Methods
2.1. Setting
This study was carried out at the Department of ORL, University Hospital Basel, Switzerland. We recorded the data from PPPD patients who were provided vibro-tactile balance-feedback training treatment for 2 weeks as described in detail below. For this current, retrospective study, PPPD patients were included whether or not they had, pre-VT-fb therapy, pathological balance control during stance and gait tests, in comparison to the balance control of the healthy age-matched normal subjects [21,22]. Three PPPD patients had normal balance control as defined by our Balance Control Index (see Equation 1 and Table 1, below). The comparison group was a group of age-matched subjects with normal balance control (HCs). Patients and controls provided informed written consent to use their data for scientific purposes. This study was conducted in accordance with the Declaration of Helsinki, and the protocol was approved on 25.02.2023 by the local ethical committee responsible for the University Hospital Basel: Ethics Committee for North–Central Switzerland which has the German abbreviation, (EKNZ) (Project identification code 2014-026, Amendment 5).
This report is based on data collected from 14 patients and 12 healthy controls (HC) between 15th May 2023 and 1st November 2025. The sample size of no less than 10 subjects per group was based on a power analysis of 80%. This analysis revealed that trends in improvement of the balance control of the patients with VT-fb training, as noted in our previous publication [19], would reach statistical significance (p ≤ 0.05) with 10 subjects.
2.2. Study Groups of Subjects
PPPD patients were recruited into our therapy program if they suffered from persistent dizziness for at least 3 months, and, over this period had to have at least 15 of 30 days, consecutively with dizziness present. Furthermore, their vestibular and neurology test results had to indicate that these satisfied the criteria for a central vestibular deficit in order to be excluded from this study as described below. As indicated in the table of demographic data (Table 1), the patients’ dizziness was either constantly present or episodic. All patients were examined clinically for vestibular and neurological deficits before testing with a battery of oculomotor (optokinetic nystagmus and smooth pursuit eye tracking) and vestibular tests (caloric canal paresis and rotating chair or video head impulse tests). These tests investigated whether a central or peripheral vestibular deficit was present or not [23]. Vibration sense in the feet was used to test for a lower-leg polyneuropathy among other tests [25]. Patients were excluded from the study if they fulfilled any of the following 7 exclusion criteria: (1) a central vestibular deficit in oculomotor tests, (2) a physical inability to participate in the physiotherapy exercises, (3) a visual deficit affecting balance control, (4) evidence of a medium to severe form of depression, (5) an indication of a lack of motivation or ability to cooperate with medical personnel (e.g., lack of sufficient German or English language skills), (6) severe comorbid psychiatric disorders (e.g., schizophrenia), and (7) an orthopaedic disorder that would have affected balance control. Most patients were transferred to our tertiary hospital from ORL (otorhinolaryngology); neurology; and psychiatric practices as well as by general practitioners in Basel and the surrounding area of North–West Switzerland.
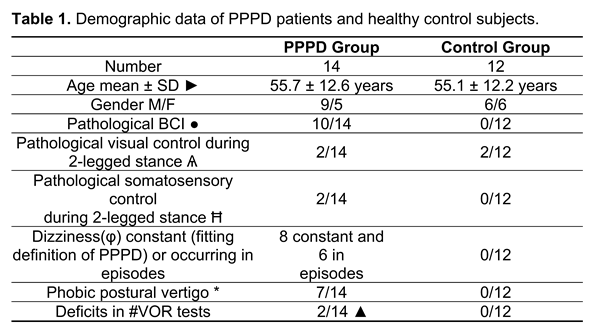
►—No 24. see Section 2.4 (Methods) below. PPPD (persistent postural-perceptual dizziness) — φ is defined according to the criteria of Staab et al. [1] and requires that dizziness be present for at least 15 of 30 consecutive days. Ѧ—Visual control ratio for 2-legged stance greater than normal [31]. Ħ—Somatosensory control ratio, lower than normal at onset and termination of VT-fb training for the same patient. #VOR stands for vestibular ocular reflex. To be defined as having a peripheral vestibular deficit (PVD), the patient had to have a caloric canal paresis value greater than 30%, or the lateral vHIT gain had to be less than 0.7. 2 PVD patients had a chronic uncompensated unilateral PVD. The VOR responses of the 2 uncompensated patients had gains which were lower than normal in both directions of yaw rotation. *—The presence of phobic postural vertigo is based on the criteria of Brandt et al. [2] supported by the findings of Querner et al. [16]. ▲—1 with additionally benign proximal positioning nystagmus.
2.3. Dizziness Handicap Inventory
The Dizziness Handicap Inventory (DHI) questionnaire, introduced by Jacobson and Newman [26], was used in order to score the subjective impression of the impact of dizziness on the subject’s daily life (one of our primary outcomes). Almost exclusively, we used a German translation of the DHI, which was validated by Volz-Sidiropoulou et al. [27]. These authors [26,27] set this impact as minor, medium, or major, based on whether the DHI score was below or above 30, or above 60, respectively. Depending on the language abilities of the patient, we also used the original English version [26], or an Italian version of the DHI [28]. The DHI has 25 questions, provides a global score, and captures 3 aspects of impairment: emotional, functional, and physical. Participants could choose to answer each of the 25 questions in 1 of 3 ways: yes (score 4), sometimes (score 2), or no (score 0). The maximum score is 100.
2.4. Balance Control Index (BCI)
We used the same techniques, described previously [21,22,24], to measure balance control during stance and gait tasks and to establish whether balance control was, as defined by the BCI, within normal HC limits or not. For this purpose, lower-trunk sway was recorded during stance and gait tasks with a fibre-optic gyroscope system (SwayStarTM Balance Int. Innovations, Switzerland) and compared with values from a reference data bank of over 500 normal subjects [21,22] provided by the SwayStar system software. The stance and gait tests were comprised of 14 tasks as follows: standing on 2 legs with eyes open and with eyes closed on a normal surface (tasks 1 and 2); standing on 1 leg with eyes open and with eyes closed on a normal surface (tasks 3 and 4); walking 8 tandem steps on a normal surface while looking at the feet (task 5); standing on a foam surface on 2 legs with eyes open and with eyes closed; (tasks 6 and 7); standing on a foam surface on 1 leg with eyes open (task 8); walking 8 tandem steps on a foam surface while looking at the feet (task 9); walking 3 m while rotating the head from side-to-side or walking 3 m while pitching the head by flexing and extending the neck, or only with eyes closed (tasks 10, 11 and 12); walking up and down a set of steps with 2 steps up and 2 steps down (task 13); and walking over 4 low barriers 24 cm in height and spaced 1 m apart (task 14).
For the two-legged stance tasks, participants were asked to stand still on a firm or foam surface in a normal, comfortable standing position, with the lateral borders of the feet hip-width apart, and arms hanging alongside the trunk. The foam surface was 10 cm high, 44 cm width and 204 cm long. Foam density was 25 kg/m3. For eyes-open stance tasks, patients were asked to focus on a black filled circle, 10 cm in diameter, placed at eye height, 5 m away. During one-legged tasks, patients could choose their better leg to stand on. Stabilizing their raised leg against the standing leg was not permitted. All walking tasks (with eyes closed, with the head rotating or pitching up and down, or walking over 4 low barriers) were measured over 3 m. During all tasks, patients were asked not to talk and a spotter stood next to the patient to aid them in case of a loss of balance control. For the assessment sequences, each task was performed once and only repeated once if a loss of balance occurred. During training, each task was repeated 4 times, independent of whether a loss of balance occurred during a trial. Recording was stopped if the patient lost balance control, for example, needing to take a step during 2-legged stance trials, or if the non-stance foot touched the floor during 1-legged stance trials. Otherwise, stance tasks were terminated at 20 s. Only data prior to any loss of balance was analysed. During the training and the assessment sequences, patients were requested to sway as little as possible. When the patients received VT-fb of trunk sway, they were requested to try to avoid activating the vibro-tactile transducers and to move trunk sway away the direction the indicated by the feedback if the VT-fb was activated.
The test results of each assessment sequence were combined to yield a Balance Control Index (BCI) which was then compared to age-matched normal reference values [21,22,24]. Measures used in the BCI calculation were the peak-to-peak range of angular displacement and velocity in the roll and pitch directions from each BCI assessment protocol (see below) as well as trial durations. The measures were combined into a single value, the Balance Control Index or BCI [24], as follows:
where s2 stands for standing on 2 legs, ec for eyes closed, f stands for foam, pv stands for peak-to-peak pitch velocity, tan8 for 8 tandem steps, ra for peak-to-peak roll angle, w3 for walking 3 m, dur for duration, and hp for head pitching. A patient was assumed to have an objectively determined balance deficit if the patient’s BCI was greater than the normal age-matched upper 95% value for the BCI. Normal BCI values for this comparison were based on previously recorded data from healthy control (HC) subjects (including data from Allum et al. [24] and Hegeman et al. [21]). We used, for this purpose, data from subjects with an age ±5 years of the patient’s age. Thus, for example, for a subject with an average mean age of PPPD patients with 54 years (see Table 1), data from 39 HCs would be used. As indicated in Equation (1), the BCI uses a combination of stance and gait trunk sway and trial duration measures. The BCI has been validated in a number of patient groups [22,29,30,31]. We also compared the BCI values of patients, who had received the intervention of this study, with those of normal HC subjects whose perceived sway was also recorded.
2.5. Visual and Somatosensory Contributions to Balance During Stance
To quantify the use of visual and somatosensory inputs by patients when controlling balance during 2-legged stance task, we computed the following control ratios (CR), respectively:
where v stands for peak-to-peak pitch velocity for the particular task, for example, s2eo as defined above. Assuming that vestibular signals provided the remaining sensory inputs, the vestibular CR can be defined as:
CRvest = 100 – CRvs – CRss
These ratios were compared with those of the age-matched controls of this study and investigated for changes during the 3 weeks of vibro-tactile balance training. The ratios were also compared, similarly as with the BCI, with data from Allum et al. [24] and Hegeman et al. [21]. The CRs were developed by Horlings et al [31] as an alternative, less variable, technique for quantifying changes in visual and somatosensory contributions to stance balance control as a result of vestibular sensory loss than the technique developed by Nashner and Peters for the EquitestTM system [32].
2.6. Measurement of Perceived Trunk Sway
In order to obtain a measure of the perceived trunk sway in the pitch and roll directions during a stance or gait task, we asked subjects, immediately after 5 specific tasks to lean, on command, the maximal amount they perceived themselves to have leant in the left-right and forwards-backwards directions during the recording of the previous task (see Figure 1). We carried out this perceived sway procedure for the following tasks: s2eo, s2eof, s2ecf, 8tan, w3hr where f stands for a foam support surface, 8tan stands for walking 8 tandem steps and w3hr stands for walking 3m while rotating the head from side-to-side. To have a consistent reproduction of perceived trunk sway, subjects were asked to reproduce the amplitudes of sway while standing on 2 legs, eyes open, on a firm support (s2eo) – see Figure 1 and Figure 2. The peak-to-peak trunk sway amplitude for the perceived tasks was compared to same peak-to-peak measure for the previous trial. Subjects were not informed in advance which tasks would be used for the perceived task. The choice of tasks to use to measure perceived sway was based on those often employed for identifying patients with structural and functional balance disorders [15,18,33].
2.7. Intervention: Balance Training with Vibro-Tactile Feedback of Trunk Sway
Vibro-tactile feedback (VT-fb) training of trunk sway was employed to provide participants additional feedback of trunk sway during the same measurement tasks used during testing. For this purpose, an add-on device of SwayStar called Balance FreedomTM was used. The device was approved for use on patients by the Swiss Agency for Therapeutic Products (Swissmedic Reference Number: 2008-MD-0011). This feedback system consists of 8 vibrators positioned at 45-degree intervals around a circular headband, thereby providing directionally-specific sway information (see Figure 1 in Allum et al., [29]). For example, if a sway threshold for forward pitch was exceeded, the vibrator in the middle of the forehead was activated to inform the participant that they should move in the opposite direction. Likewise, for backward trunk movements exceeding threshold, the vibrator at the back of the head came on. Left and right supra-threshold sway caused the vibrators over the left and right ears, respectively, to be activated. For sway in the diagonal directions, forward and left, for example, the vibrator between the forehead and left ear was activated when its threshold was exceeded. Thus, when the head was aligned in the straight-ahead position, the VT-fb provided by the vibrators was aligned with the axes of the SwayStar gyroscopes mounted at lumbar 3. The controller for the vibrators was connected directly with the SwayStarTM unit. Task-specific thresholds for trunk sway angles were set in the controller based on pitch and roll measures obtained from the first (baseline) assessment and adjusted based on the assessments after the first week of training. The threshold VT-fb amplitudes were calculated as 40% of the 90% ranges of pitch and roll sway angle. We used 40% of the 90% ranges based on a previous assessment of the average range of sway reductions achieved by healthy elderly and young normal subjects [24]. Thus, the threshold ranges were set at 80% (40% for each side) of the 90% ranges. To determine the 90% ranges, the total peak-to-peak range of each trunk sway variable was determined over the trial duration for a task, and this range was split into 40 bins. Samples were then sorted into the appropriate bins to build a histogram of the samples. The range from the lower 5% level to the upper 95% level of the histogram was used to define the 90% range.
2.8. Balance Feedback Training Protocol
In order to establish a baseline status prior to our feedback training, we first measured stance and gait balance control for patients and controls using the standard test battery of 14 stance and gait balance tasks developed by Allum and Adkin [22] and described in section 2.4 above. This provided an overall baseline measure, the BCI, using measured values from this test battery (see equation 1). Included in this baseline status was the measurement of perceived sway (see section 2.6). A subset of the test battery, 11 of the 14 tasks (no 1-legged stance tasks), were trained twice a week for 2 weeks, with each task repeated 3 times. The VT thresholds were reset after 1 week using a repeated measurement of the standard test battery during which perceived sway was also measured as described in section 2.6 above. At the end of the second week, we retested balance control with the standard test battery, and measured perceived sway, in order to have a comparison BCI and perceived sway values prior to, during, and at the end of feedback training.
3. Results
3.1. Comparisons Between Perceived and Measured Sway Amplitudes
Figure 1 provides examples of measured and perceived trunk sway amplitudes of a typical PPPD patient and of a typical healthy control (HC) subject for the task of standing, on 2 legs, eyes closed on foam (s2ecf). Figure 2 provides similar information for the gait task of walking 8 tandem steps (w8tan). Note that the term ”perceived” is used to describe the patient’s measured values, which resulted when asked to duplicate the peak-to-peak trunk sway of the immediately preceding trial while standing on a firm surface with eyes open. Three key features of the data are apparent in the plots of figures 1 and 2. Firstly, the perceived trunk sway amplitudes, marked on the data plots of Figure 1 and Figure 2 with labelled double headed arrows, as well as the significance of population perceived mean values across all stance tests marked by highlighted bold text in Table 2A (columns 2 and 4), indicate that perceived sway values were larger for PPPD patients than those of the HC subjects in both the pitch and roll directions. That is, the perceived values of figures 1B and 2B are greater than those of figure 1D and 2D, respectively. Note also that a different ordinate scale factor is used in figures 1B and 2B than in figures 2B and 2D. As indicated in table 2A, similar results were obtained for all stance tasks. The second feature of the data was that for the tan8 task, as well as the s2ecf task, means of measured values were also greater for the PPPD subjects compared to HCs, see Table 2A (columns 1 and 3) and compare figure 1A with figure 1C as well as figure 2A with 2C, respectively. The third noticeable feature of the plots of figure 1 is that the perceived amplitudes of trunk lean in figure 1B are greater than the measured values of figure 1A; similarly for figure 1D and 1C, respectively. That is, within the PPPD population, perceived values for stance trials are greater than measured values for stance trials (see columns 3 and 4, Table 3). Thus, the data of Tables 2A and 3 show that stance and 8tan trials provided the greatest number of population differences with measured and perceived amplitudes being greater for PPPD patients than HCs in both the pitch and roll directions. Furthermore, perceived values were greater than measured values for the stance trials of PPPD patients.
Overall descriptions and specific summary legends for Tables 2A, 2B, 3 and 4.
The summary tables of paired t-test population analyses of measured (labelled (meas) and perceived (perc), peak-to-peak lower (lumbar 2-3) trunk sway of PPPD patients with respect to age-matched HC calculated during 5 tests (S2eo, S2eof, S2eof, W8tan, W3mhr (see Methods for text abbreviations)) in the pitch (pi-) and roll (ro-) directions, immediately before and after VT feedback training. For the perceived measurements (labelled –per), immediately after each of the 5 tests, subjects were asked to stand, as in the s2eo position, and then on command to lean to the left, right, forwards and backwards as far as they thought they had lent during the immediately preceding test (see figures 1 and 2). The t-tests values were calculated at 2 time points, at onset of VT-fb training (Table 2A), in order to demonstrate a population effect prior to treatment and at training termination effect 3 weeks later (Table 2B) in order to show a treatment effect.
Table 2A. Presence of significant population differences (p<0.05 before Bonferroni correction) are highlighted between PPPD and HC subjects for measured (meas) and perceived (perc) trunk sway amplitudes at onset of VT-fb training. The abbreviation for each test type as listed in column 5 is provided in the methods section. Cells with p>0.025, (>0.05 before Bonferroni corrections for 3 comparisons) are highlighted. Most significant differences at training onset (see highlighted cells) were, as expected, with PPPD patients had larger values than HCs, except for the 4 highlighted cells. That is, as indicated, only 4 cells showed marked differences which were not significant.
Table 2B. Absence of significant population differences (p<0.05) between PPPD and HC subjects for measured (meas) and perceived (perc) trunk sway amplitudes at termination of VT-fb training. Note that the population differences are greater than those of Table 2A.
Table 3. Significant differences (p<0.05 before Bonferroni correction) between perceived (perc) and measured (meas) trunk sway amplitudes at termination of VT-fb training, provided to PPPD subjects. The difference for HC subjects is also provided. However, the HC subjects were not provided training.
Table 4. Regression parameters for perceived (perc) versus measured (meas) trunk sway amplitudes.
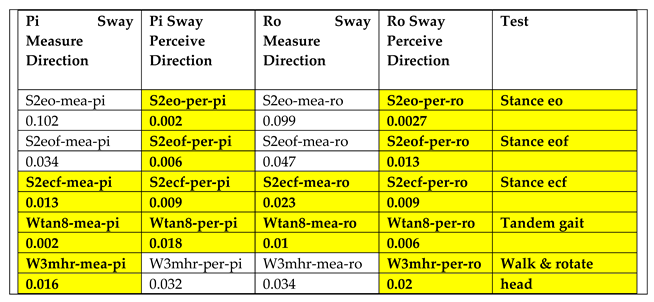
Table 2A Significant t-test differences (p<0.025) between perceived (per) and measured (mea) values of trunk lean for PPPD patients at VT balance tactile treatment onset compared to aged-matched healthy controls. For 14 of 20 comparisons highlighted, p<0.025.
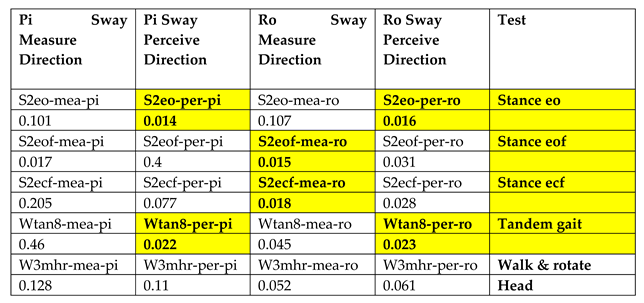
Table 2B Significant t-test differences (p<0.025) between perceived (per) and measured (mea) values of trunk lean for PPPD patients at VT balance tactile treatment termination compared to aged-matched healthy controls. For 6 of 20 comparisons, cells were highlighted when p<0.025, indicating an improvement in balance control had occurred.
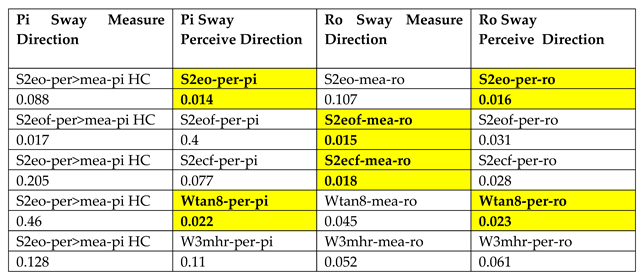
Table 3. Significant t-test differences (p<0.025) within population between perceived (per) and measured (mea) trunk lean for PPPD patients For 6 of 20 comparisons, cells were highlighted when p<0.025.
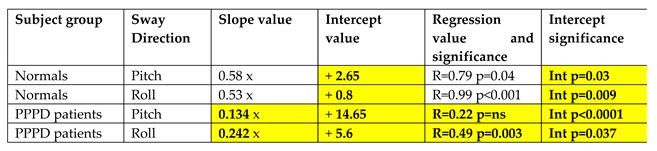
Table 4: Summary of regression analysis of peak-to-peak trunk sway for HCs and PPPD patients measured during 5 tests (S2eo, S2of, S2ecf, W8tan, W3mhr)). After each of these tests subjects were asked to stand, as in the S2eo position, and then on command to lean to the left, right, forwards, and backwards as far as they thought they had maximally leaned during the previous test (see figure 1). Measures entered into the regression analyses of Table 4 were the peak-to-peak roll and pitch axis values measured with the SwayStar gyroscopes. The x axis values are the peak-to-peak measured values during the trial and the y axis values for the perceived sway. ns stands for not significant. Tests were repeated twice for the PPPD patients over the 3 week period of VTfb training.
3.2. Regressions Between Measured and Perceived Trunk Sway Values
By comparing a patient’s actual trunk sway during balance tests with the patient’s perceived sway (Figure 1 and Figure 2, Tables 2A and 3), we concluded that regression analysis might provide useful descriptive parameters characterising the relationship between measured and perceived trunk sway-means for PPPD patients and HCs. As documented in figures 3 and 4 as well as in Table 4, the characterisation consisted of weakly-varying slope values plus a large, but consistent variation in intercept values. For example, the regressions of PPPD patients in the pitch direction had a slope value of 0.365 (p=0.05) and an intercept value of 12.9 (p<0.001) and for HCs, in the pitch direction, the slope was 0.448 (and not significant). However, the intercept was significant (p=0.03) with a value of 2.85 (see Table 4). Figure 3 and Figure 4 show this relation for PPPD patients and HCs, respectively. Note there are less HC data points in figure 4 than PPPD data points in figure 3, because trials were not repeated for HCs, neither did they receive 2 weeks of VT-fb training. This result was obtained regardless of the used to calculate the intercept values. In our case, linear or logarithmic regression yield similar results (within 5% of one another. Table 4 provides a list of the regression parameters and documents that slope values did not differ between pitch and roll, neither between PPPD and HC populations. However, the intercept values show larger values for pitch than roll (approximately 3-fold) and greater values for PPPD patients than controls (approximately 6-fold) for the same pitch or roll axis. Thus, based on these results, we expected that the effects of VT-fb training would be more evident for the intercept values of the pitch plane rather than those of the roll plane. Furthermore, that this result was independent of the method used to calculate the intercept value. Intercept values for linear and logarithmic regressions yielded results within ±5% of one another.
3.3. Effect of Vibro-Tactile Feedback Training on Trunk Sway of PPPD Patients
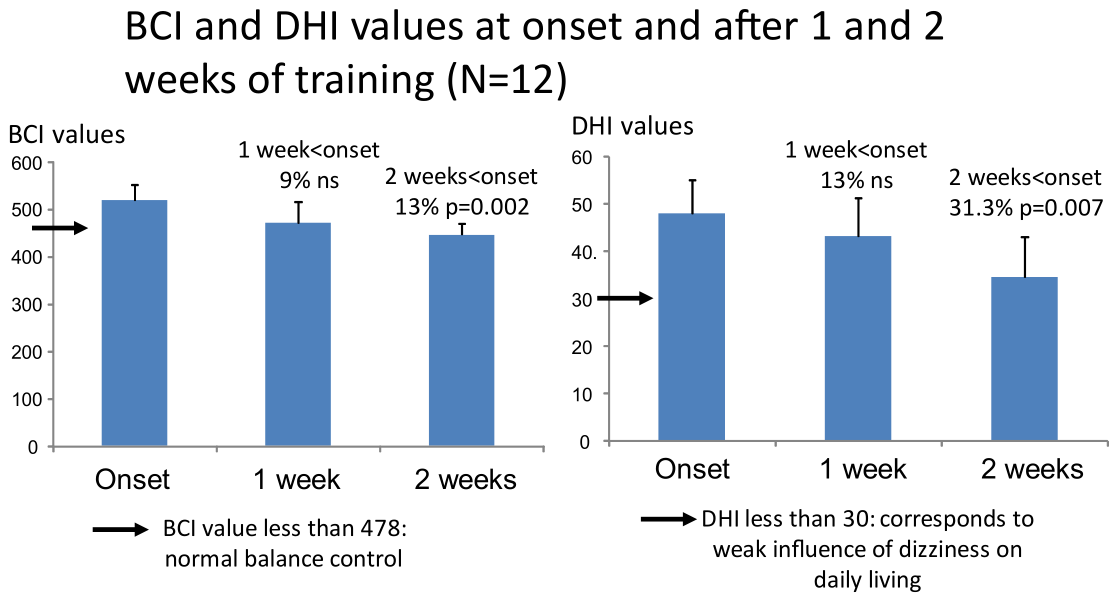
We aimed to parameterise the relation between measured and perceived sway using linear regression analysis in order to describe how balance feedback-training influenced this relationship. The intercept values for the regression plots derived from data illustrated in figure 3 show a profound effect of VT-fb training, 37%, on pitch (figure 5, p=0.04 with respect to onset values). Training had a similar, 40%, but less significant effect, p=0.05, on roll intercept values, after 2 weeks of training (Figure 5). Based on the population regression plots of figure 3, this result for pitch and roll intercept values was expected. In comparison, Figure 6 illustrates that the changes in BCI and DHI values, 17 and 31%, respectively, with VT-fb training are more modest. With our 2-week training protocol described above (see Methods), we were able to improve balance control, as quantified with the BCI, 17%, with greater improvement in gait compared to stance trials, and could reduce the value of the dizziness handicap inventory (DHI) values by 31%. Both values are slightly lower than the reductions obtained by Candreia et al., [19], 26.2% and 36.4%, respectively, in a group of 15 PPPD patients all of whom had a quantified balance deficit (pathological BCI). In the current study, 10 of the 15 PPPD patients we tested had a pathological BCI at training onset. The largest change we observed over the 2 week period was in the intercept values of the regression analysis which decreased some 37% (p<0.04 - see figure 5). Extrapolating this value to that of 4 weeks of training would have placed the intercept values of PPPD patients within the range of those of HCs (see Table 4 and Figure 5).
Summarising, the largest change with training we observed was in the decrease in perceived versus measured trunk sway regression intercept values (on average 38%, for pitch and roll p<0.02). This value compares with lower improvement in BCI (17%) and DHI (28%) scores. One of the unanswered questions underlying this improvement in regression intercept values that needs to be discussed is whether there is a central correlate to the intercept value that changes with the amount of balance training.
4. Discussion
The current study has focussed on 3 aspects of actually measured and perceived trunk sway of PPPD patients in comparison to that of HC subjects. First, we examined whether the average perceived trunk sway angle recorded during stance and gait balance tests could be used as symptom marker to distinguish measured trunk sway of PPPD patients from that of healthy controls. This emerged to be the case, see figure 3. Further, if significantly different, which measures of stance and gait tasks provided the most significant separation between the population means. Although our analysis of perceived sway was limited to 3 stance and 2 gait tasks, in order not to burden patients excessively with balance tasks, trunk sway recorded while standing eyes closed on foam and walking 8 tandem steps was shown to provide the clearest indication of differences between PPPD and HC subjects, and this across all 4 measurement variables used; measured trunk pitch and roll and, perceived, trunk pitch and roll. The greatest significance within a test was found for walking 8 tandem steps, see Table 2A. The greatest significance across this test was found for measured pitch (p=0.002), and measured (p=0.01) and perceived roll (p=0.006). Standing eyes closed on foam yielded similarly significant results, except for measured roll. Previous studies have demonstrated similar results identifying these 2 tests as symptom markers of PPPD [2,14]. Specifically, with a sway-referenced support surface (partially equivalent to standing on foam [34]) similar conclusions to ours for stance on a foam support surface were reached [35]. In summary, our results indicate that perceived measures from the 8 tandem steps and s2ecf provide symptom markers for PPPD, especially if perceived values are outside of the range of HCs. Interestingly, providing, specific task information in the form of vibrotactile-feedback has been shown to improve reaction times in comparison to visual feedback [36].
Secondly, by asking subjects in the perceived sway tasks to lean in the pitch and roll directions the amount they thought they had swayed during the previous measured task, we were attempting to establish if there was a directional relationship between the perceived angular movements of the body’s centre of mass and the perceived distance to the edges of the base of support (BOS) in the pitch and roll directions. In other words, if trunk sway was greater during the perceived trials for PPPD subjects, the distance to the BOS limit must have been perceived as greater too. Otherwise, the perceived sway should have been less.
In vestibular neuronectomy patients, the perceived distance to the BOS is significantly smaller than in healthy controls [36,37]. Understanding this relationship is crucial for assessing fall risk in PPPD patients. A more direct approach involves analysing ankle and trunk muscle EMG responses, ankle torques, and trunk sway in response to head accelerations and ankle flexion induced by support surface ankle dorsi-flexion rotation tilts. These responses depend on vestibular and proprioceptive inputs, with minimal visual influence, but are strongly influenced by central set in PPPD [38,39,40]. Chronic vestibular loss patients and those with functional disorders respond differently to toe-up support surface pitch tilts [17,41,42,43]. In vestibular loss patients, reduced early leg and trunk external oblique muscle responses cause initially forward sway, followed by excessive backward sway due to increased lower back muscle activity [40]. With repeated tilts, consistently decreasing response adaptation occurs at similar rates in vestibular loss patients and healthy controls, indicating a weak central influence due to vestibular loss [43]. In contrast, PPPD patients exhibit trial-by-trial variations in response amplitudes inconsistent with an increasing stability with adaptation [17]. The increased late tibialis anterior and paraspinal activity and reduced soleus activity leads to destabilizing ankle torques and excessive backwards trunk sway [17].
Thus, although measuring trunk sway during stance and gait trials, provides valuable information on possible disease biomarkers for PPPD, examining responses to platform tilts provides greater insights into these possible biomarkers. The next step in this research approach should be to examine the effects of multi-directional combined platform tilts on PPPD patients in order to determine if the interaction effects of initial vertically directed head linear and roll-directed head angular accelerations on the generation of early vestibulospinal muscle responses, subsequent trunk motion and perceived sway differ in PPPD patients compared to HCs. Because initial head roll angular acceleration responses for platform roll tilt are delayed some 30 ms with respect to head vertical linear accelerations elicited by pitch tilt, separated central processing of pitch versus roll muscle responses is assumed to occur for normal subjects [45,46]. Whether this is the case of PPPD patients is an open question.
As described above, one approach we have used with PPPD patients has been first to correlate the largest initial head accelerations occurring during platform tilt with the latencies and subsequent amplitudes of muscle and kinematic responses, assuming that the vestibulo-spinal effect is determined by response changes with vestibular-loss, and those due to PPPD have a greater kinematic variation. Our second approach has been to examine differences between trunk sway during stance and gait tasks. Other authors have chosen to use direct electrical (galvanic) near the vestibular labyrinth to identify differences in vestibulo-spinal responses of PPPD patients compared to those of HCs [38].
Examples of the latter approach have been described by Helmchen and coworkers [38,39] who compared postural control in patients with PPPD, albeit without peripheral vestibular loss, and HCs. In the easiest condition (eyes open on a firm support surface), PPPD patients exhibited larger measured sway, both with eyes open and closed, and perceived the sway as larger. However, the perceived to measured ratio was similar to that of healthy controls, indicating no postural misperception. During galvanic vestibular stimulation (GVS) [39], both groups showed proportional increases in sway, without misperception. In reproducing perceived sway with eyes open, PPPD patients overestimated their sway, reflecting poorer base-line control, but the perceived to measured ratio was similar to healthy controls. These data reinforce the notion that PPPD patients rely excessively on visual reference frames for posture control, using inappropriate visual scaling factors (rather than vestibular inputs). In contrast, our results for stance tests without GVS indicated no pathological visual or proprioceptive scaling factors (see Table 1).
Our findings, of increased perceived sway in PPPD patients, are similar to those of previous studies [18]. However, we have been able to extend the findings to other stance tasks as well as gait tasks. For those tasks which provided the most significant differences in perceived sway, s2ecf and tan8, the measured values of PPPD patients were also significantly larger than those of HCs. Although San Pedro Murillo et al [18] did not examine regression analysis, data in their figure 1A is suggestive of a prominent offset effect for all 3 groups they studied. Interestingly, our offset values are quite low across trials for the HC subjects, 2.86 degs for pitch and 1.0 degs for roll, but considerable for PPPD patients, 13 degs for pitch and 5.7 degs for roll.
Thirdly, we attempted to provide PPPD patients an artificial feedback signal of trunk sway to help reduce perceived sway of the trunk. That is, during training, when trunk sway exceeded 70% of peak angular sway previously recorded in measured trials, one of 8 vibrators in a head-band indicating the direction of trunk sway was switched on automatically to inform the wearer that continued sway in that direction would lead to a fall. In effect we were providing the test subject a dynamic BOS signal. Considering the DHI [26], which is a commonly used to judge the effect of dizziness on daily living, we could establish an average reduction of 28% in this score. This value is slightly less than that of our previous study on PPPD patients, 36% [15]. In the current study, we have introduced a new descriptor of the balance instability of PPPD patients, the regression intercept value of peak-to-peak sway for measured versus perceived sway. After 2 weeks of vibro-tactile balance feedback training, a large 38% improvement in the intercept value was present. This improvement was larger than that of the previous improvement measures we have used to date for our balance training studies [15].
5. Conclusions
These results indicate that measured and perceived trunk sway of PPPD patients during stance and gait tests is greater than that of HCs. The greatest difference with respect to HCs occurred for pitch trunk sway while standing eyes closed on foam and when walking tandem steps, suggesting that measures from these tests may serve as markers for PPPD. The regressions between measured and perceived sway are dominated by large pitch and roll offsets in PPPD patients which could be reduced towards normal values with 2 weeks of balance training. Future studies might also address the question of the ideal duration of training.
Author Contributions
This study was conceived by HMR and JHJ. The subject investigations were carried out by JHJA, HMR, LG, and AO. Data analysis was performed by JHJA. The first draft of the manuscript was written by JHJA and DK. All authors have read and agreed to the published version of the manuscript.
Funding
This research received no external funding.
Institutional Review Board Statement
This study was conducted in accordance with the Declaration of Helsinki, and the protocol was approved on 25.02.2023 by the local ethical committee responsible for the University Hospital Basel: Ethics Committee for North–Central Switzerland which has the German abbreviation, (EKNZ) (Project identification code 2014-026, Amendment 5).
Informed Consent Statement
Informed consent was obtained from all subjects involved in the study.
Data Availability Statement
The raw data supporting the conclusions of this article will be made available by the authors on request.
Conflicts of Interest
The author JHJA declares a conflict of interest as he has worked as a consultant for the company, Balance International Innovations GmbH, producing the SwayStar equipment used in this study to measure balance control.
Acknowledgments
We thank all the subjects of this study for their participation. We thank Prof Christof Stieger for giving us the opportunity to use the infrastructure of the Neurootology laboratory at the Department of ORL at the University Hospital Basel. We thank Ms Barbara Wenger for editorial assistance.
Abbreviations
The following abbreviations are used in this manuscript:
| PPPD | Persistent postural perceptual dizziness |
| HCs | Healthy controls |
| VT-fb | Vibro-tactile feedback |
| VOR | Vestibulo-ocular reflex |
| PVD | Peripheral vestibular deficit |
| BCI | Balance control index |
| DHI | Dizziness handicap inventory |
| BOS | Base of support |
References
- Staab, J.P.; Eckhardt-Henn, A.; Horii, A.; Jacob, R.; Strupp, M.; Brandt, T.; et al. Diagnostic criteria for persistent postural-perceptual dizziness (PPPD). Consensus document of the Committee for the Classification of Vestibular Disorders of the Bárány Society. J. Vestib. Res. 2017, 27(4), 191–208. [Google Scholar] [CrossRef] [PubMed]
- Brandt, T. Phobic postural vertigo. Neurology 1996, 46(6), 1515–9. [Google Scholar] [CrossRef] [PubMed]
- Bronstein, A.M. The visual vertigo syndrome. Acta Otolaryngol. 1995, 115, 45–8. [Google Scholar] [CrossRef]
- Jacob, R.G.; Woody, S.R.; Clark, D.B.; Lilienfeld, S.O.; Hirsch, B.E.; Kucera, G.D.; et al. Discomfort with space and motion: a possible marker of vestibular dysfunction assessed by the situational characteristics questionnaire. J. Psychoathol Behav. Assess. 1993, 15, 299–324. [Google Scholar] [CrossRef]
- Ruckenstein, M.J.; Staab, J.P. Chronic subjective dizziness. Otolaryngol. Clin. North Am. 2009, 42, 71–7. [Google Scholar] [CrossRef] [PubMed]
- Popkirov, S.; Staab, J.P.; Stone, J. Persistent postural-perceptual dizziness (PPPD): a common, characteristic and treatable cause of chronic dizziness. Pract. Neurol. 2018, 18, 5–13. [Google Scholar] [PubMed]
- Tarnutzer, A.A.; Kaski, D. What’s in a name? Chronic vestibular migraine or persistent postural perceptual dizziness. Brain Sci. 13(12), 1692. [CrossRef] [PubMed]
- Habs, M.; Strobl, R.; Grill, E.; Dieterich, M.; Bense, S.B. Primary or secondary chronic functional dizziness: does it make a difference? A Dizzy Reg study in 356 patients. J. Neurol. 2020, 267 (Suppl 1), 212–222. [Google Scholar] [CrossRef] [PubMed]
- Honegger, F.; Hubertus, J.W.; Allum, J.H. Coordination of the head with respect to the trunk, pelvis, and lower leg during quiet stance after vestibular loss. Neuroscience 2013, 232, 204–15. [Google Scholar] [CrossRef] [PubMed]
- Allum, J.H.J.; Scheltinga, A.; Honegger, F. The effect of peripheral vestibular recovery on improvements in vestibulo-ocular reflexes and balance control after acute unilateral peripheral vestibular loss. Otol. Neurotol. 2017, 38, e531–e538. [Google Scholar] [CrossRef] [PubMed]
- Nazareth, I.; Yardley, L.; Owen, N.; Luxon, L. Outcome of symptoms of dizziness in a general practice community sample. Fam. Pract. 1999, 16, 616–8. [Google Scholar] [CrossRef] [PubMed]
- Kim, H.J.; Lee, J.O.; Choi, J.Y.; Kim, J.S. Etiologic distribution of dizziness and vertigo in a referral-based dizziness clinic in South Korea. J. Neurol. 2020, 267, 2252–2259. [Google Scholar] [CrossRef] [PubMed]
- Staab, J.P. Persistent Postural-Perceptual Dizziness: Review and Update on Key Mechanisms of the Most Common Functional Neuro-otologic Disorder. Neurol. Clin. 2023, 41(4), 647–664. [Google Scholar] [CrossRef] [PubMed]
- Dieterich, M.; Staab, J. Functional dizziness: from phobic postural vertigo and chronic subjective dizziness to persistent postural-perceptual dizziness. Curr. Opin. Neurol. 2017, 30(1), 107–13. [Google Scholar] [CrossRef] [PubMed]
- Schmid, D.A.; Allum, J.H.J.; Sleptsova, M.; Gross, S.; Gaab, J.; Welge-Lüssen, A.; et al. Effects of a program of cognitive-behavioural group therapy, vestibular rehabilitation, and psychoeducational explanations on patients with dizziness and no quantified balance deficit, compared to patients with dizziness and a quantified balance deficit. J. Psychosom. Res. 2018, 105, 21–30. [Google Scholar] [CrossRef] [PubMed]
- Querner, V.; Krafczyk, S.; Dieterich, M.; Brandt, T. Patients with somatoform phobic postural vertigo: the more difficult the balance task, the better the balance performance. Neurosci. Lett. 2000, 285(1), 21–4. [Google Scholar] [CrossRef] [PubMed]
- Vonk, J.; Horlings, C.G.C.; Allum, J.H.J. Differentiating malingering balance disorder patients from healthy controls, compensated unilateral vestibular loss, and whiplash patients using stance and gait posturography. Audiol. Neurootol. 2010, 15, 261–72. [Google Scholar] [PubMed]
- San Pedro Murillo, E.; Bancroft, M.J.; Koohi, N.; Castro, P.; Kaski, D. Postural misperception: a biomarker for persistent postural perceptual dizziness. J. Neurol. Neurosurg. Psychiatry 2022, jnnp-2022-329321. [Google Scholar]
- Candreia, C.; Rust, H.M.; Honegger, F.; Allum, J.H.J. The effects of vibro-tactile biofeedback training on balance control and dizziness in patients with persistent postural-perceptual dizziness (PPPD). Brain Sci. 2023, 13, 781–799. [Google Scholar] [CrossRef]
- McCaslin, D.L.; Shepard, N.T.; Hollman, J.H.; Staab, J.P. Characterization of Postural Sway in Patients With Persistent Postural-Perceptual Dizziness (PPPD) Using Wearable Motion Sensors. Otol. Neurotol. 2022, 43, 243–251. [Google Scholar] [CrossRef]
- Hegeman, J.; Shapkova, E.Y.; Honegger, F.; Allum, J.H.J. Effect of age and height on trunk sway during stance and gait. J. Vestib. Res. 2007, 17((2), 3):75–87. [Google Scholar]
- Allum, J.H.; Adkin, A.L. Improvements in trunk sway observed for stance and gait tasks during recovery from an acute unilateral peripheral vestibular deficit. Audiol. Neurootol. 2003, 8(5), 286–302. [Google Scholar] [CrossRef] [PubMed]
- Allum, J.H.; Ura, M.; Honegger, F.; Pfaltz, C.R. Classification of peripheral and central (pontine infarction) vestibular deficits. Selection of a neuro-otological test battery using discriminant analysis. Acta Otolaryngol. 1991, 111(1), 16–26. [Google Scholar] [CrossRef] [PubMed]
- Allum, J.H.; Carpenter, M.G.; Adkin, A.L. Balance control analysis as a method for screening and identifying balance deficits. Ann. N Y Acad. Sci. 2001, 942, 413–27. [Google Scholar] [CrossRef] [PubMed]
- Callaghan, B.; Price, R.; Feldman, E. Distal Symmetric Polyneuropathy: A Review. JAMA 2015, 314(20), 2172–81. [Google Scholar] [CrossRef] [PubMed]
- Jacobson, G.P.; Newman, C.W. The development of the Dizziness Handicap Inventory. Arch. Otolaryngol. Head. Neck Surg. 1990, 116(4), 424–7. [Google Scholar] [CrossRef] [PubMed]
- Volz-Sidiropoulou, E.; Takahama, J.; Gauggel, S.; Westhofen, M. Das „Dizziness Handicap Inventory”: Erste psychometrische Kennwerte einer Deutschen Version. Laryngorhinootologie 2010, 89(07), 418–23. [Google Scholar] [CrossRef] [PubMed]
- Nola, G.; Mostardini, C.; Salvi, C.; Ercolani, A.P.; Ralli, G. Validity of Italian adaptation of the Dizziness Handicap Inventory (DHI) and evaluation of the quality of life in patients with acute dizziness. Acta Otorhinolaryngol. Ital. 2010, 30, 190. [Google Scholar] [PubMed]
- Allum, J.H.J.; Rust, H.M.; Lutz, N.; Schouenborg, C.; Fischer-Barnicol, B.; Haller, V.; et al. Characteristics of improvements in balance control using vibro-tactile biofeedback of trunk sway for multiple sclerosis patients. J. Neurol. Sci. 2021, 425, 117432. [Google Scholar] [CrossRef] [PubMed]
- Nanhoe-Mahabier, W.; Allum, J.H.; Pasman, E.P.; Overeem, S.; Bloem, B.R. The effects of vibrotactile biofeedback training on trunk sway in Parkinson's disease patients. Park. Relat. Disord. 2012, 18(9), 1017–21. [Google Scholar] [CrossRef]
- Horlings, C.G.C.; Küng, U.M.; Bloem, B.R.; Honegger, F.; Van Alfen, N.; BGM Van Engelen, B.G.M.; Allum, J.H.J. Identifying deficits in balance control following vestibular or proprioceptive loss using posturographic analysis of stance tasks. Clin. Neurophysiol. 2008, 119, 2338–2346. [Google Scholar] [CrossRef] [PubMed]
- Nashner, L.M.; Peters, J.F. Dynamic posturography in the diagnosis and management of dizziness and balance disorders. Neurol. Clin. 1990, 8, 331–49. [Google Scholar] [CrossRef] [PubMed]
- Honegger, F.; van Spijker, G.J.; Allum, J.H. Coordination of the head with respect to the trunk and pelvis in the roll and pitch planes during quiet stance. Neuroscience 2012, 213, 62–71. [Google Scholar] [CrossRef] [PubMed]
- Allum, J.H.; Zamani, F.; Adkin, A.L.; Ernst, A. Gait Differences between trunk sway characteristics on a foam support surface and on the Equitest ankle-sway-referenced support surface. Posture Gait 2002, 16, 264–70. [Google Scholar] [CrossRef]
- Alvarez-Otero, R.; Perez-Fernandez, N. The limits of stability in patients with unilateral vestibulopathy. Acta Oto-Laryngol. 2017, 137;10, 1051–1056. [Google Scholar] [CrossRef]
- Beule, A.G.; Allum, J.H.J. Otolith function assessed with subjective postural horizontal and standardised stance and gait tasks. Audiol. Neurotol. 2006, 11, 172–182. [Google Scholar] [CrossRef]
- Wall C3rd Merfeld, D.M.; Rauch, S.D.; Black, F.O. Vestibular prostheses: the engineering and biomedical issues. In J Vestib Res.; J Vestib Res. 2002-2003; 12(2-3):95-113; Wall, C., 3rd, Merfeld, D.M., Rach, S.D., Black, F.O., Eds.; 2002-2003; Volume 12, 2-3, pp. 95–113. [Google Scholar] [PubMed]
- Helmchen, C.; Blüm, S.K.; Storm, R.; Krause, J.; Sprenger, A. J Postural motion perception during vestibular stimulation depends on the motion perception threshold in persistent postural-perceptual dizziness. J. Neurol. 2024, 8, 4909–4924. [Google Scholar] [CrossRef]
- Storm, R.; Krause, J.; Blüm, S.K.; Wrobel, V.; Frings, A.; Helmchen, C.; Sprenger, A. Visual and vestibular motion perception in persistent postural-perceptual dizziness (PPPD). J. Neurol. 2024, 6, 3227–3238. [Google Scholar] [CrossRef]
- Woll, J.; Sprenger, A.; Helmchen, C. Postural control during galvanic vestibular stimulation in patients with persistent perceptual-postural dizziness. J. Neurol. 2019, 66, 1236–1249. [Google Scholar] [CrossRef]
- Allum, J.H.J.; Carpenter, M.G. Postural control and the vestibulospinal system, Chapter 4. In 2025 Oxford Textbook for Vertigo and Imbalance ed A Bronstein.
- Allum, J.H.; Keshner, E.A.; Honegger, F.; Pfaltz, C.R. Indicators of the influence a peripheral vestibular deficit has on vestibulo-spinal reflex responses controlling postural stability. Acta Otolaryngol. 1988, 106, 252–63. [Google Scholar] [CrossRef] [PubMed]
- Allum, J.H.; Pfaltz, C.R. Vestibulospinal reflexes in differentiating between organic and functional (psychogenic) causes of vertigo. HNO 1987, 35, 128–35. [Google Scholar] [PubMed]
- Keshner, E.A.; Allum, J.H.; Pfaltz, C.R. Postural coactivation and adaptation in the sway stabilizing responses of normals and patients with bilateral vestibular deficit. Exp. Brain Res. 1987, 69, 77–92. [Google Scholar] [CrossRef] [PubMed]
- Honegger, F.; Hillebrandt, I.M.A.; van den Elzen, N.G.A.; Tang, K.-S.; Allum, J.H.J. The effect of prosthetic feedback on the strategies and synergies used by vestibular loss subjects to control stance. J. Neuroeng. Rehabil. 2013, 10, 115. [Google Scholar] [CrossRef] [PubMed]
- Grüneberg, C.; Duysens, J.; Honegger, F.; Allum, J.H. Spatio-temporal separation of roll and pitch balance-correcting commands in humans. J. Neurophysiol. 2005, 94, 3143–58. [Google Scholar] [CrossRef] [PubMed]
Figure 1.
Typical examples trunk roll and pitch sway angle plotted as a x-y plot for a PPPD subject (upper 2 sets of traces, panels A and B) and a healthy control subject (lower set of 2 traces, panels C and D). The subjects first performed the task of standing on 2 legs eyes closed on a foam support surface. Immediately after this trial (left set of traces), the subjects were asked to reproduce their perceived maximum lower trunk sway during the previous trial by leaning to the left and right (roll) as well as backwards and forwards on verbal command, while standing on 2 legs with eyes open on a normal firm surface (right set of traces). The peak-to-peak measures of pitch and roll are marked on the x-y plots (green traces) of pitch and roll and can be compared to mean population values listed in the figure. Note that the axis scaling is different in the upper right plot, panel B, compared to that of the other plots. Histograms of roll and pitch angle are provided with the x-y plots. These were computed by dividing the range of roll and pitch values into 40 bins and then assigning the sampled values to the appropriate bin.
Figure 1.
Typical examples trunk roll and pitch sway angle plotted as a x-y plot for a PPPD subject (upper 2 sets of traces, panels A and B) and a healthy control subject (lower set of 2 traces, panels C and D). The subjects first performed the task of standing on 2 legs eyes closed on a foam support surface. Immediately after this trial (left set of traces), the subjects were asked to reproduce their perceived maximum lower trunk sway during the previous trial by leaning to the left and right (roll) as well as backwards and forwards on verbal command, while standing on 2 legs with eyes open on a normal firm surface (right set of traces). The peak-to-peak measures of pitch and roll are marked on the x-y plots (green traces) of pitch and roll and can be compared to mean population values listed in the figure. Note that the axis scaling is different in the upper right plot, panel B, compared to that of the other plots. Histograms of roll and pitch angle are provided with the x-y plots. These were computed by dividing the range of roll and pitch values into 40 bins and then assigning the sampled values to the appropriate bin.
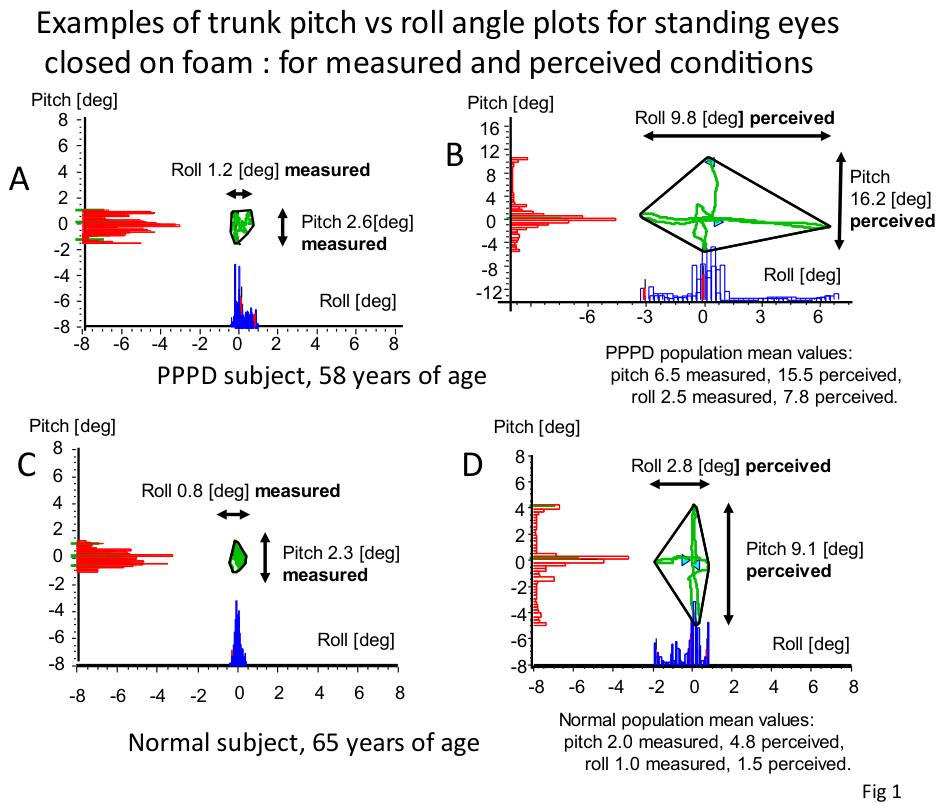
Figure 2.
Typical examples trunk roll and pitch sway angle plotted as a x-y plot for a PPPD subject (upper set of traces) and a healthy control subject (lower set of traces) performing the task of walking 8 tandem steps on a firm support surface. The subjects are the same as those of figure 1. For details see the legend to figure 1.
Figure 2.
Typical examples trunk roll and pitch sway angle plotted as a x-y plot for a PPPD subject (upper set of traces) and a healthy control subject (lower set of traces) performing the task of walking 8 tandem steps on a firm support surface. The subjects are the same as those of figure 1. For details see the legend to figure 1.
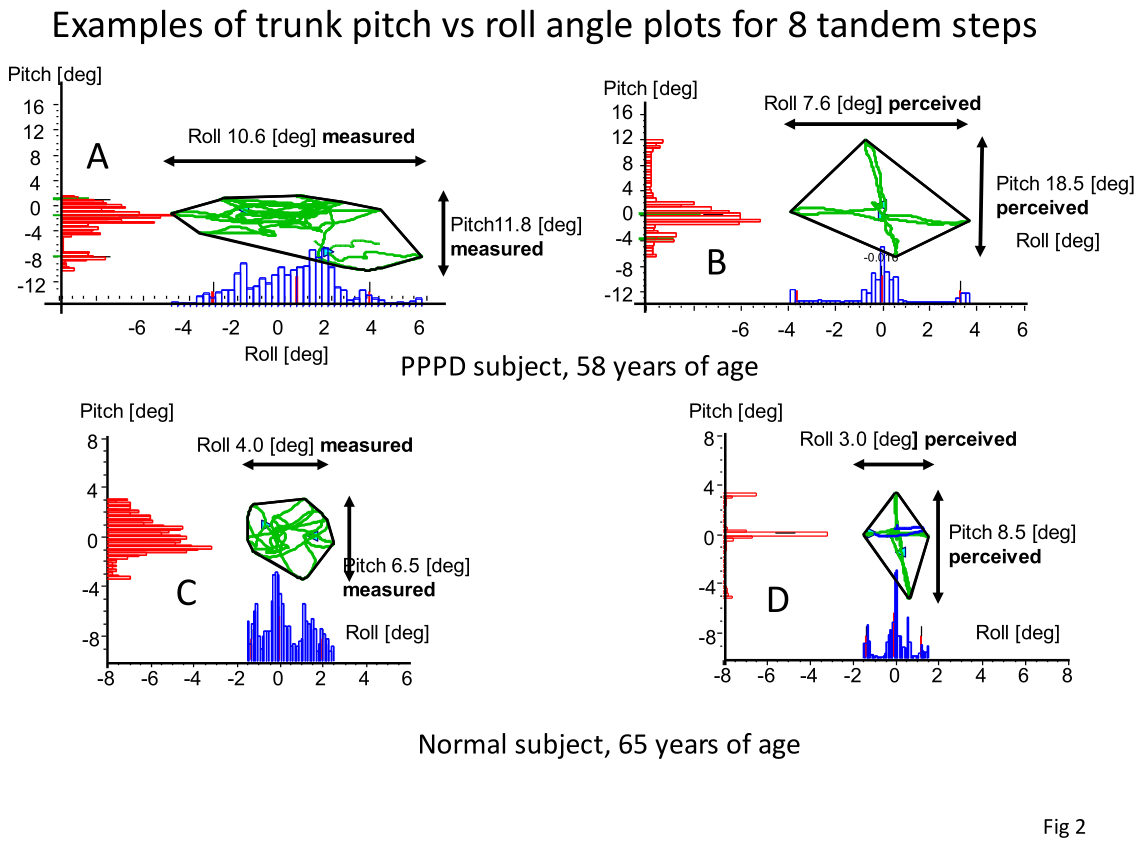
Figure 3.
Regressions between measured and perceived pitch angle (left panel) and roll angle (right panel) data of PPPD patients. Each data point is the average for 15 patients, for 1 of 3 stance tasks (blue data points) and for 1 of 2 gait tasks (red data points), and for 1 of 3 weekly visits for a total of 15 data points. The regression coefficients are listed in Table 4.
Figure 3.
Regressions between measured and perceived pitch angle (left panel) and roll angle (right panel) data of PPPD patients. Each data point is the average for 15 patients, for 1 of 3 stance tasks (blue data points) and for 1 of 2 gait tasks (red data points), and for 1 of 3 weekly visits for a total of 15 data points. The regression coefficients are listed in Table 4.
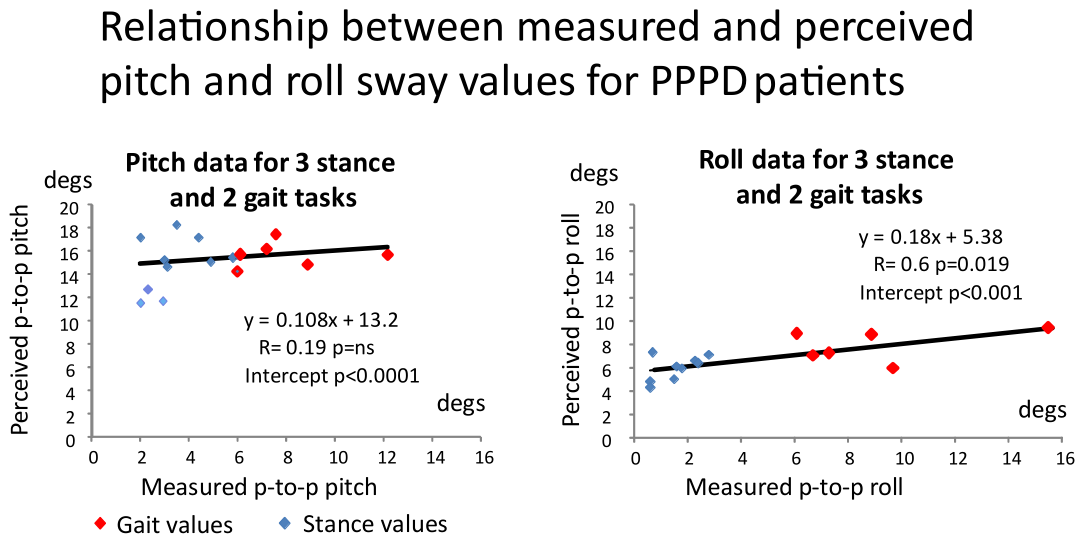
Figure 4.
Regressions between measured and perceived pitch (left panel) and roll (right panel) data of HC subjects. Each data point is the average of 15 subjects, for 1 of 3 stance (blue data points) or 1 of 2 gait (red data points) tasks, giving a total of 5 data points. The regression coefficients are listed in Table 4. Note, as with the PPPD patients, the larger intercept value obtained for pitch compared to roll. However, the scaling factor. As in figure 3 intercept values are greater for pitch compared to roll, within each test population an approximately similar scale factor of 6.5.
Figure 4.
Regressions between measured and perceived pitch (left panel) and roll (right panel) data of HC subjects. Each data point is the average of 15 subjects, for 1 of 3 stance (blue data points) or 1 of 2 gait (red data points) tasks, giving a total of 5 data points. The regression coefficients are listed in Table 4. Note, as with the PPPD patients, the larger intercept value obtained for pitch compared to roll. However, the scaling factor. As in figure 3 intercept values are greater for pitch compared to roll, within each test population an approximately similar scale factor of 6.5.
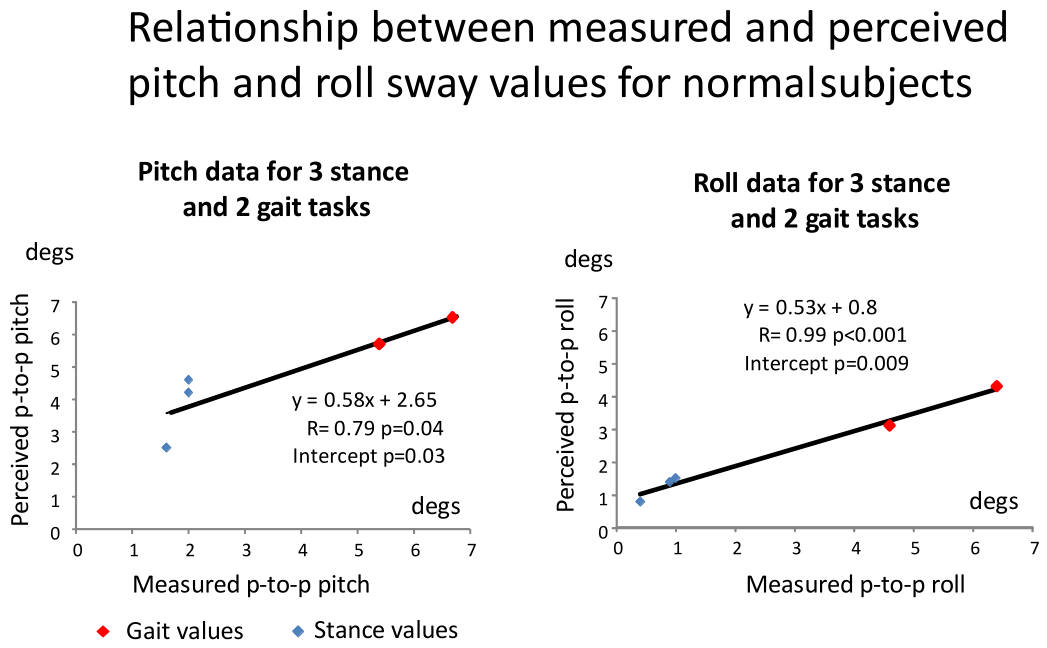
Figure 5.
Decreases in pitch intercept values of perceived sway versus measured sway obtained for the regression of measured with perceived sway during 2 weeks of VT-fb training. The height of the columns represents the mean values of the 15 patients and the vertical bars the standard error of the mean. The percentage of improvement in intercept values over 2 weeks is listed above the 2 weeks’ columns and can be compared with the values of healthy controls (chequered columns).
Figure 5.
Decreases in pitch intercept values of perceived sway versus measured sway obtained for the regression of measured with perceived sway during 2 weeks of VT-fb training. The height of the columns represents the mean values of the 15 patients and the vertical bars the standard error of the mean. The percentage of improvement in intercept values over 2 weeks is listed above the 2 weeks’ columns and can be compared with the values of healthy controls (chequered columns).
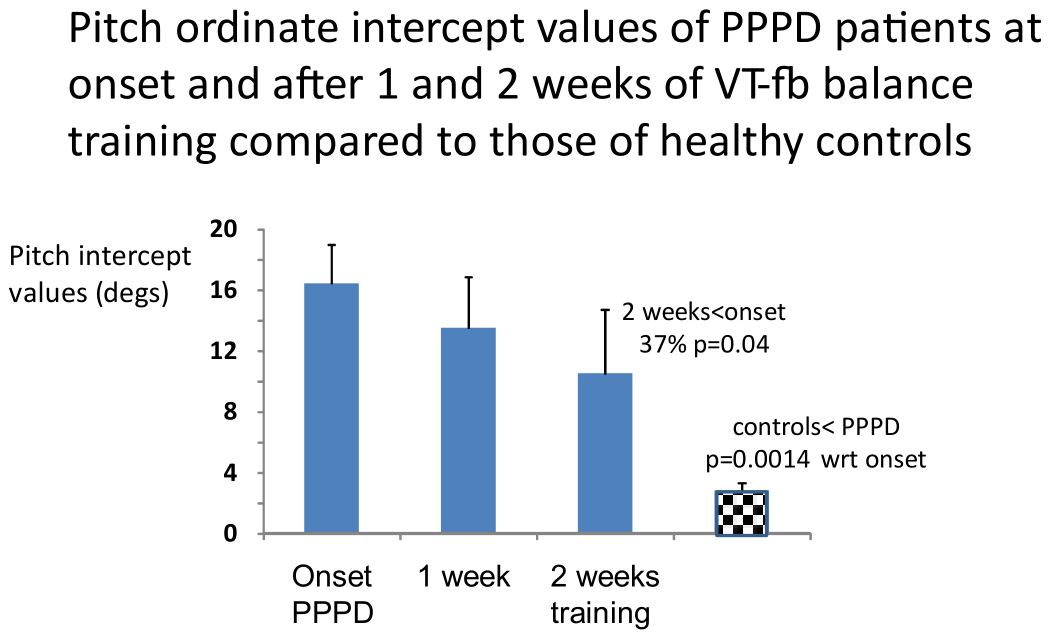
Figure 6.
Decreases in Balance Control Index (BCI) and Dizziness Handicap Inventory (DHI) values for PPPD patients after 2 weeks of vibro-tactile feedback training. The height of the columns represents the mean values of the 15 patients and the vertical bars the standard error of the mean. The significance of the decrease over 2 weeks, p=0.003 and p=0.019 respectively, is listed above the 2 weeks’ columns. At 1 week, the decreases were not significant. A horizontal arrow on the BCI ordinate marks the upper 95% of normal values. A horizontal arrow on the DHI ordinate marks the upper level of a weak influence of dizziness on daily living [33].
Figure 6.
Decreases in Balance Control Index (BCI) and Dizziness Handicap Inventory (DHI) values for PPPD patients after 2 weeks of vibro-tactile feedback training. The height of the columns represents the mean values of the 15 patients and the vertical bars the standard error of the mean. The significance of the decrease over 2 weeks, p=0.003 and p=0.019 respectively, is listed above the 2 weeks’ columns. At 1 week, the decreases were not significant. A horizontal arrow on the BCI ordinate marks the upper 95% of normal values. A horizontal arrow on the DHI ordinate marks the upper level of a weak influence of dizziness on daily living [33].
Disclaimer/Publisher’s Note: The statements, opinions and data contained in all publications are solely those of the individual author(s) and contributor(s) and not of MDPI and/or the editor(s). MDPI and/or the editor(s) disclaim responsibility for any injury to people or property resulting from any ideas, methods, instructions or products referred to in the content. |
© 2026 by the authors. Licensee MDPI, Basel, Switzerland. This article is an open access article distributed under the terms and conditions of the Creative Commons Attribution (CC BY) license.
Copyright: This open access article is published under a Creative Commons CC BY 4.0 license, which permit the free download, distribution, and reuse, provided that the author and preprint are cited in any reuse.


