

Submitted:
24 July 2026
Posted:
27 July 2026
You are already at the latest version
Abstract
Battery swapping stations can shorten the charging service time of electric-vehicles, but the value of their operation depends on the coordination between high-power battery charging and renewable generation on one hand, and storage dispatch and tariff-driven grid exchange on the other. This paper develops a linear programming-based optimal power flow model for a grid-connected Battery Swapping Station incorporating photovoltaic generation, wind turbines, and a battery energy storage system. The proposed model manages eight power flow paths among the photovoltaic array, wind turbines system, battery energy storage system, utility grid, and battery swapping station demand. Its objective is to minimize the combined cost associated with electricity purchased from the grid and battery degradation while simultaneously maximizing revenue obtained through feed-in tariffs from surplus renewable generation. A 24-hour case study was conducted by integrating high and low demand season scenarios with a heavy duty battery swapping station demand profile, alongside Cape Town renewable resource data and South African time-of-use tariffs, to examine seasonal demand variations under both weekday and weekend operating conditions. The optimization results reduce the daily grid electricity expenditure from ZAR 7,676.39 to ZAR 564.81 during high-demand weekdays, from ZAR 4,093.28 to ZAR 1,330.89 during low-demand weekdays, and from ZAR 3,256.88 to ZAR 380.89 during low-demand weekends. Based on the analyzed operating conditions, the proposed energy management strategy yields estimated annual savings of approximately ZAR 1.389 million, with an expected discounted payback period of about five years. These findings demonstrate that coordinated dispatch of renewable generation and battery storage can substantially reduce dependence on grid electricity for Battery Swapping Station operation, although the overall economic performance remains strongly influenced by electricity tariff structures, demand characteristics, and assumptions regarding capital investment and operating costs.
Keywords:
electric vehicle battery swapping station
; optimal power flow
; linear programming
; battery energy storage system
; energy management system
; time-of-use electricity pricing
1. Introduction
The global transportation sector is experiencing a profound transformation as governments and industries seek effective strategies to reduce greenhouse gas (GHG) emissions, improve energy security, and achieve long-term climate objectives. This transition is critical as transportation remains one of the largest contributors to energy-related carbon dioxide (CO2) emissions, accounting for nearly 23% of global emissions from the energy sector [1,2,3,4]. Consequently, the widespread adoption of electric vehicles (EVs) has become an important pathway toward achieving the carbon neutrality goals established under the Paris Agreement. As EV deployment continues to accelerate worldwide, the growing demand for electricity presents new operational challenges for existing power systems. Uncontrolled charging activities can increase peak electricity demand, create voltage instability, and raise operating costs for electricity suppliers [5,6,7,8,9,10]. These challenges highlight the importance of developing intelligent charging infrastructure supported by advanced energy management techniques.
Among the available EV charging technologies, Battery Swapping Stations (BSSs) have emerged as an attractive alternative to conventional plug-in charging systems. Unlike direct charging, which requires users to wait for the EV battery to recharge, the BSS model decouples the charging process from the vehicle usage. This allows for the rapid replacement of a depleted EV battery with a fully charged one in a matter of minutes, which directly and effectively addresses user concerns regarding range anxiety and long charging durations [11,12,13]. From a grid perspective, BSSs offer unique advantages as flexible loads. The aggregated EV batteries within a battery swapping station can be charged during periods of low electricity prices, allowing the charging process to be decoupled from vehicle arrival times. This operational flexibility enables charging schedules to be shifted away from high-price periods, while the integrated battery energy storage system and renewable energy sources support battery swapping demand when electricity prices are high or renewable generation is limited. Consequently, the coordinated operation of these energy resources improves operational flexibility, reduces dependence on the utility grid, and enhances the overall economic performance of the battery swapping station [14,15,16].
Despite these operational advantages, the sustainability and economic performance of BSSs depend heavily on the energy sources used to charge the batteries. A station supplied primarily by fossil-fuel-based electricity cannot fully realise the environmental benefits associated with electric mobility [17,18]. Integrating renewable energy technologies, particularly photovoltaic (PV) and wind turbine (WT) systems, offers an effective approach for reducing carbon emissions and lowering dependence on conventional electricity generation. Nevertheless, renewable energy resources are inherently intermittent and weather-dependent, making reliable station operation more challenging. Variations in renewable generation, together with uncertain battery swapping demand, may increase renewable energy curtailment or require additional electricity imports from the utility grid [19,20].
To address these challenges, Battery Energy Storage Systems (BESSs) are increasingly incorporated into renewable-powered BSSs. A stationary BESS stores surplus renewable electricity during periods of excess generation and releases the stored energy when renewable production is insufficient or swapping demand increases. Besides enhancing system reliability, the BESS enables energy arbitrage by charging during low-tariff periods and discharging when electricity prices are high, thereby reducing operating costs while improving renewable energy utilisation [21,22,23,24,25]. Consequently, the operation of a grid-connected BSS integrating renewable generation and battery storage represents a complex optimisation problem involving multiple, often competing, objectives. Effective operation requires coordinated management of renewable generation, battery storage, electricity market tariffs, and battery swapping demand while maintaining acceptable battery state-of-charge (SoC) limits.
Existing research on battery swapping stations has evolved along several complementary directions. One of the strands focuses on the siting of facilities, network planning and capacity allocation where the major issue is the spatial distribution of swapping infrastructure and its interaction with highway or distribution-network constraints [26,27,28,29,30,31]. A second strand looks at scheduling and operational control, both including the effects of queues, real-time energy management, response to tariffs, and coordination with microgrids or distribution networks [32,33,34,35,36,37]. A third body of research associates EV charging or BSS operation with renewable energy and storage, which demonstrate that photovoltaic, wind, and battery resources can decrease grid reliance when their dispatch is synchronized with demand and tariffs [15,16,19,20,23].
These contributions are technically useful, yet to some extent they indicate a gap in modelling. Siting models tend to be too much aggregate to describe the hour-by-hour interaction of renewable availability, storage state, grid purchase, and feed-in revenue [27,30]. Scheduling studies provide more operation detail, although many focus on either grid-connected BSS dispatch, photovoltaic integration, or demand response as individual problems but not as a coupled power-flow problem across PV, wind, BESS, grid import, and grid export paths [33,35,36]. Renewable-assisted EV infrastructure studies further suggest that storage can enhance the utilization of renewables, yet the economic worth of that storage is dependent on the tariff asymmetry, the form of charging demand, and when renewable is generated [15,38,39]. The implication here is that a BSS cannot be considered as simply a load, a storage asset, or a renewable off-taker but rather as a functioning node with these roles being concurrent.
In this regard, this paper formulates an optimal power-flow model that is based on a linear programming model in relation to a grid-connected EV BSS fed by solar PV, wind generation, and a stationary BESS. The model expressly coordinates eight paths of power flows among the PV system, wind turbine system, BESS, utility grid and BSS charging demand. Its aim is to reduce weighted grid-purchase and storage-wear costs and take into consideration feed-in revenue as a result of excess renewable generation. Unlike formulations that need a mixed-integer structure, the current formulation is not enforced to be binary or integer and to have unit-commitment or charger on/off states.
The paper makes three contributions. First, it develops a reproducible power-flow model of an integrated BSS–PV–WT–BESS–grid system, which has explicit balance equations, SoC limits, and terminal storage constraints. Second, it analyzes the model with four tariff and resource conditions which differentiate between high- and low-demand seasons and weekday/weekend periods of TOU. Third, it correlates the short-horizon dispatch results to annualized savings and discounted payback analysis, and thus bridges the gap between operational optimization and investment-level economic interpretation. The remainder of this paper is organised as follows. Section 2 presents the mathematical formulation of the proposed optimisation model. Section 3 describes the case study, input data, and modelling assumptions. Section 4 discusses the simulation results and their implications. Finally, Section 5 summarises the main findings and outlines recommendations for future research.
2. Mathematical Model Formulation
This section defines the deterministic dispatch model used to evaluate the integrated BSS–PV–WT–BESS–grid system. The formulation is written for an hourly horizon because the available BSS load, renewable-resource, and TOU tariff data are hourly. The decision variables are the controllable power flows – shown in Figure 1, the model therefore represents operational dispatch rather than long-term component sizing or stochastic planning.
2.1. Schematic Model Layout Description
Figure 1 illustrates the configuration of the proposed grid-connected hybrid renewable energy system designed to supply power to an electric vehicle battery swapping station (BSS). The system consists of photovoltaic (PV) panels, vertical-axis wind turbines (WTs), a battery energy storage system (BESS), the utility grid, and the EV battery swapping station. Within the BSS, depleted EV batteries are recharged while fully charged batteries are made available for vehicle battery replacement. The energy exchange among the system components is represented by eight power flow pathways, denoted as – . Specifically, denotes the power supplied from the PV system to the BSS, represents the power transferred from the PV system to the BESS for energy storage, and corresponds to the surplus PV power exported to the utility grid. Similarly, is the power delivered by the wind turbines to the BSS, is the wind-generated power stored in the BESS, and represents excess wind power injected into the utility grid. The discharge power supplied from the BESS to the BSS is represented by , while denotes the electricity imported from the utility grid to satisfy the remaining charging demand. The proposed energy management strategy prioritizes renewable energy utilization to maximize operational efficiency and reduce dependence on the utility grid. Under normal operating conditions, electricity generated by the PV and wind systems is first allocated to satisfy the charging demand of the battery swapping station. When renewable generation exceeds the instantaneous load demand, the excess energy is directed to the BESS until its storage capacity is reached. Once the BESS is fully charged, any remaining surplus renewable energy is exported to the utility grid through the feed-in tariff (FIT) mechanism. Conversely, when renewable generation is insufficient to meet the charging demand, the BESS supplies the required deficit provided that its state of charge remains above the minimum allowable limit. If the available stored energy is inadequate, the utility grid provides the remaining power required to maintain uninterrupted battery swapping operations. This coordinated power dispatch strategy enables efficient utilization of renewable energy resources, enhances the operational flexibility of the BSS, and minimizes electricity procurement costs under the adopted optimal power flow management framework.
2.2. Sub-Models of the Proposed System Components
The following sections provide a detailed overview of the proposed system by presenting the mathematical models and operational characteristics of its various components.
2.2.1. Wind Turbine System
The wind turbine (WT) converts the kinetic energy contained in the movement of air into electrical energy. In the proposed system, the WT is modeled as an alternating-current (AC) power source whose output depends primarily on the prevailing wind speed at the turbine hub. Electricity generation begins once the wind velocity reaches the cut-in wind speed (). As the wind speed increases beyond this threshold, the generated power increases until the rated wind speed () is attained. Between the rated and cut-out wind speeds, the turbine continues to operate at its rated power output. When the wind speed exceeds the cut-out value (), the turbine is automatically disconnected to prevent mechanical damage and ensure safe operation. The resulting power output of the wind turbine is described by Equation (1) [40].
where denotes the wind speed at time interval t, is the cut-in wind speed, is the rated wind speed, represents the cut-out wind speed, and is the rated electrical power of the WT. The rated output power is determined using Equation (2).
In Equation (2), and denote the efficiencies of the turbine’s gearbox and the electrical generator, respectively. The parameter represents the air density (), is the turbine power coefficient that quantifies the fraction of available wind power converted into useful mechanical energy, is the area swept by the turbine rotor and corresponds to the rated wind speed.
Because the wind speed varies with elevation, the installation height of the turbine significantly influences the available wind resource and, consequently, the electrical power that can be generated. Wind speeds measured at one elevation can therefore be adjusted to another hub height using the power-law relationship expressed in Equation (3).
where is the measured wind speed at the reference height (), V is the wind speed measured at the height of the center (h), and denotes the surface roughness exponent, whose value depends on the characteristics of the surrounding terrain. Typically, exceeds 0.25 in densely vegetated or forested environments and is generally below 0.10 on smooth surfaces such as open water or flat terrain [41].
Within the proposed hybrid energy system, the electrical power generated by the WT is distributed among three destinations: the battery swapping station through , the battery energy storage system through , and the utility grid through . The power balance governing these energy flows is given by Equation (4).
To ensure physically realistic operation, the WT output is restricted within its allowable operating range. The minimum output power is zero when the wind speed is below the cut-in threshold or exceeds the cut-out limit, whereas the maximum output cannot exceed the turbine’s rated capacity. This operating constraint is represented by Equation (5).
2.2.2. Solar Photovoltaic System
The solar photovoltaic (PV) system converts incident solar radiation directly into direct-current (DC) electrical energy and is modeled as a renewable generation source with output that varies according to environmental conditions. Since the availability of solar energy changes throughout the day, the electrical power produced by the PV array is inherently intermittent. The generated power is primarily influenced by the intensity of solar irradiation, the conversion efficiency of the PV modules, the operating temperature, and the total effective surface area of the installed panels. The instantaneous electrical power produced by the PV array is determined using Equation (6) [42].
where denotes the electrical power generated by the PV array, is the total surface area of the PV modules exposed to solar radiation, represents the incident solar irradiance, and is the overall energy conversion efficiency of the PV system. The conversion efficiency is calculated using Equation (7).
In Equation (7), represents the reference conversion efficiency of the PV module under standard test conditions at the reference cell temperature typically 25°C, while denotes the temperature coefficient that accounts for the reduction in efficiency as the cell temperature increases (typically 0.004 – 0.005 per °C). The parameter corresponds to the average hourly solar irradiance under nominal operating conditions (0.8 ), while (typically 45°C) and (typically 20°C) denote the cell and ambient temperatures under nominal test conditions, respectively.
The amount of solar irradiation received by a PV array continuously varies with meteorological and geographical conditions. Factors such as time of day, seasonal variation, installation orientation, panel tilt angle, site latitude, and the proportions of direct and diffuse solar radiation all influence the total incident irradiance. Consequently, the hourly solar irradiation received by the PV array is expressed by Equation (8).
where and denote the beam and diffuse components of solar irradiation at the time interval t, respectively, while is the geometric correction factor that relates the beam radiation incident on the inclined PV surface to that received on a horizontal plane.
The overall electrical output of the photovoltaic system depends not only on the power generated by an individual module but also on the total number of PV panels installed. If represents the number of photovoltaic modules, the total power generated by the complete PV system at the time interval t is determined using Equation (9).
Within the proposed hybrid renewable energy system, the electrical power generated by the PV array is distributed among three possible destinations. Power supplies the battery swapping station, charges the battery energy storage system, and exports surplus electricity to the utility grid. The corresponding power balance relationship is given by Equation (10).
The operating output of the photovoltaic system is limited by its installed capacity. Consequently, the generated power cannot be negative and must remain within the maximum rated capacity of the PV installation. This operational constraint is represented by Equation (11).
2.2.3. Battery Energy Storage System
The battery energy storage system (BESS) is incorporated into the proposed EV battery swapping station to improve operational flexibility, enhance the utilisation of renewable energy, and reduce dependence on electricity supplied by the utility grid. By storing surplus energy generated from the photovoltaic (PV) and wind turbine (WT) systems, the BESS can supply electricity whenever renewable generation is insufficient or when battery swapping demand exceeds the available renewable power. In addition to improving system reliability, the BESS enables peak-load management, energy arbitrage under time-of-use (TOU) tariffs, and uninterrupted operation during grid outages or scheduled load-shedding events. Consequently, integrating energy storage enhances both the economic and operational performance of the hybrid renewable energy system.
The operating condition of the BESS is characterised by its state of charge (SoC), which represents the amount of stored energy available at any given time. The SoC continuously changes according to the balance between charging and discharging processes. During periods of surplus renewable generation, electrical energy from the PV and WT systems is stored in the BESS, increasing its SoC. Conversely, when renewable generation is insufficient to satisfy the charging requirements of depleted EV batteries, the stored energy is discharged, causing the SoC to decrease. The temporal evolution of the BESS SoC therefore depends on the initial storage level together with the charging and discharging power exchanged during each sampling interval.
In practical applications, battery systems are not ideal because energy losses occur during charging, discharging, and self-discharge while the battery remains idle. These inefficiencies must therefore be incorporated into the mathematical model to accurately represent the actual storage behaviour. Considering charging efficiency, discharging efficiency, and self-discharge losses, the SoC of the BESS at time is determined using Equation (12) [38].
where denotes the battery state of charge at sampling interval t, represents the battery self-discharge rate, and are the charging and discharging efficiencies of the BESS, respectively, and is the nominal energy capacity of the storage system. The charging power supplied by the PV array and WT is represented by and , respectively, while denotes the power discharged from the BESS to satisfy the battery swapping station demand. The parameter represents the sampling interval used in the optimization model.
Using Equation (12), the state of charge at any sampling interval can be expressed recursively in terms of the initial battery condition. Consequently, the cumulative SoC over the optimization horizon is obtained using Equation (13) [38].
where represents the initial state of charge of the battery energy storage system at the beginning of the optimization period.
To ensure reliable operation and extend battery service life, the BESS must operate within its permissible state-of-charge limits. Excessive charging may accelerate battery degradation, whereas excessive discharging can shorten battery lifespan and reduce system reliability. Therefore, the SoC is constrained to remain between predefined minimum and maximum operating limits throughout the scheduling horizon, as expressed by Equation (14).
The minimum allowable state of charge is determined from the specified depth of discharge (DoD), which defines the maximum proportion of stored energy that may be safely withdrawn from the battery. The relationship between the minimum SoC and the depth of discharge is given by Equation (15).
where denotes the maximum allowable depth of discharge of the battery, expressed as a percentage of its nominal energy capacity.
2.2.4. Utility Grid
The utility grid serves as the supplementary electricity source within the proposed hybrid renewable energy system, ensuring that the battery swapping station (BSS) continues to operate whenever the combined output from the photovoltaic (PV) system, wind turbine (WT), and battery energy storage system (BESS) is insufficient to satisfy the charging demand. Consequently, the grid provides operational support by maintaining a reliable electricity supply during periods of low renewable energy generation or high battery swapping demand.
Besides supplying electricity, the utility grid also enables bidirectional energy exchange. When the renewable generation exceeds the immediate demand of the BSS and the BESS has reached its available storage capacity, the surplus electricity generated by the PV and WT systems can be exported to the utility network. This capability allows the system operator to benefit from feed-in tariff (FIT) schemes while improving the utilization of renewable energy resources and reducing energy curtailment.
The total electrical energy imported from the utility grid over the optimization horizon is determined from the accumulated grid power supplied to the battery swapping station during each sampling interval. This relationship is expressed by Equation (16).
where denotes the electrical power imported from the utility grid to supply the battery swapping station at time interval t, and represents the duration of the sampling interval.
The cost associated with purchasing electricity from the utility grid depends on the applicable time-of-use (TOU) electricity tariff. Since electricity prices vary throughout the day, the optimization model schedules grid power purchases according to the prevailing tariff structure to minimize operating costs. The total expenditure on imported grid electricity is therefore calculated using Equation (17).
where represents the electricity tariff applicable during the sampling interval t, expressed in Rand per kilowatt-hour ().
Similarly, the total electrical energy exported from the hybrid renewable energy system to the utility grid is obtained by adding the surplus power generated by the photovoltaic and wind turbine systems over the optimization horizon, as represented by Equation (18).
where represents the electrical power exported from the photovoltaic system to the utility grid, while denotes the corresponding power exported from the wind turbine system.
Revenue generated from exporting renewable electricity is determined according to the feed-in tariff applicable to each renewable energy technology. The total income obtained from electricity sales is therefore evaluated using Equation (19).
where and denote the feed-in tariff rates for photovoltaic and wind-generated electricity, respectively, during the sampling interval t. Incorporating both electricity purchase costs and export revenue enables the optimization model to identify the most economically advantageous operating strategy while improving renewable energy utilization.
Finally, the power imported from the utility grid is constrained to remain within its permissible operating limits. Although the utility grid is assumed to have sufficient capacity to satisfy the required demand under normal operating conditions, the imported power must remain non-negative throughout the optimization period. This operating constraint is represented by Equation (20).
2.2.5. Battery Swapping Station Power Demand
A battery swapping station (BSS) is an EV charging facility that enables drivers to replace depleted batteries with fully charged ones in a short period, thus eliminating the long waiting times associated with conventional plug-in charging methods [43,44]. A typical BSS consists of several battery charging units and swapping bays that allow multiple battery exchange operations to be performed simultaneously. The power demand of the battery swapping station is governed primarily by the charging requirements of depleted batteries that await future swapping operations [45]. Consequently, accurate modeling of the charging demand is essential to ensure that an adequate inventory of fully charged batteries is continuously available while maintaining efficient utilization of available energy resources.
The total electrical demand of the BSS depends on several factors, including the number of batteries that require charging, their energy capacities, battery technologies, initial state of charge (SoC), and the selected charging strategy. Since multiple batteries may be charged concurrently, the overall charging and discharging power of the station is obtained by summing the contributions of all batteries undergoing the charging process. The aggregate charging and discharging powers of the battery swapping station are expressed by Equations (21) and (22), respectively.
where n denotes the total number of EV batteries depleted available for charging, represents the total charging power of the station at the sampling interval t and is the corresponding total discharging power. Furthermore, and denote the charging and discharging powers associated with the EV battery, respectively.
Each battery stored within the swapping station undergoes charging and, where applicable, discharging processes in accordance with its operating characteristics. The state of charge of an individual battery varies throughout the charging cycle and provides a measure of the remaining stored energy relative to its nominal capacity. Taking into account the charging efficiency and energy exchange during each sampling interval, the SoC of the EV battery is determined using Equation (23) [37].
where represents the duration of the sampling interval, while denotes the charging efficiency of the EV battery. The battery charging efficiency is calculated using Equation (24).
During the battery swapping operation, a fully charged battery is removed from the charging inventory and immediately exchanged with a depleted battery received from an arriving electric vehicle. At the instant of battery exchange, the battery participating in the swapping process is considered unavailable for charging or discharging, and its associated charging power, discharging power, and state of charge are therefore reset in accordance with the operational conditions defined in the optimization model. The total charging demand of the BSS is evaluated by aggregating the discretized charging power of all depleted EV batteries connected to the station. Based on the charging capacity of the BSS, the total power required to recharge the n depleted EV batteries at time t can be calculated using Equation (25).
where is the cumulative charging power demand associated with all depleted EV batteries undergoing charging at the battery swapping station at time .
2.3. Optimization Problem Formulation and Proposed Algorithm
The proposed optimization framework aims to determine the optimal power dispatch strategy that minimizes the total operational energy cost while ensuring that the battery swapping station demand is fully supplied through the coordinated scheduling of utility grid power, photovoltaic generation, wind energy, and EV battery storage. In addition, the optimization model considers the cost of battery degradation resulting from EV battery discharge, thereby enhancing the long-term economic performance of the system.
2.3.1. Objective Function
The objective function is formulated as a weighted multi-objective optimization problem. It combines three economic performance indicators into a single objective, namely: (i) minimization of the electricity procurement cost from the utility grid, (ii) minimization of battery degradation resulting from charging and discharging operations, and (iii) maximization of the revenue generated from exporting excess renewable energy. Appropriate weighting coefficients are introduced to balance the relative importance of these competing objectives according to the operational priorities of the system. The mathematical formulation of the objective function is presented in Equation (26).
where , and are weighting factors, is the TOU grid-purchase tariff, and are the PV ana WT feed-in tariffs, respectively, is the grid-to-EV BSS power flow from, is the BESS-to-EV BSS discharge power flow, is the PV-to-grid export power flow, is the WT-to-grid export power flow, is the sampling time, N is the number of sampling intervals, is the BESS wearing cost coefficient, and a is the hourly auxiliary operating cost. The weighting factor satisfy .
2.3.2. System Constraints
The optimization model is subject to several operational constraints that guarantee the feasible operation of the proposed battery swapping station. These include the power balance constraint, renewable energy generation limits, battery state-of-charge constraints, power flow limits, and the terminal state-of-charge requirement. The corresponding mathematical formulations are given in Equations (27)–(32).
-
Power balanceThe total charging demand at each sampling interval must be supplied by the available energy sources, as expressed in Equation (27).
-
Wind turbine power supplyThe combined wind power supplied to the battery swapping station and the battery energy storage system cannot exceed the available wind power generation, as given in Equation (28).
-
Solar PV power supplyThe photovoltaic power allocated to the battery swapping station, battery energy storage system, and utility grid is limited by the available PV generation, as described by Equation (29).
-
State of charge of the BESSThe state of charge of the battery energy storage system is maintained within its prescribed operating limits throughout the optimization horizon, as defined in Equation (30).
-
Power flow limitsThe power exchanged through each energy pathway is restricted by its corresponding minimum and maximum operating limits, as shown in Equation (31).which defines the upper and lower bounds for each source power output and where i = 1,2,3,..,8 is the index of power flows, is the maximum limits for each decision variable at the sampling time t.
-
Fixed-final state condition for the BESSTo ensure sustainable battery operation, the battery energy storage system is required to satisfy the fixed-final state condition at the end of the optimization period, as formulated in Equation (34).
2.3.3. Algorithm for Solving the Optimization Problem
The dispatch problem manages the hourly power-flow vector to minimize the objective function in (26) subject to the balance, generation, SoC, power-flow, and terminal-storage constraints. Because the objective function and constraints are linear in the decision variables, the problem is solved as a linear programming model in MATLAB R2025a using the OPTI toolbox with SCIP 1. If future versions introduce binary charger-status, import/export exclusivity, or unit-commitment variables, the formulation would become a mixed-integer linear program; these binary variables are not imposed in the present dispatch model. The canonical form is given as follows
subject to:
where represents the objective function, A and b represent the coefficients corresponding to the inequality constraints, and represent the coefficients corresponding to the equality constraints, and are the lower and upper bounds of the decision variables.
3. Case Study Data
The case study is constructed to evaluate dispatch behaviour under a heavy-duty BSS demand profile and South African renewable-resource and tariff conditions. The BSS demand profile is taken as a representative high-power commercial swapping profile, while the renewable and tariff inputs correspond to Cape Town and Eskom TOU pricing. This design should therefore be interpreted as a techno-economic transfer case rather than as a direct historical reconstruction of one physical BSS site. The charging demand is supplied by WT generation, PV generation, BESS discharge, and grid import; surplus renewable generation is either stored in the BESS or exported to the utility grid.
3.1. EV BSS Power Demand Load Profile
The EV BSS load profile is based on a heavy-duty truck swapping station at a central logistics hub in Shanghai Port, China. Heavy-duty BSS demand is appropriate for this study because commercial swapping stations typically impose larger, less deferrable charging requirements than private light-duty charging, which makes storage coordination and tariff response more consequential for grid-connected operation [24,30,33]. Figure 2 and Figure 3 show representative weekday and weekend BSS demand profiles used as the charging load in the dispatch model. These profiles are used to test whether the hybrid renewable-BESS system can meet a high-power swapping load while reducing grid-energy expenditure under TOU prices.
3.2. Renewable Energy Power Supply
The renewable-resource inputs are derived from Cape Town wind-speed, solar-radiation, and ambient-temperature data [46]. Cape Town is used because South African EV infrastructure is exposed to tariff volatility and grid-reliability concerns that make local renewable generation and storage economically relevant [47,48,49]. Figure 4 and Figure 5 present hourly wind-speed profiles for the high- and low-demand seasons, respectively. The high-demand profile has an average wind speed of 2.54 m/s, with the highest values between 14:00 and 16:00; the low-demand profile has an average wind speed of 3.27 m/s, with the highest values between 09:00 and 10:00. Figure 6 and Figure 7 present corresponding short-wave solar-power profiles, with peak values of approximately 0.67 kW/m2 in the high-demand season and 0.79 kW/m2 in the low-demand season. Figure 8 and Figure 9 provide annual wind and solar-resource profiles used to contextualize the seasonal cases.
3.3. Time-of-Use Electricity Tariff
The electricity pricing structure considered in this study follows the 2023/2024 Eskom Megaflex time-of-use (TOU) tariff, which is regulated by the National Energy Regulator of South Africa (NERSA). The TOU tariff provides economic incentives for shifting electricity consumption to lower-cost periods while reducing demand during peak-price intervals. It also allows surplus renewable energy to be exported to the utility grid after meeting the battery swapping station demand. Electricity prices are classified into off-peak (), standard (), and peak () periods, with separate tariff schedules for the high-demand (June–August) and low-demand (September–May) seasons. The corresponding weekday and weekend TOU tariff functions used in the optimization model are given in Equation (35)–(38). 2.
High demand season for weekdays and weekends:
Low demand season for weekdays and weekends:
Here, ZAR denotes South African Rand, t denotes hour of day, and denotes the tariff applied to grid imports. The weekend tariffs in (36) and (38) include only off-peak and standard periods. Feed-in tariffs for distributed renewable energy are regulated through South African electricity-market rules administered by NERSA 3. The case study uses feed-in values of 1.12 ZAR/kWh for PV export and 1.0398 ZAR/kWh for WT export. In the optimization model, export is permitted only after BSS demand and BESS charging priorities have been considered through the power-balance and storage constraints.
4. Simulation Results and Discussion
This section evaluates the performance of the proposed optimization framework under different operating conditions and examines its effectiveness in managing energy flows within the grid-connected hybrid renewable energy system. The analysis focuses on the coordinated operation of the photovoltaic (PV) system, wind turbine (WT), battery energy storage system (BESS), and utility grid in supplying the electrical demand of the battery swapping station (BSS). Particular attention is given to the influence of renewable energy availability, electricity tariff structures, and seasonal demand variations on the overall operational cost and system performance.
The optimization model was implemented in MATLAB using the SCIP solver available through the OPTI Toolbox. Simulations were performed over a 24-hour scheduling horizon with an hourly sampling interval ( = 1h), beginning at 00:00. The optimization determines the optimal hourly power dispatch among all available energy sources while satisfying the operational constraints described in the previous section. The complete set of simulation parameters adopted in this study is summarized in Table 1.
To demonstrate the robustness of the proposed energy management strategy, four representative operating scenarios are investigated. These scenarios capture the combined effects of seasonal electricity demand, renewable energy availability, and weekday/weekend TOU electricity tariffs. The comparative analysis provides valuable insight into how different operating conditions influence renewable energy utilization, battery dispatch, grid energy consumption, electricity expenditure, and the overall economic performance of the battery swapping station.
4.1. High Demand Electricity Pricing Season
4.1.1. Scenario 1: Optimal Operational Strategy During a Representative Weekday in the High-Demand Season (June–August)
Figure 10 illustrates the optimal hourly power dispatch of the proposed grid-connected PV–WT–BESS hybrid energy system for a representative winter weekday during the high-demand electricity pricing season. The figure shows the respective contributions of the photovoltaic system (), wind turbine (), BESS (), and utility grid () in supplying the charging demand of the BSS. The optimization strategy dynamically allocates power among these sources according to renewable energy availability, electricity tariff periods, and battery operating conditions to minimize the overall operating cost. During the off-peak tariff periods (00:00 – 06:00 and 22:00 – 24:00), the optimization primarily utilises electricity imported from the utility grid to satisfy the BSS charging demand. This operating strategy is economically advantageous because electricity prices are at their lowest during these hours, while renewable energy generation is either unavailable or extremely limited. Consequently, importing low-cost grid electricity during off-peak periods reduces operating expenses while preserving the stored energy in the BESS for periods when electricity becomes more expensive. Following sunrise, increasing solar irradiance progressively enhances the contribution of the photovoltaic system. As PV generation rises throughout the morning, dependence on grid electricity decreases substantially. In contrast, wind power exhibits natural fluctuations during the day because of variations in wind speed. Despite this variability, wind generation complements photovoltaic production and contributes additional renewable energy that improves supply reliability and reduces the need for electricity imports. The BESS plays a key role in balancing the hybrid energy system. During periods of surplus renewable generation, excess electricity produced by the PV and WT systems is stored in the BESS instead of being wasted. The stored energy is subsequently discharged during high-tariff periods, particularly between 06:00 – 09:00 and again when renewable generation declines during the evening (17:00 – 19:00). This charging and discharging strategy effectively shifts renewable energy from periods of abundance to periods of high electricity prices, thereby lowering grid energy purchases while maintaining a reliable supply to the battery swapping station. Although renewable generation and battery storage satisfy most of the station demand during expensive tariff periods, limited grid support remains necessary during certain morning intervals when the combined output of the PV system, WT system, and BESS is insufficient to meet the instantaneous charging demand. Nevertheless, the optimization significantly reduces reliance on the utility grid compared with a conventional grid-only charging strategy. During the standard tariff periods (09:00 – 17:00 and 19:00 – 22:00), renewable generation becomes the dominant energy source supplying the battery swapping station. In addition to meeting the charging demand, surplus renewable electricity is directed to the battery energy storage system whenever additional storage capacity is available. This operating strategy increases renewable energy utilization while preparing the storage system to support the evening demand period.
Figure 11 presents the optimal power exchange associated with the battery energy storage system. The charging power supplied by the photovoltaic array () and the wind turbine (), together with the battery discharge power (), clearly demonstrate the coordinated operation achieved by the optimization algorithm. Whenever renewable generation exceeds the instantaneous charging demand of the battery swapping station, the excess energy is stored in the BESS. Conversely, during periods of reduced renewable generation or elevated electricity tariffs, the stored energy is released to support the charging demand, thereby reducing the requirement for expensive electricity imports from the utility grid. This coordinated charging and discharging behaviour highlights the important role of the BESS in improving both system flexibility and operational economics.
The corresponding state-of-charge (SoC) profile of the battery energy storage system is illustrated in Figure 12. The SoC increases steadily during the daytime, particularly between 09:00 and 17:00, when photovoltaic generation reaches its highest output and sufficient renewable energy is available for battery charging. As solar production decreases later in the day and electricity prices remain relatively high, the BESS begins to discharge to support the battery swapping station, resulting in a gradual reduction in the stored energy level. Throughout the simulation period, both the minimum and maximum SoC limits, together with the terminal SoC requirement, are fully satisfied. This confirms that the optimization algorithm successfully maintains feasible battery operation while ensuring long-term operational reliability and battery health.
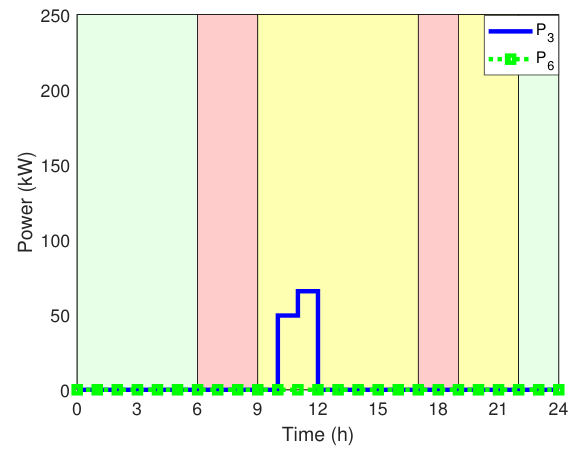
The hybrid renewable energy system produces considerably higher electricity output during daylight hours than during night-time due to the contribution of solar photovoltaic generation. As illustrated in Figure 13, any renewable energy remaining after satisfying the BSS demand is exported to the utility grid, with the majority of the exported electricity originating from the PV system. Under the Eskom TOU tariff, operating the battery swapping station without the proposed hybrid renewable energy system results in a daily electricity expenditure of ZAR 7,676.39. By applying the proposed optimal power flow management strategy, the daily electricity cost is reduced substantially to ZAR 564.81. In addition, the export of surplus renewable electricity during the selected weekday generates a feed-in tariff (FIT) revenue of ZAR 129.00, predominantly from photovoltaic generation. These results demonstrate that the coordinated operation of the utility grid, renewable energy sources, and battery storage effectively minimizes electricity procurement costs while ensuring compliance with the TOU pricing framework.
Overall, the results demonstrate that the proposed optimization framework effectively coordinates renewable energy generation, battery storage, and utility grid interaction to minimize electricity procurement costs during the high-demand season. By strategically storing surplus renewable energy and discharging it during expensive tariff periods, the proposed approach substantially reduces dependence on the utility grid while maintaining uninterrupted operation of the battery swapping station.
Figure 10.
Charging demand side power flows.
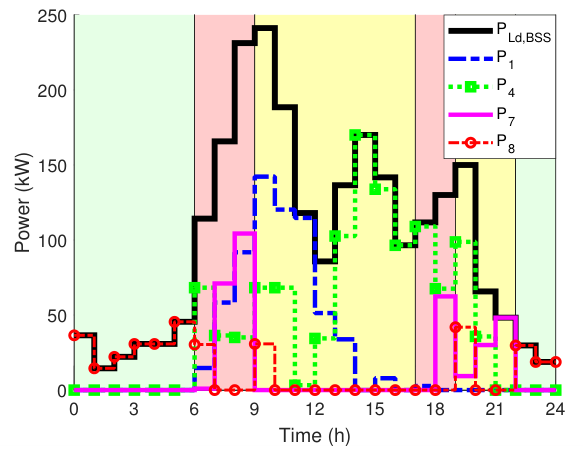
Figure 11.
BESS side power flows.
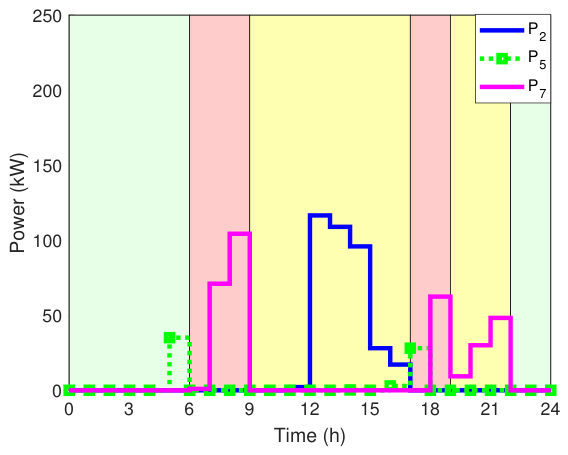
Figure 12.
BESS SoC.
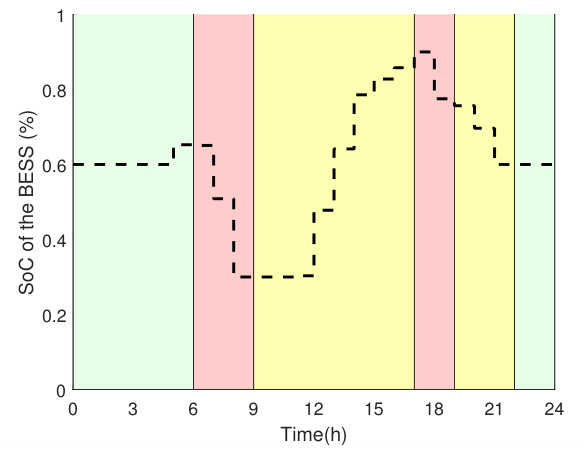
Figure 13.
Hybrid power to the Grid.
4.1.2. Scenario 2: Optimal Operational Strategy During a Representative Weekend in the High-Demand Season (June–August)
Figure 14 presents the optimal hourly power dispatch of the proposed PV–WT–BESS hybrid energy system for a representative winter weekend during the high-demand electricity pricing season. The figure illustrates the contributions of the PV system (), WT (), BESS (), and utility grid () in satisfying the charging demand of the BSS. Compared with the weekday scenario, the weekend electricity tariff structure modifies the optimal dispatch strategy, resulting in a different balance between renewable energy utilization, battery operation, electricity imports, and renewable energy exports. During the off-peak tariff periods, the optimization relies primarily on electricity imported from the utility grid to supply the battery charging demand. At these times, renewable generation remains limited because of low solar irradiance and naturally varying wind conditions, while the relatively low electricity price makes grid imports economically preferable. This operating strategy also preserves the stored energy in the BESS for periods when renewable resources become less available or when electricity prices increase. As solar irradiance increases after sunrise, photovoltaic generation progressively becomes the dominant energy source supplying the battery swapping station. Wind generation continues to complement the photovoltaic system throughout the day, although its contribution varies according to the prevailing wind conditions. The coordinated utilization of both renewable resources substantially reduces the requirement for electricity imported from the utility grid during daylight hours.
Figure 15 illustrates the corresponding power flows associated with the BESS. Excess renewable electricity generated by the PV and WT systems is directed to the BESS whenever the instantaneous charging demand has been satisfied. The stored energy is subsequently discharged during the standard tariff periods, particularly between 07:00 – 12:00 and 18:00 – 20:00, when renewable generation alone cannot fully satisfy the battery charging demand. This charging and discharging strategy enables the BESS to smooth the fluctuations in renewable generation while reducing electricity purchases from the utility grid.
The SoC profile of the BESS is presented in Figure 16. The BESS gradually accumulates energy during periods of high renewable generation, particularly around midday when PV output reaches its maximum. As renewable generation decreases later in the day, the stored energy is released to support the BSS, leading to a controlled reduction in the SoC. Throughout the optimization period, the SoC remains within its prescribed operating limits, and the terminal SoC constraint is fully satisfied, confirming that the proposed energy management strategy maintains technically feasible BESS operation without excessive charging or deep discharge.
Figure 17 shows the renewable electricity exported to the utility grid through PV and WT generation. Most of the exported energy occurs around midday when photovoltaic production exceeds both the battery swapping demand and the charging capacity of the battery energy storage system. Under weekend tariff conditions, the economic advantage of avoiding grid electricity purchases is lower than during weekdays because of the reduced electricity price differential. Consequently, exporting surplus renewable energy through the feed-in tariff mechanism becomes a more attractive operating strategy, increasing the financial contribution of electricity sales to the overall system performance. The economic performance of the proposed optimiZation strategy further demonstrates these operational differences. A conventional grid-supplied BSS incurs a daily electricity cost of ZAR 4,093.28, whereas the proposed hybrid dispatch reduces the grid electricity expenditure to ZAR 1,330.83 while simultaneously generating ZAR 643.56 through renewable electricity exports. Compared with the weekday case, the direct savings achieved from reducing grid electricity purchases are smaller because weekend tariff rates are generally lower. However, the increased export of surplus renewable energy compensates for part of this reduction, illustrating the ability of the optimization framework to adapt its operating strategy according to prevailing electricity market conditions.
Overall, the results indicate that the proposed optimization model effectively coordinates renewable generation, battery storage, and utility grid interaction under weekend operating conditions. Unlike the weekday scenario, where the primary economic benefit is obtained by avoiding expensive peak-period electricity purchases, the weekend strategy derives a greater proportion of its economic value from exporting surplus renewable energy. This adaptive operating behaviour demonstrates the flexibility of the proposed optimization framework and its ability to maximize economic performance under varying tariff structures and renewable resource conditions.
Figure 14.
Charging demand side power flows.
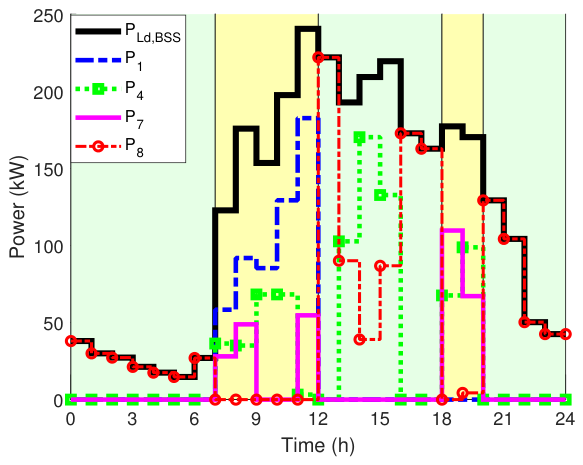
Figure 15.
BESS side power flows.
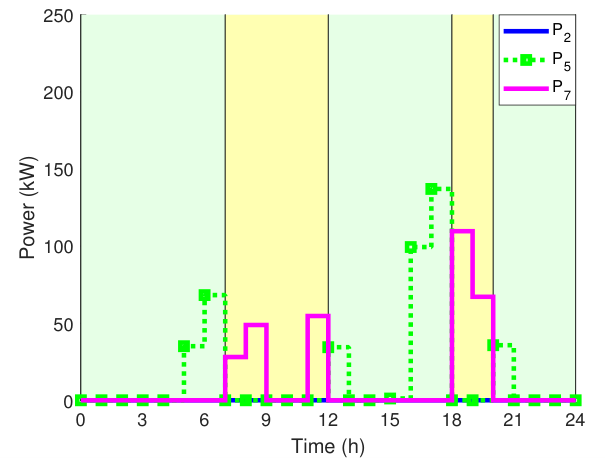
Figure 16.
BESS SoC.
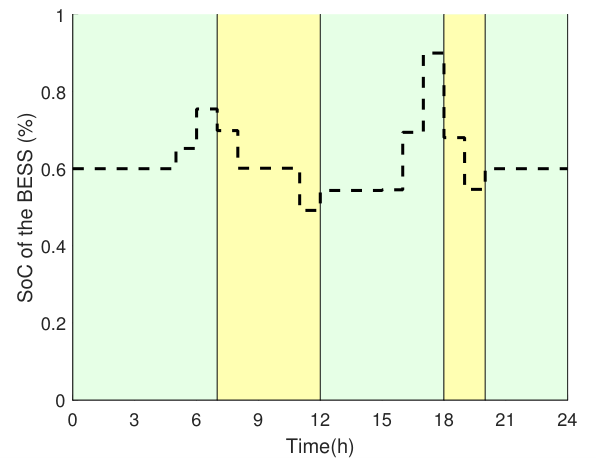
Figure 17.
Hybrid power to the Grid.
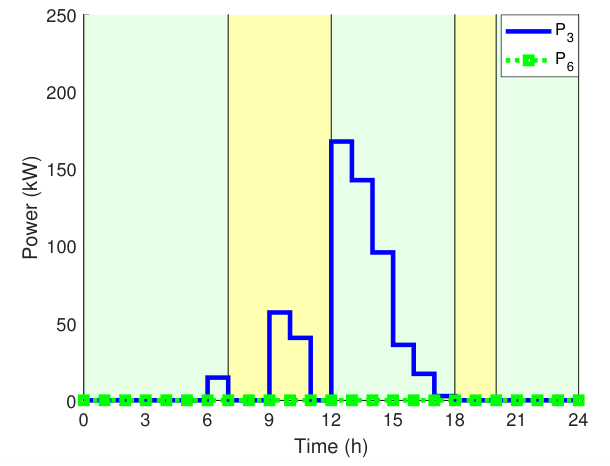
4.2. Low Demand Electricity Pricing Season
4.2.1. Scenario 3: Optimal Operational Strategy for a Representative Weekday During the Low-Demand Electricity Pricing Season (September–May)
Figure 18 illustrates the optimal hourly power dispatch of the proposed PV–WT–BESS hybrid energy system during a representative weekday in the low-demand electricity pricing season. The figure shows the respective contributions of the PV system , WT , BESS , and utility grid in supplying the charging demand of the battery swapping station. The optimization algorithm schedules these energy sources according to renewable energy availability, battery operating conditions, and the applicable TOU electricity tariffs to minimize the daily operating cost. During the off-peak tariff periods (00:00 – 06:00 and 22:00 – 24:00), the battery swapping station is supplied mainly by electricity imported from the utility grid. This operating strategy is economically justified because electricity prices are lowest during these periods, while renewable generation remains limited owing to the absence of solar irradiation and relatively low wind power availability. Consequently, the optimization preserves the stored energy in the BESS for later use when renewable generation decreases or electricity prices become comparatively higher. Following sunrise, PV generation increases steadily as solar irradiance intensifies throughout the morning. The additional solar power progressively replaces electricity imported from the utility grid, thereby reducing dependence on conventional electricity supply. Wind generation complements PV generation during the day, although its contribution varies according to the prevailing wind conditions. The combined utilization of these renewable resources enables the BSS to satisfy a large proportion of its charging demand without relying heavily on the utility grid.
Figure 19 presents the corresponding power flows associated with the battery energy storage system. The charging power supplied by the PV system and the WT , together with the BESS discharge power , demonstrate the coordinated operation achieved by the optimization model. Whenever renewable generation exceeds the instantaneous charging demand, surplus electricity is stored in the BESS. The stored energy is subsequently discharged during periods when renewable generation decreases, thereby maintaining a continuous supply to the battery swapping station while reducing electricity purchases from the utility grid.
The SoC profile shown in Figure 20 confirms this operating behaviour. The SoC gradually increases during periods of abundant renewable generation, particularly around midday when photovoltaic output reaches its maximum. As renewable production declines later in the day, the stored energy is discharged to supplement the battery swapping demand, resulting in a controlled decrease in the SoC. Throughout the optimization period, both the upper and lower SoC limits, together with the fixed-final state condition constraint for the BESS SoC requirement, remain fully satisfied, demonstrating that the proposed energy management strategy maintains technically feasible battery operation without excessive charging or deep discharge.
Figure 21 illustrates the surplus renewable electricity exported to the utility grid through the PV and WT systems. Most of the exported energy occurs during midday when renewable generation exceeds both the battery swapping demand and the available charging capacity of the BESS. Rather than curtailing excess renewable production, the optimization exports the surplus electricity to the grid, thereby generating additional revenue through the applicable feed-in tariff programme. This operating strategy improves both renewable energy utilization and the economic performance of the proposed hybrid energy system.
Overall, the weekday results for the low-demand season demonstrate that the optimization framework effectively balances renewable generation, battery storage, and utility grid interaction. Although electricity prices are lower than those observed during the high-demand season, the coordinated utilization of renewable energy and battery storage continues to reduce grid electricity consumption while maximizing the financial benefits associated with surplus renewable energy.
Figure 18.
Charging demand side power flows.
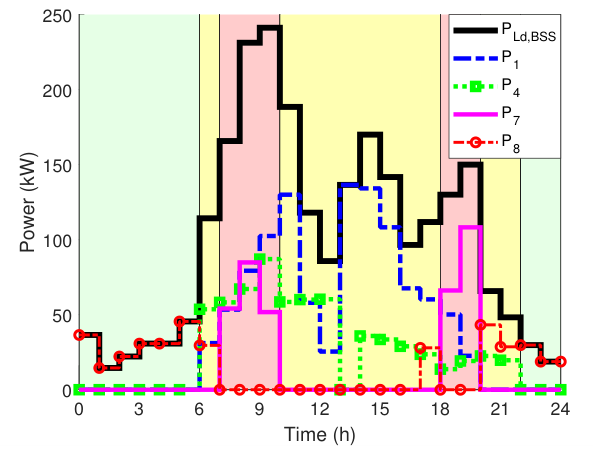
Figure 19.
BESS side power flows.
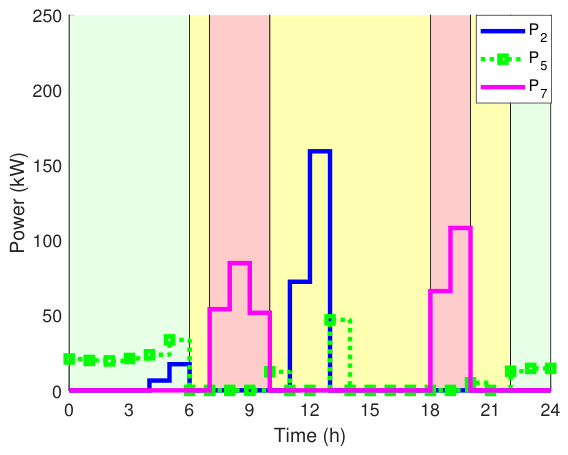
Figure 20.
BESS SoC.
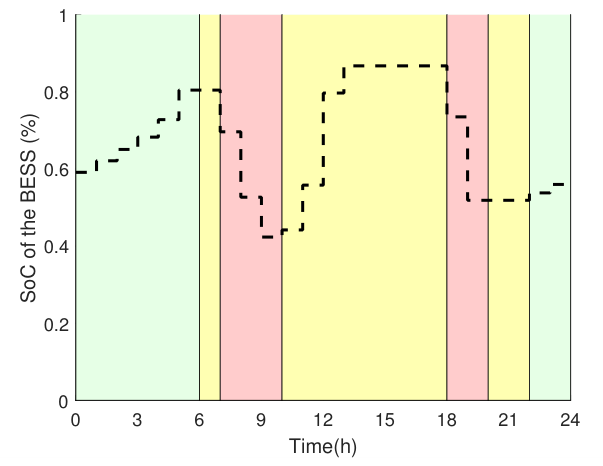
Figure 21.
Hybrid power to the Grid.
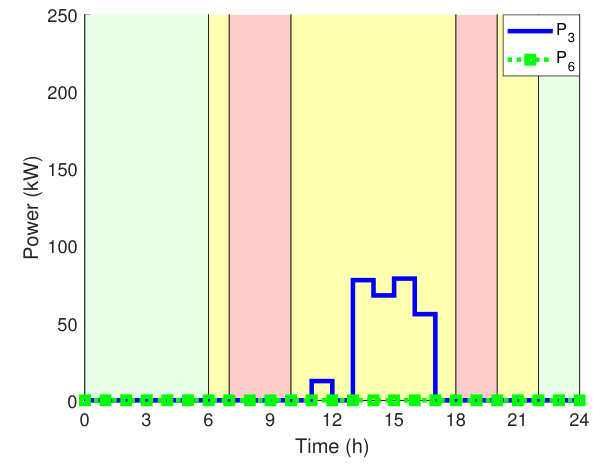
4.2.2. Scenario 4: Optimal Operation Strategy of the Proposed System in Low Demand Season for One Day on the Weekend (September to May)
Figure 22 presents the optimal power dispatch for the proposed hybrid renewable energy system during a representative weekend in the low-demand electricity pricing season. Similar to the previous scenarios, the optimization coordinates the PV system (), WT (), BESS (), and utility grid to satisfy the charging demand of the BSS while minimizing the overall operating cost. However, the weekend tariff structure produces a different operating strategy because the difference between off-peak and standard electricity prices is smaller than during weekdays. During off-peak periods, the optimization imports electricity from the utility grid whenever this represents the most economical operating option. At the same time, renewable generation from the PV and WT systems is utilized whenever available to reduce unnecessary grid dependence. As solar irradiance increases during the morning, photovoltaic generation becomes the primary energy source supplying the battery swapping station, while wind generation provides supplementary renewable power throughout the day.
Figure 23 illustrates the charging ( and ) and discharging power flows associated with the BESS. Surplus renewable energy produced during periods of high PV and wind generation is directed to the BESS whenever additional storage capacity is available. The stored energy is subsequently discharged during periods of lower renewable generation to maintain a reliable electricity supply to the battery swapping station. This coordinated charging and discharging strategy improves renewable energy utilization while reducing fluctuations in grid electricity imports.
The corresponding SoC profile of the BESS is shown in Figure 24. The BESS accumulates energy during periods of abundant renewable generation and gradually releases the stored energy as renewable production decreases later in the day. Throughout the optimization horizon, the SoC remains within the prescribed operating limits and satisfies the required fixed-final state condition, confirming that the optimization successfully maintains reliable BESS operation while preserving BESS health.
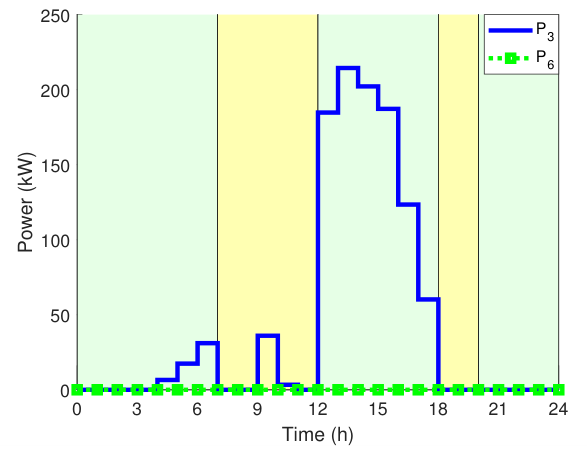
Figure 25 presents the renewable electricity exported to the utility grid through the PV and WT systems. Compared with the weekday scenario, a greater proportion of surplus renewable electricity is exported because the economic benefit associated with avoiding grid electricity purchases is reduced under the weekend tariff structure. Consequently, the optimization allocates more excess renewable energy to grid export, thereby increasing feed-in tariff revenue while maintaining reliable operation of the battery swapping station.
The simulation results demonstrate that the proposed optimization framework automatically adapts its dispatch strategy to changing electricity tariff conditions. Under the low-demand weekend scenario, the algorithm places greater emphasis on maximizing renewable energy utilization and electricity export while continuing to minimize operating costs through coordinated scheduling of the photovoltaic system, wind turbine, battery energy storage system, and utility grid. These findings confirm the flexibility and robustness of the proposed energy management strategy across different seasonal and tariff conditions.
Figure 22.
Charging demand side power flows.
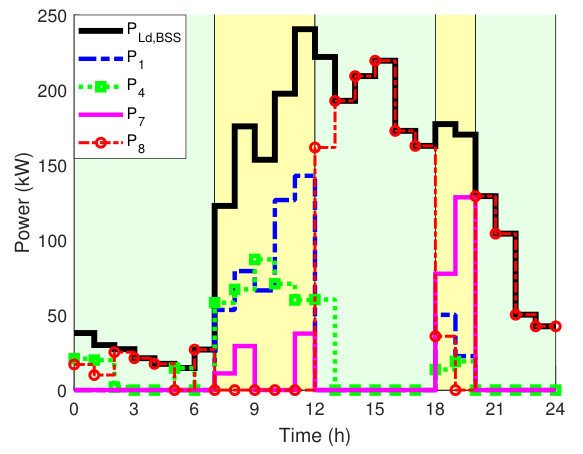
Figure 23.
BESS side power flows.
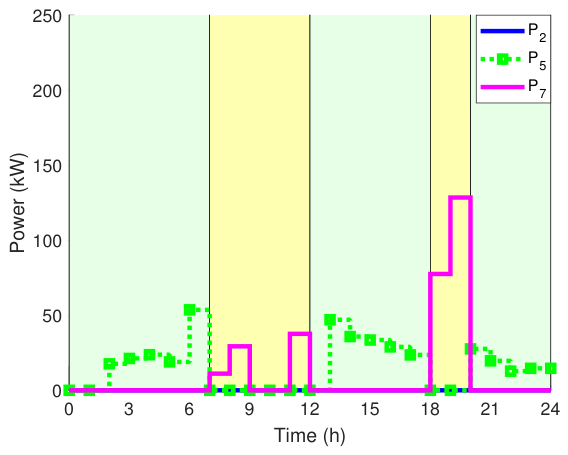
Figure 24.
BESS SoC.
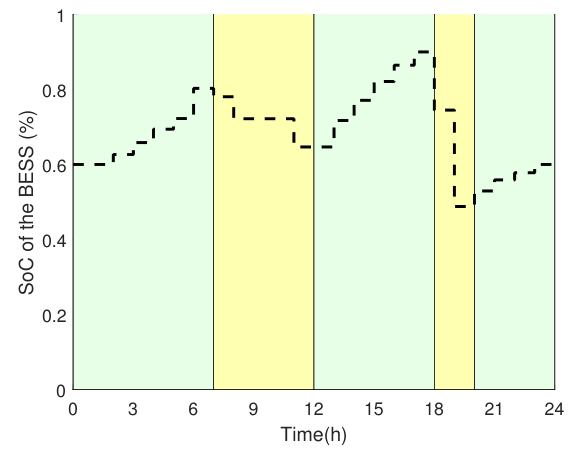
Figure 25.
Hybrid power to the Grid.
4.3. Baseline and Optimal Cost Savings
To quantify the economic benefits of the proposed energy management strategy, the operating performance of the hybrid renewable energy system is compared with that of a conventional grid-connected battery swapping station. In the baseline case, the entire charging demand is supplied directly by the utility grid according to the applicable TOU electricity tariff, without support from renewable generation or battery energy storage. In contrast, the proposed optimization framework coordinates the operation of the PV system, WT, BESS, utility grid, and renewable electricity exports to minimize the overall operating cost while maximizing the utilization of locally generated renewable energy. The comparative results for the four operating scenarios are summarized in Table 2, which presents the baseline electricity cost, optimized grid electricity cost, feed-in tariff revenue, daily energy savings, and total daily cost savings.
The results demonstrate that the proposed optimization strategy consistently reduces electricity expenditure across all operating scenarios. However, the magnitude of the savings varies according to the seasonal tariff structure, renewable energy availability, and weekday or weekend operating conditions. These variations confirm that the economic performance of the hybrid renewable energy system is strongly influenced by the interaction between electricity pricing policies and the temporal availability of renewable resources. Among the four scenarios, Scenario 1, representing a representative weekday during the high-demand electricity pricing season, achieves the largest daily cost saving of ZAR 7,111.58. This substantial reduction is primarily attributed to the high peak-period electricity tariffs, which make electricity purchased from the utility grid considerably more expensive. Under these conditions, the optimization effectively exploits PV generation, wind power, and stored battery energy to minimize costly grid electricity imports, thereby producing the greatest economic benefit. For Scenario 2, corresponding to a representative weekend during the high-demand season, the optimization reduces the daily electricity expenditure by ZAR 2,762.45 while simultaneously generating ZAR 643.56 through renewable electricity exported to the utility grid. Although the overall savings are lower than those achieved during weekdays, the contribution of feed-in tariff revenue becomes more significant because weekend electricity tariffs reduce the financial incentive for avoiding grid electricity purchases. During the low-demand electricity pricing season, the optimization continues to provide substantial economic benefits. Scenario 3 records a daily saving of ZAR 3,560.81, demonstrating that coordinated dispatch of renewable generation and battery storage remains economically advantageous even when electricity tariffs are lower. The combined utilization of PV generation, wind energy, and battery storage substantially decreases the amount of electricity imported from the utility grid while maintaining uninterrupted operation of the BSS. Similarly, Scenario 4, representing weekend operation during the low-demand season, achieves a daily cost reduction of ZAR 2,062.18 together with ZAR 1,194.70 in feed-in tariff revenue. Compared with the corresponding weekday case, a larger proportion of the economic benefit originates from exporting surplus renewable electricity rather than reducing electricity purchases from the utility grid. This behaviour reflects the lower weekend electricity prices, which shift the optimization strategy towards increased renewable energy export whenever local demand and battery charging requirements have been satisfied.
Overall, the comparative analysis clearly demonstrates that the proposed optimization framework adapts its operating strategy according to seasonal electricity tariffs and daily demand patterns. During weekdays, where electricity prices are highest, the optimization prioritises reducing grid electricity consumption through coordinated dispatch of renewable generation and battery storage. In contrast, weekend operation places greater emphasis on exporting surplus renewable energy to increase feed-in tariff revenue. This adaptive behaviour enables the proposed energy management strategy to maximize economic performance while improving renewable energy utilization under a wide range of operating conditions. The economic benefits of the proposed configuration, expressed as weekly and annual cost savings, are presented in Table 3.
4.4. Economic Analysis for the Payback Period
The economic feasibility of the proposed hybrid renewable energy system is assessed by determining whether the annual operating cost savings are sufficient to recover the initial capital investment. This analysis compares the conventional grid-only operation of the battery swapping station with the proposed optimal power flow management strategy and converts the resulting daily operating savings into annual economic benefits. The evaluation incorporates investment costs, operating and maintenance expenses, electricity cost savings, and revenue generated through the feed-in tariff over the project lifetime. To account for the time value of money, a discounted cash flow (DCF) approach is adopted, which is widely used in techno-economic assessments of energy systems [50,51]. Accordingly, the discounted present value (DPV) of the future cash flow in year z is determined using Equation (39).
where denotes the discounted present value of the future cash flow, represents the projected cash flow in year z, and d is the annual discount rate. The variable z denotes the project year in which the cash flow occurs. The discount rate reflects the opportunity cost of capital by accounting for the combined effects of inflation and interest rates. In this study, the annual interest rate 4 and inflation rate 5 are taken as 8.25% and 4.6%, respectively. Based on these parameters, the net present value (NPV) of the project is calculated using Equation (40) [50].
where is the cumulative discounted cash flow (or net present value) over the project lifetime and is the total initial capital investment. The discounted payback period (), which represents the time required for the cumulative discounted cash flow to equal the initial investment cost, is then obtained from Equation (41) [50].
where denotes the last year with a negative NPV. The investment cost of the proposed hybrid renewable energy system is summarized in Table 4, including the PV array, WT, BESS, inverter, installation, and ancillary equipment. The component prices are based on South African market rates6. The estimated total capital investment amounts to ZAR 5,866,490.
As presented in Table 5, the proposed system requires an initial capital investment of ZAR 5,866,490. Throughout the project lifetime, annual operating and maintenance costs, together with electricity cost savings and feed-in tariff revenue, are considered in the discounted cash flow analysis. The results indicate that the cumulative discounted cash flow becomes positive after approximately five years, demonstrating that the proposed hybrid renewable energy system is financially viable. Although the discounted payback period depends on assumptions regarding electricity prices, inflation, interest rates, battery degradation, and renewable energy availability, the obtained results confirm the favourable long-term economic performance of the proposed optimization framework.
4.5. Discussion, Limitations and Practical Implications
The simulation outcomes reveal that the economic worth of the proposed system depends not on renewable generation itself but on the time at which renewable generation occurs in relation to the TOU prices and the BSS demand. This follows other studies of PV-battery demand-side control and renewable-assisted EV charging, where storage contributes value by shifting energy across tariff periods, instead of simply increasing total renewable penetration [38,39]. In the current work, the BESS will be most useful when it prevents the opportunity cost of grid purchase in peak periods, whereas feed-in revenue will be more prominent when the tariff conditions during weekends increase the opportunity cost of exporting excess renewable energy.
The weekday/weekend dichotomy is thus of primary concern in the connotation of the results. Weekdays with high demand give rise to the greatest absolute daily saving due to peak tariffs being high and grid-only operation being costly. Weekdays with low demand result in the highest proportional decrease since renewable and storage dispatch are able to cover a higher portion of the charging need. The cost-avoidance potential of hybrid renewable systems is lower, but relative feed-in activity is higher during weekends, which implies that BSS operators cannot assess the hybrid systems based on their annual average tariffs. Granularity of tariff-period is needed since a given PV, WT, and BESS capacities can yield different economic results under different daily price structures [35,36].
There are certain limitations that should be taken into account. To begin with, the case study is a combination of a heavy-duty BSS demand profile and South African renewable-resource and tariff inputs. This can be useful to determine transferability when using South African energy-market conditions, but it does not supersede a locally measured South African BSS demand dataset. Second, the model is not endogenously optimized, and uncertainty in the arrival of EVs, renewable prediction, battery decay, and tariff change. Third, the formulation considers dispatch variables as continuous power flows (per hour). This would be suitable to system-level energy management, but a station-level controller would need more integer constraints to manage charger availability, battery inventory states, and mutually exclusive import/export decisions [24,30,37]. These constraints characterize the most significant extensions of the work: stochastic or robust dispatch, validation of the demand-profile using South African BSS data, and degradation-aware mixed-integer scheduling.
5. Conclusions
This paper developed a linear programming-based optimal power flow management framework for a grid-connected electric vehicle battery swapping station integrating photovoltaic generation, wind turbines, a battery energy storage system, and the utility grid. The proposed optimization model coordinates energy exchange among these resources to satisfy the charging demand of depleted EV batteries while simultaneously minimizing electricity procurement costs, reducing battery degradation costs, and maximizing revenue from surplus renewable energy exported to the utility grid through the feed-in tariff mechanism.
The simulation results demonstrate that the proposed optimization strategy effectively adapts to varying operating conditions, including high-demand and low-demand electricity pricing seasons as well as weekday and weekend tariff structures. Across all investigated scenarios, the coordinated scheduling of renewable generation, battery storage, and utility grid interaction substantially reduced electricity expenditure compared with conventional grid-dependent operation. Daily electricity costs of ZAR 7,676.39, ZAR 4,093.28, ZAR 3,883.59, and ZAR 3,256.88 were reduced to ZAR 564.81, ZAR 1,330.83, ZAR 380.89, and ZAR 1,456.11, respectively. These results confirm the effectiveness of the proposed optimal power flow strategy in improving the economic performance of battery swapping station operation under South African time-of-use electricity tariffs.
The analysis further revealed that maximizing feed-in tariff revenue is not always the primary contributor to overall cost savings. Instead, greater economic benefits are achieved when the battery energy storage system stores surplus renewable electricity during periods of high renewable generation and subsequently supplies energy during high-price tariff periods. This operating strategy reduces dependence on utility grid electricity while increasing the utilization of locally generated renewable energy.
The discounted cash flow analysis demonstrated that the proposed hybrid renewable energy system is economically viable, achieving an estimated discounted payback period of approximately five years under the adopted investment costs and electricity tariff assumptions. These findings indicate that integrating renewable generation with intelligent energy management and battery storage can significantly improve the financial performance of battery swapping infrastructure while supporting the transition toward sustainable electric mobility.
Although the proposed framework provides encouraging results, the present study is based on a deterministic optimization model using representative renewable generation and battery swapping demand profiles. Future work will therefore focus on incorporating renewable generation forecasting, stochastic EV arrival modeling, and uncertainty-aware optimization techniques such as Model Predictive Control (MPC) and robust optimization. Additional developments will include battery inventory management, charger scheduling, and mutually exclusive import-export constraints to further improve the operational flexibility and practical applicability of the proposed optimization framework.
Overall, the proposed optimal power flow management strategy provides a practical decision-support tool for the planning and operation of renewable-powered battery swapping stations. The methodology offers a promising approach for reducing operating costs, improving renewable energy utilization, and enhancing the long-term economic sustainability of future electric vehicle charging infrastructure.
Author Contributions
Conceptualization, L.T.-E.N.; methodology, L.T.-E.N.; software, L.T.-E.N.; validation, L.T.-E.N. and E.E.; formal analysis, L.T.-E.N.; investigation, L.T.-E.N. and E.E.; resources, L.T.-E.N..; data curation, L.T.-E.N.; writing—original draft preparation, L.T.-E.N.; writing—review and editing, L.T.-E.N. and E.E.; visualization, L.T.-E.N. and E.E.; supervision, L.T.-E.N. and E.E.; project administration, L.T.-E.N. and E.E.; funding acquisition, L.T.-E.N. and E.E. All authors have read and agreed to the published version of the manuscript.
Funding
This research received no external funding.
Data Availability Statement
The original contributions presented in the study are included in the article, further inquiries can be directed to the corresponding author.
Conflicts of Interest
The authors declare no conflicts of interest
References
- IPCC, Chapter 10: Transport., Intergovernmental Panel on Climate Change 2022. Available online: https://www.ipcc.ch/report/ar6/wg3/chapter/chapter-10/ (accessed on 15 November 2025).
- Jaramillo, P.; Kahn Ribeiro, S.; Newman, P.; Dhar, S.; Diemuodeke, T.; Kajino, T.; Lee, D.S.; Nugroho, S.B.; Ou, X.; Hammer Strømman, A.; et al. Transport (chapter 10). IPCC 2022: Climate Change 2022: Mitigation of Climate Change. Contribution of Working Group III to the Sixth Assessment Report of the Intergovernmental Panel on Climate Change, In Cambridge University Press; 2023; pp. 1049–1160. [Google Scholar]
- Gauto, M. A.; Roitman, T.; Lopes, E.; Capaz, R. S.; Pereira, G.A.G.; Nogueira, G.P. The greenhouse gases emissions and environmental impact profiles for bio-electromobility alternatives in brazilian urban buses. Energy Sustain. Dev. 2026, 90, 101887. [Google Scholar] [CrossRef]
- Ferrer, A. L. C.; Thome, A. M. T. Carbon emissions in transportation: A synthesis framework. Sustainability 2023, 15, 8475. [Google Scholar] [CrossRef]
- International Energy Agency. Global EV Outlook 2021. Available online: https://www.iea.org/reports/global-ev-outlook-2021 (accessed on 25 April 2023).
- Delso-Vicente, A.-T.; Camperos, M.-C.; Almonacid-Durán, M. The evolution of electric and hybrid vehicles and their influence on sustainable transport: A review and future research lines. Sustain. Technol. Entrep. 2025, 4, 100100. [Google Scholar] [CrossRef]
- Timilsina, R. R.; Zhang, J.; Rahut, D. B.; Patradool, K.; Sonobe, T. Global drive toward net-zero emissions and sustainability via electric vehicles: an integrative critical review. Energy Ecol. Environ. 2025, 10, 125–144. [Google Scholar] [CrossRef]
- Malik, M. A. I.; Kalam, M. A.; Ikram, A.; Zeeshan, S.; Zahidi, S. Q. R. Energy transition towards electric vehicle technology: Recent advancements. Energy Rep. 2025, 13, 2958–2996. [Google Scholar] [CrossRef]
- Udendhran, R.; Mohan, T. R.; Uthra, R. A.; Selvakumarasamy, S.; Dinesh, G.; Mukhopadhyay, M.; Saraswat, V.; Chakraborty, P.; et al. Transitioning to sustainable E-vehicle systems–Global perspectives on the challenges, policies, and opportunities. J. Hazard. Mater. Adv. 2025, 17, 100619. [Google Scholar] [CrossRef]
- Krishnan, T. R. R.; Satpathy, P. R.; Ramachandaramurthy, V. K.; Dollah, Z.; Pulenthirarasa, S.; Ramasamy, A. Optimizing vehicle-to-grid systems: Smart integration of shared autonomous and conventional electric vehicles. ETransportation 2025, 24, 100401. [Google Scholar] [CrossRef]
- Tightiz, L.; Dang, L. M.; Yoo, J.; Padmanaban, S. A comprehensive review on AIoT applications for intelligent EV charging/discharging ecosystem. Energy Convers. Manag. 2025, 10, 101088. [Google Scholar] [CrossRef]
- Cao, Y.; Huang, L.; Li, Y.; Jermsittiparsert, K.; Ahmadi-Nezamabad, H.; Nojavan, S. Optimal scheduling of electric vehicles aggregator under market price uncertainty using robust optimization technique. Int. J. Electr. Power Energy Syst. 2020, 117, 105628. [Google Scholar] [CrossRef]
- Zhao, Z.; Lee, C. K.; Ren, J. A two-level charging scheduling method for public electric vehicle charging stations considering heterogeneous demand and nonlinear charging profile. Appl. Energy 2024, 355, 122278. [Google Scholar] [CrossRef]
- Tayri, A.; Ma, X. Grid impacts of electric vehicle charging: A review of challenges and mitigation strategies. Energies 2025, 14, 3807. [Google Scholar]
- Bokopane, L.; Kusakana, K.; Vermaak, H.; Hohne, A. Optimal power dispatching for a grid-connected electric vehicle charging station micro-grid with renewable energy, battery storage and peer-to-peer energy sharing. J. Energy Storage 2024, 96, 112435. [Google Scholar] [CrossRef]
- Rehman, A. U.; Lu, J.; Du, B.; Bai, F.; Sanjari, M. J. Efficient management of electric vehicle charging stations: Balancing user preferences and grid demands with energy storage systems and renewable energy. Appl. Energy 2025, 393, 126147. [Google Scholar] [CrossRef]
- Mohanty, P. K.; Pradhan, R.; Jena, P.; Padhy, N. P. Renewable Energy-Based EV Battery Swapping Stations: Opportunities and Future Directions. In Hybrid Renewable Power Infrastructure for Sustainable Electric Vehicle Development; Springer, 2025; pp. 141–168. [Google Scholar]
- Khan, M. R.; Haider, Z. M.; Malik, F. H.; Almasoudi, F. M.; Alatawi, K. S. S.; Bhutta, M. S. A comprehensive review of microgrid energy management strategies considering electric vehicles, energy storage systems, and AI techniques. Processes 2024, 12, 270. [Google Scholar] [CrossRef]
- Bakht, M. P.; Salam, Z.; Gul, M.; Anjum, W.; Kamaruddin, M. A.; Khan, N.; Bukar, A. L. The potential role of hybrid renewable energy system for grid intermittency problem: A techno-economic optimisation and comparative analysis. Sustainability 2022, 14, 14045. [Google Scholar] [CrossRef]
- Fachrizal, R.; Qian, K.; Lindberg, O.; Shepero, M.; Adam, R.; Widén, J.; Munkhammar, J. Urban-scale energy matching optimization with smart EV charging and V2G in a net-zero energy city powered by wind and solar energy. ETransportation 2024, 20, 100314. [Google Scholar] [CrossRef]
- Nyamayoka, L. T.-E.; Masisi, L.; Dorrell, D. G. Optimal power dispatch of solar PV-battery storage system for electric vehicle battery swapping stations under grid scheduled load-shedding. 33rd Southern African Universities Power Engineering Conference (SAUPEC), Pretoria, South Africa, 2025; pp. 1–6. [Google Scholar]
- Nyamayoka, L. T.-E.; Masisi, L.; Dorrell, D. G.; Wang, S. Techno-economic feasibility and optimal design approach of grid-connected hybrid power generation systems for electric vehicles battery swapping station. Energies 2025, 18, 1208. [Google Scholar] [CrossRef]
- Jin, L.; Zhong, S.; Su, B.; Zhou, D.; Wang, Q.; Yu, X. EV-integrated and grid-connected hybrid renewable energy system: a two-stage optimization strategy. Energy 2025, 330, 136858. [Google Scholar] [CrossRef]
- Marchesano, M. G.; Popolo, V.; Rozhok, A.; Cavalaglio, G. Performance evaluation of battery swapping stations for evs: a multi-method simulation approach. Energies 2024, 17, 5969. [Google Scholar] [CrossRef]
- Abdelkareem, M. A.; Olabi, A. G.; AlMallahi, M. N.; Mahmoud, M.; Elgendi, M. Contributions of electric vehicles towards the sustainable development goals. Energy Convers. Manag. X 2025, 101170. [Google Scholar] [CrossRef]
- Jin, D.; Zhang, H.; Han, B.; Liu, G.; Xue, F.; Lu, S. Optimal siting and sizing of electric vehicle energy supplement infrastructure in highway networks. Inventions 2023, 8, 117. [Google Scholar] [CrossRef]
- Guo, Y.; Yan, K.; Qian, X.; Li, X.; Hu, Y.; Wang, N. A robust optimal battery swapping station location model for commercial electric vehicles under demand uncertainty. Energy 2025, 137466. [Google Scholar] [CrossRef]
- Jin, Y.; Acquah, M. A.; Seo, M.; Han, S. Optimal siting and sizing of EV charging station using stochastic power flow analysis for voltage stability. IEEE Trans. Transp. Electrif. 2023, 10, 777–794. [Google Scholar] [CrossRef]
- Henrique, L. F.; Silva, W. N.; Silva, C. C.; Dias, B. H.; Oliveira, L. W.; de Almeida, M. C. Optimal siting and sizing of distributed energy resources in a Smart Campus. Electr. Power Syst. Res. 2023, 217, 109095. [Google Scholar] [CrossRef]
- Zhan, W.; Wang, Z.; Zhang, L.; Liu, P.; Cui, D.; Dorrell, D. G. A review of siting, sizing, optimal scheduling, and cost-benefit analysis for battery swapping stations. Energy 2022, 258, 124723. [Google Scholar] [CrossRef]
- Ma, P.; Zhang, S.; Zhou, B.; Shao, W.; Li, H.; Ma, T.; Guo, D. Research on Location Planning of Battery Swap Stations for Operating Electric Vehicles. World Electr. Veh. J. 2025, 16, 332. [Google Scholar] [CrossRef]
- Marchesano, M. G.; Guizzi, G.; Vespoli, S.; Ferruzzi, G. Battery swapping station service in a smart microgrid: A multi-method simulation performance analysis. Energies 2023, 16, 6576. [Google Scholar] [CrossRef]
- Wang, H.; Ma, H.; Liu, C.; Wang, W. Optimal scheduling of electric vehicles charging in battery swapping station considering wind-photovoltaic accommodation. Electr. Power Syst. Res. 2021, 199, 107451. [Google Scholar] [CrossRef]
- Wang, D.; Xu, H.; Guo, J.; Dai, L.; Zhang, L. Optimizing highway electric vehicle scheduling and battery swapping station management for enhanced renewable energy utilization. Electronics 2025, 14, 952. [Google Scholar] [CrossRef]
- Alberizzi, J. C.; Fatehi, M.; Renzi, M. Photovoltaic-integrated battery swapping stations: An optimization tool for operational scheduling. Energy Rep. 2025, 14, 4885–4900. [Google Scholar] [CrossRef]
- Alberizzi, J. C.; Callioni, F.; Estévez, M. A. P.; Renzi, M. Optimized integration of charging and battery swapping stations for peak load and cost reduction. Energy 2025, 10, 139683. [Google Scholar]
- Mahoor, M.; Hosseini, Z. S.; Khodaei, A. Least-cost operation of a battery swapping station with random customer requests. Energy 2019, 172, 913–921. [Google Scholar] [CrossRef]
- Wu, Z.; Tazvinga, H.; Xia, X. Demand side management of photovoltaic-battery hybrid system. Appl. Energy 2015, 148, 294–304. [Google Scholar] [CrossRef]
- Bilal, M.; Oladigbolu, J. O.; Mujeeb, A.; Al-Turki, Y. A. Cost-effective optimization of on-grid electric vehicle charging systems with integrated renewable energy and energy storage: An economic and reliability analysis. J. Energy Storage 2024, 100, 113170. [Google Scholar] [CrossRef]
- Diaf, S.; Belhamel, M.; Haddadi, M.; Louche, A. Technical and economic assessment of hybrid photovoltaic/wind system with battery storage in corsica island. Energy Policy 2008, 36, 743–754. [Google Scholar] [CrossRef]
- Diaf, S.; Diaf, D.; Belhamel, M.; Haddadi, M.; Louche, A. A methodology for optimal sizing of autonomous hybrid pv/wind system. Energy Policy 2007, 35, 5708–5718. [Google Scholar] [CrossRef]
- Abbes, D.; Martinez, A.; Champenois, G. Life cycle cost, embodied energy and loss of power supply probability for the optimal design of hybrid power systems. Math. Comput. Simul. 2014, 98, 46–62. [Google Scholar] [CrossRef]
- Chen, X.; Xing, K.; Ni, F.; Wu, Y.; Xia, Y. An electric vehicle battery-swapping system: Concept, architectures, and implementations. IEEE Intell. Transp. Syst. Mag. 2021, 14, 175–194. [Google Scholar] [CrossRef]
- Lebrouhi, B.E.; Khattari, Y.; Lamrani, B.; Maaroufi, M.; Zeraouli, Y.; Kousksou, T. Key challenges for a large-scale development of battery electric vehicles: A comprehensive review. J. Energy Storage 2021, 44, 103273. [Google Scholar] [CrossRef]
- Brenna, M.; Foiadelli, F.; Leone, C.; Longo, M. Electric vehicles charging technology review and optimal size estimation. J. Electr. Eng. Technol. 2020, 15, 2539–2552. [Google Scholar] [CrossRef]
- Weather Spark. Available online: https://weatherspark.com/y/82961/Average-Weather-in-Cape-Town-South-Africa-Year-Round#Figures-WindSpeed (accessed on July 2024).
- Bokopane, L.; Kanzumba, K.; Vermaak, H. Is the South African electrical infrastructure ready for electric vehicles? In 2019 Open Innovations Conferences (OI); IEEE, 2019; pp. 127–131. [Google Scholar]
- Ahjum, F.; Godinho, C.; Burton, J.; McCall, B.; Marquard, A. A low-carbon transport future for south africa: Technical, economic and policy considerations. Clim. Transpar. 2020, 1–28. [Google Scholar]
- Dane, A.; Wright, D.; Montmasson-Clair, G. Exploring the policy impacts of a transition to electric vehicles in south africa; Trade & Industrial Policy Strategies: Pretoria, South Africa, 2019; pp. 1–20. [Google Scholar]
- Sichilalu, S.; Mathaba, T.; Xia, X. Optimal control of a wind–pv-hybrid powered heat pump water heater. Appl. Energ. 2017, 185, 1173–1184. [Google Scholar] [CrossRef]
- Hoppmann, J.; Volland, J.; Schmidt, T. S.; Hoffmann, V. H. The economic viability of battery storage for residential solar photovoltaic systems–A review and a simulation model. Renew. Sustain. Energy Rev. 2014, 39, 1101–1118. [Google Scholar] [CrossRef]
| 1 |
https://www.mathworks.com/help/optim/ug/intlinprog.html(accessed on 18 February 2026) |
| 2 | |
| 3 | |
| 4 |
https://tradingeconomics.com/south-africa/interest-rate(accessed on 20 September 2024) |
| 5 |
https://tradingeconomics.com/south-africa/inflation-cpi (accessed on 20 September 2024) |
| 6 |
https://www.sustainable.co.za/ (accessed on 14 March 2025) |
Figure 1.
Schematic layout of the proposed system.
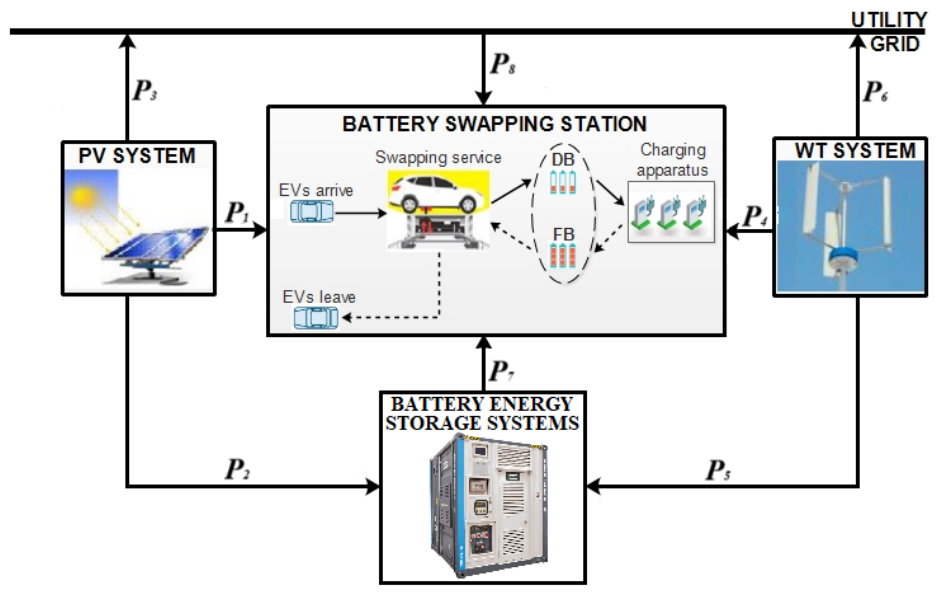
Figure 2.
Charging patterns of EV BSS on a weekday.
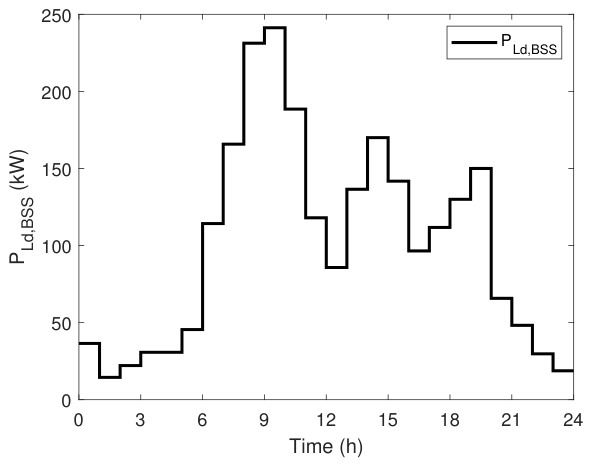
Figure 3.
Charging patterns of EV BSS on a Weekend.
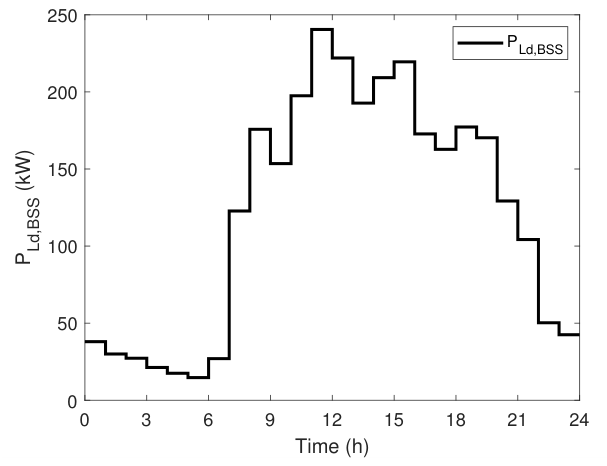
Figure 4.
Average hourly wind speed HD.
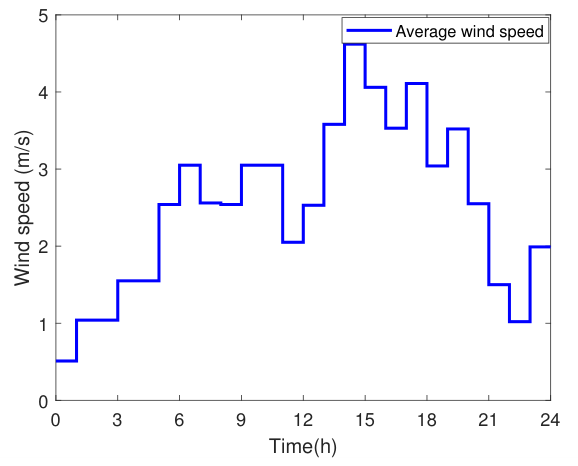
Figure 5.
Average hourly wind speed LD.
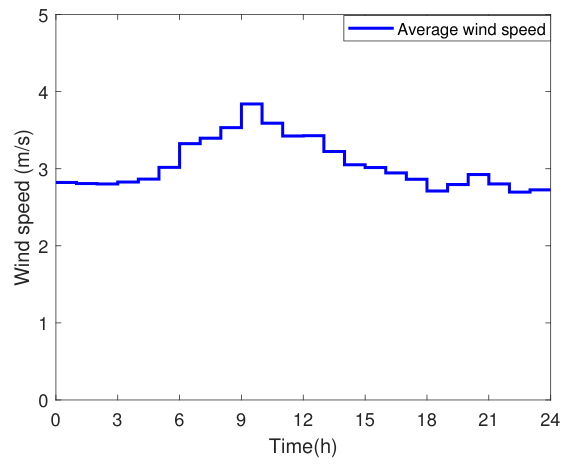
Figure 6.
Daily average shortwave solar power HD.
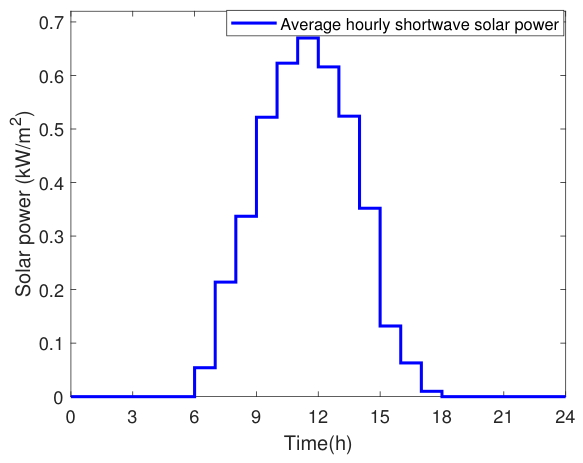
Figure 7.
Daily average shortwave solar power LD.
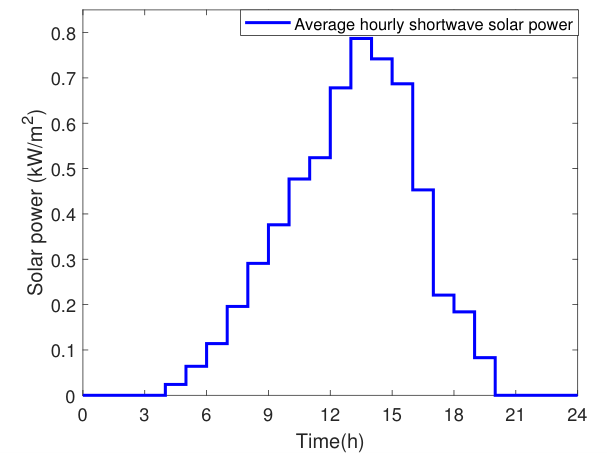
Figure 8.
Monthly average wind speed.
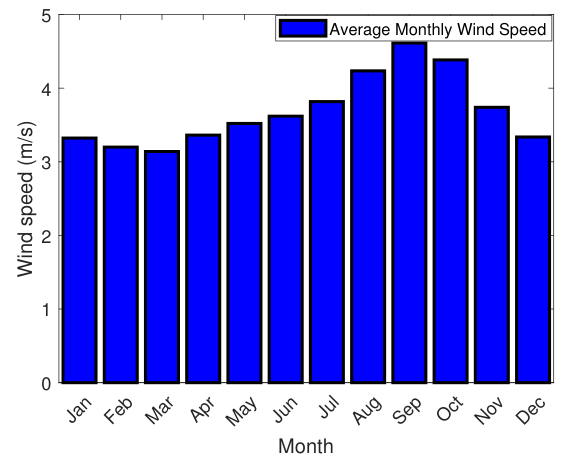
Figure 9.
Monthly average shortwave PV power.
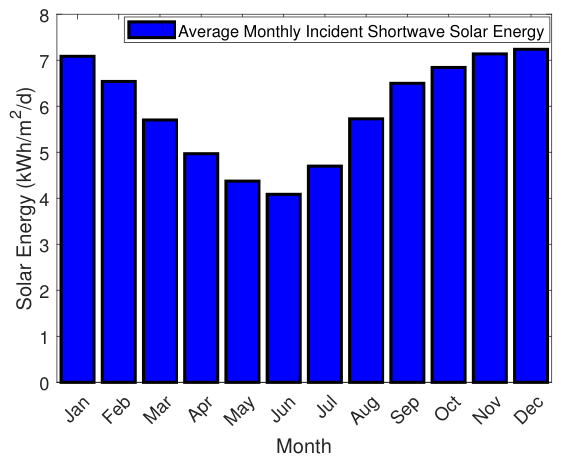

Table 1.
Simulation parameters used in this paper.
| Parameters | Symbol | Values |
|---|---|---|
| Sampling period | N | 24 |
| Sampling time | 1 h | |
| Weighting factor | 0.35 | |
| Weighting factor | 0.3 | |
| Weighting factor | 0.35 | |
| Rated power of the PV panel | 0.545 kW | |
| Conversion efficiency of the PV panel | 19.4% | |
| Rated efficiency of the PV panel | 18.1% | |
| Total number of PV panels | 402 | |
| Rated power of the WT generator | 8 kW | |
| Rated WT speed | 12 m/s | |
| Cut-in WT speed | 2.5 m/s | |
| Cut-out WT speed | 25 m/s | |
| WT gearbox efficiency | 90% | |
| WT generator efficiency | 80% | |
| Air density | 1.225 kg/m3 | |
| WT power coefficient | 0.48 | |
| Total number of WTs | 64 | |
| Wearing cost coefficient of the hybrid system | 0.001 | |
| Hourly wearing cost of other components | a | 0.002 |
| BESS nominal capacity | 600 kWh | |
| BESS maximum SoC | 90% | |
| BESS minimum SoC | 30% | |
| BESS initial SoC | 50% | |
| BESS charging efficiency | 90% | |
| BESS discharging efficiency | 80% |
Table 2.
Different case scenario with daily optimal energy and cost savings.
| Savings | |||||
|---|---|---|---|---|---|
| Baseline cost | Optimal cost | Hybrid feed-in | Energy | Cost | |
| (ZAR) | (ZAR) | (ZAR) | (kWh) | (ZAR) | |
| Scenario 1 | 7 676.39 | 564.81 | 129.00 | 2 092.16 | 7 111.58 |
| Scenario 2 | 4 093.28 | 1 330.83 | 643.56 | 1 638.72 | 2 762.45 |
| Scenario 3 | 3 883.59 | 380.89 | 322.78 | 2 071.02 | 3 560.81 |
| Scenario 4 | 3 256.88 | 1 456.11 | 1 194.70 | 1 319.51 | 2 062.18 |
Table 3.
Weekly and Annual cost savings.
| Savings | |||||
|---|---|---|---|---|---|
| Baseline cost | Optimal cost | Hybrid feed-in | Energy | Cost | |
| (ZAR) | (ZAR) | (ZAR) | (kWh) | (ZAR) | |
| Weekly HD | 46 569 | 5 486 | 1 932 | 13 738 | 41 083 |
| Weekly LD | 25 932 | 4 817 | 4 003 | 12 994 | 21 928 |
| Annualized | 181 246 | 685 368 | 1 389 284 | ||
Table 4.
Costs components of the proposed system.
| Components | Costs (ZAR) |
|---|---|
| Wind turbines | 677 160 |
| Solar photovoltaic | 1 286 360 |
| Storage system | 159 340 |
| Inverters | 77 720 |
| Installation cost | 665 910 |
| Accessories | 3 000 000 |
| Total investment capital cost | 5 866 490 |
Table 5.
Payback period of the proposed system with total investment capital cost of ZAR 5 866 490.
| Annual cost | Annual revenue | Discount | Cash flows | |||||
|---|---|---|---|---|---|---|---|---|
| Years | Operation | Maintenance | Optimal benefit | Hybrid feed-in | Total | factor | Discounted | Cumulative |
| (ZAR) | (ZAR) | cost (ZAR) | (ZAR) | (ZAR) | (1+d)−Lp | (ZAR) | (ZAR) | |
| 0 | 1.00 | (5 866 490) | (5 866 490) | |||||
| 1 | (54 689) | (285 358) | 1 389 284 | 181 246 | 1 230 485 | 0.96 | 1 187 153 | (4 679 337) |
| 2 | (55 471) | (289 438) | 1 409 151 | 198 646 | 1 262 888 | 0.93 | 1 175 510 | (3 503 827) |
| 3 | (56 264) | (293 577) | 1 429 302 | 217 716 | 1 297 177 | 0.90 | 1 164 907 | (2 338 920) |
| 4 | (57 068) | (297 775) | 1 449 741 | 238 617 | 1 333 514 | 0.87 | 1 155 368 | (1 183 552) |
| 5 | (57 885) | (302 033) | (1 470 472) | 261 524 | 1 372 078 | 0.84 | 1 146 918 | (36 634) |
| 6 | (58 712) | (306 353) | 1 491 500 | 286 630 | 1 413 065 | 0.81 | 1 139 584 | 1 102 951 |
| 7 | (59 552) | (310 733) | 1 512 829 | 314 147 | 1 456 690 | 0.78 | 1 133 397 | 2 236 347 |
| 8 | (60 403) | (315 177) | 1 534 462 | 344 305 | 1 503 186 | 0.75 | 1 128 388 | 3 364 735 |
| 9 | (61 267) | (319 684) | 1 556 405 | 377 358 | 1 552 811 | 0.72 | 1 124 592 | 4 489 327 |
| 10 | (62 143) | (324 255) | 1 578 661 | 413 584 | 1 605 847 | 0.70 | 1 122 047 | 5 611 374 |
| 11 | (63 032) | (328 892) | 1 601 236 | 453 288 | 1 662 600 | 0.67 | 1 120 793 | 6 732 168 |
| 12 | (63 933) | (333 595) | 1 624 134 | 496 804 | 1 723 409 | 0.65 | 1 120 874 | 7 853 042 |
| 13 | (64 848) | (338 366) | 1 647 359 | 544 497 | 1 788 643 | 0.63 | 1 122 335 | 8 975 377 |
| 14 | (65 775) | (343 204) | 1 670 916 | 596 769 | 1 858 706 | 0.61 | 1 125 228 | 10 100 605 |
| 15 | (66 716) | (348 112) | 1 694 810 | 654 056 | 1 934 041 | 0.58 | 1 129 604 | 11 230 209 |
| 16 | (67 670) | (353 090) | 1 719 046 | 716 848 | 2 015 135 | 0.56 | 1 135 521 | 12 365 730 |
| 17 | (68 637) | (358 139) | 1 743 629 | 785 666 | 2 102 518 | 0.54 | 1 143 040 | 13 508 770 |
| 18 | (69 619) | (363 261) | 1 768 562 | 861 090 | 2 196 773 | 0.52 | 1 152 226 | 14 660 996 |
| 19 | (70 614) | (368 455) | 1 793 853 | 943 754 | 2 298 538 | 0.51 | 1 163 148 | 15 824 143 |
| 20 | (71 624) | (373 724) | 1 819 505 | 1 034 355 | 2 408 511 | 0.49 | 1 175 879 | 17 000 022 |
| Payback is approximately 5.03 years (about 5 years and 0.4 months | ||||||||
Disclaimer/Publisher’s Note: The statements, opinions and data contained in all publications are solely those of the individual author(s) and contributor(s) and not of MDPI and/or the editor(s). MDPI and/or the editor(s) disclaim responsibility for any injury to people or property resulting from any ideas, methods, instructions or products referred to in the content. |
© 2026 by the authors. Licensee MDPI, Basel, Switzerland. This article is an open access article distributed under the terms and conditions of the Creative Commons Attribution (CC BY) license (http://creativecommons.org/licenses/by/4.0/).
Copyright: This open access article is published under a Creative Commons CC BY 4.0 license, which permit the free download, distribution, and reuse, provided that the author and preprint are cited in any reuse.


