

Submitted:
24 July 2026
Posted:
27 July 2026
You are already at the latest version
Abstract
Psidium guajava L. leaves are a valuable source of phenolic compounds, particularly glycosylated flavonoids, with possible applications as standardized nutraceutical ingredients. However, the intrinsic variability of botanical matrices requires reproducible production processes integrating extraction optimization, phytochemical characterization, and biological validation. This study aimed to develop an integrated workflow for obtaining a standardized P. guajava leaf extract from a pilot cultivation in southeastern Sicily. A Design of Experiments (DoE) approach, implemented by MODDE software, was used to optimize the aqueous extraction process. The optimal extraction conditions were a drug-to-solvent ratio of 1:30 (w/v) and an extraction temperature and time of 95 °C and 24 min., respectively. The optimized crude extract yielded a dry residue of 0.81% w/v, with total polyphenol contents of 0.253% w/v and a total flavonoid content of 0.052% w/v. Comparative HPLC-DAD screening of two macroporous resins identified Resin B as the most effective material for flavonoid enrichment, mainly targeting avicularin, guaijaverin, and hyperoside, three biomarker compounds highly characteristic of this plant species. The resulting enriched extract showed a dry residue of 3.22% w/w and a total flavonoid content of 11.071% w/v, including 3.019% w/v avicularin, 2.845% w/v guaijaverin, and 1.196% w/v hyperoside. The enriched extract was subsequently formulated on a maltodextrin carrier to obtain a standardized ingredient with a total flavonoid content of 7.75% w/v. The final formulation exhibited strong antioxidant activity in cell-free assays and significantly reduced nitric oxide production in LPS-stimulated RAW264.7 macrophages, supporting its possible use as a reproducible botanical ingredient for nutraceutical applications.
Keywords:
botanicals
; natural ingredients
; industrial scale-up
; sustainability
; flavonoid compounds
; Design of Experiments
; antioxidant activity
; anti-inflammatory activity
; avicularin
; guaijaverin
1. Introduction
Plants continue to serve as a fundamental source of bioactive compounds for healthcare and modern drug discovery [1,2,3]. Their secondary metabolites display significant structural diversity and include a wide range of therapeutic, disease-preventive, nutraceutical, and cosmetic applications [4]. In contrast to single purified compounds, botanical extracts represent complex chemical matrices in which coexisting metabolites collectively influence biological activity through additive or synergistic mechanisms [5]. Although this complexity is a notable advantage, it also presents substantial challenges for characterization, quality control, and industrial scale-up. Among the numerous medicinal plant species investigated for their phytochemical richness, Psidium guajava L. (Mirtaceae) has attracted increasing scientific interest owing to its abundance of phenolic compounds and flavonoids [6].
Despite the growing scientific interest in P. guajava, many of the studies currently available have focused primarily on describing the phytochemical composition of leaf extracts or investigating their biological properties, particularly their antioxidant, antimicrobial, anti-inflammatory, and antidiabetic activities [7,8,9]. While these investigations have considerably expanded knowledge of the bioactive potential of P. guajava leaves, comparatively little attention has been devoted to the development of integrated, reproducible, and technologically scalable processes for producing standardized extracts. Notably, limited research has integrated extraction optimization, analytical standardization using selected chemical markers, purification and enrichment strategies, and subsequent biological validation into a unified workflow. The integrated approach is essential for minimizing the intrinsic variability of botanical matrices, enhancing batch-to-batch reproducibility, and facilitating the translation of laboratory-scale procedures into processes suitable for industrial application [10]. According to this perspective, the implementation of Design of Experiments (DoE) methodologies for extraction optimization is a valuable strategy for identifying the most influential process variables while limiting experimental effort and maximizing extraction efficiency [11]. Likewise, the quantitative determination of characteristic flavonoid markers by HPLC-DAD provides a solid analytical method for quality control, enabling the establishment of standardized specifications based on individual bioactive constituents rather than solely on global parameters such as total polyphenol or total flavonoid content [12]. Furthermore, the use of macroporous resins in adsorption chromatography offers an effective downstream purification approach for selectively concentrating flavonoid-rich fractions, as a result improving the extract’s phytochemical profile and its possible biological activity [13]. Finally, stabilizing enriched extracts on suitable solid carriers may further help obtain reproducible botanical ingredients with improved handling, storage stability, and suitability for subsequent formulation and industrial applications [14].
Taking these considerations into account, the present study aimed to develop a standardized flavonoid-enriched extract from P. guajava leaves, obtained from a pilot cultivation established in southeastern Sicily, where the progressive adaptation of subtropical species may offer a promising opportunity for agricultural diversification and valorization of unconventional plant resources. The study was designed as a sequential and integrated process encompassing several complementary phases. Initially, the aqueous extraction process was optimized using a DoE approach implemented through MODDE software to identify the extraction conditions that maximized the recovery of phenolic constituents while ensuring process reproducibility. Subsequently, the main flavonoid markers, guaijaverin, avicularin, and hyperoside, were identified and quantitatively determined by HPLC-DAD to establish a reliable analytical basis for the standardization of the extract. The optimized extract was then subjected to enrichment via adsorption chromatography using a selected macroporous resin to increase the concentration of target flavonoids and reduce unwanted matrix components. Finally, the flavonoid-enriched extract was chemically characterized, and its biological potential was evaluated using complementary cell-free and cell-based in vitro assays to assess its antioxidant and anti-inflammatory activities. Overall, this integrated workflow provides a reproducible strategy for transforming a complex botanical matrix into a chemically characterized and standardized natural ingredient with possible uses in nutraceutical, phytopharmaceutical, and cosmetic sectors.
2. Materials and Methods
2.1. Chemicals and Reagents
Chemical reagents, including 2,2-diphenyl-1-picrylhydrazyl (DPPH), 2’,7’-dichlorofluorescein diacetate (DCFH-DA), and dimethyl sulfoxide (DMSO), were procured from VWR (Milan, Italy). HPLC-grade methanol, water, dimethylformamide, acetonitrile, and phosphoric acid, along with analytical-grade food-grade ethanol, Folin–Ciocalteu reagent, sodium carbonate, and aluminum chloride, were purchased from Carlo Erba Reagents (Milan, Italy). Reverse osmosis (RO) water was used for aqueous extraction and washing. High-purity analytical standards of avicularin (96%), hyperoside (94%), guaijaverin (91%), gallic acid (92%), and catechin (90%) were obtained from PhytoLab GmbH & Co. (Vestenbergsgreuth, Germany). Unless otherwise stated, all remaining chemical compounds were supplied by Sigma–Aldrich (Milan, Italy). Cell culture media and associated consumables were purchased from ThermoFisher Scientific (Monza, Italy).
2.2. Plant Material
P. guajava leaves were collected in September 2024 from a pilot cultivation in the province of Syracuse, southeastern Sicily, Italy. To provide a representative and homogeneous sample, leaves were collected at different growth stages from several plants, closely replicating the material typically obtained during standard pruning operations. The taxonomic identification of the plant material was confirmed by the pharmaceutical botanist Prof. Giuseppe A. Malfa (Department of Drug and Health Sciences, University of Catania, Italy). A voucher specimen (No. 09/24) was deposited at the same department. Following collection, leaves were uniformly distributed on a raised mesh tray and air-dried for 3 days under forced ventilation inside an Asem-180 fume hood (Asem, Treviso, Italy). Once dried, the plant material (45.8 % w/w) was ground into a coarse powder (comminuted herbal drug) using a DD6578 blade mill (Moulinex, Milan, Italy), subsequently vacuum-packed and stored at room temperature, protected from light, until use in the extraction experiments.
2.3. Exhaustive Hydroalcoholic Extraction for Preliminary Phytochemical Characterization
An exhaustive hydroalcoholic extraction was performed to obtain a comprehensive phytochemical profile of P. guajava leaves and to verify the homogeneity of the plant material prior to optimization of the aqueous extraction process.
Briefly, 3.0 g of dried and powdered leaves were placed in a cellulose extraction thimble and extracted using a SER 148 automatic solvent extractor (VELP Scientifica, Monza and Brianza, Italy). A hydroalcoholic ethanol/water solution (70:30, v/v) was used as the extraction solvent. A total volume of 150 mL was prepared and equally distributed between the two extraction vessels (75 mL each). The extraction consisted of a 10 min immersion phase, followed by a 2 h washing phase under continuous solvent reflux. The temperature was maintained at 248 °C throughout the procedure, in accordance with the instrument operating conditions. After extraction, the solutions were cooled to room temperature and filtered through Whatman No. 4-filter paper.
2.4. Determination of the Dry Residue Content
Dry residue content was determined according to the European Pharmacopoeia (Ph. Eur. 10.0, method 2.8.16) [15]. Briefly, 2.0 g of each liquid extract was transferred into a pre-weighed flat-bottom dish and evaporated to dryness on a water bath. The residue was then dried in a ventilated oven (FED 56, BINDER GmbH, Tuttlingen, Germany) at 105 °C for 3 h, cooled to room temperature in a desiccator, and weighed. The dry residue content was calculated as the percentage (w/w) of the initial sample mass.
2.5. Determination of TPC and TFC
The TPC and TFC of the different extracts were quantified using the Folin–Ciocalteu and aluminum chloride assays, respectively, as reported by Bianchi et al. [16]. For TPC, 400 µL of the aqueous extract was mixed with 40 µL of the Folin–Ciocalteu reagent and, after 5 min., 400 µL of a Na2CO3 solution (7% w/v). Final volume of 1 mL was reached with water. After incubation in the dark at room temperature for 90 min., the absorbance was measured at λ=765 nm by Hitachi UV 2000 spectrophotometer (Hitachi, Tokyo, Japan). For TFC, the aqueous extract was mixed with 30 µL of NaNO2 solution (5% w/v). After 5 min., 30 µL of AlCl3 solution (10% w/v) was added. Following a 1 min. incubation, 200 µL NaOH (1 M) was added. Final volume of 1 mL was reached with water. After 10 min. of incubation at room temperature, the absorbance was measured at λ=510 nm by Hitachi UV 2000 spectrophotometer (Hitachi, Tokyo, Japan). Phenol and flavonoid amount were calculated using standard calibration curves generated with known concentrations of gallic acid or catechin, respectively. TPC and TFC values are expressed as milligrams of gallic acid equivalents per gram of extract (mg GAE/g extract) and milligrams of catechin equivalents per gram of extract (mg CE/g extract), respectively. Data are reported as mean ± S.D. of three independent experiments.
2.6. HPLC-DAD Analysis
The phytochemical profile of the extracts was investigated by high-performance liquid chromatography coupled with diode-array detection (HPLC-DAD). The solid samples were dissolved in dimethylformamide/water solution (9:1) with a final concentration of 1,8 mg/mL. Analyses were performed using a Shimadzu LC-20 chromatographic system (Shimadzu, Kyoto, Japan) equipped with a diode-array detector and an Ascentis Express C18 analytical column (150 × 4.6 mm, 2.7 μm; Supelco, Darmstadt, Germany). The mobile phase consisted of solvent A (water/phosphoric acid, 99:1, v/v) and solvent B (methanol/acetonitrile/phosphoric acid, 49.5:49.5:1, v/v/v). Chromatographic separation was achieved using the following gradient elution program: 95% A to 77% A over 34 min., maintained at 77% for 3 min., then decreased to 74% at 60 min., 60% at 85 min., 20% at 90 min., and 0% at 92 min., for a total analysis time of 105 min. The flow rate was set at 1.0 mL min⁻¹, the column temperature was maintained at 25 °C, and the injection volume was 5 μL. UV–Vis spectra were acquired over the wavelength range of 190–500 nm, while chromatograms were recorded at λ=280 and λ=330 nm (±2 nm). Compound identification was achieved by comparing retention times and UV–Vis spectral characteristics with those of authenticated reference standards available in an in-house spectral library.
2.7. Optimization of the Aqueous Extraction by DoE
The aqueous extraction of polyphenolic and flavonoid compounds from P. guajava leaves was optimized using a DoE approach implemented in MODDE Pro 12.1 software (Sartorius Data Analytics AB, Umeå, Sweden). Three-level design model was performed to identify the optimal extraction conditions. Extraction temperature and time were selected as independent variables, while the drug-to-solvent ratio was maintained constant at 1:30 (w/v). The optimized responses were TPC, determined by the Folin–Ciocalteu assay and expressed as GAE, and TFC, determined by the AlCl₃ colorimetric method. The experimental matrices were generated according to the expression:
where l is the number of factor levels, v the number of variables, and c the number of center points. Three center points were included in each design to estimate experimental reproducibility and model pure error. The three-level full factorial design consisted of seven and twelve experimental runs, performed according to the randomized order generated by the software.
2.7.1. Extraction Procedures for DoE Experimental Runs
For each run, 50 g of dried and grinded leaves were extracted with 1.5 L of RO water under the experimental conditions defined by the design matrix. Extraction experiments were conducted at the temperatures and times specified by the experimental matrix under continuous stirring using a VELP PW overhead stirrer (VELP Scientifica, Monza and Brianza, Italy), equipped with a mechanical stirring shaft. At the end of each extraction, the aqueous extract was separated from the plant material by preliminary filtration through a 300 μm stainless-steel mesh, followed by filtration using Whatman No. 4-filter paper. The filtered extracts were subsequently analyzed for TPC and TFC determination.
2.8. Comparative Screening of Macroporous Resins for Flavonoid Enrichment
A preliminary screening was carried out to select the most suitable resin for the enrichment of flavonoid markers from the optimized aqueous extract of P. guajava. Two adsorbent resins, referred to as Resin A (110 Å pore size, 800 m²/g surface area, polystyrene-based) (PAD500, Purolite™ Resins, Ecolab, King of Prussia, PA, USA) and Resin B (70 Å pore size, 930 m²/g surface area, styrene–divinylbenzene copolymer) (Sepabeads™ SP825L, Mitsubishi Chemical Corp., Tokyo, Japan), were tested under the same experimental conditions.
For each test, 20 mL of resin were activated in 98% v/v ethanol for 24 h and then washed with RO water to remove residual ethanol. The activated resin was placed in contact with 400 mL of optimized aqueous extract in a 500 mL flask. Adsorption was performed at room temperature under mild and constant agitation [insert shaker model and rpm, if applicable]. During adsorption, aliquots were collected after 20, 60, 120, and 180 min. and analyzed by HPLC-DAD to monitor the residual concentration of hyperoside, guaijaverin, avicularin, and guaijaverin derivatives. The residual marker percentage and adsorption percentage were calculated as follows:
where C0 is the initial marker concentration, Ct is the concentration at each sampling time, and C180 is the concentration after 180 min.
After adsorption, the residual extract was removed, and the resin was washed with 40 mL of RO water at 4 °C for 20 min. The washing fraction was collected and analyzed by HPLC-DAD. The adsorbed compounds were then desorbed using four consecutive extraction steps with EtOH/H2O 70/30 v/v, each lasting 24 h. The hydroalcoholic desorption fractions were collected separately and analyzed by HPLC-DAD. Desorption recovery was calculated with respect to the amount effectively retained by the resin after the washing step. Resin selection was based on adsorption efficiency, desorption recovery, and overall recovery of the selected flavonoid markers.
2.9. Flavonoid Enrichment Using Macroporous Resin
Flavonoid enrichment was performed by adsorption chromatography using a glass column (20 cm × 2.3 cm i.d.) packed with 50 mL of Sepabeads™ SP825L macroporous polymeric resin (Mitsubishi Chemical Corp., Tokyo, Japan). Prior to use, the resin was conditioned according to the manufacturer’s instructions. The optimized aqueous extract was loaded onto the column at a flow rate of 1 bed volume (BV) h⁻¹ until the resin’s adsorption capacity was reached. The column was then rinsed with cold RO water (4 °C) at 2 BV h⁻¹ for 1 h to remove non-adsorbed residual matrix components. Flavonoid-rich compounds retained on the resin were subsequently recovered by elution with an ethanol/water mixture (70:30, v/v), with the resin left in contact with the eluent at room temperature for 24 h to ensure complete desorption. The desorption cycle was repeated four times to maximize flavonoid recovery.
2.10. Preparation of the Maltodextrin-Supported Enriched Extract
The hydroalcoholic eluates obtained from the adsorption chromatography were pooled (167.41 g; dry residue: 3.22%; TFC: 11.07%) and concentrated under reduced pressure using a rotary evaporator to remove ethanol, yielding a concentrated aqueous extract.
Maltodextrin (2.30 g, corresponding to 30% w/w of the total hydroalcoholic eluates dry residue) was added to the concentrated aqueous extract as a carrier. The mixture was stirred for approximately 1 h to ensure complete dissolution and homogeneous dispersion of the carrier. The resulting suspension was transferred to a drying dish and dried in a laboratory oven (FED 56, BINDER GmbH, Tuttlingen, Germany) at 57 °C for 4 days.
After drying, the solid material was gently ground using a mortar and pestle to obtain a homogeneous powder. The final P. guajava maltodextrin-supported flavonoid-enriched extract (PGE) was characterized by HPLC-DAD and stored in airtight amber glass containers at room temperature, protected from light, until further use.
2.11. In Vitro Antioxidant and Scavenging Activity Assays
The antioxidant and radical scavenging capacities of PGE were evaluated through DPPH•, superoxide anion (SOD-like), and hydrogen peroxide (catalase-like) scavenging assays using a Hitachi UV 2000 spectrophotometer (Hitachi, Tokyo, Japan). For the DPPH• assay, different concentrations of PGE were incubated with an 86 μM DPPH• ethanolic solution at room temperature in the dark for 10 min., and the absorbance was measured at λ=517 nm. The SOD-like activity was assessed using a cell-free, non-enzymatic method for generating superoxide anion, following the protocol described by Tomasello [17]. Briefly, various extract concentrations were mixed with 100 mM triethanolamine–diethanolamine buffer (pH 7.4), 3 mM NADH, 25 mM EDTA/12.5 mM MnCl₂, and 10 mM β-mercaptoethanol. After a 20-min. incubation at room temperature in the dark, NADH oxidation inhibition was monitored by reading the absorbance at λ=340 nm for 5 min. The catalase-like activity was determined as reported by Bianchi [16]; different concentrations of PGE were mixed with 24 mM H₂O₂ in a potassium phosphate buffer (pH 7.4) to a final volume of 1 mL, incubated for 10 min. at room temperature in the dark, and measured at λ=240 nm. For all assays, results were calculated as the percentage of scavenging or inhibition relative to the control and expressed as IC₅₀ values (mean ± S.D.) obtained from three independent experiments.
2.12. Cell Culture
RAW 264.7 cells (murine macrophages ATCC number TIB-71TM) were maintained in Dulbecco’s Modified Eagle Medium (DMEM, Gibco 41966-029) high glucose (4.5 g/L) containing 1 mM pyruvate, 4 mM Glutamine, 100 U/mL penicillin, 100 μg/mL streptomycin, and 10% Fetal Bovine Serum (FBS, Gibco A5256701) in cell culture incubator, at 37°C, with 5% CO2 and humified atmosphere. The culture medium was changed each 2/3 days. Cells were mechanically harvested twice a week, when ~80% confluence was reached, using sterile cellular scraper and centrifuged at 300 x g for 5 min. The cell pellet was resuspended in fresh medium and either expanded in a flask or seeded in multiwell plates for performing the following experiments.
2.13. MTT Assay
Cells were seeded in 96-well plates at a density of 1×10⁴ cells per well. After 48 h, cells were treated with increasing concentrations of PGE (5, 10, 25, 50 μg CE/mL) for 24 h. Then, the medium was replaced with fresh medium containing MTT at 0.5 mg/mL, and cells were incubated for 1 h in a cell culture incubator. Subsequently, the MTT solution was removed, and DMSO (100 μL/well) was added to solubilize the formazan crystals [18]. After complete solubilization, absorbance was measured spectrophotometrically at =570 nm using a microplate reader (Sinergy HT, Biotek). Results are expressed as a percentage of cell viability vs untreated control cells and reported as the mean ± S.D. of four independent experiments.
2.14. •NO Release Assay
The quantification of •NO was carried out by applying the Griess-Ilosvay reaction [19]. Briefly, RAW 264.7 cells were seeded in 96-well plates at 5×10⁴ cells per well. After 48 h, cells were pretreated for 6 h with different concentrations of PGE (5, 10, 25, 50 μg CE/mL) and then activated with LPS (1 μg/mL) for 18 h. After incubation, 100 µL of culture medium was collected from each well and mixed with 100 µL of Griess-Ilosvay reagent to quantify nitrite content (derived directly from the oxidation of •NO). Following 15 min. of incubation, the absorbance of the solution at λ=546 nm was measured by a microplate reader (Sinergy HT, Biotek). Results are expressed as a percentage of •NO release vs LPS-activated cells and reported as the mean ± S.D. of four independent experiments.
2.15. Intracellular ROS Quantification
Intracellular ROS production was evaluated using the probe 2’,7’-dichlorodihydrofluorescein diacetate (DCFH-DA), as reported by Bianchi [16]. Briefly, RAW 264.7 cells were seeded in 24-well plates at a density of 3×10⁵ cells/well. After 24 h, cells were pretreated with different concentrations of PGE (5, 10, 25, 50 μg CE/mL) and then activated with LPS (1 μg/mL) for 18 h. After incubation, DCFH-DA (5 μM) was added to the culture medium and incubated for 30 min. Then, cells were rinsed twice with ice-cold PBS (250 μL/well) and lysed with a 2.5 mg/mL digitonin solution (250 μL/well) for 1 h at 4°C in the dark. Cell lysates were subsequently centrifuged at 13,000 × g for 10 min., and fluorescence intensity was measured in 100 μL of supernatant at λex=488 nm and λem=525 nm using a microplate reader (Sinergy HT, Biotek).
2.16. Statistical Analysis
DoE data were analyzed using multiple linear regression (MLR) and analysis of variance (ANOVA). Model adequacy and performance were evaluated based on the determination coefficient (R2), cross-validated prediction coefficient (Q2), model validity, reproducibility, lack-of-fit, and residual distribution analysis. Models were considered acceptable when characterized by high R2 and Q2 values, a minimal discrepancy between these two parameters, and a non-significant lack-of-fit relative to the pure error estimated from the center points.
For all other assays, statistical comparisons were performed using one-way ANOVA coupled with Tukey’s multiple comparison test. For all statistical tests, a p-value less than 0.05 (p < 0.05) was considered statistically significant.
3. Results
3.1. Preliminary Phytochemical Characterization of P. guajava Leaves
The exhaustive hydroalcoholic extraction provided a preliminary phytochemical characterization of P. guajava leaves and served as a reference for the successive optimization of the aqueous extraction process. The analytical results obtained from two independent exhaustive extractions are summarized in Table 1.
The two extraction replicates showed a high degree of consistency, confirming the homogeneity of the plant material. The mean dry residue was 1.04 ± 0.021%, while the average TPC and TFC were 0.35 ± 0.028% and 0.077 ± 0.006%, respectively. HPLC-DAD analysis showed the presence of the characteristic flavonoid glycosides hyperoside, guaijaverin, and avicularin, with mean concentrations of 0.0184 ± 0.0022%, 0.0078 ± 0.0007%, and 0.0074 ± 0.0005%, respectively (Figure 1, Table 2).
In addition, the overall content of guaijaverin and structurally related derivatives reached 0.0444%, highlighting this class of compounds as a major component of the flavonoid fraction.
The chromatographic analysis allowed the qualitative identification of the principal flavonoid markers based on their retention times and UV–Vis spectral traits. As reported in Table 2, hyperoside, guaijaverin, and avicularin were eluted at retention times of 18.11, 22.43, and 25.79 minutes, respectively. The representative HPLC-DAD chromatogram shown in Figure 1 illustrates the phytochemical profile of the hydroalcoholic extract and the satisfactory chromatographic resolution of the selected marker compounds. Overall, the exhaustive hydroalcoholic extraction confirmed the presence of the principal flavonoid markers in P. guajava leaves and established the reference phytochemical profile, which was subsequently used to evaluate the efficiency of the optimized aqueous extraction and the enrichment process.
3.2. Optimization of the Aqueous Extraction by Design of Experiments
The aqueous extraction process was optimized through a sequential Design of Experiments (DoE), with total polyphenol content (TPC) and total flavonoid content (TFC) as target response variables. Extraction temperature and time were evaluated as independent variables, while the drug-to-solvent ratio was maintained constant at 1:30 (w/v). A three-level factorial design was performed to define the experimental domain and determine the optimal operating conditions. Second-order polynomial models were fitted to the experimental data by multiple linear regression. The diagnostic plots obtained for the TPC model are shown in Figure 2. The replicate plot showed close agreement among the center-point runs, supporting satisfactory experimental reproducibility .
The model showed a high goodness of fit, with R² = [0.995], and satisfactory predictive ability, with Q² = [0.974]. The reproducibility value was 1. The model-validity parameter was not available in the current summary-of-fit output and was therefore not interpreted; the lack-of-fit test obtained from the ANOVA should be reported separately (p = the probability for lack of fit could not be calculated). The coefficient plot indicated that extraction temperature exhibited the largest positive coefficient, while extraction time contributed a smaller positive effect. Negative coefficients for the retained quadratic and interaction terms indicated curvature in the response surface and a progressive reduction in TPC improvement at the upper end of the investigated domain. The residual normal probability plot displayed an approximately linear distribution. No deleted studentized residual exceeded the diagnostic limits, which supports the adequacy of the fitted model.
A comparable statistical evaluation was performed for the TFC model (Figure 3). The center-point responses demonstrated satisfactory agreement, indicating strong repeatability under identical experimental conditions. The model exhibited a high goodness of fit (R² = [0.985]) and satisfactory predictive performance (Q² = [0.871]). Model validity and reproducibility were [0.478] and [0.990], respectively. The lack-of-fit test was significant for p = 0.125.
Temperature exhibited the largest positive coefficient and was the factor most strongly associated with TFC within the investigated domain. In contrast, extraction time contributed minimally. Negative coefficients for the quadratic and interaction terms indicated curvature of the response surface, suggesting that improvements in TFC approached a plateau at higher temperatures. The residual normal probability plot revealed no significant deviation from linearity, and all deleted studentized residuals remained within diagnostic limits.
The predicted response surfaces for TPC and TFC are shown in Figure 4. Within the investigated experimental domain, both responses increased primarily with temperature, whereas extraction time had a less pronounced influence. The highest predicted values were observed at high temperatures and intermediate extraction times. The shaded regions extending beyond the experimental domain represent model extrapolation and were not considered when selecting the operating conditions. Because 95 °C corresponded to the upper temperature limit investigated, no prediction beyond this value was used to define the optimum.
The local robustness of the selected operating conditions was evaluated using design-space analysis based on the TFC response. Figure 5 shows that the operating point at 95 °C and 24 min. is situated within the green acceptance region, which corresponds to a predicted probability of process failure below 1%. This finding suggests that minor variations in temperature and extraction time near the selected point are unlikely to result in the TFC response exceeding the predefined acceptance criterion. Consequently, the analysis supports the operational robustness of the selected conditions within the laboratory-scale domain investigated.
Overall, the combined evaluation of model performance, regression diagnostics, predicted response surfaces, and design-space analysis supported the selection of a drug-to-solvent ratio of 1:30 (w/v), an extraction temperature of 95 °C, and an extraction time of 24 min (Table 3) as the operating conditions used for preparation of the optimized aqueous extract. These conditions represent the selected optimum within the investigated experimental domain.
Experimental verification under the selected conditions yielded a TPC of 76 mgGAE/g v.m, a TFC of 15.6 mgCE/g v.m. (v.m.: dry vegetal matrix). The differences between predicted and experimentally observed TPC and TFC values were -9.52 % and +1.30 %, respectively. These results confirm the predictive adequacy of the models on flavonoids content.
3.3. Comparative Screening of Macroporous Resins
To determine the optimal stationary phase for the enrichment and purification process, the static adsorption kinetics and subsequent desorption efficiencies of two macroporous resins (Resin A and Resin B) were systematically compared using avicularin, hyperoside, guaijaverin, and guaijaverin derivatives as target reference flavonoids. The static adsorption profiles revealed a time-dependent decrease in the concentration of all target analytes for both polymeric matrices. Although both resins exhibited a comparable kinetic trend, Resin B demonstrated a faster uptake rate per unit time than Resin A. As illustrated in the kinetic curves (Figure 6 and Figure 7), Resin B achieved a more pronounced depletion of the target compounds within the initial 0–60 min interval.
The downstream recovery performance further corroborated the operational superiority of Resin B. The fractional desorption profiles across consecutive elution steps (elu1, elu2, and elu3) highlight a highly efficient elutropic displacement from the resins. Specifically, Resin B yielded a cumulative recovery rate of 89.40% for the reference flavonoids. In contrast, Resin A exhibited a significantly lower total desorption efficiency, recovering only 82.22% of the bound analytes under identical conditions. Consequently, Resin B was selected as the optimal matrix for the enrichment process.
3.4. Column Enrichment on Resin B
Following the selection of Resin B (Sepabeads™ SP825L) as the most suitable adsorbent resin, the optimized aqueous extract (6.15 L) was subjected to column enrichment under the selected operating conditions. The recovery of the principal flavonoid markers was evaluated by HPLC-DAD analysis and the results are summarized in Figure 8.
The enrichment procedure showed high recovery efficiencies for avicularin and guaijaverin, reaching 93.84% and 95.16%, respectively. In contrast, hyperoside exhibited a substantially lower recovery (11.52%), which consequently reduced the overall recovery of guaijaverin and related derivatives to 56.02% (Figure 8). The chromatographic profile of the enriched extract was subsequently compared with that of the crude hydroalcoholic extract. As shown in Figure 9, the overall chromatographic fingerprint remained comparable to that of the original extract (Figure 1), while a selective increase in the relative abundance of the target flavonoid markers was observed.
No qualitative changes or additional peaks were detected after the enrichment process, indicating that the adsorption–desorption procedure preserved the phytochemical composition of the extract while improving the concentration of the selected flavonoid markers. These results demonstrate that the resin-based enrichment process effectively increased the concentration of the principal flavonoid markers without altering the overall chromatographic fingerprint of the P. guajava leaf extract.
3.5. Preparation of the Maltodextrin-Supported Enriched Extract (PGE)
The flavonoid-enriched eluates obtained after resin chromatography were successfully concentrated under reduced pressure to yield a concentrated aqueous extract. The addition of maltodextrin (30% w/w of the extract dry residue) followed by controlled drying produced a homogeneous free-flowing powder, hereafter referred to as PGE (Psidium guajava enriched extract).
HPLC-DAD analysis confirmed that the drying and formulation processes did not alter the chromatographic fingerprint of the enriched extract. The final formulation maintained the characteristic profile of P. guajava flavonoids, allowing the quantitative determination of the selected marker compounds. The PGE extract contained 2.113% avicularin, 1.991% guaijaverin, and 0.837% hyperoside, corresponding to a total content of 7.749% flavonoid markers and related derivatives. The resulting standardized powder was subsequently used for the in vitro antioxidant and anti-inflammatory assays.
3.6. Antioxidant Characterization of PGE
PGE antioxidant activity was evaluated against three reactive species: DPPH• radical via DPPH• test, superoxide anion () via SOD-like activity assay, and hydrogen peroxide (H2O2) via Catalase-like activity assay. The results, expressed as IC50 values and reported in Table 4, showed a potent antioxidant activity of PGE either on radical (DPPH•: 1.22±0.013 μg CE/mL; : 0.043±0.0067 μg CE/mL) and non-radical (H2O2: 9.51±0.15 μg CE/mL) reactive molecules.
3.7. Anti-Inflammatory Activity
3.7.1. Safety Assessment
PGE safety on RAW 264.7 macrophages was assessed by MTT test performed after an exposure time of 24 h to different extract concentrations (5 – 10 – 25 – 50 μg CE/mL). As evident from Figure 10, none of the tested concentrations affected cell viability.
3.7.2. Anti-Inflammatory Activity on LPS-Activated RAW 264.7 Cells
PGE anti-inflammatory activity was evaluated by measuring release of •NO in RAW 264.7 cells activated with LPS (1 μg/mL) for 18 h, following a pre-treatment with different extract concentration (5 – 10 – 25 – 50 μg CE/mL) for 6 h. Results, presented in Figure 11, showed a marked anti-inflammatory activity of PGE, with a dose-dependent reduction of •NO release and a complete recovery from LPS stress at the highest concentration (50 μg CE/mL).
3.7.3. ROS Quantification on LPS-Activated RAW 264.7 Cells
Potential anti-oxidant activity of PGE possibly linked with the found anti-inflammatory properties was evaluated applying the same experimental model and measuring intracellular ROS production by DCFH-DA method. Results, reported in Figure 10, shown no significant activity of the extract in reducing ROS production in LPS-activated macrophages execpt for the highest concentration of 50µg CE/mL (Figure 12).
4. Discussion
The present study was designed to address a central limitation in the development of botanical ingredients: the difficulty of translating a chemically complex and naturally variable plant matrix into a reproducible, analytically defined, and biologically active botanical ingredient. P. guajava leaves provide a valuable source of phytochemicals, particularly flavonoid glycosides, which are well known for their significant health benefits in humans [20,21]. The main finding of this work is that a sequential workflow comprising green extraction, design of experiments (DoE)-based process optimization, marker-oriented HPLC-DAD characterization, macroporous resin enrichment, and biological validation can yield a standardized P. guajava leaf ingredient with a controlled flavonoid profile and significant antioxidant and anti-inflammatory properties.
The preliminary hydroalcoholic extraction confirmed the presence of hyperoside, guaijaverin, avicularin, and related derivatives, supporting the suitability of these compounds as analytical markers for the selected plant material [22]. This is consistent with previous phytochemical investigations describing guava leaves as a rich source of quercetin-derived flavonol glycosides and other phenolic compounds [6,9,23,24]. From a quality-control perspective, the choice of individual flavonoid markers is particularly relevant. Total polyphenol and total flavonoid assays provide useful screening information, but they cannot fully describe the compositional identity of a botanical extract [25]. Conversely, the HPLC-DAD quantification of characteristic compounds allows a more robust definition of the extract and provides a practical basis for monitoring the efficiency of extraction, enrichment, and drying steps. This approach is in line with current quality-control strategies for botanical products, where chromatographic fingerprints and selected marker compounds are increasingly used to support batch-to-batch consistency [10,12].
The DoE-based extraction study revealed that the process parameter temperature was the most influential variable affecting the recovery of phenolic and flavonoid compounds, while extraction time had a minor effect within the tested range. This result is in line with the principles of extractive chemistry as applied to plant matrices. Increased temperature positively affects solvent diffusivity and viscosity, accelerating cell permeability by altering cell wall structures and thereby increasing metabolite mass transfer [26,27]. In addition, a short extraction time at controlled high temperatures can limit unnecessary thermal exposure and thermal degradation, reducing processing time. The use of water as the extraction solvent also offers sustainability benefits in line with green extraction principles [28,29]. The optimized aqueous extraction method therefore achieves a balance between extraction efficiency, operational simplicity, and suitability for food-grade or nutraceutical applications.
An important element of the proposed workflow is the transition from a crude aqueous extract to a flavonoid-enriched fraction using a macroporous adsorption resin. The comparative screening showed that Resin B exhibited a more favorable adsorption/desorption behavior than Resin A, with faster uptake of the target compounds and higher cumulative recovery. The performance of Resin B may be explained by a better affinity between the physicochemical properties of the resin and those of the selected flavonoid glycosides. The adsorption process in macroporous resins is generally guided by a combination of various factors, including hydrophobic interactions, π–π interactions, hydrogen bonding, pore accessibility, and the balance between molecular polarity and resin surface chemistry [30,31].
The different recoveries observed among the target flavonoids, specifically the lower recovery of hyperoside compared with avicularin and guaijaverin, may reflect differences in sugar moiety, polarity, spatial arrangement, and binding/desorption strength [32]. This result indicates that the enrichment process isn’t merely quantitative but also selective, and that the resin can significantly influence the extract’s final phytochemical profile [33]. However, based on the comparative resin screening, hyperoside recovery could be improved by implementing a two-column enrichment strategy rather than a single-column process. In this configuration, the fraction of hyperoside not adsorbed in the first column could pass through a second resin bed, where the lower concentration of competing phytochemicals may favor its retention and recovery. This strategy may therefore enhance the recovery of hyperoside while preserving the selective enrichment of avicularin and guaijaverin.
The chromatographic comparison between the crude and enriched extracts showed that the resin-based process increased the relative abundance of the selected markers without introducing evident qualitative changes in the HPLC-DAD fingerprint. This is an important outcome for the development of standardized botanical ingredients. Unlike purification strategies directed at isolating single compounds, the process preserved the phytochemical identity of the native leaf extract while concentrating a defined flavonoid fraction. Such an approach is particularly suitable for botanicals, where the biological activity may depend not only on individual constituents but also on additive or synergistic interactions among coexisting metabolites [5]. In this sense, the enriched extract can be considered a refined phytocomplex rather than a purified single-molecule preparation.
The support of the enriched extract on maltodextrin further contributes to the technological relevance of the proposed process. Liquid or semi-solid botanical extracts are often difficult to handle, dose, store, and incorporate into final formulations [34].
The conversion of the enriched fraction into a homogeneous powder improves practical applicability and supports future development into oral solid dosage forms, functional ingredients, or nutraceutical formulations. Although the addition of a carrier inevitably dilutes the concentration of the active fraction, the final PGE retained a defined flavonoid content and preserved the characteristic chromatographic profile of P. guajava. This confirms that the drying conditions and the selected carrier did not substantially alter the targeted phytochemical composition. Future stability studies under accelerated and long-term storage conditions will be necessary to confirm the suitability of this formulation strategy over time [14].
The biological findings demonstrate the functional significance of phytochemical enrichment. PGE exhibited pronounced antioxidant activity in cell-free assays. The substantial activity observed against DPPH•, superoxide anion, and hydrogen peroxide aligns with the presence of flavonol glycosides, whose phenolic hydroxyl groups facilitate electron or hydrogen transfer reactions and contribute to the neutralization of reactive species [35]. Nevertheless, the interpretation of these results should extend beyond direct chemical scavenging. In complex extracts like PGE, the antioxidant activity may result from the collective action of multiple phenolic constituents, including minor compounds not individually quantified in this study [36].
No significant cytotoxicity was observed in RAW 264.7 cells following PGE treatment at the tested concentrations, supporting the suitability of these concentrations for the subsequent biological assays. Macrophages are strongly activated by LPS stimulation, which induces •NO production by upregulating inducible nitric oxide synthase (iNOS) [37]. In this experimental model, •NO release levels serve as a marker of inflammatory activation. Results clearly showed that PGE reduced •NO production in a dose-dependent manner, restoring values close to those of unstimulated control cells at the highest concentration. These findings are consistent with previous studies demonstrating that guava leaf extracts and guava flavonoid fractions attenuate LPS-induced inflammatory responses by reducing nitric oxide production and modulating iNOS, COX-2, NF-κB, and MAPK-related pathways [38,39,40]. The presence of avicularin in the enriched extract is particularly relevant, since this flavonoid has been reported to inhibit LPS-induced •NO and PGE production in RAW 264.7 macrophages through suppression of ERK phosphorylation [39,41].
Interestingly, the intracellular ROS assay showed a significant reduction only at the highest tested concentration. This result suggests that the anti-inflammatory effect of PGE cannot be explained by a generalized intracellular ROS-scavenging activity across all concentrations. Rather, the reduction of •NO may involve more specific modulation of inflammatory signaling pathways, including iNOS expression, NF-κB activation, or MAPK phosphorylation. This interpretation is coherent with the literature on flavonoid-rich guava extracts and avicularin, but it remains to be experimentally confirmed in the present model.
5. Conclusions
This research contributes to the valorization of unutilized vegetal material, such as P. guajava pruning-derived biomass, to source of bioactive compounds. Considering that this matrix is originated from a subtropical species now cultivated in Sicily, this gain even more importance in the prospective of agricultural diversification forced by the impact of climate change in the Mediterranean area.
In the present study, a reproducible workflow to obtain a characterized, enriched and biologically validated natural ingredient from P. guajava leaves, applicable to other plant matrices, was formulated. A DoE approach was applied to determine the optimal condition of extraction (95°C, 24min) followed by the flavonoids enrichment by macroporous resin to increase the concentration of avicularin and guaijaverin without substantially altering the overall chromatographic fingerprint. The final extract was supported with maltodextrin and phytochemically and biologically characterized, revealing a strong antioxidant and anti-inflammatory properties, which sustain the potential application of PGE as a natural ingredient for nutraceutical and cosmetic application.
Additional research is needed to further characterize the phytocomplex by comprehensive LC MS/MS analysis and to scale up the process for industrial application. Also, the biological activities evaluated should be deeper investigated with in vivo inflammation models for a potential application for human diseases treatment and prevention.
Author Contributions
Conceptualization, C.D.G., R.A., and G.A.M.; methodology, C.D.G., R.A., and G.A.M.; software, M.M., S.B., A.S., F.P.; validation, M.M., A.A.T., S.B. and D.C..; formal analysis, A.S.; investigation, M.M., A.A.T., S.B., D.C. and F.P.; resources, M.M., S.B., C.D.G., R.A., and G.A.M; data curation, M.M., S.B., A.S. and F.P.; writing—original draft preparation, M.M., S.B., C.D.G., R.A., and G.A.M.; writing—review and editing, M.M., S.B., C.D.G., R.A., and G.A.M; visualization, M.M., A.A.T., D.C.; C.D.G., R.A., and G.A.M.; project administration, R.A. and G.A.M; funding acquisition, R.A. and G.A.M. All authors have read and agreed to the published version of the manuscript.
Funding
This research received no external funding.
Institutional Review Board Statement
Not applicable.
Informed Consent Statement
Not applicable.
Data Availability Statement
The data presented in this study are available within the article. Further inquiries can be directed to the corresponding author.
Acknowledgments
The authors would like to acknowledge Bionap s.r.l. for the technical support. The authors wish to thank PLANTA (Autonomous Center for Research, Documentation and Training, Palermo, Italy) for the continuous support.
Conflicts of Interest
The authors declare no conflicts of interest.
Abbreviations
The following abbreviations are used in this manuscript:
| DoE | Design of Experiments |
| HPLC-DAD | High-Performance Liquid Chromatography with Diode-Array Detection analysis |
| LPS | Lipopolysaccharide |
| DPPH | 2,2-diphenyl-1-picrylhydrazyl |
| DCFH-DA | 2’,7’-Dichlorodihydrofluorescein diacetate |
| DMSO | Dimethyl Sulfoxide |
| RO | Reverse osmosis |
| TPC | Total phenolic content |
| TFC | Total flavonoid content |
| GAE | Gallic acid equivalent |
| CE | Catechin equivalent |
| S.D. | Standard Deviation |
| PGE | Psidium guajava enriched extract |
| SOD | Superoxide Dismutase |
| NADH | Nicotinamide Adenine Dinucleotide reduced form |
| DMEM | Dulbecco’s Modified Eagle Medium |
| FBS | Fetal Bovine Serum |
| ROS | Reactive oxygen species |
| MLR | Multiple linear regression |
| v.m. | Dry vegetal matrix |
| iNOS | inducible nitric oxide synthase |
| COX-2 | cyclooxygenase-2 |
| NF- κB | nuclear factor kappa-light-chain-enhancer of activated B cells |
| MAPK | Mitogen-Activated Protein Kinase |
References
- Atanasov, A.G.; Waltenberger, B.; Pferschy-Wenzig, E.M.; Linder, T.; Wawrosch, C.; Uhrin, P.; Temml, V.; Wang, L.; Schwaiger, S.; Heiss, E.H.; Rollinger, J.M.; Schuster, D.; Breuss, J.M.; Bochkov, V.; Mihovilovic, M.D.; Kopp, B.; Bauer, R.; Dirsch, V.M.; Stuppner, H. Discovery and resupply of pharmacologically active plant-derived natural products: A review. Biotechnol. Adv. 2015, 33, 1582–1614. [Google Scholar] [CrossRef] [PubMed]
- Acquaviva, R.; Malfa, G.A.; Di Giacomo, C. Plant-Based Bioactive Molecules in Improving Health and Preventing Lifestyle Diseases. Int. J. Mol. Sci. 2021, 22. [Google Scholar] [CrossRef] [PubMed]
- Atanasov, A.G.; Zotchev, S.B.; Dirsch, V.M.; Supuran, C.T. Natural products in drug discovery: advances and opportunities. Nat. Rev. Drug Discov. 2021, 20, 200–216. [Google Scholar] [CrossRef] [PubMed]
- Fierascu, R.C.; Fierascu, I.; Baroi, A.M.; Ortan, A. Selected Aspects Related to Medicinal and Aromatic Plants as Alternative Sources of Bioactive Compounds. Int. J. Mol. Sci. 2021, 22, 1521. [Google Scholar] [CrossRef] [PubMed]
- Vaou, N.; Stavropoulou, E.; Voidarou, C.C.; Tsakris, Z.; Rozos, G.; Tsigalou, C.; Bezirtzoglou, E. Interactions between Medical Plant-Derived Bioactive Compounds: Focus on Antimicrobial Combination Effects. Antibiotics 2022, 11, 1014. [Google Scholar] [CrossRef] [PubMed]
- Sahal, A.; Chaudhary, S.; Hussain, A.; Arora, S.; Dobhal, A.; Ahmad, W.; Kumar, V.; Kumar, S. A comprehensive review on the nutritional composition, bioactive potential, encapsulation techniques, and food system applications of guava (Psidium guajava L.) leaves. Grain Oil Sci. Technol. 2025, 8, 64–74. [Google Scholar] [CrossRef]
- Gutiérrez, R.M.P.; Mitchell, S.; Vargas Solis, R. Psidium guajava: A review of its traditional uses, phytochemistry and pharmacology. J. Ethnopharmacol. 2008, 117, 1–27. [Google Scholar] [CrossRef] [PubMed]
- Naseer, S.; Hussain, S.; Naeem, N.; Pervaiz, M.; Rahman, M. The phytochemistry and medicinal value of Psidium guajava (guava). Clin. Phytosci. 2018, 4, 32. [Google Scholar] [CrossRef]
- Díaz-de-Cerio, E.; Verardo, V.; Gómez-Caravaca, A.M.; Fernández-Gutiérrez, A.; Segura-Carretero, A. Health effects of Psidium guajava L. leaves: An overview of the last decade. Int. J. Mol. Sci. 2017, 18, 897. [Google Scholar] [CrossRef] [PubMed]
- Xiong, H.; Yu, L.X.; Qu, H. Batch-to-batch quality consistency evaluation of botanical drug products using multivariate statistical analysis of the chromatographic fingerprint. AAPS PharmSciTech 2013, 14, 802–810. [Google Scholar] [CrossRef]
- Plyduang, T.; Monton, C.; Maneewattanapinyo, P.; Suksaeree, J. Advancing sustainable phytochemical extraction through design of experiments: A data-driven pathway toward low-emission natural product processing. Sustain. Chem. Clim. Action 2025, 7, 100137. [Google Scholar] [CrossRef]
- Mizzi, L.; Chatzitzika, C.; Gatt, R.; Valdramidis, V. HPLC analysis of phenolic compounds and flavonoids with overlapping peaks. Food Technol. Biotechnol. 2020, 58, 12–19. [Google Scholar] [CrossRef] [PubMed]
- Juárez-Robles, E.I.; Barrón-Velázquez, R.; Macías-Alonso, M.; Hernández-Soto, R.; Córdova-Guerrero, I.; Marrero, J.G. Recovery of bioactive plant compounds from biomass waste using sustainable methods: A review. RSC Sustain. 2026, 4, 2463–2490. [Google Scholar] [CrossRef]
- Ng, L.H.; Ling, J.K.U.; Hadinoto, K. Formulation strategies to improve the stability and handling of oral solid dosage forms of highly hygroscopic pharmaceuticals and nutraceuticals. Pharmaceutics 2022, 14. [Google Scholar] [CrossRef] [PubMed]
- European Directorate for the Quality of Medicines; HealthCare (EDQM). European Pharmacopoeia, 10th ed.; Council of Europe: Strasbourg, France, 2019. [Google Scholar]
- Bianchi, S.; Acquaviva, R.; Di Giacomo, C.; Tomasello, B.; Pappalardo, F.; Pino, A.; Naletova, I.; Condorelli, D.; La Mantia, A.; Barbagallo, I.; et al. Cynara cardunculus subsp. cardunculus (Wild Artichoke) Extract: Antimicrobial Activity and Cytotoxicity, Apoptosis Induction, and Chemosensitization in Colon Cancer Cells. Biology 2026, 15. [Google Scholar] [CrossRef] [PubMed]
- Tomasello, B.; Malfa, G.A.; Acquaviva, R.; La Mantia, A.; Di Giacomo, C. Phytocomplex of a standardized extract from red orange (Citrus sinensis L. Osbeck) against photoaging. Cells 2022, 11, 1447. [Google Scholar] [CrossRef] [PubMed]
- Di Giacomo, C.; Vanella, L.; Sorrenti, V.; Santangelo, R.; Barbagallo, I.; Calabrese, G.; Genovese, C.; Mastrojeni, S.; Ragusa, S.; Acquaviva, R. Effects of Tithonia diversifolia (Hemsl.) A. Gray extract on adipocyte differentiation of human mesenchymal stem cells. PLoS ONE 2015, 10, e0122320. [Google Scholar] [CrossRef] [PubMed]
- Acquaviva, R.; Malfa, G.A.; Santangelo, R.; Bianchi, S.; Pappalardo, F.; Taviano, M.F.; Miceli, N.; Di Giacomo, C.; Tomasello, B. Wild artichoke (Cynara cardunculus subsp. sylvestris, Asteraceae) leaf extract: Phenolic profile and oxidative stress inhibitory effects on HepG2 cells. Molecules 2023, 28, 2475. [Google Scholar] [CrossRef] [PubMed]
- Butt, E.; Altemimi, A.B.; Younas, A.; Butt, M.S.; Jalal, M.; Bhatty, M.; Abdi, G.; Aadil, R.M. Guava (Psidium guajava): A Brief Overview of Its Therapeutic and Health Potential. Food Chem. X 2025, 31, 103027. [Google Scholar] [CrossRef] [PubMed]
- Liu, C.; Jullian, V.; Chassagne, F. Ethnobotany, Phytochemistry, and Biological Activities of Psidium guajava in the Treatment of Diarrhea: A Review. Front. Pharmacol. 2024, 15, 1459066. [Google Scholar] [CrossRef] [PubMed]
- Huynh, H.D.; Nargotra, P.; Wang, H.M.D.; Shieh, C.J.; Liu, Y.C.; Kuo, C.H. Bioactive Compounds from Guava Leaves (Psidium guajava L.): Characterization, Biological Activity, and Technological Applications. Molecules 2025, 30, 1278. [Google Scholar] [CrossRef] [PubMed]
- Kumar, M.; Tomar, M.; Amarowicz, R.; Saurabh, V.; Nair, M.S.; Maheshwari, C.; Sasi, M.; Prajapati, U.; Hasan, M.; Singh, S.; et al. Guava (Psidium guajava L.) Leaves: Nutritional Composition, Phytochemical Profile, and Health-Promoting Bioactivities. Foods 2021, 10, 752. [Google Scholar] [CrossRef] [PubMed]
- Díaz-de-Cerio, E.; Verardo, V.; Gómez-Caravaca, A.M.; Fernández-Gutiérrez, A.; Segura-Carretero, A. Exploratory Characterization of Phenolic Compounds with Demonstrated Anti-Diabetic Activity in Guava Leaves at Different Oxidation States. Int. J. Mol. Sci. 2016, 17, 699. [Google Scholar] [CrossRef] [PubMed]
- Ignat, I.; Volf, I.; Popa, V.I. A Critical Review of Methods for Characterisation of Polyphenolic Compounds in Fruits and Vegetables. Food Chem. 2011, 126, 1821–1835. [Google Scholar] [CrossRef] [PubMed]
- Yuan, S.; Zhao, W.; Wang, Y.; Dong, H.; Song, K.; Shi, D. Mechanism-Driven Green Extraction of Plant Polyphenols: From Molecular Interactions to Process Integration and Intelligent Optimization. Plants 2026, 15, 596. [Google Scholar] [CrossRef] [PubMed]
- Bitwell, C.; Indra, S.S.; Luke, C.; Kakoma, M.K. A Review of Modern and Conventional Extraction Techniques and Their Applications for Extracting Phytochemicals from Plants. Sci. Afr. 2023, 19, e01585. [Google Scholar] [CrossRef]
- Chemat, F.; Vian, M.A.; Cravotto, G. Green Extraction of Natural Products: Concept and Principles. Int. J. Mol. Sci. 2012, 13, 8615–8627. [Google Scholar] [CrossRef] [PubMed]
- Alara, O.R.; Abdurahman, N.H.; Ukaegbu, C.I. Extraction of Phenolic Compounds: A Review. Curr. Res. Food Sci. 2021, 4, 200–214. [Google Scholar] [CrossRef] [PubMed]
- Zain, M.S.C.; Lee, S.Y.; Teo, C.Y.; Shaari, K. Adsorption and Desorption Properties of Total Flavonoids from Oil Palm (Elaeis guineensis Jacq.) Mature Leaf on Macroporous Adsorption Resins. Molecules 2020, 25, 778. [Google Scholar] [CrossRef] [PubMed]
- Hou, M.; Hu, W.; Xiu, Z.; Jiang, A.; Men, L.; Hao, K.; Sun, X.; Cao, D. Preparative Purification of Total Flavonoids from Sophora tonkinensis Gagnep. by Macroporous Resin Column Chromatography and Comparative Analysis of Flavonoid Profiles by HPLC-PAD. Molecules 2019, 24, 3200. [Google Scholar] [CrossRef] [PubMed]
- Wang, X.; Tan, M.; Xing, S. Engineered Porous Materials for the Recovery of High-Value Anthocyanins from Food Sources: Adsorption-Based Separation and Purification. Compr. Rev. Food Sci. Food Saf. 2026, 25, e70501. [Google Scholar] [CrossRef] [PubMed]
- Lai, Q.; Deng, J.; Yu, M.; Gan, L.; Zhu, Y.; Xia, C.; Ying, Y.; Xiang, Z. Macroporous Resin Purification of Phenolics from Penthorum chinense Leaves: Phenolic Identification, Composition Analysis, and Biological Activities. Antioxidants 2026, 15, 709. [Google Scholar] [CrossRef] [PubMed]
- Dos Santos, E.C.F.; Machado, J.C.B.; Ferreira, M.R.A.; Soares, L.A.L. Strategies to Overcome Challenges in Formulating Tablets from Dried Plant Extracts: A Comprehensive Review. AAPS PharmSciTech 2025, 27, 14. [Google Scholar] [CrossRef] [PubMed]
- Zhang, Q.; Yang, W.; Liu, J.; Liu, H.; Lv, Z.; Zhang, C.; Chen, D.; Jiao, Z. Identification of Six Flavonoids as Novel Cellular Antioxidants and Their Structure-Activity Relationship. Oxid. Med. Cell. Longev. 2020, 4150897. [Google Scholar] [CrossRef] [PubMed]
- Skroza, D.; Šimat, V.; Vrdoljak, L.; Jolić, N.; Skelin, A.; Čagalj, M.; Frleta, R.; Generalić Mekinić, I. Investigation of Antioxidant Synergisms and Antagonisms among Phenolic Acids in Model Matrices Using FRAP and ORAC Methods. Antioxidants 2022, 11, 1784. [Google Scholar] [CrossRef] [PubMed]
- Jorens, P.G.; Matthys, K.E.; Bult, H. Modulation of Nitric Oxide Synthase Activity in Macrophages. Mediat. Inflamm. 1995, 4, 75–89. [Google Scholar] [CrossRef]
- Choi, S.Y.; Hwang, J.H.; Park, S.Y.; Jin, Y.J.; Ko, H.C.; Moon, S.W.; Kim, S.J. Fermented Guava Leaf Extract Inhibits LPS-Induced COX-2 and iNOS Expression in Mouse Macrophage Cells by Inhibition of Transcription Factor NF-κB. Phytother. Res. 2008, 22, 1030–1034. [Google Scholar] [CrossRef] [PubMed]
- Lee, J.W.; Bae, C.J.; Choi, Y.J.; Kim, S.I.; Kim, N.H.; Lee, H.J.; Kim, S.S.; Kwon, Y.S.; Chun, W. Avicularin Inhibits Lipopolysaccharide-Induced Inflammatory Response by Suppressing ERK Phosphorylation in RAW 264.7 Macrophages. Biomol. Ther. 2012, 20, 532–537. [Google Scholar] [CrossRef] [PubMed]
- Lippolis, T.; Cofano, M.; Caponio, G.R.; De Nunzio, V.; Notarnicola, M. Bioaccessibility and Bioavailability of Diet Polyphenols and Their Modulation of Gut Microbiota. Int. J. Mol. Sci. 2023, 24, 3813. [Google Scholar] [CrossRef] [PubMed]
- Zhang, Z.; Lv, G.; Du, L. Avicularin Reduces the Expression of Mediators of Inflammation and Oxidative Stress in Bradykinin-Treated MG-63 Human Osteoblastic Osteosarcoma Cells. Med. Sci. Monit. 2020, 26, e921957. [Google Scholar] [CrossRef] [PubMed]
Figure 1.
Representative HPLC-DAD chromatogram of P. guajava leaf extract obtained via exhaustive hydroalcoholic extraction, recorded at 350 nm. Peaks: (1) hyperoside; (2) guaijaverin; (3) avicularin.
Figure 1.
Representative HPLC-DAD chromatogram of P. guajava leaf extract obtained via exhaustive hydroalcoholic extraction, recorded at 350 nm. Peaks: (1) hyperoside; (2) guaijaverin; (3) avicularin.
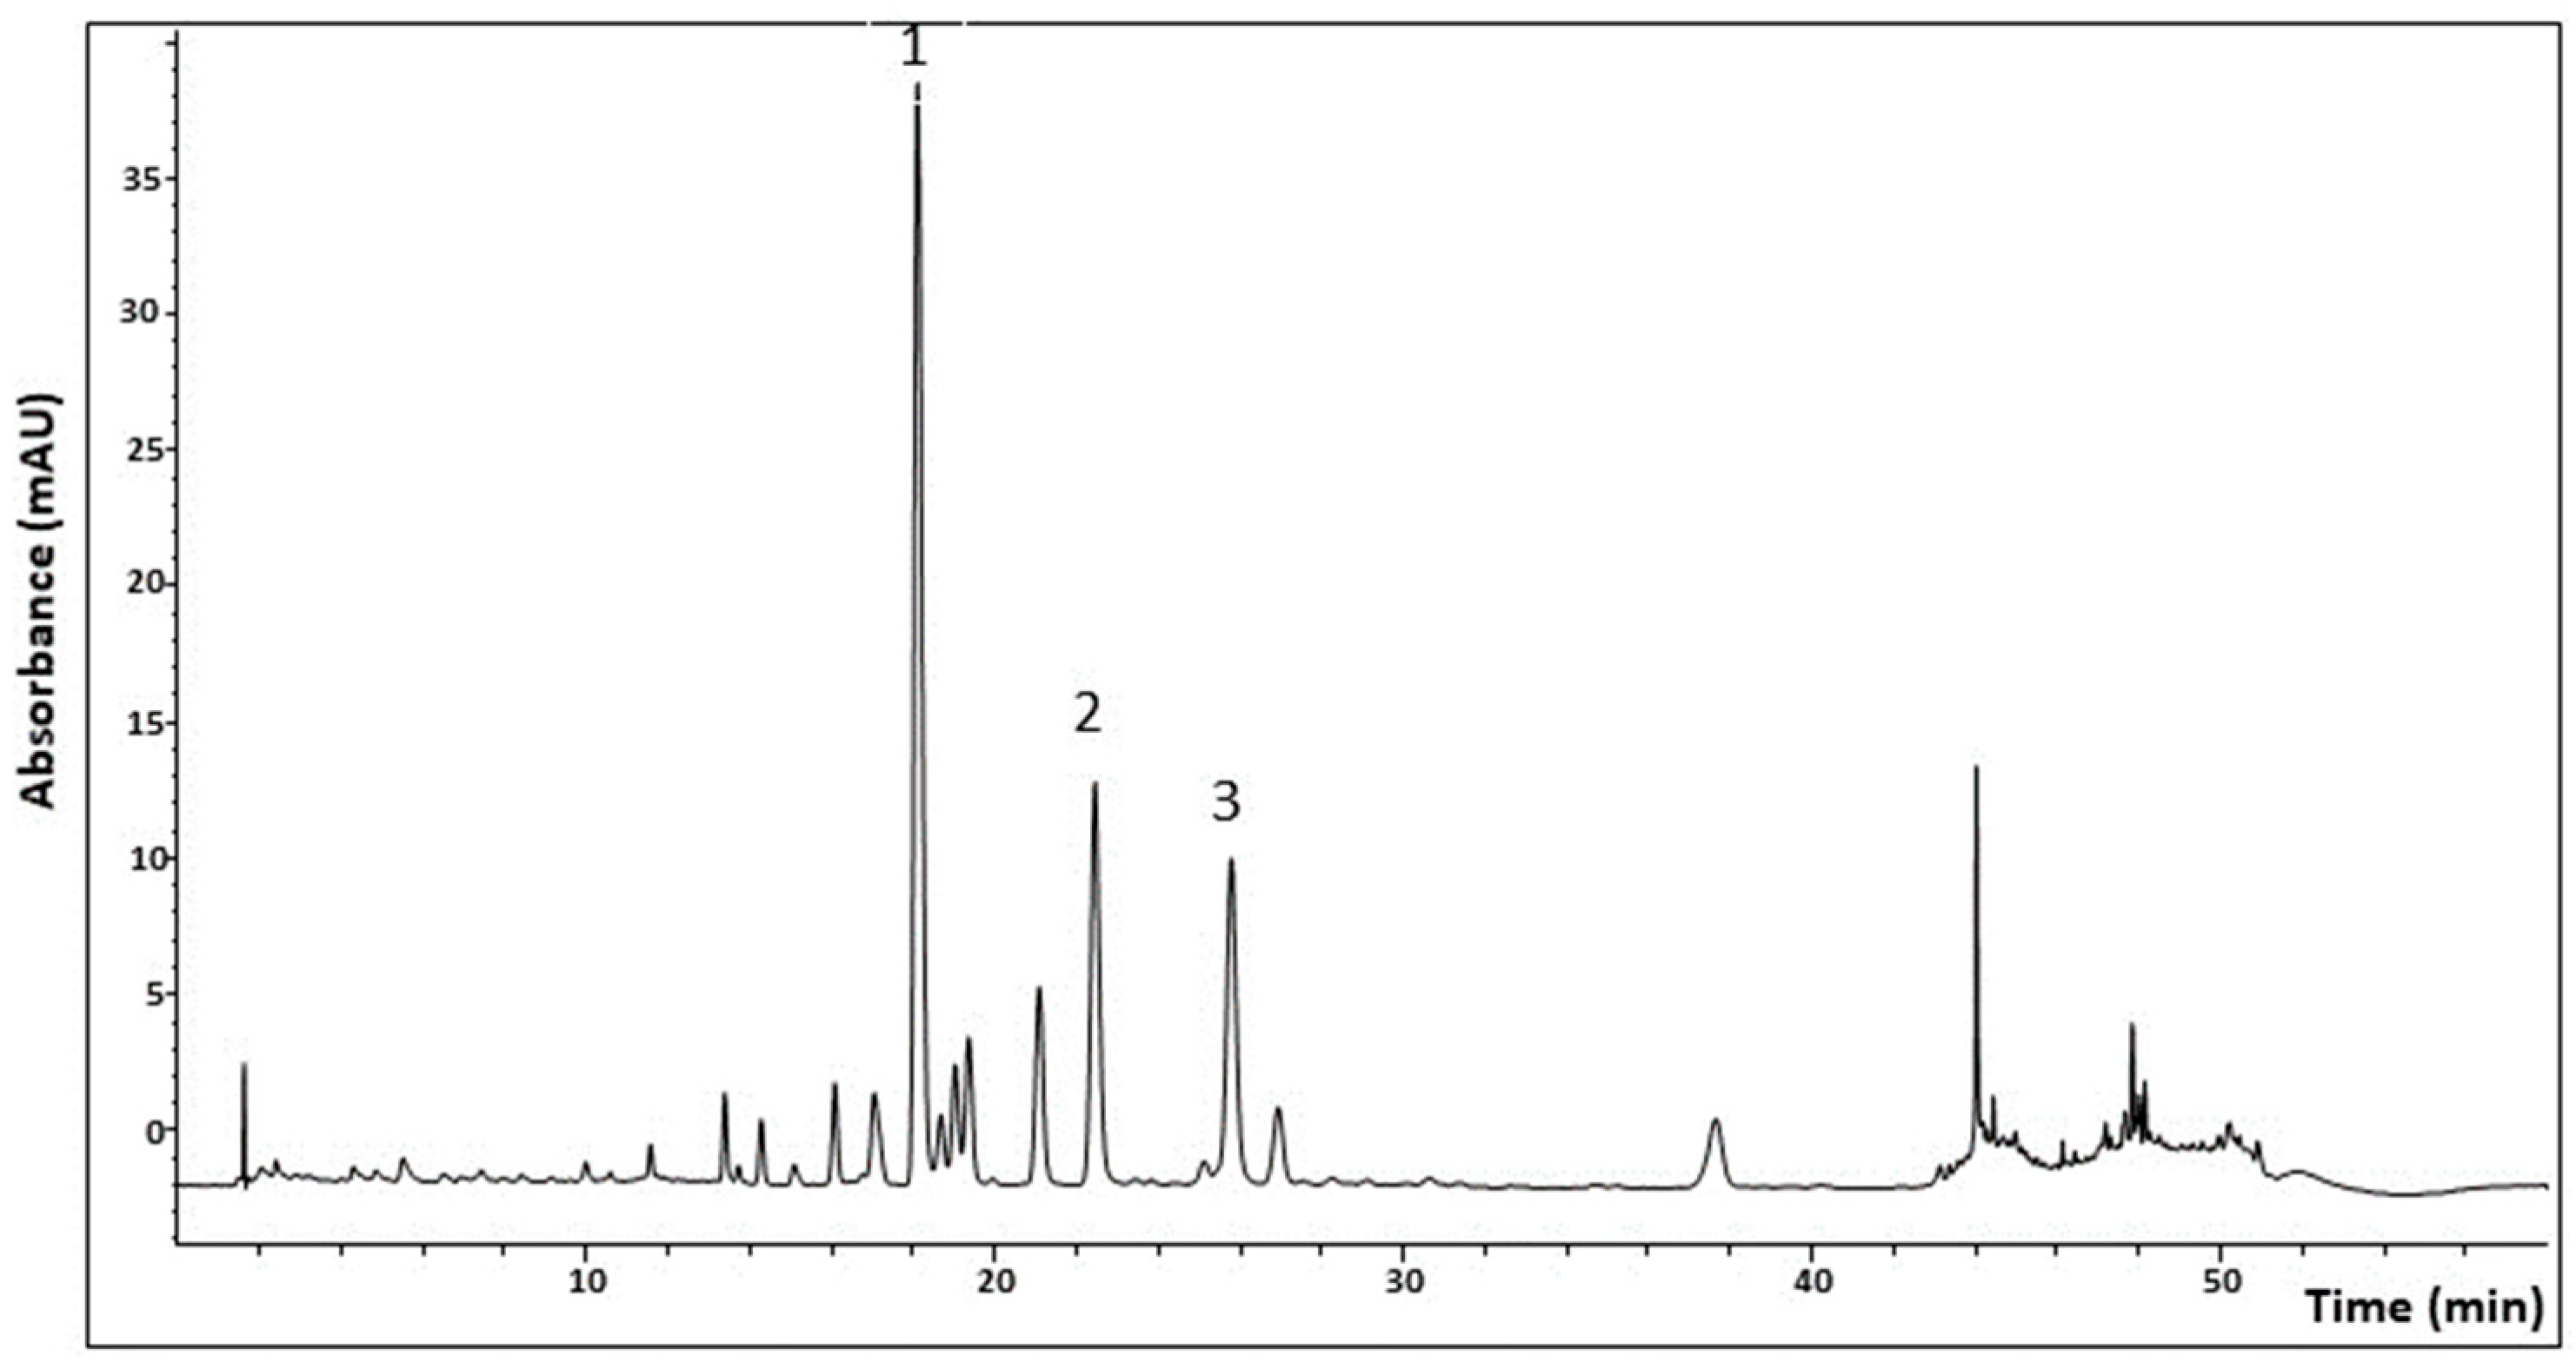
Figure 2.
Diagnostic plots of the second-order polynomial model fitted by multiple linear regression for total polyphenol content. (a) Replicate plot; (b) summary of model fit including R², Q², model validity, and reproducibility; (c) scaled and centered regression coefficients; (d) residual normal probability plot.
Figure 2.
Diagnostic plots of the second-order polynomial model fitted by multiple linear regression for total polyphenol content. (a) Replicate plot; (b) summary of model fit including R², Q², model validity, and reproducibility; (c) scaled and centered regression coefficients; (d) residual normal probability plot.
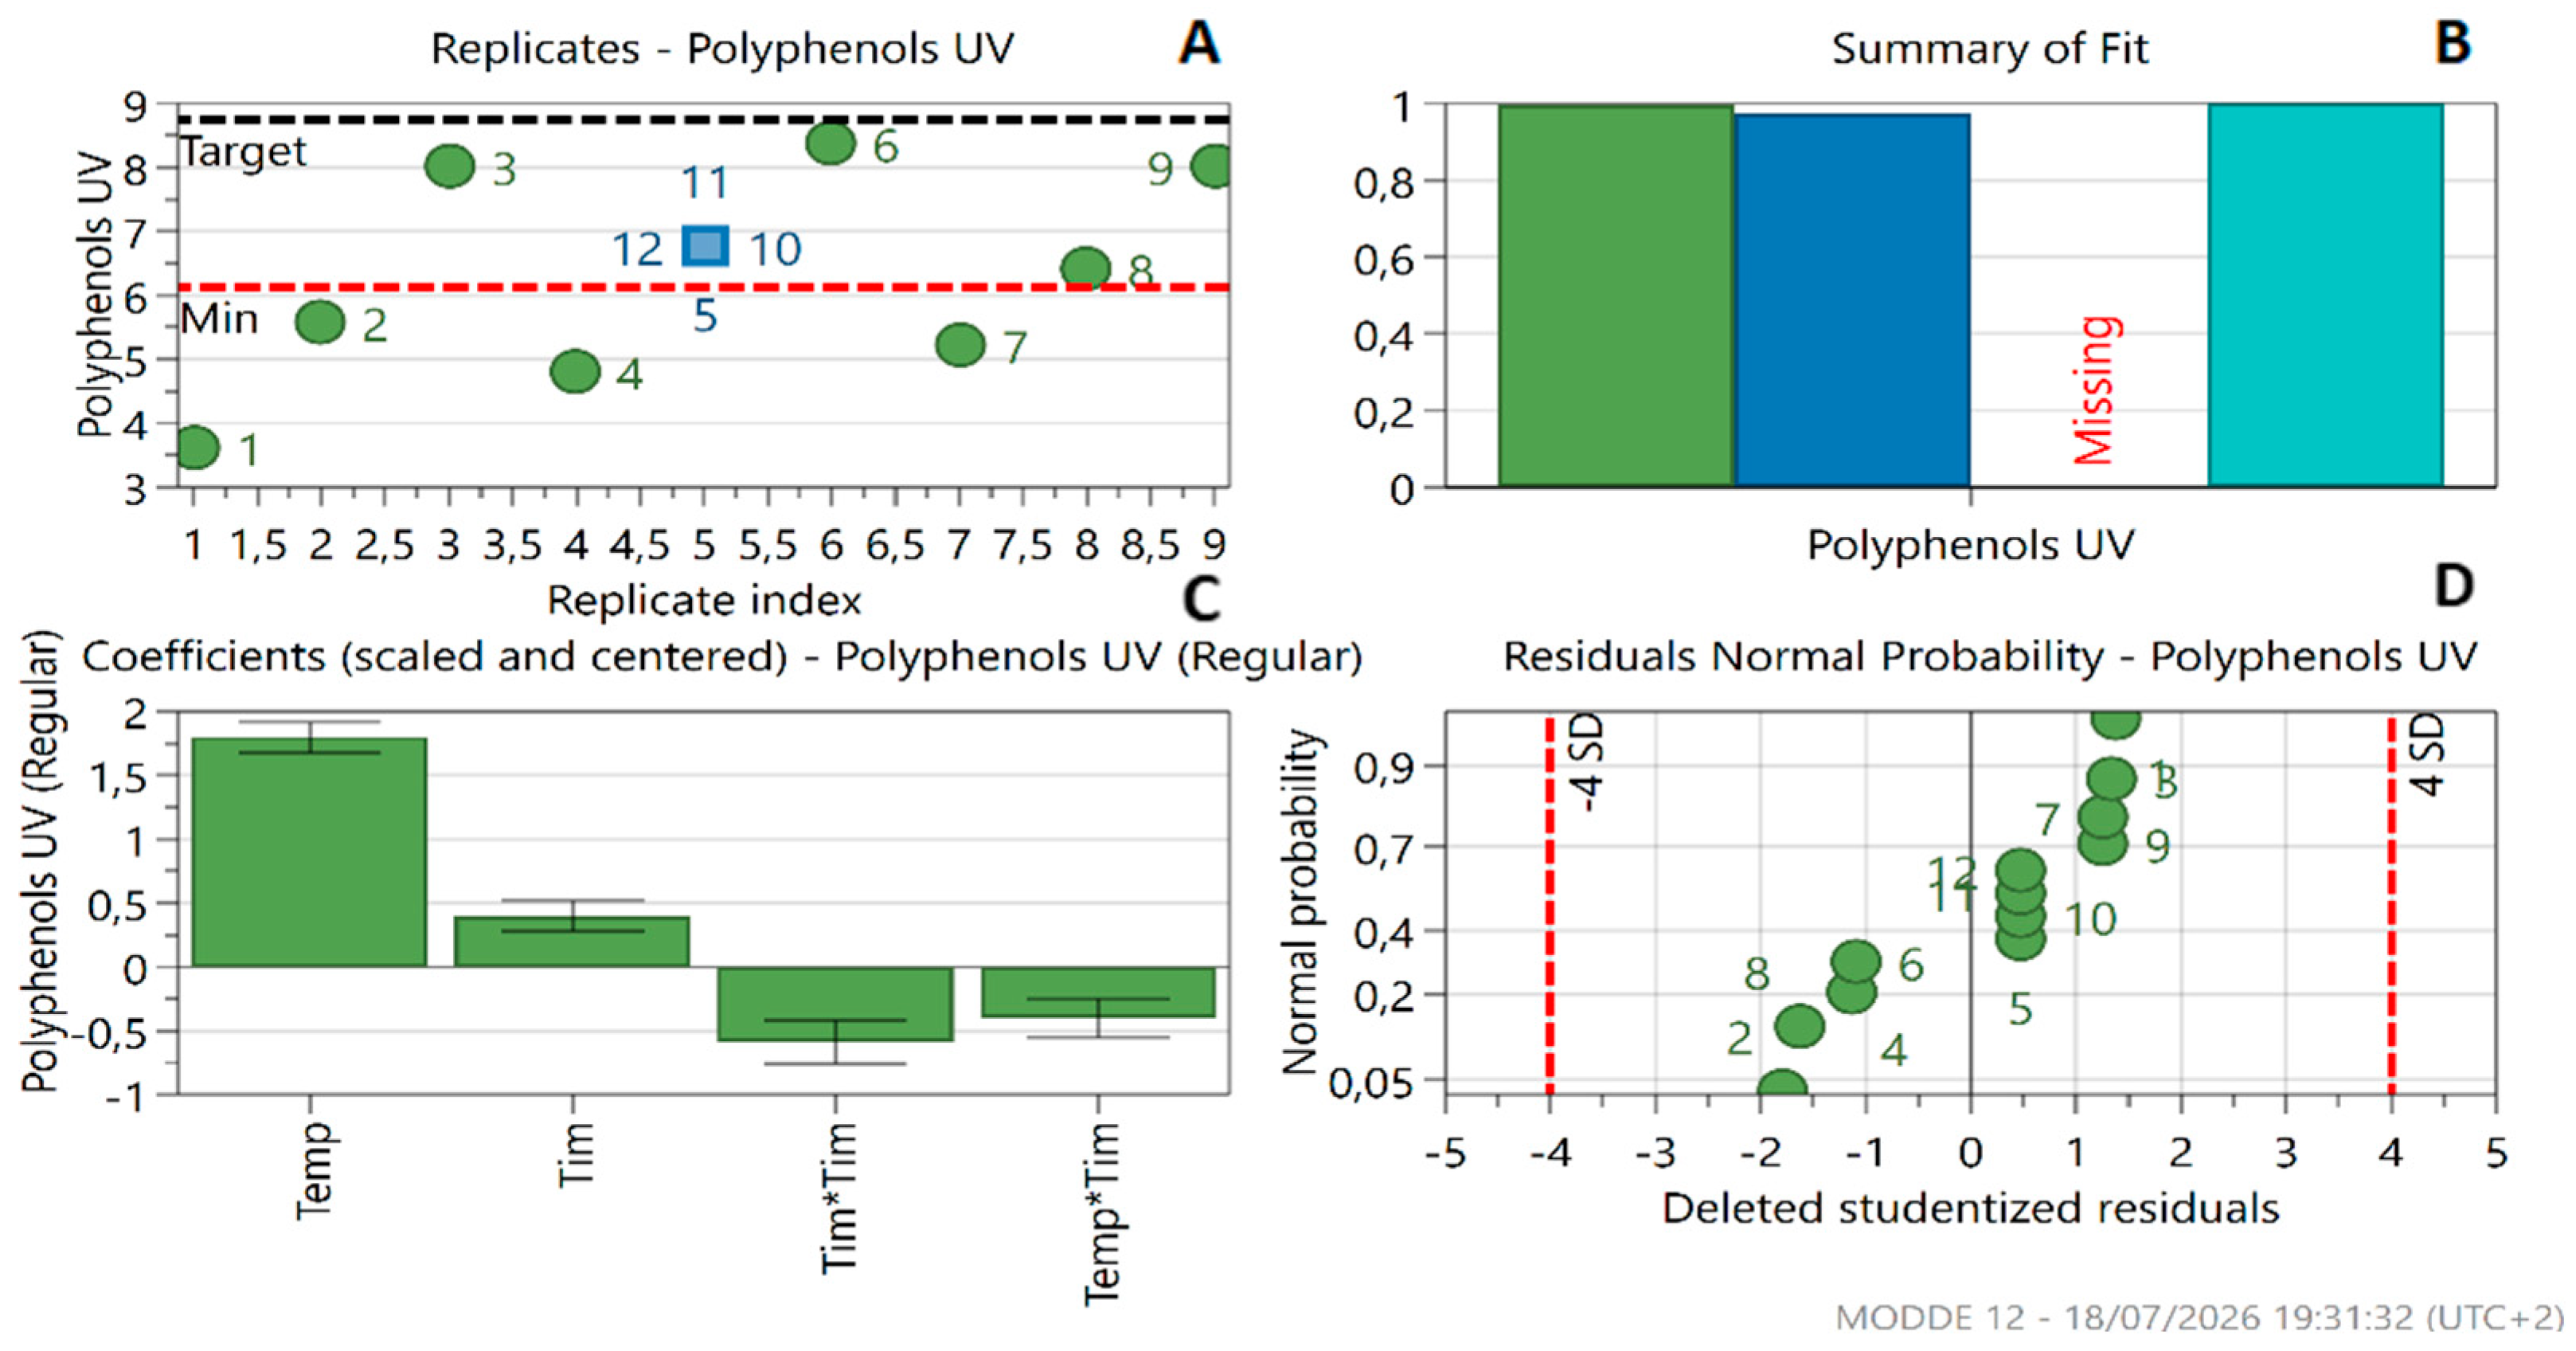
Figure 3.
Diagnostic plots of the second-order polynomial model fitted by multiple linear regression for total flavonoid content. (a) Replicate plot; (b) summary of model fit including R², Q², model validity, and reproducibility; (c) scaled and centered regression coefficients; (d) residual normal probability plot.
Figure 3.
Diagnostic plots of the second-order polynomial model fitted by multiple linear regression for total flavonoid content. (a) Replicate plot; (b) summary of model fit including R², Q², model validity, and reproducibility; (c) scaled and centered regression coefficients; (d) residual normal probability plot.
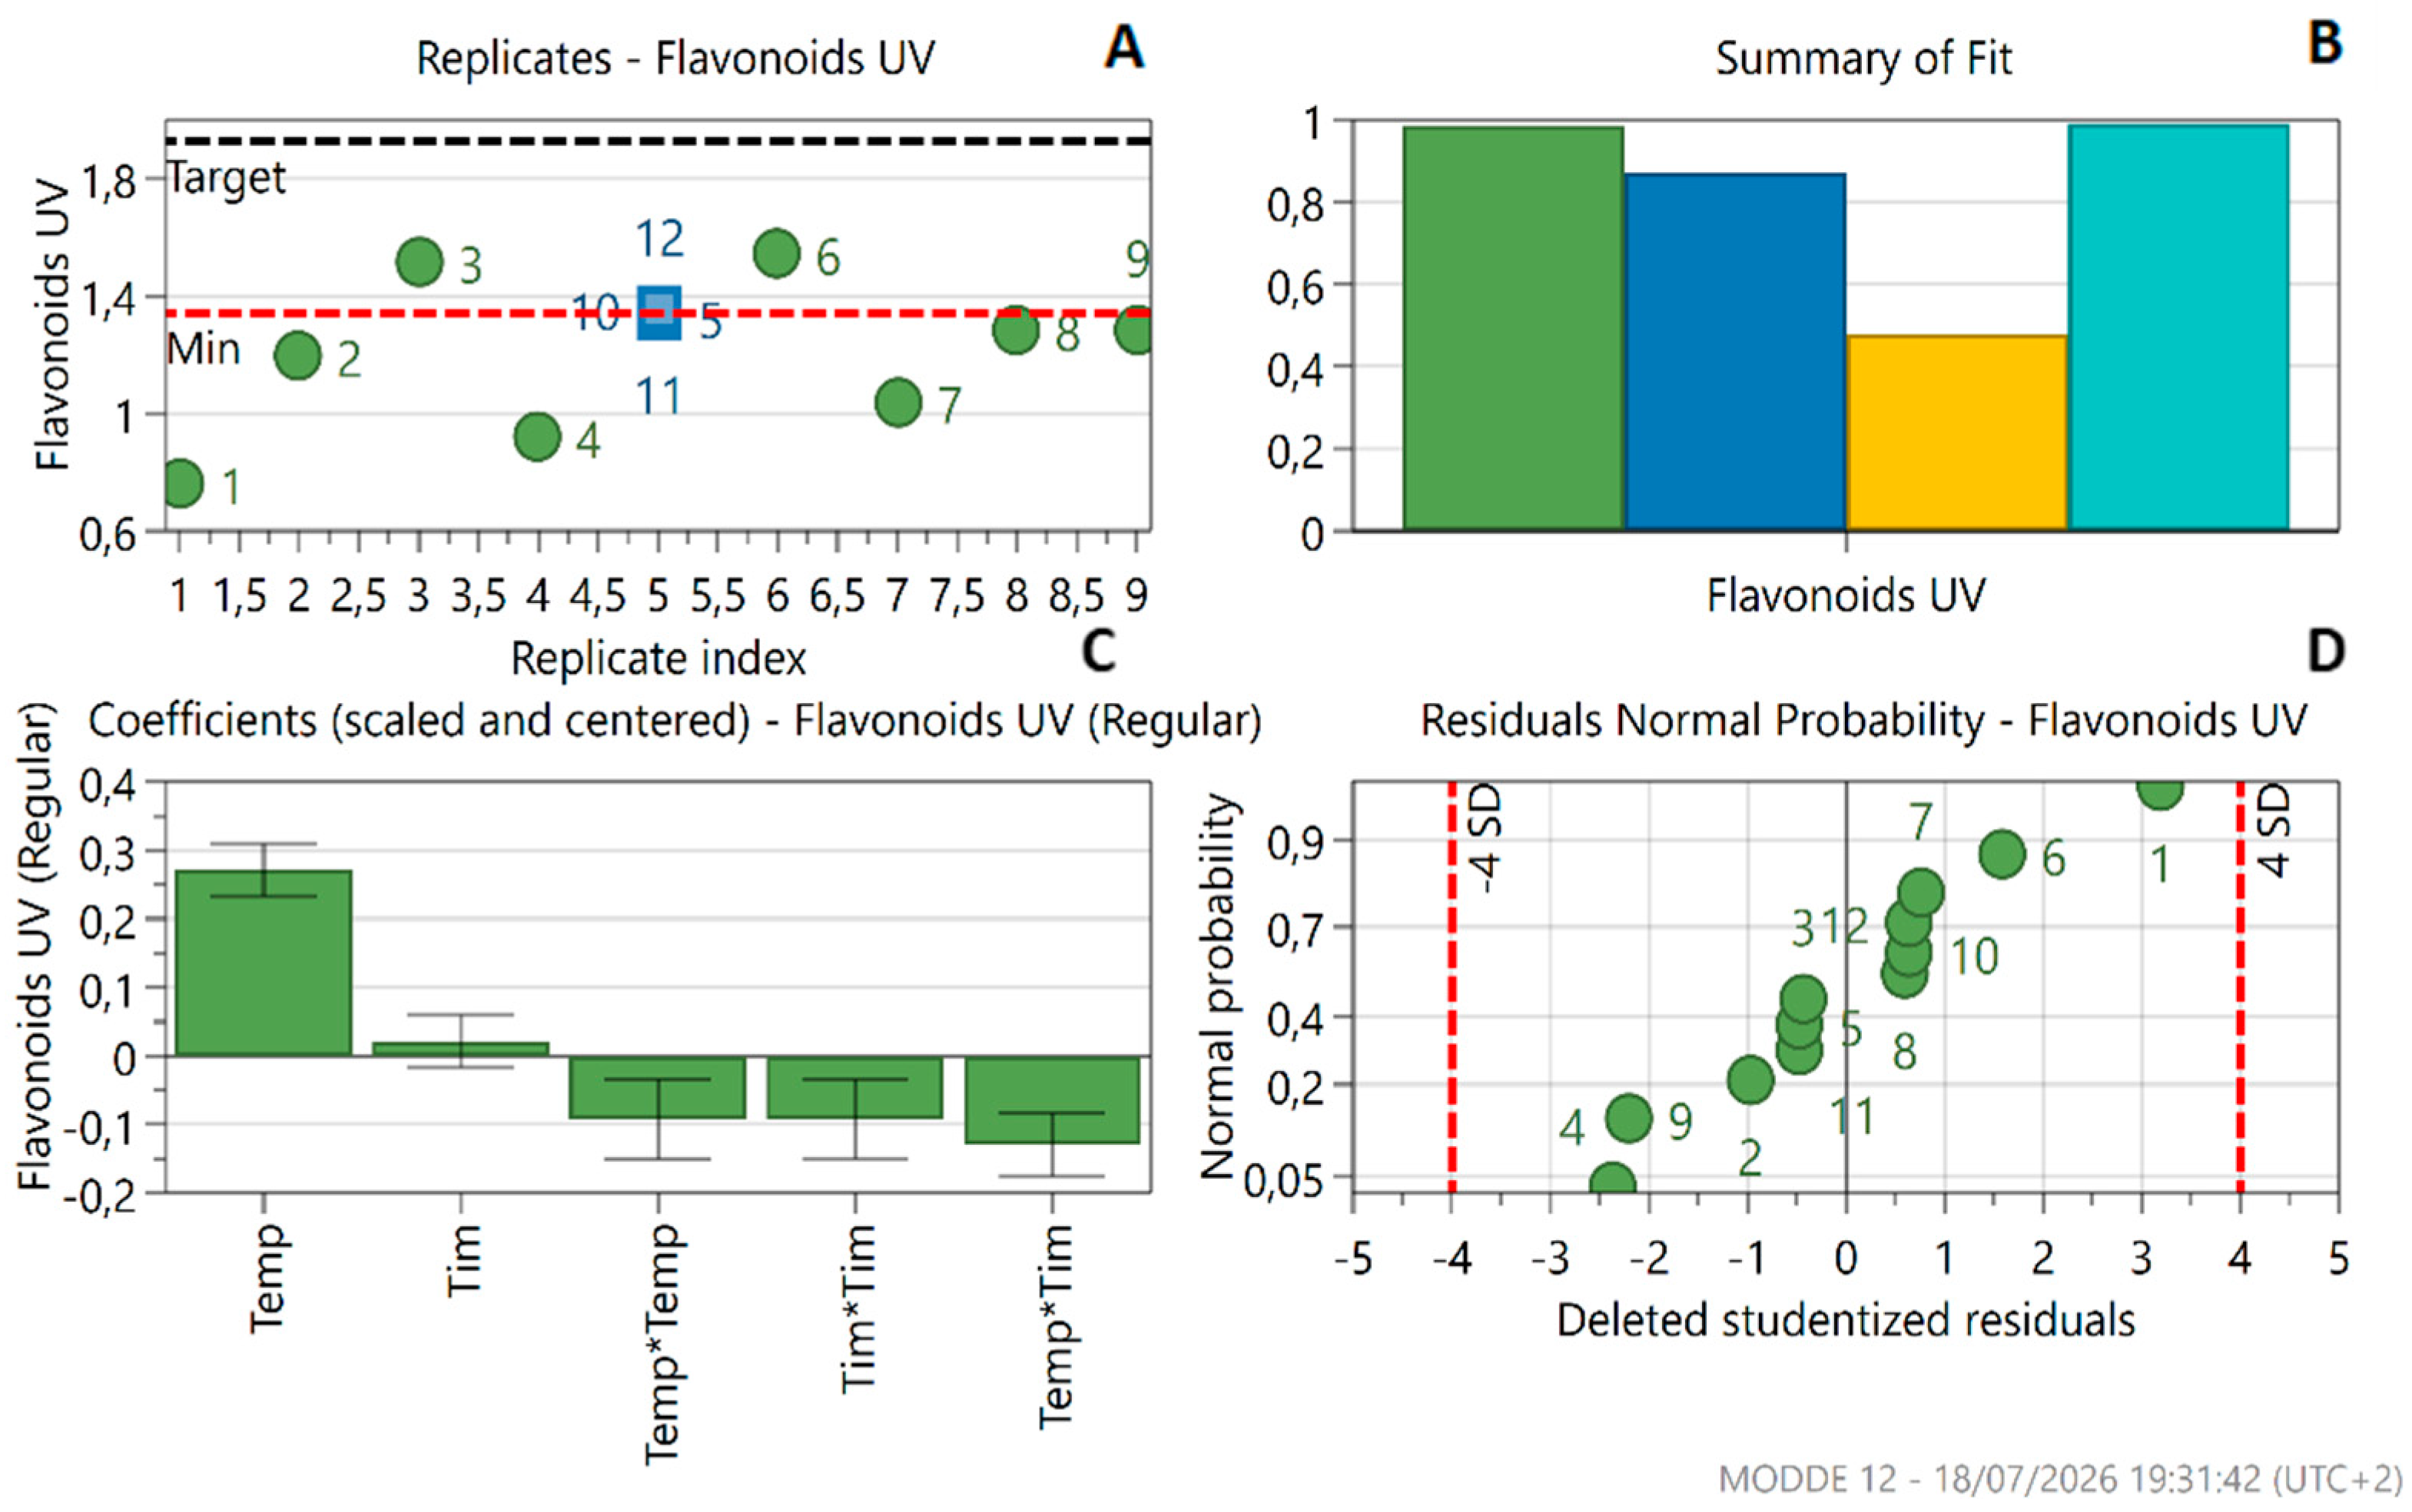
Figure 4.
Response contour plots showing the predicted effects of extraction temperature (°C) and extraction time (min) on total polyphenol content (left) and total flavonoid content (right), determined by UV–Vis spectrophotometry. Shaded regions represent predictions outside the experimental domain.
Figure 4.
Response contour plots showing the predicted effects of extraction temperature (°C) and extraction time (min) on total polyphenol content (left) and total flavonoid content (right), determined by UV–Vis spectrophotometry. Shaded regions represent predictions outside the experimental domain.
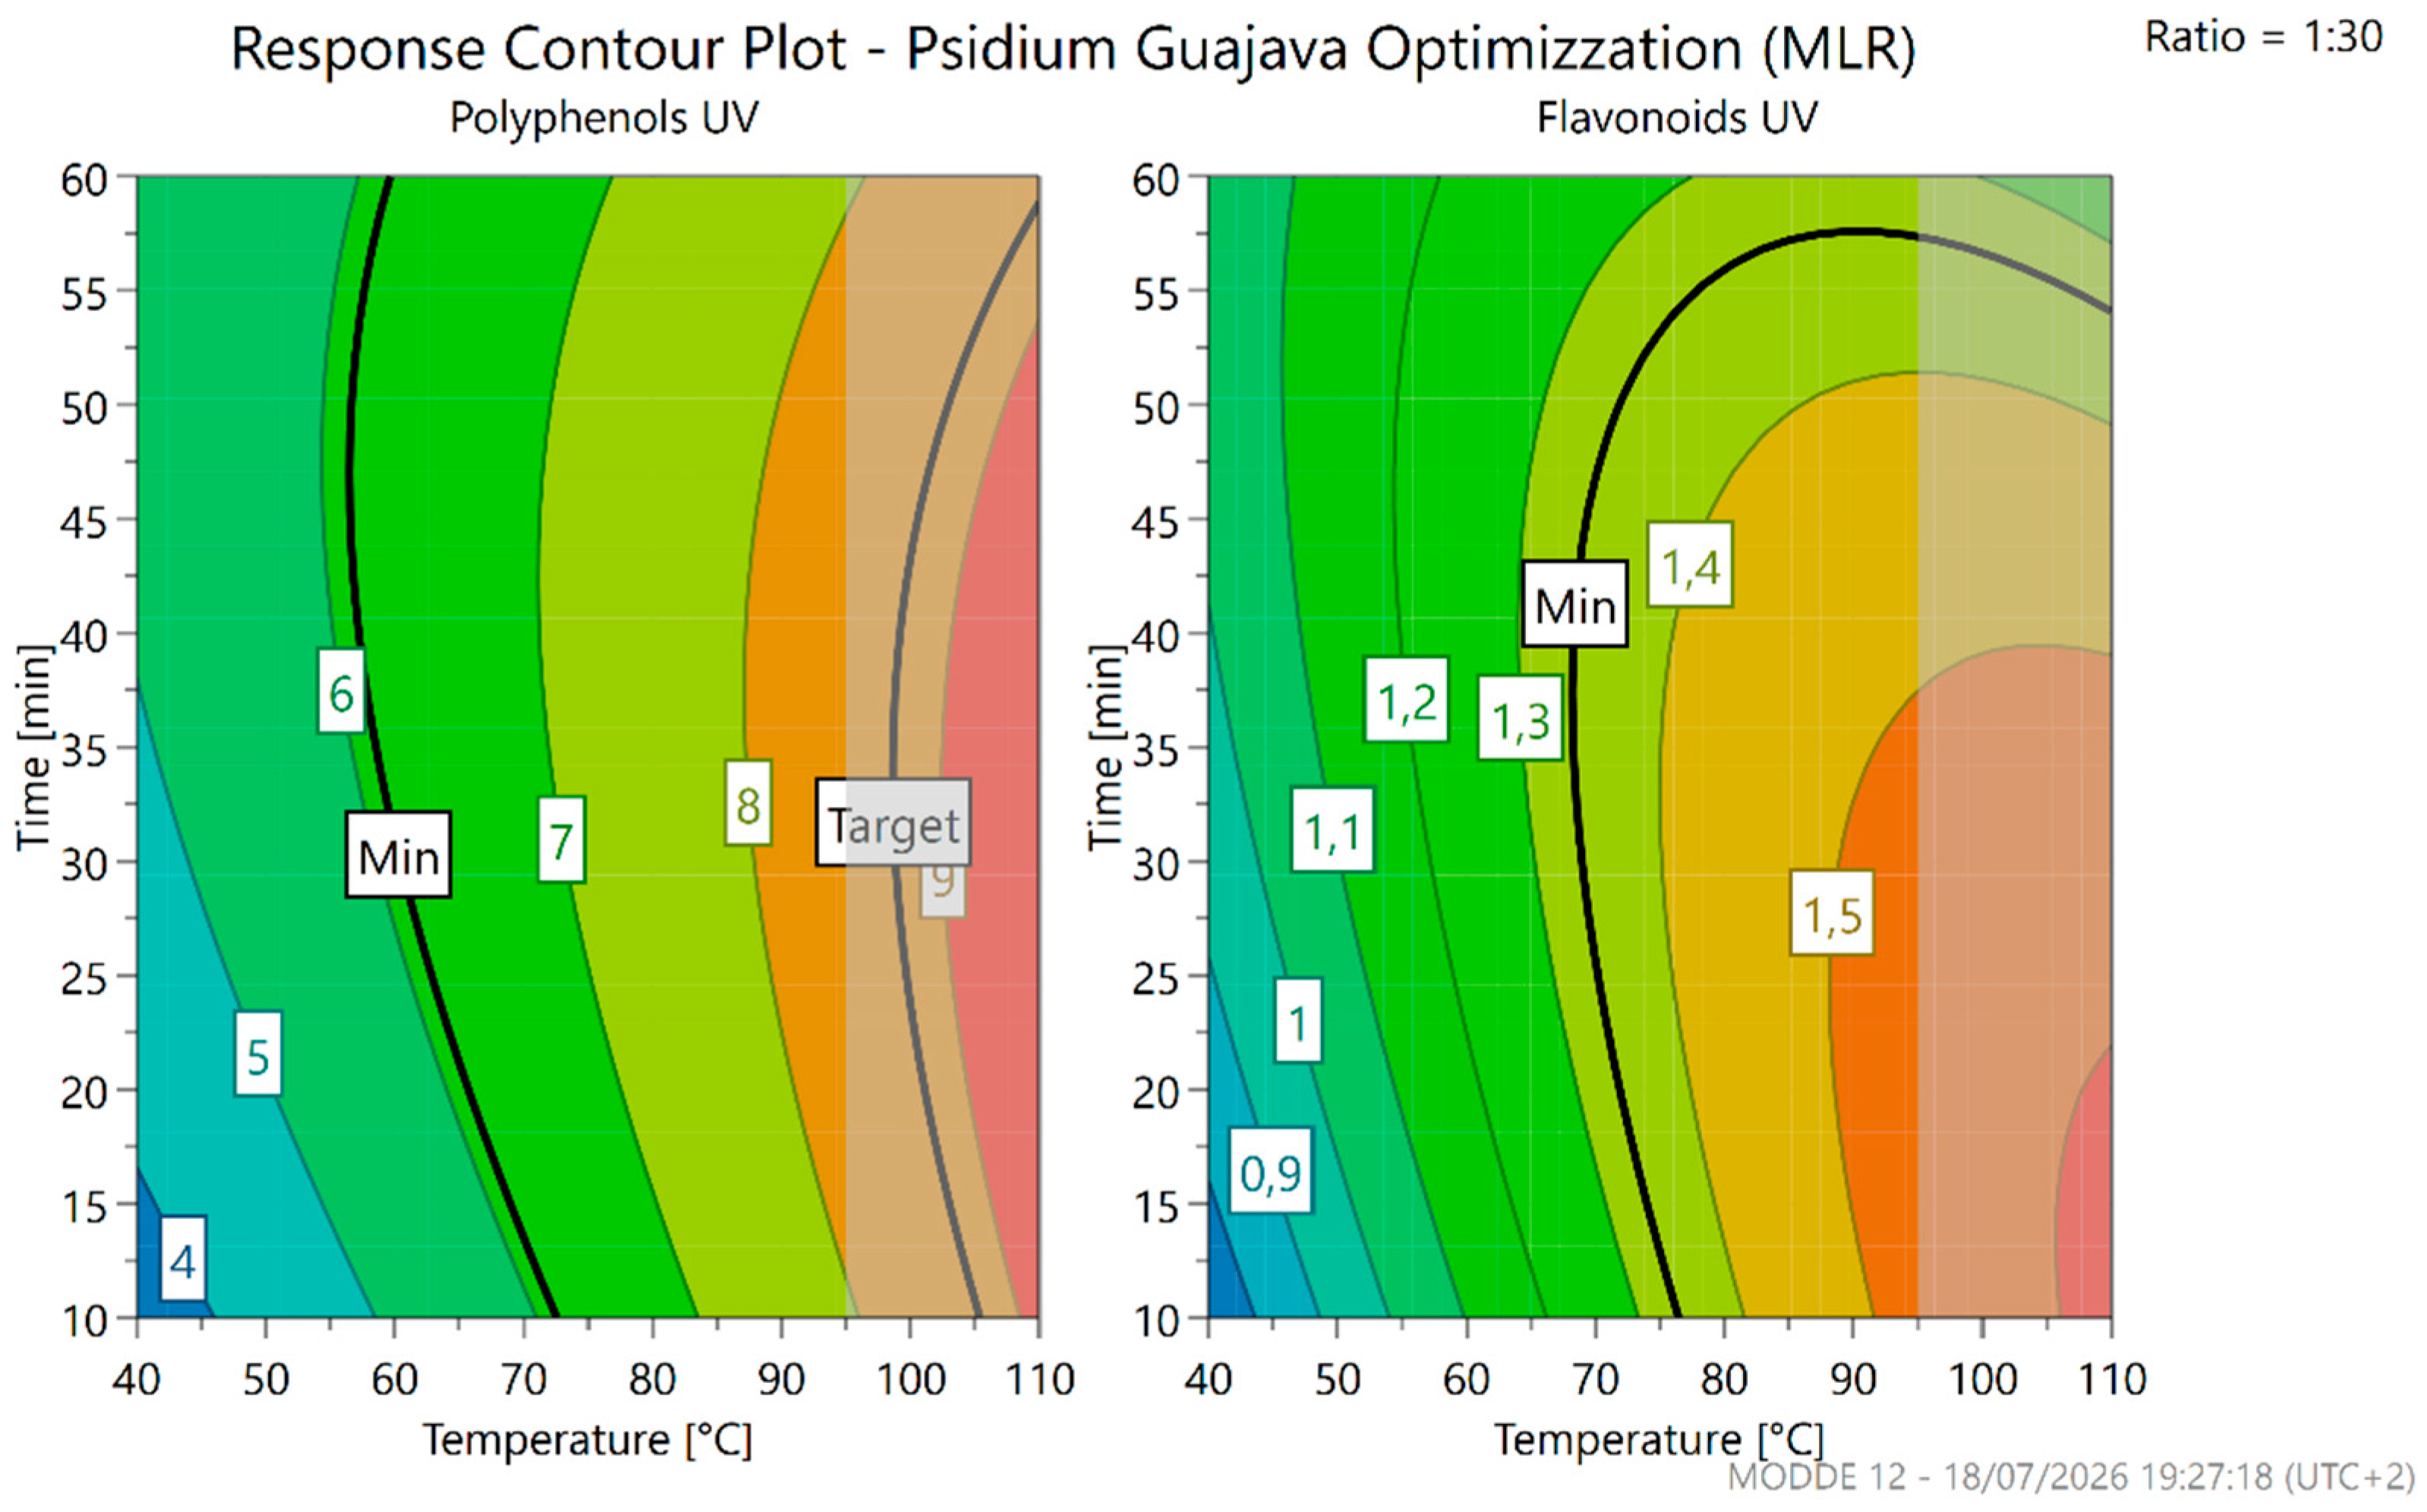
Figure 5.
Design space contour plot evaluating the robustness of the optimized extraction conditions of flavonoids as a function of temperature (°C) and extraction time (min.). The green area defines the robust operating window (sweet spot) meeting the 1% acceptance limit based on prediction intervals, representing a minimized risk of process failure.
Figure 5.
Design space contour plot evaluating the robustness of the optimized extraction conditions of flavonoids as a function of temperature (°C) and extraction time (min.). The green area defines the robust operating window (sweet spot) meeting the 1% acceptance limit based on prediction intervals, representing a minimized risk of process failure.
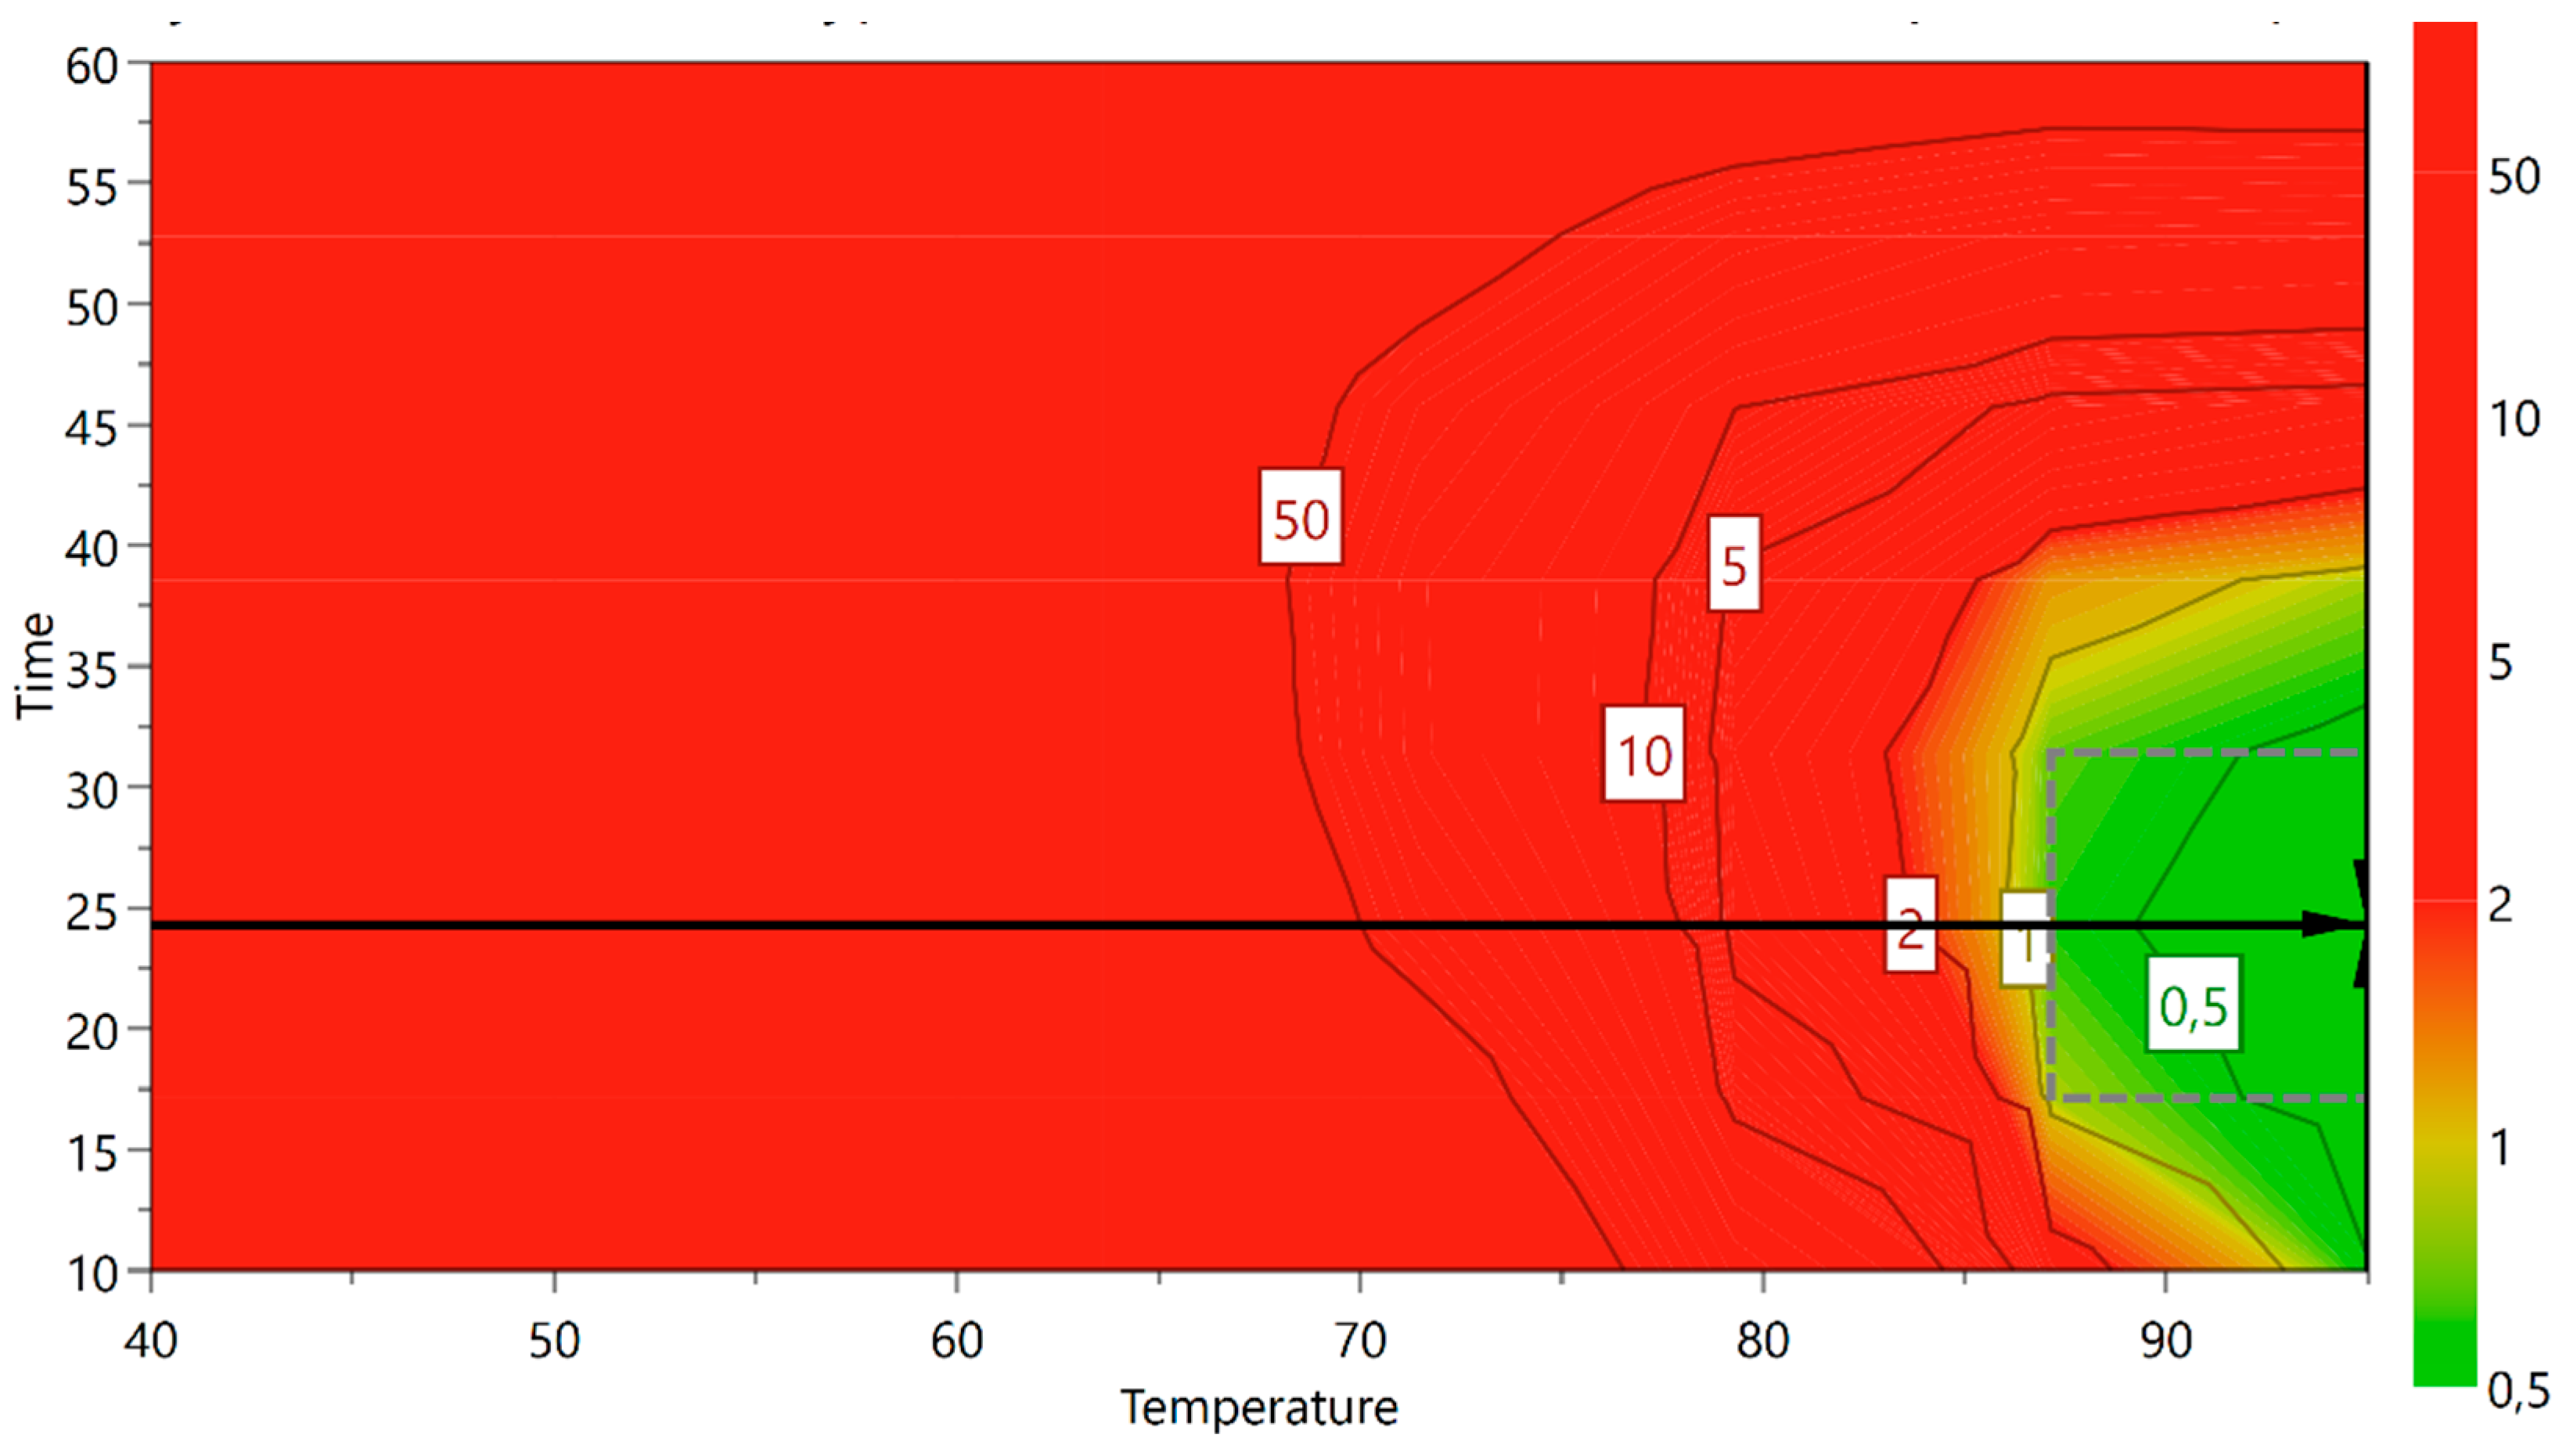
Figure 6.
Static adsorption kinetics and cumulative desorption recovery profiles of avicularin and hyperoside on macroporous resins A and B. Elu1, elu2, and elu3 represent consecutive desorption fractions.
Figure 6.
Static adsorption kinetics and cumulative desorption recovery profiles of avicularin and hyperoside on macroporous resins A and B. Elu1, elu2, and elu3 represent consecutive desorption fractions.
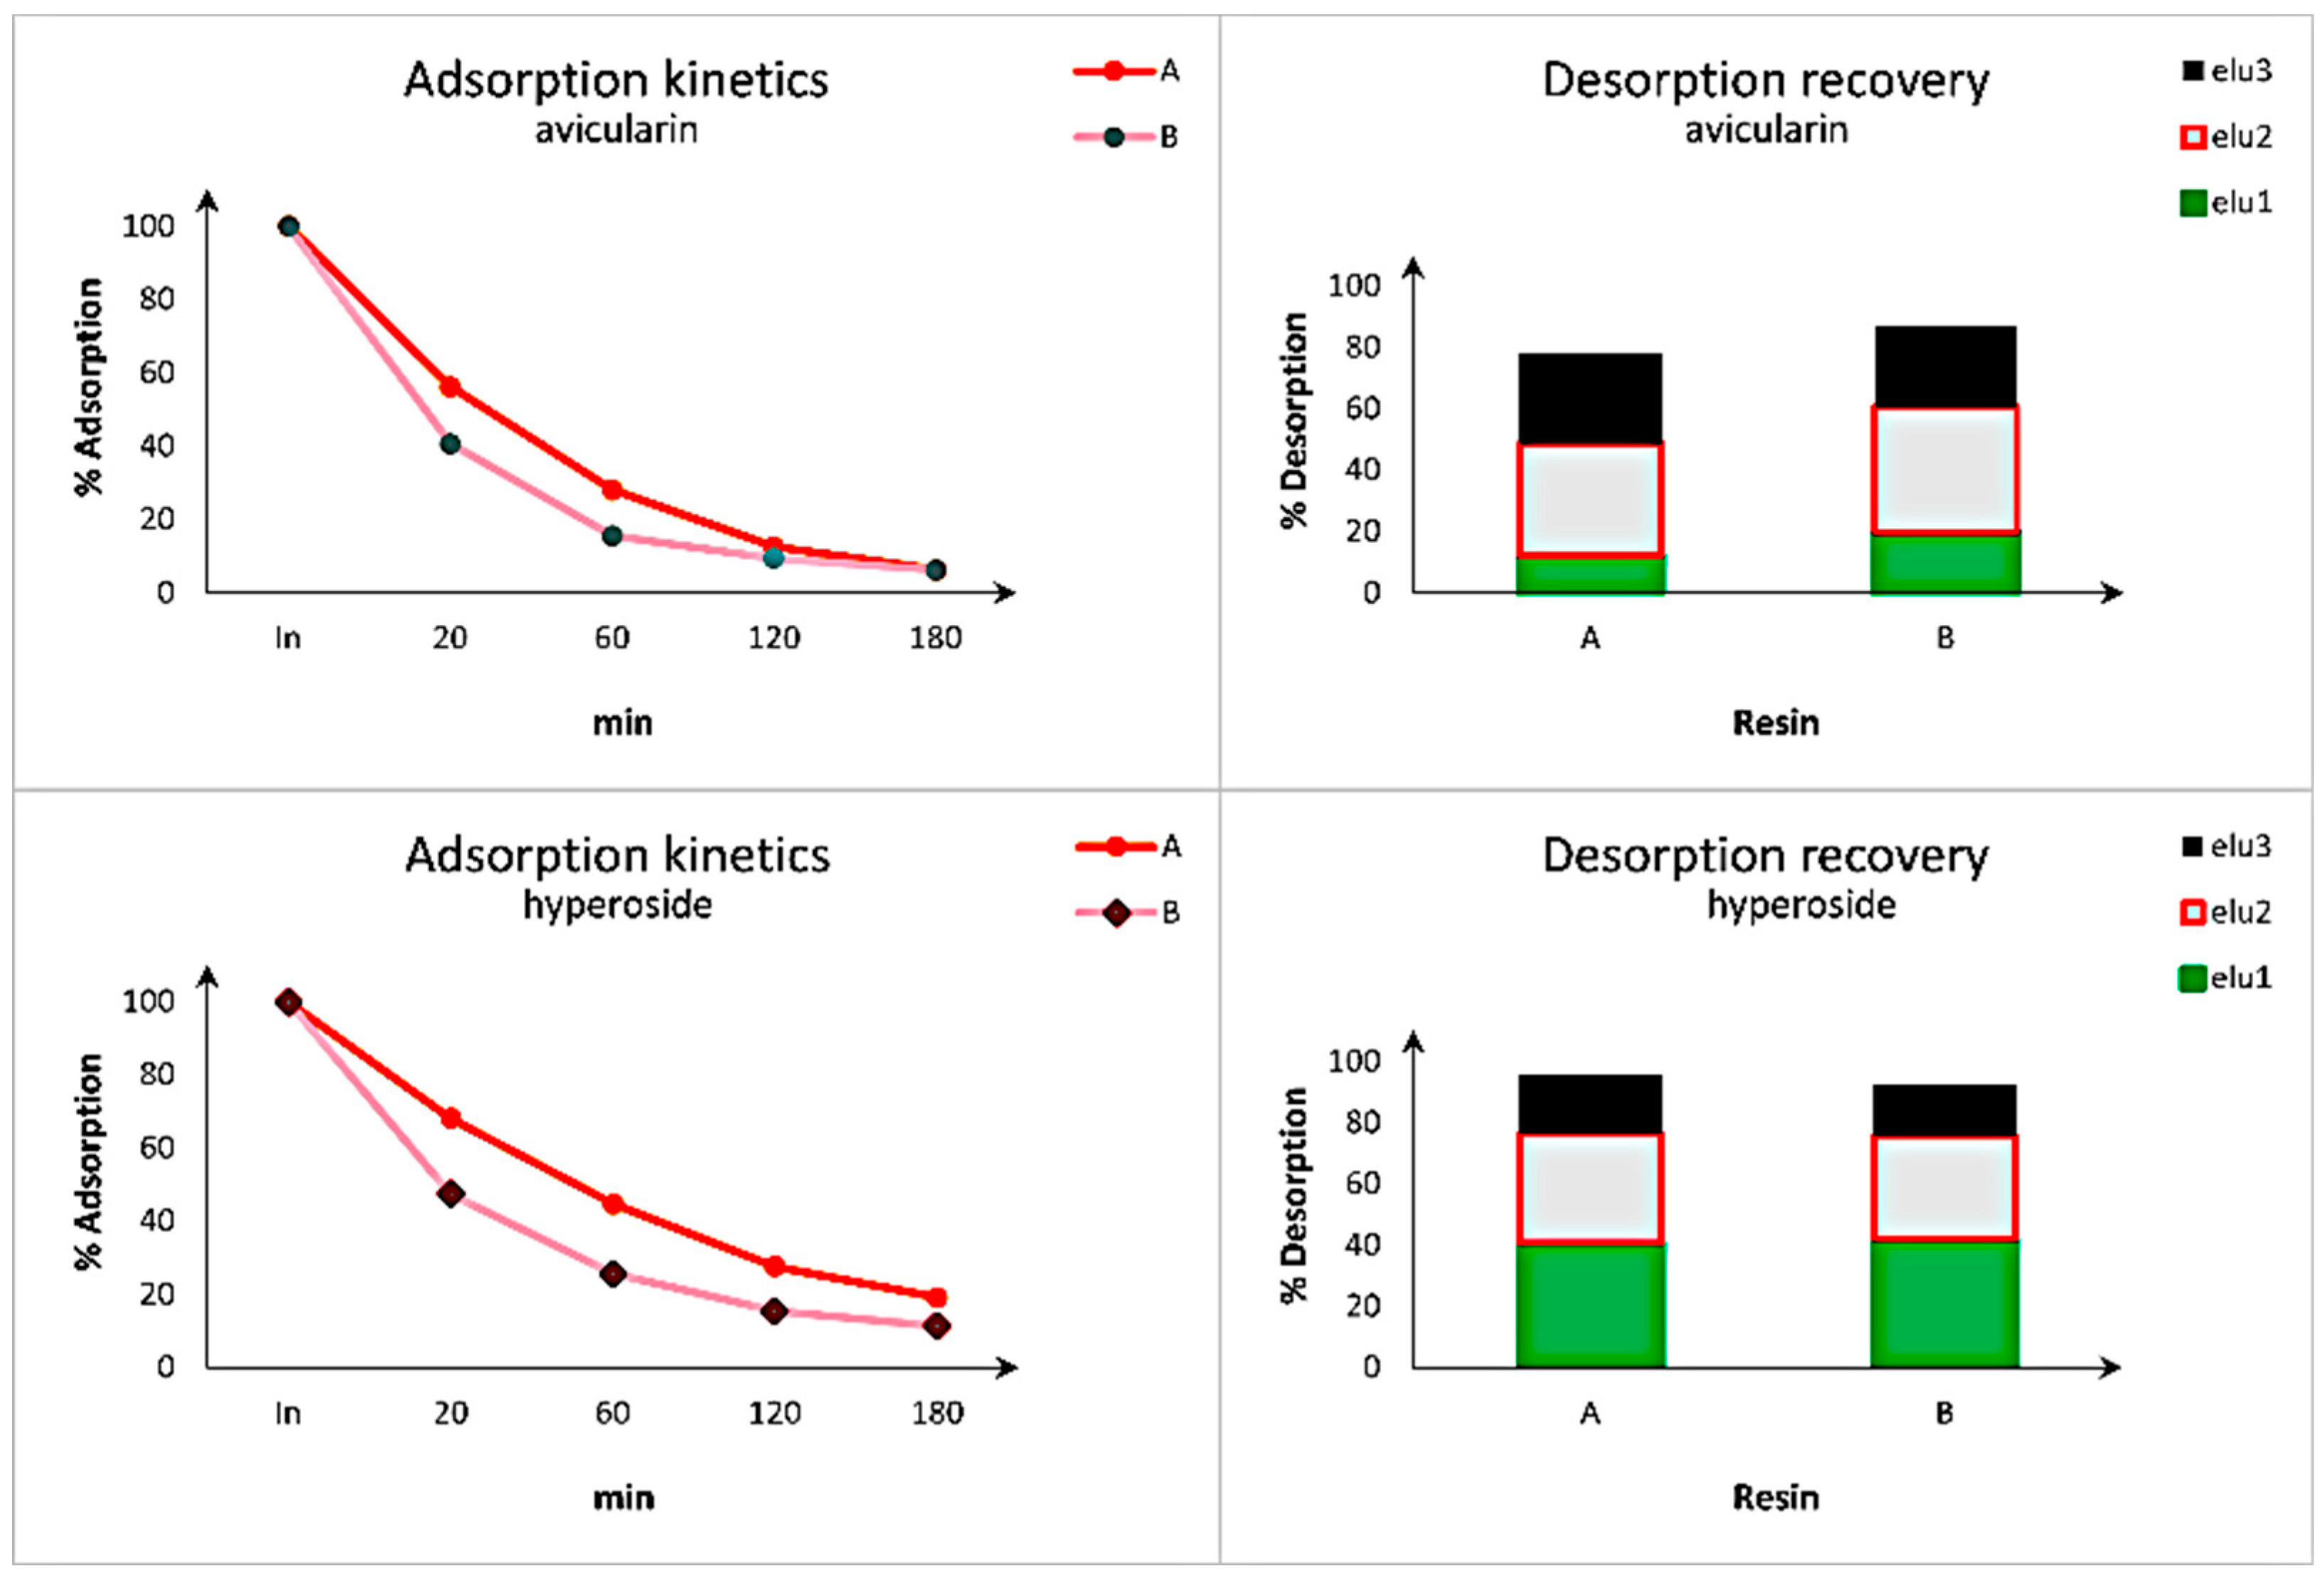
Figure 7.
Figure 7. Static adsorption kinetics and cumulative desorption recovery profiles of guaijaverin (top) and guaijaverin and derivatives (bottom) on macroporous resins A and B. Elu1, elu2, and elu3 represent consecutive desorption fractions.
Figure 7.
Figure 7. Static adsorption kinetics and cumulative desorption recovery profiles of guaijaverin (top) and guaijaverin and derivatives (bottom) on macroporous resins A and B. Elu1, elu2, and elu3 represent consecutive desorption fractions.
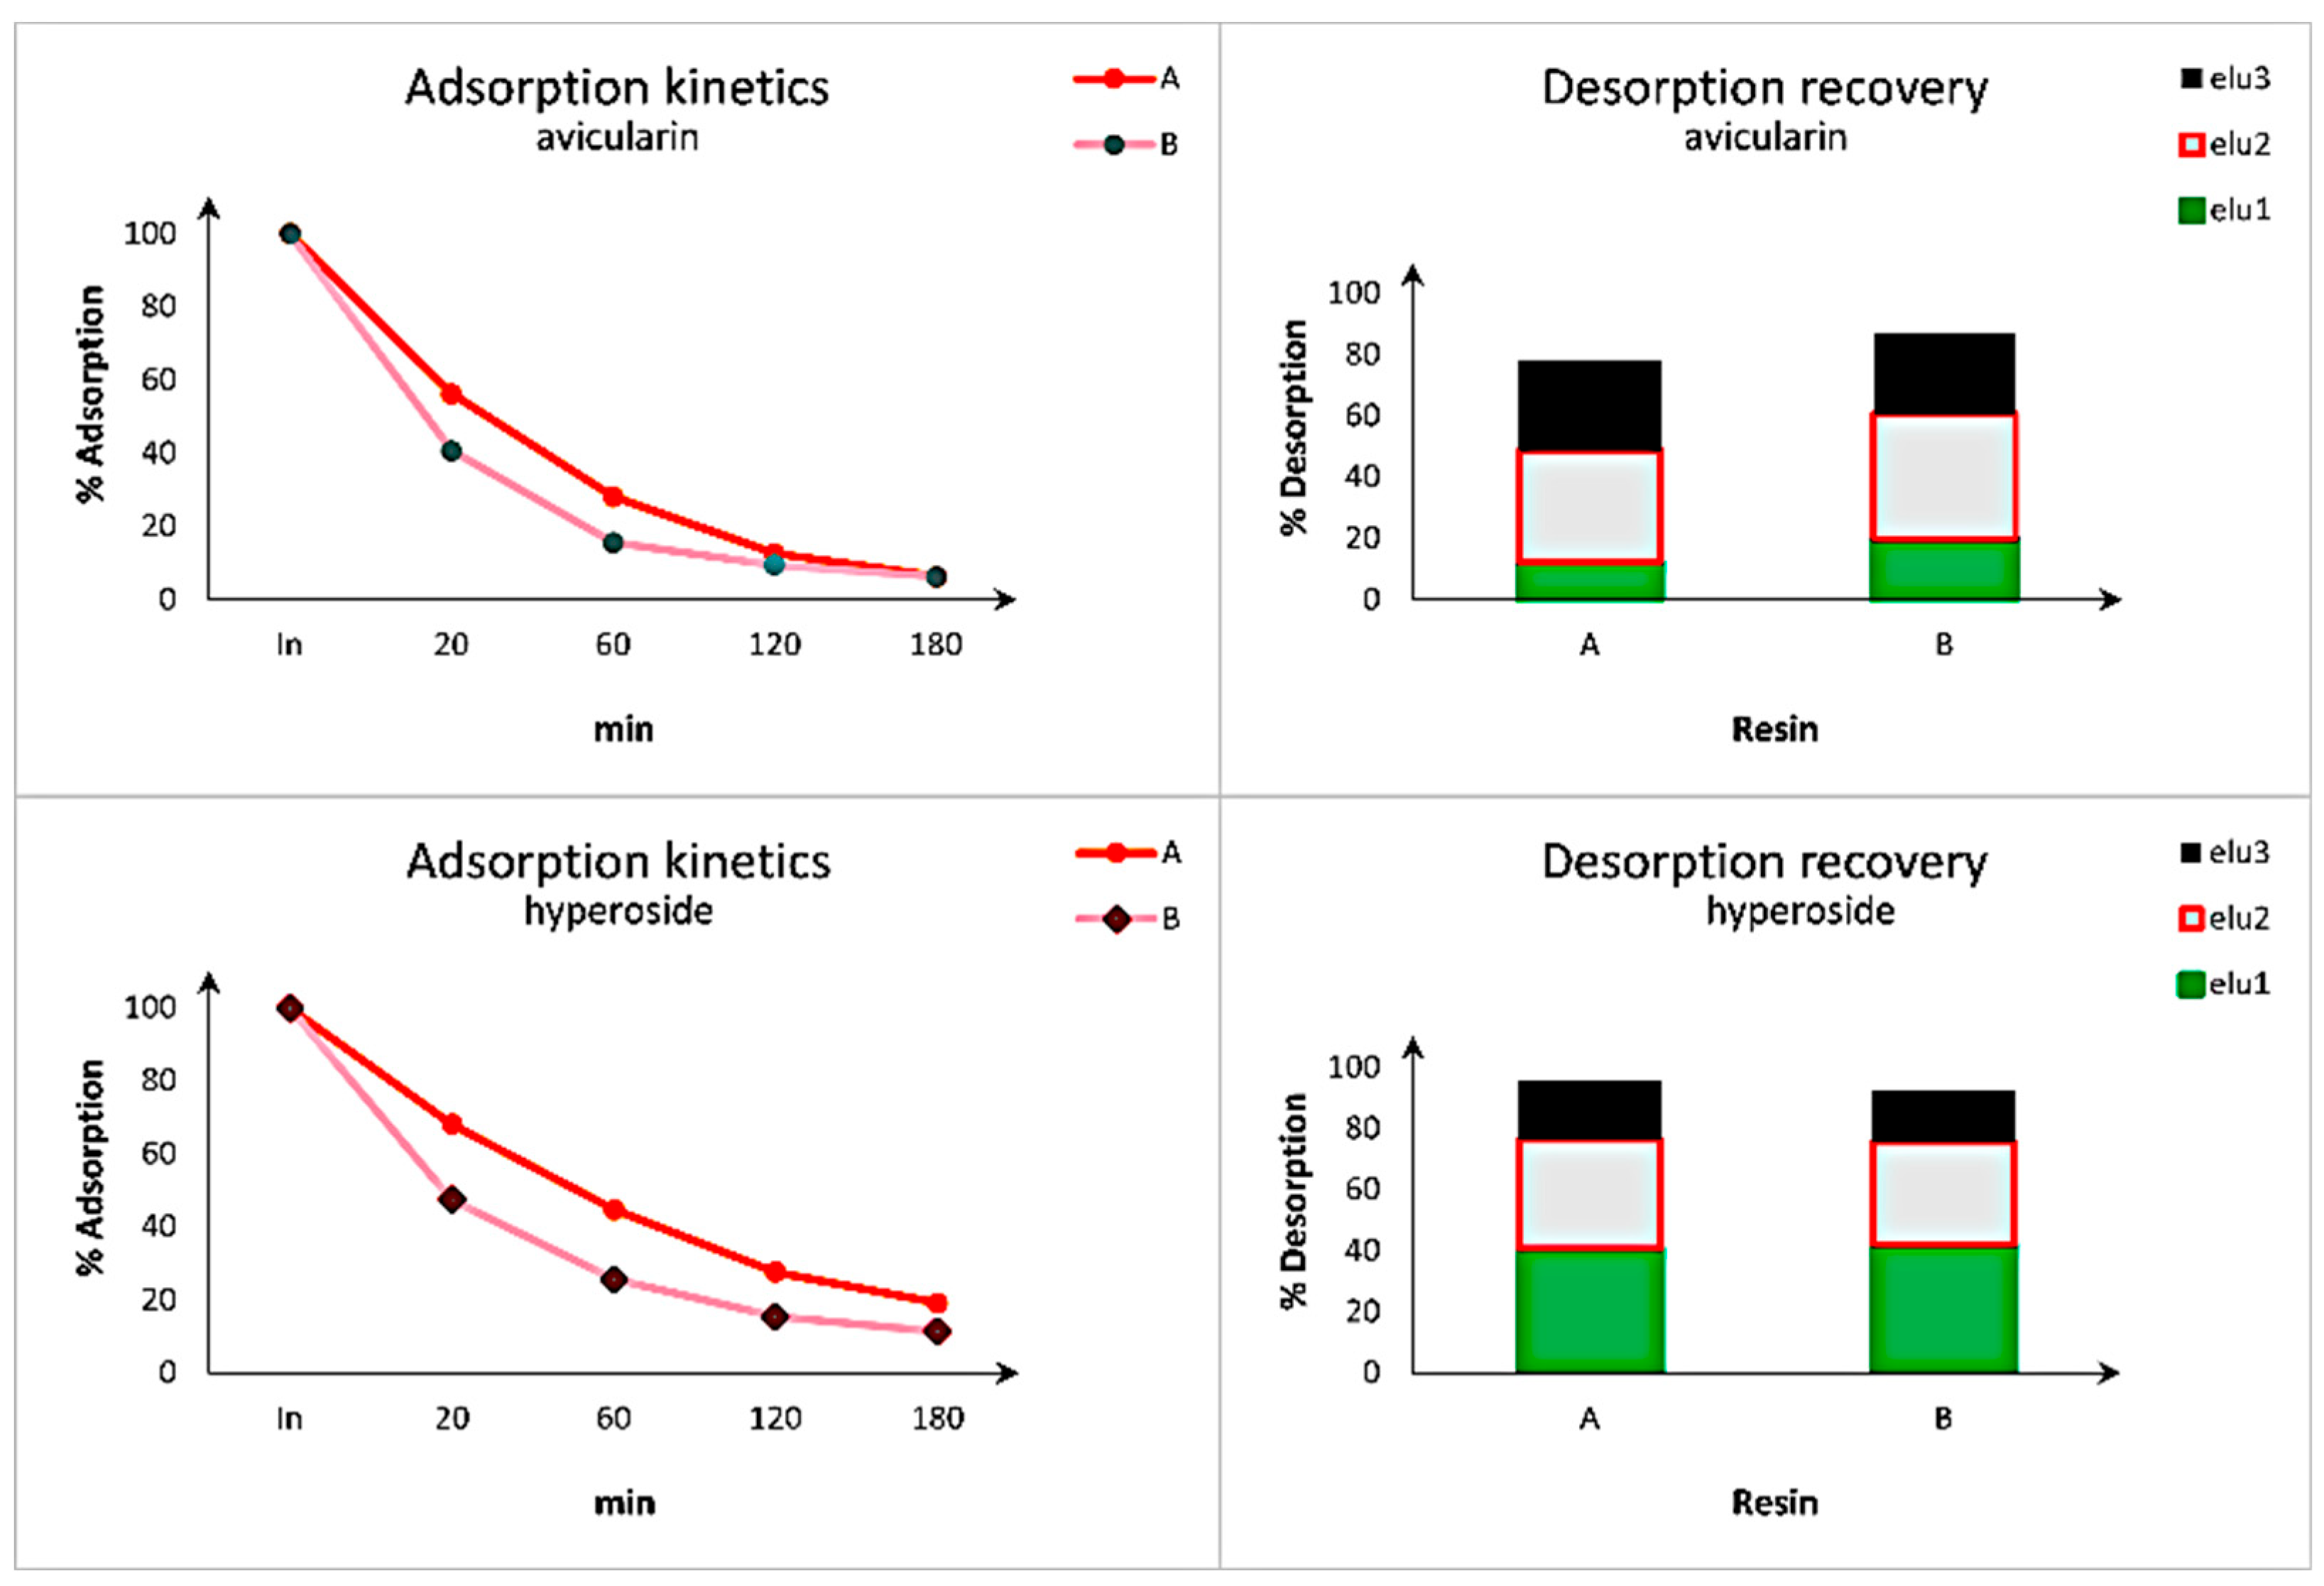
Figure 8.
Total desorption recovery yields (%) of target flavonoids obtained from the optimized macroporous resin purification process. The bars represent the cumulative eluted fraction for each specific compound.
Figure 8.
Total desorption recovery yields (%) of target flavonoids obtained from the optimized macroporous resin purification process. The bars represent the cumulative eluted fraction for each specific compound.
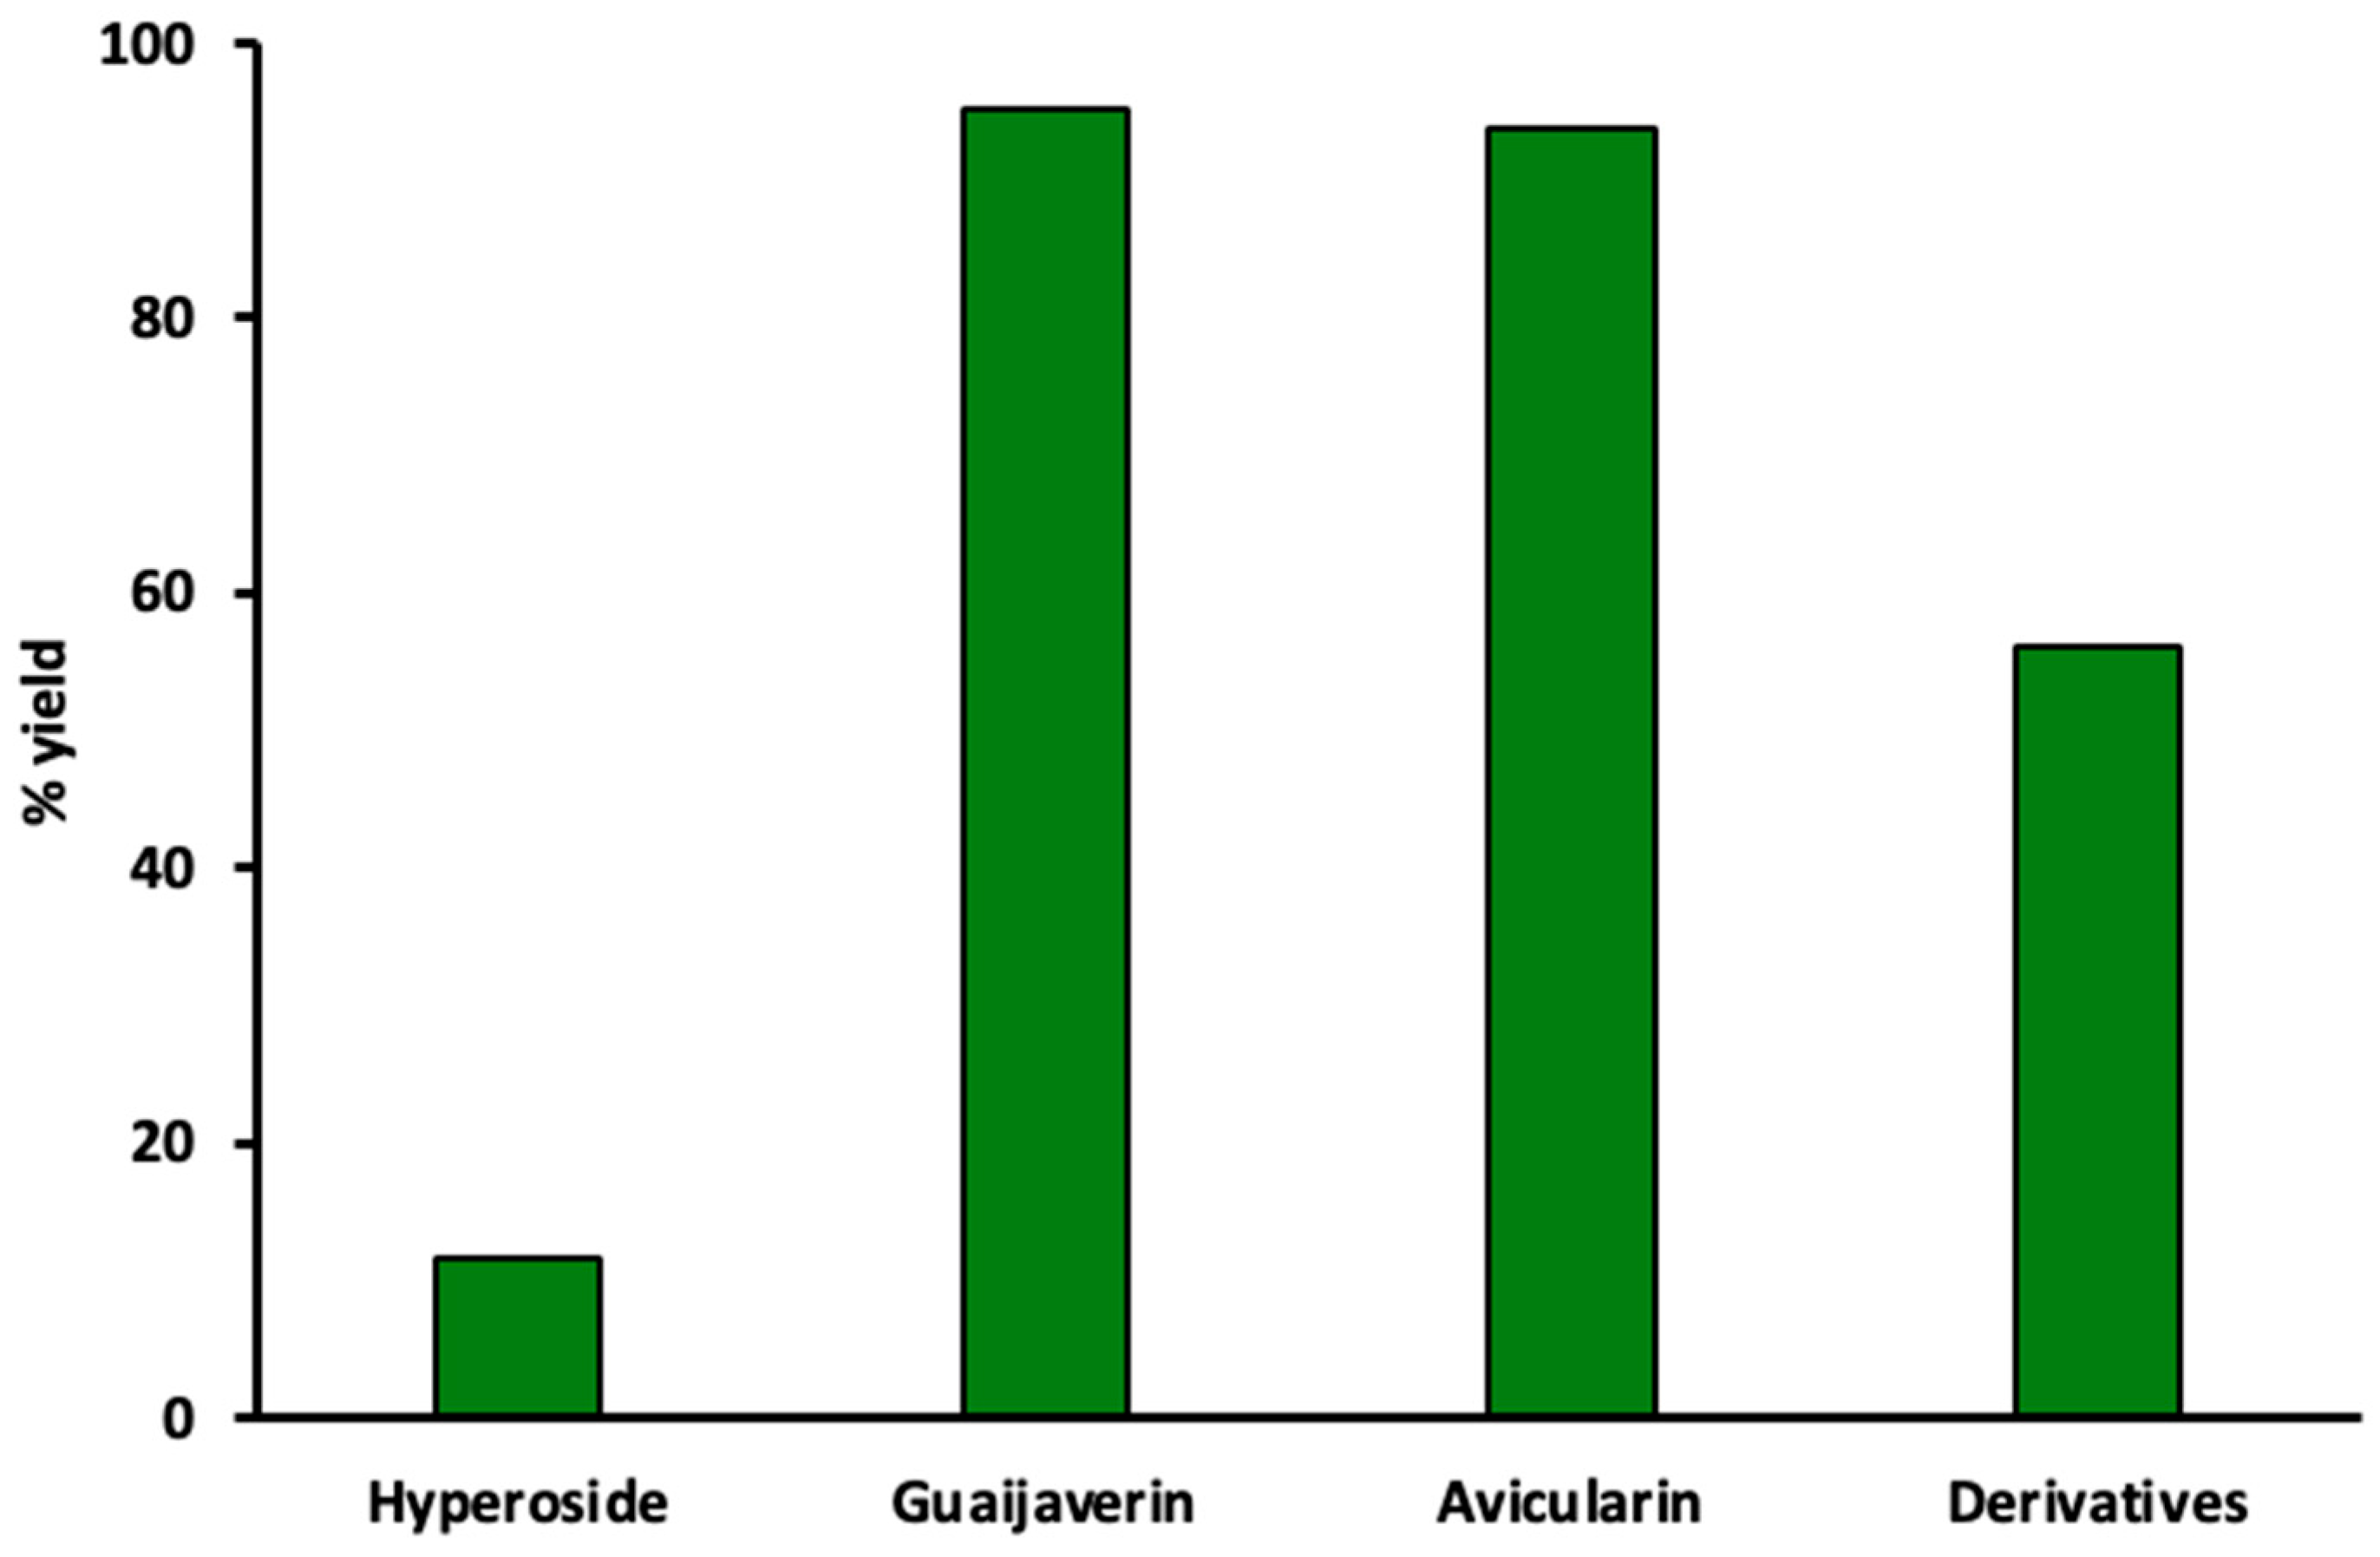
Figure 9.
Representative HPLC-DAD chromatogram of P. guajava leaf extract recorded at 350 nm. Peaks: (1) hyperoside; (2) guaijaverin; (3) avicularin.
Figure 9.
Representative HPLC-DAD chromatogram of P. guajava leaf extract recorded at 350 nm. Peaks: (1) hyperoside; (2) guaijaverin; (3) avicularin.
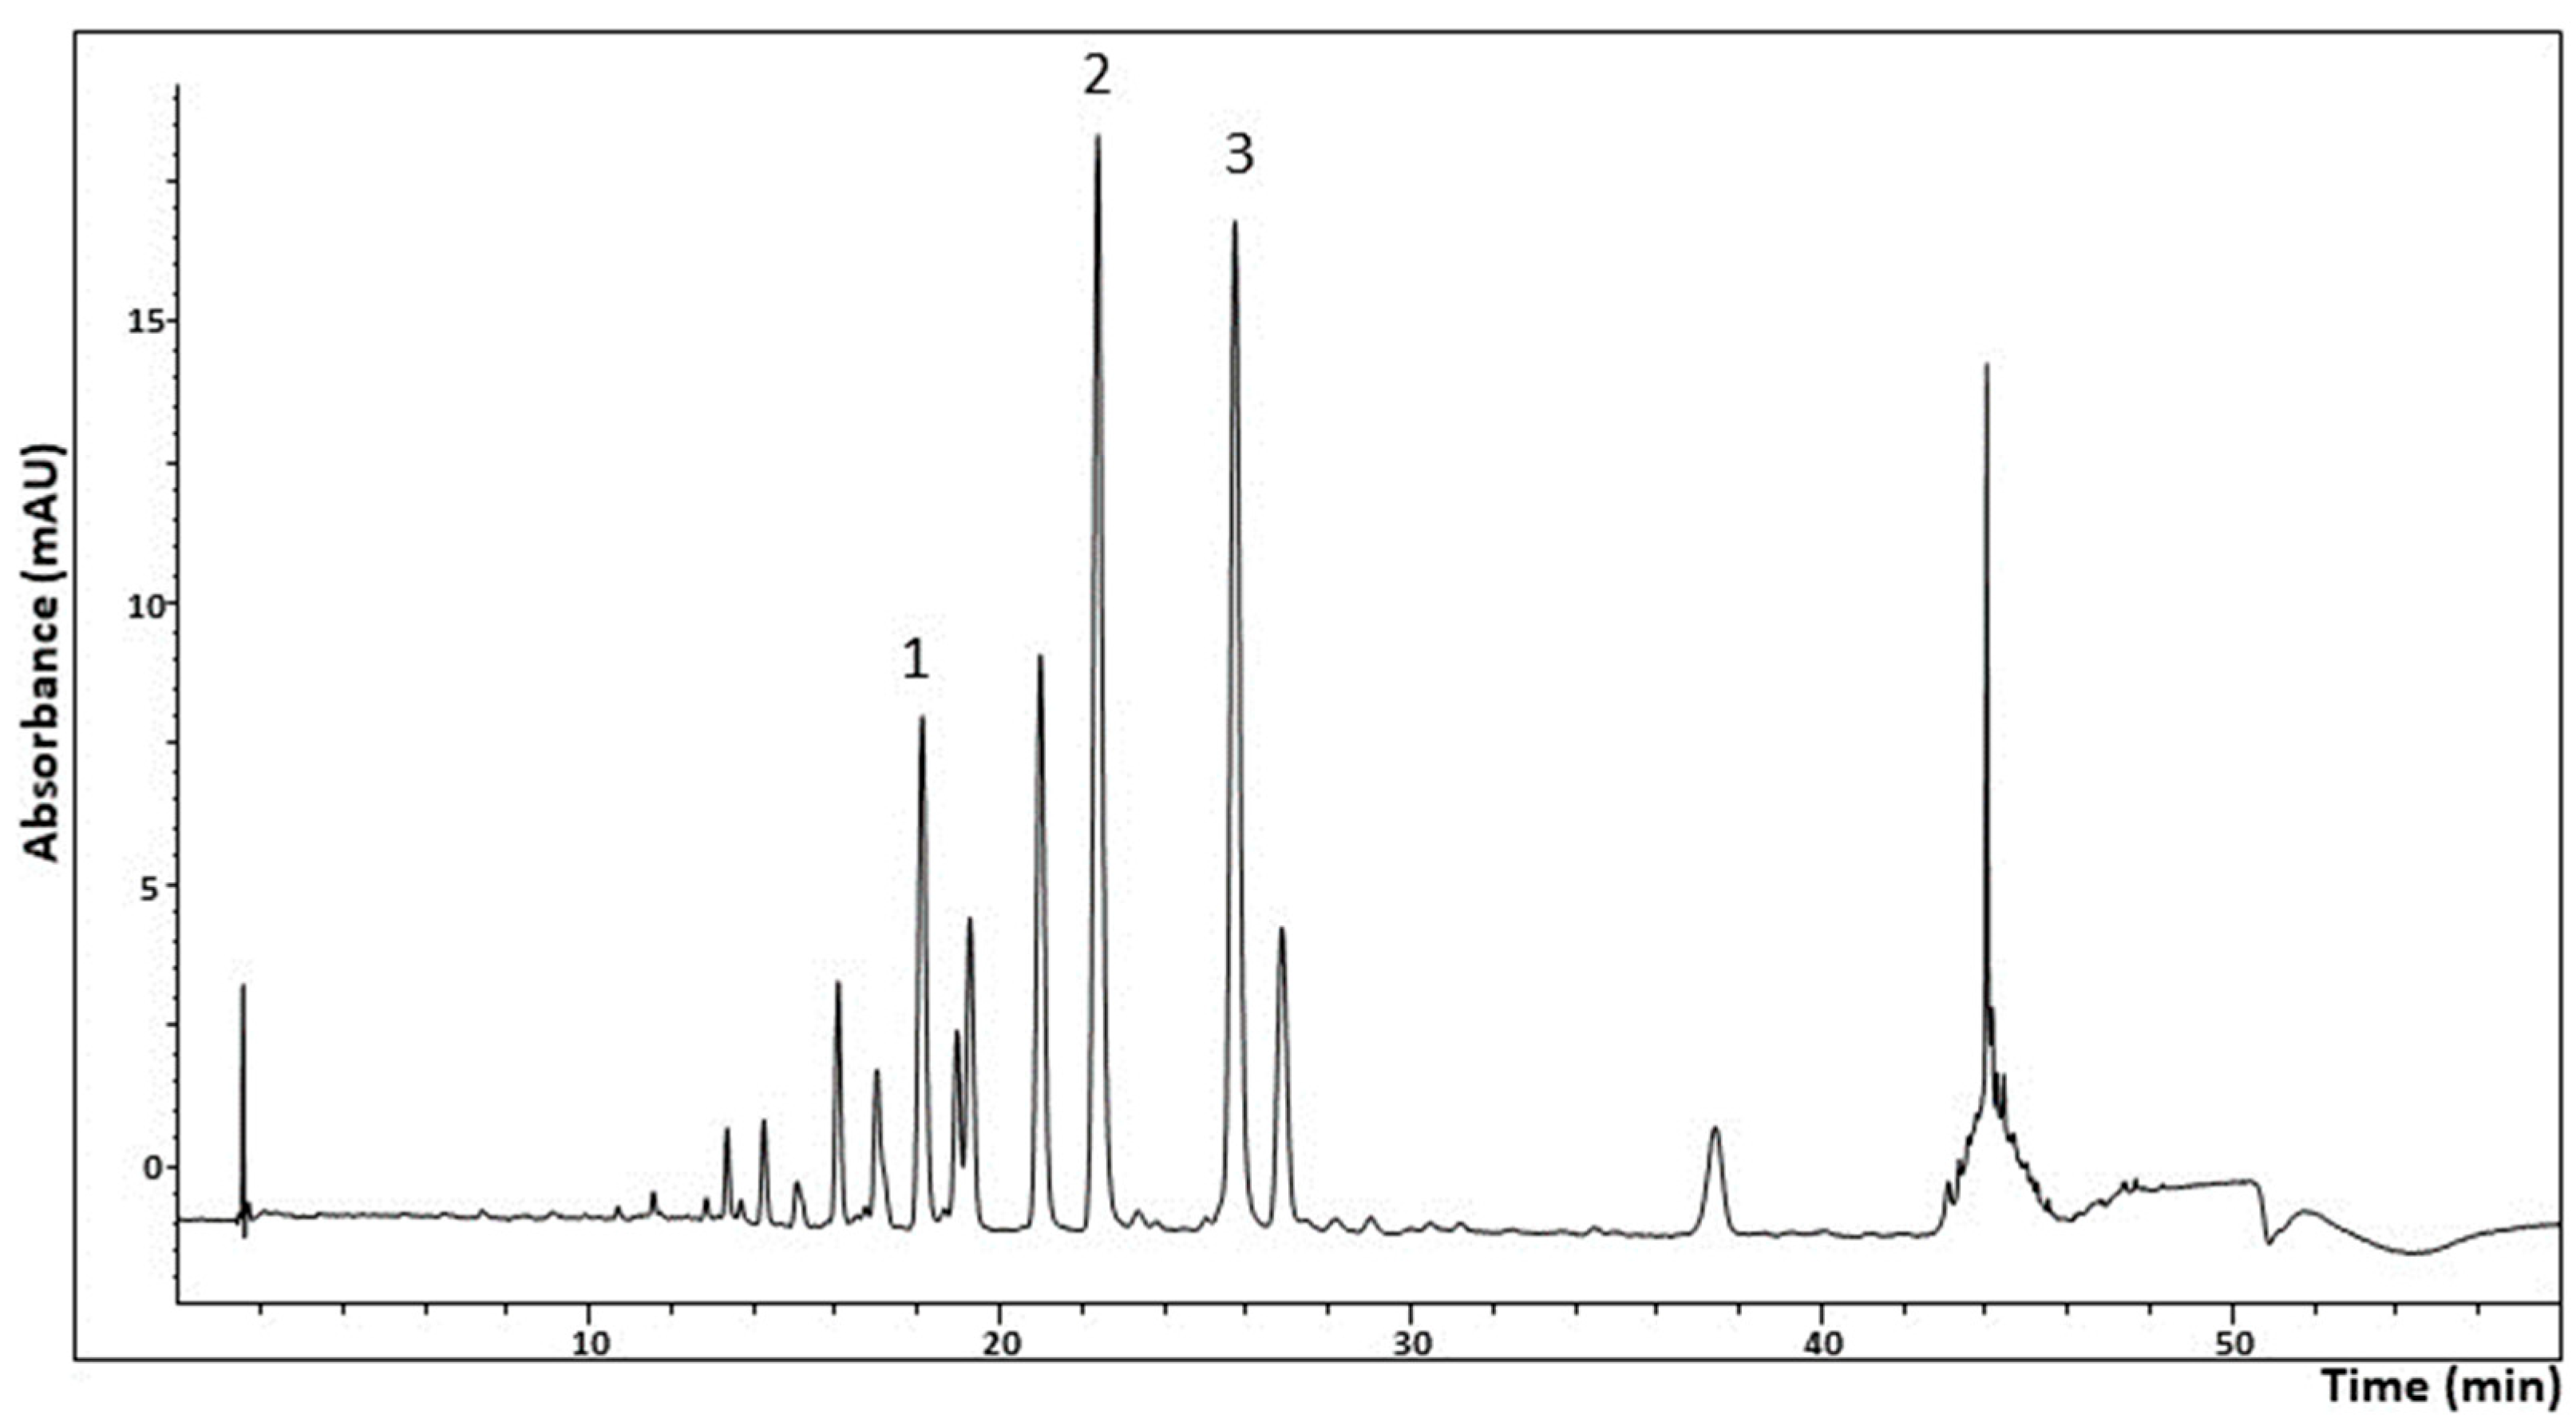
Figure 10.
MTT test on RAW 264.7 cells after 24 h exposure to different PGE concentrations. Data are reported as mean ± S.D. of four independent experiment. *: significant vs untreated CTRL cells. p < 0.05.
Figure 10.
MTT test on RAW 264.7 cells after 24 h exposure to different PGE concentrations. Data are reported as mean ± S.D. of four independent experiment. *: significant vs untreated CTRL cells. p < 0.05.
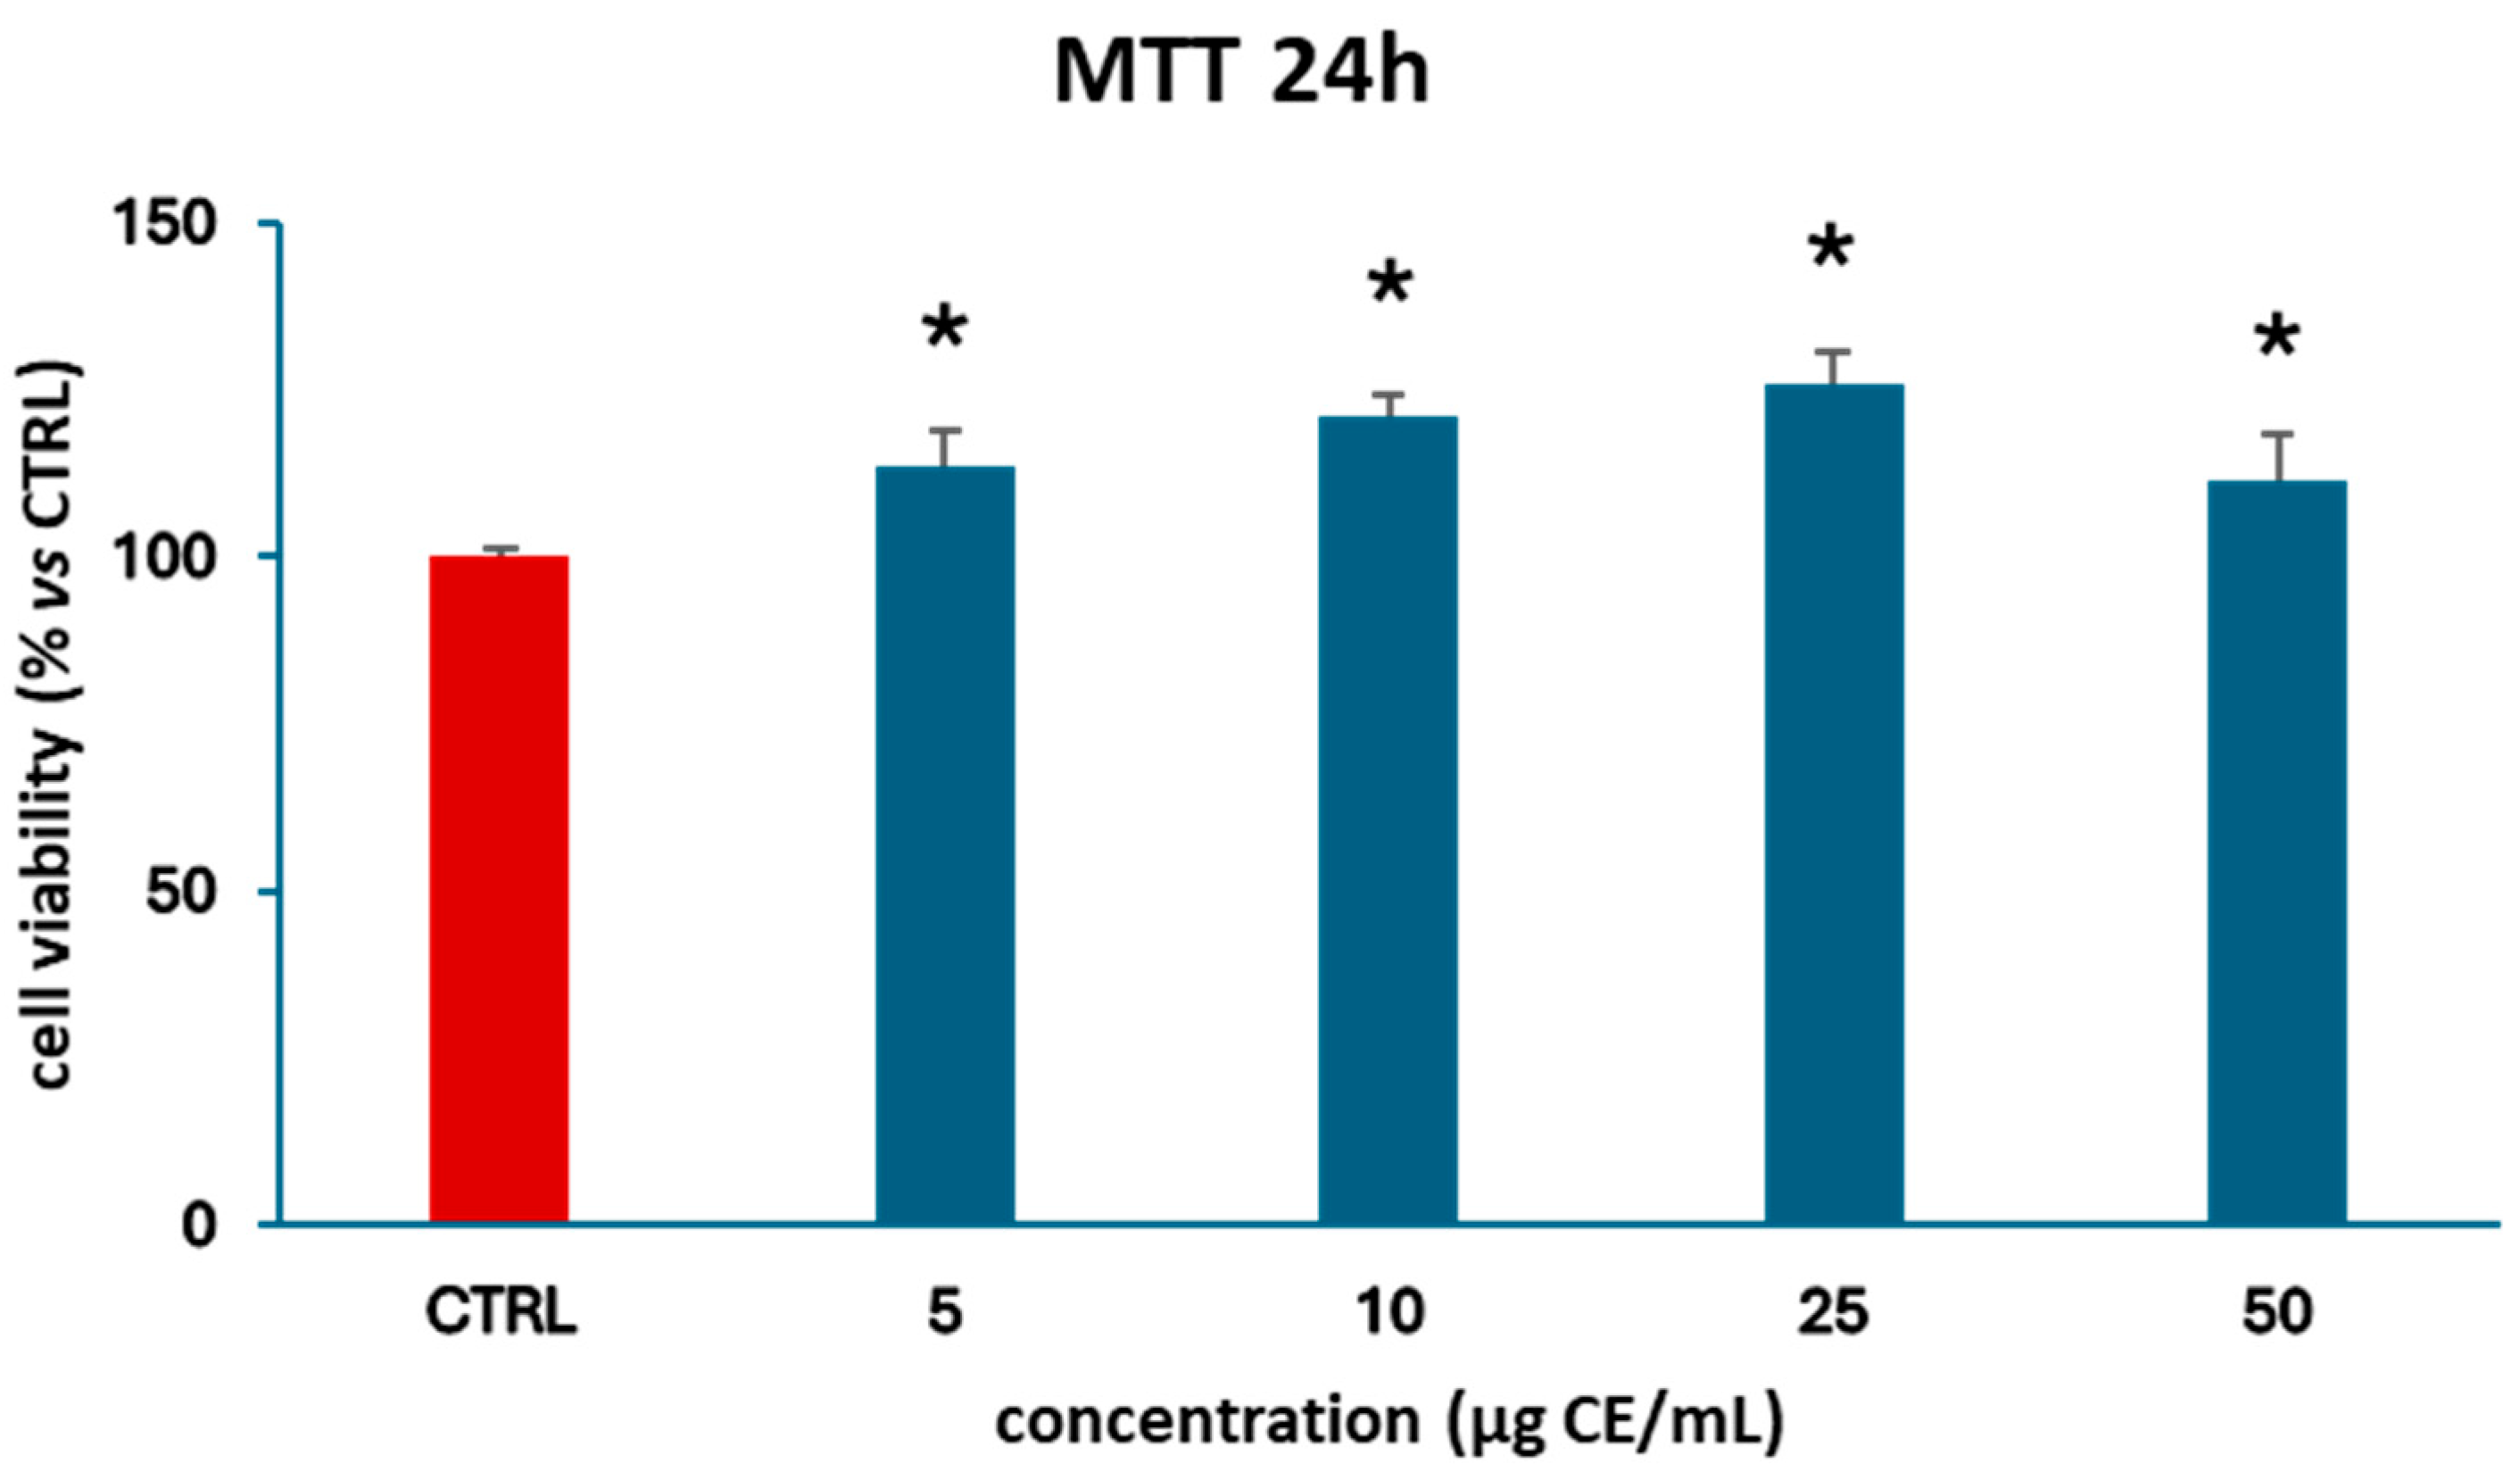
Figure 11.
•NO release in RAW 264.7 cells after 6 h pretreatment with PGE and 18 h exposure to LPS. Data are reported as mean ± S.D. of four independent experiment. *: significant vs untreated CTRL cells; #: significant vs LPS-activated cells. p < 0.05.
Figure 11.
•NO release in RAW 264.7 cells after 6 h pretreatment with PGE and 18 h exposure to LPS. Data are reported as mean ± S.D. of four independent experiment. *: significant vs untreated CTRL cells; #: significant vs LPS-activated cells. p < 0.05.
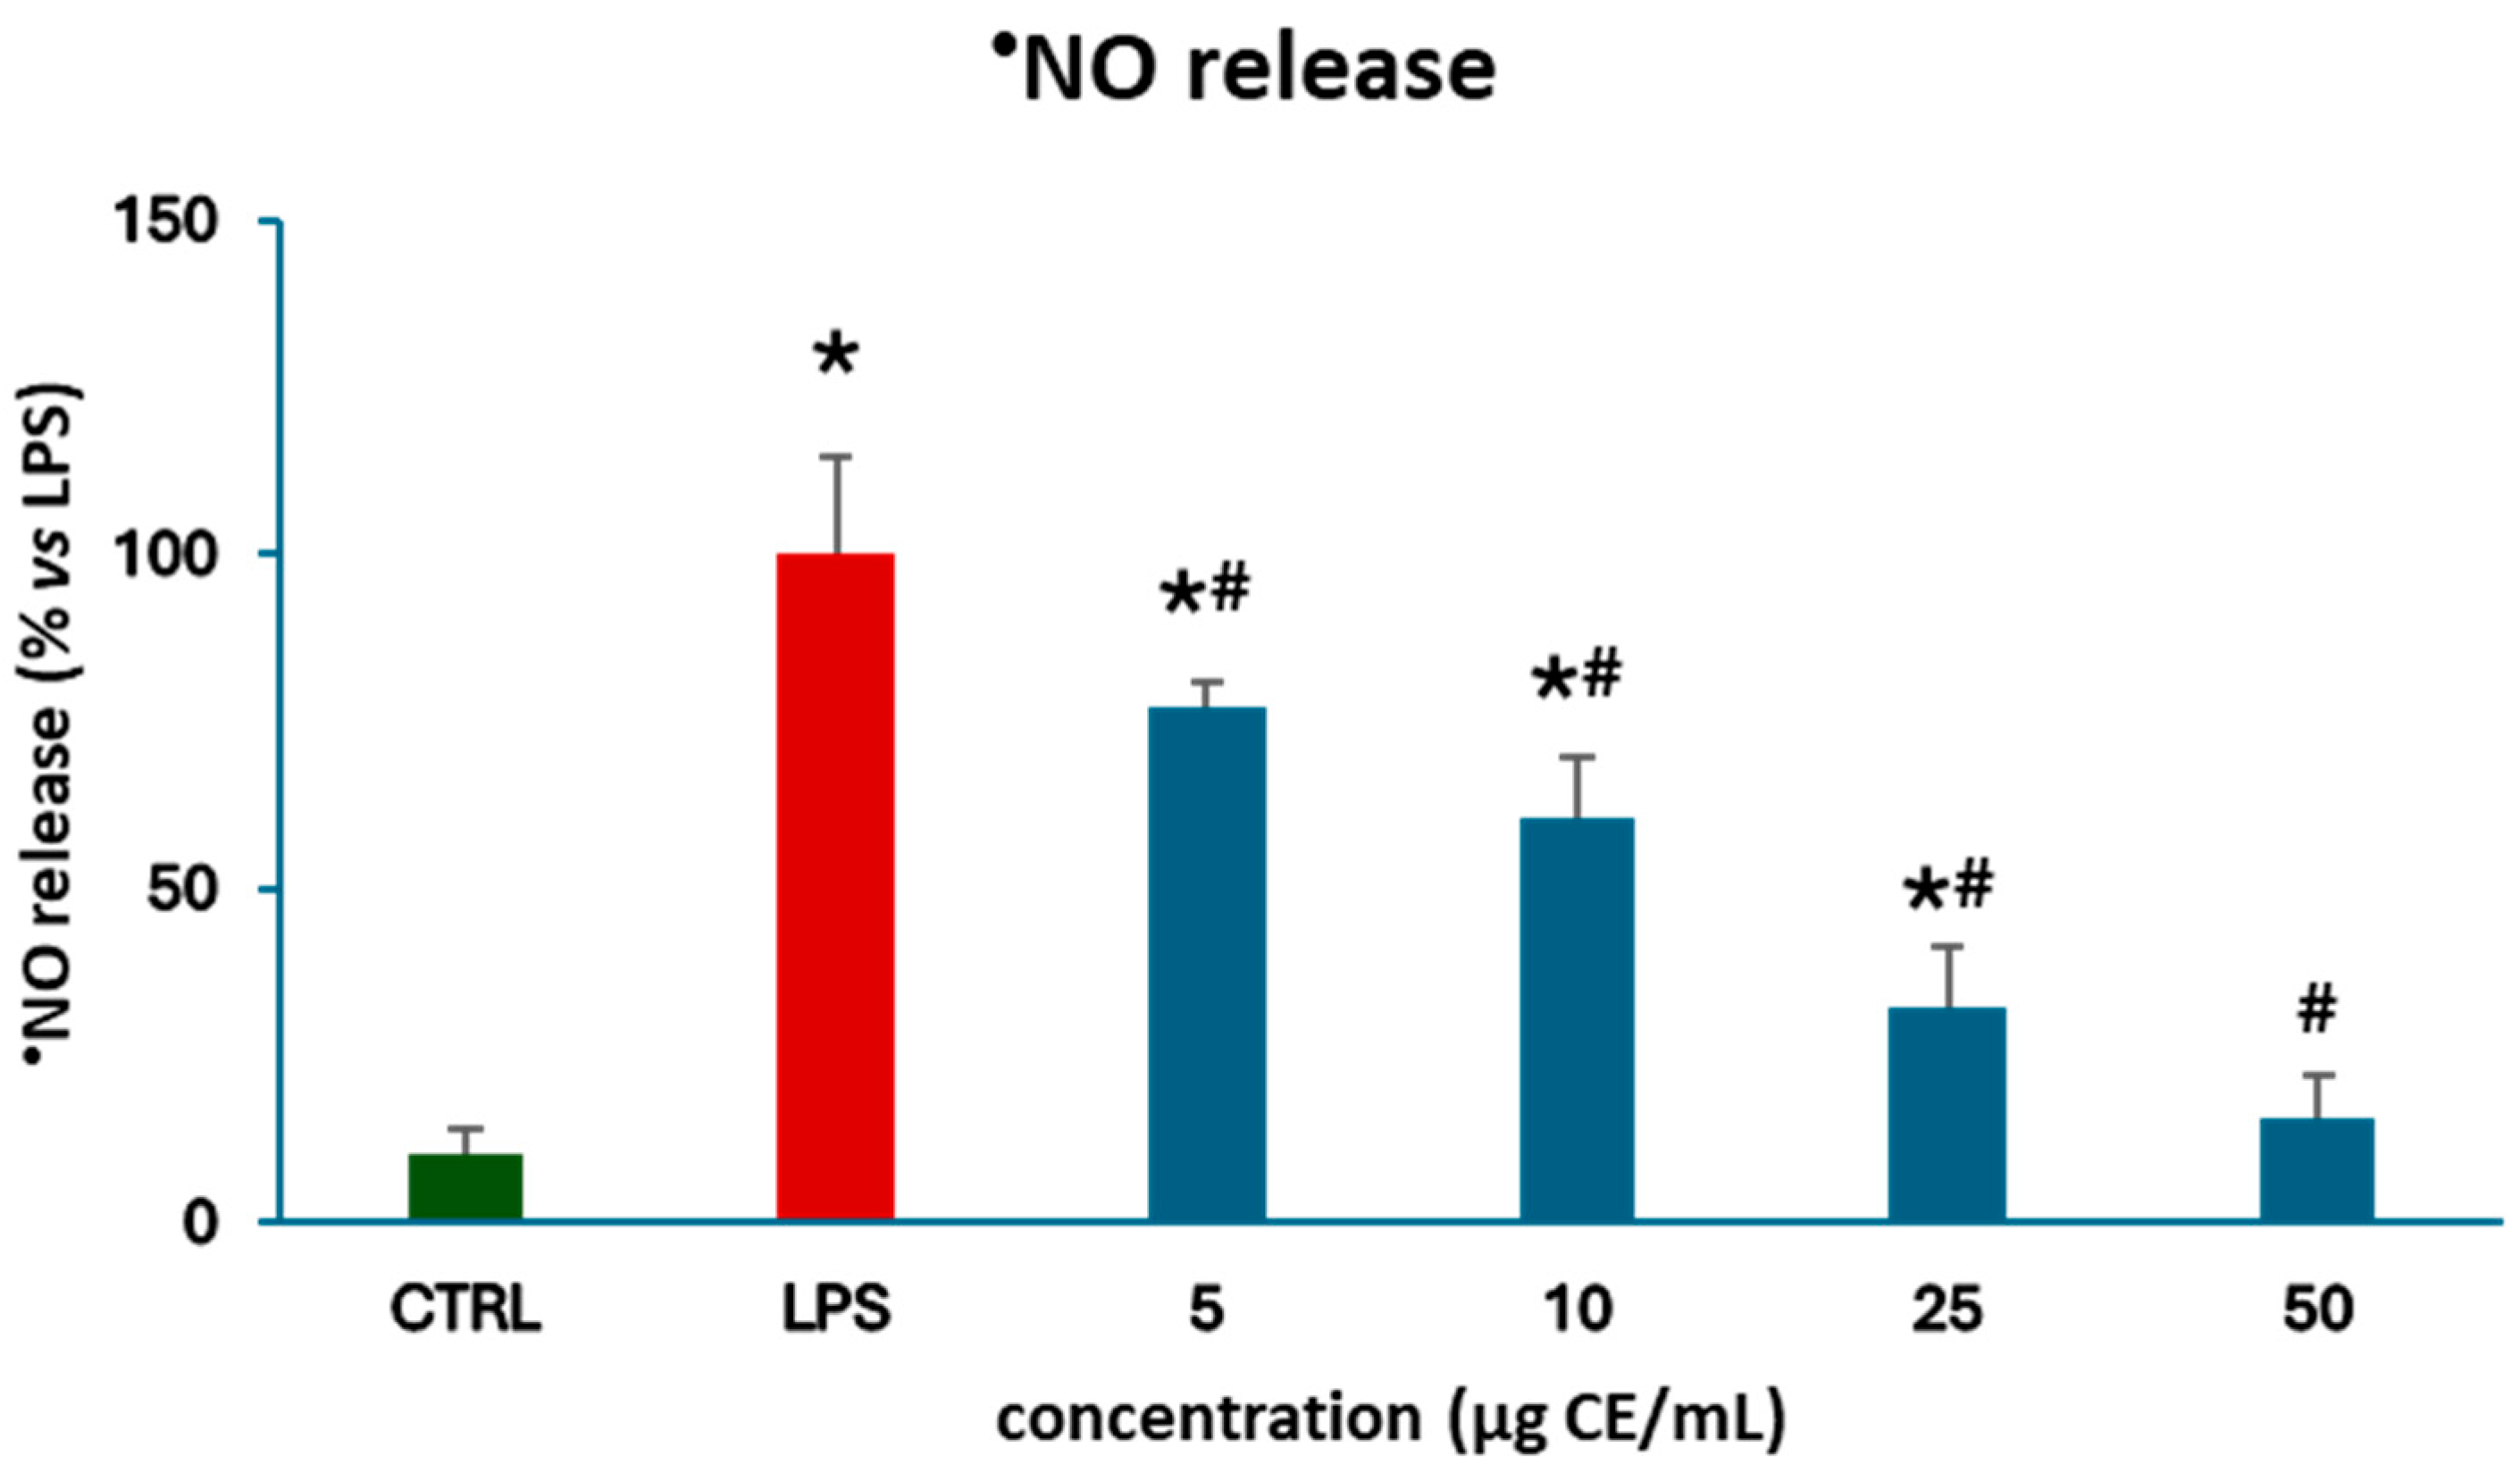
Figure 12.
ROS quantification in RAW 264.7 cells after 24 h pretreatment with PGE and 18 h exposure to LPS. Data are reported as mean ± S.D. of four independent experiment. *: significant vs untreated CTRL cells; #: significant vs LPS-activated cells. p < 0.05.
Figure 12.
ROS quantification in RAW 264.7 cells after 24 h pretreatment with PGE and 18 h exposure to LPS. Data are reported as mean ± S.D. of four independent experiment. *: significant vs untreated CTRL cells; #: significant vs LPS-activated cells. p < 0.05.
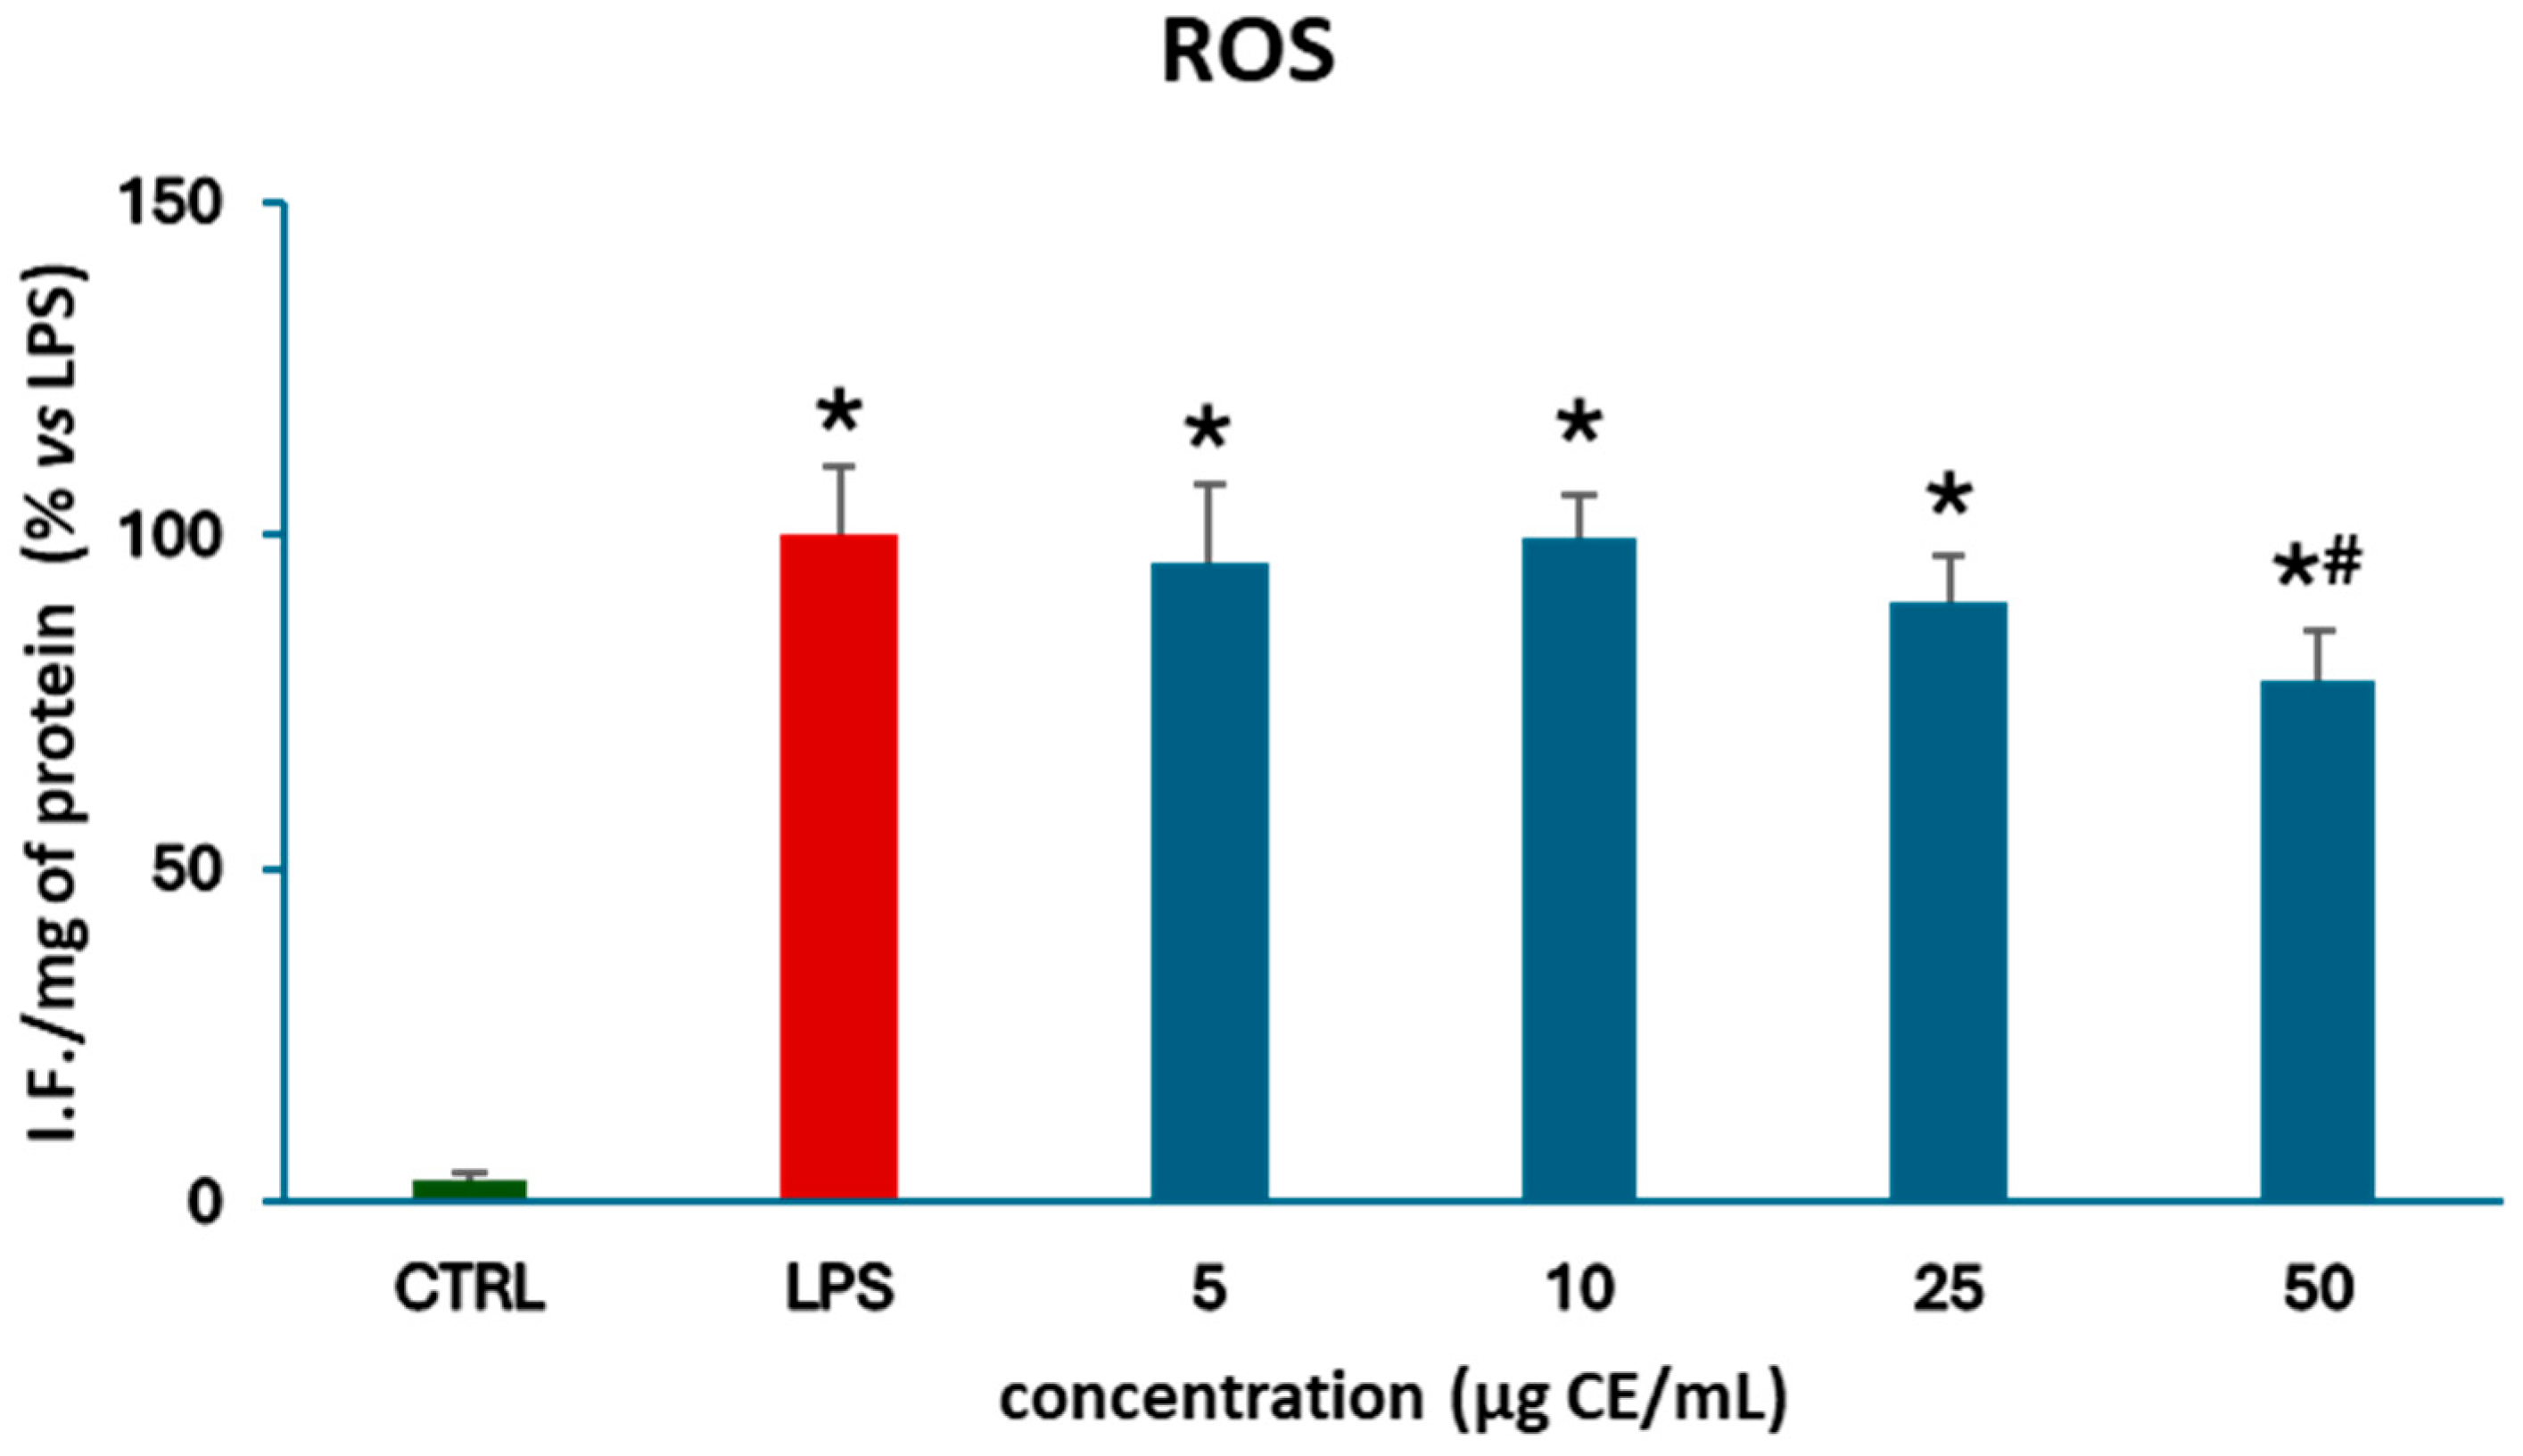

Table 1.
Quantitative evaluation of dry residue, TPC, and TFC of P. guajava leaf extracts obtained via exhaustive hydroalcoholic extraction.
Table 1.
Quantitative evaluation of dry residue, TPC, and TFC of P. guajava leaf extracts obtained via exhaustive hydroalcoholic extraction.
| Dry residual1 | TPC 2 | TFC 2 | |
| P.guajava leaves | 1.04 ± 0.021 | 0.35 ± 0.02 | 0.077 ± 0.006 |
1 % w/w; 2 % w/w (TPC GAE/g, TFC CE/g) vs Dry residual.
Table 2.
Qualitative and quantitative HPLC profiles of target flavonoids in P. guajava leaf extracts obtained via exhaustive hydroalcoholic extraction.
Table 2.
Qualitative and quantitative HPLC profiles of target flavonoids in P. guajava leaf extracts obtained via exhaustive hydroalcoholic extraction.
| Peak | Compound | Amount 1 | RT (min.) |
| 1 | Hyperoside | 0.0184±0.0022 | 18.11 |
| 2 | Guaijaverin | 0.0078±0.00071 | 22.43 |
| 3 | Avicularin | 0.0075±0.00049 | 25.79 |
1 % w/w vs Dry residual.
Table 3.
Predicted optimal extraction conditions.
| Temperature °C | Time min | TPC | TFC | |
|---|---|---|---|---|
| Optimized variables | 95 | 24 | ||
| % v/v mgGAE/g v.m.1 | 84 | |||
| % v/v mgCE/g v.m.1 | 15.4 |
1 v.m.: dry vegetal matrix.
Table 4.
PGE antioxidant characterization.
| DPPH• test 1 | SOD-like activity assay 1 | Catalase-like activity assay 1 | |
|---|---|---|---|
| PGE | 1.22±0.013 | 0.043±0.0067 | 9.51±0.15 |
1 IC50 (μg CE/mL).
Disclaimer/Publisher’s Note: The statements, opinions and data contained in all publications are solely those of the individual author(s) and contributor(s) and not of MDPI and/or the editor(s). MDPI and/or the editor(s) disclaim responsibility for any injury to people or property resulting from any ideas, methods, instructions or products referred to in the content. |
© 2026 by the authors. Licensee MDPI, Basel, Switzerland. This article is an open access article distributed under the terms and conditions of the Creative Commons Attribution (CC BY) license (http://creativecommons.org/licenses/by/4.0/).
Copyright: This open access article is published under a Creative Commons CC BY 4.0 license, which permit the free download, distribution, and reuse, provided that the author and preprint are cited in any reuse.