

Submitted:
21 July 2026
Posted:
27 July 2026
You are already at the latest version
Abstract
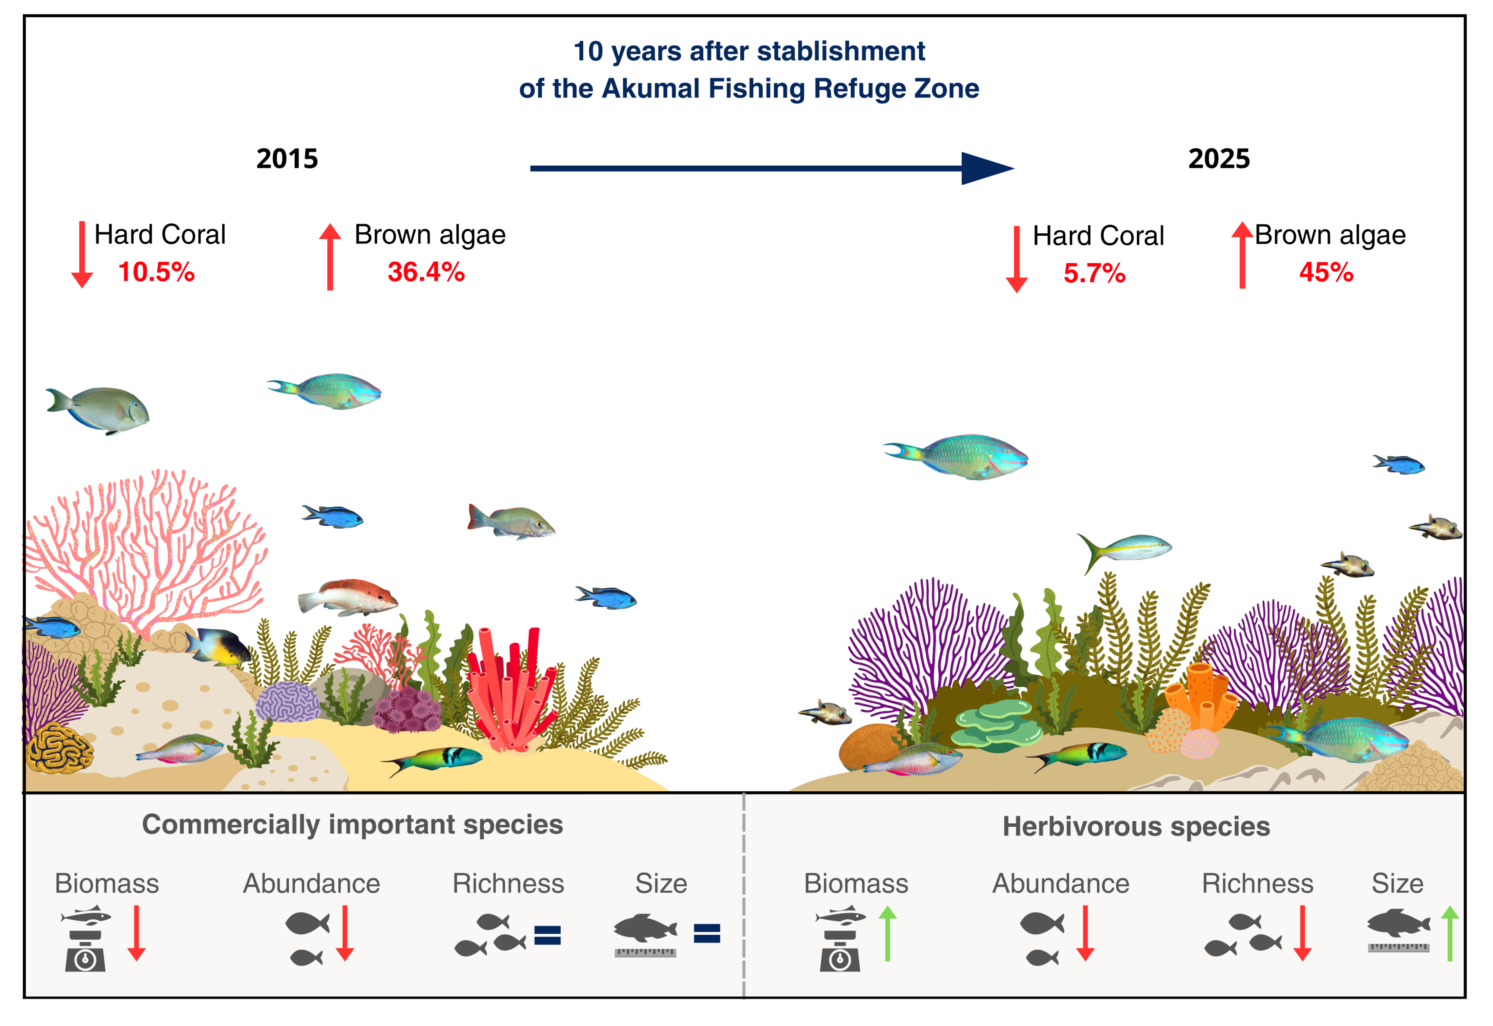
Fishing Refuge Zones (FRZs) seek to promote the recovery of exploited populations and associated ecosystems, although their effectiveness depends on various factors, such as habitat condition, the reduction of local stressors, and management implementation. We evaluated changes in the reef fish community of the Akumal FRZ, in the Mexican Caribbean, ten years after its establishment, with emphasis on commercial and herbivorous fishes. In 2025, we revisited 23 shallow and deep reef front sites surveyed in 2015 using visual censuses and benthic video transects. Fish biomass, abundance, and richness were analyzed using generalized linear mixed models; size structure using kernel density estimates; and the relationship between fish biomass and benthic condition using redundancy analysis. Commercial species showed no significant differences in biomass, richness, or size structure, but had lower abundance in 2025. In contrast, herbivores showed higher biomass and a shift toward a larger modal size, although with lower abundance and richness. These changes occurred on a reef with lower coral cover in 2025 and a predominance of brown algae in both periods. The results show a partial and functionally heterogeneous response, in a context of persistent degradation and limitations in management implementation and continuity.
Keywords:
fishing refuge zones
; coral reef fisheries
; fish biomass
; coral reefs
; environmental management
; marine protected areas
1. Introduction
Coral reefs perform a wide variety of essential ecological functions and provide highly significant ecosystem services by supporting numerous economically important species, including fish and invertebrates. These species have traditionally been exploited by commercial and artisanal fisheries, constituting fundamental sources of food and income for coastal communities [1,2,3]. However, these extractive activities represent a persistent pressure on reef fish communities, compromising their structure, diversity, and ecological function [4,5,6,7]. These changes are exacerbated by the ongoing degradation of coral reefs globally and, particularly, in the Mexican Caribbean [8,9,10], where significant declines in the biomass of key functional groups, such as herbivores—including parrotfish, surgeonfish, and commercially important species like wrasses, snappers, and groupers —have been reported [11,12].
In this context of constant pressure and ecosystem degradation, Mexican legislation provides for various management tools aimed at the conservation and sustainable use of marine resources. Among these are instruments analogous to no-take marine reserves, known as Fishery Refuge Zones (FRZs), which constitute a key tool for sustainable fisheries management [13] and were incorporated into Mexican law in 2007 through the General Law on Sustainable Fisheries and Aquaculture [14]. FRZs are marine protected areas where extractive activities are fully or partially restricted. Their main objectives are to promote the recovery of economically important fish populations, contribute to fisheries sustainability, and preserve fundamental biological processes —such as reproduction, growth, and recruitment—as well as habitat integrity and ecological interactions [14].
By February 2025, 45 FRZ had been established in Mexico, of which only 27 remained active [15]. Although the implementation of FRZ has gained prominence within fisheries management and marine conservation strategies, the extent to which they have produced measurable ecological benefits remains unclear [16]. Some available studies and technical reports suggest that these tools may promote positive changes in the size structure and biomass of reef fish, as well as moderate increases in coral cover and reductions in macroalgal cover compared to adjacent unprotected areas [17,18,19,20,21,22]. These patterns are consistent with evidence reported for no-take marine reserves on a global scale [23,24,25,26,27,28]. However, other studies have reported variable responses or patterns that are difficult to attribute directly to spatial protection [29,30].
From a management perspective, the positive effects reported for some FRZ and no-take marine reserves suggest that these tools may be most effective when fisheries protection occurs in sites with structurally complex habitats and is supported by favorable governance conditions, as well as through the active involvement of users in the implementation and monitoring of management tools [13,16,31,32,33]. However, it is still necessary to understand to what extent these tools can promote the recovery of fish biomass in degraded reefs, a condition that is increasingly common across Mexican Caribbean reef systems. Under this scenario, management strategies based exclusively on restricting fishing harvests may have limited effects if other local stressors affecting the benthic condition, structural complexity, and ecological functionality of the reef are not simultaneously addressed [8,10,34,35,36,37,38,39,40,41].
In response to Akumal reef’s degradation and decline in reef fish biomass, the Akumal Fisheries Refuge Zone was established in 2015, covering an area of 9.88 km², with the aim of preserving key species for commercial fishing and increasing their biomass [42,43]. Given the condition of the reef at the time of the decree, it was estimated that a significant recovery of fish biomass would require between 10 and 20 years of effective protection [43]. Ten years after its establishment, this FRZ provides a relevant case study for evaluating whether fisheries protection has promoted the recovery of fish biomass in a degraded reef system, particularly for herbivorous and commercially important species. In this context, we pose the following question: Has fish biomass in Akumal reef changed positively 10 years after the FRZ decree? We hypothesize that, even with the exclusion of commercial fishing activities, the progressive degradation of the coral benthic community in Akumal during the same period [39] has limited the recovery and increase in fish biomass, particularly of commercially important target species (COM).
2. Materials and Methods
Study Area
Akumal is located on the Riviera Maya, in northern Quintana Roo, Mexico, within the municipality of Tulum. It was one of the first tourist destinations developed on the mainland of Quintana Roo [44], and over the past decade, it has consistently ranked among the top three areas with the highest hotel occupancy rates in the Riviera Maya and southern Mexico, alongside Cancún and Playacar [45].
Akumal reef exhibits significant geomorphological development within the Mesoamerican Reef System [46]. It is divided into five main reef zones: the shallow reef lagoon, with seagrasses, coral patches, and sand/gravel flats; the back reef, dominated by massive hemispherical corals and octocorals; the reef crest, dominated by standing dead colonies of Acropora palmata; the reef front, with a transition zone of communities on hard substrate, between ~5 and 6 m deep, leading to a well-developed reef front with spurs and grooves down to ~15 m deep; and a reef slope, which begins at around 16 m deep and is separated from the reef front by a wide sandy channel, with a more prominent spurs and grooves system extending into a deep zone down to ~35 m [43,47,48]. Furthermore, Akumal is associated with a system of bays, coves, and coastal bodies connected to the karst aquifer of the Yucatán Peninsula. In this region, groundwater discharges constitute an important connection between the terrestrial system and the marine environment, supplying freshwater and nutrients to the coastal zone and reef ecosystems [36].
Sampling Design
To ensure comparability with previous surveys used in 2015 [43], 23 sites within the FRZ were revisited in 2025, following the same monitoring network defined by a stratified random sampling design. These included 13 sites on the shallow fore reef (~10 m deep) and 10 sites on the deep fore reef (~20 m deep) (Figure 1).
Environmental Characterization
The fish community was characterized using the same methods as those employed by Molina-Hernández et al. [43]. At each defined sampling site, a single 50 × 2 m (100 m²) visual survey transect was conducted to assess the reef fish community. All individuals were identified to the species level, and their total length was estimated in centimeters. These data were used to calculate species richness, abundance, and biomass by species, family, and trophic group. Biomass was calculated using the allometric equation:
where W is the individual’s weight (g), L is the individual’s total length (cm), and a and b are specific coefficients obtained from length-weight regressions available in FishBase [49]. Total biomass was estimated as the sum of individual weights per unit area.
W = aLb,
For the comparative analysis between 2015 and 2025, we selected two focal groups within the reef fish community: The first are commercially important species (COM), subject of the FRZ management objectives; and the second are herbivorous species (HERB) because of their ecological importance. Commercially important species included those belonging to the Serranidae (groupers) and Lutjanidae (snappers) families that were recorded within the FRZ (Epinephelus guttatus, Cephalopholis cruentata, C. fulva, Lutjanus apodus, L. synagris, L. mahogoni, and Ocyurus chrysurus), This group represents a widely used biomass-based indicator of reef condition [12] and includes some of the most important local fishery resources in the region [42,50]. Herbivores included species belonging to the families Acanthuridae (surgeonfishes) and Scaridae (parrotfishes); Acanthurus chirurgus, A. coeruleus, A. tractus, Sparisoma atomarium, S. aurofrenatum, S. chrysopterum, S. rubripinne, S. viride, Scarus coelestinus, S. iseri, S. taeniopterus, and S. vetula, following the conventional classification used in reef monitoring. Together, these groups (COM and HER) comprise two of the principal indicators used in coral reef monitoring [12], while also ensuring direct comparability with the baseline assessment conducted at the time of the FRZ decree [43]. The remaining species of the recorded fish community were grouped under the category “other reef fish species” (OTH).
The reef benthic community was characterized at each site using 30 m² (50 × 0.6 m) underwater video transects, recorded with a GoPro Hero 9 Black camera (4K at 60 fps), maintaining a constant height of approximately 40 cm and an orientation perpendicular to the substrate. The video transects were conducted along the same transects used for the visual fish surveys, to ensure spatial correspondence between the two datasets. Benthic cover was estimated by identifying organisms: stony corals at the species level, algae at the phylum level, sponges, octocorals, and zoanthids at the morphologic group level, and inert substrates such as rubble, rock, and sand. A systematic grid of 13 points was used across 40 frames distributed equidistantly along the 50-meter transect, for a total of 520 points per transect. Additionally, a frame-by-frame analysis of the entire video transect was conducted to record coral colonies by species, and these coral colonies by species data was assigned to life-strategies [37,51,52].
Data Analysis
Temporal and spatial changes in the biomass, abundance, and richness of fish groups were assessed using generalized linear mixed models (GLMMs), fitted separately for each functional group. All models included year, reef zone, and their interaction as fixed effects, while the sampling season was included as a random effect to account for the paired structure of the sampling design [53]. Biomass was modeled using error distributions consistent with the nature of the data for each group. For COM biomass, a model with a Tweedie distribution and a logarithmic link function was fitted, due to the presence of zero values. For HERB and OTH, models with a Gamma distribution and a logarithmic link were used [54].
Abundance was calculated as the sum of the number of individuals recorded per group in each sampling unit, while species richness corresponded to the number of unique species recorded per group. For COM, abundance and species richness were modeled using a Poisson distribution. In the case of HERB and OTH, abundance was modeled using a negative binomial distribution, while species richness was modeled using a Conway-Maxwell-Poisson distribution, which is suitable for count data with dispersion structures different from the Poisson distribution [54].
Models were fitted using the glmmTMB package in R. Model fit was assessed using simulated residuals generated with the DHARMa package, and the estimated marginal means, as well as changes across years and reef zones, were obtained using the emmeans package.
Temporal changes in size distribution between 2015 and 2025 were explored using kernel density curves, estimated separately for each fish group and reef zone [55,56]. The distributions were constructed based on the midpoint of each size class, weighted by the abundance recorded in each class. The curves were estimated using the density() function from the stats package, with a Gaussian kernel. Differences between the 2015 and 2025 size distributions were assessed using permutation tests based on the integrated squared distance between density curves [57], with 9,999 random permutations. The p-values obtained were adjusted for multiple comparisons using the Bonferroni correction. The density curves were visualized using the ggplot2 package.
Finally, the relationship between focal functional groups and reef habitat characteristics was explored using redundancy analysis (RDA) in Canoco (Biometris, v4.5), with analyses performed separately for 2015 and 2025. The response matrix included the biomass of the groups of interest, as well as the aggregated biomass of the remaining reef fish community, after Hellinger transformation. Explanatory variables included brown algae cover, total stony coral cover, and coral cover by life-history strategy: Weedy, Competitive, and Stress-tolerant.
3. Results
3.1. Fish Community
In 2015, a total of 2,272 reef fish were recorded, of which 1,104 were on the shallow fore reef and 1,168 on the deep fore reef. Seventy species were identified, belonging to 40 genera and 23 families (Table S1). By 2025, the total number of individuals was 2,443, with 1,285 recorded on the shallow fore reef and 1,158 on the deep fore reef. In contrast, species richness was 61 species, grouped into 40 genera and 23 families.
In 2015, the most abundant species were Azurina cyanea (304 individuals), Thalassoma bifasciatum (283), and Stegastes partitus (271). By 2025, a marked change was observed, with Canthigaster rostrata as the most abundant species (1,113 individuals), followed by T. bifasciatum (220) and A. cyanea (158).
3.2. Changes in Total Biomass and Fish Groups
At the community level, model-estimated total reef fish biomass was significantly higher in 2025 than in 2015, increasing from 3,632 g·100 m⁻² to 5,767 g·100 m⁻² (p = 0.015). When reef zones were analyzed separately, model-estimated total biomass was significantly higher in 2025 in the shallow fore reef, increasing from 3,999 g·100 m⁻² in 2015 to 8,486 g·100 m⁻² in 2025 (p = 0.004). In contrast, no significant difference was detected in the deep fore reef, where model-estimated biomass was 3,514 g·100 m⁻² in 2015 and 2,994 g·100 m⁻² in 2025 (p = 0.452).
At the reef-wide scale, model-estimated HERB biomass was significantly higher in 2025, increasing from 1,578 g·100 m⁻² in 2015 to 2,453 g·100 m⁻² in 2025 (p = 0.031). In contrast, COM biomass did not differ significantly between years, with estimates of 220 g·100 m⁻² in 2015 and 102 g·100 m⁻² in 2025 (p = 0.083). Similarly, OTH biomass did not differ significantly between years, with estimates of 1,706 g·100 m⁻² in 2015 and 2,132 g·100 m⁻² in 2025 (p = 0.242; Figure 2a).
In the shallow fore reef, model-estimated HERB biomass was significantly higher in 2025, increasing from 1,850 g·100 m⁻² in 2015 to 4,079 g·100 m⁻² in 2025 (p = 0.004). OTH biomass was also significantly higher in 2025, increasing from 1,643 g·100 m⁻² to 2,985 g·100 m⁻² (p = 0.044). In contrast, COM biomass did not differ significantly between years, with estimates of 203 g·100 m⁻² in 2015 and 333 g·100 m⁻² in 2025 (p = 0.277; Figure 2b).
In the deep fore reef, model-estimated COM biomass was significantly lower in 2025, declining from 238 g·100 m⁻² in 2015 to 31 g·100 m⁻² in 2025 (p = 0.007). In contrast, HERB biomass did not differ significantly between years, with estimates of 1,345 g·100 m⁻² in 2015 and 1,475 g·100 m⁻² in 2025 (p = 0.759). OTH biomass also showed no significant difference between years, with estimates of 1,772 g·100 m⁻² in 2015 and 1,522 g·100 m⁻² in 2025 (p = 0.526; Figure 2c).
The Year × Reef Zone interaction was significant for total community biomass (p = 0.006) and COM biomass (p = 0.004), indicating that temporal differences varied between reef zones. In contrast, there was insufficient statistical evidence that the temporal difference in HERB biomass varied between zones (p = 0.087). For OTH, the interaction was marginal (p = 0.050), and the significant difference detected in the shallow fore reef should therefore be interpreted with caution.
3.3. Temporal Variation in the Abundance and Richness of Functional Groups
At the reef-wide scale, abundance was lower in 2025 for COM, with an estimated reduction of 45% (p = 0.02), and for HERB, with a reduction of 24% (p = 0.04). In contrast, the abundance of OTH did not differ significantly between years. For species richness, COM did not differ significantly between years (model-estimated mean ± SE) 1.0 ± 0.2 species per transect in 2015 and 0.7 ± 0.2 in 2025 (p = 0.2). While HERB and OTH exhibited lower values in 2025. HERB richness declined from 5.7 ± 0.3 to 4.7 ± 0.3, equivalent to approximately one fewer species per transect (p = 0.01), whereas OTH richness declined from 11.7 ± 0.5 to 10.0 ± 0.5 equivalent to approximately 1.7 fewer species per transect (p = 0.01) (Figure 3a).
When evaluating reef zones separately, no significant differences in the abundance of any functional group were detected in the shallow fore reef (Figure 3b). In this zone, only OTH richness was lower in 2025 (11.9 ± 0.7 in 2015 and 9.7 ± 0.6 in 2025), ~ 2.2 fewer species per transect (p = 0.016). In the deep fore reef, abundance of COM and HERB was lower in 2025; the estimated reduction was 77% for COM (p = 0.02) and 38% for HERB (p = 0.01). Regarding species richness, only HERB showed lower values in 2025 (5.9 ± 0.5 in 2015 and 4.3 ± 0.4 in 2025), ~ 1.6 fewer species per transect (p = 0.009) (Figure 3c).
When assessing whether the differences between years varied statistically across reef zones, the Year × Zone interaction was not significant for the abundance of COM (p = 0.11), HERB (p = 0.20), or OTH (p = 0.48), nor for the richness of COM (p = 0.17), HERB (p = 0.17), or OTH (p = 0.33). Therefore, although temporal changes were detected in some functional groups, we cannot conclude that these changes depend on the reef zone.
At the species level, Cephalopholis fulva was the only COM species recorded in 2015 but not detected in 2025, whereas Lutjanus apodus was recorded only in 2025. For HERB, Sparisoma atomarium, Scarus coelestinus, and Scarus vetula were recorded in 2015 but not detected in 2025 (Table S1).
3.4. Differences in the Size Structure of the Functional Groups
COM maintained similar size distributions between 2015 and 2025, with a mean size of 18.6 ± 5.2 cm in 2015 (n = 38) and 20.8 ± 7.9 cm in 2025 (n = 21). In both years, the modal size class was 11–20 cm (Figure 4a), and the maximum recorded size remained in the 31–40 cm class. Permutation tests did not detect significant differences between years at the overall reef scale (p = 1), nor by reef zone: shallow fore reef (p = 0.49) and deep fore reef (p = 1) (Figure 4d).
In contrast, HERB showed significant differences in size distribution across years. The mean size was 12.9 ± 6.8 cm in 2015 (n = 513) and 18.2 ± 7.9 cm in 2025 (n = 407). The most common size class shifted from 5–10 cm in 2015 to 11–20 cm in 2025 (Figure 4b), while the maximum recorded size shifted from the 31–40 cm class to the 41–50 cm class. Permutation tests indicated significant differences between years overall for the reef and in both reef zones (p < 0.001 in all cases). In the shallow fore reef, the 2025 distribution showed a higher proportion of intermediate and large sizes; in the deep fore reef, the density also shifted toward larger size classes (Figure 4d).
OTH also showed significant differences in size distribution between 2015 and 2025 overall and by reef zone (p < 0.001 in all cases). Unlike HERB, these differences were associated with a higher proportion of small sizes in 2025 (Figure 4c). This trend was observed in both reef zones (Figure 4d), with a low proportion of larger individuals within the group.
3.5. Benthic Cover and Coral Community Structure
The benthic community was dominated by brown algae in both years, with coverage of 36.4% ± 3.5% in 2015 and 45% ± 2.4% in 2025. In contrast, stony coral coverage was 10.5% ± 0.9% in 2015 and 5.7% ± 0.5% in 2025. By 2025, sediment and octocorals accounted for 19.5% ± 2.2% and 12.9% ± 0.9% of benthic cover, respectively, while the other benthic functional groups had individual coverages of less than 10% in both periods (Figure 5a).
By reef zone, the shallow fore reef had sediment cover of 10% ± 1.7% in 2015 and 26% ± 2.7% in 2025. In this same zone, stony coral coverage was 10% ± 1.2% in 2015 and 6.4% ± 0.7% in 2025 (Figure 5b). In the deep fore reef, brown algae were the dominant component, with coverage of 52.9% ± 2.2% in 2015 and 56.6% ± 1.5% in 2025; stony coral coverage was 11.2% ± 1.4% and 4.9% ± 0.6%, respectively (Figure 5c).
Regarding stony coral species composition in the FRZ, 36 species were recorded in 2015 and 31 species in 2025. Among the species recorded in 2015, eight were no longer observed during the 2025 surveys: Dendrogyra cylindrus, Favia fragum, Isophyllia rigida, I. sinuosa, Madracis formosa, Manicina areolata, Mycetophyllia aliciae, and Solenastrea bournoni. Whereas three stony coral species: Agaricia lamarcki, Madracis auretenra, and Pseudodiploria clivosa were recorded only during the 2025 surveys (Table S2). On the reef front we recorded 33 species in 2015 and 25 in 2025, while the reef slope had 33 recorded species in 2015 and 29 in 2025. In both times, the dominant species were Agaricia agaricites, Porites astreoides, and Siderastrea siderea.
In 2015, a total of 1,836 stony coral colonies were recorded in the Akumal FRZ fore reef with a mean density of coral colonies of 2.66 ± 0.79 /m², with similar densities between the shallow and deep fore reef (2.74 ± 0.88 and 2.55 ± 0.68, respectively); For 2025, there were 2,228 stony coral colonies recorded, and the density was 3.23 ± 1.02 coral colonies per sq.m. in the fore reef, with 3.6 ± 1.08 cols./m² in the shallow fore reef, and 2.75 ± 0.71 cols./m² in the deep fore reef. The size of coral colonies, within the videotransects was visibly smaller in 2025 than in 2015. Considering life history strategies, the coral community structure was primarily represented by the Weedy and Stress-tolerant categories in both times. In 2015, Weedy colonies had a relative abundance of 62.7% and Stress-tolerant colonies 36.2%. In 2025, Weedy colonies accounted for 52.9%, while Stress-tolerant colonies accounted for 46.3%. Meanwhile, Competitive species had a marginal representation, accounting for just 1.1% in 2015 and 0.9% in 2025. On the reef front zone in 2015, Weedy colonies accounted for 56.8%, Stress-tolerant colonies for 42.6%, and Competitive colonies for 0.6%, while in 2025, Stress-tolerant colonies accounted for 50.1%, Weedy colonies for 48.8%, and Competitive colonies for 1.1%. On the reef slope zone in 2015, Weedy colonies accounted for 71.0%, Stress-tolerant colonies for 27.2%, and Competitive colonies for 1.8%. By 2025, Weedy colonies accounted for 59.8%, Stress-tolerant for 39.7%, and Competitive for 0.5%.
3.6. Relationship Between Fish Biomass and Benthic Structure
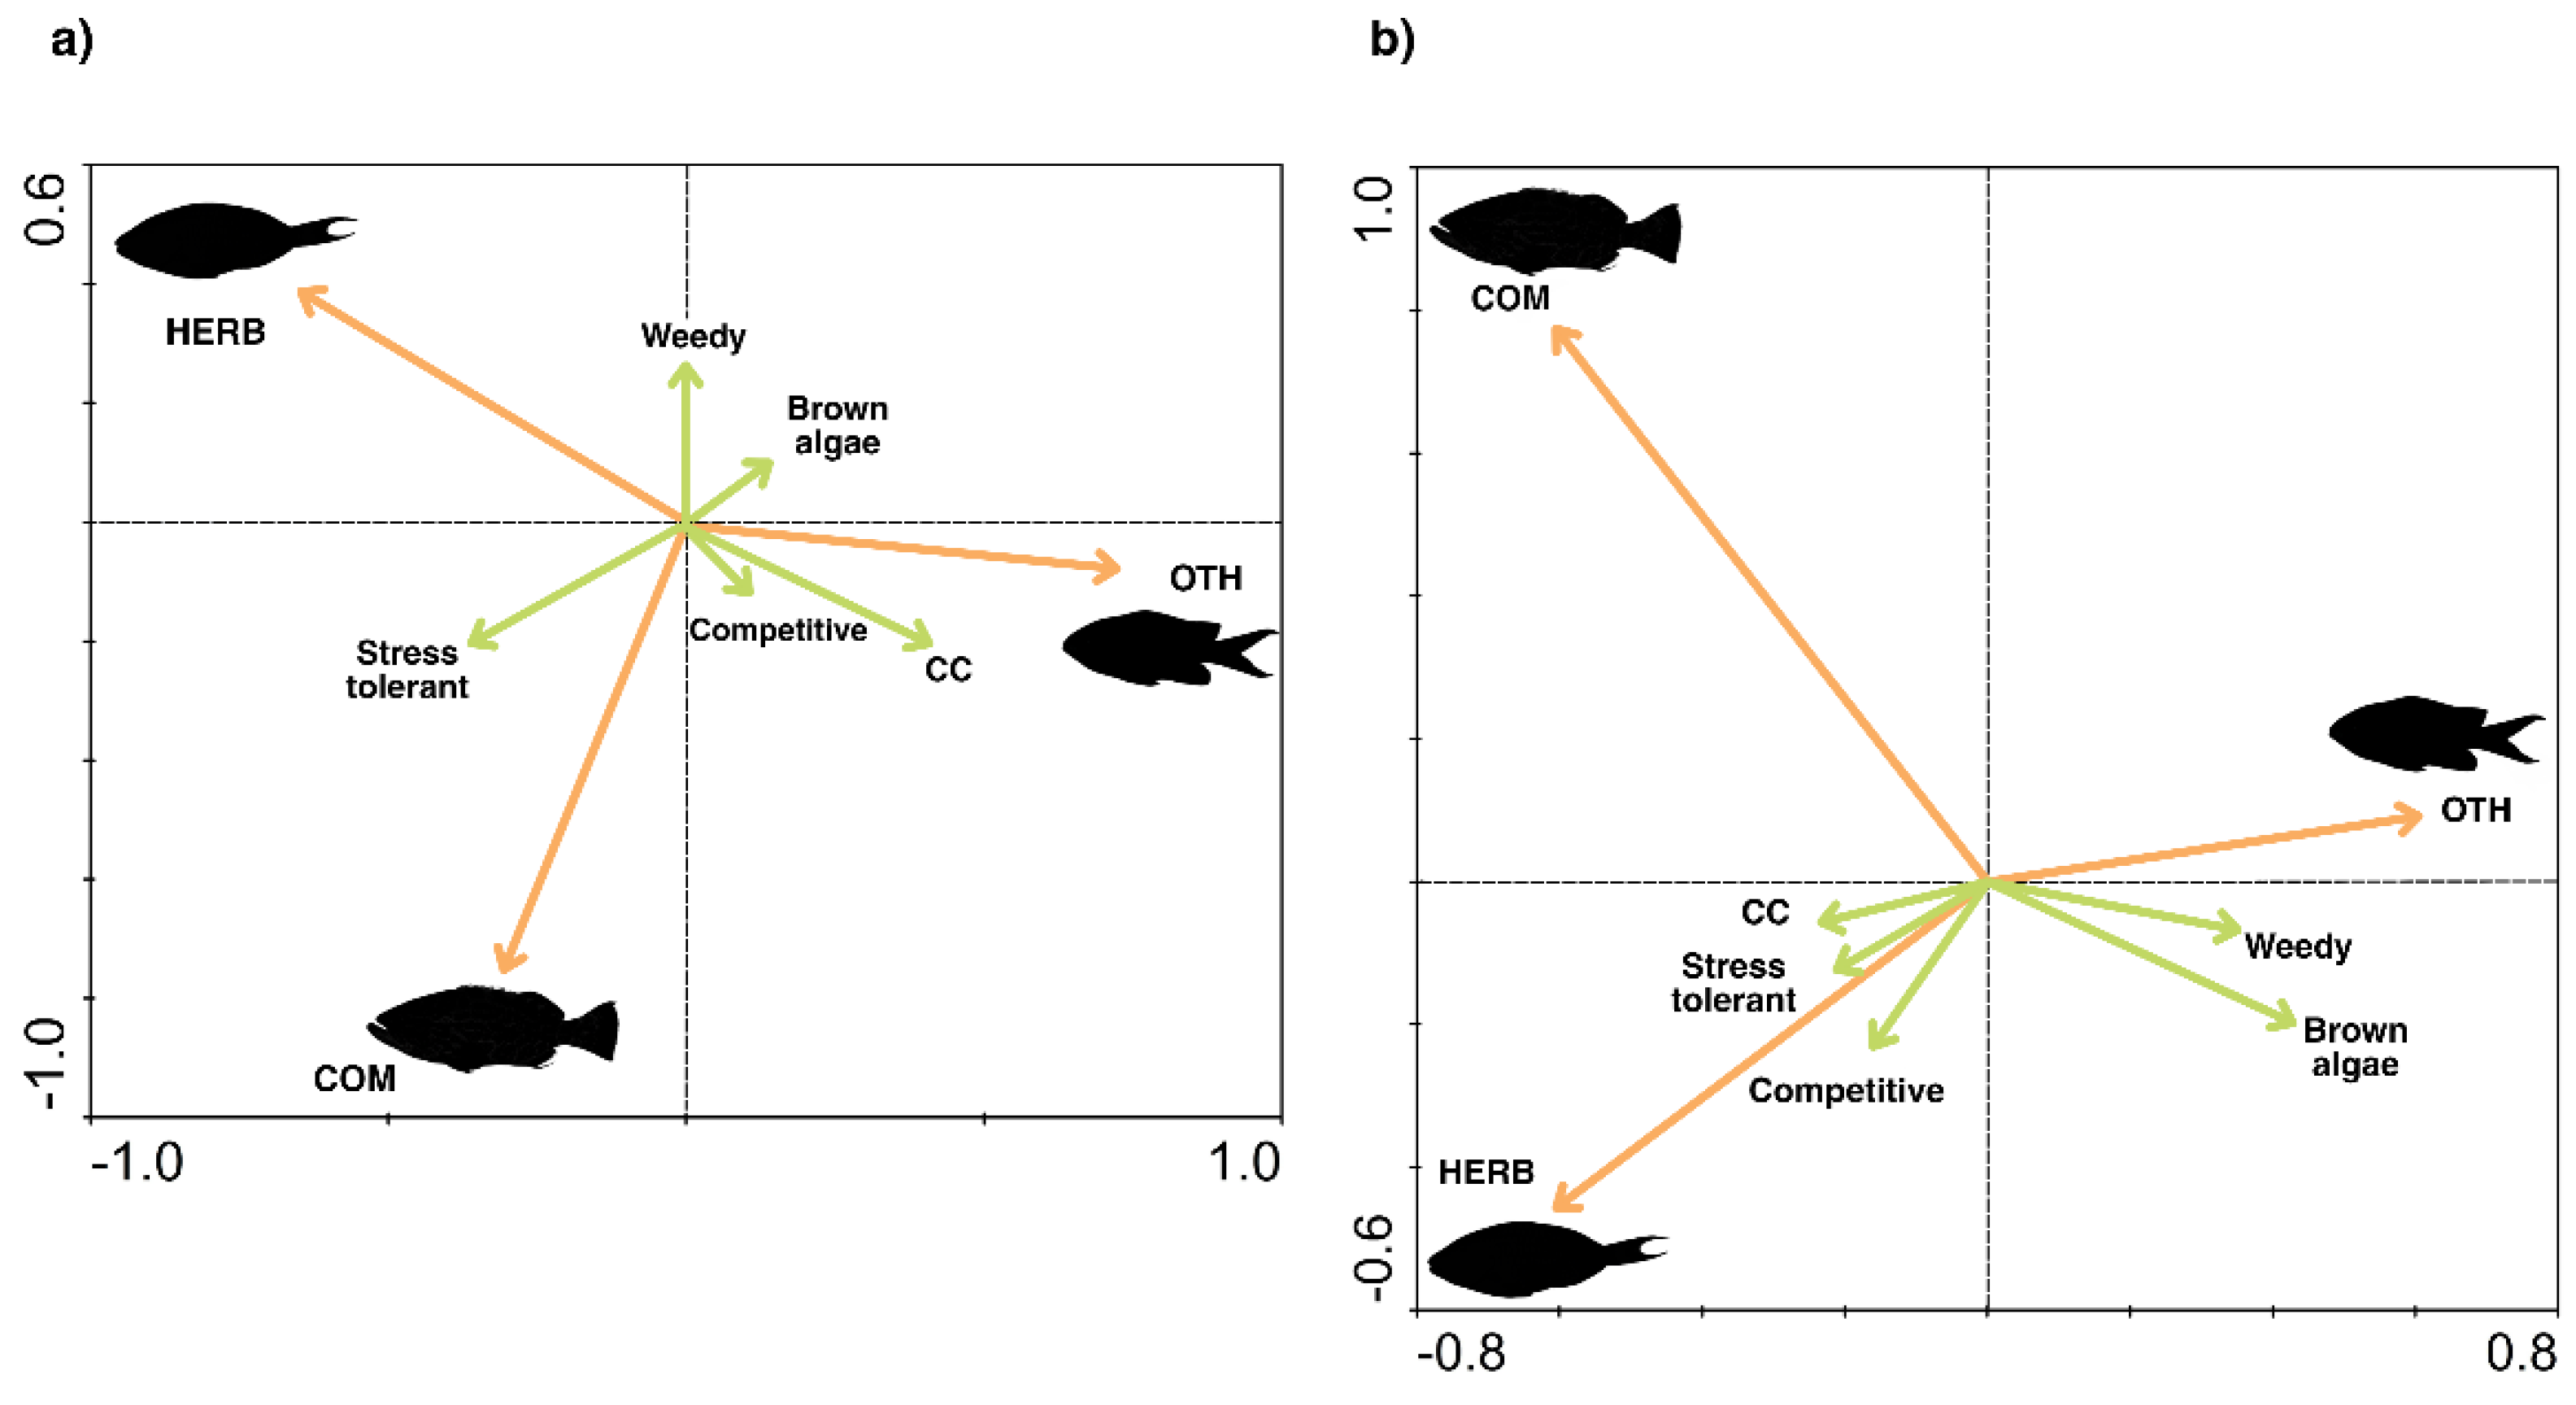
The redundancy analysis showed that environmental variables accounted for a similar proportion of the variation in functional-group biomass in both years. In 2015, the RDA explained 27.2% of the total variation, while in 2025 it explained 28.3%. In both cases, the first two canonical axes accounted for virtually all of the constrained variation, explaining 99.8% in 2015 and 99.4% in 2025.
Ordination patterns revealed a consistent primary gradient, separating sites dominated by brown algae and Weedy coral assemblages from sites characterized by higher coral presence and greater herbivore biomass. However, the benthic attributes associated with this gradient changed markedly through time. The association of hard coral cover with the ordination gradient was weaker in 2025 (Figure 6a) than in 2015 (Figure 6b), and the coral assemblage associated with the more conserved end of the gradient shifted from Competitive corals toward Stress-tolerant taxa. Competitive corals remained weakly associated with fish biomass in both periods, consistent with their low representation following disturbance.
Functional groups also differed in their position along this benthic gradient. HERB maintained its association with the more coral-associated end of the gradient in both years, although in 2025 this relationship was mainly linked to Stress-tolerant rather than Competitive coral assemblages. COM also exhibited a marked reorganization, becoming more distinctly associated with the remaining structurally conserved habitats and increasingly separated from sites characterized by brown algae, Weedy corals and other degraded benthic conditions. In contrast, OTH was more closely aligned with the brown algae–Weedy coral gradient, particularly in 2025 (Figure 6).
4. Discussion
4.1. Fish Community
Total biomass of the fish community was higher in 2025 than in 2015. However, the high variability observed in 2025 suggests that this increase was influenced by sites with particularly high values, rather than by a uniform response across the entire reef. Therefore, it did not necessarily reflect a clear trajectory of sustained recovery of the total fish community. Rather, it suggests a heterogeneous response, consistent with studies in protected areas and degraded reefs where spatial protection can generate positive effects on some components of the assemblage, without necessarily producing a uniform recovery of the entire community [29,33].
When we analyzed the remaining assemblage of reef fishes (OTH), biomass and abundance showed no significant changes between 2015 and 2025. In contrast, species richness declined and size structure shifted significantly toward smaller individuals. This result coincided with the high representation of small individuals of Canthigaster rostrata, a species that represented approximately 45% of all fishes recorded in 2025.
In disturbed reefs, changes in coral cover can alter the composition of the total fish community by reducing the abundance of species dependent on live coral and, in some cases, favoring species associated with the consumption of algae, detritus, or invertebrates [58]. In this regard, total fish-community biomass should be interpreted with caution, as it depends not only on cumulative mass or number of individuals, but also on species richness, species identity, and the relative contribution of larger species or individuals [59,60,61].
4.2. Commercially Important Target Species
Regarding the main conservation objective of the Akumal FRZ, commercially important species showed no clear signs of recovery; the estimated biomass of this group did not differ significantly between 2015 and 2025 and remained below the critical threshold (<390 g·100 m⁻²) proposed for commercial fish in the Mesoamerican Reef System [12]. Also, there was no observed shift toward larger individuals, one of the expected responses in no-take reserves, where reduced fishing pressure typically favors increases in biomass, density, and body size of exploited species [62,63].
However, the lack of recovery in commercially important fishes must be interpreted considering Akumal’s initial conditions, as the FRZ was established when commercial populations were already depleted and several target species were poorly represented [43]. This limitation may have been exacerbated by the loss of structural complexity in the habitat, a key factor in sustaining more abundant, diverse, and functionally complex reef fish communities [8,34]. In this context, the decade elapsed since the FRZ decree should not be interpreted in isolation, as the ecological benefits of protected areas depend on the level of protection and the presence of active management [25], as well as on the degree of compliance, monitoring, the spatial design of the area [33], and surrounding human pressure [64].
COM’s slow response may also be associated with the life history traits of various commercial fish, particularly groupers and snappers. These groups typically include long-lived, relatively slow-growing, late-maturing species and, in some cases, protogynous hermaphrodites—characteristics that increase their vulnerability to fishing and reduce their ability to recover after prolonged periods of exploitation [65,66]. Therefore, spatial protection may be necessary but not sufficient unless accompanied by complementary tools targeting critical life-cycle processes, such as the protection of spawning aggregations, seasonal closures, catch limits, and effective monitoring during key periods [67,68]; these additional factors needing protection and management might fall completely outside of the FRZ geographic limits, and very little is known about spawning aggregations in the north of Quintana Roo.
4.3. Herbivore Fish
In contrast to the response of commercially important fishes, herbivorous fishes showed positive responses, particularly in terms of biomass and body size. Within the Akumal FRZ boundaries, the biomass of herbivore fishes was higher in 2025 than in 2015 and remained above the critical threshold of 990 g·100 m⁻² proposed for the Mesoamerican Reef System [12]. However, this positive response was not accompanied by a widespread increase in abundance or species richness; on the contrary, at the scale of the entire reef system, both the abundance and species richness of this group declined. Therefore, the increase in biomass was primarily explained by a significant shift in size structure toward larger individuals, rather than by an increase in the number of herbivorous fishes or species.
A consistent finding across Caribbean studies is that increases in biomass inside marine reserves are driven primarily by increases in individual body size rather than numerical abundance [69,70]. This pattern reflects the selective removal of large individuals by fishing outside reserves, and their subsequent recovery when fishing ceases—a demographic shift that has functional consequences, because large parrotfishes exert disproportionate grazing and erosive pressure per capita [71,72]. However, not all observed increases in parrotfish biomass can be attributed solely to protection from fishing, particularly after no changes were observed for other groups. An alternative, non-exclusive mechanism is that coral mortality and consequent habitat degradation may indirectly increase herbivorous fishes by expanding the substrate available for algal turf colonization [73,74]. This process occurred extensively throughout the Mexican Caribbean, including Akumal, following the widespread coral mortality caused first by the 2018 outbreak of stony coral tissue loss disease and later by the 2023 marine heatwave [35,37,75]. Under this scenario, the increase in herbivore biomass could reflect a response to changes in food availability associated with habitat degradation, rather than a general improvement in the reef or a direct effect of the refuge. This interpretation is consistent with studies suggesting that some herbivorous fish may be less vulnerable than other functional groups to reef disturbances, especially when benthic primary production increases following coral loss [76].
However, the response of herbivores should not be assumed to be uniform. Previous studies have shown that responses may depend on the functional identity of species, the availability of nursery habitats, connectivity between habitats, and spatial variability in reef structure [77]. For example, Wilson et al. [58] reported contrasting responses among families, with declines in surgeonfish and apparent increases in parrotfish concentrated in a few locations, highlighting the importance of interpreting these changes with caution when high spatial variability is present. In the present study, this variability between sites was also evident; therefore, the increase in biomass in HERB could reflect the response of certain components of the group—particularly individuals or species with a greater contribution to biomass—rather than a uniform recovery of the herbivore community as a whole. Also important, not all herbivores contribute equally to reef ecological processes. Some parrotfish species associated with bioerosion may respond more rapidly to protection in terms of abundance, biomass, and ecological impact, due to their lower vulnerability to fishing and their ability to persist in degraded habitats [71].
4.4. Benthic Habitat as Limiting Factor
The benthic community exhibited conditions consistent with a trajectory of reef degradation that had already been underway since 2015; the FRZ Akumal is characterized by low coral cover, increased brown algae cover, and sediment accumulation. Furthermore, coral richness was lower in 2025, and the assemblage was dominated in both periods by species with Weedy life strategies, while Competitive species made only a marginal contribution. This composition is consistent with widely documented trends in Caribbean reefs, where the loss of builder corals has favored coral assemblages with lower structural complexity and reduced functional capacity [8,34,78].
Long-term monitoring in Akumal indicates that coral cover declined from approximately 35% in the mid-1990s to about 15% in the early 2000s, and to less than 10% after 2010, while algal coverage has remained persistently high at >35% [39]. This condition reflects the interaction between chronic local pressures—such as tourism intensity, coastal development, and nutrient inputs—and recent acute disturbances, including stony corals tissue loss disease and the mass bleaching event of 2023 [10,35,39,79,80,81]. Recent landscape-scale photogrammetric surveys conducted on the Akumal fore reef further illustrate the extent of this degradation by showing that framework-building corals now persist primarily as isolated remnant colonies embedded within an extensive matrix of dead substrate, rather than forming a continuous three-dimensional reef framework (Molina-Hernández et al., -accepted-). This reorganization of the reef landscape likely alters the habitat template experienced by reef fishes by restricting structurally complex refuges to relatively small and isolated patches while expanding low-complexity substrates [8,82,83]. Such habitat configuration provides a plausible mechanism for the contrasting responses observed here, favoring herbivorous fishes that exploit algal-covered substrates while limiting the recovery of commercially important species that depend more strongly on structurally complex habitats. Accordingly, the associations observed in the RDA suggest that the remaining biomass of COM and HERB is still related to remining structural components of the reef. The main example of this is the deep fore reef zone in 2025, dominated by Weedy coral species, which coincidentally registered significantly lower COM species biomass, as well as lower abundance and species richness, suggesting the diminished capacity of this reef zone to sustain COM fish species, usually of larger sizes than OTH and HERB species.
Changes observed during the study period do not appear to represent an isolated disturbance, but rather the continuation of a degradation process previously documented for Akumal. Long term degradation in Akumal’s coral assemblage has been accompanied by higher sedimentation rates, lower topographic complexity, a higher incidence of coral diseases in shallow areas, and elevated nutrient concentrations in the system have been reported [84]. In this sense, habitat condition provides a plausible context for interpreting the limited response of the fish community. Moreover, fisheries protection could benefit certain community components, but its effect may be limited if it is applied to a habitat with low coral cover, high algal dominance, and lower structural complexity, since the effectiveness of marine reserves also depends on the habitat’s capacity to support fish populations and not solely on fishing restrictions [85,86].
4.5. Implications for Management in Degraded Reef Systems
Fisheries Refuge Zones have gained increasing importance as management tools [13]. Although evidence for their ecological effectiveness remain mixed [16], several studies and technical reports have documented positive effects on the biomass and size structure of reef fish, as well as moderate increases in coral cover and reductions in macroalgal cover [17,18,19,20,21,22]. Other studies, however, have documented variable responses or responses that are difficult to attribute directly to spatial protection [29,30]. Our results fall within this second scenario and provide evidence of the limited scope of spatial protection in degraded reefs. Under these conditions, restricting fishing may be insufficient if other local stressors that compromise habitat quality and the system’s resilience are not simultaneously addressed [8,34,35,36,37,40,41].
The available evidence also suggests that FRZs tend to function best when fisheries protection occurs at sites with structurally complex habitats and under favorable conditions of governance, enforcement, and active user involvement in the implementation and monitoring of management tools [13,16,31,32,33]. In Akumal, these conditions were limited; in addition to habitat degradation, previous studies have documented communication problems among stakeholders, low community involvement in decision-making, conflicts of interest, and limited social ownership of the site by its residents [43,87,88]. These challenges were further exacerbated by a lack of institutional continuity as the FRZ decree was not renewed in 2024 and the reef remained without official protection for nearly a year prior to our survey in 2025 [15], as well as lack of strict enforcement of regulations, as some illegal fishing was observed regularly within the FRZ boundaries (Penié-Rodriguez -Pers. Comm.-). This combination of ecological degradation, weak implementation, and discontinuity in management likely reduced the FRZs ability to generate detectable ecological effects. This is consistent with studies warning that the formal designation of marine reserves does not guarantee positive conservation or management outcomes, especially when there are weaknesses in implementation and governance [25,89].
The social implications of these findings also warrant further investigation. Spatial management tools inevitably impose restrictions on resource use, under the expectation that ecological recovery will generate benefits for local communities [62]. However, where the recovery of commercially important species is limited, it remains unclear to what extent these expected social benefits are realized. Evaluating these outcomes through participatory approaches with local stakeholders will be essential to align management expectations with ecological realities and to adapt conservation strategies through community engagement [90,91].
5. Conclusions
Our results suggest that a decade after the FRZ Akumal was established, the reef fish community and benthic habitat did not show a clear recovery. Although total biomass was higher in 2025, this pattern was not accompanied by consistent changes in abundance, species richness, or size structure among the functional groups evaluated. In particular, commercially important species—the primary focus of this management tool—remained in a critical condition and showed no signs of recovery, while the response observed in herbivores should be interpreted with caution, as it may reflect a functional reorganization associated with a differential association of species to sites with better benthic condition and 3D structure, rather than a comprehensive recovery of the reef.
These results contrast with the positive responses reported for many no-take marine reserves and suggest that fisheries protection in the FRZ Akumal did not result in widespread community-level recovery. This limitation appears to be associated not only with persistent habitat deterioration but also with the gap between the formal protection decree and its effective implementation, in a context of low local participation and limited continuity in management, which reinforces the need to rethink conservation -in Akumal and Caribbean-wide-, from a more integral perspective. Fisheries protection remains necessary, but it will hardly be sufficient unless accompanied by effective actions to reduce local pressures and sustain the ecological, social, and institutional conditions that enable the reef’s recovery and functionality.
Supplementary Materials
The following supporting information can be downloaded at the website of this paper posted on Preprints.org, Table S1: Reef fish species and total number of individuals recorded in the Akumal Fishery Refuge Zone in 2015 and 2025; Table S2: Scleractinian coral species, life-history strategies, and total number of colonies recorded in the Akumal Fishery Refuge Zone in 2015 and 2025.
Author Contributions
Conceptualization, A.M.R. and J.R.G.P.; methodology, validation, formal analysis, investigation, data curation, writing—original draft preparation, writing—review and editing, visualization, A.M.R., J.R.G.P. and AMH.; supervision, project administration, funding acquisition, J.R.G.P. All authors have read and agreed to the published version of the manuscript.
Funding
This research and APC was funded by UNAM, DGAPA-PAPIIT Project IN116724.
Institutional Review Board Statement
Not applicable.
Data Availability Statement
Data available at Zenodo, https://doi.org/ 10.5281/zenodo.21386345. Jul 16, 2026.
Conflicts of Interest
The authors declare no conflicts of interest. The funders had no role in the design of the study; in the collection, analyses, or interpretation of data; in the writing of the manuscript; or in the decision to publish the results.
Acknowledgments
A.M.R. acknowledges the support of the Graduate Program in Marine Sciences and Limnology at the Universidad Nacional Autónoma de México (UNAM). This article forms part of the requirements for obtaining a Master of Science degree in Marine Sciences and Limnology in the field of Marine Biology. A.M.R. also acknowledges the Secretaría de Ciencia, Humanidades, Tecnología e Innovación (SECIHTI) for graduate scholarship (No. 2055371).
Abbreviations
The following abbreviations are used in this manuscript:
| FRZ | Fishing Refuge Zones |
| COM | Commercially important species |
| HERB | Herbivorous species |
| OTH | Other reef fish species |
| GLMM | Generalized Linear Mixed Model |
| RDA | Redundancy analysis |
| CC | Stony coral |
References
- Secretaría de Agricultura y Desarrollo Rural. Acuerdo mediante el cual se da a conocer la actualización de la Carta Nacional Pesquera. Diario Oficial de la Federación. 10 March 2025, pp. 8–57. Available online: https://www.dof.gob.mx/nota_detalle.php?codigo=5751372&fecha=10/03/2025.
- McField, M.; Richards Kramer, P. Healthy Reefs for Healthy People: A Guide to Indicators of Reef Health and Social Well-Being in the Mesoamerican Reef Region; Healthy Reefs for Healthy People Initiative: Miami, FL, USA, 2007; p. 208 pp. [Google Scholar]
- Wilkinson, C.; Souter, D. Status of Caribbean Coral Reefs after Bleaching and Hurricanes in 2005; Global Coral Reef Monitoring Network and Reef and Rainforest Research Centre: Townsville, Australia, 2008. [Google Scholar]
- Jackson, J.B.C.; Kirby, M.X.; Berger, W.H.; Bjorndal, K.A.; Botsford, L.W.; Bourque, B.J.; Bradbury, R.H.; Cooke, R.; Erlandson, J.; Estes, J.A.; et al. Historical Overfishing and the Recent Collapse of Coastal Ecosystems. Science 2001, 293, 629–637. [Google Scholar] [CrossRef] [PubMed]
- Mumby, P.J.; Steneck, R.S.; Edwards, A.J.; Ferrari, R.; Coleman, R.; Harborne, A.R.; Gibson, J.P. Fishing down a Caribbean Food Web Relaxes Trophic Cascades. Mar. Ecol. Prog. Ser. 2012, 445, 13–24. [Google Scholar] [CrossRef]
- Roberts, C.M. Effects of Fishing on the Ecosystem Structure of Coral Reefs. Conserv. Biol. 1995, 9, 988–995. [Google Scholar] [CrossRef] [PubMed]
- Zamborain-Mason, J.; Cinner, J.E.; MacNeil, M.A.; Graham, N.A.J.; Hoey, A.S.; Beger, M.; Brooks, A.J.; Booth, D.J.; Edgar, G.J.; Feary, D.A.; et al. Sustainable Reference Points for Multispecies Coral Reef Fisheries. Nat. Commun. 2023, 14, 5368. [Google Scholar] [CrossRef] [PubMed]
- Álvarez-Filip, L.; Paddack, M.J.; Collen, B.; Robertson, D.R.; Côté, I.M. Simplification of Caribbean Reef-Fish Assemblages over Decades of Coral Reef Degradation. PLoS ONE 2015, 10, e0126004. [Google Scholar] [CrossRef] [PubMed]
- Correa, D.; Villegas-Sánchez, C.A.; Pérez-España, H.; Alvarez-Filip, L. Reef Health Status of the Southwestern Gulf of Mexico and Mexican Caribbean Coral Reefs. Cienc. Mar. 2025, 50. [Google Scholar] [CrossRef]
- Rioja-Nieto, R.; Álvarez-Filip, L. Coral Reef Systems of the Mexican Caribbean: Status, Recent Trends and Conservation. Mar. Pollut. Bull. 2019, 140, 615–625. [Google Scholar] [CrossRef] [PubMed]
- Molina-Hernández, A.; González-Barrios, F.J.; Perry, C.T.; Álvarez-Filip, L. Two Decades of Carbonate Budget Change on Shifted Coral Reef Assemblages: Are These Reefs Being Locked into Low Net Budget States? Proc. R. Soc. B Biol. Sci. 2020, 287, 20202305. [Google Scholar] [CrossRef] [PubMed]
- McField, M.; Soto, M.; Martinez, R.; Giró, A.; Guerrero, C.; Rueda, M.; Kramer, P.; Roth, L.; Muñiz, I. 2024 Mesoamerican Reef Report Card; Healthy Reefs Initiative, 2024. [Google Scholar]
- González-Medina, T.; Montaño-Moctezuma, G.; Rodríguez-Cardozo, L.; Torre, J.; Espinoza-Tenorio, A.; Jiménez-García, N. Historical Reconstruction of Fishing Refuge Zones in Mexico: An Innovative Marine Conservation and Sustainable Fisheries Co-Management Tool. Mar. Policy 2025, 172, 106505. [Google Scholar] [CrossRef]
- Cámara de Diputados del H. Congreso de la Unión. Ley General de Pesca y Acuacultura Sustentables. In Diario Oficial de la Federación; 24 July 2007. [Google Scholar]
- Cudney-Bueno, R.; Lara-Mendoza, R.E.; Huerta-Bello, M.Á.; Vázquez-Prada, M.L. Diagnóstico de las Zonas de Refugio Pesquero en México; Instituto Mexicano de Investigación en Pesca y Acuacultura Sustentables: Mexico City, Mexico, 2025. [Google Scholar]
- Villaseñor-Derbez, J.C.; Amador-Castro, I.G.; Hernández-Velasco, A.; Torre, J.; Fulton, S. Two Decades of Community-Based Marine Conservation Provide the Foundations for Future Action. Front. Mar. Sci. 2022, 9, 893104. [Google Scholar] [CrossRef]
- Caamal, J.; Acevedo-Rosas, A.; Marcos, S.; Fulton, S. Evaluación de la Red de Zonas de Refugio Pesquero Punta Herrero, 2012–2017; Comunidad y Biodiversidad A.C.: Guaymas, Sonora, Mexico, 2018. [Google Scholar]
- Caamal, J.; Acevedo-Rosas, A.; Fulton, S.; Marcos, S.; Romero, A. Evaluación de la Zona de Refugio Pesquero Banco Chinchorro, 2012–2017; Comunidad y Biodiversidad A.C.: Guaymas, Sonora, Mexico, 2018. [Google Scholar]
- Fulton, S.; Caamal, J.; Bourillón, L.; García, C. Evaluación de los Refugios Pesqueros de María Elena, 2012–2014; Comunidad y Biodiversidad A.C.: Guaymas, Sonora, Mexico, 2014. [Google Scholar]
- Micheli, F.; Saenz-Arroyo, A.; Greenley, A.; Vazquez, L.; Espinoza-Montes, J.A.; Rossetto, M.; De Leo, G.A. Evidence That Marine Reserves Enhance Resilience to Climatic Impacts. PLoS ONE 2012, 7, e40832. [Google Scholar] [CrossRef] [PubMed]
- Quintana, A.C.E.; Basurto, X. Community-Based Conservation Strategies to End Open Access: The Case of Fish Refuges in Mexico. Conserv. Sci. Pract. 2021, 3, e283. [Google Scholar] [CrossRef]
- Caamal, J.; Acevedo, A. Monitoreo Biológico de Zonas de Refugio Pesquero, Quintana Roo, 2012–2018; Comunidad y Biodiversidad A.C.: Guaymas, Sonora, Mexico, 2019. [Google Scholar]
- Ault, J.S.; Smith, S.G.; Bohnsack, J.A.; Luo, J.; Harper, D.E.; McClellan, D.B. Building Sustainable Fisheries in Florida’s Coral Reef Ecosystem: Positive Signs in the Dry Tortugas. Bull. Mar. Sci. 2006, 78, 633–654. [Google Scholar]
- Ferreira, H.M.; Magris, R.A.; Floeter, S.R.; Ferreira, C.E.L. Drivers of Ecological Effectiveness of Marine Protected Areas: A Meta-Analytic Approach from the Southwestern Atlantic Ocean (Brazil). J. Environ. Manag. 2022, 301, 113889. [Google Scholar] [CrossRef] [PubMed]
- Horta e Costa, B.; de Benito-Abelló, C.; Pike, E.; Turnbull, J.; MacCarthy, J.; Harasta, N.; Fragkopoulou, E.; Roessger, J.; Sullivan-Stack, J.; Grorud-Colvert, K.; et al. Marine Protected Areas Stage of Establishment and Level of Protection Are Good Predictors of Their Conservation Outcomes. Cell Rep. Sustain. 2025, 2, 100345. [Google Scholar] [CrossRef]
- Hughes, T.P.; Kerry, J.T.; Álvarez-Noriega, M.; Álvarez-Romero, J.G.; Anderson, K.D.; Baird, A.H.; Babcock, R.C.; Beger, M.; Bellwood, D.R.; Berkelmans, R.; et al. Global Warming and Recurrent Mass Bleaching of Corals. Nature 2017, 543, 373–377. [Google Scholar] [CrossRef] [PubMed]
- Mumby, P.J.; Steneck, R.S.; Roff, G.; Paul, V.J. Marine Reserves, Fisheries Ban, and 20 Years of Positive Change in a Coral Reef Ecosystem. Conserv. Biol. 2021, 35, 1473–1483. [Google Scholar] [CrossRef] [PubMed]
- Sala, E.; Giakoumi, S. No-Take Marine Reserves Are the Most Effective Protected Areas in the Ocean. ICES J. Mar. Sci. 2018, 75, 1166–1168. [Google Scholar] [CrossRef]
- Rife, A.N.; Aburto-Oropeza, O.; Hastings, P.A.; Erisman, B.; Ballantyne, F.; Wielgus, J.; Sala, E.; Gerber, L. Long-Term Effectiveness of a Multi-Use Marine Protected Area on Reef Fish Assemblages and Fisheries Landings. J. Environ. Manag. 2013, 117, 276–283. [Google Scholar] [CrossRef] [PubMed]
- Villaseñor-Derbez, J.C.; Aceves-Bueno, E.; Fulton, S.; Suarez, A.; Hernández-Velasco, A.; Torre, J.; Micheli, F. An Interdisciplinary Evaluation of Community-Based TURF-Reserves. PLoS ONE 2019, 14, e0221660. [Google Scholar] [CrossRef] [PubMed]
- Graham, N.A.J.; Nash, K.L. The Importance of Structural Complexity in Coral Reef Ecosystems. Coral Reefs 2013, 32, 315–326. [Google Scholar] [CrossRef]
- Pomeroy, R.S.; Watson, L.M.; Parks, J.E.; Cid, G.A. How Is Your MPA Doing? A Methodology for Evaluating the Management Effectiveness of Marine Protected Areas. Ocean Coast. Manag. 2005, 48, 485–502. [Google Scholar] [CrossRef]
- Skinner, C.; Prince, K.R.F.; Polunin, N.V.C.; Mumby, P.J.; Williams, S.M.; Sánchez-Godínez, C.; Dryden, C.S.; Newman, S.P. Evaluating MPA Success for Caribbean Reef Fish: The Role of Design, Habitat, and Management. Coral Reefs 2026, 45, 981–999. [Google Scholar] [CrossRef]
- Álvarez-Filip, L.; Dulvy, N.K.; Gill, J.A.; Côté, I.M.; Watkinson, A.R. Flattening of Caribbean Coral Reefs: Region-Wide Declines in Architectural Complexity. Proc. R. Soc. B Biol. Sci. 2009, 276, 3019–3025. [Google Scholar] [CrossRef] [PubMed]
- Álvarez-Filip, L.; González-Barrios, F.J.; Pérez-Cervantes, E.; Molina-Hernández, A.; Estrada-Saldívar, N. Stony Coral Tissue Loss Disease Decimated Caribbean Coral Populations and Reshaped Reef Functionality. Commun. Biol. 2022, 5, 440. [Google Scholar] [CrossRef] [PubMed]
- Hernández-Terrones, L.M.; Null, K.A.; Ortega-Camacho, D.; Paytan, A. Water Quality Assessment in the Mexican Caribbean: Impacts on the Coastal Ecosystem. Cont. Shelf Res. 2015, 102, 62–72. [Google Scholar] [CrossRef]
- Randazzo-Eisemann, Á.; Garza-Pérez, J.R. The Effects of Coral Assemblage Shift on Reef Functions in Akumal, Mexico. Mar. Ecol. Prog. Ser. 2022, 695, 53–63. [Google Scholar] [CrossRef]
- Randazzo-Eisemann, Á.; Garza-Pérez, J.R.; Figueroa-Zavala, B. The Role of Coral Diseases in the Flattening of a Caribbean Coral Reef over 23 Years. Mar. Pollut. Bull. 2022, 181, 113855. [Google Scholar] [CrossRef] [PubMed]
- Randazzo-Eisemann, Á.; Garza-Pérez, J.R.; Penié-Rodriguez, I.; Figueroa-Zavala, B. 25 Years of Multiple Stressors Driving the Coral-Algae Phase Shift in Akumal, Mexico. Ocean Coast. Manag. 2021, 214, 105917. [Google Scholar] [CrossRef]
- Roy, R.E. Akumal’s Reefs: Stony Coral Communities along the Developing Mexican Caribbean Coastline. Rev. Biol. Trop. 2004, 52, 869–881. [Google Scholar] [PubMed]
- Suchley, A.; Álvarez-Filip, L. Local Human Activities Limit Marine Protection Efficacy on Caribbean Coral Reefs. Conserv. Lett. 2018, 11, e12571. [Google Scholar] [CrossRef]
- Secretaría de Agricultura; Ganadería; Desarrollo Rural; Pesca y Alimentación. Acuerdo por el que se establece una zona de refugio pesquero en aguas marinas de jurisdicción federal ubicadas en la zona de Akumal en el Estado de Quintana Roo. In Diario Oficial de la Federación; 13 April 2015. [Google Scholar]
- Molina-Hernández, A.L.; Garza-Pérez, J.R.; Aranda-Fragoso, A. Identifying Management Challenges and Implementation Shortcomings of a New Fishing Refuge: Akumal Reef, Mexico. Ocean Coast. Manag. 2018, 161, 127–140. [Google Scholar] [CrossRef]
- Aranda-Fragoso, A. Estudio de Factibilidad para la implementación de una Zona de Exclusión Pesquera en Akumal, Quintana Roo. Bachelor’s Thesis, Universidad Nacional Autónoma de México, Mexico City, Mexico, 2016. [Google Scholar]
- Secretaría de Fomento Turístico del Gobierno del Estado de Yucatán. Informe Estadístico: Región Mundo Maya, Ciudades del Interior; Secretaría de Fomento Turístico del Gobierno del Estado de Yucatán: Mérida, Yucatán, Mexico, 2024. [Google Scholar]
- Garza-Pérez, J.R. Información y Manejo para la Protección de la Biodiversidad de la Barrera Arrecifal de México: Evaluación de Variables, Modelación Espacial del Hábitat y SIG. Ph.D. Thesis, Centro de Investigación y de Estudios Avanzados del Instituto Politécnico Nacional, Mérida, Yucatán, Mexico, 2004. [Google Scholar]
- Garza-Pérez, J.R.; Barrón-Coronel, F. Coral Reef Benthos Classification Using Data from a Short-Range Multispectral Sensor. Remote Sens. 2022, 14, 5782. [Google Scholar] [CrossRef]
- Núñez-Lara, E.; Arias-González, J.E. The Relationship between Reef Fish Community Structure and Environmental Variables in the Southern Mexican Caribbean. J. Fish. Biol. 1998, 53, 209–221. [Google Scholar] [CrossRef]
- Froese, R.; Pauly, D. (Eds.) FishBase. World Wide Web electronic publication; 2025; Available online: https://www.fishbase.org.
- Fernández, J.I.; Álvarez-Torres, P.; Arreguín-Sánchez, F.; López-Lemus, L.G.; Ponce, G.; Díaz-de-León, A.; Arcos-Huitrón, E.; del Monte-Luna, P. Coastal fisheries of Mexico. In Coastal Fisheries of Latin America and the Caribbean; FAO Fisheries and Aquaculture Technical Paper No. 544; Salas, S., Chuenpagdee, R., Charles, A., Seijo, J.C., Eds.; Food and Agriculture Organization of the United Nations: Rome, Italy, 2011; pp. 231–284. [Google Scholar]
- Madin, J.S.; Anderson, K.D.; Andreasen, M.H.; Bridge, T.C.L.; Cairns, S.D.; Connolly, S.R.; Darling, E.S.; Diaz, M.; Falster, D.S.; Franklin, E.C.; et al. The Coral Trait Database, a curated database of trait information for coral species from the global oceans. Sci. Data 2016, 3, 160017. [Google Scholar] [CrossRef] [PubMed]
- Darling, E.S.; Álvarez-Filip, L.; Oliver, T.A.; McClanahan, T.R.; Côté, I.M. Evaluating life-history strategies of reef corals from species traits. Ecol. Lett. 2012, 15, 1378–1386. [Google Scholar] [CrossRef] [PubMed]
- Bolker, B.M.; Brooks, M.E.; Clark, C.J.; Geange, S.W.; Poulsen, J.R.; Stevens, M.H.H.; White, J.S.S. Generalized linear mixed models: A practical guide for ecology and evolution. Trends Ecol. Evol. 2009, 24, 127–135. [Google Scholar] [CrossRef] [PubMed]
- Brooks, M.E.; Kristensen, K.; van Benthem, K.J.; Magnusson, A.; Berg, C.W.; Nielsen, A.; Skaug, H.J.; Mächler, M.; Bolker, B.M. glmmTMB balances speed and flexibility among packages for zero-inflated generalized linear mixed modeling. R J. 2017, 9, 378–400. [Google Scholar] [CrossRef]
- Rivera-Velázquez, G.; Salgado-Ugarte, I.; Soto, L.; Naranjo, E. A case study of length frequency distribution analysis of Litopenaeus vannamei (Boone, 1931) using kernel density estimators. Lat. Am. J. Aquat. Res. 2010, 38, 201–209. [Google Scholar] [CrossRef]
- Silverman, B.W. Density Estimation for Statistics and Data Analysis; Chapman and Hall: London, UK, 1986. [Google Scholar]
- Anderson, N.H.; Hall, P.; Titterington, D.M. Two-sample test statistics for measuring discrepancies between two multivariate probability density functions using kernel-based density estimates. J. Multivar. Anal. 1994, 50, 41–54. [Google Scholar] [CrossRef]
- Wilson, S.K.; Graham, N.A.J.; Pratchett, M.S.; Jones, G.P.; Polunin, N.V.C. Multiple disturbances and the global degradation of coral reefs: Are reef fishes at risk or resilient? Glob. Chang. Biol. 2006, 12, 2220–2234. [Google Scholar] [CrossRef]
- Hadj-Hammou, J.; McClanahan, T.R.; Graham, N.A.J. Decadal shifts in traits of reef fish communities in marine reserves. Sci. Rep. 2021, 11, 23470. [Google Scholar] [CrossRef] [PubMed]
- Lefcheck, J.S.; Edgar, G.J.; Stuart-Smith, R.D.; Bates, A.E.; Waldock, C.; Brandl, S.J.; Kininmonth, S.; Ling, S.D.; Duffy, J.E.; Rasher, D.B.; et al. Species richness and identity both determine the biomass of global reef fish communities. Nat. Commun. 2021, 12, 6875. [Google Scholar] [CrossRef] [PubMed]
- Noble, M.M.; van Laake, G.; Berumen, M.L.; Fulton, C.J. Community change within a Caribbean coral reef marine protected area following two decades of local management. PLoS ONE 2013, 8, e54069. [Google Scholar] [CrossRef] [PubMed]
- Aburto-Oropeza, O.; Erisman, B.; Galland, G.R.; Mascareñas-Osorio, I.; Sala, E.; Ezcurra, E. Large recovery of fish biomass in a no-take marine reserve. PLoS ONE 2011, 6, e23601. [Google Scholar] [CrossRef] [PubMed]
- Lester, S.E.; Halpern, B.S.; Grorud-Colvert, K.; Lubchenco, J.; Ruttenberg, B.I.; Gaines, S.D.; Airamé, S.; Warner, R.R. Biological effects within no-take marine reserves: A global synthesis. Mar. Ecol. Prog. Ser. 2009, 384, 33–46. [Google Scholar] [CrossRef]
- Cinner, J.E.; Maire, E.; Huchery, C.; MacNeil, M.A.; Graham, N.A.J.; Mora, C.; McClanahan, T.R.; Barnes, M.L.; Kittinger, J.N.; Hicks, C.C.; et al. Gravity of human impacts mediates coral reef conservation gains. Proc. Natl. Acad. Sci. USA 2018, 115, E6116–E6125. [Google Scholar] [CrossRef] [PubMed]
- Brulé, T.; Colas-Marrufo, T.; Pérez-Díaz, E.; Déniel, C. Biology, exploitation and management of groupers (Serranidae, Epinephelinae, Epinephelini) and snappers (Lutjanidae, Lutjaninae, Lutjanus) in the Gulf of Mexico. In Environmental Analysis of the Gulf of Mexico; Withers, K., Nipper, M., Eds.; Harte Research Institute for Gulf of Mexico Studies: Corpus Christi, TX, USA, 2008; Volume Special Publication Series No. 1, pp. 137–179. [Google Scholar]
- Coleman, F.C.; Koenig, C.C.; Huntsman, G.R.; Musick, J.A.; Eklund, A.M.; McGovern, J.C.; Sedberry, G.R.; Chapman, R.W.; Grimes, C.B. Long-lived reef fishes: The grouper-snapper complex. Fisheries 2000, 25, 14–21. [Google Scholar] [CrossRef]
- Fennessy, S.T.; Linardich, C.; Rhodes, K.; Barreiros, J.P.; Pollard, D.; Sosa-Cordero, E.; Coleman, F.; Aguilar-Perera, A.; Malinowski, C.R.; Brulé, T.; et al. Does fishery management for groupers (Teleostei: Epinephelidae) protect them effectively? Context from the IUCN’s Red List of Threatened Species. Ocean Coast. Manag. 2026, 273, 108065. [Google Scholar] [CrossRef]
- Grüss, A.; Robinson, J.; Heppell, S.S.; Heppell, S.A.; Semmens, B.X. Conservation and fisheries effects of spawning aggregation marine protected areas: What we know, where we should go, and what we need to get there. ICES J. Mar. Sci. 2014, 71, 1515–1534. [Google Scholar] [CrossRef]
- Vallès, H.; Oxenford, H.A. Parrotfish size: A simple yet useful alternative indicator of fishing effects on Caribbean reefs? PLoS ONE 2014, 9, e86291. [Google Scholar] [CrossRef] [PubMed]
- Hawkins, J.P.; Roberts, C.M. Effects of fishing on sex-changing Caribbean parrotfishes. Biol. Conserv. 2004, 115, 213–226. [Google Scholar] [CrossRef]
- Molina-Hernández, A.; Álvarez-Filip, L. Incorporating parrotfish bioerosion into the herbivory paradigm of coral reef resilience. Conserv. Lett. 2024, 17, e13058. [Google Scholar] [CrossRef]
- Randazzo-Eisemann, Á.; Molina-Hernández, A.L.; Alvarez-Filip, L.; Garza-Pérez, J.R. Strong linkage between parrotfish functions and habitat characteristics. PLoS ONE 2024, 19, e0315179. [Google Scholar] [CrossRef] [PubMed]
- Lindahl, U.; Öhman, M.C.; Schelten, C.K. The 1997/1998 mass mortality of corals: Effects on fish communities on a Tanzanian coral reef. Mar. Pollut. Bull. 2001, 42, 127–131. [Google Scholar] [CrossRef] [PubMed]
- Molina-Hernández, A.; Medellín-Maldonado, F.; Lange, I.D.; Perry, C.T.; Álvarez-Filip, L. Coral reef erosion: In situ measurement on different dead coral substrates on a Caribbean reef. Limnol. Oceanogr. 2022, 67, 2734–2749. [Google Scholar] [CrossRef]
- Álvarez-Filip, L.; Perry, C.T.; Pérez-Cervantes, E.; Molina-Hernández, A.; de Bakker, D.M.; Webb, A.E.; Rioja-Nieto, R.; Medina-Valmaseda, A. Disease and bleaching drive divergent net carbonate production across Caribbean reef systems. Curr. Biol. 2026, 36, 2688–2695.e2. [Google Scholar] [CrossRef] [PubMed]
- Graham, N.A.J.; Chabanet, P.; Evans, R.D.; Jennings, S.; Letourneur, Y.; MacNeil, M.A.; McClanahan, T.R.; Öhman, M.C.; Polunin, N.V.C.; Wilson, S.K. Extinction vulnerability of coral reef fishes. Ecol. Lett. 2011, 14, 341–348. [Google Scholar] [CrossRef] [PubMed]
- Adam, T.C.; Schmitt, R.J.; Holbrook, S.J.; Brooks, A.J.; Edmunds, P.J.; Carpenter, R.C.; Bernardi, G. Herbivory, connectivity, and ecosystem resilience: Response of a coral reef to a large-scale perturbation. PLoS ONE 2011, 6, e23717. [Google Scholar] [CrossRef] [PubMed]
- Toth, L.T.; Stathakopoulos, A.; Kuffner, I.B.; Ruzicka, R.R.; Colella, M.A.; Shinn, E.A. The unprecedented loss of Florida’s reef-building corals and the emergence of a novel coral-reef assemblage. Ecology 2019, 100, e02781. [Google Scholar] [CrossRef] [PubMed]
- Camacho-Cruz, K.; Rey-Villiers, N.; Ortiz-Hernández, M.C.; González-Jones, P.; Galán-Caamal, R.D.J.; Matus-Hernández, M.; Sánchez, A. Changes in the enrichment of dissolved inorganic nutrients in the coastal waters of the Mexican Caribbean, influenced by submarine groundwater discharges 2016–2019. Mar. Pollut. Bull. 2022, 185, 114308. [Google Scholar] [CrossRef] [PubMed]
- Gil, M.A.; Renfro, B.; Figueroa-Zavala, B.; Penié, I.; Dunton, K.H. Rapid tourism growth and declining coral reefs in Akumal, Mexico. Mar. Biol. 2015, 162, 2225–2233. [Google Scholar] [CrossRef]
- Mutchler, T.; Dunton, K.H.; Townsend-Small, A.; Fredriksen, S.; Rasser, M.K. Isotopic and elemental indicators of nutrient sources and status of coastal habitats in the Caribbean Sea, Yucatan Peninsula, Mexico. Estuar. Coast. Shelf Sci. 2007, 74, 449–457. [Google Scholar] [CrossRef]
- Molina-Hernández, A.; Garza-Pérez, R.; Estrada-Saldívar, N. Full-spur mapping: Refining coral reef carbonate production estimates using underwater photogrammetry. R. Soc. Open Sci. 2026. [Google Scholar] [CrossRef]
- Agudo-Adriani, E.A.; Cappelletto, J.; Cavada-Blanco, F.; Cróquer, A. Structural complexity and benthic cover explain reef-scale variability of fish assemblages in Los Roques National Park, Venezuela. Front. Mar. Sci. 2019, 6, 690. [Google Scholar] [CrossRef]
- McCormick, M.I.; Moore, J.A.Y.; Munday, P.L. Influence of habitat degradation on fish replenishment. Coral Reefs 2010, 29, 537–546. [Google Scholar] [CrossRef]
- Naranjo García, M.J. Patrones de sedimentación y calidad del agua relacionados con indicadores de degradación arrecifal en Akumal, Q. Roo. M.Sc. Thesis, Universidad Nacional Autónoma de México, Sisal, Yucatán, Mexico, 2015. [Google Scholar]
- Coker, D.J.; Wilson, S.K.; Pratchett, M.S. Importance of live coral habitat for reef fishes. Rev. Fish. Biol. Fish. 2014, 24, 89–126. [Google Scholar] [CrossRef]
- Olson, J.C.; Appeldoorn, R.S.; Schärer-Umpierre, M.T.; Cruz-Motta, J.J. Recovery when you are on your own: Slow population responses in an isolated marine reserve. PLoS ONE 2019, 14, e0223102. [Google Scholar] [CrossRef] [PubMed]
- Mata-Lara, M.; Garza-Pérez, J.R.; Salles Afonso de Almeida, P. Camino a la resiliencia: Monitoreo socioeconómico de Akumal, Q. Roo; Technical Report; Laboratorio Nacional de Resiliencia Costera (LANRESC): Yucatán, Mexico, 2016; p. 84 pp. [Google Scholar]
- Reyes Jaime, D. Análisis de las herramientas de manejo implementadas en el arrecife de Akumal Q. Roo desde una perspectiva socio-ambiental. M.Sc. Thesis, Universidad Nacional Autónoma de México, Mexico City, Mexico, 2024. [Google Scholar]
- Penié-Rodríguez, I. Personal communication, 2021.
- Relano, V.; Pauly, D. The “Paper Park Index”: Evaluating marine protected area effectiveness through a global study of stakeholder perceptions. Mar. Policy 2023, 151, 105571. [Google Scholar] [CrossRef]
- Bennett, N.J. Using perceptions as evidence to improve conservation and environmental management. Conserv. Biol. 2016, 30, 582–592. [Google Scholar] [CrossRef] [PubMed]
- Mascia, M.B.; Claus, C.A.; Naidoo, R. Impacts of marine protected areas on fishing communities. Conserv. Biol. 2010, 24, 1424–1429. [Google Scholar] [CrossRef] [PubMed]
Figure 1.
Polygon of the Akumal Fishery Refuge Zone (FRZ), and sampling sites distributed in the shallow fore reef (~10 m deep, green circles) and deep fore reef (~20 m deep, orange circles).
Figure 1.
Polygon of the Akumal Fishery Refuge Zone (FRZ), and sampling sites distributed in the shallow fore reef (~10 m deep, green circles) and deep fore reef (~20 m deep, orange circles).
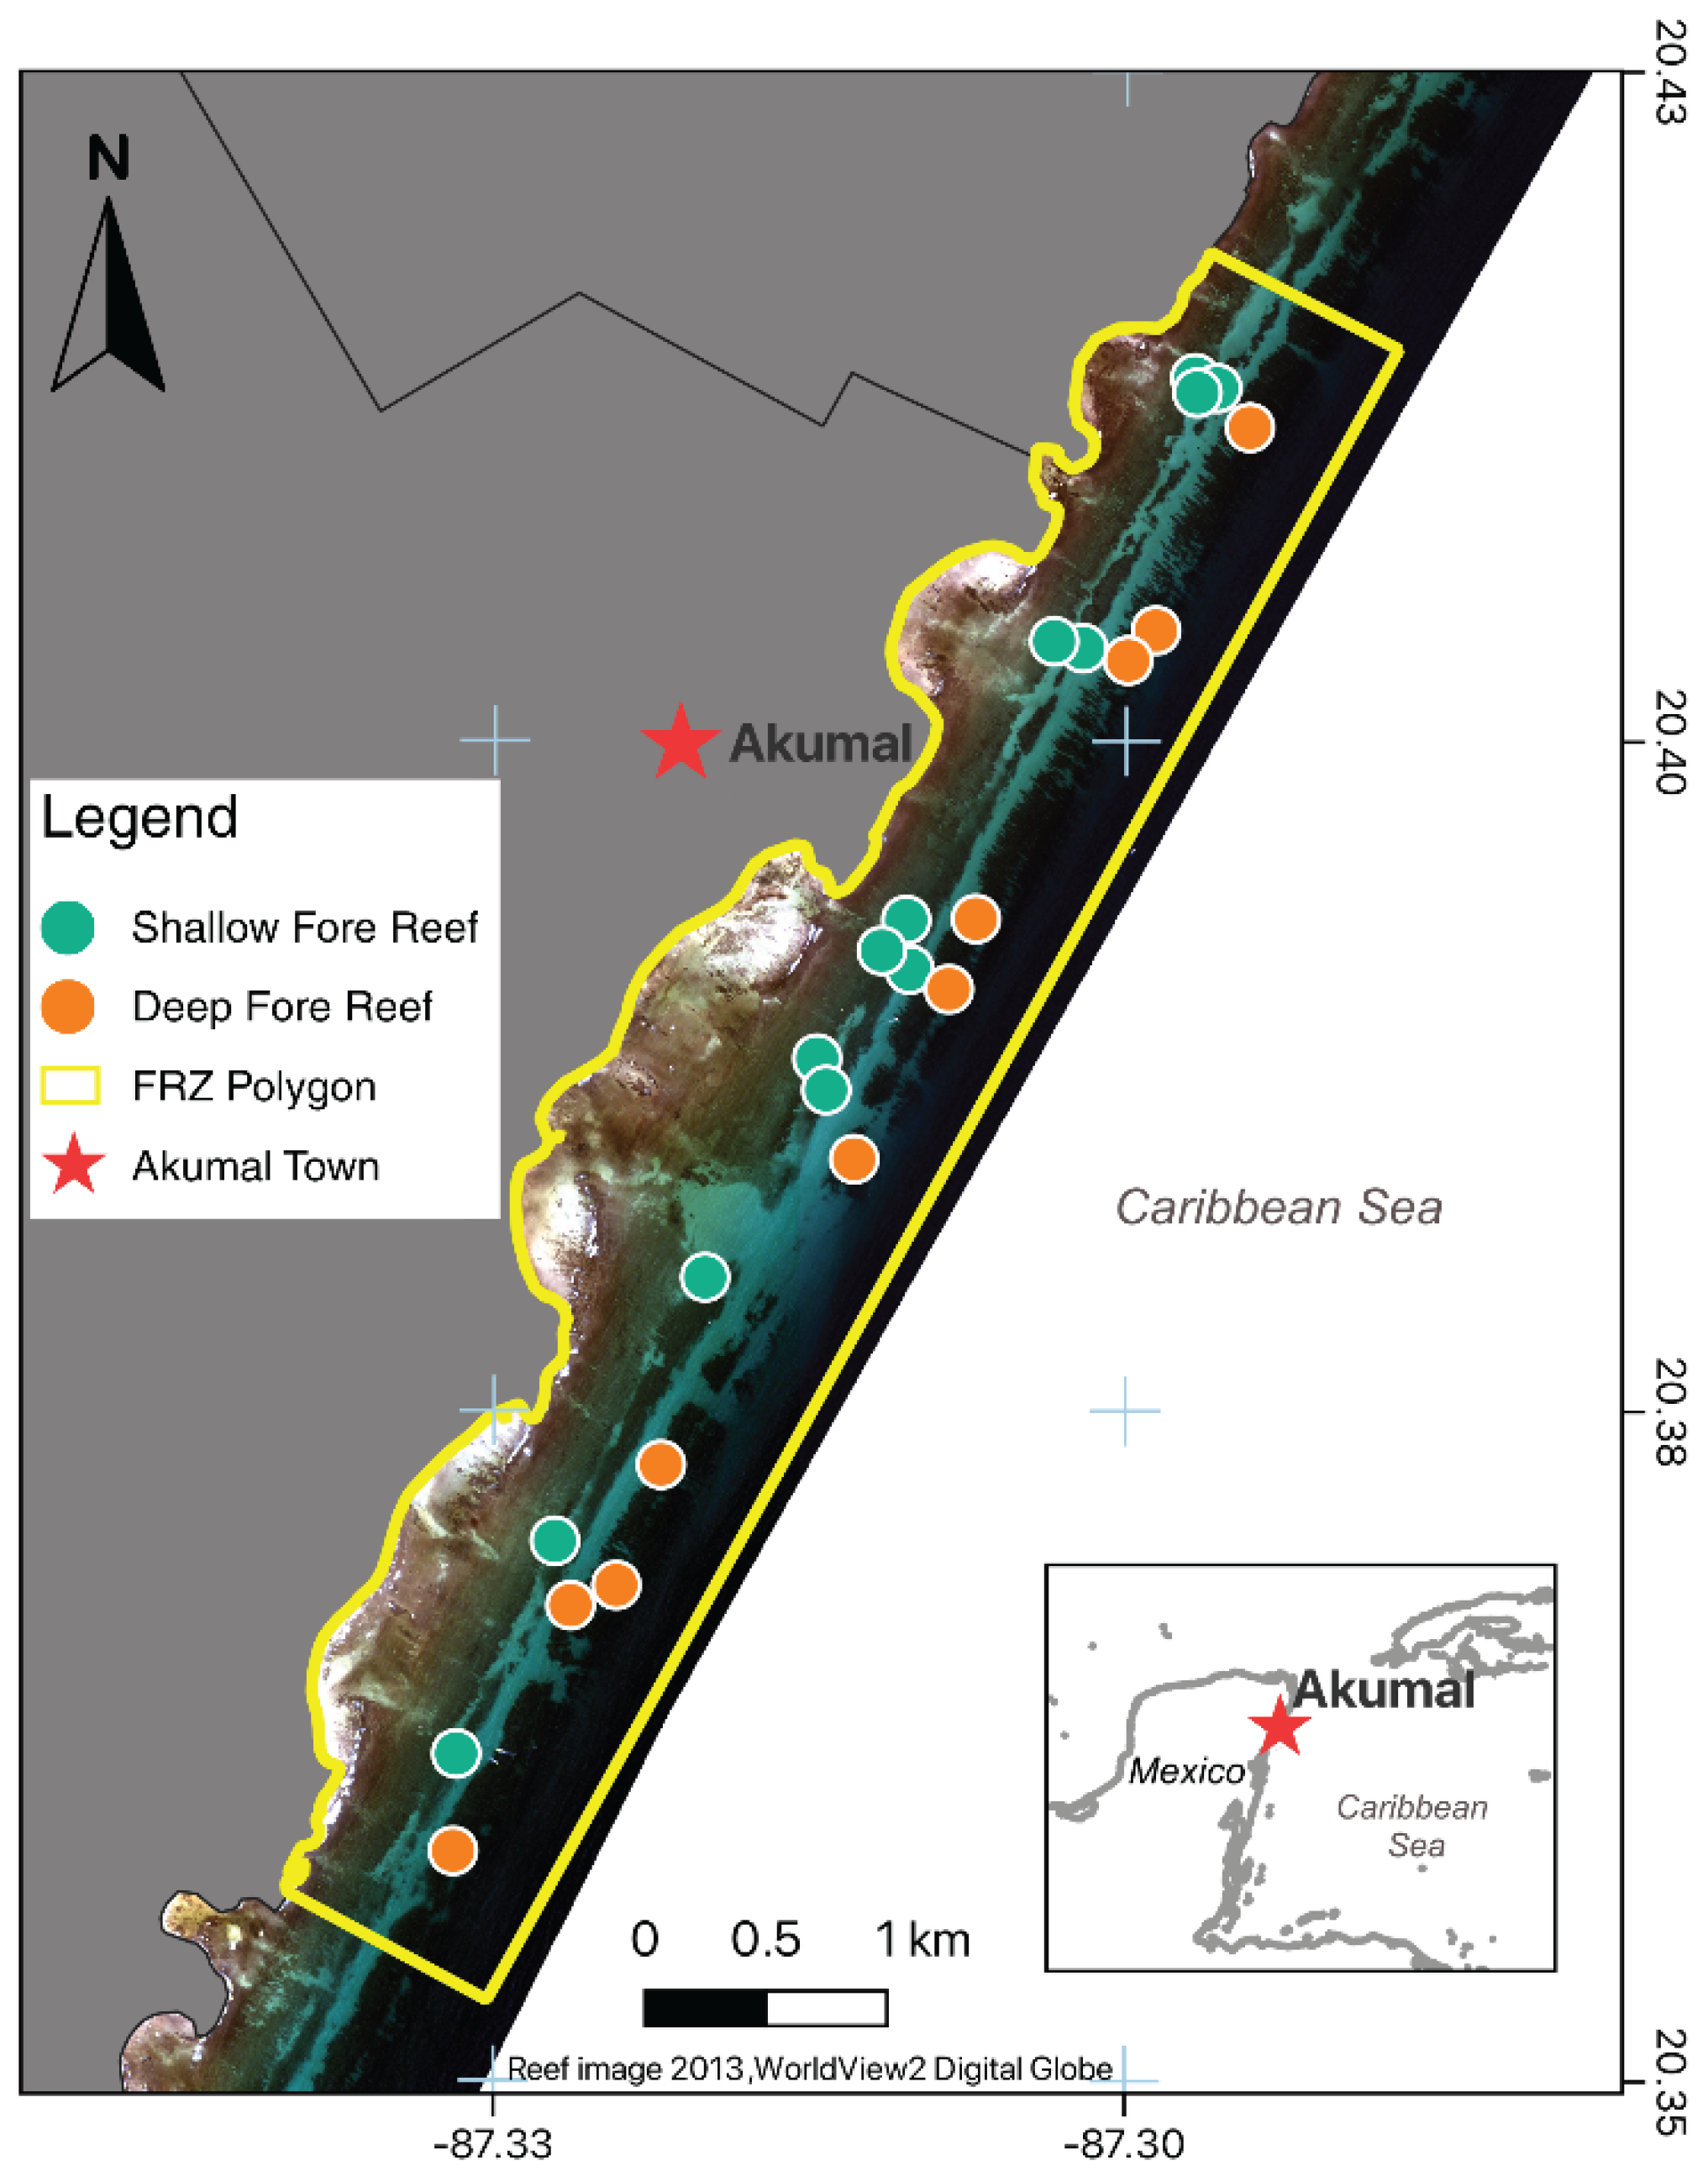
Figure 2.
Estimated biomass of reef fish groups in 2015 and 2025. The GLMM-estimated means ± 95% CI are shown for (a) the reef-wide scale, (b) the shallow fore reef, and (c) the deep fore reef. Red dashed lines indicate the Healthy Reefs critical biomass cutoffs for herbivorous fishes (990 g·100 m⁻²) and commercially important fishes (390 g·100 m⁻²) [12]. Exact p-values are shown; * and ** indicate p ≤ 0.05 and p ≤ 0.01, respectively.
Figure 2.
Estimated biomass of reef fish groups in 2015 and 2025. The GLMM-estimated means ± 95% CI are shown for (a) the reef-wide scale, (b) the shallow fore reef, and (c) the deep fore reef. Red dashed lines indicate the Healthy Reefs critical biomass cutoffs for herbivorous fishes (990 g·100 m⁻²) and commercially important fishes (390 g·100 m⁻²) [12]. Exact p-values are shown; * and ** indicate p ≤ 0.05 and p ≤ 0.01, respectively.
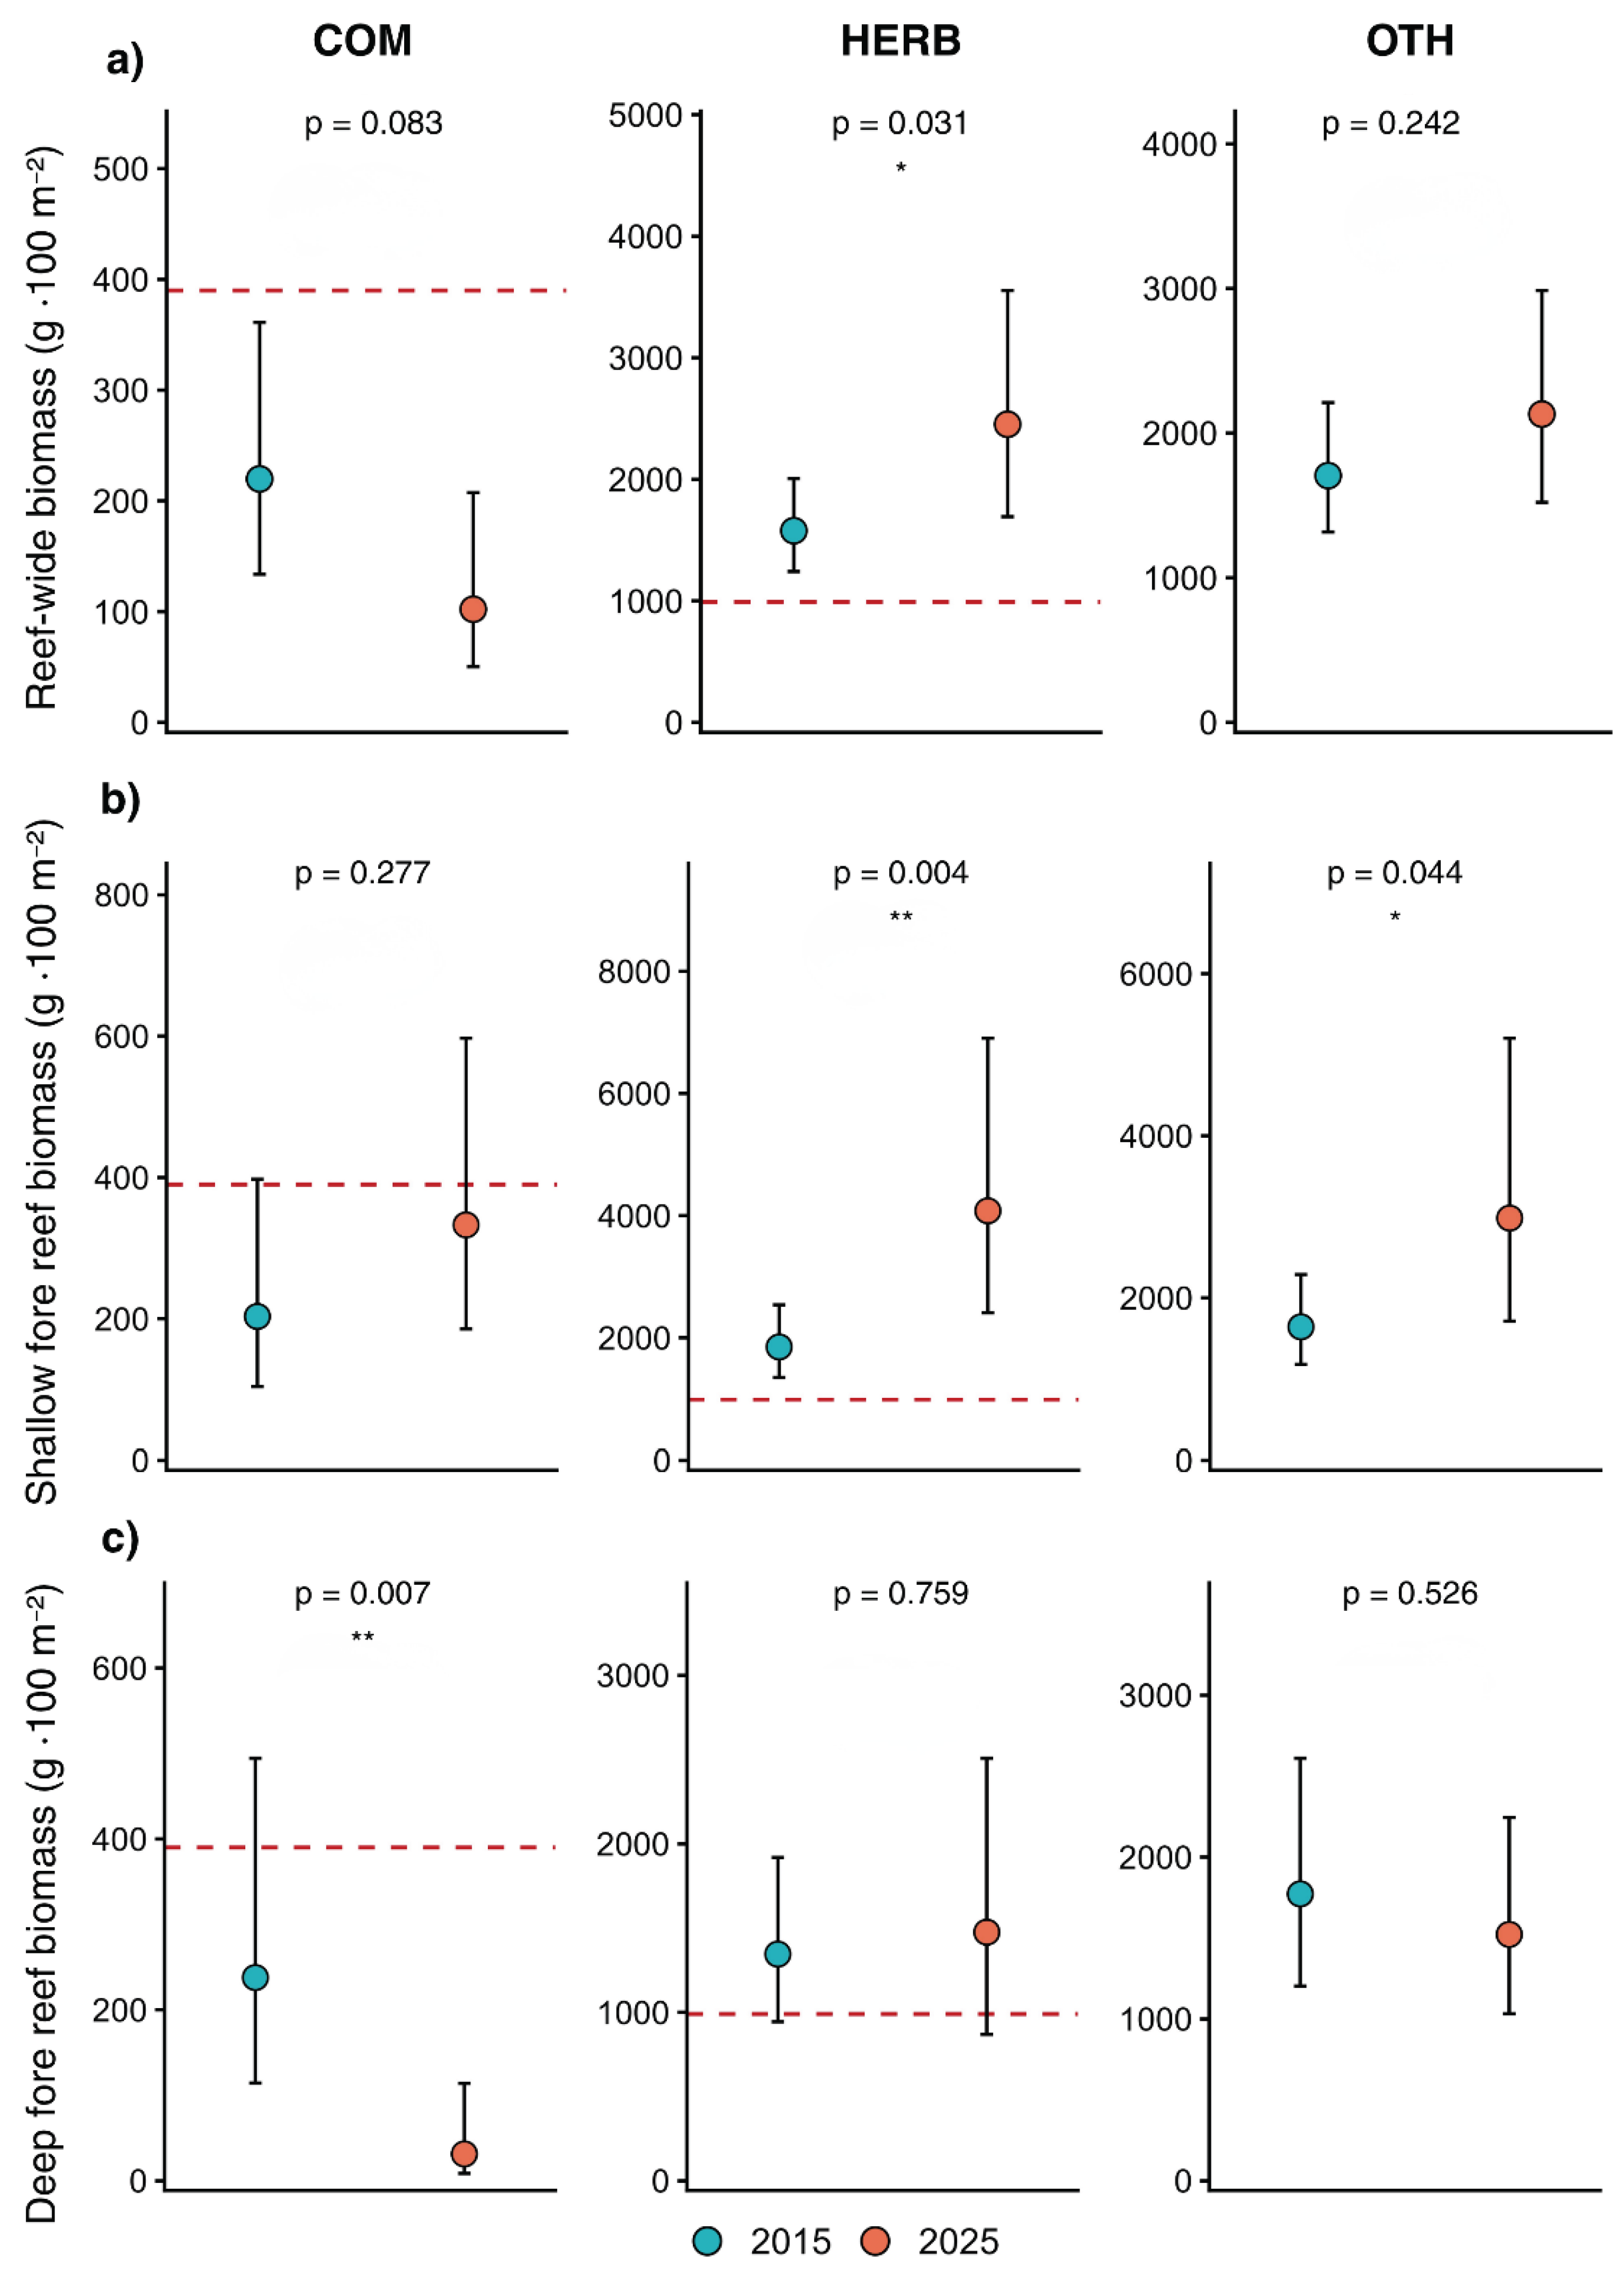
Figure 3.
Estimated temporal changes in the abundance and richness of reef fish between 2015 and 2025. The figure shows the effect sizes estimated by GLMM, expressed as lnRR = ln (2025/2015), for (a) the reef system as a whole, (b) the shallow fore reef, and (c) the deep fore reef. The points represent the estimated lnRR, and the horizontal lines represent the 95% confidence intervals; the red dashed line indicates no temporal change. Negative values indicate lower values in 2025 compared to 2015. Purple = significant change (p < 0.05); gray = non-significant change (p ≥ 0.05).
Figure 3.
Estimated temporal changes in the abundance and richness of reef fish between 2015 and 2025. The figure shows the effect sizes estimated by GLMM, expressed as lnRR = ln (2025/2015), for (a) the reef system as a whole, (b) the shallow fore reef, and (c) the deep fore reef. The points represent the estimated lnRR, and the horizontal lines represent the 95% confidence intervals; the red dashed line indicates no temporal change. Negative values indicate lower values in 2025 compared to 2015. Purple = significant change (p < 0.05); gray = non-significant change (p ≥ 0.05).
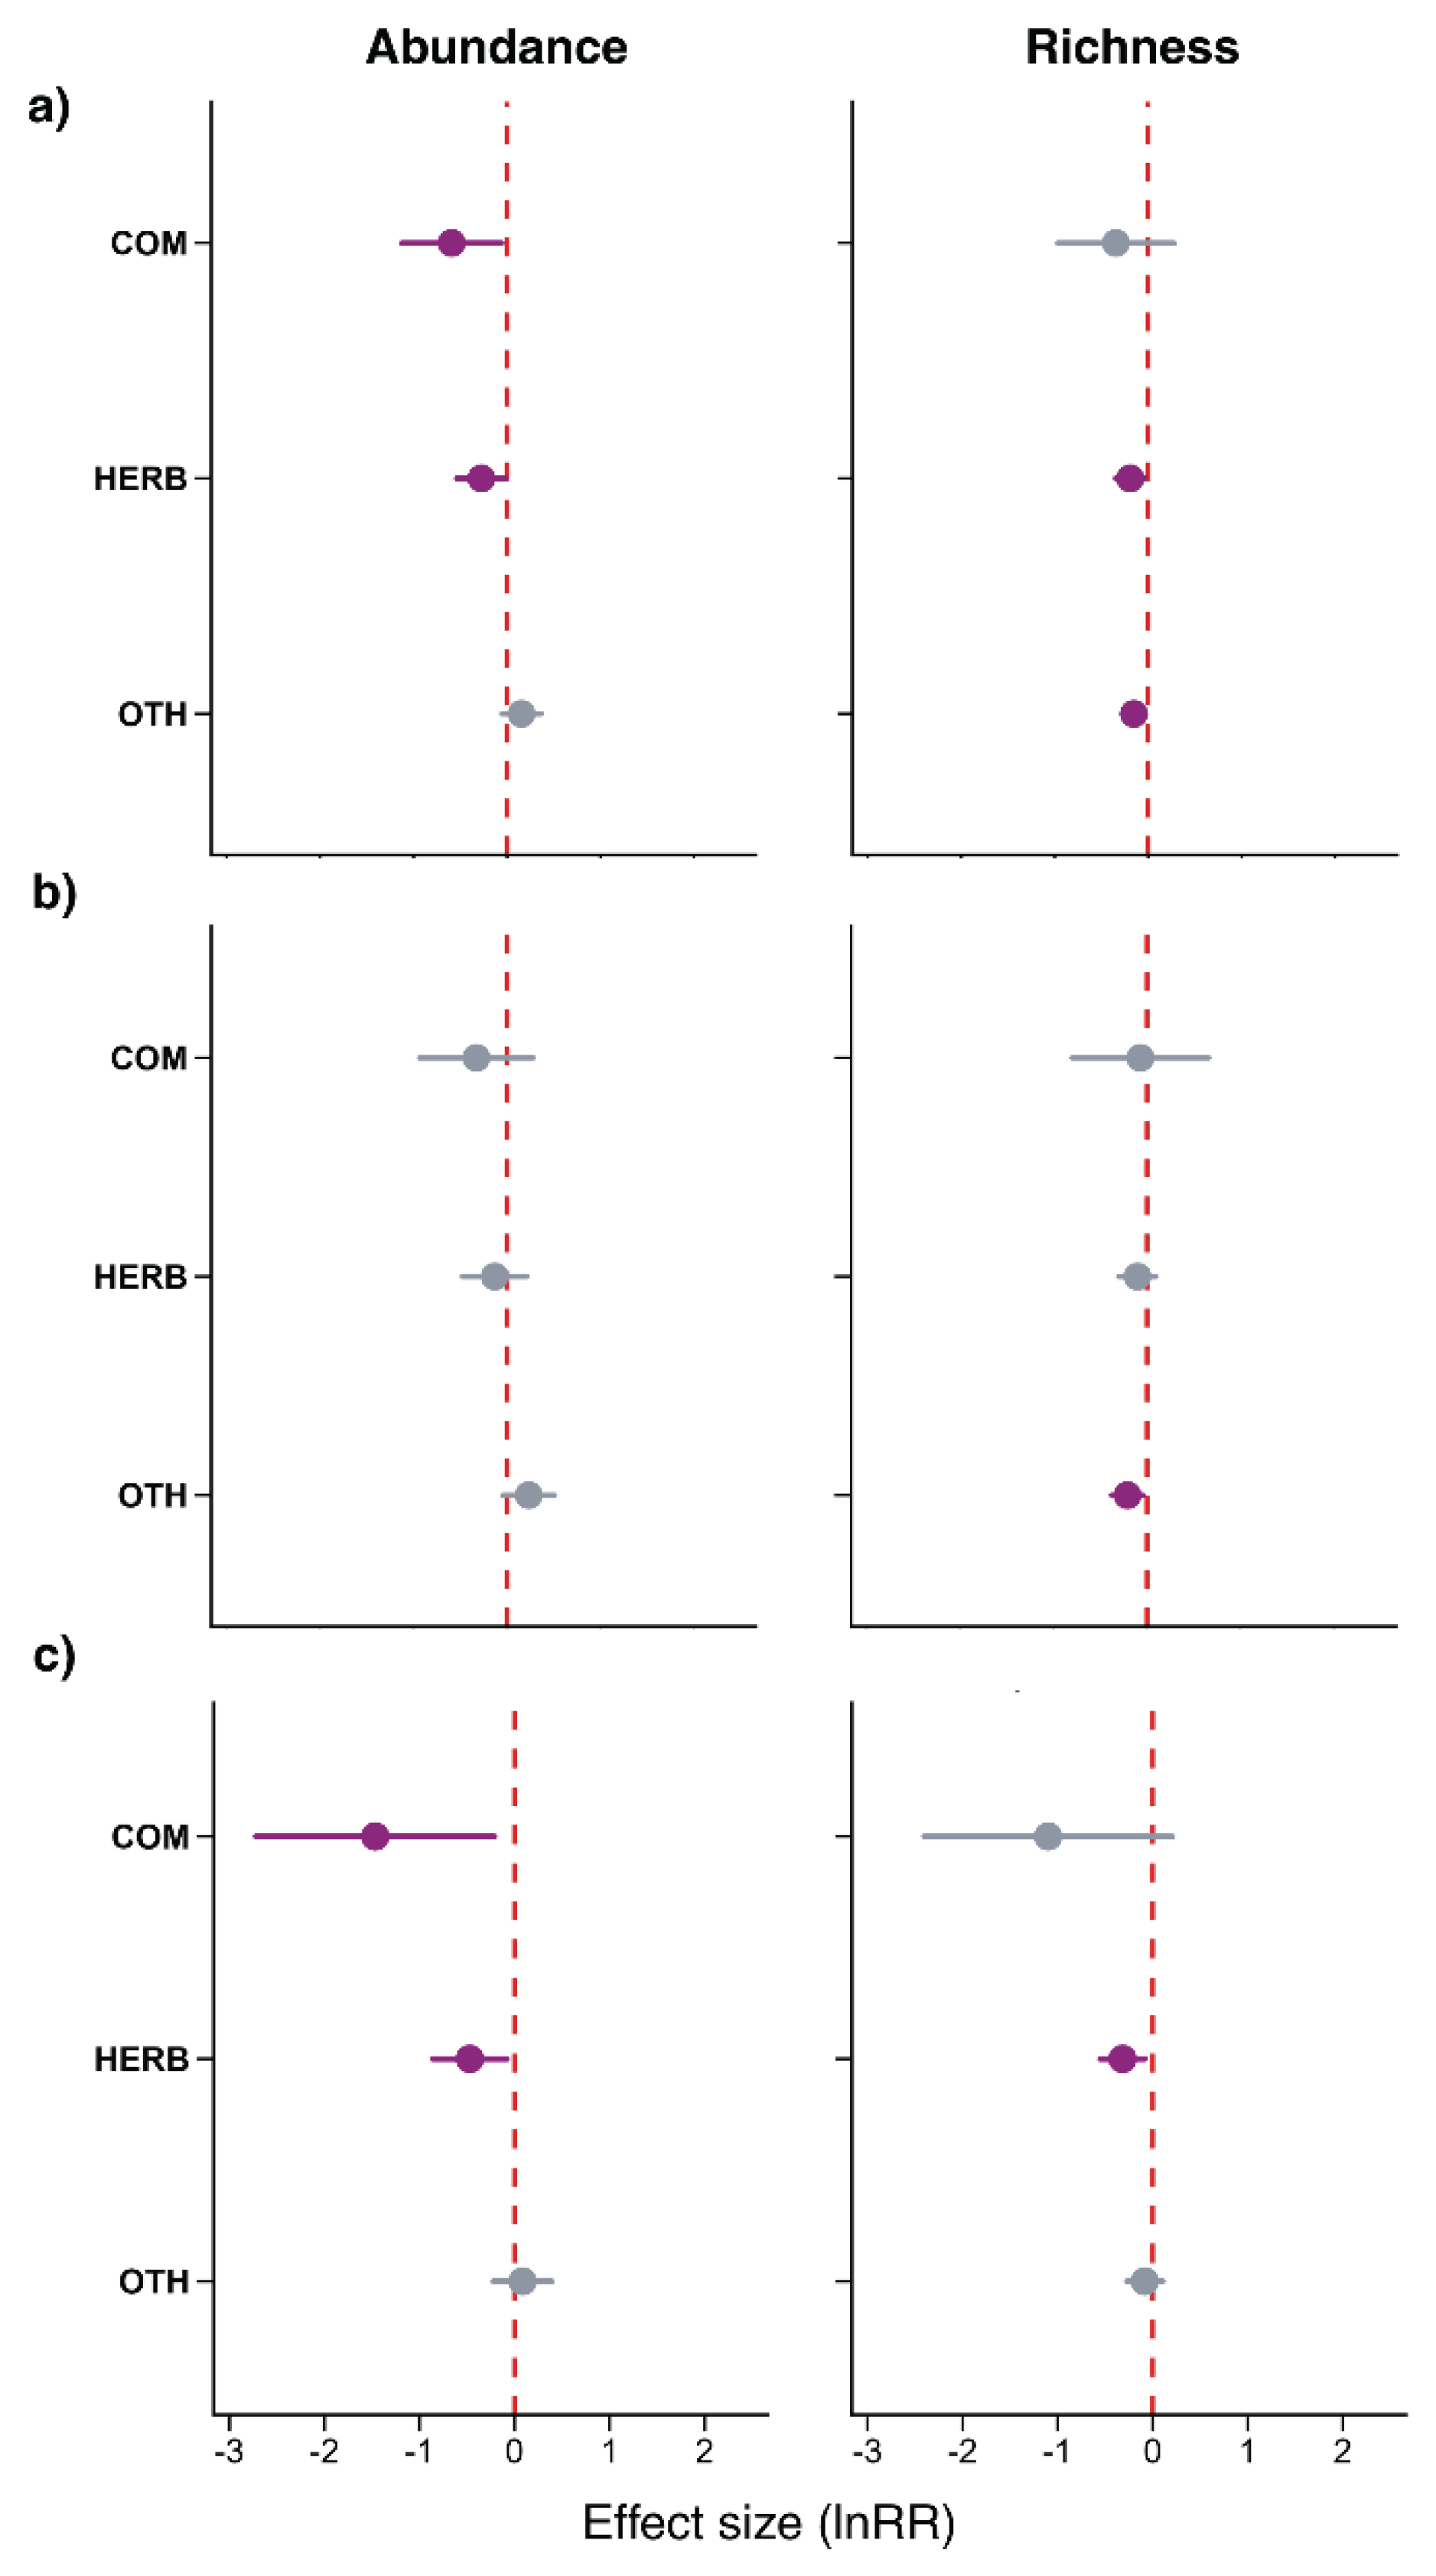
Figure 4.
Size distribution of reef fish by functional group between 2015 and 2025 in Akumal FRZ fore reef. Kernel densities are shown for: (a) COM; (b) HERB; and (c) OTH overall. Kernel densities also shown by reef zone: (d) shallow fore reef and deep fore reef.
Figure 4.
Size distribution of reef fish by functional group between 2015 and 2025 in Akumal FRZ fore reef. Kernel densities are shown for: (a) COM; (b) HERB; and (c) OTH overall. Kernel densities also shown by reef zone: (d) shallow fore reef and deep fore reef.
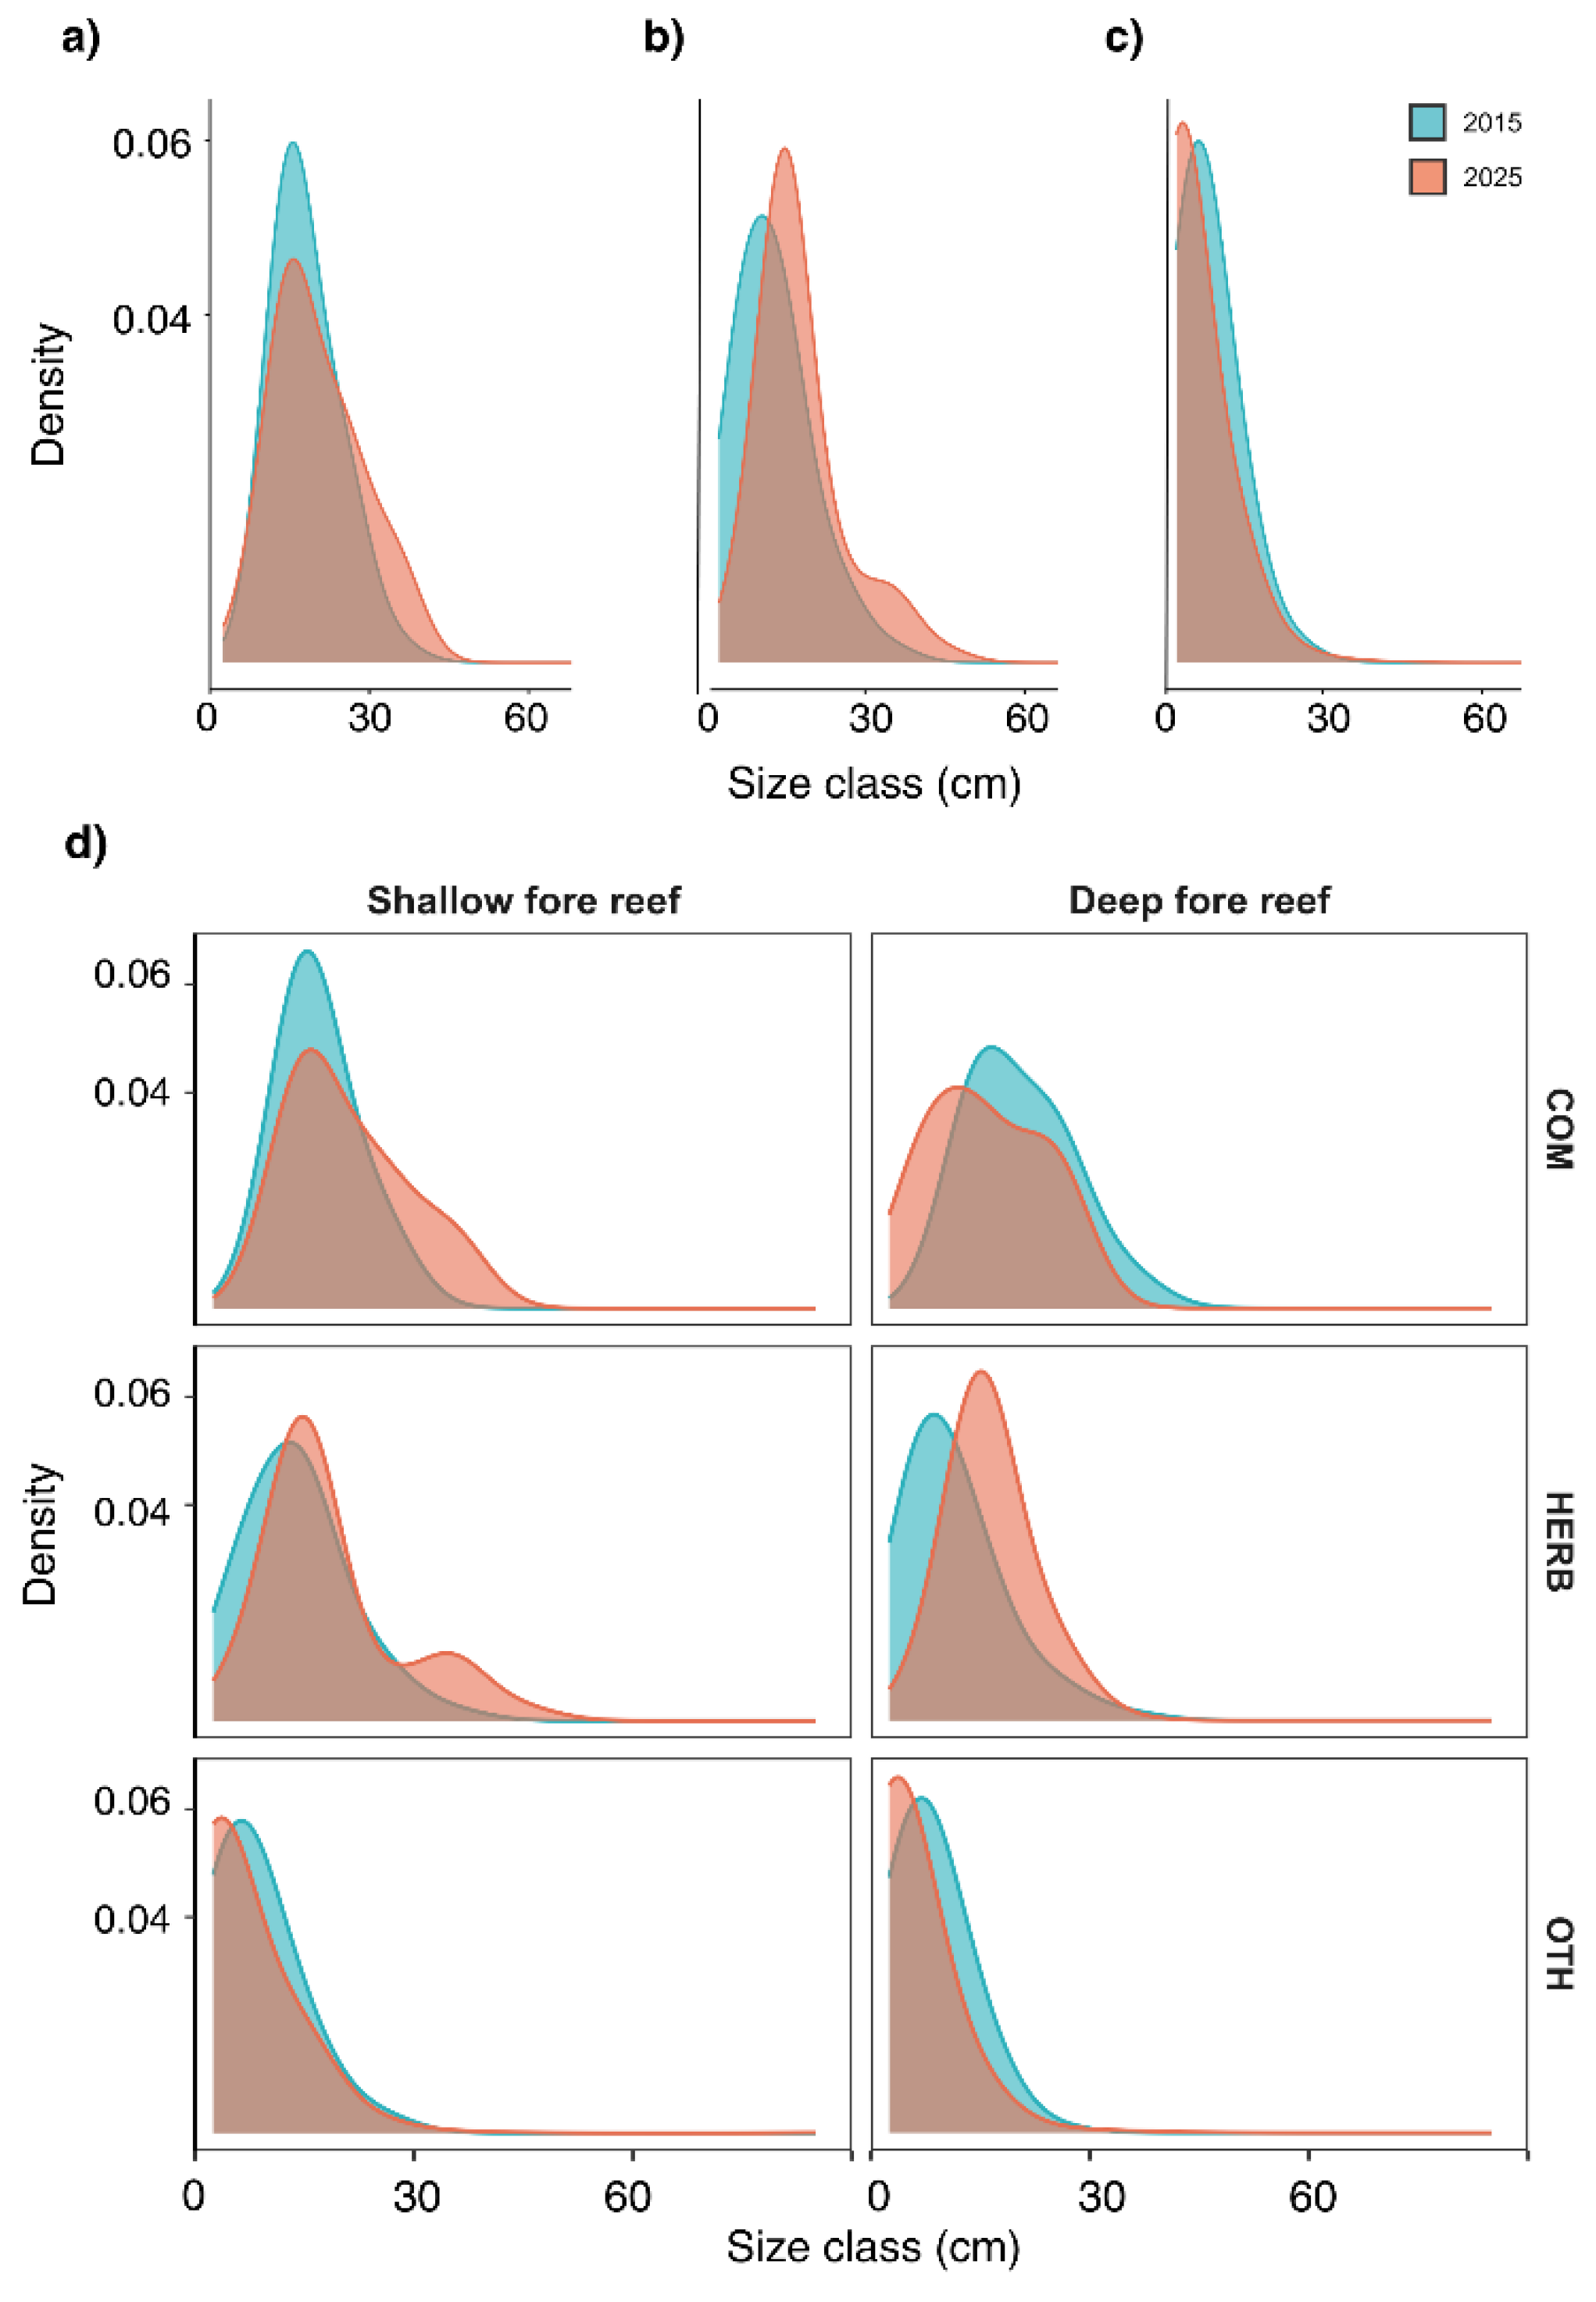
Figure 5.
Coverage of benthic functional groups between 2015 and 2025. The figure shows the average coverage (%) for: (a) reef;( b) shallow fore reef; and (c) deep fore reef. The dots represent the means, and the horizontal bars represent the ± standard error.
Figure 5.
Coverage of benthic functional groups between 2015 and 2025. The figure shows the average coverage (%) for: (a) reef;( b) shallow fore reef; and (c) deep fore reef. The dots represent the means, and the horizontal bars represent the ± standard error.
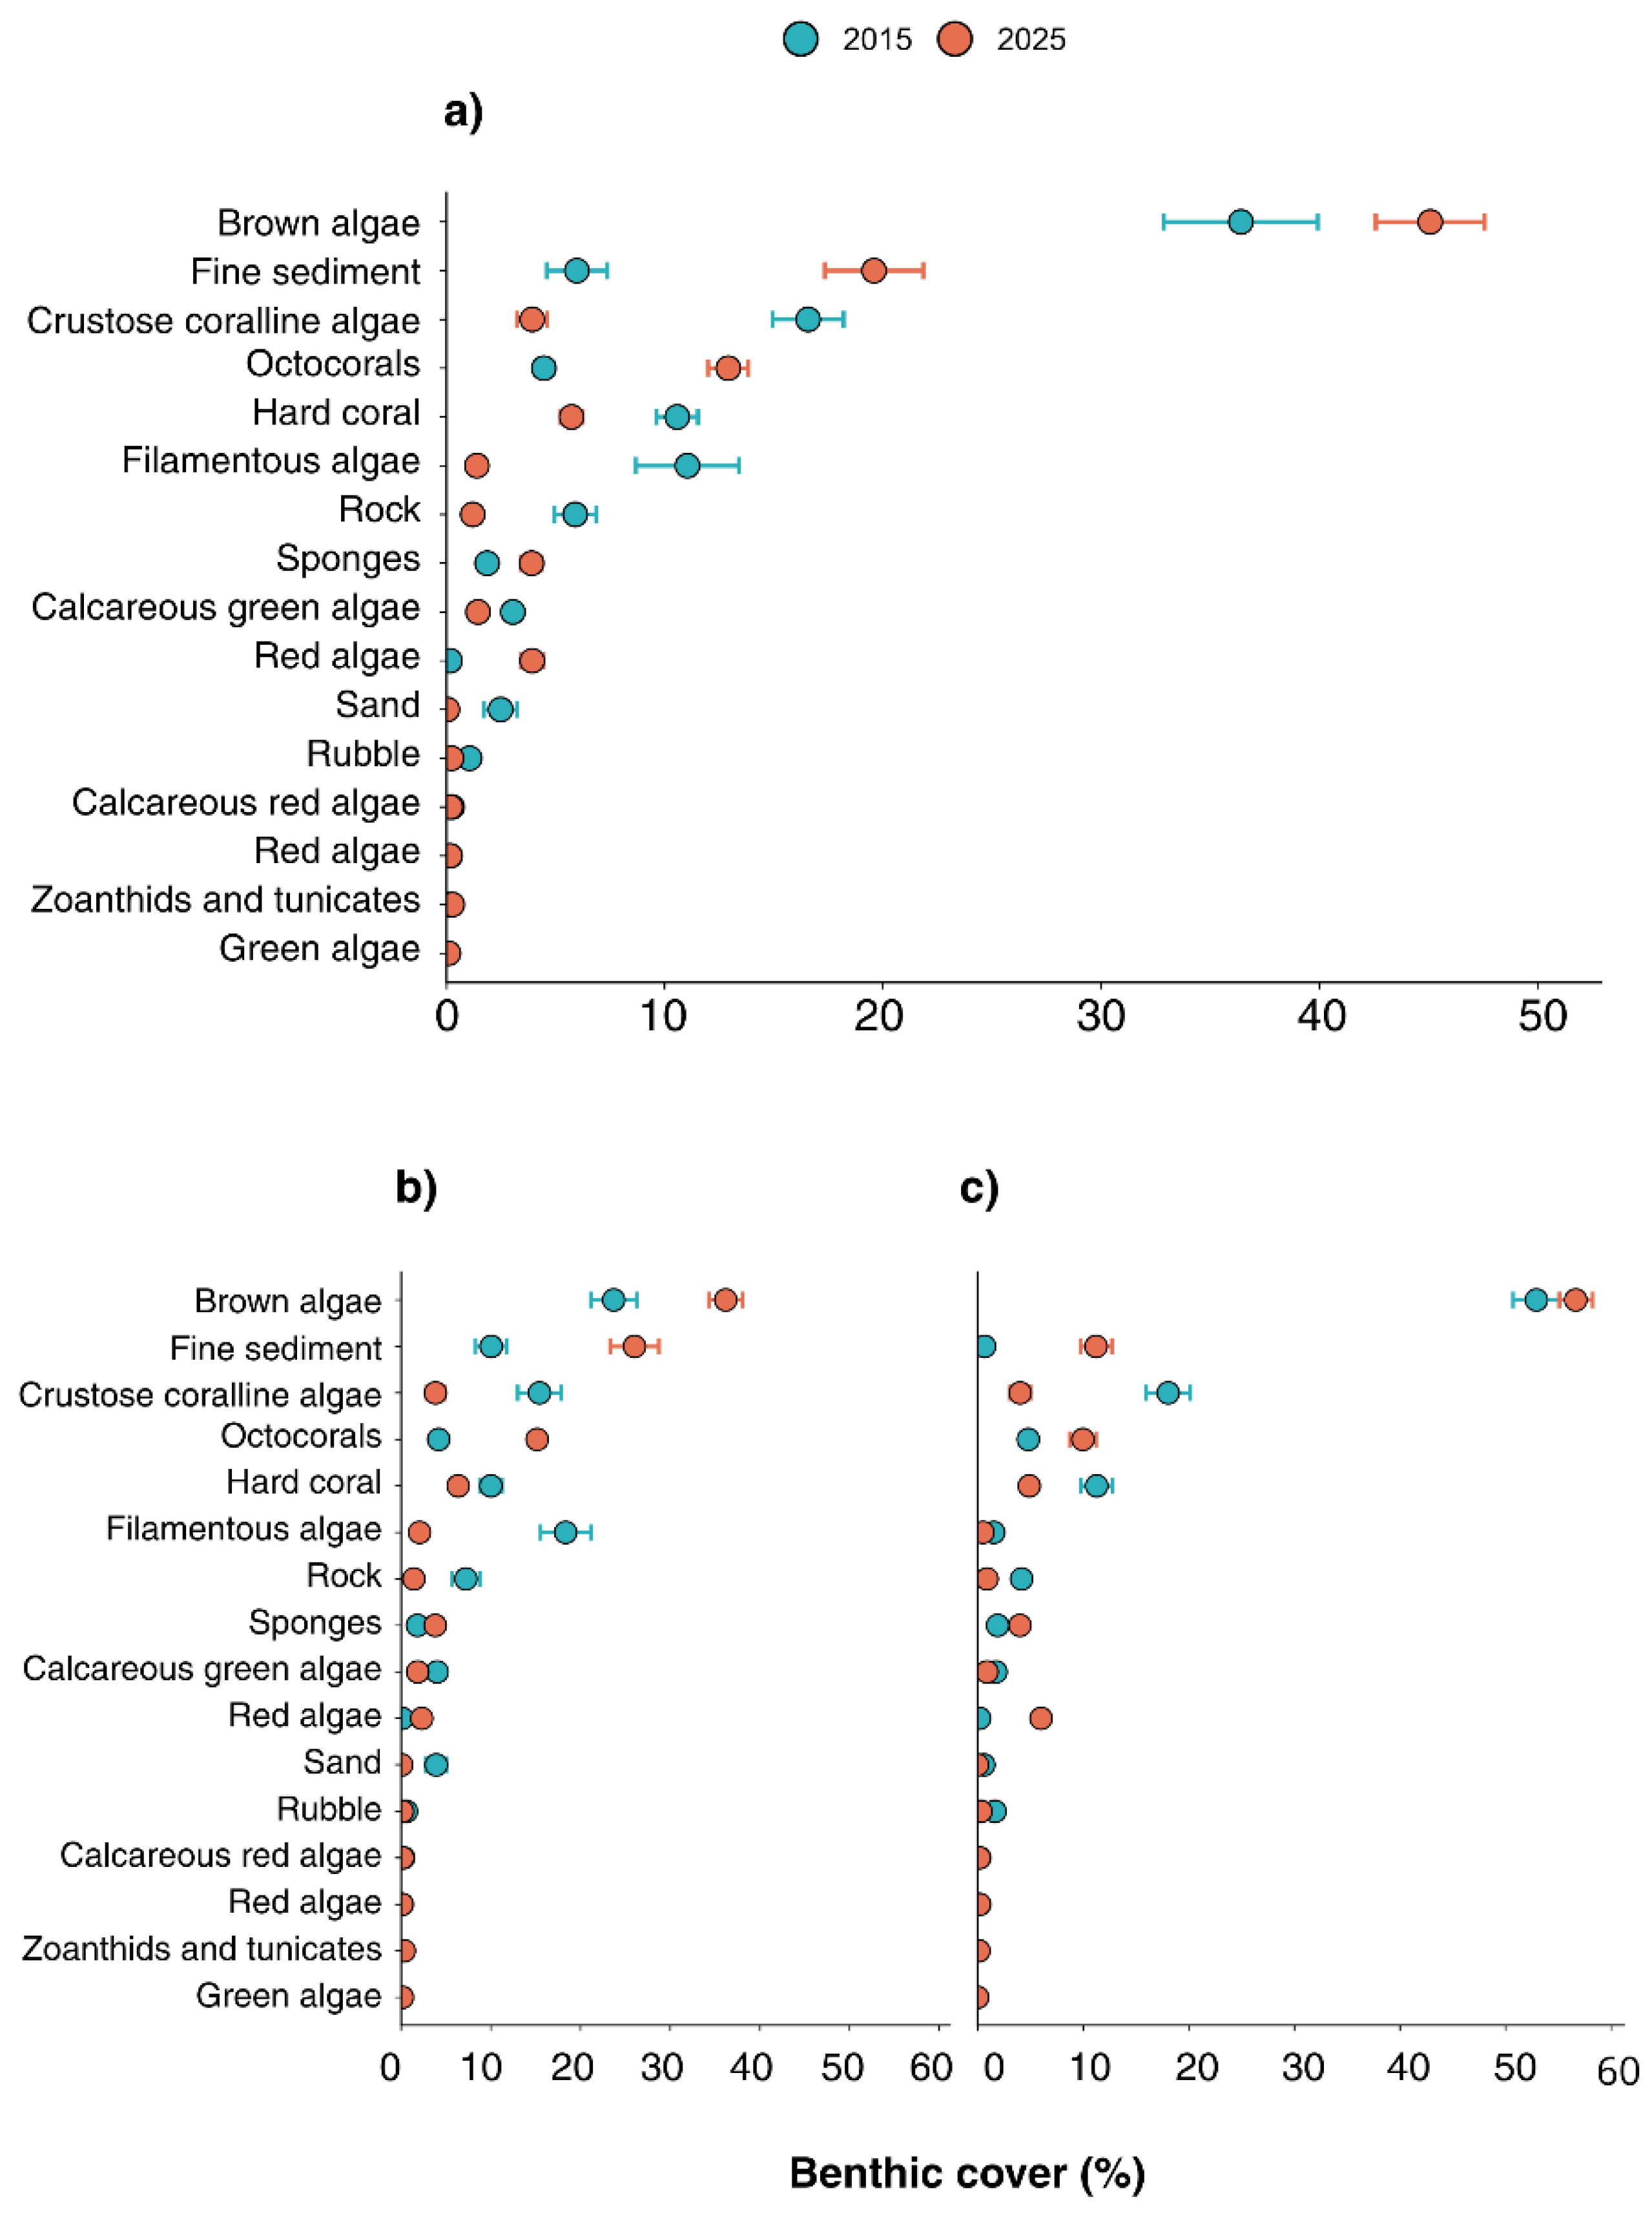
Figure 6.
RDA ordination diagram of biomass of fish functional groups relationship to environmental variables in: (a) 2015; and (b) 2025. The orange arrows represent the functional groups: commercially important species (COM), herbivores (HERB), and other reef fish (OTH); the green arrows represent the environmental variables: brown algae, stony coral (CC), and coral life history strategies (Weedy, Stress-tolerant, and Competitive).
Figure 6.
RDA ordination diagram of biomass of fish functional groups relationship to environmental variables in: (a) 2015; and (b) 2025. The orange arrows represent the functional groups: commercially important species (COM), herbivores (HERB), and other reef fish (OTH); the green arrows represent the environmental variables: brown algae, stony coral (CC), and coral life history strategies (Weedy, Stress-tolerant, and Competitive).
Disclaimer/Publisher’s Note: The statements, opinions and data contained in all publications are solely those of the individual author(s) and contributor(s) and not of MDPI and/or the editor(s). MDPI and/or the editor(s) disclaim responsibility for any injury to people or property resulting from any ideas, methods, instructions or products referred to in the content. |
© 2026 by the authors. Licensee MDPI, Basel, Switzerland. This article is an open access article distributed under the terms and conditions of the Creative Commons Attribution (CC BY) license (http://creativecommons.org/licenses/by/4.0/).
Copyright: This open access article is published under a Creative Commons CC BY 4.0 license, which permit the free download, distribution, and reuse, provided that the author and preprint are cited in any reuse.