

Submitted:
23 July 2026
Posted:
24 July 2026
You are already at the latest version
Abstract
Gonadotropin-releasing hormone agonists are used to treat central precocious puberty and are increasingly prescribed in gender-affirming care. Despite well-established reproductive effects, their broader physiological effects during puberty remain poorly understood. Male and female Wistar rats received a depot triptorelin injection at pubertal onset. Body mass, food intake, and locomotor activity were monitored. After 28 days, reproductive function was assessed, and pituitary and hypothalamic gene expression was analyzed. Changes in gonadal weight, estrous cycle, folliculogenesis, seminiferous tubules’ morphology, and sperm count confirmed the suppression of pubertal maturation. Triptorelin downregulated Gnrhr and Lhb, demonstrating suppression of gonadotrope function. Despite comparable reproductive suppression, metabolic responses to triptorelin were strongly sex-dependent. Females exhibited increased body weight gain accompanied by delayed hyperphagia, whereas males showed reduced body weight gain, unchanged food intake, and increased mean locomotor speed. Female-specific transcriptional remodeling was observed in the hypothalamus, characterized by downregulation of Lepr and Npy and upregulation of Sst and Kiss1 expression. Collectively, these findings demonstrate that pubertal triptorelin treatment induces profound reproductive suppression in both sexes while eliciting sex-specific hypothalamic adaptations in pathways regulating energy homeostasis. This suggests that puberty blockers exert broader neuroendocrine effects beyond the suppression of reproductive maturation.
Keywords:
GnRH agonist
; puberty blockers
; gonadotropin-releasing hormone
; triptorelin
; gender-affirming care
; puberty
1. Introduction
Puberty is a developmental period characterized by somatic and sexual development of secondary sexual characteristics and reproductive maturation. This process involves the establishment of hypothalamic-pituitary-gonadal (HPG) axis activity and is triggered by the hypothalamic peptide kisspeptin, which plays a paramount role in regulating the pulsatile release pattern of gonadotropin-releasing hormone (GnRH). GnRH acts on its receptor (GnRHR) on the pituitary gonadotropes, which is critical for the synthesis and release of luteinizing (LH) and follicle-stimulating (FSH) hormone. LH and FSH act on the gonads, driving steroidogenesis, as well as folliculogenesis and spermatogenesis [1,2].
The timing of puberty is directly linked to energy stores and nutritional status. Conditions like extreme exercise and malnutrition can delay puberty, while obesity can lead to earlier puberty onset [3]. The integration of peripheral and central metabolic signals governing pubertal maturation occurs within the hypothalamus. The postnatal maturation of hypothalamic neuropeptide Y (NPY)/agouti-related peptide (AgRP) and proopiomelanocortin (POMC) circuits establishes the metabolic framework that enables the central assessment of energy sufficiency, a prerequisite for pubertal activation of the HPG axis. As these circuits reach functional maturity, they integrate signals like leptin and insulin-like growth factor 1 (IGF-1) to trigger kisspeptin neurons, effectively lifting the metabolic brake on the reproductive system to initiate the transition into puberty [3]. Moreover, neuropeptides synthetized by POMC, AgRP and NPY neurons continue to participate in regulation of reproduction beyond puberty, since there are direct effects of these peptides on GnRH excitability [4].
Since the seminal work of Knobil in monkeys in 1978 [5], it is well known that intermittent GnRH release is essential for proper function of the HPG axis. In all mammals investigated so far, continuous application of GnRH leads to pituitary desensitization and suppression of HPG axis function. Specifically, prolonged occupancy of GnRHR induces striking decrease in LH and FSH secretion, as well as downregulation in mRNA expression of gonadotropin beta subunits [6].
GnRH analogues are synthetic peptides that structurally resemble the natural GnRH, with some amino acid modifications. They were developed in the early 1980s and today have a variety of clinical applications including treatment of prostate cancer and various gynecological conditions [7]. The agonist analogues of GnRH (GnRHa) have increased affinity for GnRHR and longer half-life compared to the natural peptide. After an initial flare-up in gonadotropin release, GnRHa induce long-term suppression of pituitary gonadotrope function [8]
Since the early 1990s, GnRHa have been the treatment of choice for central precocious puberty (CPP). Commonly referred to as puberty blockers, they delay the onset of secondary sexual characteristics and prevent premature activation of the HPG axis. Another benefit of GnRHa is that they improve final height in CPP girls [9]. This is why they are also used (usually combined with other agents) in pediatric conditions associated with compromised adult stature, including growth hormone deficiency, idiopathic short stature, and in children born small for gestational age [10]. More recently, GnRHa use was widened to transgender adolescents, with aim to suppress the development of secondary sexual characteristics associated with biological sex and thus improve gender dysphoria. Aside from this benefit, GnRHa are often viewed as agents that prolong the time for decisions on gender transition [11].
Although these treatments were long considered safe, their use in minors has become increasingly debated. Several countries, including the United Kingdom, Sweden, and New Zealand, have introduced restrictions on the use of puberty blockers in children under 18 years of age. In contrast, in countries such as Belgium and the Netherlands, GnRHa remain part of established clinical protocol (the Dutch protocol) for the treatment of transgender adolescents. These differing approaches reflect ongoing ethical and medical concerns, particularly regarding the limited understanding of the short- and long-term effects of GnRHa on health and development [12]. Furthermore, data on male subjects remain scarce, as CPP is more frequently diagnosed in girls [13].
In parallel with the ongoing clinical investigations [14], preclinical research has increasingly focused on elucidating the effects of GnRHa exposure. Most rodent studies to date have primarily examined the status and reversibility of the HPG axis function, often following prepubertal administration [15,16,17,18,19]. However, less attention has been given to GnRHa exposure during puberty itself—a clinically relevant scenario in which ongoing pubertal development is interrupted rather than delayed.
Here, we investigate the effects of pubertal administration of the GnRHa triptorelin on the HPG axis and its integration with metabolic regulatory pathways in rats of both sexes. We demonstrate that prolonged triptorelin exposure suppresses HPG axis activity in both males and females, as evidenced by reduced gonadal weight, altered gonadal histological features, and changes in gonadotrope-related gene expression. Notably, these effects are accompanied by sex-specific metabolic outcomes, including increased body weight and food intake in females but not males. Furthermore, hypothalamic expression of key metabolic regulators, including Npy and Lepr, is selectively downregulated in females. Collectively, these findings indicate that pubertal triptorelin exposure disrupts hypothalamic reproductive–metabolic integration in a sex-specific manner, highlighting a previously underappreciated dimension of GnRHa action during adolescence.
2. Materials and Methods
2.1. Animals
The study was performed on 5-6 weeks old female and male rats of Wistar strain, provided by the Experimental animals breeding facility of the Institute for Biological Research “Sinisa Stankovic”. During the experiment the animals were housed 3 per cage, and kept in standard laboratory environment (12 h dark/light cycle, at constant temperature/humidity), with unlimited access to chow and tap water. The experimental protocols were approved by the National licensing committee at the Department of Animal Welfare, Veterinary Directorate, Ministry of Agriculture, Forestry and Water Management of Republic of Serbia (Permit No 323-07-11135/2022-05) and performed in compliance with the guidelines of the Directive on the protection of animals used for experimental and other scientific purposes (2010/63/EU). The experimental procedures did not result in any unexpected adverse events or signs of pain or distress. Animals were monitored daily using non-invasive procedures, including assessment of puberty onset, body weight, and estrous cycle. The first experiment for estrous cycle assessment, gonadal morphology, body weight gain and qPCR analyses was done with 7 animals per group. The second experiment for food intake and locomotor activity was done with 9 animals per group. In total 64 animals were used (32 females and 32 males).
2.2. Triptorelin Administration
In female rats, puberty onset typically occurs between postnatal days (PND) 30 and 40 and it is determined by vaginal opening. In male rats, puberty onset occurrs between postnatal days 38 and 45 and it is determined by preputial separation, i.e., the separation of the prepuce from the glans penis [1]. Vaginal opening was registered between PND 30 and 36 (33.5 ± 2.2), while preputial separation occurred between PND 39 and 45 (42.0 ± 2.2). On the day of puberty onset, animals were randomly assigned to Control or Triptotrelin group. Animals in the Triptorelin group (T) received an intramuscular injection of 100 μL of Diphereline® (Ipsen Pharma Biotech, France; active substance: triptorelin pamoate) dissolved in sterile saline solution at a dose of 2.9 mg/kg body weight. Animals in the Control group (C) received 100 μL of vehicle, i.e. sterile saline solution i.m. at the onset of puberty.
2.3. Estrous Cycle Assessment
Starting from the day of vaginal opening, non-invasive vaginal lavage was performed daily between 9:00 and 10:00 a.m. The phase of the estrous cycle was determined based on the cellular composition and morphology, which was was assessed via light microscopy. All females were sacrificed during the diestrus phase of the estrous cycle.
2.4. Food Intake Determination
For the calculation of food intake, animals were housed 3 per cage according to their assigned experimental group. Food consumption per cage (n = 3 cages/group), was calculated as the difference between the amount of chow provided and the amount remaining after a 48 h period. The data are expressed as food consumption per animal over the 48 h period and presented as mean ± SEM. The experimenter was blinded to the treatment group allocation during food intake determination and data analysis.
2.5. Novel Rectangular Arena Procedure
Locomotor activity was assessed 26 days after the triptorelin or vehicle injection, using an automated monitoring system consisting of Opto-Varimex 5 cages (Columbus Instruments, Columbus, OH, USA) connected to an IBM-compatible computer for real-time data acquisition. Prior to testing, all animals were acclimated to the experimental room for 30 minutes to minimize the influence of environmental novelty. Following habituation, each animal was placed in the center of the testing arena and allowed to freely explore the novel environment for 30 minutes. Behavioral data were collected and analyzed using Auto-Track software (version 5.5.9). Locomotor activity was quantified as the total distance traveled, calculated from consecutive interruptions of infrared beams within the apparatus. Average locomotor speed (cm/s) was automatically calculated by the tracking software as the total distance traveled in centimeters divided by the duration of active ambulatory time over the 30-minute test period. The results are presented as mean ± SEM, from n ≥ 8 animals per group. The experimenter was blinded to the treatment group allocation during behavioral testing and data analysis.
2.6. Tissue Collection
The animals were sacrificed by asphyxia in a CO₂ chamber with a gradual increase in CO₂ concentration. The animals were perfused with 50 mL of cold saline. From each animal, the pituitary gland and hypothalamus were isolated, weighed, and stored in RNAlater® (Sigma-Aldrich, Saint Louis, MO) at −80 °C for subsequent RNA isolation and gene expression analysis. Hypothalamus was dissected on ice as a block of tissue, with boundaries defined using a coronal rat brain matrix. The rostral cut was made 2 mm anterior to the optic chiasm, and the caudal cut behind the mammillary bodies. Lateral borders were set to 2 mm lateral to the third ventricle. The dorsal border of the sampled block was defined by the top of the third ventricle. Ovaries and testes were collected from all animals, fixed in Bouin’s solution, and subsequently processed for histological analysis.
2.7. Spermatozoid Count and Gonadal Histology
Heads and tails of epididymis were macerated in DMEM medium and incubated at 34 °C for 20 minutes on a shaker at 700 rpm. The suspension was strained through a 100 µm mesh and spermatozoids counted on a Neubauer hemocytometer. The results are presented as mean numbers of spermatozoids per head (caput) or tail (cauda) of one epididymis ± SEM, from n = 7 animals per group.
After fixation, testes and ovaries were embedded in paraffin, cut to 7 µm sections and mounted on gelatin-coated slides. Ovary and testis sections were stained with hematoxylin and eosin (H&E), and examined and photographed using a Zeiss Axiovert microscope (Carl Zeiss GmbH, Vienna, Austria) Every 10th ovarian section was used to analyze ovarian morphology, done according to criteria described by Pedersen and Peters [20]. Antral follicles with a cavity within granulosa cell layer (type 5b and higher), and large corpora lutea (CL) (over 800 µm in diameter) were counted and expressed as the total numbers per ovary. The results are presented as mean counts ± SEM, from n ≥ 6 ovaries per group. Diameter of seminiferous tubules was measured from 60-80 round or close to round tubules from 7-10 micrographs (10x magnification) of H&E stained sections, per animal. The results are expressed as mean diameters ± SEM, from n ≥ 6 testes per group. Micrographs were sized, cropped and arranged in Photoshop CS (Adobe Inc. San Jose, CA). The experimenters were blinded to the treatment group allocation during spermatozoid count and histological analysis.
2.8. RNA Isolation, Reverse Transcription and Gene Expression
Total pituitary RNA was isolated using RNeasy Mini Kit (QIAGEN, Germany) according to the manufacturer’s instructions, while hypothalamic RNA was isolated using the TRIzol method. Briefly, 1 ml of TRIzol™ Reagent (Invitrogen, Carlsbad, CA, USA) was added per 100 mg of tissue, followed by tissue homogenization. Chloroform was added in a one-fifth volume relative to TRIzol, and samples were vortexed and centrifuged (12,000 × g, 4 °C, 15 min). The aqueous phase containing RNA was carefully transferred to a new tube, mixed with half-volume isopropanol and stored at -80 °C overnight. The following day, samples were thawed and centrifuged (12,000 × g, 4 °C, 10 min). RNA pellets were washed with 75% ethanol and centrifuged (7500 × g, 4 °C, 5 min), air-dried, and resuspended in UltraPure water (Milli-Q®, MilliporeSigma, Burlington, MA, USA). The concentration of RNA was determined by NanoPhotometer MicroVolume spectrophotometer (Implen, Germany, catalog number: N60 UV/Vis), while sample purity was assessed by A260/A280 and A260/A230 ratios.
Further, 1 µg of RNA was used for reverse transcription, which was carried out with the High-Capacity cDNA Reverse Transcription Kit (Applied Biosystems by Thermo Fisher Scientific, Waltham, MA, USA). Quantitative real time PCR (qRT-PCR) was performed using TaqMan® or SYBR™ Green reagents (Applied Biosystems by Thermo Fisher Scientific, Waltham, MA, USA) on the QuantStudioTM 3 Real-Time PCR System (Applied Biosystems by Thermo Fisher Scientific). The primer sequences and probe identification numbers are listed in Table 1 and Table 2, respectively. Relative gene expression levels were calculated using the comparative 2−∆Ct method, using glyceraldehyde 3-phosphate dehydrogenase (Gapdh) as the housekeeping gene.
2.9. Statistical Analysis
Parametric analyses were performed using R (packages: lme4, lmerTest, car, emmeans, pheatmap), while GraphPad Prism 8 was used for Welch’s t-tests and data visualization. Model assumptions (normality and homoscedasticity) were verified using residual diagnostics, Shapiro-Wilk, and Levene's tests. Prior to analysis, extreme biological and technical outliers were screened and excluded. Accordingly, one female with a highly irregular estrous cycle was excluded from all analyses.
Depending on the experimental design, specific statistical models were applied as follows:
For body mass & food intake, Linear Mixed-Effects Models were utilized to control for repeated measurements over time, specifying Sex, Treatment, Day (categorical factor), and all interactions as fixed effects. For body mass, animal identity was included as a random intercept, whereas for food intake (recorded per cage), Cage_ID was specified as a random intercept. Omnibus testing was evaluated via Type III ANOVA with Satterthwaite’s method. Post-hoc pairwise comparisons between control and treated groups were conducted within each Sex and Day combination, with p-values adjusted using the Šidák correction.
Locomotor activity (total n = 35, due to one outlier exclusion) and log2-transformed gene expression data were analyzed via Type III Two-way ANOVA using sum-to-zero contrasts (contr.sum). Pairwise post-hoc differences for all parameters were resolved using Tukey’s adjustment. For gene expression, omnibus p-values were adjusted across all genes using the Benjamini–Hochberg (FDR) method and reported as q-values. Expression patterns were visualized via hierarchical clustering heatmaps (z-score normalization, Euclidean distance, Ward’s 'ward.D2' method).
Statistically significant differences are denoted as: *p < 0.05, **p < 0.01, ***p < 0.001.
No formal a priori sample size calculation was performed. Therefore, no single primary outcome measure was used to determine sample size. Sample sizes were based on previous studies using similar experimental models and practical considerations. Effect sizes and confidence intervals were not calculated or reported. During the preparation of this manuscript, the authors used free versions of ChatGPT and Gemini for acquiring the R code, used for data analyses. The authors have reviewed and edited the output and take full responsibility for the content of this publication.
3. Results
3.1. The Effect of Triptorelin on Estrous Cycle, Sperm Count and Gonadal Morphology
Triptorelin significantly affected the absolute mass of both ovaries (control 74.9 ± 8.6 mg; triptorelin 40.7 ± 7.3 mg) and testes (control 3.4 ± 0.2 g; triptorelin 1.7 ± 0.1 g). In both males and females, relative mass of ovaries and testicles in triptorelin treated animals was almost two-fold decreased in comparison to control animals (Figure 1A-C).
From the day of vaginal opening until the end of experiment, control females maintained regular 4-5 days long cycles. After triptorelin administration, females completed the ongoing cycle but then remained in diestrus until the end of the experiment. Estrous cycle of representative animals from C and T group are shown in Figure 1D. Triptorelin treatment also led to changes in ovarian histology. Representative low-power magnification micrographs depicting H&E stained ovary sections from C and T group are shown in Figure 1E. Triptorelin treated animals had significantly lower number of large follicles (75.2 ± 3.6) compared to controls (26.7 ± 4.3) (Figure 1F). Atretic follicles, follicular and luteal cysts were frequently observed in triptorelin treated animals. Ovaries of triptorelin treated animals were not completely devoid of CL, but their number was significantly lower (12.0 ± 3.9) than in control animals (35.3 ± 1.9, p < 0.005). Number of big CL was also scarce in triptorelin treated animals (2.0 ± 0.9), compared to controls (13.7 ± 2.0, Figure 1G). Primary and other small follicles seemed intact in T group, but their number was not assessed.
Representative low-power magnification micrographs depicting H&E stained testicle sections from C and T group are shown in Figure 1H. While some seminiferous tubules were apparently unaffected by treatment (normal structure of the tubule wall and presence of spermatozoa in the lumen (arrow in 1H)), tubules with various signs of degeneration were also observed (arrowhead in Figure 1H). The layered structure of the wall was occasionally completely disturbed these tubules were completely devoid of spermatocytes (Figure 1H, asterisk). Degenerative changes were more often observed in the middle portions of the sections. Analysis of H&E stained testicle sections revealed smaller diameter of seminiferous tubules in triptorelin treated animals (Figure 1I). The number of spermatozoa (Figure 1J) in the head and tail of epididymis was significantly reduced in triptorelin treated animals (16.4 ± 4.6 × 10⁶ (caput); 3.9 ± 2.1 ×10⁶ (cauda)) compared to control (48.2 ± 2.6 ×10⁶ (caput); 33.8 ± 3.1 × 10⁶ (cauda)). In three triptorelin treated animals, complete absence of spermatozoa was noted in cauda epididymis.
3.2. Gene Expression Profiling of the Pituitary Gland
Having established the impact of triptorelin on gonads, we next examined global gene expression patterns in the pituitary gland. Data were first visualized using a heatmap (Figure 2) based on z-score standardized values for each gene. Hierarchical clustering showed that the primary factor driving sample grouping was the treatment effect. This separation was mainly characterized by downregulation of Lhb and Gnrhr, along with upregulation of Cga in the treated samples. Within these treatment-defined clusters, a secondary separation by sex was observed, driven by the expression of Fshb, Prl, and Pomc. Overall, these results demonstrate that triptorelin treatment has a more profound effect on the pituitary gene expression profile than biological sex. Hierarchical clustering of genes yielded two primary clades: one comprising Lhb, Fshb, and Gnrhr, reflecting their response to GnRHa induced suppression, and a second clade containing Cga, Prl, Pomc, and Tshb, characterized by more diverse regulatory patterns including upregulation and sexual dimorphism.
The statistical analysis summary of the effects of sex, treatment and their interaction on the expression profile of selected pituitary genes is presented in Table 3, and post-hoc comparisons are presented in Figure S1 in the Supplementary file.
3.2.1. Pituitary Genes Influenced by Both Sex and Treatment
A key subset of pituitary genes, specifically those encoding the gonadotropin subunits − Lhb, Fshb, and Cga, as well as the lactogenic hormone Prl, demonstrated significant sensitivity to both biological sex and triptorelin treatment (q < 0.05, Table 3).
For Lhb and Cga, the treatment effect was the most prominent driver of changes in expression (F1,21 = 55.41, q < 0.001 and F1,21 = 70.21, q < 0.001, respectively, Table 3). While significant sexual dimorphism was present for both genes (q = 0.009 for Lhb and q <0.001 for Cga), the absence of a significant sex-by-treatment interaction (q > 0.05) indicates that triptorelin induced a consistent, yet divergent, response in both males and females: a robust downregulation of Lhb and a significant upregulation of Cga, confirmed with post-hoc analysis (Table 3, Figure S1). While there were no baseline differences between control groups for Lhb (p = 0.870) or Cga (p = 0.460), the treated groups showed a distinct divergence, with triptorelin-treated females exhibiting significantly higher expression levels than their male counterparts (p = 0.007 and p < 0.001, respectively, Figure S1).
For Fshb and Prl, biological sex accounted for the largest proportion of total variance (F1, 21 = 32.61, q < 0.001 and F1, 21 = 33.20, q < 0.001, respectively; Table 3), reflected in a strong dimorphism between control females and males (p < 0.001 for both, Figure S1). Triptorelin treatment significantly modulated the expression of both Fshb (q = 0.003) and Prl (q = 0.033; Table 3). Post-hoc comparisons revealed that triptorelin significantly reduced Fshb expression in males (p = 0.001), whereas its impact on Prl downregulation was significantly pronounced in females (p = 0.033) (Figure S1).
3.2.2. Pituitary Genes with Single-Factor or No Significant Effects
In contrast to the multi-factor responsiveness of the gonadotropin subunits, the expression of Gnrhr, Pomc, and Tshb exhibited more restricted regulatory patterns.
The expression of the Gnrhr was modulated only by the treatment effect (F1, 21 = 85.49, q < 0.001). Post-hoc analysis confirmed the downregulation of Gnrhr in triptorelin-treated rats of both sexes compared to their respective controls (p < 0.001, Figure S1), while there were no significant differences between sexes, neither in control conditions, nor after treatment (Table 3, Figure S1).
Conversely, the expression of Pomc was solely influenced by biological sex (F1, 21 = 6.93, q = 0.022), although post-hoc analysis did not reveal significant differences between female and male groups. Finally, the expression of the Tshb remained stable – no significant effects were observed for sex, treatment, or their interaction (Table 3). Post-hoc comparisons found no significant differences between control and treated groups of either sex.
3.3. Body Mass Changes Under Triptorelin in a Sex-Specific Manner
After characterizing pituitary transcriptional responses, we next examined how triptorelin affects the organismal level, beginning with longitudinal tracking of body mass and food intake. Body mass was analyzed using a linear mixed model with sex, treatment, and day as fixed effects and animal identity as a random effect (Figure 3). A significant main effect of sex (F1,24 = 111.21, p < 0.0001) and day (F27,648 = 449.74, p < 0.0001) was observed, while the main effect of treatment was not significant (F1,24 = 0.02, p = 0.888).
Significant interactions were detected between sex and treatment (F1,24 = 5.83, p = 0.024), sex and day (F27, 648 = 11.55, p < 0.0001), and treatment and day (F27, 648 = 1.80, p = 0.008). Importantly, a significant three-way interaction between sex, treatment, and day was observed (F27,648 = 3.30, p < 0.0001).
According to the post-hoc test (Šidák-adjusted) triptorelin treatment in males significantly reduced body mass compared to controls between days 12 and 19 (p < 0.05), with an average decrease of 30–35 g (≈10–12%). In contrast, in females, triptorelin treatment significantly increased body mass from day 18 to 28 (p < 0.05), with an average increase of 29–35 g (≈18–22%).
These findings demonstrate opposite, time-dependent effects of treatment in males and females.
3.4. Food Intake and Locomotor Activity
To elucidate the origin of differences in weight gain, we monitored food intake and locomotor activity, as shown in Figure 4. For food intake, a highly significant main effect of Sex (F1, 8.02 = 52.08, p < 0.001), with male rats consuming substantially more food than females throughout the study. A significant main effect of day was also observed (F5, 40.02 = 9.81, p < 0.001), reflecting a general increase in food consumption during maturation. The main effect of treatment (F1, 8.02 = 2.15, p = 0.181) and the omnibus three-way interaction (F5, 40.02 = 0.41, p = 0.839) were not significantly different.
However, post-hoc pairwise comparisons revealed a sex-specific hyperphagic response that tracks the weight gain trajectory observed in female rats (Figure 4A). In male rats, triptorelin treatment had no significant impact on food consumption at any time point. While food intake did not differ during the early phase on Days 14, 16, and 18 (p > 0.05), a statistical trend toward increased food consumption emerged on Day 22 (mean difference = -5.73 g, p = 0.055). This hyperphagic effect became statistically significant on Day 24, with treated females consuming significantly more food than controls (mean difference = -7.25 g, p = 0.017). The elevated food intake was also recorded on Day 28 (mean difference = -5.92 g, p = 0.048).
For locomotor activity, defined as the total distance travelled within the 30-minute testing period, a type III two-way ANOVA showed that the main effect of sex was highly significant (F1, 31 = 35, p < 0.0001; Figure 4B). Conversely, the main effect of triptorelin treatment showed no statistical significance (F1, 31 = 0.34, p = 0.57). The sex:treatment interaction displayed a statistical trend (F1, 31 = 3, p = 0.08). Similarly, in the analysis of the average speed, the main effect of sex was significant (F1, 31 = 23, p < 0.0001; Figure 4C) as opposed to the main effect of treatment, which showed only a statistical trend (F1, 31 = 3, p = 0.09). However, a highly significant sex:treatment interaction effect was observed (F1, 31 = 9, p = 0.005), demonstrating that triptorelin modulates locomotion velocity in a sex-dependent manner.
To resolve specific group differences for both parameters, Tukey post-hoc multiple comparisons were conducted. In control groups, a robust sexual dimorphism was evident in both tested locomotor aspects: control females exhibited higher locomotor activity compared to control males (Predicted LS mean difference = 23.96, p < 0.0001) and moved at a significantly faster average speed (Predicted LS mean difference = 2.6, p < 0.0001).
Triptorelin treatment altered the locomotion parameters in male cohort only – it increased the average speed compared to control males (Predicted LS mean difference = -1.6, p = 0.012), while the corresponding locomotor activity increase was not statistically significant (Predicted LS mean difference = -7.35, p = 0.37). In contrast, triptorelin treatment had no impact on females, with control and triptorelin groups showing almost identical levels in both locomotor activity (p = 0.82) and average speed (p = 0.80).
For total locomotor activity, treated females remained significantly more active than treated males (Predicted LS mean difference = 12.87, p = 0.03). Triptorelin-induced increase in the average speed in males led to the disappearance of the sex difference observed in control groups – treated females no longer differed significantly from treated males (p = 0.60), and control females showed no significant difference compared to treated males (p = 0.17).
3.5. Targeted Gene Expression Profiling of the Hypothalamus
Following the assessment of gonads, pituitary gene expression, and changes in physical activity and energy balance, we focused on the effects of triptorelin on the central regulator of the HPG axis, the hypothalamus.
To obtain an overview of the global transcriptional landscape across experimental groups, hierarchical clustering was performed on the log2-transformed, z-score normalized expression levels of the 10 target genes (Figure 5).
The samples (horizontal axis on the dendrogram) were primarily divided into two major clusters, driven by triptorelin treatment: (i) the right female cluster contained all control samples (Cf) and the majority of triptorelin-treated females (Tf). This group was characterized by an upregulation of genes Kiss1, Esr1, and Pomc and a downregulation of Sst; (ii) and the left cluster (predominantly males), encompassed all male control samples (Cm) and male triptorelin-treated samples (Tm). Notably, two triptorelin-treated female samples (Tf5 and Tf13) clustered within this group, indicating a treatment-induced shift in these specific animals toward a male-like expression profile.
The 10 target genes were divided into three hierarchical blocks based on their co-expression profiles across sexes and treatments: (i) The Sst and Agrp cluster - this branch isolates genes involved in energy balance and growth regulation with sex dimorphic expression pattern in baseline, with Sst showing higher expression in control males vs. control females; (ii) the Npy and Lepr cluster - this pair share a downregulation pattern in triptorelin-treated females; (iii) the neuroendocrine cluster - this branch encompasses the remaining six genes, splitting into two sub-groups: the Pdyn and Tac3 sub-cluster, which groups genes exhibiting a moderate main effect of sex; and the Gnrh1, Kiss1, Esr1, and Pomc sub-cluster, which represents the primary driving force of sexual dimorphism in the dataset, characterized by higher expression in female controls compared to male controls, together with the induction of Kiss1 in females following triptorelin treatment.
3.5.1. Hypothalamic Genes with Three Significant Effects
Sst and Npy, showed significant main effects for both factors and an interaction effect (Table 4). Sst expression was influenced by sex (F1, 19 = 243.58, q < 0.001), treatment (F1, 19 = 39.85, q < 0.001), and a significant sex:treatment interaction (F1, 19 = 54.65, q < 0.001). Triptorelin treatment significantly induced Sst expression in females, while it had no significant impact on males (Figure S2). Baseline sexual dimorphism (Cf vs. Cm, p < 0.001) remained pronounced following treatment (Tf vs Tm, p < 0.001). Npy expression similarly demonstrated significant effects for sex (F1, 19 = 18.08, q = 0.001), treatment (F1, 19 = 19.45, q = 0.001), and their interaction (F1, 19 = 23.13, q = 0.001). According to the post-hoc test, the treatment had an effect only in females, causing a significant reduction in Npy levels compared to female controls (p < 0.001). Figure S2).
3.5.2. Genes with Two Significant Effects
Lepr expression was characterized by a significant main effect of treatment (F1, 19 = 7.34, q = 0.035) and a significant sex:treatment interaction (F1, 19 = 9.16, q = 0.023. Pairwise post-hoc comparisons confirmed that triptorelin treatment downregulated Lepr expression in females only (p = 0.006), (Figure S2). Kiss1 expression was driven independently by sex (F1, 19 = 28.69, q < 0.001) and treatment (F1, 19 = 40.67, q < 0.001), without a significant interaction (Table 4). Post-hoc analysis highlighted sexual dimorphism under control conditions (p = 0.022). Triptorelin treatment led to an upregulation of Kiss1 in females (p = 0.001) and a similarly significant induction in males (p = 0.002; Figure S2).
3.5.3. Genes with One or No Significant Effect
Several genes were modulated by sex only, without responding to triptorelin treatment (Table 4), such as Esr1 (F1, 19 = 27.48, q < 0.001) and Pomc (F1, 19 = 15.52, q = 0.002). Specifically, for Esr1 we observed the difference between female and male controls (p = 0.001), which reached only a statistical trend following treatment (Tf vs. Tm, p = 0.052; Figure S2), while for Pomc, a baseline difference between sexes was observed as well, (p = 0.009), but no treatment-related modifications were detected (Table 4, Figure S2).
Pdyn, Tac3 and Agrp demonstrated a significant main effect of sex (Table 4). However, the pairwise analyses did not yield statistically significant results (p > 0.05 across all comparisons, Figure S2). Gnrh1 expression did not vary significantly as a function of sex, treatment, or their interaction (Table 4), with post-hoc pairs confirming the absence of any statistical differences (Figure S2).
4. Discussion
We show here that long-acting GnRHa triptorelin effectively suppresses reproductive maturation in both female and male rats. In females, we observed estrous cycle arrest in diestrus, reduced ovarian mass, altered ovarian histology, and a reduced number of antral follicles and CL, findings supported by others [21,22]. Regarding testicles, triptorelin affected their weight and the diameter of seminiferous tubules, in line with [23,24,25,26]. In our hands however, triptorelin partially suppresses spermatogenesis, confirming prolonged and efficient suppression of the HPG axis. Variable degree of spermatogenesis suppression observed in the present study is consistent with the heterogeneous testicular responses previously reported after GnRHa treatment [25]. It is also of note that the effectiveness and physiological consequences of GnRHa treatment partly depends on the developmental stage at treatment initiation. Namely, the HPG axis undergoes rapid maturation during puberty, with changes in GnRH secretion [27], pituitary responsiveness [28], and gonadal sensitivity [29].
The suppression of HPG axis in both sexes is also evidenced in the pituitary gland of both sexes, as continuous occupancy of the GnRHR produces expected Gnrhr and Lhb downregulation [30]. On the other hand, continuous GnRH induces Cga expression [6], as we observe here. We also anticipated Fshb downregulation in both sexes. Interestingly, females do not show Fshb mRNA downregulation. However, GnRH is not the only significant regulator of Fshb; one possible explanation is a loss of inhibitory tone provided by the ovaries, because prolonged disruption of follicular development may also include a decrease in granulosa cells inhibin production. For example, both immune neutralization of inhibin and ovariectomy lead to Fshb mRNA increase [31]. It is of note that 28 days after goserelin acetate implantation, mice show FSH blood levels similar to control animals, although its levels were significantly lower on days 9 and 21 [22].
Increase in weight gain following GnRHa treatment in female is consistent with previous rodent studies [16,18,32]. Similar, sex-specific effects have been reported in humans, where GnRHa treatment transiently increases body mass index in girls, but not boys with CPP [33,34]. These changes are generally reversible and tend to resolve within one year after treatment cessation [34,35,36]. The BMI increase under GnRHa in girls seems to be linked to the weight status prior to treatment [36], and dietary habits [37]. The weight increase was also suggested to be related to direct effects on human adipocytes through GnRHR [38] or ascribed to “menopause-effect”, i.e. estrogen deficiency [39]. Our findings suggest that the increased body weight gain observed in triptorelin-treated females may be at least partly attributable to increased food intake.
The altered feeding behaviour of triptorelin-treated females was accompanied by decreased hypothalamic Lepr expression, suggesting reduced hypothalamic leptin responsiveness. This could be attributed to estradiol deficiency, similar to findings from rat ovariectomy models [40,41] and also correlates to increased leptin levels in CPP girls under GnRHa treatment [42,43]. We expected to associate changes in Lepr expression with alterations in the mRNA expression for orexigenic and anorexigenic peptides in the hypothalamus or Tshb in the pituitary gland. However, Pomc and Agrp remain unchanged while Npy mRNA in females shows paradoxical downregulation under triptorelin treatment. Although reduced leptin signaling is often associated with increased NPY activity during negative energy balance, the present findings likely reflect developmental remodeling of hypothalamic circuits during puberty rather than a classical fasting-like response. Interestingly, a recent study finds that in girls with CPP, leuprorelin lowers NPY serum levels although it increases circulating leptin and body fat percentage [43]. The increased hypothalamic Sst expression observed here is consistent with a previous report demonstrating increased GH pulsatility in females following triptorelin treatment [44] which may enhance GH-mediated negative feedback on hypothalamic somatostatin neurons [45]. However, because somatostatin is expressed by several hypothalamic neuronal populations with distinct roles in energy homeostasis [46], increased Sst expression may also contribute, at least in part, to the hyperphagic response observed in females.
As Guarraci et al. [19] already reported, we also observe elevated Kiss1 mRNA levels in the hypothalamus of the triptorelin treated animals. This upregulation is not accompanied by changes in the expression of Pdyn and Tac3, coding for prodynorphin and neurokinin B which are stored within kisspeptin neurons in the arcuate nucleus. Kisspeptin neurons in the arcuate nucleus not only regulate reproduction but participate in circuits governing feeding behavior and energy expenditure. Its effects on feeding depend on developmental stage and hormonal status – namely, kisspeptin-kiss1R system matures during puberty [47]. Even though kisspeptin mode of action is mostly anorexigenic, mediated through inhibition of NPY and stimulation of POMC neuron firing [48], our study suggests that interventions during this developmental window may produce remodeling of hypothalamic feeding circuits. An important limitation of the present study is that gene expression was analyzed in whole hypothalamic tissue rather than in individual hypothalamic nuclei. Consequently, nucleus-specific transcriptional changes may have been underestimated or masked by opposing responses in anatomically distinct neuronal populations.
Unlike females, male rats exhibited no evidence of coordinated transcriptional remodeling of the hypothalamic pathways examined; suggesting that lag in body-weight gain may involve mechanisms other than altered hypothalamic expression of these metabolic regulators. Similarly, prepubertal male rats gained less weight after leuprorelin administration [18]. Nevertheless, we find that this effect is transient, and indeed, longer triptorelin administration seems to result in an increase in weight gain in male rats, as well [44].
In the present study, rats display distinct sex specific pattern of behavior characterized by increased locomotor activity in females compared to males, which is largely in accordance with literature data [49,50]. Our findings suggest subtle alterations in exploratory behavior rather than a robust increase in overall locomotor activity. Triptorelin induced higher average speed in males; although the increase in total distance traveled remained at the level of trend. Whereas increased ambulation has been reported in mice following two weeks of leuprorelin treatment [15], locomotor behavior in our study was evaluated at a later time point after triptorelin administration. It is therefore possible that the behavioral consequences of pubertal GnRHa treatment evolve over time, although differences in species, experimental protocols, and GnRHa formulations may also contribute to the observed discrepancies. While the mechanisms underlying these subtle behavioral outcomes following triptorelin treatment remain to be elucidated, the present findings suggest that suppression of the HPG axis may underlie the altered locomotion patterns, possibly through alterations in energy expenditure and basal metabolism, as reflected in transiently reduced body weight in male rats. Previously, triptorelin treatment has been reported to reduce voluntary wheel-running activity in young rats [51], a behavior that reflects not only motor output but also motivation to engage in rewarding physical activity. These findings imply that GnRHa may differentially influence neural circuits regulating exploratory behavior and voluntary exercise. This interpretation is further supported by evidence that peripubertal but not adult castration increases locomotor behavior in adulthood [52] indicating an organizational role of pubertal testosterone in shaping adult activity patterns. Notably, testosterone deficiency induced by castration during adulthood is not associated with changes in locomotor activity [53], suggesting that early life suppression of gonadal hormones has distinct consequences due to the disruption of pubertal organizational processes, further supporting the importance of carefully interpreting the findings of hormonal manipulation during puberty.
Collectively, these findings indicate that the consequences of GnRHa treatment during puberty cannot be interpreted simply as transient hypogonadism. Instead, suppression of gonadal steroids during this critical developmental window appears to influence the maturation of hypothalamic circuits involved in metabolic regulation, resulting in sex-specific neuroendocrine adaptations.
5. Conclusions
In conclusion, triptorelin effectively suppresses pubertal maturation in both sexes but elicits fundamentally different metabolic adaptations in males and females. Female rats develop hyperphagia, increased body weight, and coordinated changes in hypothalamic Lepr, Npy, and Sst expression, whereas males exhibit transient reduction in body-weight gain and subtle behavioral alterations without comparable changes in the expression of hypothalamic genes examined. These findings suggest that the metabolic consequences of pubertal GnRHa treatment extend beyond reproductive suppression and involve sex-specific reorganization of hypothalamic circuits regulating energy homeostasis. Further studies examining individual hypothalamic nuclei and endocrine pathways, particularly the GH/IGF-1 axis and leptin signaling, will be essential for defining the mechanisms underlying these developmental effects.
Supplementary Materials
The following supporting information can be downloaded at the website of this paper posted on Preprints.org.
Author Contributions
Conceptualization, I.B. and M.J; Methodology, I.B, Z.P. and M.J; Validation, D.S. and A.M.; Formal Analysis, D.S.; Investigation, D.D, A.M, N.B, Z.P. and K.T. Writing – Original Draft Preparation, I.B.; Writing – Review & Editing, D.S, A.M, Z.P, D.D, N.B, K.T. and M.J; Visualization, I.B, D.S. and A.M.
Funding
This research was supported by the Ministry of Science, Technological Development and Innovation of the Republic of Serbia (grant number 451-03-33/2026-03/ 200007).
Institutional Review Board Statement
The animal study protocol was approved by by the National licensing committee at the Department of Animal Welfare, Veterinary Directorate, Ministry of Agriculture, Forestry and Water Management of Republic of Serbia (Permit No 323-07-11135/2022-05) and performed in compliance with the guidelines of the Directive on the protection of animals used for experimental and other scientific purposes (2010/63/EU).
Data Availability Statement
The raw data supporting the conclusions of this article will be made available by the authors on request. The datasets are not publicly available because they contain unpublished data that form part of ongoing research and future planned analyses.
Conflicts of Interest
The authors have no relevant financial or non-financial interests to disclose.:
Acknowledgments
During the preparation of this manuscript, the authors used free versions of ChatGPT and Gemini for the purposes of data analyses. The authors have reviewed and edited the output and take full responsibility for the content of this publication.
Abbreviations
| The following abbreviations are used in this manuscript | . |
| HPG | Hypothalamic-pituitary-gonadal (axis) |
| GnRH | Gonadotropin-Releasing Hormone |
| GnRHR | Gonadotropin-Releasing Hormone Receptor |
| LH | Luteinizing Hormone |
| FSH | Follicle-Stimulating Hormone |
| NPY | Neuropeptide Y |
| AgRP | Agouti-related peptide |
| POMC | Proopiomelanocortin |
| IGF-1 | Insulin-like growth factor 1 |
| GnRHa | Gonadotropin-releasing hormone agonist |
| CPP | Central precoccius puberty |
References
- Ojeda, S.R.; Skinner, M.K. CHAPTER 38 - Puberty in the Rat. In Knobil and Neill's Physiology of Reproduction (Third Edition); Neill, J.D., Ed.; Academic Press: St Louis, 2006; pp. 2061–2126. [Google Scholar]
- Uenoyama, Y.; Inoue, N.; Nakamura, S.; Tsukamura, H. Central Mechanism Controlling Pubertal Onset in Mammals: A Triggering Role of Kisspeptin. Front. Endocrinol. 2019, 10, 312. [Google Scholar] [CrossRef] [PubMed]
- Jimenez-Puyer, M.; Sobrino, V.; Colledge, W.H.; Jones, S.; Tena-Sempere, M. Hypothalamic control of puberty: from neuronal circuits to mechanisms for its metabolic regulation. Rev. Endocr. Metab. Disord. 2025. [Google Scholar] [CrossRef] [PubMed]
- Roa, J.; Herbison, A.E. Direct regulation of GnRH neuron excitability by arcuate nucleus POMC and NPY neuron neuropeptides in female mice. Endocrinology 2012, 153, 5587–5599. [Google Scholar] [CrossRef] [PubMed]
- Belchetz, P.E.; Plant, T.M.; Nakai, Y.; Keogh, E.J.; Knobil, E. Hypophysial responses to continuous and intermittent delivery of hypopthalamic gonadotropin-releasing hormone. Science 1978, 202, 631–633. [Google Scholar] [CrossRef] [PubMed]
- Janjic, M.M.; Prévide, R.M.; Fletcher, P.A.; Sherman, A.; Smiljanic, K.; Abebe, D.; Bjelobaba, I.; Stojilkovic, S.S. Divergent expression patterns of pituitary gonadotropin subunit and GnRH receptor genes to continuous GnRH in vitro and in vivo. Sci. Rep. 2019, 9, 20098. [Google Scholar] [CrossRef] [PubMed]
- Saleh, F.L.; Taylor, H.S. Clinical applications of gonadotropin-releasing hormone analogues: a broad impact on reproductive medicine. F&S Rep. 2023, 4, 83–87. [Google Scholar] [CrossRef] [PubMed]
- Casati, L.; Ciceri, S.; Maggi, R.; Bottai, D. Physiological and pharmacological overview of the gonadotropin releasing hormone. Biochem. Pharmacol. 2023, 212, 115553. [Google Scholar] [CrossRef] [PubMed]
- Popovic, J.; Geffner, M.E.; Rogol, A.D.; Silverman, L.A.; Kaplowitz, P.B.; Mauras, N.; Zeitler, P.; Eugster, E.A.; Klein, K.O. Gonadotropin-releasing hormone analog therapies for children with central precocious puberty in the United States. Front. Pediatr. 2022, 10, 968485. [Google Scholar] [CrossRef] [PubMed]
- Mauras, N.; Ross, J.; Mericq, V. Management of Growth Disorders in Puberty: GH, GnRHa, and Aromatase Inhibitors: A Clinical Review. Endocr. Rev. 2023, 44, 1–13. [Google Scholar] [CrossRef] [PubMed]
- Hembree, W.C.; Cohen-Kettenis, P.T.; Gooren, L.; Hannema, S.E.; Meyer, W.J.; Murad, M.H.; Rosenthal, S.M.; Safer, J.D.; Tangpricha, V.; T'Sjoen, G.G. Endocrine Treatment of Gender-Dysphoric/Gender-Incongruent Persons: An Endocrine Society Clinical Practice Guideline. J. Clin. Endocrinol. Metab. 2017, 102, 3869–3903. [Google Scholar] [CrossRef] [PubMed]
- de Vries, A.L.C.; Hannema, S.E. Growing Evidence and Remaining Questions in Adolescent Transgender Care. N. Engl. J. Med. 2023, 388, 275–277. [Google Scholar] [CrossRef] [PubMed]
- Robilliard, R.; Lee, P.A.; Swartz Topor, L. Diagnosis, Treatment, and Outcomes of Males with Central Precocious Puberty. Endocrinol. Metab. Clin. N. Am. 2024, 53, 239–250. [Google Scholar] [CrossRef] [PubMed]
- Boogers, L.S.; Wiepjes, C.M.; Staphorsius, A.S.; Klink, D.T.; Ciancia, S.; Romani, A.; Stolk, T.H.R.; van den Boogaard, E.; Steensma, T.D.; de Vries, A.L.C.; et al. A European Network for the Investigation of Gender Incongruence in adolescents. J. Sex. Med. 2024, 21, 350–356. [Google Scholar] [CrossRef] [PubMed]
- Anacker, C.; Sydnor, E.; Chen, B.K.; LaGamma, C.C.; McGowan, J.C.; Mastrodonato, A.; Hunsberger, H.C.; Shores, R.; Dixon, R.S.; McEwen, B.S.; et al. Behavioral and neurobiological effects of GnRH agonist treatment in mice-potential implications for puberty suppression in transgender individuals. Neuropsychopharmacol. Off. Publ. Am. Coll. Neuropsychopharmacol. 2021, 46, 882–890. [Google Scholar] [CrossRef] [PubMed]
- Guarraci, F.A.; Avendano, L.; Kelly, M.; Estoesta, C.; Frohock, B.; Candelario, I.; Davis, L.K.; Oevermann, M.; Sencherey, B.; Toro, E.; et al. Daily GnRH agonist treatment effectively delayed puberty in female rats without long-term effects on sexual behavior or estrous cyclicity. Physiol. Behav. 2022, 254, 113879. [Google Scholar] [CrossRef] [PubMed]
- Guarraci, F.A.; Avendano, L.; Kelly, M.; Estoesta, C.; Sencherey, B.; Valdivia, H.S.; Gale, A.; Yepez, L.; Belfield, J.B.; Carter, K.M.; et al. Chronic periadolescent leuprolide exposure affects the development of reproductive physiology and behavior of female and male rats differently, but both mature after treatment termination. Biol. Sex. Differ. 2023, 14, 1. [Google Scholar] [CrossRef] [PubMed]
- Guarraci, F.A.; Davis, L.K.; Henneman, E.L.; Toro, E.; Odell, S.E.; Le, N.; Navarro, J.M.; Valdivia, H.S.; Williams, I.; Credeur, M.; et al. Daily GnRH agonist treatment delays the development of reproductive physiology and behavior in male rats. Horm. Behav. 2021, 132, 104982. [Google Scholar] [CrossRef] [PubMed]
- Guarraci, F.A.; Klepcyk, I.M.; Thompson, L.M.; Streifer, M.; Hilz, E.N.; Hudson, G.; Meerts, S.H.; Gore, A.C. Chronic periadolescent leuprolide exposure affects the expression of multiple genes in the hypothalamus and pituitary gland with a different pattern of expression in female and male Long-Evans rats. Horm. Behav. 2025, 174, 105798. [Google Scholar] [CrossRef] [PubMed]
- Pedersen, T.; Peters, H. Proposal for a classification of oocytes and follicles in the mouse ovary. J. Reprod. Fertil. 1968, 17, 555–557. [Google Scholar] [CrossRef] [PubMed]
- Singh, P.; Krishna, A. Effects of GnRH agonist treatment on steroidogenesis and folliculogenesis in the ovary of cyclic mice. J. Ovarian Res. 2010, 3, 26. [Google Scholar] [CrossRef] [PubMed]
- Dela Cruz, C.; Kinnear, H.M.; Hashim, P.H.; Wandoff, A.; Nimmagadda, L.; Chang, F.L.; Padmanabhan, V.; Shikanov, A.; Moravek, M.B. A mouse model mimicking gender-affirming treatment with pubertal suppression followed by testosterone in transmasculine youth. Hum. Reprod. 2023, 38, 256–265. [Google Scholar] [CrossRef] [PubMed]
- Peirouvi, T.; Salami, S. GnRH agonist induces apoptosis in seminiferous tubules of immature rats: direct gonadal action. Andrologia 2010, 42, 231–235. [Google Scholar] [CrossRef] [PubMed]
- Khadivi, B.; Peirouvi, T.; Javanmard, I.M.; Rasmi, Y. Short-term buserelin administration induces apoptosis and morphological changes in adult rat testes. Acta Cir. Bras. 2017, 32, 140–147. [Google Scholar] [CrossRef] [PubMed]
- Marcos, A.; Rodríguez Del Cerro, M.C.; Fernández, R.M.; Pásaro, E.; Arias-Ramos, N.; López-Larrubia, P.; González-Peramato, P.; Guillamon, A.; De Miguel, M.P. The GnRH Agonist Triptorelin Causes Reversible, Focal, and Partial Testicular Atrophy in Rats, Maintaining Sperm Production. Int. J. Mol. Sci. 2025, 26. [Google Scholar] [CrossRef] [PubMed]
- Xi, L.; Kraskauskas, D.; Muniyan, S.; Batra, S.K.; Kukreja, R.C. Androgen-deprivation therapy with leuprolide increases abdominal adiposity without causing cardiac dysfunction in middle-aged male mice: effect of sildenafil. Am. J. Physiol. Regul. Integr. Comp. Physiol. 2023, 324, R589–r600. [Google Scholar] [CrossRef] [PubMed]
- Becú-Villalobos, D.; Libertun, C. Development of gonadotropin-releasing hormone (GnRH) neuron regulation in the female rat. Cell. Mol. Neurobiol. 1995, 15, 165–176. [Google Scholar] [CrossRef] [PubMed]
- Bjelobaba, I.; Janjic, M.M.; Tavcar, J.S.; Kucka, M.; Tomić, M.; Stojilkovic, S.S. The relationship between basal and regulated Gnrhr expression in rodent pituitary gonadotrophs. Mol. Cell. Endocrinol. 2016, 437, 302–311. [Google Scholar] [CrossRef] [PubMed]
- Ketelslegers, J.M.; Hetzel, W.D.; Sherins, R.J.; Catt, K.J. Developmental changes in testicular gonadotropin receptors: plasma gonadotropins and plasma testosterone in the rat. Endocrinology 1978, 103, 212–222. [Google Scholar] [CrossRef] [PubMed]
- Janjic, M.M.; Stojilkovic, S.S.; Bjelobaba, I. Intrinsic and Regulated Gonadotropin-Releasing Hormone Receptor Gene Transcription in Mammalian Pituitary Gonadotrophs. Front. Endocrinol. 2017, 8, 221. [Google Scholar] [CrossRef] [PubMed]
- Dalkin, A.C.; Knight, C.D.; Shupnik, M.A.; Haisenleder, D.J.; Aloi, J.; Kirk, S.E.; Yasin, M.; Marshall, J.C. Ovariectomy and inhibin immunoneutralization acutely increase follicle-stimulating hormone-beta messenger ribonucleic acid concentrations: evidence for a nontranscriptional mechanism. Endocrinology 1993, 132, 1297–1304. [Google Scholar] [CrossRef] [PubMed]
- Blacker, C.M.; Ataya, K.M.; Savoy-Moore, R.T.; Subramanian, M.G.; Mutchnick, M.G.; Dunbar, J.C. The gonadotropin-releasing hormone agonist leuprolide affects the thymus and other non-reproductive systems of female rats. Acta Endocrinol. 1991, 125, 581–589. [Google Scholar] [CrossRef] [PubMed]
- Hou, L.; Ying, Y.; Wu, W.; Ye, F.; Zhang, C.; Luo, X. The Effect of GnRHa Treatment on Body Mass Index in Central Precocious Puberty: A Systematic Review and Meta-Analysis. Horm. Res. Paediatr. 2024, 97, 419–432. [Google Scholar] [CrossRef] [PubMed]
- Leite, A.L.; Galo, E.; Antunes, A.; Robalo, B.; Amaral, D.; Espada, F.; Castro, S.; Simões Dias, S.; Limbert, C. Do GnRH Agonists Really Increase Body Weight Gain? Evaluation of a Multicentric Portuguese Cohort of Patients With Central Precocious Puberty. Front. Pediatr. 2022, 10, 816635. [Google Scholar] [CrossRef] [PubMed]
- van der Sluis, I.M.; Boot, A.M.; Krenning, E.P.; Drop, S.L.; de Muinck Keizer-Schrama, S.M. Longitudinal follow-up of bone density and body composition in children with precocious or early puberty before, during and after cessation of GnRH agonist therapy. J. Clin. Endocrinol. Metab. 2002, 87, 506–512. [Google Scholar] [CrossRef] [PubMed]
- Arcari, A.J.; Gryngarten, M.G.; Freire, A.V.; Ballerini, M.G.; Ropelato, M.G.; Bergadá, I.; Escobar, M.E. Body mass index in girls with idiopathic central precocious puberty during and after treatment with GnRH analogues. Int. J. Pediatr. Endocrinol. 2016, 2016, 15. [Google Scholar] [CrossRef] [PubMed]
- Figueiredo, F.N.; Ganen, A.d.P.; Figueiredo, C.C.; Evangelista, N.M.d.A.; Fernandes, V.d.F.T.; Pacheco, L.d.A.; Kato, T.; Colares Neto, G.d.P. Impact of dietary patterns on body weight in girls with central precocious puberty treated with leuprolide during the COVID-19 pandemic. Front. Pediatr. 2025, 13–2025. [Google Scholar] [CrossRef] [PubMed]
- Li, X.; Zhang, X.; Shen, Z.; Chen, Z.; Wang, H.; Zhang, X. GnRH receptor mediates lipid storage in female adipocytes via AMPK pathway. Int. J. Med. Sci. 2022, 19, 1442–1450. [Google Scholar] [CrossRef] [PubMed]
- Chiocca, E.; Dati, E.; Baroncelli, G.I.; Mora, S.; Parrini, D.; Erba, P.; Bertelloni, S. Body mass index and body composition in adolescents treated with gonadotropin-releasing hormone analogue triptorelin depot for central precocious puberty: data at near final height. Neuroendocrinology 2009, 89, 441–447. [Google Scholar] [CrossRef] [PubMed]
- Kimura, M.; Irahara, M.; Yasui, T.; Saito, S.; Tezuka, M.; Yamano, S.; Kamada, M.; Aono, T. The obesity in bilateral ovariectomized rats is related to a decrease in the expression of leptin receptors in the brain. Biochem. Biophys. Res. Commun. 2002, 290, 1349–1353. [Google Scholar] [CrossRef] [PubMed]
- Meli, R.; Pacilio, M.; Raso, G.M.; Esposito, E.; Coppola, A.; Nasti, A.; Di Carlo, C.; Nappi, C.; Di Carlo, R. Estrogen and raloxifene modulate leptin and its receptor in hypothalamus and adipose tissue from ovariectomized rats. Endocrinology 2004, 145, 3115–3121. [Google Scholar] [CrossRef] [PubMed]
- Wijarn, P.; Poomthavorn, P.; Khlairit, P.; Pongratanakul, S.; Chailurkit, L.; Mahachoklertwattana, P. Short-term effects of gonadotropin-releasing hormone analogue treatment on leptin, ghrelin and peptide YY in girls with central precocious puberty. J. Pediatr. Endocrinol. Metab. JPEM 2021, 34, 479–484. [Google Scholar] [CrossRef] [PubMed]
- Tarçin, G.; Bayramoğlu, E.; Güneş Kaya, D.; Karakaş, H.; Demirbaş, K.C.; Turan, H.; Evliyaoğlu, O. The role of body composition and appetite-regulating hormones in idiopathic central precocious puberty and their changes during GnRH analog therapy. J. Endocrinol. Investig. 2025, 48, 145–152. [Google Scholar] [CrossRef] [PubMed]
- Gevers, E.F.; Wit, J.-M.; Robinson, I.C.A.F. Effects of Long-Term Gonadotropin-Releasing Hormone Analog Treatment on Growth, Growth Hormone (GH) Secretion, GH Receptors, and GH-Binding Protein in the Rat. Pediatr. Res. 1998, 43, 111–120. [Google Scholar] [CrossRef] [PubMed]
- Hurley, D.L.; Bartke, A.; Wagner, T.E.; Wee, B.E.; Phelps, C.J. Increased hypothalamic somatostatin expression in mice transgenic for bovine or human GH. J. Neuroendocrinol. 1994, 6, 539–548. [Google Scholar] [CrossRef] [PubMed]
- Stengel, A.; Taché, Y. Central somatostatin signaling and regulation of food intake. Ann. N. Y. Acad. Sci. 2019, 1455, 98–104. [Google Scholar] [CrossRef] [PubMed]
- Semaan, S.J.; Tolson, K.P.; Kauffman, A.S. The development of kisspeptin circuits in the Mammalian brain. Adv. Exp. Med. Biol. 2013, 784, 221–252. [Google Scholar] [CrossRef] [PubMed]
- Hudson, A.D.; Kauffman, A.S. Metabolic actions of kisspeptin signaling: Effects on body weight, energy expenditure, and feeding. Pharmacol. Ther. 2022, 231, 107974. [Google Scholar] [CrossRef] [PubMed]
- van Hest, A.; van Haaren, F.; van de Poll, N.E. Behavioral differences between male and female Wistar rats on DRL schedules: effect of stimuli promoting collateral activities. Physiol. Behav. 1987, 39, 255–261. [Google Scholar] [CrossRef] [PubMed]
- Knight, P.; Chellian, R.; Wilson, R.; Behnood-Rod, A.; Panunzio, S.; Bruijnzeel, A.W. Sex differences in the elevated plus-maze test and large open field test in adult Wistar rats. Pharmacol. Biochem. Behav. 2021, 204, 173168. [Google Scholar] [CrossRef] [PubMed]
- Jones, B.C.H.; David, S. Effects of Puberty Blocker Treatment on Voluntary Wheel Running Activity in Young Rats. Int. J. Sport Exerc. Health Res. 2023, 7, 83–89. [Google Scholar] [CrossRef]
- Brand, T.; Slob, A.K. Peripubertal castration of male rats, adult open field ambulation and partner preference behavior. Behav. Brain Res. 1988, 30, 111–117. [Google Scholar] [CrossRef] [PubMed]
- Slob, A.K.; Bogers, H.; van Stolk, M.A. Effects of gonadectomy and exogenous gonadal steroids on sex differences in open field behaviour of adult rats. Behav. Brain Res. 1981, 2, 347–362. [Google Scholar] [CrossRef] [PubMed]
Figure 1.
Triptorelin depo induced changes in gonads in both sexes after 28 days. (A, up) Representative images of ovaries and uterus in control (C) and triptorelin treated (T) animals. (A, down) Representative images of testicles in control and triptorelin treated males. (B) Mass of ovaries relative to body mass in mg/g (mean ± SEM, n ≥ 6 /group). (C) Mass of testicles relative to body mass in mg/g (mean ± SEM, n ≥ 6 /group). (D) Represetative graphical representation of the estrous cycle in a triptorelin treated female, arrested in diestrus (red circles), and a normally-cycling control female (black circles) (M-metestrus, D-diestrus, P-proestrus, E-estrus). (E) Representative H&E stained sections of ovaries from C and T group. (F) Number of large follicles per ovary was significantly lower in T group (mean ± SEM, counted from 70 µm apart slices throughout the whole ovary, from n = 6 ovaries/group) (G). Number of big CL was also significantly lower in T group (mean ± SEM, counted the same as follicles, n = 6 ovaries/group). (H) Representative H&E stained testicular sections from C and T group. Seminiferous tubules in T group showed various signs of degeneration, such as thinning of the tubule walls (arrowhead) and complete tubule degeneration with absence of spermatocytes (asterisk). Tubules without signs of degeneration were also observed (arrow). (I) Diameter of seminiferous tubules (in µm, measured from at least five micrographs per testis and presented as mean ± SEM, from n = 6 animals/group). (J) The number of spermatozoa per cauda epididymis (mean ± SEM, from n ≥ 6 animals/group). **p < 0.01, ***p < 0.005; Welch’s t-test. Scale bars: 1 cm in A, 1 mm in D, 200 µm in H.
Figure 1.
Triptorelin depo induced changes in gonads in both sexes after 28 days. (A, up) Representative images of ovaries and uterus in control (C) and triptorelin treated (T) animals. (A, down) Representative images of testicles in control and triptorelin treated males. (B) Mass of ovaries relative to body mass in mg/g (mean ± SEM, n ≥ 6 /group). (C) Mass of testicles relative to body mass in mg/g (mean ± SEM, n ≥ 6 /group). (D) Represetative graphical representation of the estrous cycle in a triptorelin treated female, arrested in diestrus (red circles), and a normally-cycling control female (black circles) (M-metestrus, D-diestrus, P-proestrus, E-estrus). (E) Representative H&E stained sections of ovaries from C and T group. (F) Number of large follicles per ovary was significantly lower in T group (mean ± SEM, counted from 70 µm apart slices throughout the whole ovary, from n = 6 ovaries/group) (G). Number of big CL was also significantly lower in T group (mean ± SEM, counted the same as follicles, n = 6 ovaries/group). (H) Representative H&E stained testicular sections from C and T group. Seminiferous tubules in T group showed various signs of degeneration, such as thinning of the tubule walls (arrowhead) and complete tubule degeneration with absence of spermatocytes (asterisk). Tubules without signs of degeneration were also observed (arrow). (I) Diameter of seminiferous tubules (in µm, measured from at least five micrographs per testis and presented as mean ± SEM, from n = 6 animals/group). (J) The number of spermatozoa per cauda epididymis (mean ± SEM, from n ≥ 6 animals/group). **p < 0.01, ***p < 0.005; Welch’s t-test. Scale bars: 1 cm in A, 1 mm in D, 200 µm in H.
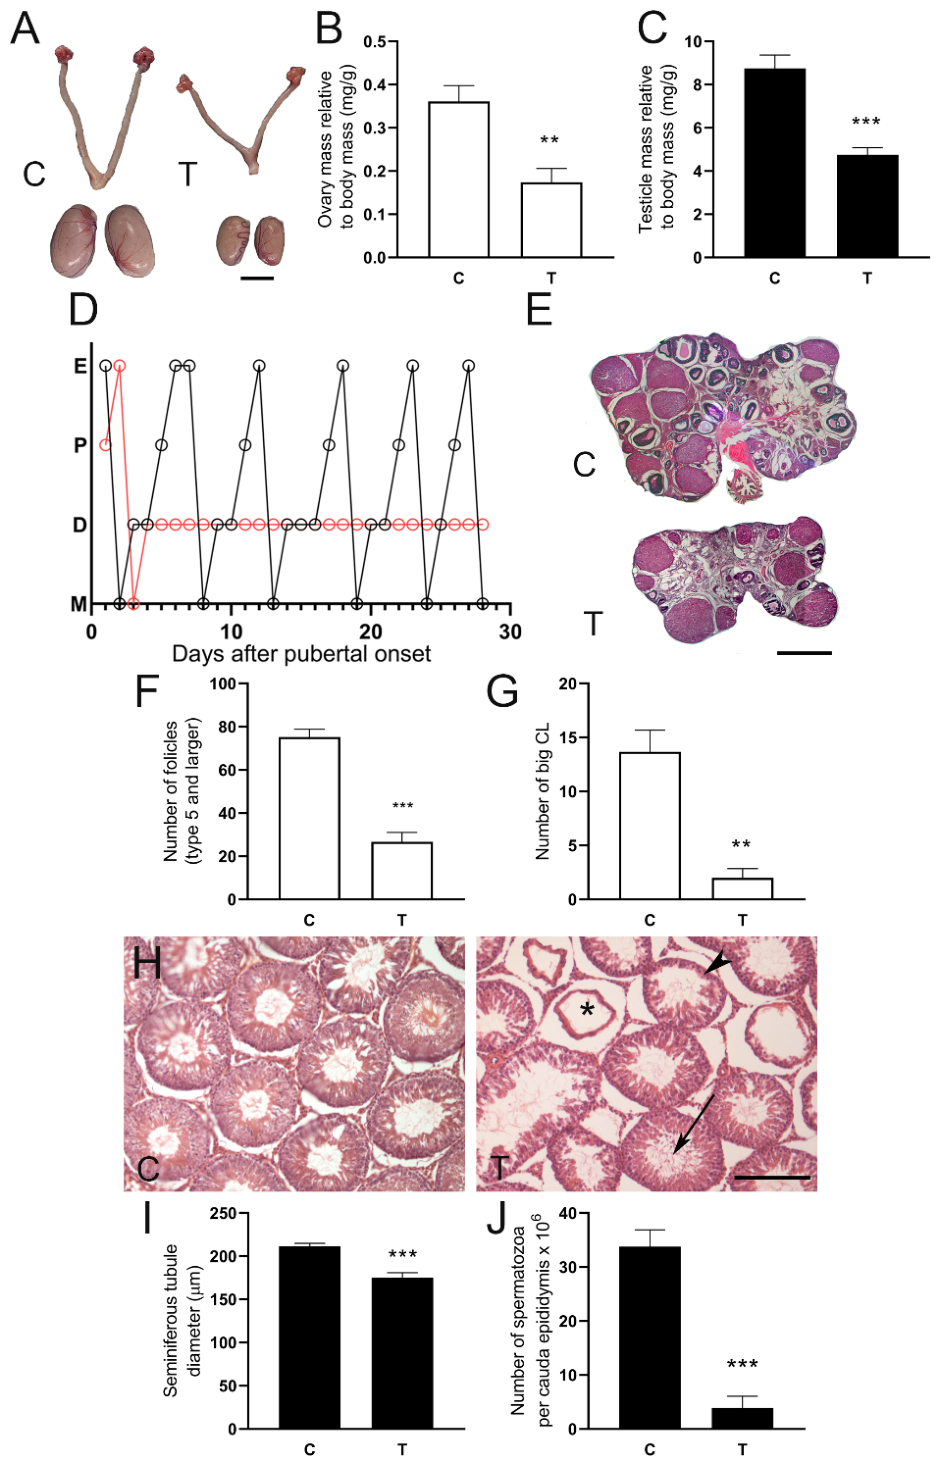
Figure 2.
Heatmap of pituitary gene expression. Heatmap showing relative expression levels of selected genes (Fshb, Lhb, Gnrhr, Pomc, Prl, Cga, and Tshb) in pituitary samples from control and triptorelin-treated male and female animals. Gene expression values were log₂-transformed and standardized as z-scores per gene to allow comparison across samples. Rows represent individual genes, while columns represent individual samples (n = 25). Samples are annotated by sex (female: orange, male: blue) and treatment (control: grey, triptorelin: green). Hierarchical clustering was performed using euclidean distance and ward.D2. The color scale was mapped from dark blue (downregulation) through white to red (upregulation). Clustering patterns suggest that samples group primarily according to treatment, with additional separation by sex. Experimental group abbreviations: Cf = Female Control; Tf = Female Triptorelin; Cm = Male Control; Tm = Male Triptorelin. Numbers denote individual animals within each group.
Figure 2.
Heatmap of pituitary gene expression. Heatmap showing relative expression levels of selected genes (Fshb, Lhb, Gnrhr, Pomc, Prl, Cga, and Tshb) in pituitary samples from control and triptorelin-treated male and female animals. Gene expression values were log₂-transformed and standardized as z-scores per gene to allow comparison across samples. Rows represent individual genes, while columns represent individual samples (n = 25). Samples are annotated by sex (female: orange, male: blue) and treatment (control: grey, triptorelin: green). Hierarchical clustering was performed using euclidean distance and ward.D2. The color scale was mapped from dark blue (downregulation) through white to red (upregulation). Clustering patterns suggest that samples group primarily according to treatment, with additional separation by sex. Experimental group abbreviations: Cf = Female Control; Tf = Female Triptorelin; Cm = Male Control; Tm = Male Triptorelin. Numbers denote individual animals within each group.
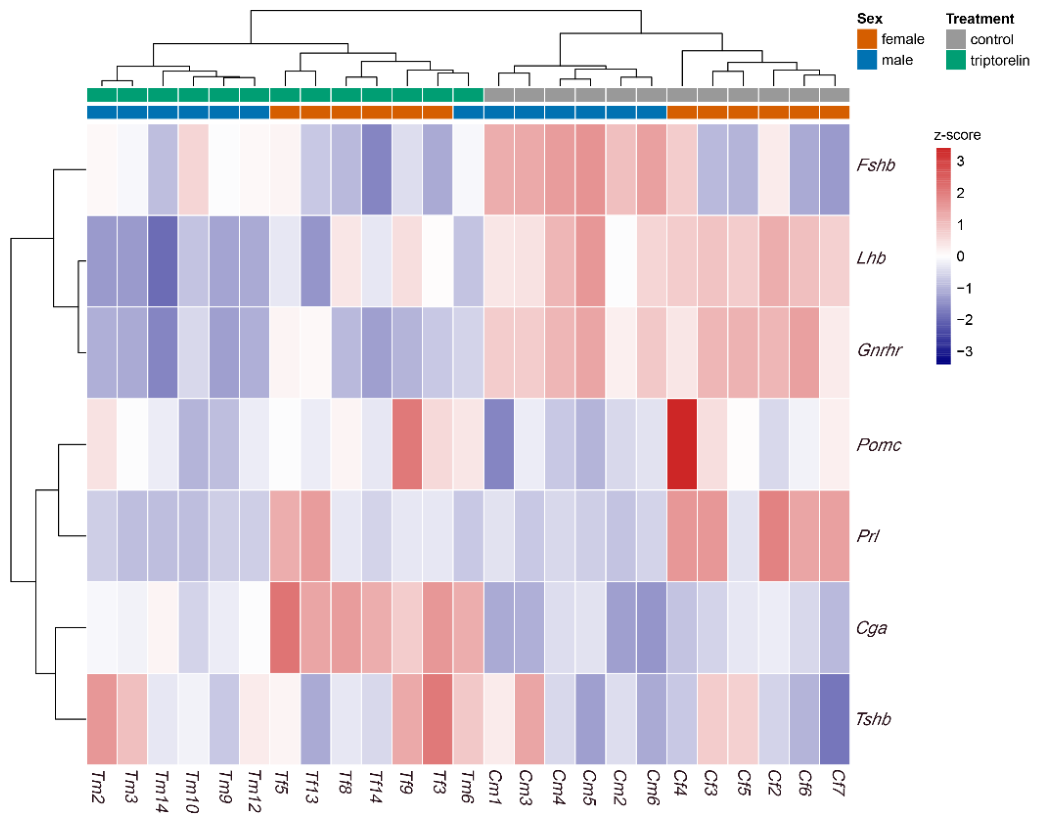
Figure 3.
Sex-specific effects of triptorelin on body weight over time. Body weight of male and female rats treated with triptorelin or vehicle was monitored over 28 days. A linear mixed model revealed a significant sex × treatment × day interaction. Post-hoc analysis (Šidák correction) showed that triptorelin significantly reduced body weight gain in males between days 12–19 and increased body mass in females between days 18–28 (*p < 0.05 vs. control at corresponding time points). Data are presented as mean ± SEM (n = 7 per group).
Figure 3.
Sex-specific effects of triptorelin on body weight over time. Body weight of male and female rats treated with triptorelin or vehicle was monitored over 28 days. A linear mixed model revealed a significant sex × treatment × day interaction. Post-hoc analysis (Šidák correction) showed that triptorelin significantly reduced body weight gain in males between days 12–19 and increased body mass in females between days 18–28 (*p < 0.05 vs. control at corresponding time points). Data are presented as mean ± SEM (n = 7 per group).
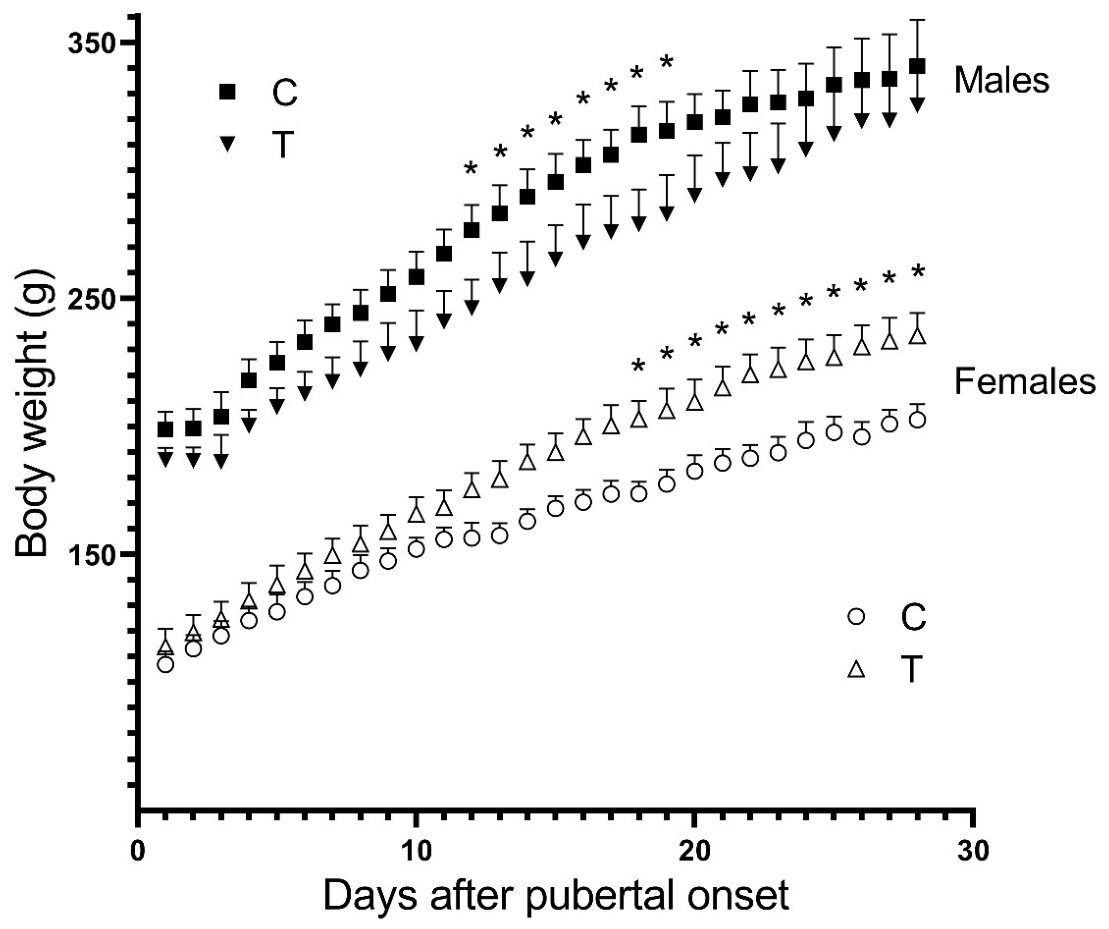
Figure 4.
Food intake and locomotor activity under triptorelin treatment. (A) Average food intake per cage for female (left) and male (right) animals. Food intake was significantly higher for female T group at days 24 and 28. *p < 0.05 vs. control at corresponding time points. Open circles, control females; open triangles, treated females; black squares, control males; closed triangles, treated males. Food intake in males was not different between C and T group. (B) Total distance traveled in the open field arena during 30 minutes for females (open bars) and males (black bars). (C) Triptorelin significantly increased average velocity in males but not in females. Open circles, control females; open triangles, treated females; black squares, control males; closed triangles, treated males. *p < 0.05; **p < 0.01; *** p <0.001.Data are presented as mean ± SEM (n = 9 animals (3 cages) per group).
Figure 4.
Food intake and locomotor activity under triptorelin treatment. (A) Average food intake per cage for female (left) and male (right) animals. Food intake was significantly higher for female T group at days 24 and 28. *p < 0.05 vs. control at corresponding time points. Open circles, control females; open triangles, treated females; black squares, control males; closed triangles, treated males. Food intake in males was not different between C and T group. (B) Total distance traveled in the open field arena during 30 minutes for females (open bars) and males (black bars). (C) Triptorelin significantly increased average velocity in males but not in females. Open circles, control females; open triangles, treated females; black squares, control males; closed triangles, treated males. *p < 0.05; **p < 0.01; *** p <0.001.Data are presented as mean ± SEM (n = 9 animals (3 cages) per group).
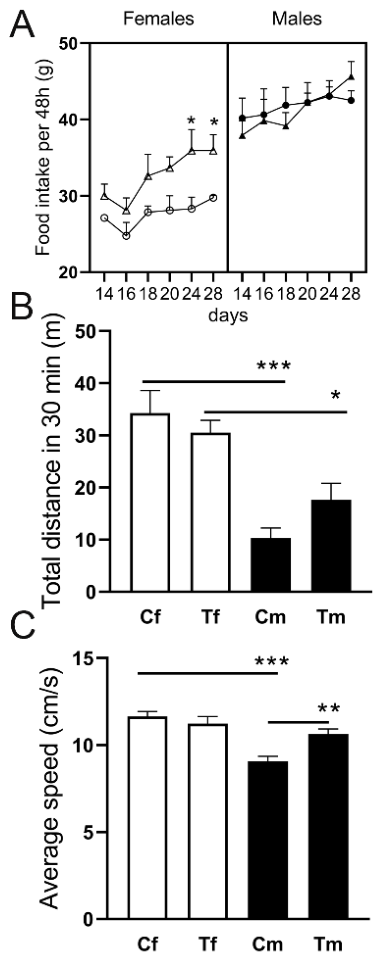
Figure 5.
Heatmap of hypothalamic gene expression. Heatmap showing relative expression levels of selected genes (Sst, Agrp, Npy, Lepr, Pdyn, Tac3, Gnrh1, Kiss1, Esr1, and Pomc) in hypothalamic samples from control and triptorelin-treated male and female animals. Gene expression values were log₂-transformed and standardized as Z-scores per gene to allow comparison across samples. Rows represent individual genes, while columns represent individual samples (n = 23). Samples are annotated by sex (female: orange, male: blue) and treatment (control: grey, triptorelin: green). Hierarchical clustering was performed using euclidean distance and ward.D2. Color scale: dark blue – downregulation; white – no change; red – upregulation. Experimental group abbreviations: Cf = Female Control; Tf = Female Triptorelin; Cm = Male Control; Tm = Male Triptorelin. Numbers denote individual animalss within each group.
Figure 5.
Heatmap of hypothalamic gene expression. Heatmap showing relative expression levels of selected genes (Sst, Agrp, Npy, Lepr, Pdyn, Tac3, Gnrh1, Kiss1, Esr1, and Pomc) in hypothalamic samples from control and triptorelin-treated male and female animals. Gene expression values were log₂-transformed and standardized as Z-scores per gene to allow comparison across samples. Rows represent individual genes, while columns represent individual samples (n = 23). Samples are annotated by sex (female: orange, male: blue) and treatment (control: grey, triptorelin: green). Hierarchical clustering was performed using euclidean distance and ward.D2. Color scale: dark blue – downregulation; white – no change; red – upregulation. Experimental group abbreviations: Cf = Female Control; Tf = Female Triptorelin; Cm = Male Control; Tm = Male Triptorelin. Numbers denote individual animalss within each group.
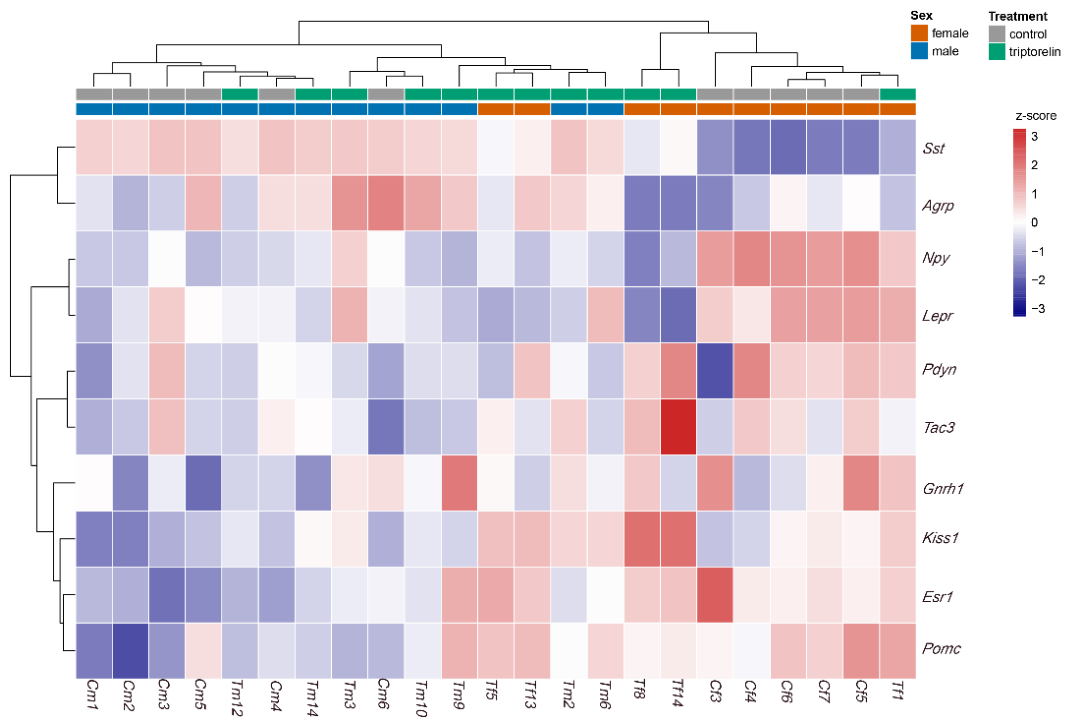

Table 1.
Primer sequences.
| Name | Accession number | Forward primer sequence | Reverse primer sequence |
|---|---|---|---|
| Gapdh | NM_017008.4 | CAACTCCCTCAAGATTGTCAGCAA | GGCATGGACTGTGGTCATGA |
| Gnrh1 | NM_012767.2 | AGGAGGATCAAATGGCAGAAC | TCTTCAATCAGACGTTCCAGAGC |
| Kiss1 | NM_181692.2 | TCCTCTGTGTGGCCTCTTTT | AGGCTTGCTCTCTGCATACC |
| Npy | NM_012614.2 | TACTACTCCGCTCTGCGACA | GGGCATTTTCTGTGCTTTCT |
| Sst | NM_012659.2 | GATAGCGGCTGAAGGAGACG | CAAAGCCAGGACGATGCAGA |
| Lepr | NM_001429462.1 | GGGACATAGAGTGCTGGATGA | GGTGAACCTTAGAGTCATAATTCTTG |
| Agrp | NM_033650.1 | TGTGTAAGGCTGCACGAGTC | AGTACCTAGCTTGCGGCAGT |
| Pomc | NM_139326.3 | AGAACGCCATCATCAAGAACG | AGGTCAGGTGCTCTCGCC |
| Tshb | NM_013116.2 | ACAGAACGGTGGAAATACCG | GTTGGTTTTGACAGCCTCGT |
| Esr1 | NM_012689.2 | GCGCAAGTGTTACGAAGTGG | AGTGCCCATTTCATTTCGGC |
Table 2.
Taqman probes.
| Name | Probe identification number |
|---|---|
| Gapdh | Rn01462661_g1 |
| Cga | Rn01440184_m1 |
| Lhb | Rn00563443_g1 |
| Fshb | Rn01484594_m1 |
| Gnrhr | Rn00563377_m1 |
| Prl | Rn00561791_m1 |
| Pdyn | Rn00571351_m1 |
| Tac3 | Rn00569758_m1 |
Table 3.
Statistical summary of two-way ANOVA for pituitary gene expression.
| Gene | Factor | Sum of Squares | df (num, den) | F-value | q-value |
|---|---|---|---|---|---|
| Lhb | sex | 2.77 | 1, 21 | 9.76 | 0.009 |
| treatment | 15.74 | 1, 21 | 55.41 | <0.001 | |
| sex:treatment | 1.17 | 1, 21 | 4.12 | 0.130 | |
| Fshb | sex | 19.71 | 1, 21 | 32.61 | <0.001 |
| treatment | 7.70 | 1, 21 | 12.75 | 0.003 | |
| sex:treatment | 3.80 | 1, 21 | 6.28 | 0.072 | |
| Gnrhr | sex | 0.29 | 1, 21 | 1.85 | 0.220 |
| treatment | 13.22 | 1, 21 | 85.49 | <0.001 | |
| sex:treatment | 0.14 | 1, 21 | 0.91 | 0.409 | |
| Cga | sex | 2.65 | 1, 21 | 25.15 | <0.001 |
| treatment | 7.40 | 1, 21 | 70.21 | <0.001 | |
| sex:treatment | 0.87 | 1, 21 | 8.22 | 0.065 | |
| Tshb | sex | 0.02 | 1, 21 | 0.11 | 0.745 |
| treatment | 0.42 | 1, 21 | 2.79 | 0.128 | |
| sex:treatment | 0.002 | 1, 21 | 0.02 | 0.905 | |
| Pomc | sex | 1.84 | 1, 21 | 6.93 | 0.022 |
| treatment | 0.05 | 1, 21 | 0.17 | 0.686 | |
| sex:treatment | 0.25 | 1, 21 | 0.96 | 0.409 | |
| Prl | sex | 30.99 | 1, 21 | 33.20 | <0.001 |
| treatment | 5.57 | 1, 21 | 5.96 | 0.033 | |
| sex:treatment | 3.23 | 1, 21 | 3.46 | 0.134 |
The table shows the results of a two-way ANOVA (Type III Sum of Squares) assessing the effects of sex, triptorelin treatment, and their interaction on the mRNA expression of target genes. For each gene, the Sum of Squares, degrees of freedom (df), numerator, denominator (num, den), F-statistics (F-value), and Benjamini–Hochberg adjusted p-values (q-values) are reported. Statistical significance was defined as q < 0.05 and indicated in bold.
Table 4.
Statistical summary of two-way ANOVA for gene expression in the hypothalamus.
| Gene | Factor | Sum of Squares | df (num, den) | F-value | q-value |
|---|---|---|---|---|---|
| Sst | sex | 37.08 | 1, 19 | 243.58 | <0.001 |
| treatment | 6.07 | 1, 19 | 39.85 | <0.001 | |
| sex:treatment | 8.32 | 1, 19 | 54.65 | <0.001 | |
| Npy | sex | 2.73 | 1, 19 | 18.08 | 0.001 |
| treatment | 2.94 | 1, 19 | 19.45 | 0.001 | |
| sex:treatment | 3.50 | 1, 19 | 23.13 | 0.001 | |
| Lepr | sex | 0.07 | 1, 19 | 0.39 | 0.542 |
| treatment | 1.32 | 1, 19 | 7.34 | 0.035 | |
| sex:treatment | 1.65 | 1, 19 | 9.16 | 0.023 | |
| Kiss1 | sex | 10.20 | 1, 19 | 28.69 | <0.001 |
| treatment | 14.46 | 1, 19 | 40.67 | <0.001 | |
| sex:treatment | 0.20 | 1, 19 | 0.57 | 0.576 | |
| Pdyn | sex | 0.77 | 1, 18 | 5.32 | 0.044 |
| treatment | 0.02 | 1, 18 | 0.14 | 0.791 | |
| sex:treatment | 0.02 | 1, 18 | 0.11 | 0.748 | |
| Tac3 | sex | 0.26 | 1, 19 | 5.15 | 0.044 |
| treatment | 0.04 | 1, 19 | 0.88 | 0.514 | |
| sex:treatment | 0.02 | 1, 19 | 0.31 | 0.649 | |
| Esr1 | sex | 1.59 | 1, 19 | 27.48 | <0.001 |
| treatment | 0.23 | 1, 19 | 3.89 | 0.126 | |
| sex:treatment | 0.11 | 1, 19 | 1.84 | 0.386 | |
| Pomc | sex | 2.05 | 1, 19 | 15.52 | 0.002 |
| treatment | 0.32 | 1, 19 | 2.43 | 0.226 | |
| sex:treatment | 0.20 | 1, 19 | 1.53 | 0.386 | |
| Agrp | sex | 1.31 | 1, 18 | 6.61 | 0.032 |
| treatment | 0.004 | 1, 18 | 0.02 | 0.885 | |
| sex:treatment | 0.12 | 1, 18 | 0.62 | 0.576 | |
| Gnrh1 | sex | 0.29 | 1, 19 | 1.78 | 0.220 |
| treatment | 0.03 | 1, 19 | 0.16 | 0.791 | |
| sex:treatment | 0.26 | 1, 19 | 1.61 | 0.386 |
The table shows the results of a two-way ANOVA (Type III Sum of Squares) assessing the effects of sex, triptorelin treatment, and their interaction on the mRNA expression of target genes in the hypothalamus. For each gene, the Sum of Squares, degrees of freedom (df), numerator, denominator (num, den), F-statistics (F-value), and Benjamini–Hochberg adjusted p-values (q-values) are reported. Statistical significance was defined as q < 0.05 and indicated in bold.
Disclaimer/Publisher’s Note: The statements, opinions and data contained in all publications are solely those of the individual author(s) and contributor(s) and not of MDPI and/or the editor(s). MDPI and/or the editor(s) disclaim responsibility for any injury to people or property resulting from any ideas, methods, instructions or products referred to in the content. |
© 2026 by the authors. Licensee MDPI, Basel, Switzerland. This article is an open access article distributed under the terms and conditions of the Creative Commons Attribution (CC BY) license (http://creativecommons.org/licenses/by/4.0/).
Copyright: This open access article is published under a Creative Commons CC BY 4.0 license, which permit the free download, distribution, and reuse, provided that the author and preprint are cited in any reuse.