

Submitted:
24 July 2026
Posted:
24 July 2026
You are already at the latest version
Abstract
The phase-pure syntheses of Fe(dca)₂ and Fe(dca)₂(NH₃)₂ have enabled comprehensive investigation of their structural and magnetic properties. Fe(dca)₂ crystallizes in the orthorhombic space group Pnnm, with Fe²⁺ ions octahedrally coordinated by six dca ligands, forming a rutile-like 3D network. Temperature-dependent structural analysis reveals minor distortions and a slight unit cell volume contraction (~2.5 ų) from 300 K to 25 K. Fe(dca)₂(NH₃)₂ crystallizes in the monoclinic space group P2₁/c, featuring two axial ammonia ligands and dca-bridged Fe²⁺ ions forming layers. Magnetic susceptibility measurements of Fe(dca)₂ reveal a ferrimagnetic transition at TC = 19.1 K, con-firmed by SQUID data, Mößbauer spectroscopic measurements and low-temperature neutron diffraction. A magnetic hysteresis at 5 K indicates long-range cooperative magnetic ordering. ATR-IR spectroscopic measurements support the structural models and confirm the chemical composition of both compounds. TGA shows the thermal decomposition of Fe(dca)₂.
Keywords:
crystal structure
; iron
; dicyanamide
; ammonia
; magnetism
; X-ray diffraction
; neutron powder diffraction
1. Introduction
The identification of molecular and solid-state structures has long been a central objective in chemistry and materials science, as structural elucidation is closely linked to the understanding and control of the physical and chemical properties of compounds. Such knowledge not only enables the rational tuning of material behavior but also provides the foundation for the design and development of tailored compounds with desired functionalities. While there is a large variety of well-known compounds containing oxides, compounds comprising nitrogen are comparably less studied. Beside the pseudo-chalcogenide cyanamide/carbodiimide moiety (NCN)2− [1,2,3,4,5,6,7,8,9,10] and the guanidine moiety (CN3H5) [11,12], the pseudo halide dicyanamide ((N(CN)2) −, dca) has been studied in the recent past. The boomerang-shaped dicyanamide unit has up to four coordination sites attributable to the free electron pairs at the μ1-, μ3-, and μ5-positions. Several dicyanamide-containing compounds are known, whose structure, physical and chemical properties have been investigated, for example, the 3d metal bisdicyanamides M(dca)2 with M = Mn, Co, Ni, Cu, Zn [13,14,15,16,17,18,19,20,21].
One of the pure 3d metal bisdicyanamides, M(dca)2 with M = Fe, has already been investigated regarding its properties [15,16,17,19]. So far, its structure could not be conclusively determined, since a phase-pure synthesis has proven difficult [13,14,18]. In this work, we will summarize previous findings on Fe(C5H5N)2 and additionally provide a structural characterization conducting further analyses of the physical and chemical properties. Additionally, we synthesize and characterize Fe(NH3)2(dca)2, which is a compound of the ML2(dca)2-type that has been already studied using different metals M and ligands L, for example, Fe(C5H5N)2(dca)2 [22] or M(NH3)2(dca)2 with M = Co, Ni [23], Cu [24]. While M(dca)2-type compounds show a 3D structure, ML2(dca)2-type compounds are characterized by a layered structure. These layers are connected by π-stacking [22] or hydrogen bonds [23,24]. While the pure dicyanamides (without additional ligands) show cooperative magnetism at low temperatures [13,14,18], the compounds incorporating additional ligands are paramagnetic over the entire temperature range.
2. Results
In the following sections, we present the physical and chemical properties of Fe(N(CN)₂)₂ (1) and Fe(NH₃)₂(N(CN)₂)₂ (2), which we analyzed using X-ray and neutron diffraction, magnetic measurements (SQUID data), Mößbauer spectroscopy, thermogravimetric analysis (TGA), and Infrared spectroscopy (ATR-IR).
2.1. Structural Description and Discussion
The structural data for 1 was derived from the X-ray powder diffraction at 300 K and the neutron powder (NP) diffraction at 25 K (Figure 1). The magnetic structure is discussed in the magnetic measurements section based on the neutron powder data at 10 K, since the magnetic phase-change temperature is at T = 19 K.
In the temperature range from 300 to 25 K, the compound crystallizes in the orthorhombic crystal system with space group Pnnm (no. 58), and is therefore isostructural to known transition metal bisdicyanamides [13,15,16,17,18,20,21]. At 25 K, the lattice parameters are a = 6.0476(3) Å, b = 7.1029(2) Å, c = 7.4385(2) Å, V = 319.52(2) Å3, and at 300 K, they are a = 6.0728(3) Å, b = 7.1532(3) Å, c = 7.4132(4) Å, V = 322.03(3) Å3 with Z = 2. The lattice parameters are also summed up in Tables A1–A3. Six dca units surround each Fe2+ ion: four are equatorially coordinated at either their μ1 or μ5 position forming chains made of Fe2+ ions connected via two dca units. The other two dca moieties are in trans position and are coordinated at the μ3 position. Since such a dca moiety is basically part of another, yet similar chain that is, however, shifted and rotated corresponding to the bridging positions, the structure of 1 is a rutile-like 3D network. The coordination sphere of iron in 1 arising from the NP diffraction data refinement at T = 25 K is shown in Figure 2. At 25 K, the distances between the nitrogen and iron atoms are d(N1–Fe) = 2.1316(19) Å and d(N2–Fe) = 2.197(3) Å leading to an almost perfect octahedron with the nitrogen atoms at the corner and the iron cations at the center. At 300 K, the distance between N2 and Fe increases (d(N2–Fe) = 2.225(8) Å), while the distance between N1 and Fe decreases (d(N1–Fe) = 2.095(5) Å). Thus, the octahedron is distinctly distorted in the a/c–direction (N1-Fe-N1-direction), which is also apparent from the lattice parameters.
The lattice parameter c increases with decreasing temperature, while the lattice parameters a and, in particular, b decrease, resulting in an overall volume shrinkage of approximately 2.5 Å3 (V300 K-25 K = 0.8%). This volume contraction is comparatively small relative to that observed for the isostructural compound cobalt bisdicyanamide for which the volume decreases by about 3 Å3 within a temperature range of only 170 K, which means over a range approximately 100 K smaller than for 1. In contrast, Zn(dca)2 exhibits a significantly larger volume decrease of approximately 14 Å3 between 293 and 123 K. Furthermore, Ni(dca)2 and Mn(dca)2 show an increase in the lattice parameters a and c upon cooling. The origin of these differing thermal expansion behaviors among the binary 3d bisdicyanamides remains unclear, particularly because compounds containing nickel, manganese, and iron exhibit increasing lattice parameters with decreasing temperature, whereas the cobalt and zinc analogs do not.
A comparison of the lattice parameters of the compounds at room temperature reveals a clear trend: as the atomic number of the 3d metals increases, the lattice parameters a, b and c decrease along with the ionic radii r (Figure 3). Thus, this observation is in accordance with chemical intuition, and compound 1 conforms to this trend. The only exception in this series is the zinc phase whose lattice parameters are significantly larger than those of the other 3d metals. The full 3d shell (4s0 3d10) of a Zn2+ ion could cause a significant increase in the lattice parameters.
The crystal structure of 2 (Figure 2, right) was determined at 300 K using X-ray powder diffraction (Figure 4, right). The compound crystallizes in the monoclinic space group P21/c (no. 14) with the lattice parameters a = 5.943(2) Å, b = 10.8241(4) Å, c = 6.8887(3) Å, β = 97.6035(16)°, V = 439.27(3) Å3 and Z = 2. Similar to 1, 2 comprises four equatorially coordinated dca units at either their μ1 or μ5 position. However, they form chains by connecting Fe2+ ions via a single dca unit. Because each μ1 and μ5 position of a dca unit links different iron atoms, layers are formed. Additionally, each Fe2+ ion is coordinated at the trans positions by two ammonia groups (at the lone pairs of the nitrogen atoms) yielding a nearly perfect octahedral coordination with six nitrogen atoms coordinating the iron. The hydrogen atoms of the ammonia groups form hydrogen bonds with the layers above and below, bonding in particular to the lone pairs of the nitrogen atoms of the dca units. The distances between the nitrogen atoms of the dca units and the Fe2+ cations are d(Ndca–Fe) = 2.1194(5) Å and between the ammonia nitrogen atoms and the Fe2+ cations d(NNH3–Fe) = 2.1500(5) Å. Further compounds are reported in literature that contain central transition metal atoms coordinated by dicyanamide and ammonia ligands [23,24].
For example, the herein reported compound 2 shows similar features as Co(dca)2(NH3)2 [23] and they both were measured at T = 300 K. Comparing the lattice parameters of both substances, all lattice parameters are larger in case of the compound with cobalt as the central atom. The deviations of a, b, and β are less than 1 %, while the deviation of c is 1.5 %. Accordingly, the volumes of the two unit cells differ by 4 %. Regarding the radii of the doubly positive transition metals, the trend of the lattice parameters is reversed: The radius of Co2+ is r(Co2+) = 0.56 Å while that of Fe2+ is r(Fe) = 0.63 Å corresponding to a difference between the radii of 11%.
To determine the hydrogen positions and anisotropic displacement parameters of 2, the neutron diffraction data was refined using the crystal structure determined from X-ray diffraction at 300 K as the starting model (Figure 4, left). While the reflections at small d-spacings being the important ones for the refinement of anisotropic displacement parameters were reproduced satisfactorily, significant discrepancies were observed at larger values. In particular, the reflections at d = 2.5, 3.0, 3.2, and 3.3 Å could not be adequately fitted, although they are predicted by the structural model derived from the 300 K X-ray diffraction data.
Several approaches were explored to improve the refinement. First, a micro-strain model was introduced to account for possible lattice strain or structural defects; this, however, did not result in a significant improvement. In addition, the structural model reported for (Ni(NH₃)₂(dca)₂) [23], which already includes a micro-strain contribution in its refinement, was used as an alternative starting point after replacing the central nickel atom with iron but even this model did not result in an improved fit of the observed reflections. Finally, preferred-orientation corrections were included in the refinement, yet no satisfactory agreement between observed and calculated intensities could be achieved.
The origin of these discrepancies remains unresolved. Possible explanations include disorder or alternative orientations of the NH₃ groups and hydrogen atoms that are not adequately captured by the room-temperature structural model. Furthermore, local structural defects or short-range ordering phenomena may contribute to the observed intensity mismatches. Since none of the tested refinement strategies led to a satisfactory description of the diffraction pattern, the available neutron diffraction data may not provide sufficient information to uniquely determine the hydrogen positions and, also, displacement parameters. Additional neutron diffraction measurements will therefore be required to clarify the structural model and resolve the origin of the observed discrepancies.
2.2. Magnetic Measurements
The magnetic data of 1 normalized to a single Fe2+ center is shown in Figure 5. At 0.01 T, the compound was measured in zero-field cooling (zfc) and field cooling (fc) mode due to the well-known occurrence of long-range magnetic ordering [14]. At 400 K, the value of χmT is 2.77 cm3 K mol-1 (Figure 5a). This value is distinctly below the expected range 3.2–4.1 cm3 K mol-1 of an isolated high spin Fe2+ center [25]. At decreasing temperatures, the values of χmT stay almost constant down to 100 K and slightly decrease to about 25 K showing diverging values regarding both measurement modes with the lower values in fc mode. Upon further cooling, both series significantly increase and reach maxima at 15 K with 38 (zfc) and 176 cm3 K mol-1 (fc) dropping off to 6.42 and 37.9 cm3 K mol-1 at 2.0 K. At 5.0 K, the molar magnetization is characterized by a hysteretic loop (Figure 5a, inset). At the highest fields of ±5.0 T, the magnetization reaches ±0.8 NA μB, while the coercive field is 0.5 T (horizontal intercepts at ±0.47 T), and the remnant magnetization is 0.4 NA μB (vertical intercepts at ±0.39 NA μB). While the shape of χmT vs. T curve with decreasing temperatures from 400 K, and in particular below 100 K, is due to the thermal depopulation of the energy states of the Fe2+ center split by electron-electron inter-repulsion, ligand field, and spin-orbit coupling, the magnetic properties of Fe(dca)2 are considerably affected by three-dimensional long-range ordering effects at even lower temperatures. This is evident from the observation of the hysteresis loop, the significant increase of χmT at about 25 K and the diverging χmT vs. T data in zfc and fc measurement mode below that temperature. Such observations are characteristic of ferri- or ferromagnetic phase transitions.
The χmT value at room temperature or even at 400 K, however, is distinctly below the value of an isolated high spin Fe2+ center (and considerably above values of low spin (S = 0) or intermediate spin scenarios (S = 1)). This may indicate the presence of antiferromagnetic exchange interactions of lower dimensionality, although the slope of the χmT vs. T plot is rather small in this temperature range. A comparison with literature[14] shows that we find slightly smaller values of χmT at room temperature. In addition, we find a distinctly lower coercive field and a broader width of the ac measurements data (see Figure 5b), which may indicate that 1 is rather a ferrimagnet instead of a canted antiferromagnet as concluded by Kurmoo and Kepert. [13] 1 being a ferrimagnet could also explain the rather low magnetization values at ±5.0 T, since the saturation magnetization is expected to be a third of 4 NA μB (≈ 1.3 NA μB) in this case. Additionally, the critical temperature TC can be reliably determined from the minimum of the temperature derivative of the in-phase component (χm‘). We find TC = (19.1 ± 0.1) K in good agreement with literature [14].
For gaining more insight into the magnetic structure of 1, powder neutron diffraction data was obtained at 10 and 25 K to complement the conclusions and assumptions of the SQUID measurements. The results of these measurements are shown in Figure 6. If the difference between the two measurements at 10 K and 25 K is examined, the 10 K measurement shows two additional reflections at approximately 165 000 μs, two additional reflections at approximately 75 000 μs which indicate antiferromagnetism, and higher reflection intensities at 85 000 and 70 000 μs which indicate ferro- or ferrimagnetism. SQUID measurements distinctly prefer ferrimagnetism over ferromagnetism (S = 2). However, the additional reflections are too few to find a reasonable propagation vector for unambiguously determining the type of magnetism. Therefore, only occurrence of cooperative magnetism can be confirmed along with a magnetic transition between 10 and 25 K, in agreement with the SQUID data.
2.3. 57Fe Mösbauer Spectroscopy
For 1 the oxidation state of iron was investigated using 57Fe Mössbauer spectroscopy. The 57Fe Mössbauer spectrum of 1, presented in Figure 7, shows a quadrupole split signal with an experimental line width of 0.35(1) mm s–1 at an isomer shift of 1.12(1) mm s–1, clearly indicating high-spin iron(II) [26]. Further examples for nitrogen coordinated high-spin iron(II) compounds are Cs2FeHFeL(CN)6 ( = 1.040(5) mm s–1 relative to 57Co/Pd [MB3]), Fe(phen)2(NCS)2 ( = 0.98(3) mm s–1 relative to α-Fe [27]) and [Fe(btre)2(NCS)2] ( = 1.086(2) mm s–1 relative to 57Co/Rh [28]). The two crystallographically independent iron sites in the nitridosilicate Fe2Si5N8 are also in a high-spin state, however, with slightly lower isomer shift values of 0.837(2) and 0.816(2) mm s–1 [29].
The significant quadrupole splitting of 3.16(1) mm s–1 results from the coordination geometry of the iron atoms occupying Wyckoff site 2a (site symmetry ..2/m). The iron a-toms are coordinated by six nitrogen atoms in elongated octahedra (4 × N1 at 209.7 pm and 2 × N2 at 221.7 pm), thereby the N–Fe–N bond angles only slightly differ from ideal octahedral geometry (deviation equal or smaller than 0.8°). The elongation partially splits the degeneracy of the eg and t2g orbitals, which is reflected in the quadrupole splitting value.
At an isomer shift of around 0 mm s–1 the experimental spectrum shows a very small additional contribution of an iron-containing impurity. The extremely low intensity prevents a sufficient fit, however this does not interfere with the data of 1.
2.4. ATR-IR and TGA
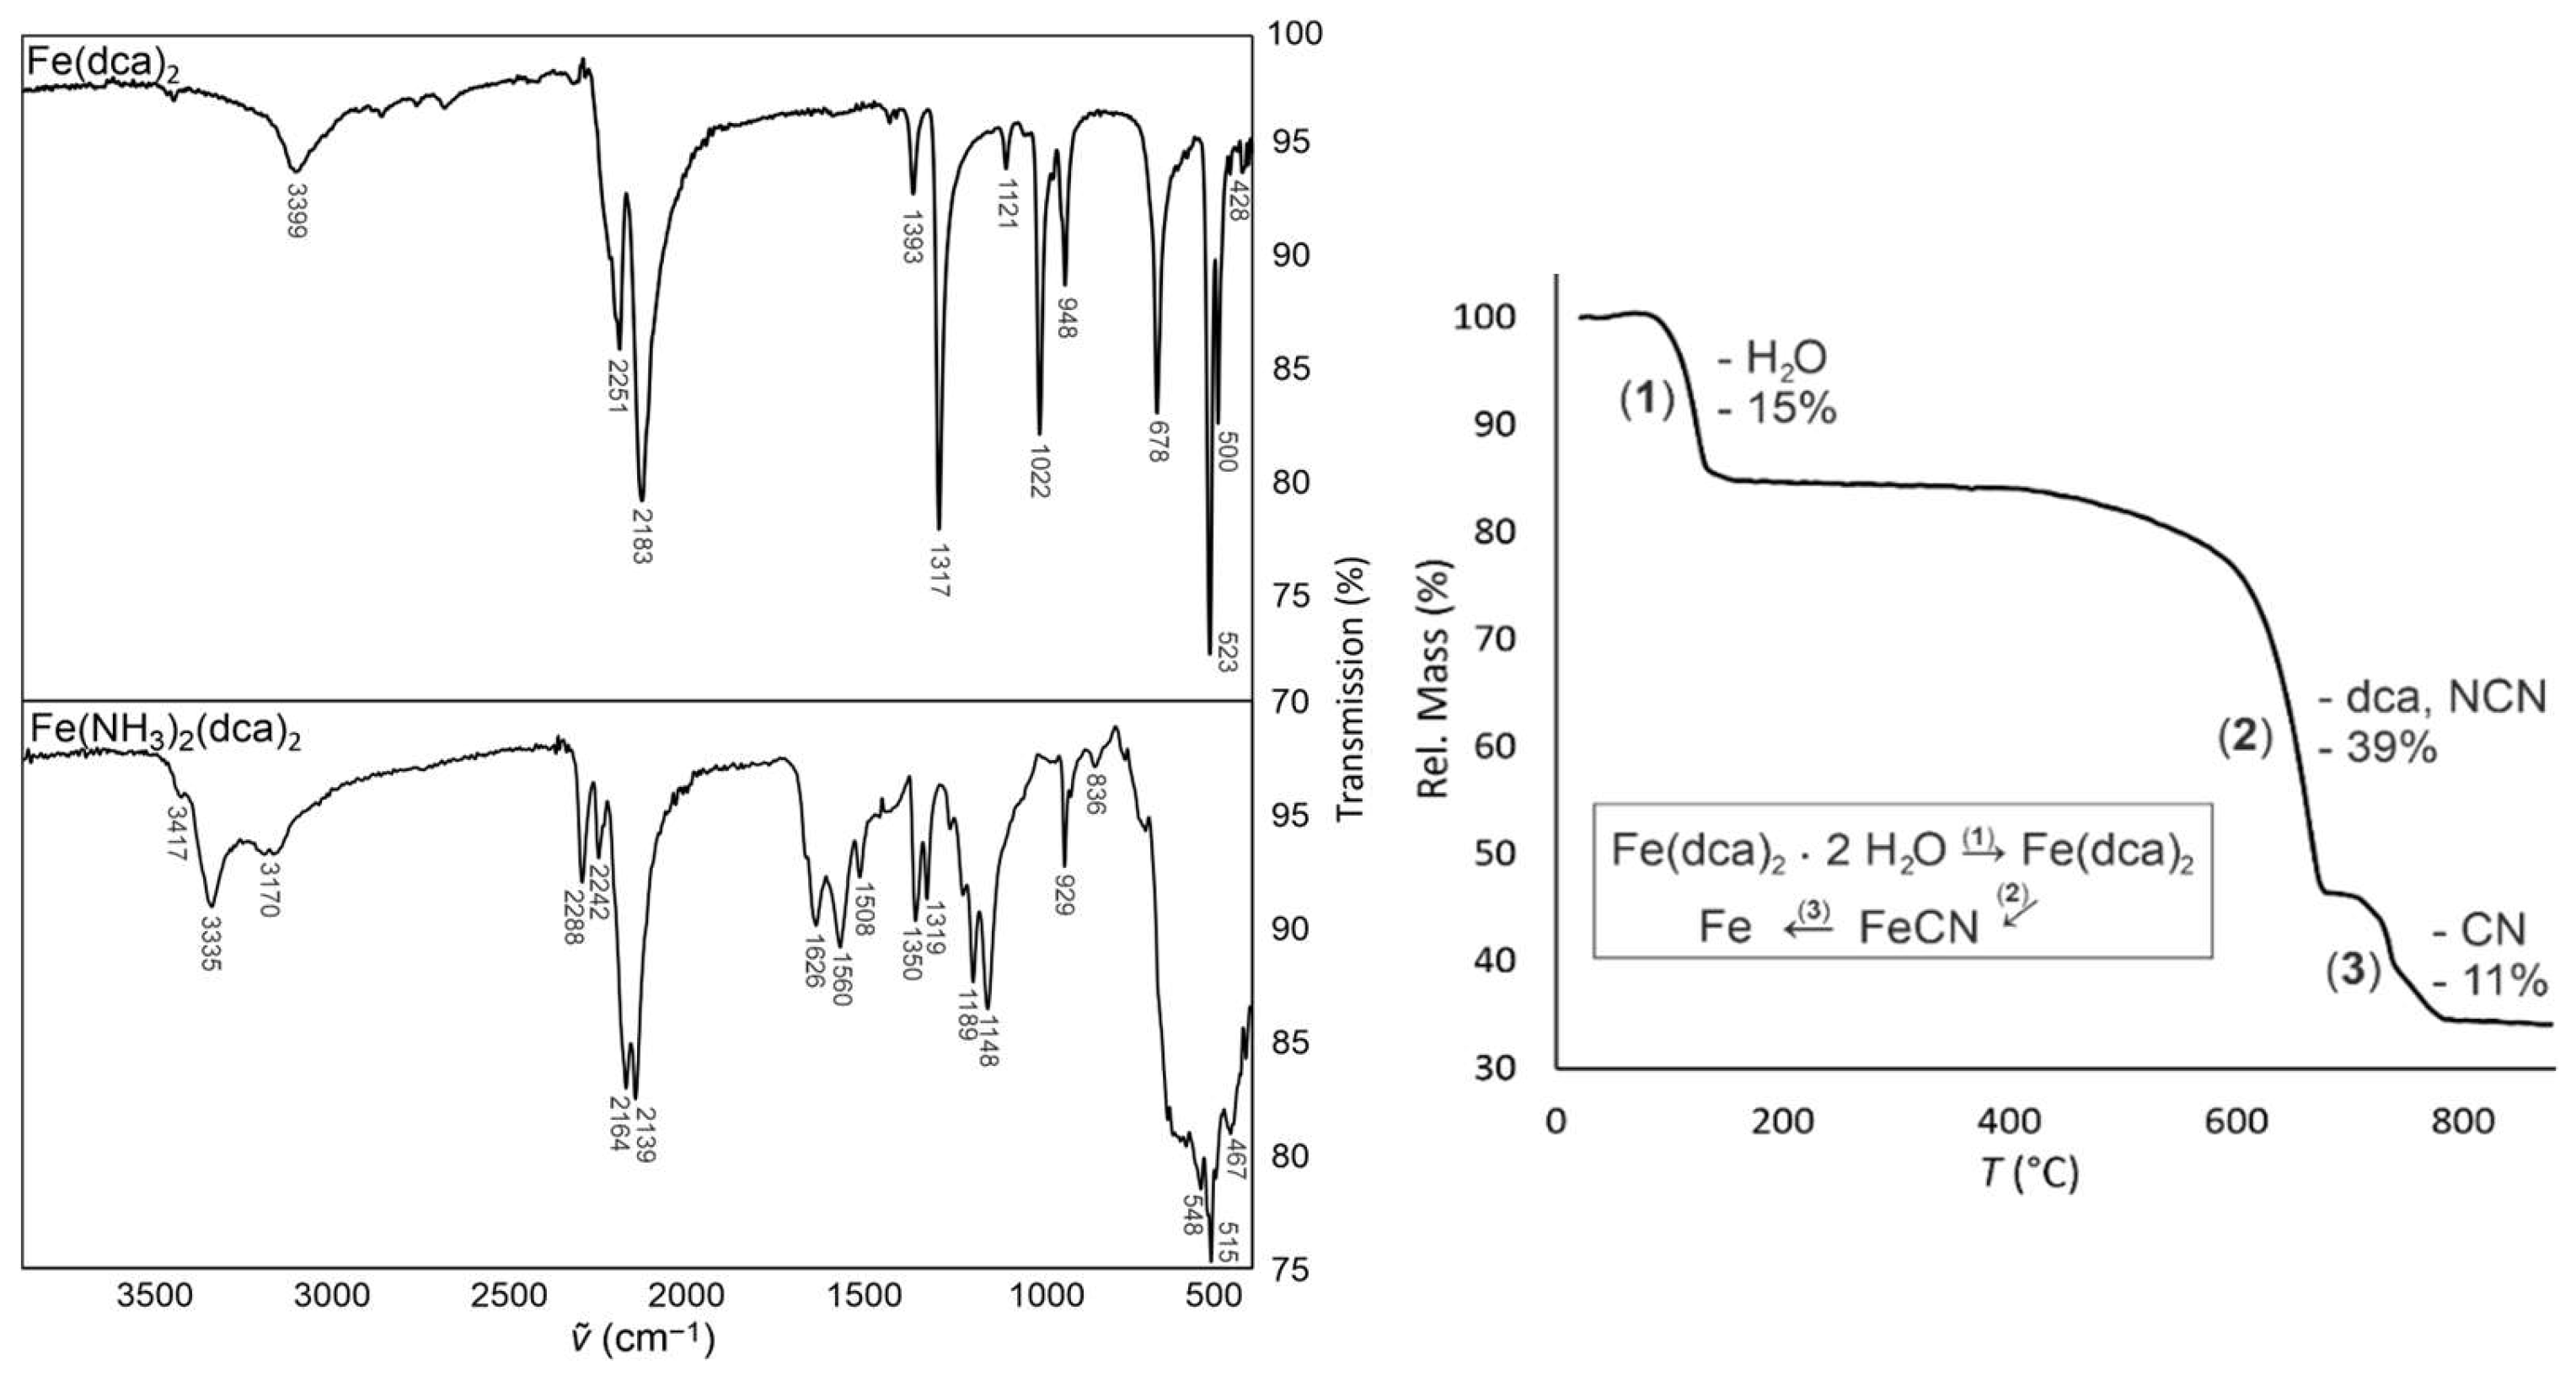
The ATR-IR measurements of 1 and 2 are shown in Figure 8 on the left. The results are in good agreement with literature [18,23]. The allocated oscillations can be found in Table A2. Additionally, the oscillations for 1 and 2 were calculated with DFT using a harmonic oscillation model to eliminate the overtones in the theoretical IR spectra (Table A4). Note that there is a signal at 2399 cm–1 in the IR spectrum of 1 indicating water as an impurity, since the sample was stored under ambient conditions. The DFT calculations are in good agreement with the measurements.
The results of the TGA of 1 are shown in Figure 7 on the right-hand side plotting the mass fraction against the temperature. Three steps of mass loss occur at about T ≈ 120 (1), 650 (2) and 720 °C (3). Since the IR spectroscopic measurement revealed some water in the measured sample, the first step of mass loss (1) at T ≈ 120 °C is assigned to the cleavage of adsorbed water. A mass loss of approximately 15 % corresponds to two water molecules per molecular unit Fe(dca)2, resulting in a molar mass loss of 36 g/mol. The subsequent mass loss (2) at T ≈ 650 °C from 85 % to 46 % corresponds to a molar mass of about 92 g mol–1. This loss could represent the sum of a dca and a NCN unit, in which case a residue of FeCN remains. The final step of mass loss (3) occurs at about T ≈ 720 °C, representing the cleavage of the remaining CN unit (46% to 35%) from the remaining residue of iron. We could not find a thermal decomposition of a “pure” transition-metal dicyanamide in the literature for comparison with our results, but the cleavages of the above-described fragments seem reasonable.
3. Materials and Methods
3.1. Synthesis
Fe(dca)2 (1) was synthesized by adding a stoichiometric amount of FeCl2 · 4 H2O (3.96 g, 20 mmol) to a solution of NaN(CN)2 (3.5615 g, 40 mmol, 2 Eq.) and H2NCN (0.840 g, 20 mmol, 1 Eq.) in methanol. The solution was stirred for 1 h at room temperature. The product precipitated as beige microcrystalline powder. The powder was filtered, dried and prepared for powder X-Ray diffraction. Fe[NH3]2[dca]2 (2) was synthesized by recrystallizing 1 in liquid ammonia under Schlenk conditions: compound 1 (0.939 g, 5 mmol) was filled in a Schlenk flask and cooled to −78 °C. Subsequently, ammonia was condensed into the flask while stirring the reaction mixture until all powder was suspended in the ammonia. In the next step, the excess of ammonia was removed by slowly thawing the solvents under standard conditions. The product was isolated as a black and sticky crystalline powder.
3.2. Powder X-Ray/Neutron Diffraction (PXRD/PND)
The compounds were measured on a Stoe STADI MP (STOE and Cie GmbH, Darmstadt, Germany) with Mo-Kα1 radiation (λ = 0.709300 Å) to avoid fluorescence and a Dectris Mythen2 1K detector. 1 was measured in a flat sample holder; 2 was loaded into a capillary with a diameter of 0.5 mm. Both samples were measured for 4 hours in the 0–40° transmission range using Debye-Scherrer geometry.
Time-of-flight (TOF) powder neutron diffraction experiments were carried out at the Spallation Neutron Source (SNS) of Oak Ridge National Laboratory (ORNL) at the POWGEN powder diffractometer [30] to examine the crystal and magnetic structures of 1 and 2. For measurements, powder samples of 1 and 2 were filled into vanadium cans of 6 mm diameter. Background as well as vanadium corrections were applied using the standard data-reduction algorithm of POWGEN. The TOF experiments were carried out at 10 and 25 K with a neutron center-wavelength of λc = 1.500 Å, covering a d-range from 0.5 to 12.5 Å at 60 Hz.
3.3. Rietveld Refinements
Refinements of the data were made using the software FullProf Suite (Vers. 2023) [31].
(1): Fe(dca)2: For the powder X-ray diffractogram, the structural model of Co(dca)2 was used, while cobalt was exchanged by iron. A pseudo-Voigt profile was used as profile function. For the crystal structure refinement of the neutron powder data, the structure model obtained from the refinement of the powder X-ray diffractogram was used. Additionally, powder neutron diffraction experiments were performed at 10 K to find the possible magnetic peaks of the substance.
(2): Fe(NH3)2(dca)2: For the powder X-ray diffractogram, the structural model of Ni(NH3)2(dca)2 was used, while nickel was exchanged by iron. Since there were no magnetic structure changes observed between 10 and 25 K, the diffractogram at T = 10 K was refined, because the isostructural compound Ni(NH3)2(dca)2 was measured at the same temperature ensuring comparable results.
3.4. 57Fe Mössbauer Spectroscopy
A 57Co/Rh source was used for the Mössbauer spectroscopic characterization in conventional transmission geometry. 75 mg of the Fe[N(CN)2]2 sample were mixed with alpha-glucose and were placed in a thin-walled PMMA container with a thickness corresponding to about 7 mg Fe per cm2. The measurement was performed in a commercial liquid nitrogen bath cryostat. The temperature of the absorber was set to 78 K, while the source was kept at room temperature. Fitting of the spectrum was performed with the WinNormos for Igor 8 program package [32].
3.5. Infrared Spectroscopy (ATR-IR)
The ATR-IR spectra (absorbance in dependence of the wavelength) were measured using a Bruker alpha II spectrometer (Bruker Optics, Ettlingen, Germany) and edited with the software OPUS (Version 7.8).
3.6. Thermogravimetric Analysis (TGA)
Thermogravimetric analysis of 1 was performed in the temperature range from 25 to 1000 °C with a heating rate of 5 K/min while the compound was weighed using a Netzsch® STA 409 C (Netzsch, Selb, Germany).
3.7. Magnetic Measurement
To determine the magnetic properties of 1, measurements were performed with a Quantum Design SQUID Magnetometer MPMS-5XL. The crystalline powders were compacted and fixed in different PTFE capsules. Data was taken in dependence of the magnetic field (as hysteresis curve from –5.0 to 5.0 T at 5.0 K) and the temperature (field cooling (fc): 2.0 to 400 K with 0.01, 0.1 and 1.0 T, zero field cooling (zfc): 2.0 to 400 K with 0.01 T). Furthermore, measurements were conducted in a dynamic magnetic field with an amplitude of 3 T in absence of a static magnetic field between 2.0 and 26.0 K and frequencies of f = 111, 555 and 938 Hz. All data was corrected for the diamagnetic contributions of the specimen holder and the intrinsic contribution of the sample (χm,dia = –9.4×10⁻⁵ cm3 mol–1).
3.8. Phonon Calculations
All structures were optimized using the Vienna Ab initio Simulation Package (VASP) [33,34,35,36] with density functional theory (DFT). The electronic wave functions were derived from PAW pseudopotentials [37], employing a kinetic energy plane-wave cutoff of 500 eV, and exchange and correlation were GGA-parameterized according to Perdew, Burke, and Ernzerhof optimized for solids (PBEsol)[38]. For the Brillouin zone integration, Blöchl’s tetrahedron method was employed, utilizing k-point meshes with densities ranging from 0.02 to 0.04 Å−1 [39]. Convergence criteria were set at energy differences of 10−4 eV Å–1 for ionic and 10−6 eV for electronic steps. To simulate lattice vibrations (phonons), Phonopy [40] was employed, utilizing the Hellmann–Feynman forces obtained from VASP. Furthermore, an in-depth simulation of infrared (IR) spectra was performed by employing phononic calculations and Born effective charges, which were also obtained through the aforementioned methods. The resulting data was meticulously processed using the JaGeo/IR software package [41].
3.9. Chemicals and Reagents
The following chemicals were used without further purification: FeCl2 · 4 H2O (Merck KGaA, ≥ 99 %), NaN(CN)2 (Sigma-Aldrich, 96 %), H2NCN (Sigma-Aldrich, 99 %), Methanol (VWR Int., 100 %), Ammonia gas (Westfalen AG, 99.9999 %).
4. Conclusions
Both crystallographic and magnetic investigations of the iron-based dicyanamide compounds Fe(dca)2 (1) and Fe(dca)2(NH3)2 (2) were carried out. It is now finally possible to synthesize compound 1 in a phase-pure form, enabling more accurate and reliable characterization of its structural and magnetic properties. 1, crystallizing in the orthorhombic space group Pnnm, forms a 3D rutile-like network with Fe²⁺ centers octahedrally coordinated by dicyanamide (dca) ligands. The structure exhibits only minor thermal contraction (ΔV ≈ 2.5 ų from 300 to 25 K), in contrast to larger volume changes observed in related compounds such as those of cobalt and zinc. The Fe–N bond lengths and lattice parameters show subtle but consistent temperature-dependent changes, suggesting slight octahedral distortion at higher temperatures.
In contrast, compound 2, crystallizing in the monoclinic space group P2₁/c, forms a layered structure with Fe²⁺ centers also octahedrally coordinated—this time by four dca ligands and two ammonia molecules. The hydrogen bonding from ammonia groups plays a key role in stabilizing the layered network. The coordination geometry and bonding distances confirm nearly ideal octahedral symmetry. Comparison with similar cobalt-based analogues highlights predictable trends in lattice parameters corresponding to differences in ionic radius.
Magnetic measurements of 1 demonstrate complex behavior being characteristic of ferrimagnetism, with a transition temperature Tc ≈ 19 K, as indicated by SQUID data and neutron diffraction studies. 57Fe Mößbauer spectroscopy confirms high-spin Fe2+. Below the transition temperature, clear divergences in zfc and fc data and the emergence of hysteresis confirm the onset of long-range cooperative magnetism. The shape and temperature dependence of the χₘT curve further supports a ferrimagnetic ground state with possible antiferromagnetic interactions at higher temperatures.
Thermal analysis of 1 shows a three-step decomposition process. The first mass loss at T ≈ 120 °C corresponds to adsorbed water, while further steps likely involve cleavage of dca and CN moieties, ultimately leading to iron-containing residues. The ATR-IR spectra and DFT-calculated vibrational modes corroborate the structural assignments and confirm the presence of water impurities.
In summary, the study of compounds 1 and 2 reveals the strong interplay between structure, temperature, and magnetism in iron-based bisdicyanamides. The results deepen the understanding of structure-property relationships in this class of coordination polymers and highlight the influence of ligand type, metal ion, and dimensionality on both crystallographic and magnetic behavior. Further investigations, however, are necessary to clearly determine the magnetic ordering in compound 1. Further neutron diffraction experiments are needed to constrain and refine the proposed magnetic structure.
Supplementary Materials
The following supporting information can be downloaded at the website of this paper posted on Preprints.org.
Author Contributions
Conceptualization, L.H.; methodology, L.H.; software, J.H.; validation, L.H. J.H., A.H. and J.v.L.; formal analysis, J.H.; investigation, L.H. A.K. and J.v.L.; resources, E.F., R.P. and R.D.; writing—original draft preparation, L.H., J.v.L. R.P. and A.K.; writing—review and editing, J.v.L, J.H., A.H., R.D., R.P. and E.F.; visualization, L.H.; supervision, E.F. and R.D.; project administration, L.H.; funding acquisition, E.F. and R.D. All authors have read and agreed to the published version of the manuscript.
Funding
Calculation time was provided by the Jülich Aachen Research Alliance (project no. jara0033).
Data Availability Statement
The original contributions presented in this study are included in the article/supplementary material. Further inquiries can be directed to the corresponding author(s).
Acknowledgments
We thank Chang Li for carrying out the neutron diffraction experiments at POWGEN. We gratefully acknowledge the financial support provided by JCNS to perform the neutron scattering measurements at the Spallation Neutron Source (SNS), Oak Ridge, TN. Part of the research conducted at the SNS was sponsored by the Scientific User Facilities Division, Office of Basic Energy Sciences, U.S. We also thank Tobias Storp for the XRD measurements and Noah Avraham from the Institute of Technical and Macromolecular Chemistry for the TGA. Additionally, we thank Dr. Philipp Jacobs and Prof. Dr. rer. nat. Ullrich Englert as regards discussions and ideas about the neutron data refinement and interpretation.
Conflicts of Interest
The authors declare no conflicts of interest.
Abbreviations
The following abbreviations are used in this manuscript:
| dca | Dicyanamide |
| (P)XRD | (Powder) X-Ray diffraction |
| T.O.F | Time of flight |
| ATR-IR | Attenuated Total Reflectance - Infrared Spectroscopy |
| TGA | Thermogravimetric analysis |
| PND | Powder neutron diffraction |
| fc | Field cooling |
| zfc | Zero field cooling |
| SQUID | Superconducting quantum interference device |
| DFT | Density functional theory |
| GGA | Generalized Gradient Approximation |
| PBEsol | Perdew-Burke-Erzerhof (optimized for solids) |
| PAW | Projected augmented wave |
| VASP | Vienna ab initio simulation package |
| SNS | Spallation Neutron Source |
| ORNL | Oak Ridge National Laboratory |
| NA | Avogadros number |
| μB | Bohr magneton |
| μ1, μ3, μ5 | Bridging modes of ligands |
| S | Spin quantum numbers |
| f | Frequency (Hz) |
References
- Berger, U.; Schnick, W. J. Alloys Compd. 1994, 206, 179.
- Bredig, M. J. Am. Chem. Soc. 1942, 64, 1730. [CrossRef]
- Britton, D.; Chow, Y.M. Acta Crystallogr. B Struct. Crystallogr. Cryst. Chem. 1977, 33, 697. [Google Scholar]
- Chen, K.; Fehse, M.; Laurita, A.; Arayamparambil, J.J.; Sougrati, M.T.; Stievano, L.; Dronskowski, R. Angew. Chem. 2020, 132, 3747.
- Dahrouch, M.; Diaz, E.; Iturra, A.; Parra, M.; Gatica, N.; Moreno, Y.; Chavez, I.; Manriquez, J. M. J. Chil. Chem. Soc. 2011, 56, 587. [CrossRef]
- Down, M.G.; Haley, M.J.; Hubberstey, P.; Pulham, R.J.; Thunder, A.E. J. Chem. Soc., Dalton Trans. 1978, 2, 133.
- Liu, X.; Krott, M.; Müller, P.; Hu, C.; Lueken, H.; Dronskowski, R. Inorg. Chem. 2005, 44, 3001. [CrossRef] [PubMed]
- Liu, X.; Stork, L.; Speldrich, M.; Lueken, H.; Dronskowski, R. Chem. Eur. J. 2009, 15, 1558. [PubMed]
- Corkett, A. J.; Reckeweg, O.; Pöttgen, R.; Dronskowski, R. Chem. Mater. 2024, 36, 9107. [CrossRef]
- Scholz, T.; Görne, A.L.; Dronskowski, R. Prog. Solid State Chem. 2018, 51, 1–18. [Google Scholar] [CrossRef]
- Pearson, B. Elsevier Applied Science; London, 1991. [Google Scholar]
- Qiao, X.; Corkett, A. J.; Luo, D.; Dronskowski, R. Inorganics 2020, 8, 64. [CrossRef]
- Lappas, A.; Wills, A.S.; Green, M.A.; Prassides, K.; Kurmoo, M. Phys. Rev. B 2003, 67, 144406.
- Kurmoo, M.; Kepert, C.J. New. J. Chem. 1998, 22, 1515. [Google Scholar]
- Köhler, H.; Kolbe, A.; Lux, G. Z. Anorg. Allg. Chem. 1977, 428, 103.
- Jürgens, B.; Irran, E.; Schnick, W. J. Solid State Chem. 2001, 157, 241.
- Batten, S.R.; Jensen, P.; Kepert, C.J.; Kurmoo, M.; Moubaraki, B.; Murray, K.S.; Price, D. J. J. Chem. Soc. Dalton Trans. 1999, 6, 3079. [Google Scholar]
- Manson, J. L.; Kmety, C.R.; Huang, Q.; Lynn, J.; Bendele, G.M.; Pagola, S.; Stephens, P.W.; Liable-Sands, L.M.; Rheingold, A.L.; Epstein, A.J.; Miller, J.S. Chem. Mater. 1998, 10, 2552.
- Moliner, N.; Gaspar, A.B.; Muñoz, M.C.; Niel, V.; Cano, J.; Real, J.A. Inorg. Chem. 2001, 40, 3986. [CrossRef] [PubMed]
- Batten, S.R.; Robson, R.; Jensen, P.; Moubaraki, B.; Murray, K.S. Chem. Commun. 1998, 313, 1–2, 120.
- Jensen, P.; Batten, S.R.; Fallon, G.D.; Moubaraki, B.; Murray, K.S.; Price, D.J. Chem. Commun. 1999, 159, 352.
- Henrich, L.; Müller, P.C.; Hempelmann, J.; Mann, M.; van Leusen, J.; Steinberg, S.; Dronskowski, R. Molecules 2023, 28, 4886. [PubMed]
- Mann, M.; Mroz, D.; Henrich, L.; Houben, A.; van Leusen, J.; Dronskowski, R. Inorg. Chem. 2019, 58, 7803. [PubMed]
- Reckeweg, O.; Schulz, A.; DiSalvo, F.J. Z. Naturforsch 2013, 68b, 296. [CrossRef]
- Lueken, H. Magnetochemie; Teubner Verlag: Stuttgart, 1999. [Google Scholar]
- Greenwood, N.N.; Gibb, T.C. Mössbauer Spectroscopy; Chapman & Hall: London, 1971. [Google Scholar]
- König, E.; Hüfner, S.; Steichele, E. Z. Naturforsch 1967, 22a, 1543–1550.
- Garcia, Y.; Bravic, G.; Gieck, C.; Chasseau, D.; Tremel, W.; Gütlich, P. Inorg. Chem. 2005, 44, 9723–9730. [CrossRef] [PubMed]
- Bielec, P.; Janka, O.; Block, T.; Pöttgen, R.; Schnick, W. Angew. Chem. Int. Ed. 2018, 57, 2409–2412. [CrossRef]
- Huq, A.; Hodges, J. P.; Gourdon, O.; Heroux, L. Powgen: A third-generation highresolution high-throughput powder diffraction instrument at the Spallation Neutron Source. In European Powder Diffraction Conference; August 2010, Darmstadt, Germany; Oldenbourg Wissenschaftsverlag: München, 2011; pp. 127–136. [Google Scholar]
- Rodriguez-Carvajal, J. Satellite Meeting on Powder Diffraction. XV Congress of the International Union of Crystallography (IUCr), Toulouse, Frankreich, 1990; p. 127. [Google Scholar]
- Brand, R. A. WinNormos for Igor6 (version for Igor 6.2 or above: 22/02/2017); Universität Duisburg: Duisburg (Germany), 2017. [Google Scholar]
- Kresse, G.; Furthmüller, J. Comput. Mater. Sci. 1996, 6, 15.
- Kresse, G.; Furthmüller, J. Phys. Rev. B 1996, 54, 11169. [CrossRef]
- Kresse, G.; Hafner, J. Phys. Rev. B 1993, 47, 558. [CrossRef]
- Kresse, G.; Joubert, D. Phys. Rev. B 1999, 59, 1758. [CrossRef]
- Blöchl, P.E. Phys. Rev. B 1994, 50, 17953. [CrossRef]
- Csonka, G.I.; Perdew, J.P.; Ruzsinszky, A.; Philipsen, P.H.T.; Lebègue, S.; Paier, J.; Vydrov, O.A.; Ángyán, J.G. Phys. Rev. B 2009, 79, 155107.
- Monkhorst, H.J.; Pack, J.D. Phys. Rev. B 1976, 13, 5188. [CrossRef]
- Togo, A.; Tanaka, I. Scr. Mater. 2015, 108, 1. [CrossRef]
- George, J. Zenodo. Available online: https://zenodo.org/record/3241592#.Y9pBPq2ZO70 (accessed on 21 June 2026).
Figure 1.
Rietveld refinements of 1 from NP data at 25 K (left) and from PXRD data at 300 K (right) with measured data in red, calculated patterns in black, reflection positions in green and difference curves in blue.
Figure 1.
Rietveld refinements of 1 from NP data at 25 K (left) and from PXRD data at 300 K (right) with measured data in red, calculated patterns in black, reflection positions in green and difference curves in blue.
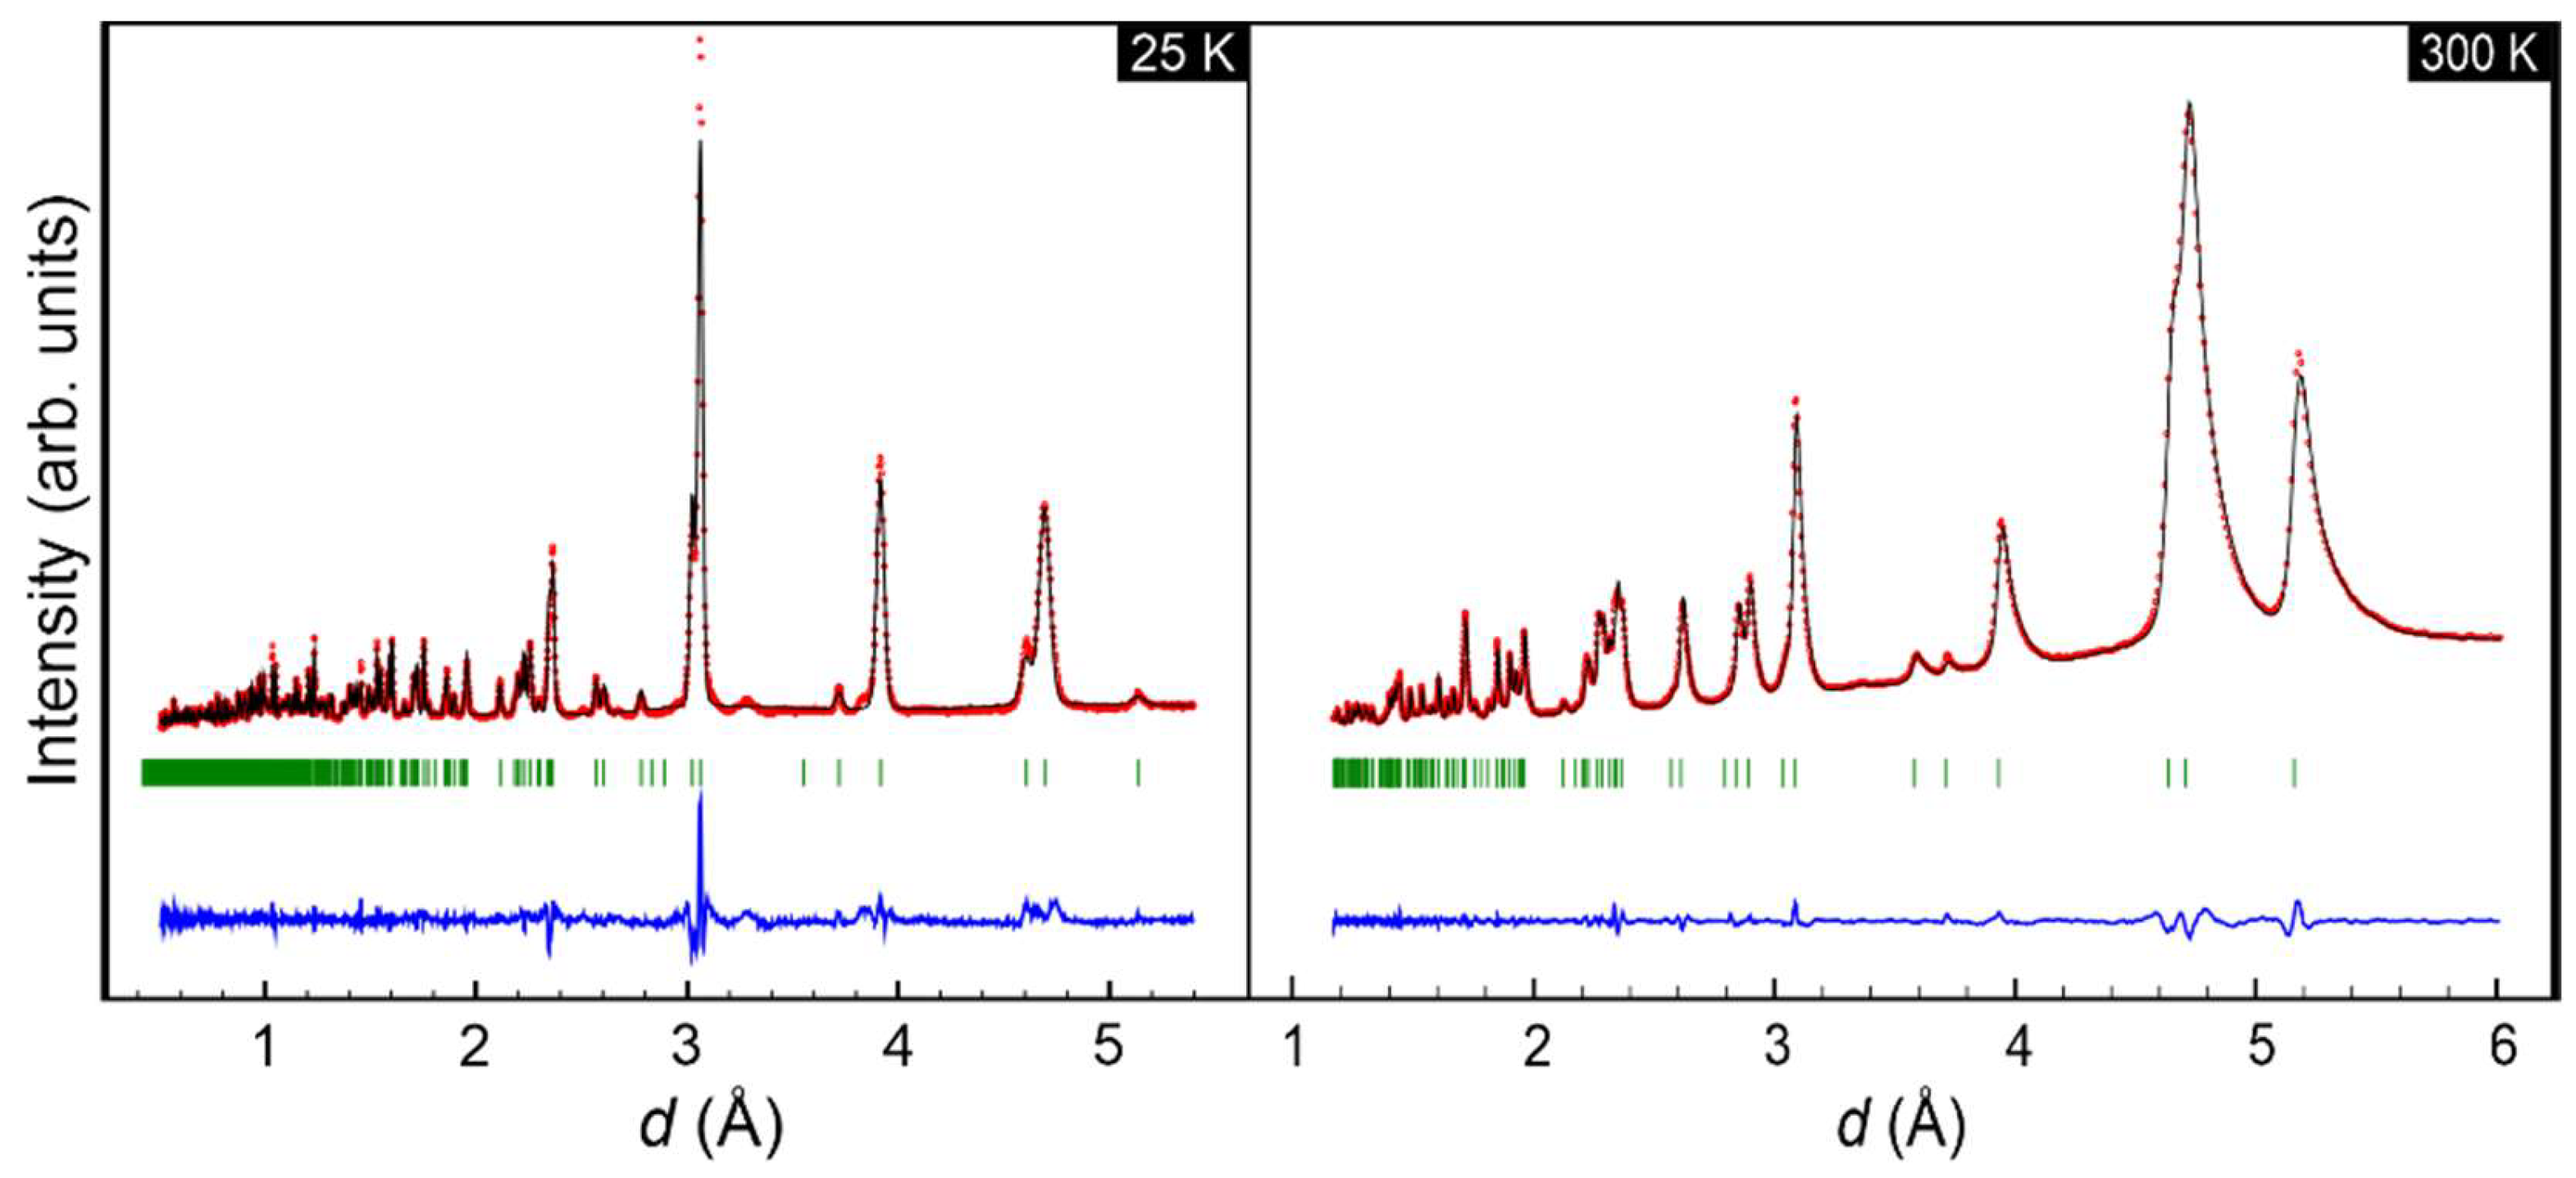
Figure 2.
Coordination sphere of iron in 1 (left) and 2 (right) with iron in brown, carbon in black, nitrogen in green, and hydrogen in white.
Figure 2.
Coordination sphere of iron in 1 (left) and 2 (right) with iron in brown, carbon in black, nitrogen in green, and hydrogen in white.
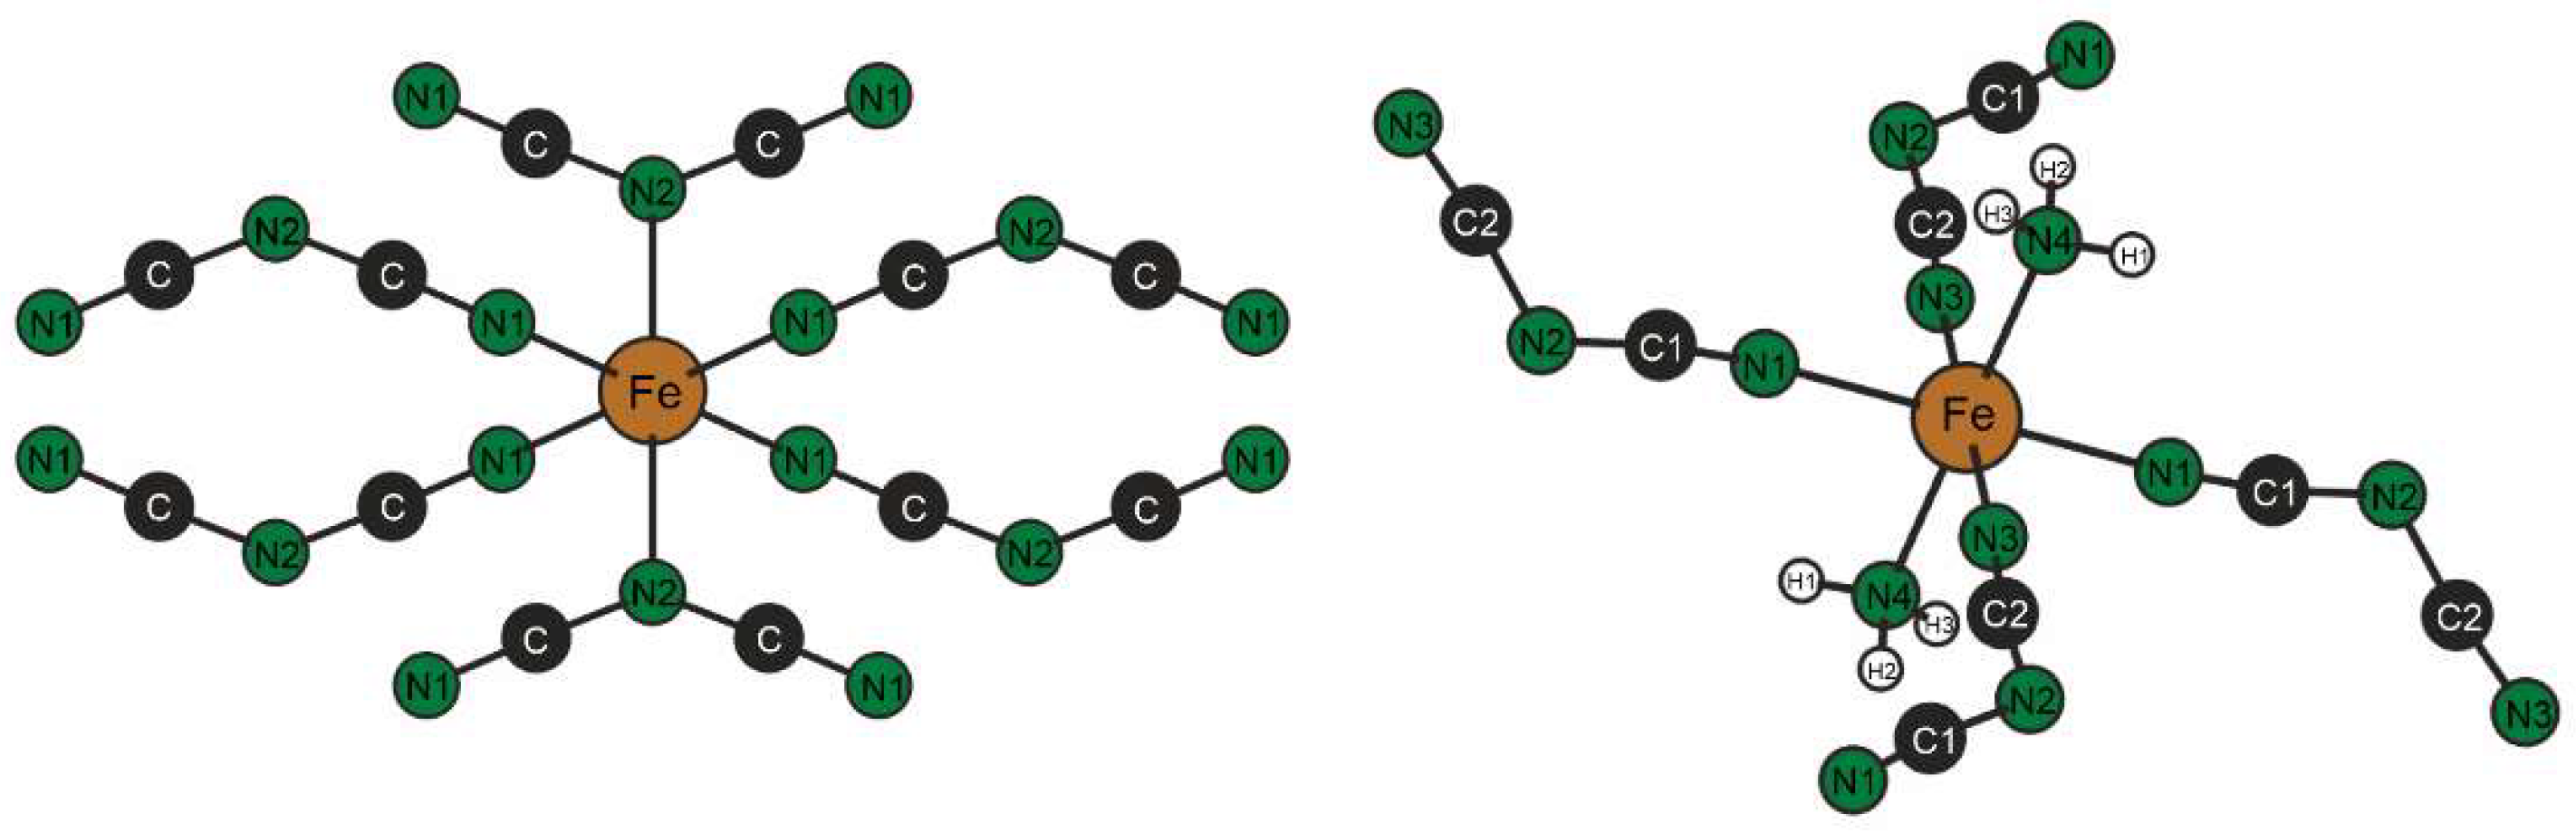
Figure 3.
Lattice parameters and ionic radii of M(dca)2, M = Mn, Fe, Co, Ni, Zn at room temperature.
Figure 3.
Lattice parameters and ionic radii of M(dca)2, M = Mn, Fe, Co, Ni, Zn at room temperature.
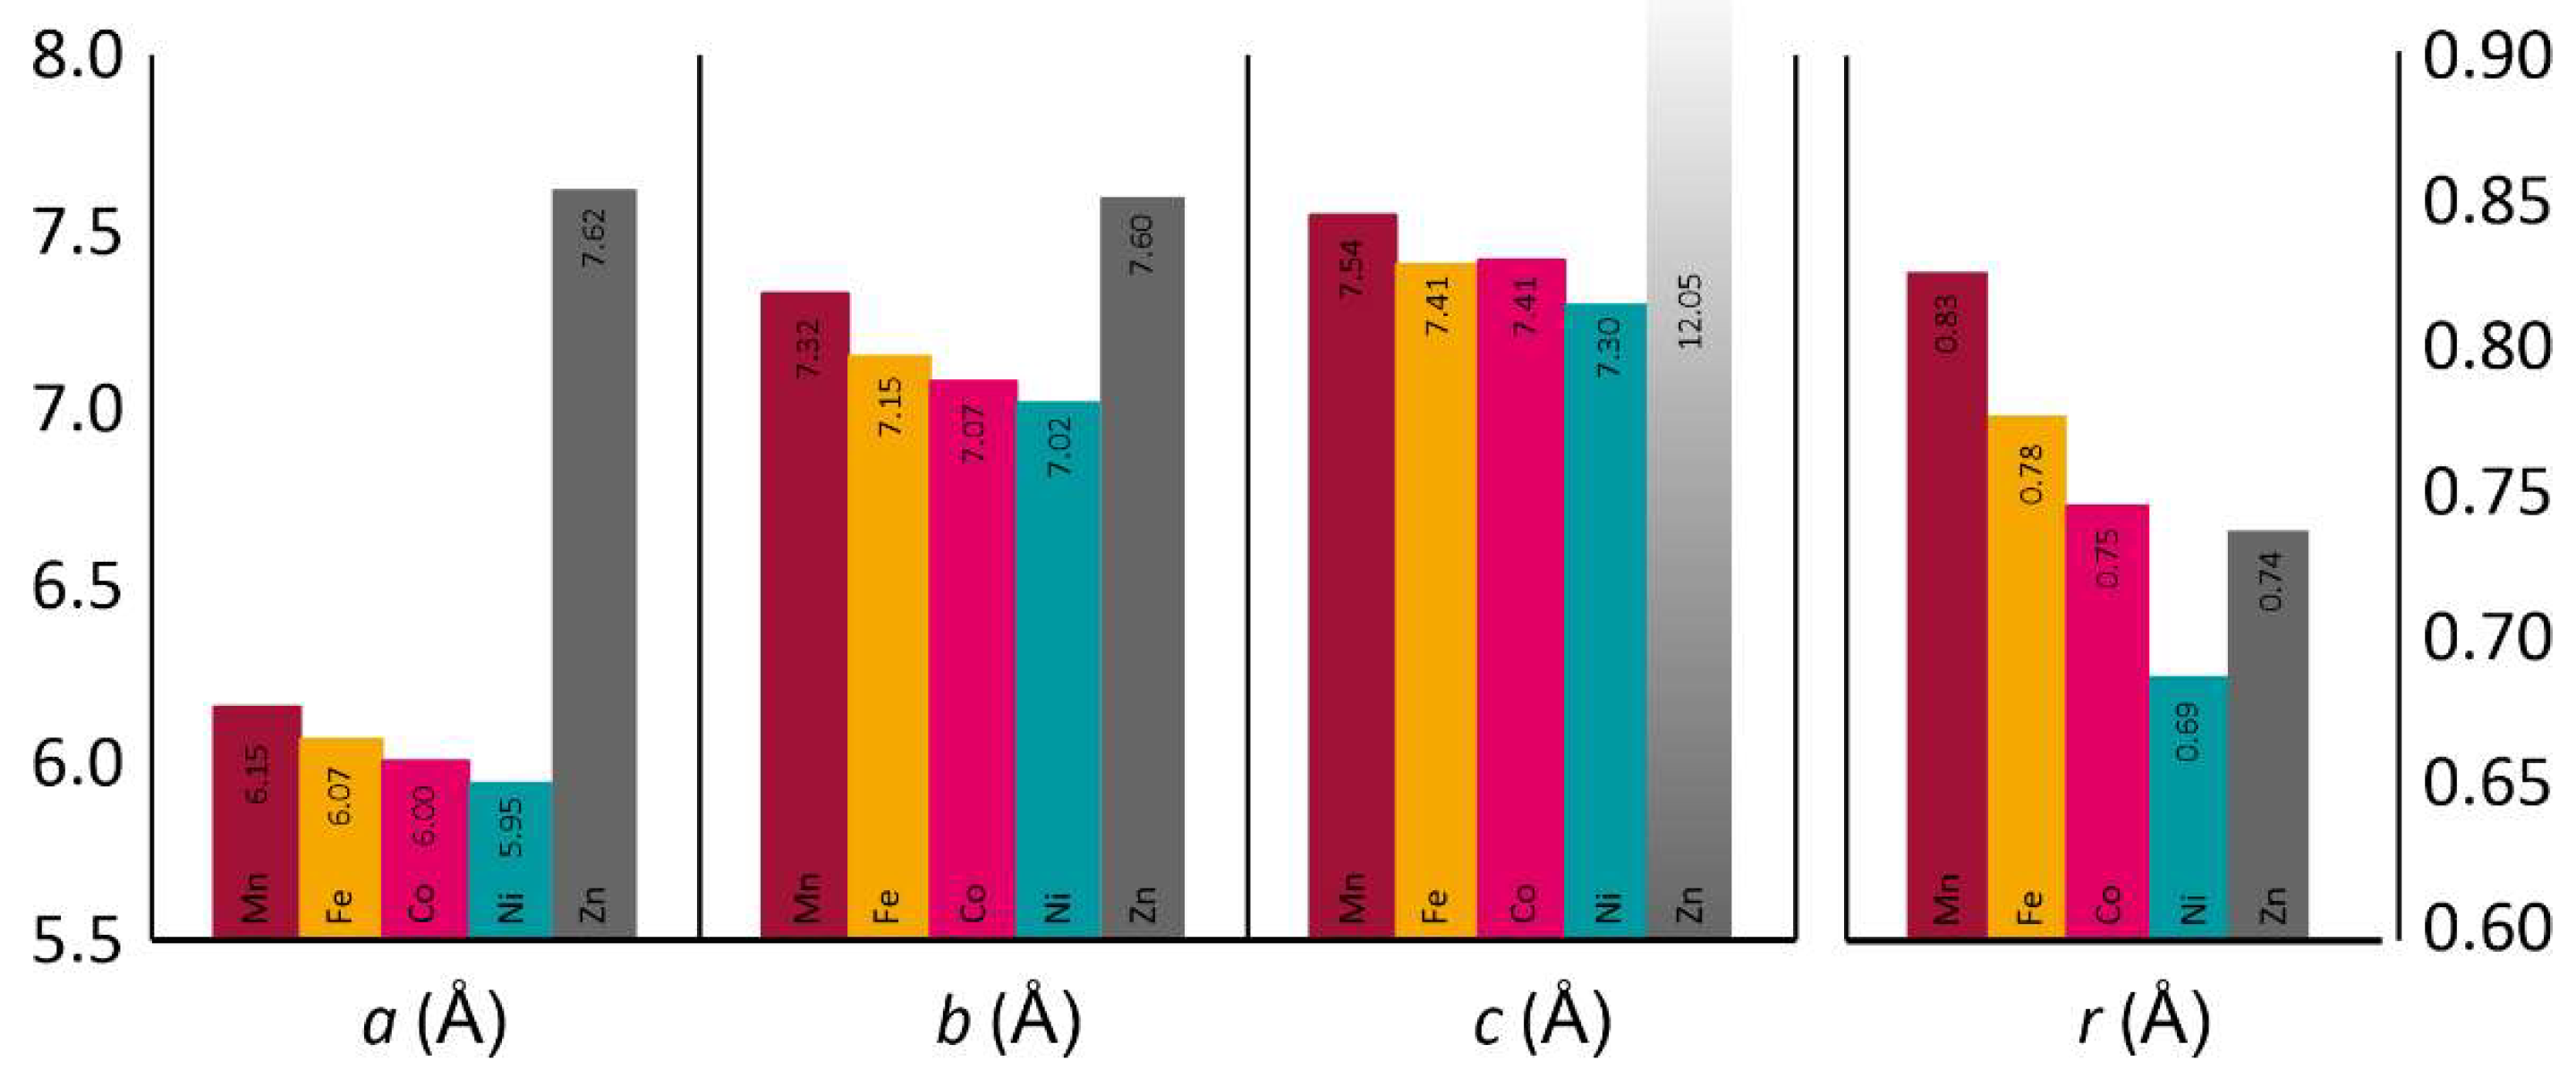
Figure 4.
Rietveld refinement of 2 at 300 K from the X-ray powder data (right) and from the neutron powder data at 10 K (left) with measured data in red, calculated patterns in black, reflection positions in green and difference curves in blue.
Figure 4.
Rietveld refinement of 2 at 300 K from the X-ray powder data (right) and from the neutron powder data at 10 K (left) with measured data in red, calculated patterns in black, reflection positions in green and difference curves in blue.
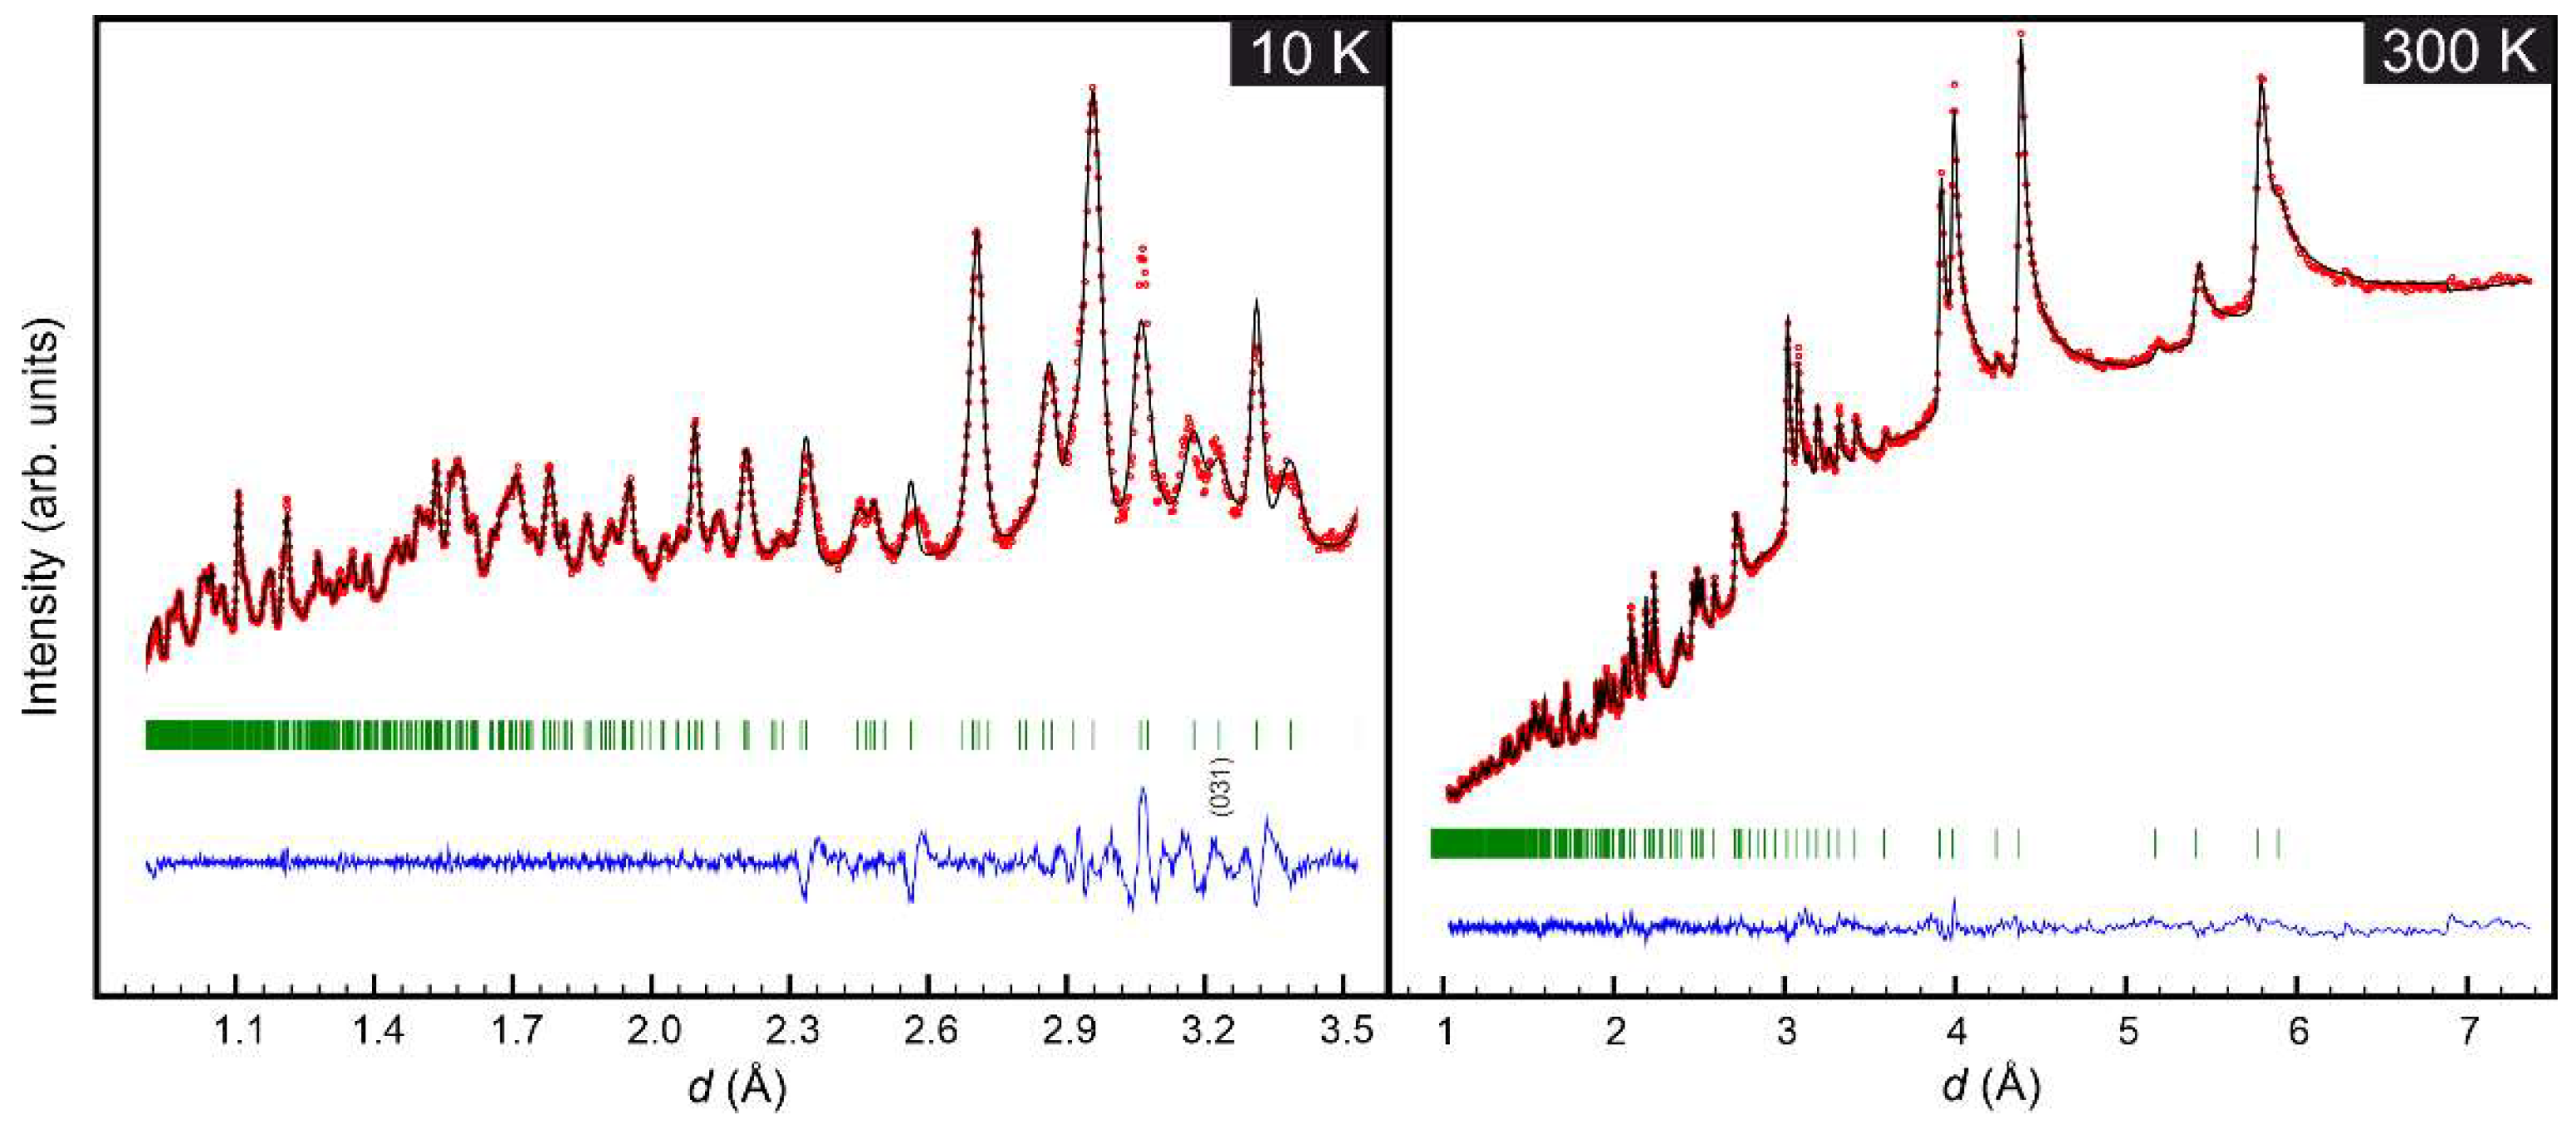
Figure 5.
a) Temperature dependence of χmT (zfc/fc) at 0.01 T of 1; inset: molar magnetization Mm vs. applied magnetic field B at 5.0 K. b) Temperature derivative of χm‘ vs. T for determination of the critical temperature TC; inset: corresponding in-phase molar magnetic susceptibility χm‘ vs. T and out-of-phase molar magnetic susceptibility χm‘‘ vs. T at zero static magnetic bias field.
Figure 5.
a) Temperature dependence of χmT (zfc/fc) at 0.01 T of 1; inset: molar magnetization Mm vs. applied magnetic field B at 5.0 K. b) Temperature derivative of χm‘ vs. T for determination of the critical temperature TC; inset: corresponding in-phase molar magnetic susceptibility χm‘ vs. T and out-of-phase molar magnetic susceptibility χm‘‘ vs. T at zero static magnetic bias field.
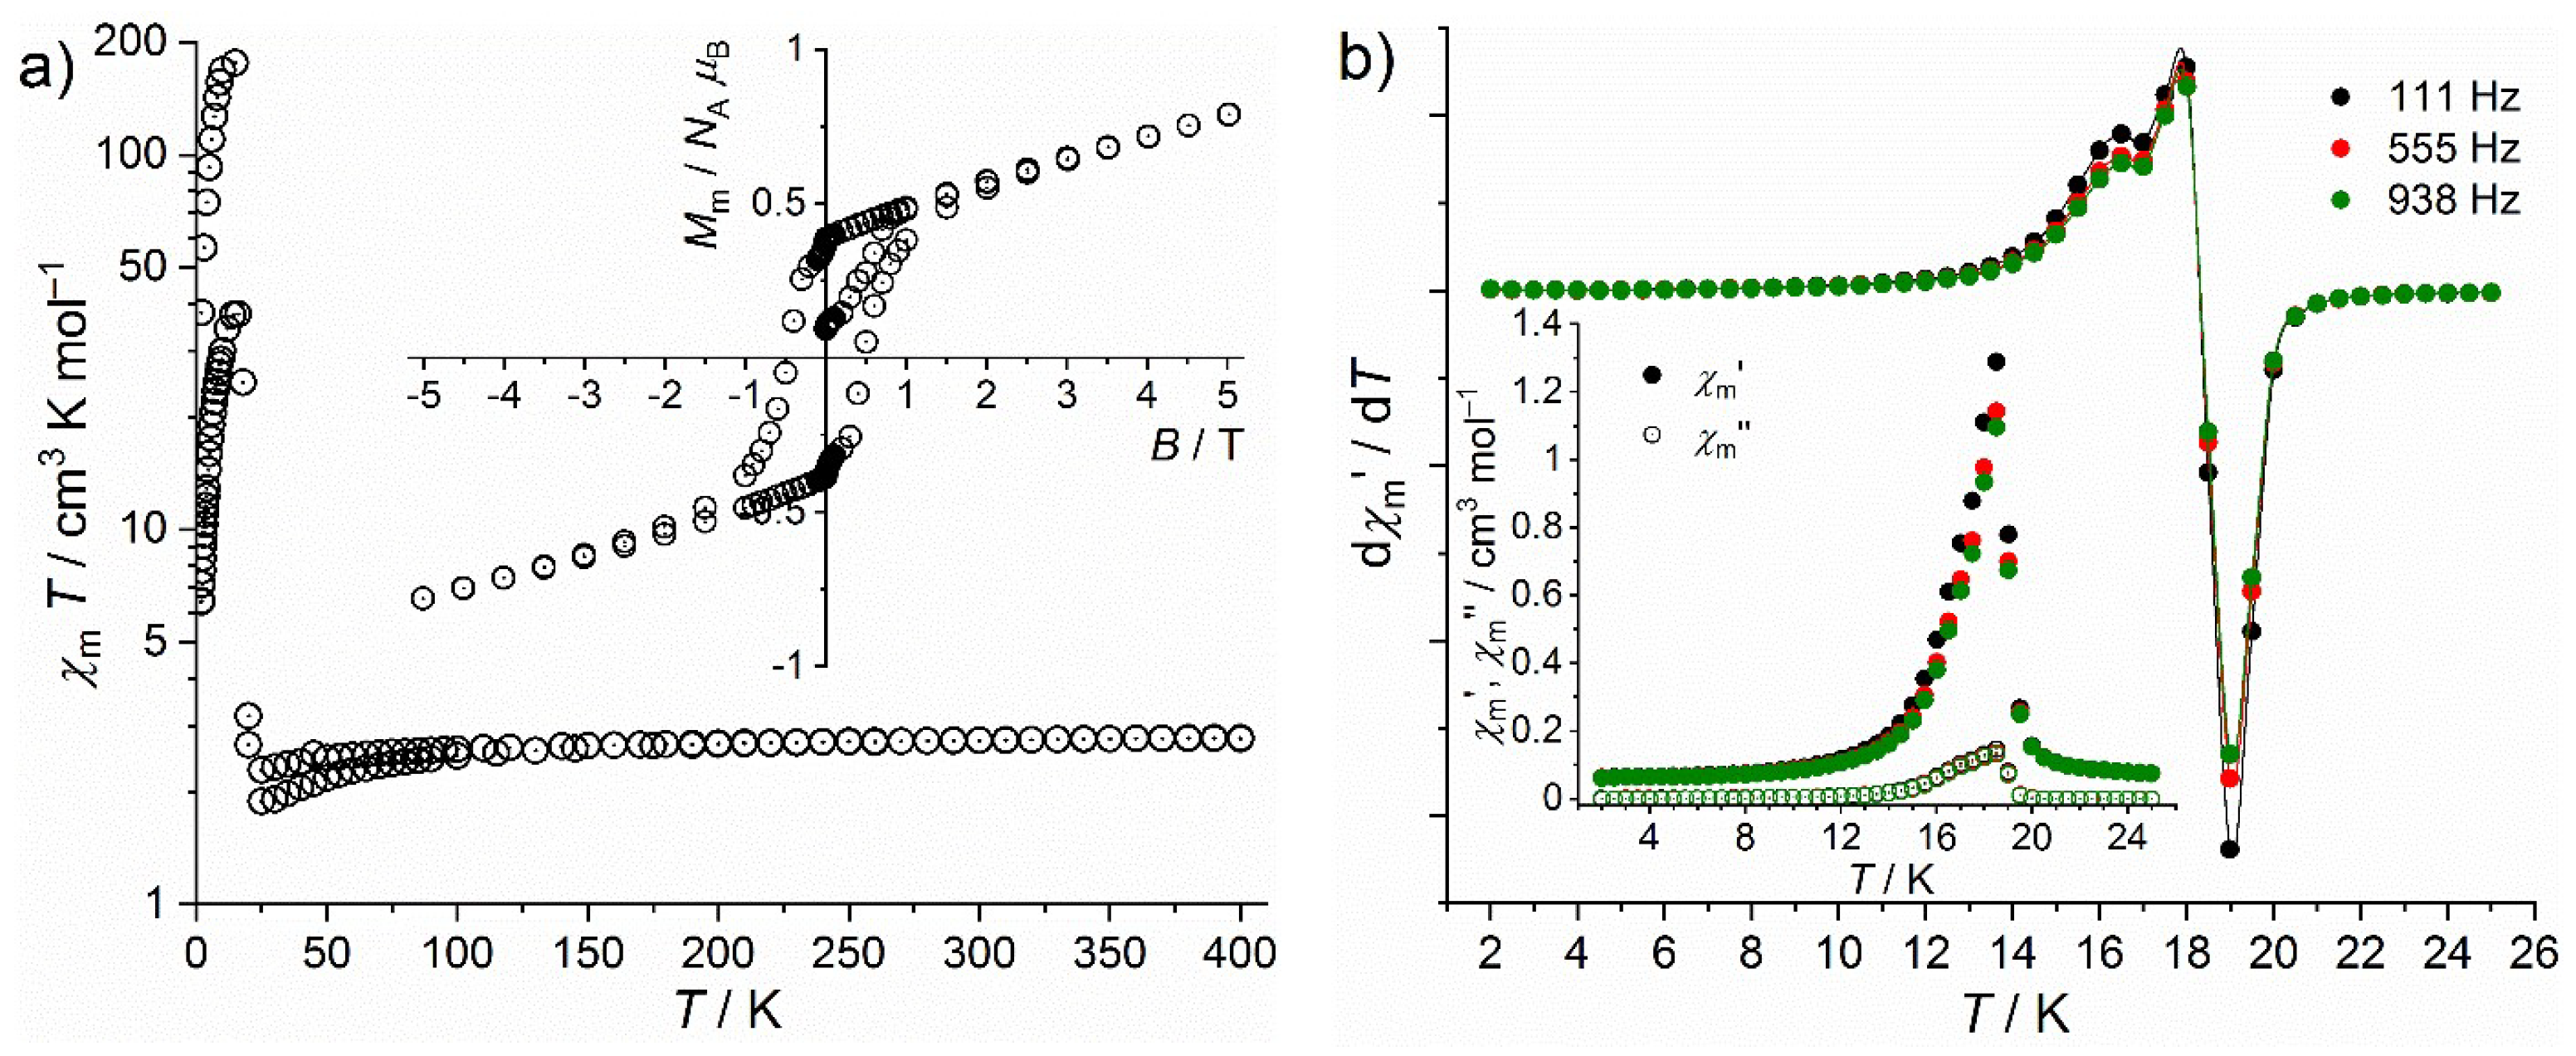
Figure 6.
Powder neutron diffraction measurements of 1 at 10 K (black) and 25 K (red).
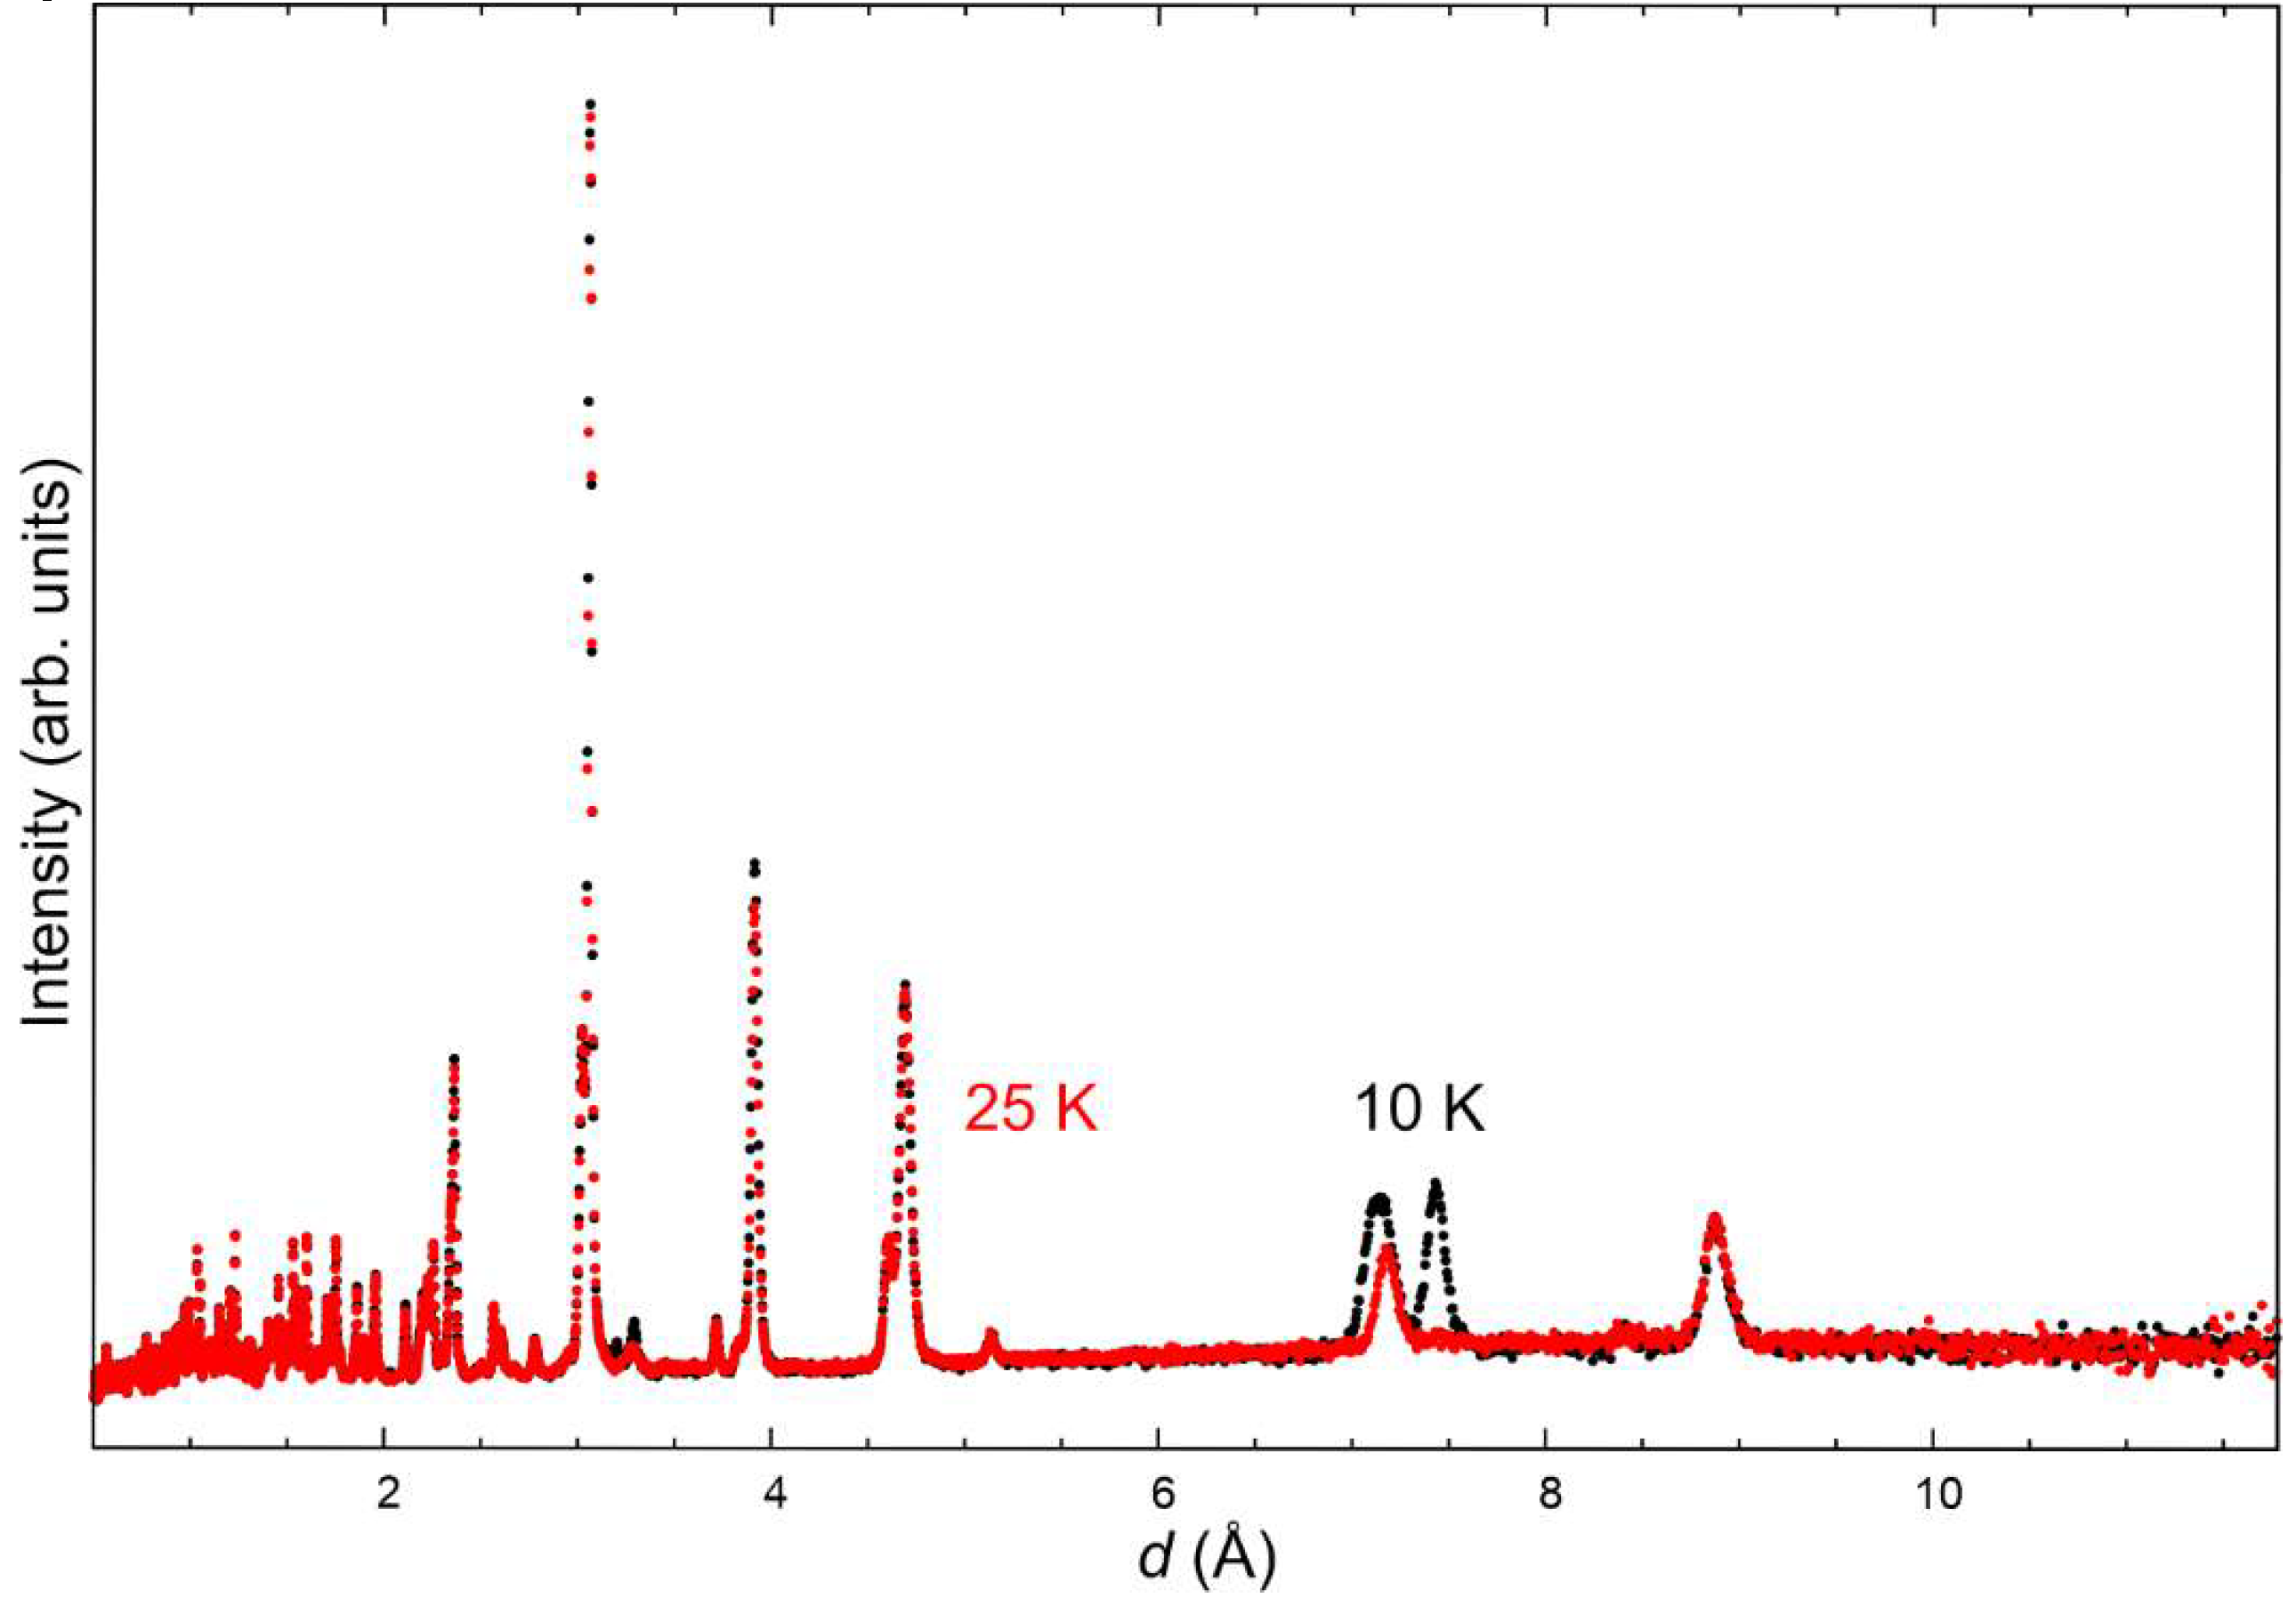
Figure 7.
Experimental (data points) and simulated (colored line) 57Fe Mössbauer spectrum of 1 measured at 78 K.
Figure 7.
Experimental (data points) and simulated (colored line) 57Fe Mössbauer spectrum of 1 measured at 78 K.
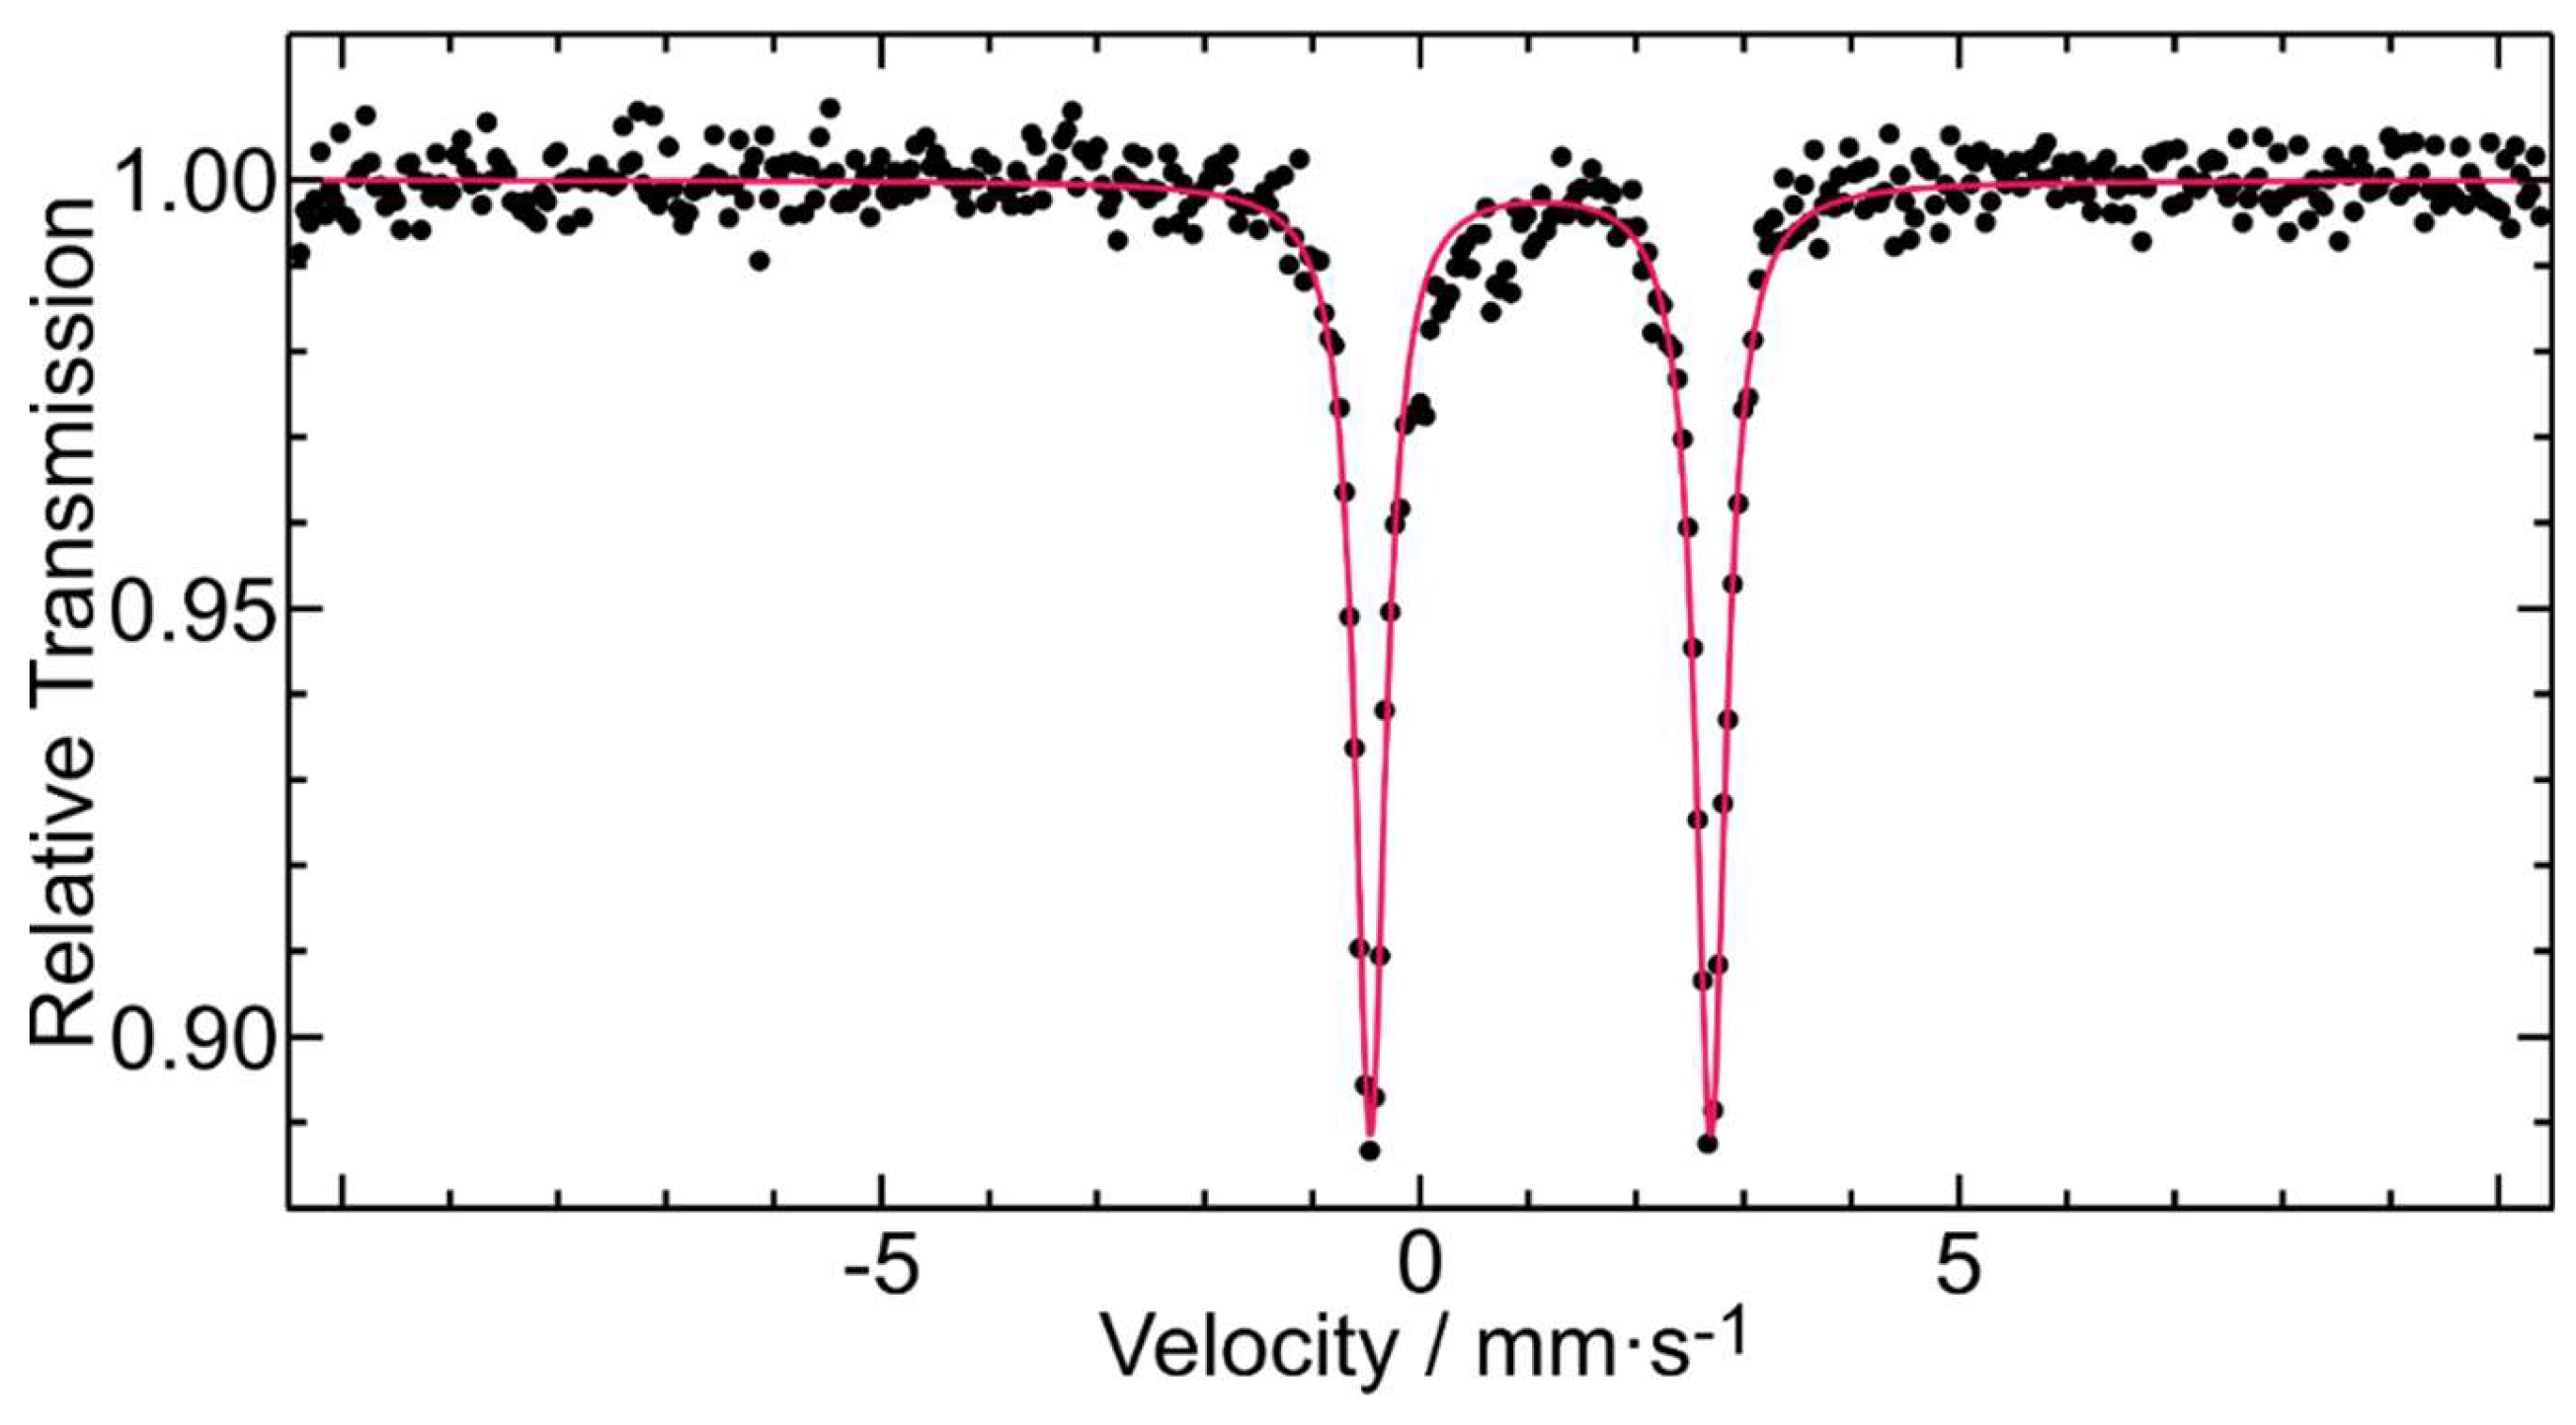
Figure 8.
On the left: ATR-IR measurements of 1 (top) and 2 (bottom), on the right: thermogravimetric analysis of 1 with possible decompositions steps (inset).
Figure 8.
On the left: ATR-IR measurements of 1 (top) and 2 (bottom), on the right: thermogravimetric analysis of 1 with possible decompositions steps (inset).
Disclaimer/Publisher’s Note: The statements, opinions and data contained in all publications are solely those of the individual author(s) and contributor(s) and not of MDPI and/or the editor(s). MDPI and/or the editor(s) disclaim responsibility for any injury to people or property resulting from any ideas, methods, instructions or products referred to in the content. |
© 2026 by the authors. Licensee MDPI, Basel, Switzerland. This article is an open access article distributed under the terms and conditions of the Creative Commons Attribution (CC BY) license (http://creativecommons.org/licenses/by/4.0/).
Copyright: This open access article is published under a Creative Commons CC BY 4.0 license, which permit the free download, distribution, and reuse, provided that the author and preprint are cited in any reuse.