

Submitted:
23 July 2026
Posted:
24 July 2026
You are already at the latest version
Abstract
Dysregulated insulin signaling in brain has been linked to cognitive impairment and dementia. Insulin-like growth factor-1 (IGF-1) is a peptide growth hormone crucial for neurogenesis and neuroprotection. Findings regarding potential involvement of IGF-1 in dementia have been conflicting, and the status of IGF-1 in clinical cohorts with Alzheimer’s disease (AD) and concomitant cerebrovascular disease (CeVD) burden is unknown. A Singapore-based memory clinic cohort consisting of 46 non-cognitively impaired (NCI), 101 with cognitive impairment, no dementia (CIND) and 81 AD dementia subjects underwent plasma IGF-1 measurements and neuroimaging assessments for association analyses of peripheral IGF-1 with regional brain volumes, as well as with neuroimaging CeVD markers (lacunes, cerebral microbleeds, white matter hyperintensities). Plasma IGF-1 levels were significantly lower in AD compared to NCI and CIND participants (both p < 0.001). Plasma IGF-1 was significantly associated with smaller hippocampal (p = 0.035), amygdala (p = 0.024), parietal lobe (p = 0.029), and frontal lobe (p = 0.002) volumes. In contrast, plasma IGF-1 did not associate with CeVD markers after covariate adjustments. Our findings suggest that plasma IGF-1 may be a specific blood-based biomarker for neurodegeneration, while having no direct role in CeVD pathophysiology.
Keywords:
Alzheimer’s disease
; insulin-like growth factor 1
; biomarker
; neurodegeneration
; cerebrovascular disease
Alzheimer’s disease (AD) is the most common type of neurodegenerative dementia, characterized by cortical β-amyloid (Aβ) plaque deposition and neurofibrillary tangles (NFTs). As the disease progresses, accumulative neuronal death and dysfunction lead to brain atrophy and cognitive impairment. Furthermore, while cerebrovascular disease is recognized as a distinct process which can lead to vascular dementia (VaD, as part of the spectrum of vascular cognitive impairment), there is increasing evidence that cerebrovascular disease may be a common co-pathology in patients with AD [1,2], which in turn contributes to AD progression, including the exacerbation of cognitive impairment and dementia severity [3,4]. Additionally, atherosclerosis of large vessels like the Circle of Willis has been reported to be associated with more severe cortical and hippocampal atrophy [5], while associations between cerebrovascular disease (CeVD) subtypes (such as white matter lesions, lacunar infarcts, cerebral microbleeds) and cortical atrophy are less clear. Importantly, whilst peripheral biomarkers of AD and VaD have been widely investigated [6], studies into biomarkers which can differentiate AD- vs. CeVD-associated processes in patients who manifest concomitant disease remain scarce.
There has been growing interest in the potential roles that insulin signaling dysregulation may play in the pathogenesis of cognitive impairment and dementia [7,8,9,10,11], where insulin-like growth factor 1(IGF-1) is a key player in the insulin signaling axis. IGF-1 is a peptide hormone that is structurally similar to insulin but produced primarily by hepatocytes [12]. It is secreted in response to changes in growth hormone (GH) levels in the body and as such, IGF-1 concentrations peak at the age of puberty and declines progressively with age [13,14]. However, IGF-1 can also be found in neurons independently of GH [15,16], where it has key roles in neurogenesis and synaptogenesis [17,18]. In animal models, IGF-1 knockdown showed reduced adult hippocampal neurogenesis and impaired spatial memory [19,20]. Conversely, overexpression of IGF-1 in animal models increases brain volumes [21]. Recent clinical studies on the role of IGF-1 in neurodegeneration have shown complementary results, where a few studies reported associations between increased serum IGF-1 in AD patients and better cognition outcomes [22,23,24], while others have reported lower IGF-1 levels in AD patients [25,26] which were associated with lower brain volumes [27,28].
Reduced IGF-1 has also been linked to several vascular disease factors, including increased risks of ischemic stroke [29], hypertension [30], cardiovascular diseases [31,32,33], diabetes mellitus [34] and metabolic syndrome [35]. However, it is unclear if peripheral IGF-1 is associated with specific CeVD subtypes. In this study, we measured plasma IGF-1 in a Singaporean memory clinic cohort, and studied its associations with neuroimaging assessments of brain atrophy and CeVD.
2. Materials and Methods
2.1. Study Population
Details of the longitudinal study from which the participants of the present study are derived (n = 228, recruited between 2010 and 2013) have been previously described [36]. Briefly, informed consent was obtained from participants or their next-of-kin prior to recruitment into the study with approval from the Singapore National Healthcare Group Domain–Specific Review Board (reference: 2010/00017; study protocol number: DEM4233) for the collection of detailed medical and drug histories, clinical evaluations, neuroimaging, cognitive assessments (Mini-Mental State Examination (MMSE, score ranges 0 – 30, with higher scores indicating better function) and Clinical Dementia Rating-Sum of Boxes (CDR-SB, score ranges 0 – 18, with higher scores indicating greater cognitive and functional impairment), as well as blood-draw for plasma IGF-1 measurements.
2.2. Clinical Diagnoses of Cognitive Impairment and Dementia Study Population
Diagnoses of all participants were made at consensus meetings of study clinicians and neuropsychologists as previously described [36]. Briefly, participants with no cognitive impairment (NCI) had no objective cognitive impairment based on formal neuropsychological assessments. Participants with cognitive impairment, no dementia (CIND) did not meet the Diagnostic and Statistical Manual of Mental Disorders, Fourth Edition (DSM-IV) diagnostic criteria for dementia but had impairment in at least one cognitive domain on a neuropsychological test battery as previously described [37]. Clinical diagnoses of AD dementia were made according to the DSM-IV criteria as well as the NINCDS-ADRDA criteria [38].
2.3. Assessment of Other Risk Factors
Risk factors (hypertension, hyperlipidemia, diabetes mellitus and cardiovascular diseases) were obtained through detailed questionnaires, clinical interviews and were classified in this study as present or absent, based on past medical history or usage of medication for the treatment of the condition. Hypertension was defined as systolic blood pressure of ≥ 140 mmHg and/or diastolic blood pressure of ≥ 90 mmHg or a history of use of anti-hypertensive medication. Hyperlipidemia was defined as having total cholesterol levels of ≥ 4.14 mM or a history of use of lipid-lowering medication. Diabetes mellitus was defined as glycated haemoglobin (HbA1c) of ≥ 6.5% or a history of use of diabetic medication. Cardiovascular disease was defined as having a positive history of atrial fibrillation, congestive heart failure and/or myocardial infarction. Positive APOE4 (ε4 variant of the apolipoprotein E gene) status was also assessed as previously described [39] and defined as having at least one ε4 allele.
2.4. Neuroimaging
Magnetic resonance imaging (MRI) scans were performed on a 3T Siemens Magnetom Trio Tim scanner using a 32-channel head coil at the Clinical Imaging Research Centre, National University of Singapore. The sequences included T1-weighted, fluid attenuated inversion recovery (FLAIR), T2-weighted, and susceptibility-weighted imaging sequences (see Supplementary Data S1) as described previously [40].
2.4.1. Brain Atrophy MRI Markers
Initial analysis consisted of measures of global cortical atrophy based on dichotamization of GCA scores (< 2, none to mild vs. ≥ 2, moderate to severe, see Figure 1) [41]. Furthermore, quantitative analyses of regional brain atrophy were performed using an automated segmentation procedure at the Department of Medical Informatics, Erasmus University Medical Center, Netherlands (FreeSurfer, v.5.1.0). Image preprocessing and the tissue classification algorithm was performed to quantify global cortical thickness [42], which was measured as the shortest distance between grey/white matter boundary and pial surface at each vertex. All MRI scans were also processed with AccuBrain® IV 2.0 (BrainNow Medical Technology Ltd., Hong Kong SAR), a fully automated software for brain volumetric segmentation and quantification [43,44].
2.4.2. Cerebrovascular Disease MRI Markers
Detailed descriptions of visual gradings of CeVD markers, namely white matter hyperintensities (WMH), lacunes and cerebral microbleeds (CMBs), together with cortical infarcts can be found in Supplementary Data S1. Presence of significant WMH was also assessed based on dichotamization of Fazeka scores (< 2, absent or only punctate foci vs. ≥ 2, beginning confluent or large confluent areas in deep white matter regions, see Figure 1) [41]. Furthermore, WMH was graded using the Age-Related White Matter Changes (ARWMC) scale [45], which was also dichotomized (≥ 8, a significant burden of white matter disease). Clinically significant cerebrovascular disease (CeVD+) was defined as the presence of cortical infarcts and/or ≥ 2 lacune, and/or confluent WMH (ARWMC ≥ 8) in at least 2 brain regions, as previously proposed [46].
2.5. Blood Biomarker Measurements
Non-fasting blood was collected from study participants and processed by centrifugation at 2000g at 4oC for 10 minutes for plasma extraction and stored at -80oC until use. Plasma IGF-1 was measured by a quantitative sandwich immunoassay technique (Quantikine, Cat number: DG100B, R&D Systems Inc., Minneapolis, MN, USA) in accordance with manufacturer’s instructions.
2.6. Statistical Analyses
Statistical analyses were performed using IBM SPSS Statistics version 26 (IBM Co., Armonk, NY, USA). Normally distributed continuous data are presented as mean ± standard deviation (SD), while skewed continuous data are presented as median (interquartile range, IQR). Group comparisons of continuous demographic variables were performed using independent t-tests and one-way analysis of variance (ANOVA) with post-hoc Bonferroni tests for normally distributed data and non-parametric Mann-Whitney U tests or Kruskal-Wallis test with Dunn’s procedure for skewed distributed data. For categorical variables, chi-square tests were used. Correlation analyses were performed using Spearman’s rank correlations. Negative binomial regression models were used for counts of cortical infarcts, lacunes and CMBs. Binary logistic regression models were used for ARWMC scores. All models were adjusted for age, sex, education, APOE4 carrier status, hypertension, hyperlipidemia, diabetes and cardiovascular diseases. Volumetric measures were further adjusted for total intracranial volume. Significance was set at p < 0.05.
3. Results
3.1. Participant Characteristics
Table 1 shows the baseline demographic characteristics of the 228 study participants. Among them, 46 (20.2%) were NCI, 101 (44.3%) were CIND and 81 (35.5%) were AD dementia participants. Compared to NCI, CIND and AD dementia participants were older and less educated. The prevalence of hypertension and diabetes was higher in AD dementia participants compared to NCI participants. No significant difference was observed in APOE ε4 carrier frequency, prevalence of hyperlipidemia and cardiovascular diseases among groups. Plasma IGF-1 levels were lower in female participants, and negatively correlated with age (Spearman’s rho = -0.429), but positively correlated with education (rho = 0.292). There was no significant difference in plasma IGF-1 levels in those with hypertension, hyperlipidemia, diabetes and cardiovascular diseases.
3.2. Plasma IGF-1 Changes Across Diagnostic Groups
When compared across the clinical diagnostic groups, a significant decrease in plasma IGF-1 was observed only in AD participants (mean [SD] = 49.2 [17.1] ng/ml) compared to the NCI (65.6 [15.1] ng/ml) and CIND (61.2 [19.1] ng/ml) groups (Figure 1A). There was no significant difference between NCI and CIND participants (p = 0.491). Plasma IGF-1 was also lower in participants with significant global cortical atrophy (GCA) (Figure 1B). In contrast, IGF-1 levels were not significantly altered when participants were segregated either by CeVD- vs. CeVD+ (Figure 1C) or specifically by presence vs. absence of significant WMH (Figure 1D).
3.3. Associations Between Plasma IGF-1 and MRI Markers of Brain Atrophy
Following the GCA analysis above, we performed correlation analyses with each brain region listed in Supplementary Table S1. All regional brain volumes analyzed were positively correlated with plasma IGF-1, with rho values ranging from 0.327 to 0.389 (all p < 0.001). Furthermore, we performed univariate linear regression of quantitative regional brain volumes adjusted for covariates. Table 2 shows linear regression models with significant associations with plasma IGF-1 after adjusting for age, sex, education and total intracranial volume (Model 1), and additionally for APOE4 status, hypertension, hyperlipidemia, diabetes mellitus and cardiovascular diseases (Model 2): hippocampal volume (β = 0.956, p = 0.035), global cortical thickness (β = 0.217, p = 0.002), amygdala volume (β = 0.504, p = 0.024), parietal lobe volume (β = 8.336, p = 0.029), frontal lobe volume (β = 12.584, p = 0.048) and gray matter volume (β = 39.486, p = 0.016). Only temporal lobe volume (β = 8.638, p = 0.060) failed to reach statistical significance after Model 2 adjustments.
3.4. Associations Between Plasma IGF-1 and MRI Markers of CeVD
We initially showed that plasma IGF-1 levels did not significantly differ between CeVD- and CeVD+ participants (see Figure 1). We then proceeded to assess IGF-1 correlations with CeVD subtypes, and found that cerebral microbleed (CMB) count (rho = -0.095), lacunes count (rho = -0.032) and cortical infarcts count (rho = -0.046) were not correlated to plasma IGF-1 levels (all p-values > 0.05). ARWMC scores for WMH was negatively correlated with IGF-1 (rho = -0.168), but no associations were found for ARWMC or other CeVD types on regression analyses adjusted for covariates (see Table 3).
3.5. Sensitivity Analyses
As this study included participants with larger cortical infarcts as well as small vessel diseases, sensitivity analyses to assess the potential effects of larger lesions were performed by excluding participants with large structural lesions (n = 7) on demographic variables (Table S2), Diagnostic group differences (Supplementary Figure S1), Regression analyses of brain atrophy measures (Table S3) and CeVD markers (Supplementary Table S4), which showed that all results and conclusions remained unchanged, except for the loss of statistical significance for the association between plasma IGF-1 and frontal lobe volume.
3.6. Associations Between Plasma IGF-1 and Cognition
Given the strong association observed between IGF-1 and brain atrophy, as well as the established association between brain atrophy and cognitive impairment, we examined whether IGF-1 was associated with cognitive performance. Table S5 showed that IGF-1 was positively correlated with baseline MMSE scores (rho = 0.245) and negatively correlated with CDR-Sum of Boxes (CDR-SoB) scores (rho = -0.277).
4. Discussion
This study on a Singapore-based cohort with comprehensive neuroimaging showed decreased plasma IGF-1 levels in AD dementia patients compared to NCI controls and CIND, corroborating a number of previous studies [25,26,47]. The dysregulation in the IGF-1 signalling axis has been shown to mediate the pathogenesis of AD [48], where IGF-1 deficits disrupt glucose metabolism in the brain, subsequently culminating in neuroinflammation [49], neuronal death and neurodegeneration [50]. Decreased IGF-1 levels have also been linked to worse prognosis in other neurodegenerative diseases such as Parkinson’s disease [51] and multiple sclerosis [52]. In parallel, adults with growth hormone disorders have demonstrated reduced IGF-1 and altered cortical thickness [53].
Our findings of significant associations between lower plasma IGF-1 levels and smaller hippocampal volume as well as cortical thinning are corroborated by prior studies [27,28,47,54]. Whilst hippocampal atrophy is a prominent feature in AD [55,56,57,58,59]. This study is, to the best of our knowledge, the first to expand findings of IGF-1 associations with multiple other brain regions, and the positive association with gray matter volume and lobar volumes support the hypothesis that IGF-1 decline is associated with the severity of neurodegeneration. Interestingly, plasma IGF-1 decreases were significantly associated with amygdala atrophy, which previous studies have observed in early stages of AD [59,60,61,62]. The amygdala atrophy pattern is predictive of conversion to dementia [63,64], although not as strongly as hippocampal atrophy [65]. Plasma IGF-1 was also associated with parietal lobe atrophy, which has been gaining interest due to its prominence in presymptomatic stages of AD [66,67], with the degeneration of the inferior parietal lobule being especially detrimental for AD [68,69,70]. Therefore, plasma IGF-1 should be further assessed as a potential biomarker for these features, which aligns with the rising interest of using the atrophy of a composite of brain regions other than the hippocampus in isolation, to aid the early diagnosis of AD [70].
By contrast to the findings for brain atrophy measures, we did not observe any significant changes in plasma IGF-1 levels in participants with significant CeVD burden. Although previous studies have highlighted IGF-1 involvement in white matter protection [71] or reduced WMH volumes [27,72], we also did not observe any IGF-1 association in WMH volumes in this cohort after adjustment for covariates (Table 3). Additionally, this study is, as far as we know, the first to investigate plasma IGF-1 associations with lacunes and microbleeds in a clinical cohort, and we again report no associations between IGF-1 and these small vessel disease subtypes, nor with larger cortical infarcts. As the cohort investigated by the present study is known to have high CeVD burden concomitant to amyloid pathology [73], our results point to specific involvement of IGF-1 deficits in AD-associated brain atrophy, while showing a lack of direct pathophysiological link to cerebrovascular-related pathology. This also suggests that plasma IGF-1 may be a useful biomarker in differentiating AD- from vascular cognitive impairment-driven processes. Furthermore, our results point to IGF-1 as a potential therapeutic target which may have protective mechanisms independent of its effect on glucose metabolism, since its association with brain atrophy remained significant after adjusting for diabetes mellitus (see Table 2). However, studies proposing intervention with IGF-1 may need to contend with a complex relationship between IGF-1 and brain neuroimaging or cognitive outcomes. For example, Cao et al. reported a U-shaped relationship between IGF-1 concentrations and risk of dementia and stroke in the UK Biobank Cohort [27], findings supported by a meta-analysis showing that mid-range IGF-1 concentrations in the body may be optimal for preventing cognitive decline [74]. This necessitates further studies elucidating the relationships amongst IGF-1, brain volumes and cognitive function.
The significant correlations observed between IGF-1 and both brain atrophy and cognitive outcomes suggest that IGF-1 may be associated with the structural and functional aspects of brain health. The association with cognition is consistent with the established relationship between brain atrophy and cognitive decline and may indicate that the effects of IGF-1 on cognitive performance are through the preservation of brain structure. These findings align with the proposed neuroprotective role of IGF-1, which has been implicated in neuronal survival, synaptic plasticity, and maintenance of brain volume. Together, the observed associations support a potential link between higher IGF-1 levels, reduced neurodegeneration, and better cognitive function.
The strengths of this study would be the careful clinical diagnoses of cognitive impairment and dementia based on comprehensive neuropsychological assessments, as well as the use of 3T-MRI to grade and classify participants with CeVD and brain atrophy. Furthermore, quantitative volumetric measurements for multiple individual brain regions were available using cutting-edge platforms. However, several limitations of this study should also be recognized. Firstly, as this analysis is cross-sectional, the temporal association between IGF-1 and progression of brain atrophy or CeVD progression require further study. A follow-up study with longitudinal IGF-1 measurements may provide better temporal correlations between biomarker changes and clinical progression of cognitive decline. Furthermore, although IGF-1 is one of the key proteins of the IGF signaling axis, potential confounding effects of other important components of the putative underlying pathways, such as IGF-2, IGF binding proteins (IGFBPs) and receptors, were not considered in this study. In particular, the associations between IGF-1 and IGFBPs should be further investigated given that different IGFBP subtypes differentially modulate IGF-1 bioavailability, stability, and receptor signaling [75]. Lastly, the association of IGF-1 levels with other pathological hallmarks of AD, such as amyloid plaque and neurofibrillary tangle burden, require further examination.
5. Conclusions
This study shows that decreased plasma IGF-1 is a potential biomarker specifically for widespread brain atrophy, while showing no association with concomitant CeVD, in a cohort of participants with AD dementia. IGF-1 may be a therapeutic target for AD-associated neurodegeneration. Future studies are needed to validate the current findings and elucidate the pathophysiological mechanisms underlying the associations between IGF-1 deficits and brain atrophy.
Supplementary Materials
The following supporting information can be downloaded at the website of this paper posted on Preprints.org, Data S1: Magnetic resonance imaging protocol and CeVD description; Table S1: Correlations of plasma IGF-1 with regional brain volumes; Table S2: Baseline demographics and neuroimaging characteristics of the participants excluding participants with large structural lesions on MRI scans (n = 7); Table S3: Associations of plasma IGF-1 with regional brain volumes excluding participants with large structural lesions on MRI scans (n = 7); Table S4: Associations of plasma IGF-1 with MRI markers of CeVD excluding participants with large structural lesions on MRI scans (n = 7); Table S5: Correlations with plasma IGF-1 with cognitive test scores; Figure S1: Plasma IGF-1 levels across diagnostic groups excluding participants with large structural lesions on MRI scans (n = 7).
Author Contributions
M.K.P.L and C.P.C. have full access to all of the data in the study and take responsibility for the integrity of the data and the accuracy of the data analysis. Concept and design: A.T.Y.Y., Y.L.C. and J.R.C. Acquisition, analysis, and interpretation of data: A.T.Y.Y., Y.L.C., S.H., C.Y., V.C.T.M., N.V., B.Y.T., M.A.S. and J.R.C. Drafting of the manuscript: A.T.Y.Y., Y.L.C and J.R. C. Critical revision of the manuscript for important intellectual content: all authors. Statistical analyses: A.T.Y.Y., Y.L.C., M.A.S. and J.R.C. Data visualization: A.T.Y.Y. and M.K.P.L. Supervision: M.K.P.L. and C.P.C. Funding acquisition: M.K.P.L. and C.P.C. All authors have read and agreed to the published version of the manuscript.
Funding
This study was supported by the National Medical Research Council (MOH-000707-01 and NMRC/CG/M006/2017 to C.P.C. and M.K.P.L.) and the NUS Healthy Longevity Translational Research Programme (HLTRP/2022/PS-01 to M.K.P.L.).
Institutional Review Board Statement
This study was conducted in accordance with the Declaration of Helsinki, and approval was given by the Singapore National Healthcare Group Domain–Specific Review Board (NHG–DSRB) (reference: 2010/00017; study protocol number: DEM4233).
Informed Consent Statement
Participants or their caregivers gave informed consent to participate in this study before taking part.
Data Availability Statement
Anonymised data derived from this study may be provided by the corresponding author upon reasonable request.
Acknowledgments
We acknowledge all of the Memory Aging and Cognition Centre, National University Hospital, coordinators for their contribution to recruitment and data acquisition. Joyce Chong is a recipient of an International Fellowship from the Agency for Science, Technology and Research (A*STAR), Singapore.:
Conflicts of Interest
The authors declare no conflicts of interest in regards to this study.
References
- Toledo, J.B.; et al. Contribution of cerebrovascular disease in autopsy confirmed neurodegenerative disease cases in the National Alzheimer’s Coordinating Centre. Brain 2013, 136 Pt 9, 2697–706. [Google Scholar] [CrossRef] [PubMed]
- Kim, S.E.; et al. Interaction between Alzheimer’s Disease and Cerebral Small Vessel Disease: A Review Focused on Neuroimaging Markers. Int. J. Mol. Sci. 2022, 23(18). [Google Scholar] [CrossRef] [PubMed]
- Schneider, J.A.; et al. Mixed brain pathologies account for most dementia cases in community-dwelling older persons. Neurology 2007, 69(24), 2197–204. [Google Scholar] [CrossRef] [PubMed]
- Kim, H.W.; Hong, J.; Jeon, J.C. Cerebral Small Vessel Disease and Alzheimer’s Disease: A Review. Front Neurol. 2020, 11, 927. [Google Scholar] [CrossRef] [PubMed]
- Crystal, H.A.; et al. Associations of cerebrovascular and Alzheimer’s disease pathology with brain atrophy. Curr. Alzheimer Res. 2014, 11(4), 309–16. [Google Scholar] [CrossRef] [PubMed]
- Ouyang, X.; et al. Peripheral biomarkers of neuroinflammation in Alzheimer’s disease and vascular dementia. Biochem Pharmacol. 2026, 250 Pt 2, 118077. [Google Scholar] [CrossRef] [PubMed]
- Willette, A.A.; et al. Association of Insulin Resistance With Cerebral Glucose Uptake in Late Middle-Aged Adults at Risk for Alzheimer Disease. JAMA Neurol. 2015, 72(9), 1013–20. [Google Scholar] [CrossRef] [PubMed]
- de la Monte, S.M.; Tong, M. Brain metabolic dysfunction at the core of Alzheimer’s disease. Biochem Pharmacol. 2014, 88(4), 548–59. [Google Scholar] [CrossRef] [PubMed]
- Schubert, M.; et al. Role for neuronal insulin resistance in neurodegenerative diseases. Proc. Natl. Acad. Sci. U S A 2004, 101(9), 3100–5. [Google Scholar] [CrossRef] [PubMed]
- De Felice, F.G.; Goncalves, R.A.; Ferreira, S.T. Impaired insulin signalling and allostatic load in Alzheimer disease. Nat. Rev. Neurosci. 2022, 23(4), 215–230. [Google Scholar] [CrossRef] [PubMed]
- Biessels, G.J.; Reagan, L.P. Hippocampal insulin resistance and cognitive dysfunction. Nat. Rev. Neurosci. 2015, 16(11), 660–71. [Google Scholar] [CrossRef] [PubMed]
- Yakar, S.; et al. Normal growth and development in the absence of hepatic insulin-like growth factor I. Proc. Natl. Acad. Sci. U S A 1999, 96(13), 7324–9. [Google Scholar] [CrossRef] [PubMed]
- Yamamoto, H.; et al. Effects of aging and sex on plasma insulin-like growth factor I (IGF-I) levels in normal adults. Acta Endocrinol. (Copenh) 1991, 124(5), 497–500. [Google Scholar] [CrossRef] [PubMed]
- van Dam, P.S.; Aleman, A. Insulin-like growth factor-I, cognition and brain aging. Eur. J. Pharmacol. 2004, 490(1-3), 87–95. [Google Scholar] [CrossRef] [PubMed]
- Bartke, A.; Sun, L.Y.; Longo, V. Somatotropic signaling: trade-offs between growth, reproductive development, and longevity. Physiol. Rev. 2013, 93(2), 571–98. [Google Scholar] [CrossRef] [PubMed]
- Sun, L.Y.; et al. Local expression of GH and IGF-1 in the hippocampus of GH-deficient long-lived mice. Neurobiol. Aging 2005, 26(6), 929–37. [Google Scholar] [CrossRef] [PubMed]
- Aberg, D. Role of the growth hormone/insulin-like growth factor 1 axis in neurogenesis. Endocr. Dev. 2010, 17, 63–76. [Google Scholar] [PubMed]
- Lee, E.; Son, H. Adult hippocampal neurogenesis and related neurotrophic factors. BMB Rep. 2009, 42(5), 239–44. [Google Scholar] [CrossRef] [PubMed]
- Llorens-Martin, M.; Torres-Aleman, I.; Trejo, J.L. Exercise modulates insulin-like growth factor 1-dependent and -independent effects on adult hippocampal neurogenesis and behaviour. Mol. Cell Neurosci. 2010, 44(2), 109–17. [Google Scholar] [CrossRef] [PubMed]
- Trejo, J.L.; Llorens-Martin, M.V.; Torres-Aleman, I. The effects of exercise on spatial learning and anxiety-like behavior are mediated by an IGF-I-dependent mechanism related to hippocampal neurogenesis. Mol. Cell Neurosci. 2008, 37(2), 402–11. [Google Scholar] [CrossRef] [PubMed]
- Carson, M.J.; et al. Insulin-like growth factor I increases brain growth and central nervous system myelination in transgenic mice. Neuron 1993, 10(4), 729–40. [Google Scholar] [CrossRef] [PubMed]
- Johansson, P.; et al. Serum but not cerebrospinal fluid levels of insulin-like growth factor-I (IGF-I) and IGF-binding protein-3 (IGFBP-3) are increased in Alzheimer’s disease. Psychoneuroendocrinology 2013, 38(9), 1729–37. [Google Scholar] [CrossRef] [PubMed]
- Tumati, S.; et al. Association between Cognition and Serum Insulin-Like Growth Factor-1 in Middle-Aged & Older Men: An 8 Year Follow-Up Study. PLoS ONE 2016, 11(4), e0154450. [Google Scholar] [CrossRef] [PubMed]
- Perice, L.; et al. Lower circulating insulin-like growth factor-I is associated with better cognition in females with exceptional longevity without compromise to muscle mass and function. Aging 2016, 8(10), 2414–2424. [Google Scholar] [CrossRef] [PubMed]
- Kimoto, A.; et al. Serum insulin-like growth factor-I and amyloid beta protein in Alzheimer’s disease: relationship with cognitive function. Psychogeriatrics 2016, 16(4), 247–54. [Google Scholar] [PubMed]
- Duron, E.; et al. Insulin-like growth factor-I and insulin-like growth factor binding protein-3 in Alzheimer’s disease. J. Clin. Endocrinol. Metab. 2012, 97(12), 4673–81. [Google Scholar] [CrossRef] [PubMed]
- Cao, Z.; et al. Circulating insulin-like growth factor-1 and brain health: Evidence from 369,711 participants in the UK Biobank. Alzheimers Res. Ther. 2023, 15(1), 140. [Google Scholar] [CrossRef] [PubMed]
- Westwood, A.J.; et al. Insulin-like growth factor-1 and risk of Alzheimer dementia and brain atrophy. Neurology 2014, 82(18), 1613–9. [Google Scholar] [CrossRef] [PubMed]
- Saber, H.; et al. Serum Insulin-Like Growth Factor 1 and the Risk of Ischemic Stroke: The Framingham Study. Stroke 2017, 48(7), 1760–1765. [Google Scholar] [CrossRef] [PubMed]
- Hunt, K.J.; et al. A potential inverse association between insulin-like growth factor I and hypertension in a cross-sectional study. Ann. Epidemiol. 2006, 16(7), 563–71. [Google Scholar] [CrossRef] [PubMed]
- Juul, A.; et al. Low serum insulin-like growth factor I is associated with increased risk of ischemic heart disease: a population-based case-control study. Circulation 2002, 106(8), 939–44. [Google Scholar] [CrossRef] [PubMed]
- Ungvari, Z.; Csiszar, A. The emerging role of IGF-1 deficiency in cardiovascular aging: recent advances. J. Gerontol. A Biol. Sci. Med. Sci. 2012, 67(6), 599–610. [Google Scholar] [CrossRef] [PubMed]
- Kong, A.P.; et al. Serum concentrations of insulin-like growth factor-I, insulin-like growth factor binding protein-3 and cardiovascular risk factors in adolescents. Ann. Clin. Biochem 2011, 48 Pt 3, 263–9. [Google Scholar] [PubMed]
- Sesti, G.; et al. Plasma concentration of IGF-I is independently associated with insulin sensitivity in subjects with different degrees of glucose tolerance. Diabetes Care 2005, 28(1), 120–5. [Google Scholar] [CrossRef] [PubMed]
- Aguirre, G.A.; et al. Insulin-like growth factor-1 deficiency and metabolic syndrome. J. Transl. Med. 2016, 14, 3. [Google Scholar] [CrossRef] [PubMed]
- Lim, M.J.; et al. HARMONISATION - A multimodal prospective study of vascular cognitive impairment in multi-ethnic Asians: Cohort profile, progress, current contributions, and future impact. J. Alzheimers Dis. 2025, 108(4), 1452–1474. [Google Scholar] [CrossRef] [PubMed]
- Chai, Y.L.; et al. Elevated serum inflammasome adaptor protein ASC is associated with white matter hyperintensities in vascular cognitive impairment. Brain Commun. 2026. 8, 2, fcag068. [Google Scholar]
- McKhann, G.M.; et al. The diagnosis of dementia due to Alzheimer’s disease: recommendations from the National Institute on Aging-Alzheimer’s Association workgroups on diagnostic guidelines for Alzheimer’s disease. Alzheimers Dement 2011, 7(3), 263–9. [Google Scholar] [CrossRef] [PubMed]
- Chai, Y.L.; et al. Apolipoprotein e4 is Associated with Dementia and Cognitive Impairment Predominantly Due to Alzheimer’s Disease and Not with Vascular Cognitive Impairment: A Singapore-Based Cohort. J. Alzheimers Dis. 2016, 51(4), 1111–8. [Google Scholar] [CrossRef] [PubMed]
- van Veluw, S.J.; et al. Cortical microinfarcts on 3T MRI: Clinical correlates in memory-clinic patients. Alzheimers Dement 2015, 11(12), 1500–1509. [Google Scholar] [CrossRef] [PubMed]
- Wahlund, L.O.; et al. Imaging biomarkers of dementia: recommended visual rating scales with teaching cases. Insights Imaging 2017, 8(1), 79–90. [Google Scholar] [PubMed]
- Vrooman, H.A.; et al. Multi-spectral brain tissue segmentation using automatically trained k-Nearest-Neighbor classification. Neuroimage 2007, 37(1), 71–81. [Google Scholar] [CrossRef] [PubMed]
- Zhao, L.; et al. Risk estimation before progression to mild cognitive impairment and Alzheimer’s disease: an AD resemblance atrophy index. Aging 2019, 11(16), 6217–6236. [Google Scholar] [CrossRef] [PubMed]
- Zhao, L.; et al. Automated brain volumetric measures with AccuBrain: version comparison in accuracy, reproducibility and application for diagnosis. BMC Med. Imaging 2022, 22(1), 117. [Google Scholar] [CrossRef] [PubMed]
- Wahlund, L.O.; et al. A new rating scale for age-related white matter changes applicable to MRI and CT. Stroke 2001, 32(6), 1318–22. [Google Scholar] [CrossRef] [PubMed]
- Hilal, S.; et al. Markers of cardiac dysfunction in cognitive impairment and dementia. Medicine 2015, 94(1), e297. [Google Scholar] [CrossRef] [PubMed]
- Angelini, A.; et al. Insulin-like growth factor-1 (IGF-1): relation with cognitive functioning and neuroimaging marker of brain damage in a sample of hypertensive elderly subjects. Arch. Gerontol. Geriatr. 2009, 49 Suppl 1, 5–12. [Google Scholar] [CrossRef] [PubMed]
- Steen, E.; et al. Impaired insulin and insulin-like growth factor expression and signaling mechanisms in Alzheimer’s disease--is this type 3 diabetes? J. Alzheimers Dis. 2005, 7(1), 63–80. [Google Scholar] [CrossRef] [PubMed]
- Labandeira-Garcia, J.L.; et al. Insulin-Like Growth Factor-1 and Neuroinflammation. Front Aging Neurosci. 2017, 9, 365. [Google Scholar] [CrossRef] [PubMed]
- de la Monte, S.M.; et al. Insulin resistance and neurodegeneration: roles of obesity, type 2 diabetes mellitus and non-alcoholic steatohepatitis. Curr. Opin. Investig. Drugs 2009, 10(10), 1049–60. [Google Scholar] [PubMed]
- Ghazi Sherbaf, F.; et al. Serum Insulin-Like Growth Factor-1 in Parkinson’s Disease; Study of Cerebrospinal Fluid Biomarkers and White Matter Microstructure. Front Endocrinol. 2018, 9, 608. [Google Scholar] [CrossRef]
- Nageeb, R.S.; Hashim, N.A.; Fawzy, A. Serum insulin-like growth factor 1 (IGF-1) in multiple sclerosis: relation to cognitive impairment and fatigue. Egypt J. Neurol. Psychiatr. Neurosurg. 2018, 54(1), 25. [Google Scholar] [CrossRef] [PubMed]
- Yang, H.; et al. Alterations in Cortical Thickness in Young Male Patients With Childhood-Onset Adult Growth Hormone Deficiency: A Morphometric MRI Study. Front Neurosci. 2019, 13, 1134. [Google Scholar] [CrossRef] [PubMed]
- Wittfeld, K.; et al. Insulin-Like Growth Factor, Inflammation, and MRI Markers of Alzheimer’s Disease in Predominantly Middle-Aged Adults. J. Alzheimers Dis. 2022, 88(1), 311–322. [Google Scholar] [CrossRef] [PubMed]
- Laakso, M.P.; et al. Hippocampal volumes in Alzheimer’s disease, Parkinson’s disease with and without dementia, and in vascular dementia: An MRI study. Neurology 1996, 46(3), 678–81. [Google Scholar] [CrossRef] [PubMed]
- Dickerson, B.C.; et al. The cortical signature of Alzheimer’s disease: regionally specific cortical thinning relates to symptom severity in very mild to mild AD dementia and is detectable in asymptomatic amyloid-positive individuals. Cereb. Cortex 2009, 19(3), 497–510. [Google Scholar] [PubMed]
- Thompson, P.M.; et al. Dynamics of gray matter loss in Alzheimer’s disease. J. Neurosci. 2003, 23(3), 994–1005. [Google Scholar] [CrossRef] [PubMed]
- Byun, M.S.; et al. Heterogeneity of Regional Brain Atrophy Patterns Associated with Distinct Progression Rates in Alzheimer’s Disease. PLoS ONE 2015, 10(11), e0142756. [Google Scholar] [CrossRef] [PubMed]
- Zanchi, D.; et al. Hippocampal and Amygdala Gray Matter Loss in Elderly Controls with Subtle Cognitive Decline. Front Aging Neurosci. 2017, 9, 50. [Google Scholar] [CrossRef] [PubMed]
- Poulin, S.P.; et al. Amygdala atrophy is prominent in early Alzheimer’s disease and relates to symptom severity. Psychiatry Res. 2011, 194(1), 7–13. [Google Scholar] [CrossRef] [PubMed]
- Padulo, C.; et al. Atrophy of specific amygdala subfields in subjects converting to mild cognitive impairment. Alzheimers Dement (N Y) 2023, 9(4), e12436. [Google Scholar] [CrossRef] [PubMed]
- Stouffer, K.M.; et al. Early amygdala and ERC atrophy linked to 3D reconstruction of rostral neurofibrillary tau tangle pathology in Alzheimer’s disease. Neuroimage Clin. 2023, 103374. [Google Scholar] [CrossRef] [PubMed]
- Punzi, M.; et al. Atrophy of hippocampal subfields and amygdala nuclei in subjects with mild cognitive impairment progressing to Alzheimer’s disease. Heliyon 2024, 10(6), e27429. [Google Scholar] [CrossRef] [PubMed]
- Sachdev, P.S.; et al. Amygdala in stroke/transient ischemic attack patients and its relationship to cognitive impairment and psychopathology: the Sydney Stroke Study. Am. J. Geriatr. Psychiatry 2007, 15(6), 487–96. [Google Scholar] [CrossRef] [PubMed]
- den Heijer, T.; et al. Use of hippocampal and amygdalar volumes on magnetic resonance imaging to predict dementia in cognitively intact elderly people. Arch. Gen. Psychiatry 2006, 63(1), 57–62. [Google Scholar] [CrossRef] [PubMed]
- Desikan, R.S.; et al. Temporoparietal MR imaging measures of atrophy in subjects with mild cognitive impairment that predict subsequent diagnosis of Alzheimer disease. AJNR Am. J. Neuroradiol. 2009, 30(3), 532–8. [Google Scholar] [PubMed]
- Desikan, R.S.; et al. MRI measures of temporoparietal regions show differential rates of atrophy during prodromal AD. Neurology 2008, 71(11), 819–25. [Google Scholar] [CrossRef] [PubMed]
- Greene, S.J.; R.J. Killiany, I. Alzheimer’s Disease Neuroimaging, Subregions of the inferior parietal lobule are affected in the progression to Alzheimer’s disease. Neurobiol. Aging 2010, 31(8), 1304–11. [Google Scholar] [CrossRef] [PubMed]
- Wang, Z.; et al. Differentially disrupted functional connectivity of the subregions of the inferior parietal lobule in Alzheimer’s disease. Brain Struct. Funct. 2015, 220(2), 745–62. [Google Scholar] [PubMed]
- Jacobs, H.I.; et al. Atrophy of the parietal lobe in preclinical dementia. Brain Cogn. 2011, 75(2), 154–63. [Google Scholar] [CrossRef] [PubMed]
- Feeney, C.; et al. Serum insulin-like growth factor-I levels are associated with improved white matter recovery after traumatic brain injury. Ann. Neurol. 2017, 82(1), 30–43. [Google Scholar] [CrossRef] [PubMed]
- Salzmann, A.; et al. Investigating the Relationship Between IGF-I, IGF-II, and IGFBP-3 Concentrations and Later-Life Cognition and Brain Volume. J. Clin. Endocrinol. Metab. 2021, 106(6), 1617–1629. [Google Scholar] [CrossRef] [PubMed]
- Chong, J.R.; et al. Plasma brain-derived p-Tau217 outperforms other p-Tau species in detecting abnormal brain amyloid in an Asian cohort of older people with cerebrovascular disease burden. J. Prev. Alzheimers Dis. 2026, 13(7), 100615. [Google Scholar] [CrossRef] [PubMed]
- Burgers, A.M.; et al. Meta-analysis and dose-response metaregression: circulating insulin-like growth factor I (IGF-I) and mortality. J. Clin. Endocrinol. Metab. 2011, 96(9), 2912–20. [Google Scholar] [CrossRef] [PubMed]
- Allard, J.B.; Duan, C. IGF-Binding Proteins: Why Do They Exist and Why Are There So Many? Front Endocrinol. 2018, 9, 117. [Google Scholar] [CrossRef]
Figure 1.
Plasma IGF-1 concentrations (in ng/mL) across diagnostic groups based on (A) Clinical diagnosis; (B) presence of significant global cortical atrophy (defined as GCA scores ≥ 2); (C) presence of significant CeVD (see section 2.4.2 above); and (D) presence of significant WMH (defined as Fazekas scores ≥ 2), depicted in violin graphs with the middle solid lines denoting median values, while top and bottom dotted lines represent respective quartiles. Abbreviations: AD, Alzheimer’s Disease; CeVD, cerebrovascular disease; CIND, cognitively impaired no dementia; NCI, no cognitive impairment. #p < 0.05 (Kruskal-Wallis ANOVA with post-hoc Dunn-Bonferroni’s tests); *p < 0.05 (Mann-Whitney U-tests).
Figure 1.
Plasma IGF-1 concentrations (in ng/mL) across diagnostic groups based on (A) Clinical diagnosis; (B) presence of significant global cortical atrophy (defined as GCA scores ≥ 2); (C) presence of significant CeVD (see section 2.4.2 above); and (D) presence of significant WMH (defined as Fazekas scores ≥ 2), depicted in violin graphs with the middle solid lines denoting median values, while top and bottom dotted lines represent respective quartiles. Abbreviations: AD, Alzheimer’s Disease; CeVD, cerebrovascular disease; CIND, cognitively impaired no dementia; NCI, no cognitive impairment. #p < 0.05 (Kruskal-Wallis ANOVA with post-hoc Dunn-Bonferroni’s tests); *p < 0.05 (Mann-Whitney U-tests).
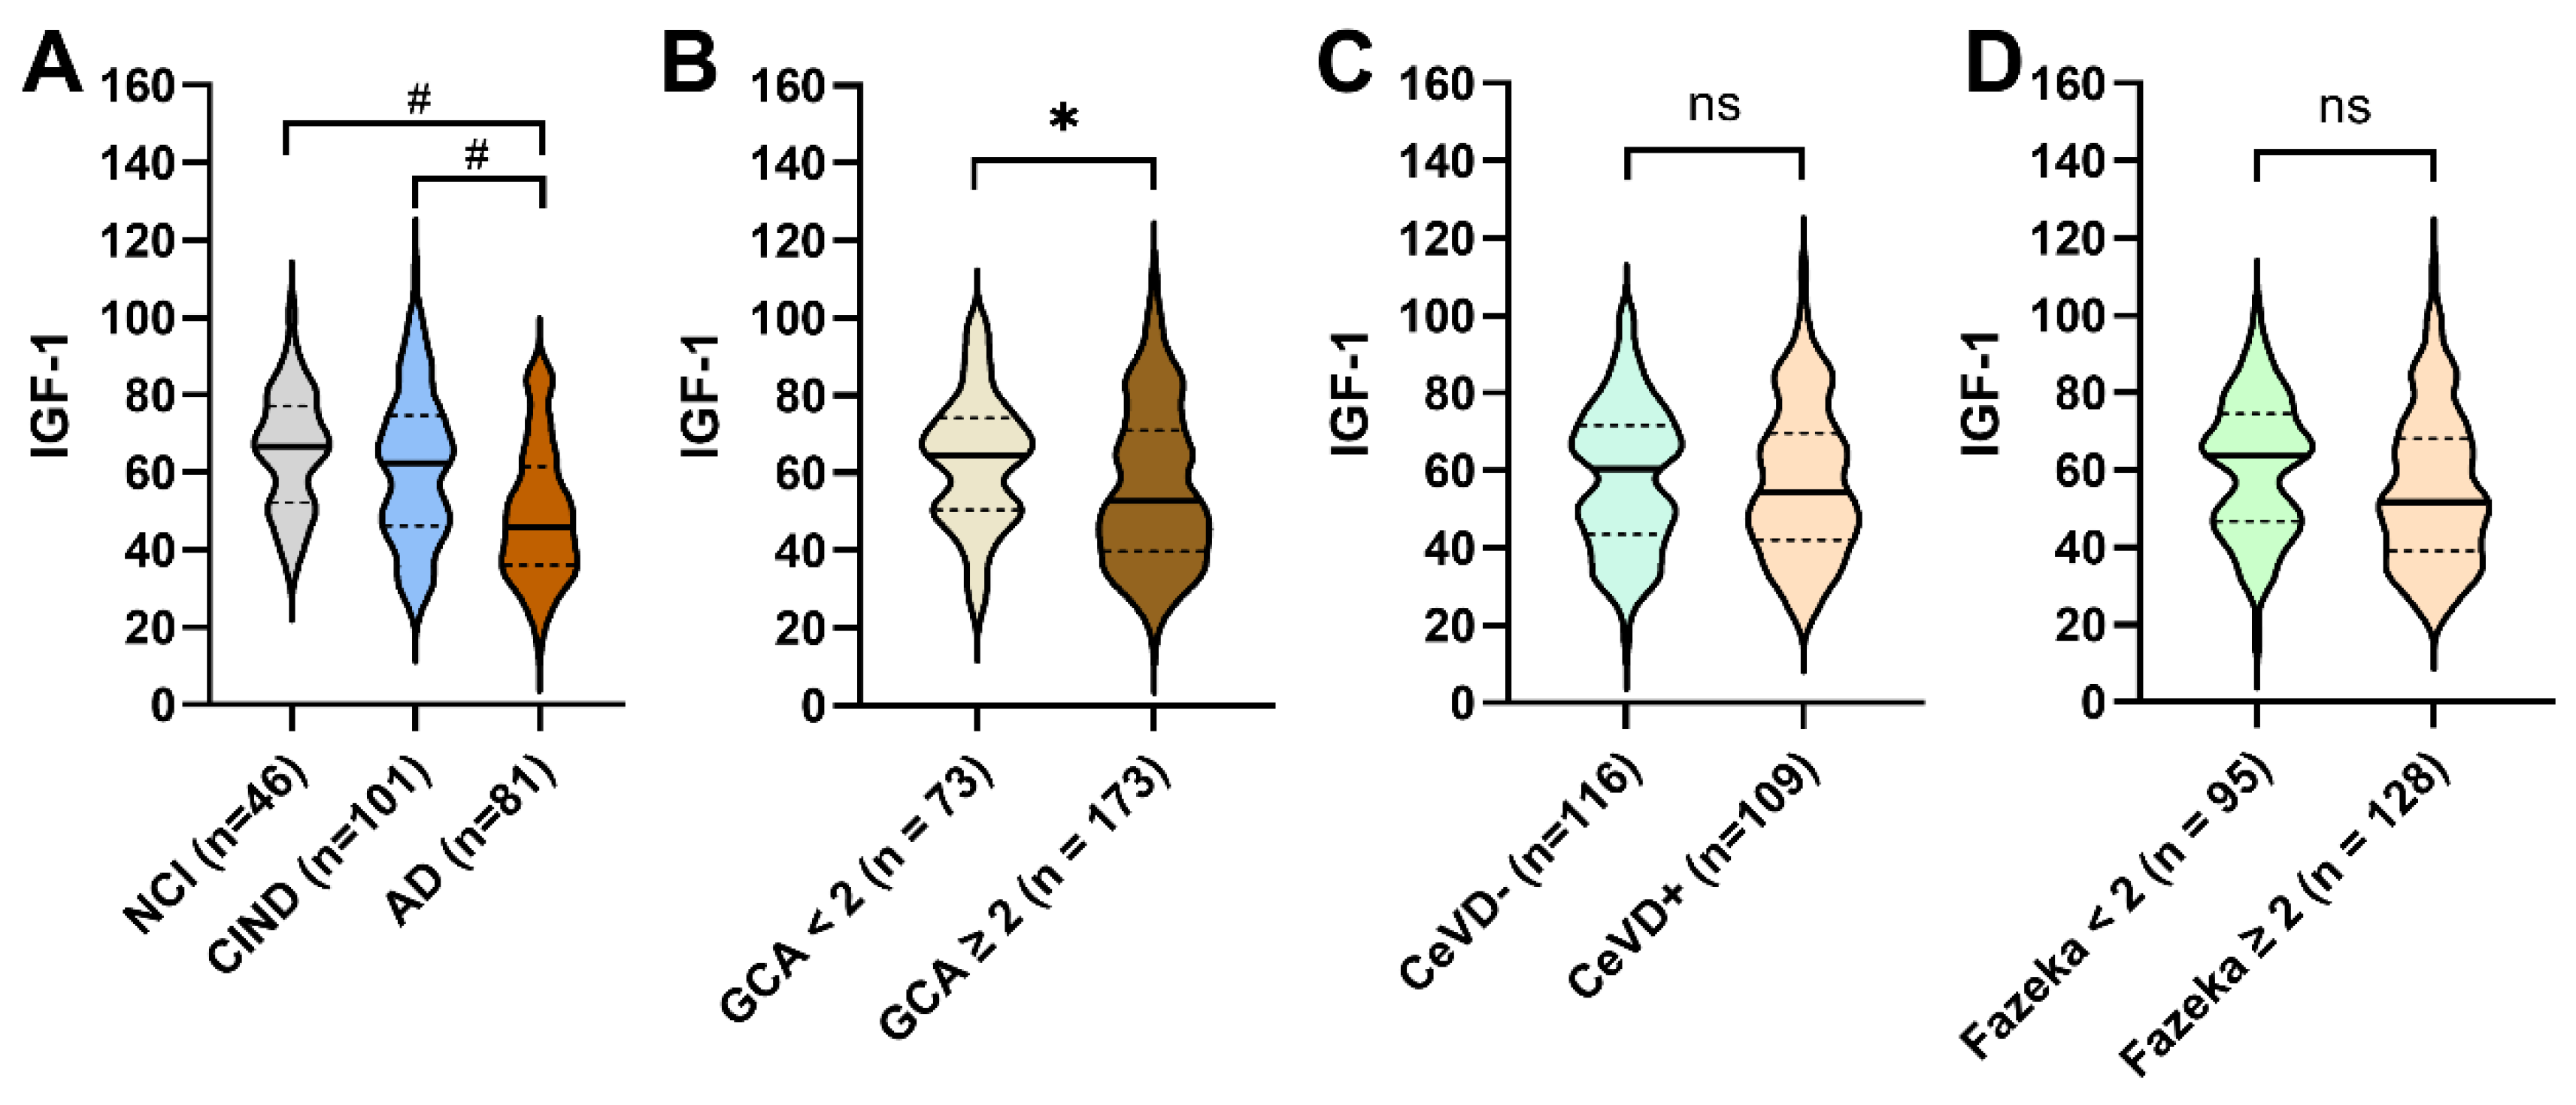

Table 1.
Baseline demographics and neuroimaging variables of study participants.
| NCI | CIND | AD | p-Value | |
|---|---|---|---|---|
| Maximum n | 46 | 101 | 81 | |
| Demographics | ||||
| Age, y | 66 (6) | 71 (9) a | 77 (7) a,b | * |
| Female, n (%) | 23 (50) | 44 (43.6) | 53 (65.4) b | * |
| Education, y | 10 (4) | 7 (5) a | 4 (4) a,b | * |
| APOE ε4 carrier, n (%) | 11 (23.9) | 29 (28.7) | 29 (35.8) | n.s. |
| Hypertension, n (%) | 28 (60.9) | 73 (72.3) | 67 (82.7) a | * |
| Hyperlipidaemia, n (%) | 27 (58.7) | 77 (76.2) | 57 (70.4) | n.s. |
| Diabetes Mellitus, n (%) | 11 (23.9) | 36 (35.6) | 38 (46.9) a | * |
| Cardiovascular disease, n (%) | 3 (6.5) | 19 (18.8) | 15 (18.5) | n.s. |
| Brain atrophy markers | ||||
| Hippocampus volume, mL | 6.6 (0.6) | 6.1 (0.9) a | 5.0 (1.1) a,b | * |
| Global cortical thickness, mm | 2.4 (0.1) | 2.3 (0.1) a | 2.2 (0.1) a,b | * |
| Amygdala volume, mL | 3.6 (0.3) | 3.4 (0.5) | 3.0 (0.6) a,b | * |
| Frontal lobe volume, mL | 149.2 (12.6) | 138.1 (18.8) a | 123.8 (15.9) a,b | * |
| Temporal lobe volume, mL | 99.9 (8.7) | 92.4 (13.3) a | 80.1 (10.8) a,b | * |
| Parietal lobe volume, mL | 72.7 (7.4) | 68.0 (10.3) a | 60.9 (8.9) a,b | * |
| Gray matter volume, mL | 598.3 (45.3) | 563.6 (61.3) a | 511.0 (49.2) a,b | * |
| Total intracranial volume, mL | 1434.4 (116.8) | 1422.3 (131.9) | 1370.6 (115.7) a,b | * |
| CeVD markers | ||||
| Significant CeVD, n (%) | 9 (19.6) | 55 (55.0) a | 45 (57.0) a | * |
| Cortical infarcts | 0 (0) | 0 (0) | 0 (0) | n.s. |
| Lacunes | 0 (0) | 0 (1) a | 0 (1) | * |
| Cerebral microbleeds | 0 (1) | 0 (1) | 1 (2) | * |
| ARWMC scores | 4 (2) | 6 (6) a | 7 (6) a,b | * |
| WMH volume, mL | 3.3 (5.1) | 6.7 (17.1) a | 14.1 (19.0) a,b | * |
| Blood biomarker | ||||
| Plasma IGF-1, ng/ml | 65.6 (15.1) | 61.2 (19.1) | 49.2 (17.1) a,b | * |
Table 1. Baseline demographics and neuroimaging variables of study participants. *Denotes significant p-values (<0.05). Hippocampal volume, amygdala volume, frontal lobe volume, temporal lobe volume, parietal lobe volume, gray matter volume, intracranial volume data was available for 223 participants. WMH volume data was available for 206 participants. ARWMC scores data was available for 224 participants. Cortical infarcts and lacunes data were available for 226 participants. CMBs data was available for 217 participants. Global cortical thickness data was available for 185 participants. Abbreviations: AD, Alzheimer’s disease; ARWMC, Age-related White Matter Changes; CeVD, cerebrovascular disease; CIND, cognitive impairment, no dementia; IQR, inter-quartile range; IGF-1, insulin-like growth factor 1; NCI, no cognitive impairment; SD, standard deviation; WMH, white matter hyperintensity. aSignificantly different from NCI. bSignificantly different from CIND.
Table 2.
Associations of plasma IGF-1 with regional brain volumes.
| Plasma IGF-1* | Hippocampal volume (n = 223) |
Global cortical thickness (n = 185) | Amygdala volume (n = 223) |
Temporal lobe volume (n = 223) | Parietal lobe volume (n = 223) |
Frontal lobe volume (n = 223) |
Gray matter volume (n = 223) |
|---|---|---|---|---|---|---|---|
| β (95% CI) | β (95% CI) | β (95% CI) | β (95% CI) | β (95% CI) | β (95% CI) | β (95% CI) | |
| Model 1 |
1.1 (0.2-2.0)# |
0.2 (0.1-0.4)# |
0.5 (0.1-1.0)# |
10.1 (1.2-19.0)# |
9.3 (1.9-16.7)# |
13.5 (1.0-26.0)# |
43.8 (11.5-76.0)# |
| Model 2 |
1.0 (0.1-1.8)# |
0.2 (0.1-0.4)# |
0.5 (0.1-0.9)# |
8.6 (-0.4-17.7) |
8.3 (0.8-15.8)# |
12.6 (0.1-25.1)# |
39.5 (7.5-71.5)# |
Table 2. Associations of plasma IGF-1 with regional brain volumes. Associations between plasma IGF-1 and brain volumes are expressed as β = mean difference with 95% CI. # denote statistically significant associations. Hippocampal, amygdala, temporal lobe, parietal lobe, frontal lobe and gray matter volumes data were not available for 5 participants while global cortical thickness data were not available for 43 participants. * Log-transformed. Model 1: Adjusted for age, sex, education and total intracranial volume. Model 2: Adjusted for age, sex, education, total intracranial volume, APOE4 status, hypertension, hyperlipidemia, diabetes mellitus and cardiovascular diseases. Abbreviations: CI, confidence interval; IGF-1, insulin-like growth factor 1.
Table 3.
Associations of plasma IGF-1 with CeVD neuroimaging markers.
| Plasma IGF-1* | Cortical infarcts count (n = 226) |
Lacunes count (n = 226) |
CMBs count (n = 217) |
ARWMC score ≥ 8 (n = 224) |
WMH volume (n = 206) |
|
|---|---|---|---|---|---|---|
| RR (95% CI) | RR (95% CI) | RR (95% CI) | OR (95% CI) | β (95% CI) | ||
| Model 1 | 0.6 (0.04-8.2) | 1.0 (0.2-6.0) | 0.5 (0.1-1.7) | 1.7 (0.2-13.6) | Model 3 | -10.2 (-24.7-4.4) |
| Model 2 | 0.3 (0.02-5.4) | 0.7 (0.1-4.9) | 0.6 (0.2-2.4) | 1.7 (0.2-14.8) | Model 4 | -9.7 (-24.6-5.2) |
Table 3: Associations of plasma IGF-1 with CeVD neuroimaging markers. Associations between plasma IGF-1 and cortical infarct counts, lacunes count and CMBs count are expressed as RR values with 95% CI. Associations between plasma IGF-1 and ARWMC scores are expressed as OR values with 95% CI. Associations between plasma IGF-1 and WMH volume are expressed as β = mean difference with 95% CI. Cortical infarcts count and lacunes count data was missing for 2 participants, CMB counts data was missing for 11 participants, ARWMC scores data was missing for 4 participants and WMH volume data was missing for 22 participants. * Log-transformed. Model 1: Adjusted for age, sex and education. Model 2: Adjusted for age, sex, education, hypertension, hyperlipidemia, diabetes mellitus and cardiovascular diseases. Model 3: Adjusted for age, sex, education and total intracranial volume. Model 4: Adjusted for age, sex, education, total intracranial volume, hypertension, hyperlipidemia, diabetes mellitus and cardiovascular diseases. Abbreviations: ARWMC, Age-related White Matter Changes; CeVD, cerebrovascular disease; CI, confidence interval; CMBs, cerebral microbleeds; IGF-1, insulin-like growth factor 1; OR, odds ratio; RR, rate ratio; WMH, white matter hyperintensities.
Disclaimer/Publisher’s Note: The statements, opinions and data contained in all publications are solely those of the individual author(s) and contributor(s) and not of MDPI and/or the editor(s). MDPI and/or the editor(s) disclaim responsibility for any injury to people or property resulting from any ideas, methods, instructions or products referred to in the content. |
© 2026 by the authors. Licensee MDPI, Basel, Switzerland. This article is an open access article distributed under the terms and conditions of the Creative Commons Attribution (CC BY) license (http://creativecommons.org/licenses/by/4.0/).
Copyright: This open access article is published under a Creative Commons CC BY 4.0 license, which permit the free download, distribution, and reuse, provided that the author and preprint are cited in any reuse.