

Submitted:
24 July 2026
Posted:
24 July 2026
You are already at the latest version
Abstract
Background: Coronary artery spasm (CAS) is a reversible cause of myocardial ischemia, infarction, and sudden cardiac death. Often under-recognized and influenced by ethnicity, geography, and environment, CAS requires population-level data. This study examined nationwide CAS epidemiology in Taiwan by age, sex, region, and season.
Methods: This cross-sectional population-based study used Taiwan National Health Insurance Research Database (2004-2018). CAS was identified by validated diagnostic-code criteria: at least three outpatient diagnoses or one inpatient diagnosis. Age- and sex-standardized prevalence and incidence were calculated, and temporal, geographic, and seasonal variations assessed.
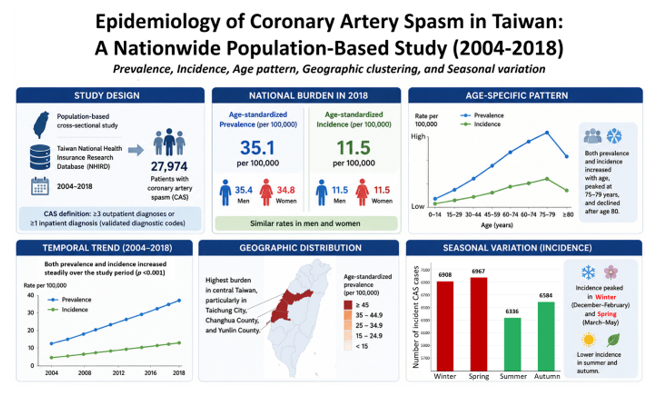
Results: Among 27,974 patients with CAS, the mean age at diagnosis was 57.9 years, with nearly equal sex distribution (49.7% female). In 2018, the age-standardized prevalence was 35.1 per 100,000 population, with comparable rates in men (35.4) and women (34.8 per 100,000). The incidence was 11.5 per 100,000 in both sexes. Both prevalence and incidence increased linearly from 2004 to 2018 (P < 0.001), peaked at ages 75–79 years, and then declined. Geographic analysis revealed the highest disease burden in central Taiwan, particularly in Taichung City, Changhua County, and Yunlin County. Seasonal analysis showed a clear pattern, with incidence peaking in winter (December–February) and spring (March–May), and notably lower counts in summer and autumn.
Conclusion: From 2004 to 2018, CAS prevalence and incidence increased in Taiwan, affected both sexes similarly, peaked at ages 75–79 years, and were highest in central western regions during winter and spring. These findings may improve CAS recognition and resource allocation.
Keywords:
coronary artery spasm
; prevalence
; incidence
; sex difference
; geographic variation
1. Introduction
Epicardial coronary artery spasm (CAS), a reversible cause of myocardial ischemia characterized by short, severe artery constriction that reduces blood flow, contributes to myocardial infarction, recurrent angina, emergency department utilization, and cardiovascular morbidity in East Asian populations [1]. The prevalence and incidence of CAS are significantly higher in East Asians—notably Japanese, Korean, and Taiwanese—than in Caucasians, with its global prevalence varying by geography, ethnicity, and sex, all of which influence clinical diagnosis and treatment [2]. In patients without obstructive coronary artery disease (CAD), CAS occurs in around 50% of angina (16-73%) [3,4] and 57% of acute coronary syndrome cases [3,5], highlighting the need for routine diagnostic evaluation to prevent misdiagnosis. In CAS patients undergoing coronary arteriography, the prevalence of multiple CASs (≥2 spastic coronary arteries) by provocative testing in Korea (intravenous, 57.1%) [6], Japanese (intracoronary, 24.3%) [7] and Taiwanese populations (intracoronary, 19.3%) [8] are markedly higher than those in Caucasians (intravenous, 7.5%) [9]. Because Asian populations demonstrate 3-4 times higher prevalence rates than Western World population, more aggressive diagnostic testing in these populations is warranted [1,2]. In 2010, angina from ischemic heart disease affected about 112 million people worldwide (1.6% of the population) being slightly more common in males (1.7%) than females (1.5%) [10]; hence, a 50% prevalence of CAS represents millions of affected individuals globally, highlighting the need for investment in diagnostic facilities and training. The incidence of CAS-induced angina also demonstrates marked geographic and ethnic variations, ranging from 1.7% in the Duke study (USA) [11] to 13% in Shimokawa's study (Japan) [12], with intermediate rates of 4–5% in the Pisa study (Italy) [12] and 4% in the Montreal study (Canada) [12], reflecting higher prevalence in East Asian compared to Western countries. The incidence of vasospastic angina pectoris was higher in Japan than in Western countries. Additionally, recurrent angina occurs in 10-53% of patients during follow-up, emphasizing the chronic nature of CAS and the necessity for effective long-term management strategies to improve patient quality of life [4]. While there is evidence for racial differences in coronary constrictor response, the prevalence and incidence of CAS in different populations remains to be defined. Therefore, systematic analysis of health system administrative data helps improve our understanding of disease burden by integrating incidence and prevalence data to characterize the epidemiology of coronary artery spasm in Taiwan and to generate evidence relevant to healthcare planning and environmental cardiovascular health policy.
While CAS is common in myocardial ischemia globally, it shows unique sex- and age-related epidemiological patterns that differs notably from atherosclerotic CAD. CAS occurs more frequently in men than women in both East Asian and Western populations [3]. This male predominance suggests a fundamental biological or behavioral difference in the susceptibility to CAS. Most individuals diagnosed with CAS are aged between 40 and 70, and its prevalence usually decreases after 70 years old [3]. The reduction in prevalence after age 70 contrasts sharply with CAD, which becomes more common as people get older. The mechanisms underlying this age-related decline in CAS prevalence remain incompletely understood. Despite the recognition of sex- and age-related patterns in CAS epidemiology, comprehensive population-based studies examining sex- and age-stratified prevalence and incidence across entire populations remain limited. Most existing data derives from selected patient cohorts undergoing coronary arteriography, which may not reflect the true burden of CAS in the general population. We, therefore, conducted a population-based epidemiological study utilizing Taiwanese large health system administrative databases to quantify the population burden of CAS and identify demographic, geographic, and environmental patterns relevant to cardiovascular prevention and health-service planning.
2. Materials and Methods
2.1. Data Source
This was a cross-sectional epidemiology study, which utilized the data from the Taiwan National Health Insurance Research Database (NHIRD). The Taiwan NHIRD contains data for outpatient and inpatient services, including diagnoses, medications, interventions, operations, hospitalizations and emergency visits from the inception of Taiwan’s National Health Institute (NHI) program since March 1995. The NHIRD is currently curated and managed by the Health and Welfare Data Science Center of the Taiwan Ministry of Health and Welfare. The NHI program in Taiwan is obligational, mandatory and universal which provided approximately 99.8% coverage for the 23.9 million citizens in Taiwan. Diagnoses were recorded based on the International Classification of Diseases, Ninth Revision, Clinical Modification (ICD-9-CM) before December 31, 2015, and transitioned to using both ICD-9-CM and Tenth Revision (ICD-10-CM) thereafter. Comprehensive descriptions of the NHIRD have been documented in previous literature [13]. Data obtained from the NHIRD are deidentified from all personal information and therefore this study was exempted obtaining informed consent from patients and was approved by the Taipei Medical University–Joint Institutional Review Board (N202410068; date of approval: 25 November 2025). This study adhered to the principles of the Declaration of Helsinki.
2.2. Patient Population
The data analyzed in this study spanned the period from 2000 to 2018. We identified CAS patients within the NHIRD—covering the entire Taiwanese population—between January 1, 2004, and December 31, 2018. To ensure the accuracy of the CAS diagnosis, we required patients to have at least three outpatient diagnoses or one inpatient diagnosis (ICD-9-CM: 413.1 and ICD-10-CM: I20.1) during the study period [14] (Supplementary Table S1). To distinguish newly diagnosed CAS, we used 2000–2003 as a washout period and did not include these years for cohort inclusion. Additionally, individuals younger than 20 years or those with missing demographic data were excluded from the analysis.
2.3. Estimation of Prevalence and Incidence
Prevalent CAS cases were defined as individuals diagnosed with CAS during the 15-year period (2004–2018) prior to December 31 of each calendar year. Incident CAS cases were defined as those diagnosed with CAS within the same 15-year period without any prior diagnosis, with the history traceable as far back as January 2000. The denominator for prevalence/incidence estimation in each calendar year consisted of all Taiwanese individuals aged ≥20 years as of July 1st. These rates were calculated by dividing the number of CAS cases by the total adult Taiwanese population for each respective year. Furthermore, the prevalence and incidence were standardized according to the 2004 Taiwan population structure, utilizing single-year age groups for the standardization process.
Prevalence and incidence were calculated for various cities/counties in Taiwan, excluding the offshore islands. Specifically, the analysis encompassed 19 regions on the main island of Taiwan: Taipei city, New Taipei county, Keelung city, Taoyuan city, Hsinchu city, Hsinchu county, Yilan county, Miaoli county, Taichung city, Changhua county, Yunlin county, Nantou county, Chiayi city, Chiayi county, Tainan city, Kaohsiung city, Pingtung county, Hualien county, and Taitung county. To visualize the geographic variations in the prevalence and incidence of CAS across these regions, choropleth maps were utilized.
2.4. Baseline Characteristics
We additionally extracted baseline characteristics, including age at CAS diagnosis, sex, residential urbanization level (categorized into four tiers), monthly income (tertiles), and comorbidities. Comorbidities comprised diabetes mellitus, hypertension, dyslipidemia, chronic kidney disease, chronic obstructive pulmonary disease, gouty arthritis, hepatitis C virus infection, depression, psychotic disorders, anxiety, stroke, obstructive CAD, acute coronary syndrome (ACS), and coronary revascularization. Stroke, ACS, and coronary revascularization were defined using any inpatient diagnosis or procedure record occurring at any time before the CAS diagnosis date, whereas the remaining comorbidities were identified based on at least two outpatient diagnoses or one inpatient diagnosis within the year preceding the CAS diagnosis. The Charlson’s Comorbidity Index score was also extracted as a measure of the patients' overall disease burden.
2.5. Statistics Analysis
The baseline characteristics between male and female patients were compared using independent sample t-test for continuous variable and chi-square test for categorical variable. We calculated the 95% confidence intervals (CIs) for prevalence and incidence based on the Poisson distribution for the observed number of prevalent and incident CAS cases. Temporal trends in CAS prevalence and incidence over the study period were evaluated using Poisson regression models, with the annual number of CAS cases as the response variable, calendar year (2004–2018) entered as a continuous predictor, and the natural logarithm of the corresponding annual population size included as an offset. Formal county-level ecological regression analyses were not performed because county-specific exposure and outcome datasets were not integrated into a unified analytical panel; hence, the environmental interpretations presented in this study should be considered hypothesis-generating and warrant future investigation. Adjusted incidence rate ratios and corresponding 95% CIs. The significance level was set at 0.05 with two-sided test. Other statistical analyses were performed using SAS statistical software, version 9.4 (SAS Institute, Cary, NC, USA).
3. Results
3.1. Patient Characteristics
A total of 27,974 individuals with diagnoses of CAS were identified within the Taiwan NHIRD between 2004 and 2018. The mean age at diagnosis of CAS was 57.9 years, with a nearly equal sex distribution (13,917 females; 49.7%). The mean age at diagnosis of CAS was 57.9 years, with a nearly equal sex distribution (13,917 females; 49.7%). The majority of patients were diagnosed between the ages of 40 and 70, with the ooccurrence demonstrating a decline in patients older than 70 years. The most prevalent comorbidity was hypertension (60%), followed by dyslipidemia (32%), anxiety (18.7%), and diabetes (18.4%). Of note, 36% of the patients had a diagnosis of obstructive CAD prior to their CAS diagnosis; additionally, 8.8% had previously experienced ACS, and 5.1% had undergone coronary revascularization. Male patients with CAS exhibited a higher prevalence of obstructive CAD, ACS, and a history of coronary revascularization compared to their female counterparts (Table 1).
3.2. Prevalence of CAS in Taiwan
In 2018, Taiwan had 19,171,861 adult residents, among whom 8,570 (0.045%) were identified as prevalent CAS cases, corresponding to an age-standardized prevalence of 35.1 per 100,000 population (95% CI, 34.2–36.0) (Table 2).
Sex-stratified estimates showed standardized prevalences of 35.4 (95% CI, 34.2–36.7) per 100,000 in men and 34.8 (95% CI, 33.5–36.0) per 100,000 in women (Table 3). Figure 1A shows a significant linear increase in CAS prevalence in the overall cohort over time (p trend <0.001). When stratified by sex, similar upward trends were observed in both men and women, with no evidence of sex-specific differences (Figure 1B).
The age-specific prevalence was further calculated (Figure 1C). The results showed an apparent quadratic trend. The prevalence increased progressively from the 20–24 age group (24.6 cases per 100,000 population, 95% CI 22.2–27.0) to 75–79 years (979.3 events per 100,000 population, 95% CI 952.9–1005.8), at which point it reached a plateau and subsequently declined sharply after the age of 80 (Supplementary Table S2). Figure 1D depicts sex-specific age-stratified prevalence. In both men and women, prevalence followed a quadratic pattern across age groups, peaking at 75–79 years.
Age-standardized prevalence for the overall population (A) and stratified by sex (B), and age-specific prevalence for the overall population (C) and stratified by sex (D). The error bar represents the 95% confidence interval of the estimate.
3.3. Incidence of CAS in Taiwan
In 2018, out of 19,171,861 adult citizens in Taiwan, 2,661 (0.014%) were identified as incident CAS cases, yielding an age-standardized incidence of 11.5 (95% CI 11.0–12.0) events per 100,000 population (Table 2). The standardized incidence in 2018 was 11.5 (10.8–12.3) for men and 11.5 (10.8–12.2) for women (Table 3).
Figure 2A demonstrates an increasing linear trend of incident CAS in the whole cohort (p trend <0.001). This linear trend remained consistent across sexes, with no significant sex differences observed (Figure 2B).
Figure 2C further illustrates the age-specific incidence, which demonstrated a significant quadratic trend. The incidence rose steadily with age, increasing from 22.6 events per 100,000 population (95% CI, 20.3–24.9) among individuals aged 20–24 years to a plateau at 75–79 years (307.1 per 100,000 population; 95% CI, 292.3–321.9). This peak was followed by a marked decline in those aged ≥80 years (Supplementary Table S3). Figure 2D further illustrates the age-specific incidence stratified by sex. A significant quadratic trend was observed in both sexes. For both men and women, the incidence of CAS peaked within the 75–79 years age group.
Age-standardized incidence for the overall population (A) and stratified by sex (B), and age-specific incidence for the overall population (C) and stratified by sex (D). The error bar represents the 95% confidence interval of the estimate.
3.4. Geographic Variations in the Prevalence and Incidence of CAS in Taiwan
We further estimated CAS prevalence and incidence across cities and counties in Taiwan. CAS prevalence was highest in three counties/cities located in central western Taiwan—Taichung City, Changhua County, and Yunlin County (Figure 3A). The geographic pattern of incidence was broadly similar to that of prevalence, indicating that CAS was generally more common in central Taiwan (Figure 3B).
3.5. Seasonal Variations in the Incidence of CAS in Taiwan
Data for incident CAS from 2004 to 2018 were aggregated and analyzed by the month of initial diagnosis (Figure 4). The results revealed a distinct seasonal pattern: the number of newly diagnosed CAS cases began to rise in November, coinciding with the onset of cooler temperatures, and continued to increase through December and January (the coldest months of the year). A sharp decline was observed in February, followed by a sudden rebound in March, marking the beginning of spring. From April onwards, the incidence decreased and remained relatively stable and lower throughout the period leading up to October.
4. Discussion
This nationwide population-based study provides the first comprehensive epidemiological characterization of CAS in Taiwan, demonstrating that it represents a substantial and growing cardiovascular burden with distinct demographic, temporal, and geographic patterns. In 2018, the age-standardized prevalence and incidence were 35.1 and 11.5 per 100,000 population, respectively, with equivalent rates between men and women. Our findings reveal four critical observations: (1) both prevalence and incidence increased over the study period, (2) disease burden was comparable across sexes, (3) both metrics exhibited a non-linear age distribution with peak incidence at 75–79 years followed by decline, and (4) marked geographic clustering occurred in central western Taiwan, particularly in Taichung City, Changhua County, and Yunlin County, with a distinct seasonal pattern characterized by winter (December to February) and spring (March to May) peaks.
Our age-specific findings both confirm and extend previous work. While CAS is traditionally described as a disorder affecting patients in their 50s [15], and earlier cohort studies suggested a male predominance with a peak between 40 and 70 years [8], our nationwide data demonstrated peak prevalence and incidence at 75–79 years in both sexes [16]. This discrepancy likely reflects methodological differences. Cohort studies often enroll symptomatic patients referred for specialized testing, potentially overrepresenting younger patients with classic presentations. In contrast, nationwide data better capture older adults, atypical presentations, and patients with multiple comorbidities. Consequently, the burden of CAS in older adults may have been underestimated in previous clinical series. Although individuals aged 75–79 years exhibited the highest CAS incidence, the geographic distribution of this elderly population (Supplementary Table S4) did not parallel the distribution of CAS cases across Taiwan. The largest elderly populations were concentrated in metropolitan regions (e.g., New Taipei City, Taipei City, Kaohsiung City), whereas the highest CAS incidence occurred predominantly in central Taiwan (e.g., Taichung City, Changhua County, Yunlin County). This suggests that while advanced age increases susceptibility, population aging alone cannot explain geographic clustering. Instead, aging likely interacts with environmental and regional determinants—such as seasonality, air pollution, urbanization, socioeconomic characteristics, and comorbidity burden—to influence disease occurrence. The decline in incidence after age 80 indicates a non-linear age pattern, differing from atherosclerotic coronary artery disease, which typically increases steadily with age. Possible explanations include survivor effects, competing mortality, changes in autonomic or endothelial function, and under-recognition among the very elderly. Clinically, CAS should not be regarded solely as a middle-age disorder; it remains a crucial diagnostic consideration in older patients with angina or non-obstructive CAD.
Our results align with broader literature indicating that CAS is more common in East Asian populations than in Western populations. Higher prevalence has been repeatedly reported in Japanese [7], Korean [6], and Taiwanese [8] cohorts, with meta-analytic data showing epicardial CAS is more frequent in Asian populations (52% vs. 33%) [4]. Prior studies also indicate that CAS accounts for a substantial proportion of angina and acute coronary syndrome cases without obstructive CAD (Table 4) (Figure 3C) [4,6,7,8,9,11,12,17,18,19,20,21,22,23,24,25,26].
Several explanations exist for these ethnic and geographic differences, notably the East Asian aldehyde dehydrogenase 2 (ALDH2) variant, which impairs enzyme function and increases CAS risk [2]. However, genetic predisposition alone is unlikely to explain the full pattern. Environmental exposures, smoking, dietary habits, endothelial dysfunction, vascular reactivity, and healthcare practice differences probably all contribute. These findings reinforce the need for region-sensitive approaches to recognition, diagnosis, and prevention, supporting the view that CAS is a common vasomotor disorder with meaningful implications for clinical care and health-service planning in East Asia.
A significant contribution of this study is its estimation of incidence rates at the population level. Most prior epidemiological work has focused on prevalence, largely because incidence is difficult to determine without clear identification of new cases and valid denominator data. Utilizing a nationwide database with a 4-year washout period helped differentiate new cases from pre-existing conditions. This distinction is vital: prevalence quantifies the total healthcare burden, whereas incidence is more informative for monitoring temporal trends, identifying high-risk populations, and evaluating prevention strategies. Population-based data are particularly valuable here, avoiding selection biases inherent in referral-based cohorts and providing appropriate denominators for public health interpretation [27].
Interpretation of CAS epidemiology remains complicated by the lack of universally applied diagnostic standards. Our case definition relied on International Classification of Diseases codes within a national database—a practical approach for large-scale research but different from studies relying on provocative testing. The angiographic threshold for a positive provocation test varies substantially across the literature (from >50% to >90% luminal narrowing), strongly affecting reported prevalence. While the Coronary Vasomotion Disorders International Study Group (COVADIS) proposed standardized criteria [4], they are not consistently implemented. The COVADIS framework improves specificity but its requirement for ≥90% diameter reduction may miss clinically meaningful cases, including sub-threshold CAS associated with ischemia and symptoms [28]. A strict definition may miss 29.1% of clinically significant CAS, leading to undertreatment. Greater standardization would improve cross-study comparability and our understanding of the global CAS burden.
The geographic clustering of CAS in central-western Taiwan is intriguing and likely multifactorial. These regions have historically experienced relatively high levels of ambient air pollution because of industrial activity and unfavorable topography [29,30]. PM2.5 exposure has been associated with both obstructive and non-obstructive myocardial infarction; its stronger association with non-obstructive than with obstructive myocardial infarction suggests a possible preferential effect on vasospastic pathways, although this evidence remains indirect [31]. Because PM2.5 monitoring was incomplete before 2012 and systematic manual monitoring with official Ministry of Environment reporting began in 2013 (Supplementary Table S5), our study did not link county-level environmental exposures to CAS rates within a unified analytical panel. However, PM2.5 exposure alone based on available county-level ecological data did not explain the observed distribution of CAS. The highest PM2.5 concentrations in Taiwan occur predominantly in southern and southwestern regions, whereas the highest CAS burden was concentrated in central Taiwan. Furthermore, PM2.5 levels in Taiwan peak in winter, driven by transboundary inflow via the northeast monsoon combined with stable atmospheric conditions and Central Taiwan has topographic pollutant stagnation [32,33]. Emerging evidence supports a biologically plausible link between particulate air pollution and coronary vasomotor dysfunction: exposure to PM2.5 and PM10 has been associated with abnormal coronary vasoconstriction [34], and air pollution reduction has been linked to decreased cardiac morbidity [35]. Regional differences in healthcare access, socioeconomic conditions, physician distribution, and diagnostic awareness may also influence the observed rates [36]. The geographic clustering should therefore be regarded as a hypothesis-generating, multifactorial signal. The CAS burden likely reflects the convergence of multiple regional determinants, including seasonal pollution accumulation, population aging, industrial exposure, healthcare accessibility, and diagnostic capture effects (Figure 5).
The seasonal pattern—with incidence highest in winter and spring—aligns with prior reports of seasonal variation in cardiovascular events [37,38]. A French study reported clear seasonal variation in PM2.5 concentrations, with higher levels in winter and lower levels in summer, alongside a winter peak in coronary events [39]. Several other mechanisms may explain the excess burden during colder months: cold exposure activates the sympathetic nervous system [40], lower temperatures impair endothelial function [41], systemic inflammation intensifies [37], and cold conditions increase vascular smooth muscle contractility [40]. The relatively lower number of cases in February should be interpreted cautiously, as healthcare utilization may decrease during the Chinese Lunar New Year holiday, and the shorter month reduces event detection. Seasonal analyses must consider both biological mechanisms and cultural/administrative influences.
This study has several strengths, notably the use of nationwide data allowing comprehensive assessment of patterns in a large real-world population, and the 4-year washout period strengthening incident case identification. Nonetheless, limitations exist. First, the reported long-term period prevalence likely underestimates true lifetime prevalence due to clinically silent cases. Second, administrative data reflects healthcare encounters rather than symptom onset. Third, the database lacked individual-level information on smoking, diet, occupational exposure, environmental pollutant burden, and genetic background. Fourth, standardized county-level PM2.5 data were not available for the full study period. Taiwan’s automated PM2.5 monitoring network began gradual implementation in August 2005, and nationwide routine manual monitoring was not fully established until December 2012. Therefore, county-level PM2.5 analyses were mainly limited to 2013–2018, when standardized and nationally comparable measurements were available. Finally, regional variation may partly reflect differences in healthcare access or diagnostic practice rather than true biological risk differences.
5. Conclusions
CAS in Taiwan is increasing, affects men and women at similar rates, peaks later in life (75–79 years) than previously suggested, and varies substantially by region and season. These findings refine our understanding of CAS in the general population and underscore the need for greater clinical awareness, standardized diagnostic criteria, and region-specific public health strategies. Better recognition of CAS, particularly in older adults and high-burden regions, is essential for improving clinical outcomes.
Supplementary Materials
The following supporting information can be downloaded at the website of this paper posted on Preprints.org. Supplementary Table S1. International Classification of Diseases diagnostic codes (ICD-9-CM: 413.1 and ICD-10-CM: I20.1) used in the study. Supplementary Table S2. Age-specific prevalence of coronary artery spasm from 2004 to 2018. Supplementary Table S3. Age-specific incidence of coronary artery spasm from 2004 to 2018. Supplementary Table S4. Top 10 counties and cities by population aged 75–79 years, 2007–2018. Supplementary Table S5. Mean seasonal PM2.5 concentrations (µg/m³) across 19 counties in Taiwan, 2013–2018.
Author Contributions
Conceptualization, Alexander T.-H.W. and M.-Y.H.; methodology, N.G.K., I.Y.C., M.-J.H. and M.-Y.H.; software, M.-Y.H.; formal analysis, C.H. and M.-Y.H.; investigation, C.-T.Y. and P.H.; data curation, M.-Y.H.; writing—original draft preparation, Alexander T.-H.W.; Writing—Reviewing and Editing, M.-Y.H.; supervision, M.-Y.H.; funding acquisition, C.-T.Y. and M.-Y.H. All authors have read and agreed to the published version of the manuscript.
Funding
This research was funded by National Science Council of Taiwan to MY Hung (grant number NSTC 112-2314-B-038-104-MY3) and Shuang Ho Hospital, Taipei Medical University to Ming-Yow Hung (grant number 115FRP-09).
Institutional Review Board Statement
The study was conducted in accordance with the guidelines of the Declaration of Helsinki and approved by the Taipei Medical University–Joint Institutional Review Board (N202410068; date of approval: 25 November 2025).
Informed Consent Statement
Data obtained from the NHIRD are deidentified from all personal information and therefore this study was exempted obtaining informed consent from patients.
Data Availability Statement
The data supporting this article are not publicly available due to information governance restrictions. Access is controlled by the Taiwan Ministry of Health and Welfare and requires prior approval through a formal application process. Researchers interested in obtaining access to the dataset should submit an application to the Ministry and may contact the relevant staff member for assistance at stcarolwu@mohw.gov.tw. Taiwan Ministry of Health and Welfare Address: No.488, Sec. 6, Zhongxiao E. Rd., Nangang Dist., Taipei City 115, Taiwan (R.O.C.). Phone: +886-2-8590-6848.
Acknowledgments
We thank Alfred Hsing-Fen Lin and Zoe Ya-Jhu Syu for their assistance in statistical analysis. We also thank the intellectual support from Taiwan Society of Coronary Artery Spasm.
Conflicts of Interest
The authors declare no conflict of interest.
Abbreviations
CAD: coronary artery disease; CAS: coronary artery spasm; CI: confidence interval; ICD-9-CM: International Classification of Diseases, Ninth Revision, Clinical Modification; ICD-10-CM: International Classification of Diseases, Tenth Revision, Clinical Modification; NHI: National Health Institute; NHIRD: National Health Insurance Research Database.
References
- Hung, M.Y.; Kounis, N.G.; Lu, M.Y.; Hu, P. Myocardial Ischemic Syndromes, Heart Failure Syndromes, Electrocardiographic Abnormalities, Arrhythmic Syndromes and Angiographic Diagnosis of Coronary Artery Spasm: Literature Review. Int. J. Med. Sci. 2020, 17, 1071–1082. [Google Scholar] [CrossRef] [PubMed]
- Ishii, M.; Seki, T.; Kaikita, K.; Sakamoto, K.; Nakai, M.; Sumita, Y.; et al. JROAD Investigators. Short-term exposure to desert dust and the risk of acute myocardial infarction in Japan: a time-stratified case-crossover study. Eur. J. Epidemiol. 2020, 35, 455–464. [Google Scholar] [CrossRef] [PubMed]
- Hung, M.J.; Hu, P.; Hung, M.Y. Coronary artery spasm: review and update. Int. J. Med. Sci. 2014, 11, 1161–1171. [Google Scholar] [CrossRef] [PubMed]
- Woudstra, J.; Vink, C.E.M.; Schipaanboord, D.J.M.; Eringa, E.C.; den Ruijter, H.M.; Feenstra, R.G.T.; et al. Meta-analysis and systematic review of coronary vasospasm in ANOCA patients: Prevalence, clinical features and prognosis. Front. Cardiovasc. Med. 2023, 10, 1129159. [Google Scholar] [CrossRef] [PubMed]
- Ong, P.; Athanasiadis, A.; Hill, S.; Vogelsberg, H.; Voehringer, M.; Sechtem, U. Coronary artery spasm as a frequent cause of acute coronary syndrome: The CASPAR (Coronary Artery Spasm in Patients With Acute Coronary Syndrome) Study. J. Am. Coll. Cardiol. 2008, 52, 523–527. [Google Scholar] [CrossRef] [PubMed]
- Park, Y.M.; Han, S.H.; Ko, K.P.; Koh, K.K.; Kang, W.C.; Lee, K.; et al. Diffuse multi-vessel coronary artery spasm: incidence and clinical prognosis. Int. J. Cardiol. 2013, 167, 398–402. [Google Scholar] [CrossRef] [PubMed]
- Sueda, S.; Kohno, H.; Fukuda, H.; Ochi, N.; Kawada, H.; Hayashi, Y.; et al. Frequency of provoked coronary spasms in patients undergoing coronary arteriography using a spasm provocation test via intracoronary administration of ergonovine. Angiology 2004, 55, 403–411. [Google Scholar] [CrossRef] [PubMed]
- Hung, M.Y.; Hsu, K.H.; Hung, M.J.; Cheng, C.W.; Cherng, W.J. Interactions among gender, age, hypertension and C-reactive protein in coronary vasospasm. Eur. J. Clin. Invest. 2010, 40, 1094–103. [Google Scholar] [CrossRef] [PubMed]
- Bertrand, M.E.; LaBlanche, J.M.; Tilmant, P.Y.; Thieuleux, F.A.; Delforge, M.R.; Carre, A.G.; et al. Frequency of provoked coronary arterial spasm in 1089 consecutive patients undergoing coronary arteriography. Circulation 1982, 65, 1299–1306. [Google Scholar] [CrossRef] [PubMed]
- Vos, T.; Flaxman, A.D.; Naghavi, M.; Lozano, R.; Michaud, C.; Ezzati, M.; et al. Years lived with disability (YLDs) for 1160 sequelae of 289 diseases and injuries 1990-2010: a systematic analysis for the Global Burden of Disease Study 2010. Lancet 2012, 380, 2163–2196. [Google Scholar] [CrossRef] [PubMed]
- Mark, D.B.; Califf, R.M.; Morris, K.G.; Harrell, F.E., Jr.; Pryor, D.B.; Hlatky, M.A.; et al. Clinical characteristics and long-term survival of patients with variant angina. Circulation 1984, 69, 880–888. [Google Scholar] [CrossRef] [PubMed]
- Shimokawa, H.; Nagasawa, K.; Irie, T.; Egashira, S.; Egashira, K.; Sagara, T.; et al. Clinical characteristics and long-term prognosis of patients with variant angina. A comparative study between western and Japanese populations. Int. J. Cardiol. 1988, 18, 331–349. [Google Scholar] [CrossRef] [PubMed]
- Hsieh, C.Y.; Su, C.C.; Shao, S.C.; Sung, S.F.; Lin, S.J.; Kao Yang, Y.H.; et al. Taiwan's National Health Insurance Research Database: past and future. Clin. Epidemiol. 2019, 11, 349–358. [Google Scholar] [CrossRef] [PubMed]
- Hung, M.Y.; Mao, C.T.; Hung, M.J.; Wang, J.K.; Lee, H.C.; Yeh, C.T.; et al. Coronary Artery Spasm as Related to Anxiety and Depression: A Nationwide Population-Based Study. Psychosom. Med. 2019, 81, 237–245. [Google Scholar] [CrossRef] [PubMed]
- Mileva, N.; Nagumo, S.; Mizukami, T.; Sonck, J.; Berry, C.; Gallinoro, E.; et al. Prevalence of Coronary Microvascular Disease and Coronary Vasospasm in Patients With Nonobstructive Coronary Artery Disease: Systematic Review and Meta-Analysis. J. Am. Heart Assoc. 2022, 11, e023207. [Google Scholar] [CrossRef] [PubMed]
- Choi, W.G.; Kim, S.H.; Rha, S.W.; Chen, K.Y.; Li, Y.J.; Choi, B.G.; et al. Impact of old age on clinical and angiographic characteristics of coronary artery spasm as assessed by acetylcholine provocation test. J. Geriatr. Cardiol. 2016, 13, 824–829. [Google Scholar] [CrossRef] [PubMed]
- Odaka, Y.; Takahashi, J.; Tsuburaya, R.; Nishimiya, K.; Hao, K.; Matsumoto, Y.; et al. Plasma concentration of serotonin is a novel biomarker for coronary microvascular dysfunction in patients with suspected angina and unobstructive coronary arteries. Eur. Heart J. 2017, 38, 489–496. [Google Scholar] [CrossRef] [PubMed]
- Choi, B.G.; Rha, S.W.; Yoon, S.G.; Choi, C.U.; Lee, M.W.; Kim, S.W. Association of Major Adverse Cardiac Events up to 5 Years in Patients With Chest Pain Without Significant Coronary Artery Disease in the Korean Population. J. Am. Heart Assoc. 2019, 8, e010541. [Google Scholar] [CrossRef] [PubMed]
- Coma-Canella, I.; Castano, S.; Macías, A.; Calabuig, J.; Artaiz, M. Ergonovine test in angina with normal coronary arteries. Is it worth doing it? Int. J. Cardiol. 2006, 107, 200–206. [Google Scholar] [CrossRef] [PubMed]
- Ong, P.; Athanasiadis, A.; Borgulya, G.; Mahrholdt, H.; Kaski, J.C.; Sechtem, U. High prevalence of a pathological response to acetylcholine testing in patients with stable angina pectoris and unobstructed coronary arteries. The ACOVA Study (Abnormal COronary VAsomotion in patients with stable angina and unobstructed coronary arteries). J. Am. Coll. Cardiol. 2012, 59, 655–662. [Google Scholar] [CrossRef] [PubMed]
- Jansen, T.P.J.; Elias-Smale, S.E.; van den Oord, S.; Gehlmann, H.; Dimitiriu-Leen, A.; Maas, A.H.E.M.; et al. Sex Differences in Coronary Function Test Results in Patient With Angina and Nonobstructive Disease. Front. Cardiovasc. Med. 2021, 8, 750071. [Google Scholar] [CrossRef] [PubMed]
- Beltrame, J.F.; Sasayama, S.; Maseri, A. Racial heterogeneity in coronary artery vasomotor reactivity: differences between Japanese and Caucasian patients. J. Am. Coll. Cardiol. 1999, 33, 1442–1452. [Google Scholar] [CrossRef] [PubMed]
- Maseri, A.; Severi, S.; Nes, M.D.; L'Abbate, A.; Chierchia, S.; Marzilli, M.; et al. Variant" angina: one aspect of a continuous spectrum of vasospastic myocardial ischemia. Pathogenetic mechanisms, estimated incidence and clinical and coronary arteriographic findings in 138 patients. Am. J. Cardiol. 1978, 42, 1019–1035. [Google Scholar] [CrossRef] [PubMed]
- Severi, S.; Davies, G.; Maseri, A.; Marzullo, P.; L'Abbate, A. Long-term prognosis of "variant" angina with medical treatment. Am. J. Cardiol. 1980, 46, 226–232. [Google Scholar] [CrossRef] [PubMed]
- Waters, D.D.; Szlachcic, J.; Miller, D.; Theroux, P. Clinical characteristics of patients with variant angina complicated by myocardial infarction or death within 1 month. Am. J. Cardiol. 1982, 49, 658–664. [Google Scholar] [CrossRef] [PubMed]
- Waters, D.D.; Miller, D.D.; Szlachcic, J.; Bouchard, A.; Méthé, M.; Kreeft, J.; et al. Factors influencing the long-term prognosis of treated patients with variant angina. Circulation 1983, 68, 258–265. [Google Scholar] [CrossRef] [PubMed]
- Sorlie, P.; Wei, G.S. Population-based cohort studies: still relevant? J. Am. Coll. Cardiol. 2011, 58, 2010–2013. [Google Scholar] [CrossRef] [PubMed]
- Feenstra, R.G.T.; Seitz, A.; Boerhout, C.K.M.; Bukkems, L.H.; Stegehuis, V.E.; Teeuwisse, P.J.I.; et al. Principles and pitfalls in coronary vasomotor function testing. EuroIntervention 2022, 17, 1271–1280. [Google Scholar] [CrossRef] [PubMed]
- Wu, P.C.; Huang, K.F. Tracing local sources and long-range transport of PM10 in central Taiwan by using chemical characteristics and Pb isotope ratios. Sci. Rep. 2021, 11, 7593. [Google Scholar] [CrossRef] [PubMed]
- Wu, Y.S.; Tsai, C.Y.; Chang, K.H.; Chiang, C.F. Impact of Air Pollutants Emitted by Taichung Power Plant on Atmospheric PM2.5 in Central Taiwan. Aerosol. Air. Qual. Res. 2021, 21, 200358. [Google Scholar] [CrossRef]
- Ishii, M.; Nakamura, T.; Ikebe, S.; Otsuka, Y.; Tsujita, K. Air pollution before and during the COVID-19 pandemic: changes in risk of acute myocardial infarction. Eur. Heart J. 2026, ehag102. [Google Scholar] [CrossRef] [PubMed]
- Chen, T.L.; Hsieh, W.J.; Lai, H.C.; Lin, N.H.; Tsay, S.C.; Charles, C.C.K.; et al. Seasonal variations in aerosol characteristics from local pollution and long-range transport at the northern tip of Taiwan. Sustain. Environ. Res. 2025, 35, 12. [Google Scholar] [CrossRef]
- Tsai, I.C.; Hsieh, P.R.; Hsu, H.H.; Tung, Y.S.; Chen, Y.M.; Cheng, C.T. Climate change-induced impacts on PM2.5 in Taiwan under 2 and 4 °C global warming. Atmos. Pollut. Res. 2024, 15, 102106. [Google Scholar] [CrossRef]
- Camilli, M.; Russo, M.; Rinaldi, R.; Caffè, A.; La Vecchia, G.; Bonanni, A.; et al. Air Pollution and Coronary Vasomotor Disorders in Patients With Myocardial Ischemia and Unobstructed Coronary Arteries. J. Am. Coll. Cardiol. 2022, 80, 1818–1828. [Google Scholar] [CrossRef] [PubMed]
- Kuehn, B.M. Closure of Coal-Burning Plant in Pittsburgh Linked to Big Reductions in Heart-Related Emergency Department Visits and Hospitalizations. Circulation 2024, 149, 1611–1613. [Google Scholar] [CrossRef] [PubMed]
- Hsieh, C.L.; Chung, C.Y.; Chen, H.Y.; Shieh, S.H.; Hsieh, M.S.; Hsieh, V.C. Bridging geographical disparities across 368 townships with healthcare system and socioeconomic factors in Taiwan. Sci. Rep. 2023, 13, 15007. [Google Scholar] [CrossRef] [PubMed]
- Hung, M.J.; Hsu, K.H.; Chang, N.C.; Hung, M.Y. Increased Numbers of Coronary Events in Winter and Spring Due to Coronary Artery Spasm: Effect of Age, Sex, Smoking, and Inflammation. J. Am. Coll. Cardiol. 2015, 65, 2047–2048. [Google Scholar] [CrossRef] [PubMed]
- Kurihara, O.; Takano, M.; Yamamoto, E.; Yonetsu, T.; Kakuta, T.; Soeda, T.; et al. Seasonal Variations in the Pathogenesis of Acute Coronary Syndromes. J. Am. Heart Assoc. 2020, 9, e015579. [Google Scholar] [CrossRef] [PubMed]
- Vaudrey, B.; Mielcarek, M.; Sauleau, E.; Meyer, N.; Marchandot, B.; Moitry, M.; et al. Short-Term Effects of Air Pollution on Coronary Events in Strasbourg, France-Importance of Seasonal Variations. Med. Sci. . 2020, 8, 31. [Google Scholar] [CrossRef] [PubMed]
- Ikäheimo, T.M. Cardiovascular diseases, cold exposure and exercise. Temperature . 2018, 5, 123–146. [Google Scholar] [CrossRef] [PubMed]
- Widlansky, M.E.; Vita, J.A.; Keyes, M.J.; Larson, M.G.; Hamburg, N.M.; Levy, D.; et al. Relation of season and temperature to endothelium-dependent flow-mediated vasodilation in subjects without clinical evidence of cardiovascular disease (from the Framingham Heart Study). Am. J. Cardiol. 2007, 100, 518–523. [Google Scholar] [CrossRef] [PubMed]
Figure 1.
Prevalence of coronary artery spasm in Taiwan from 2004 to 2018.
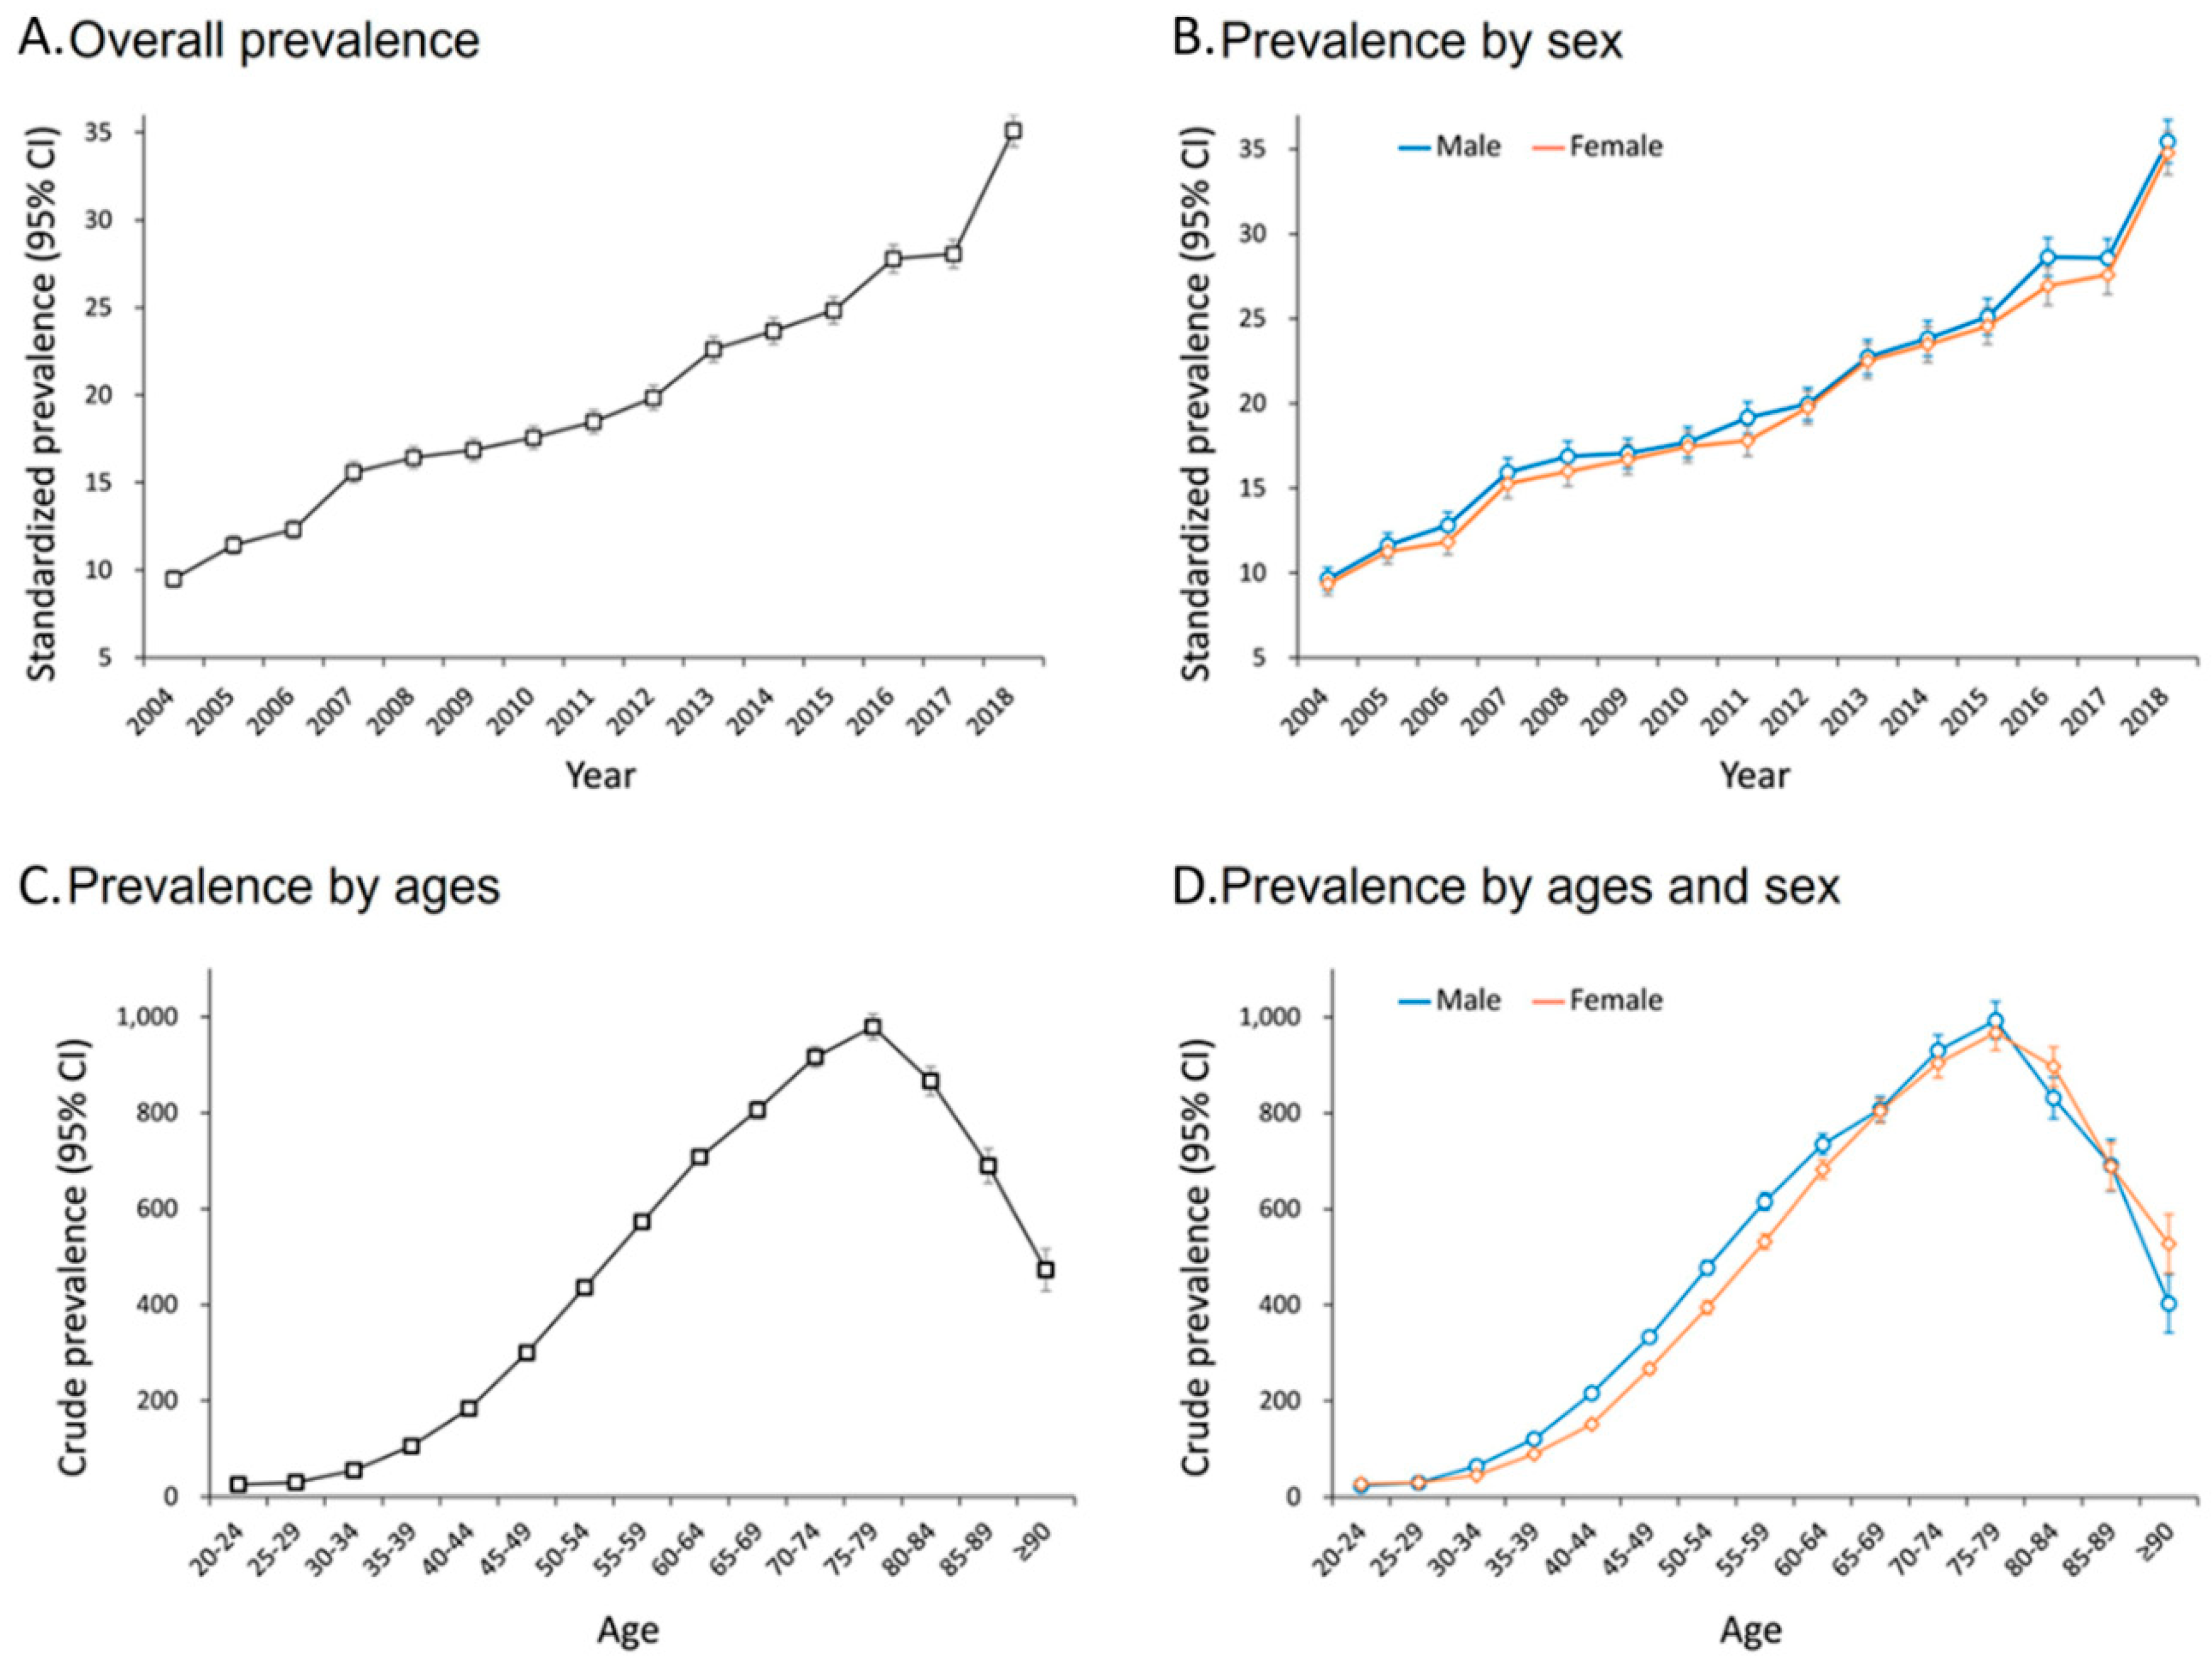
Figure 2.
Incidence of coronary artery spasm in Taiwan from 2004 to 2018.
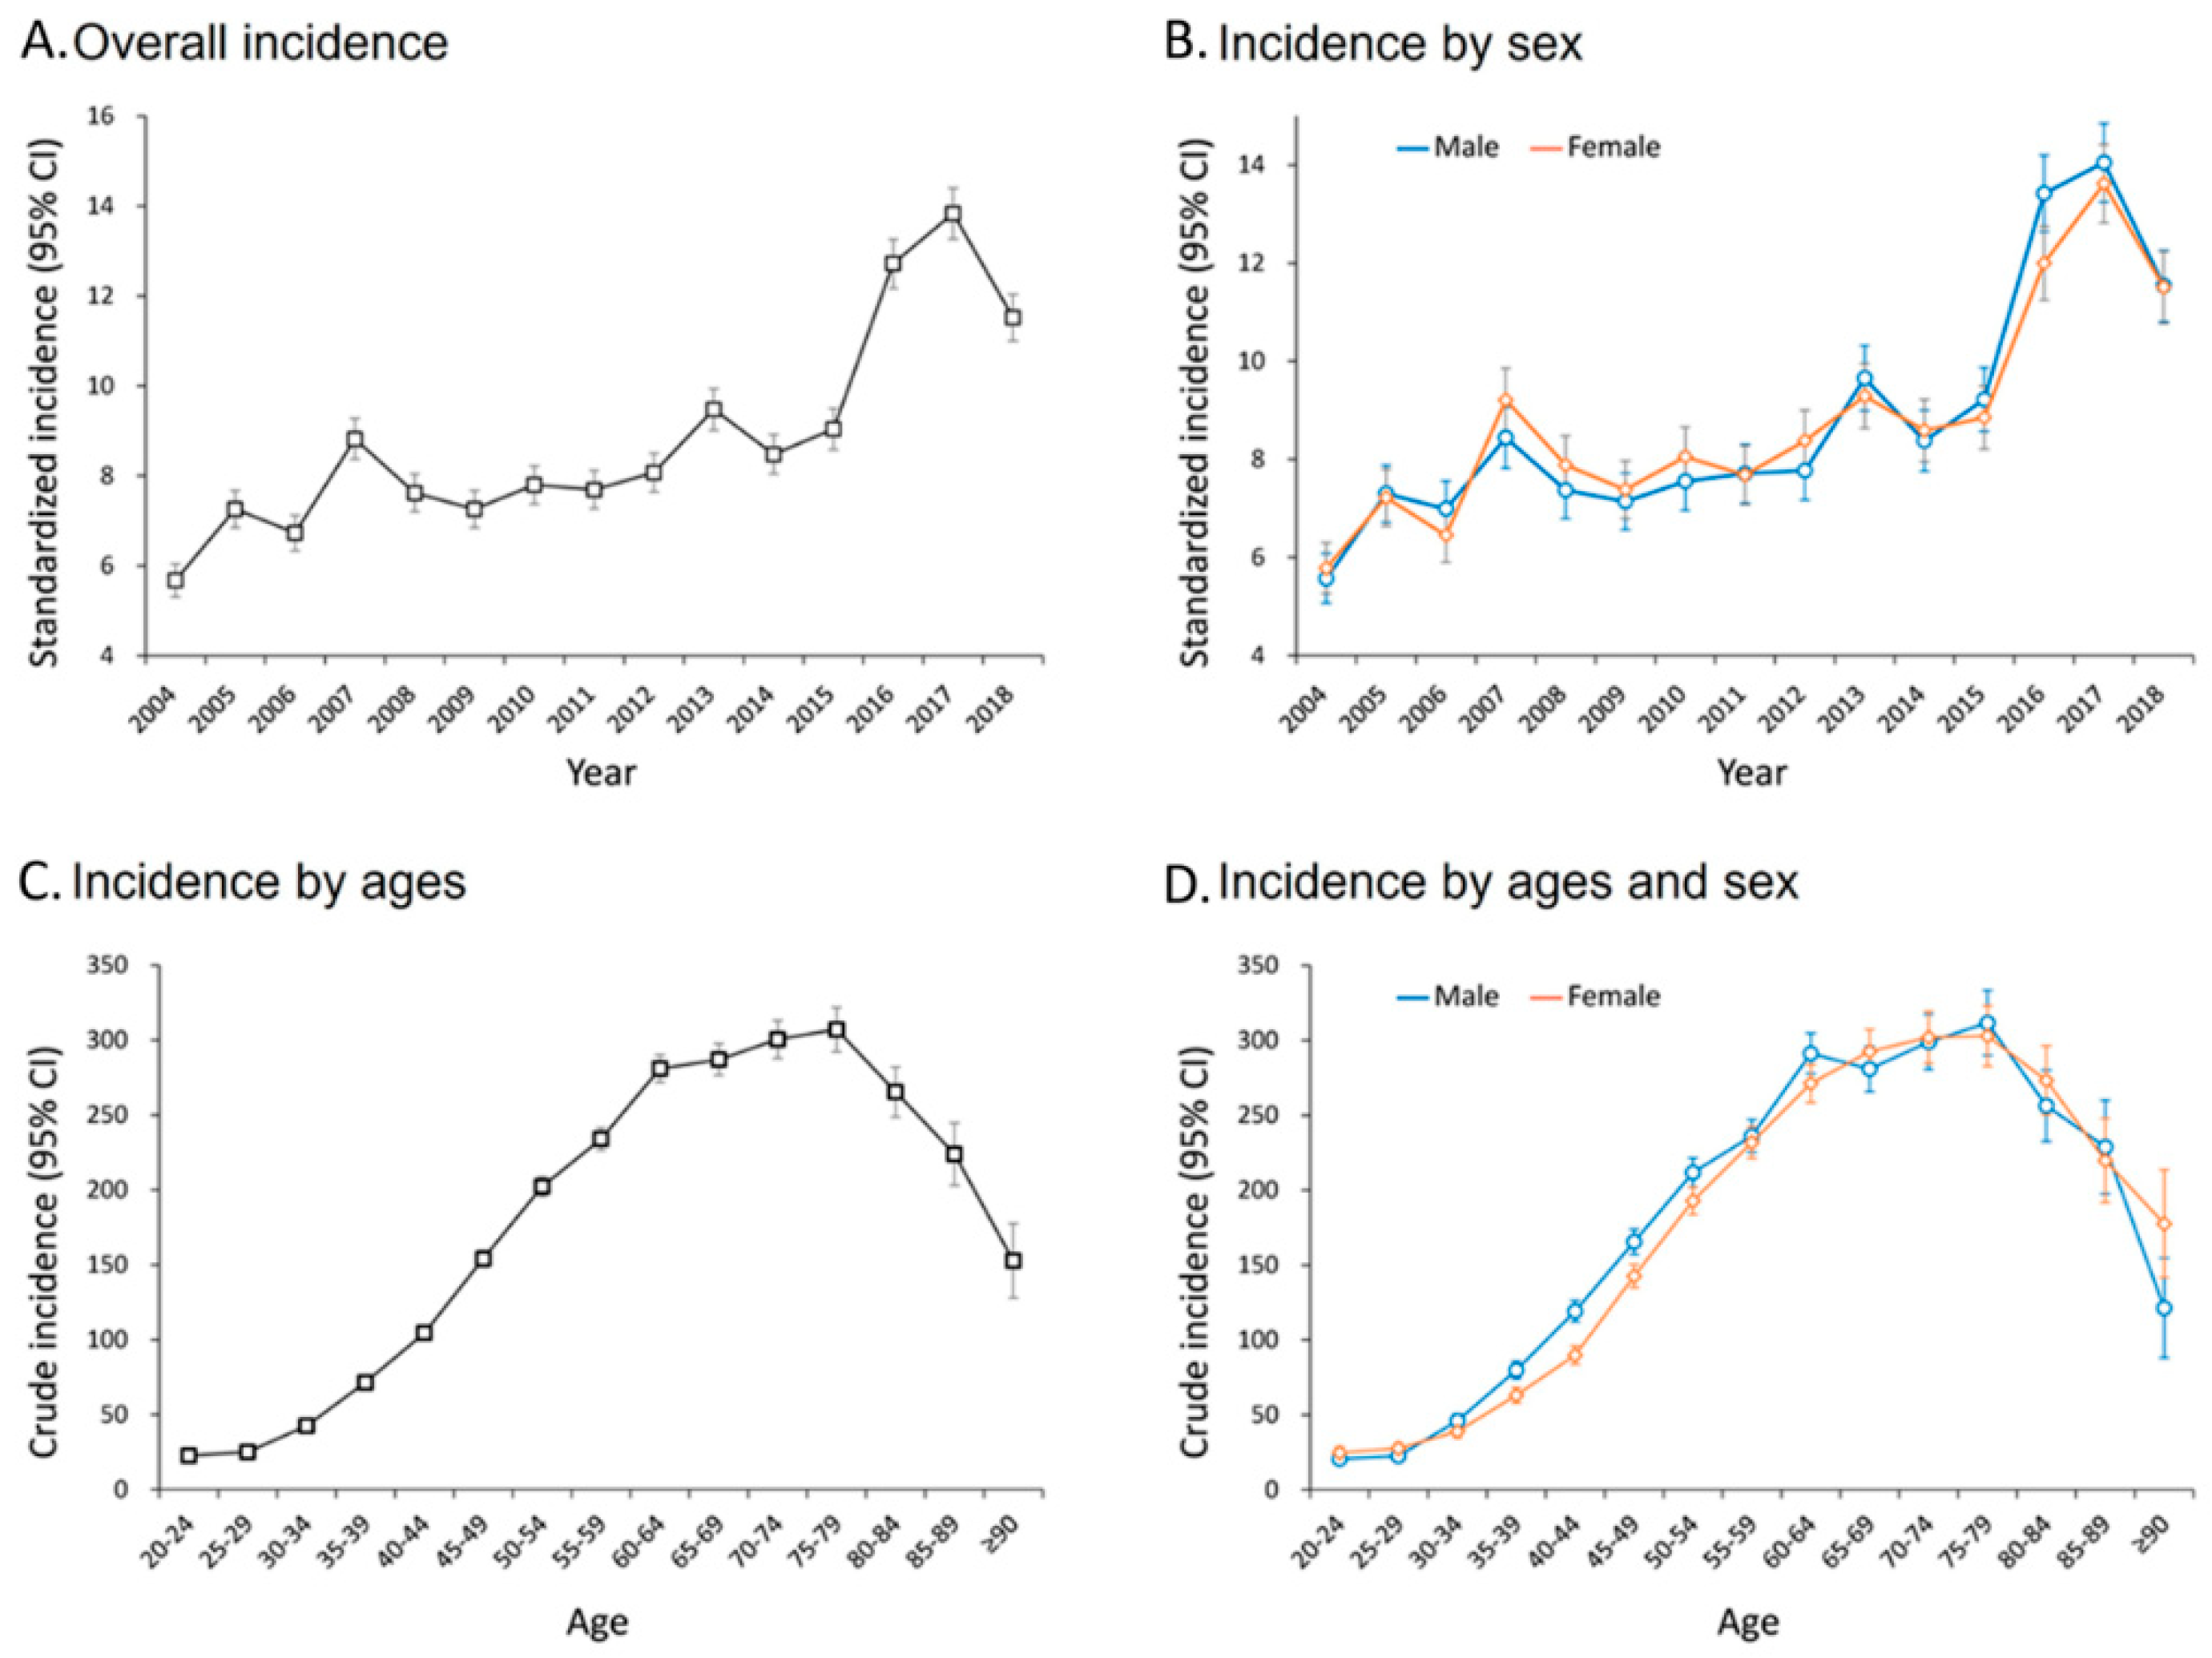
Figure 3.
Geographic distribution of coronary artery spasm prevalence and incidence. The age-standardized population-based prevalence (A) and incidence (B) of coronary artery spasm across cities and counties in Taiwan, along with (C) a global distribution of coronary artery spasm cohort-study prevalence by country and region.
Figure 3.
Geographic distribution of coronary artery spasm prevalence and incidence. The age-standardized population-based prevalence (A) and incidence (B) of coronary artery spasm across cities and counties in Taiwan, along with (C) a global distribution of coronary artery spasm cohort-study prevalence by country and region.
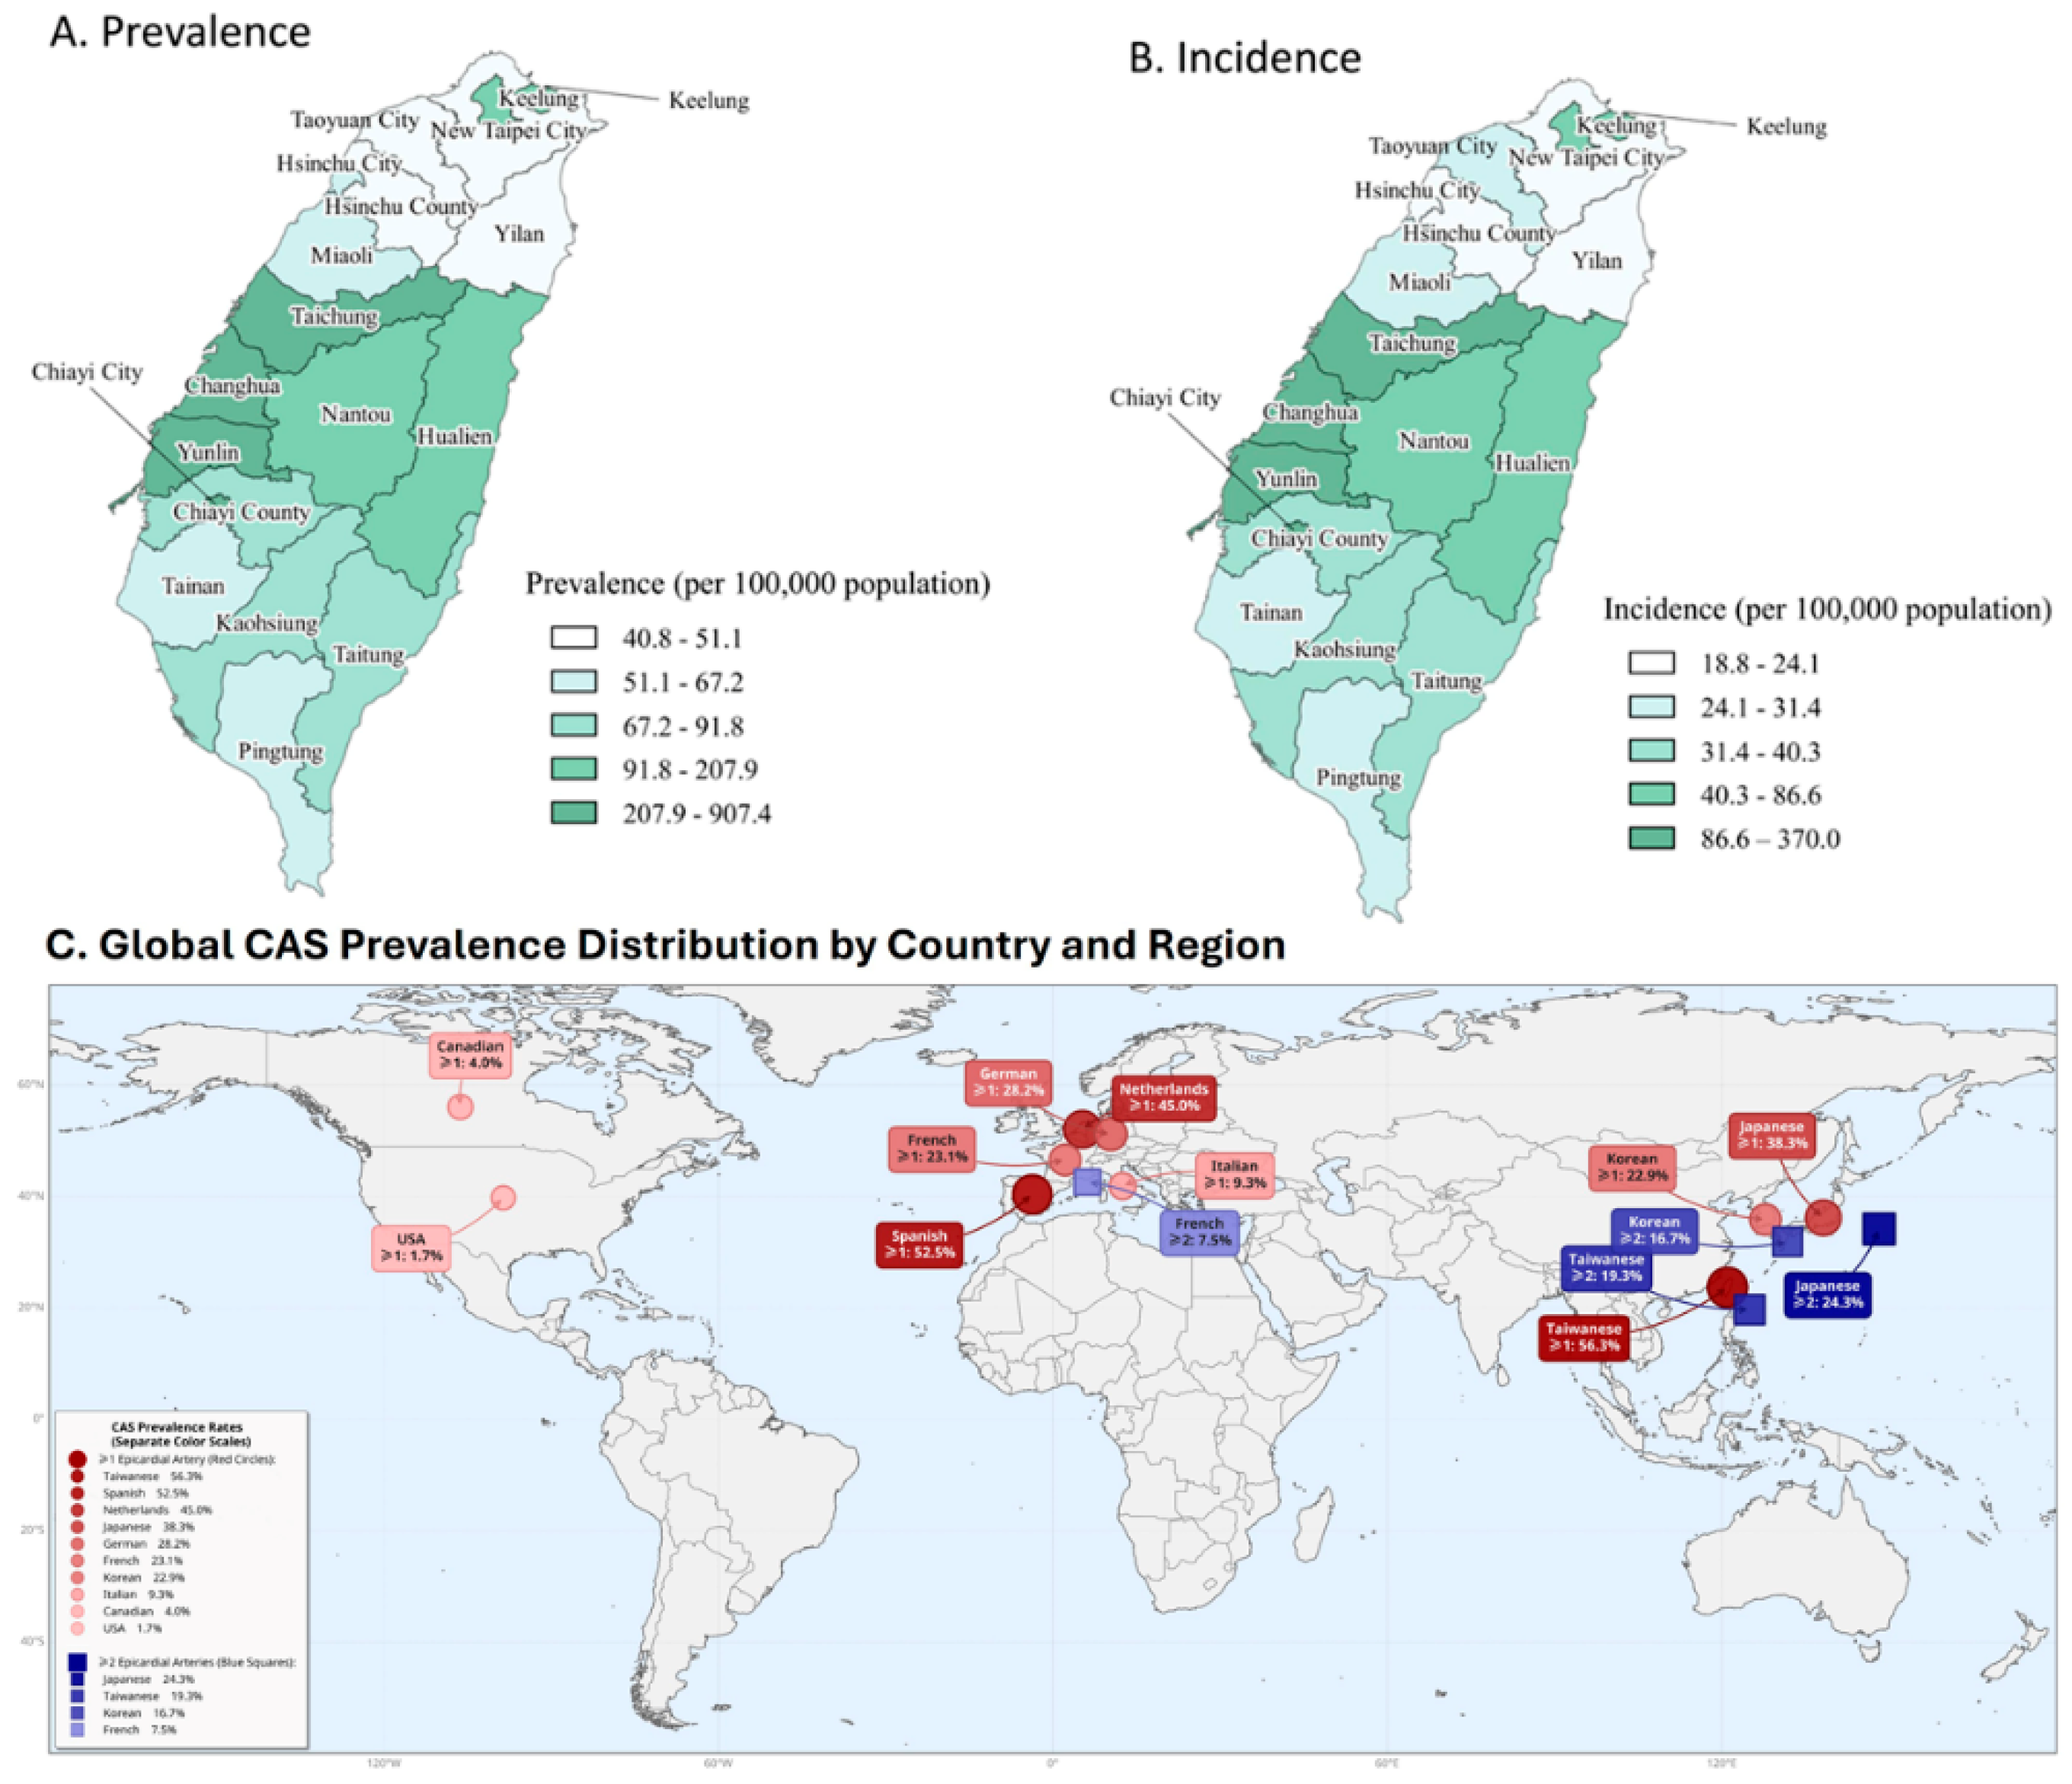
Figure 4.
Monthly and seasonal trends in coronary artery spasm incidence in Taiwan, 2004–2018.
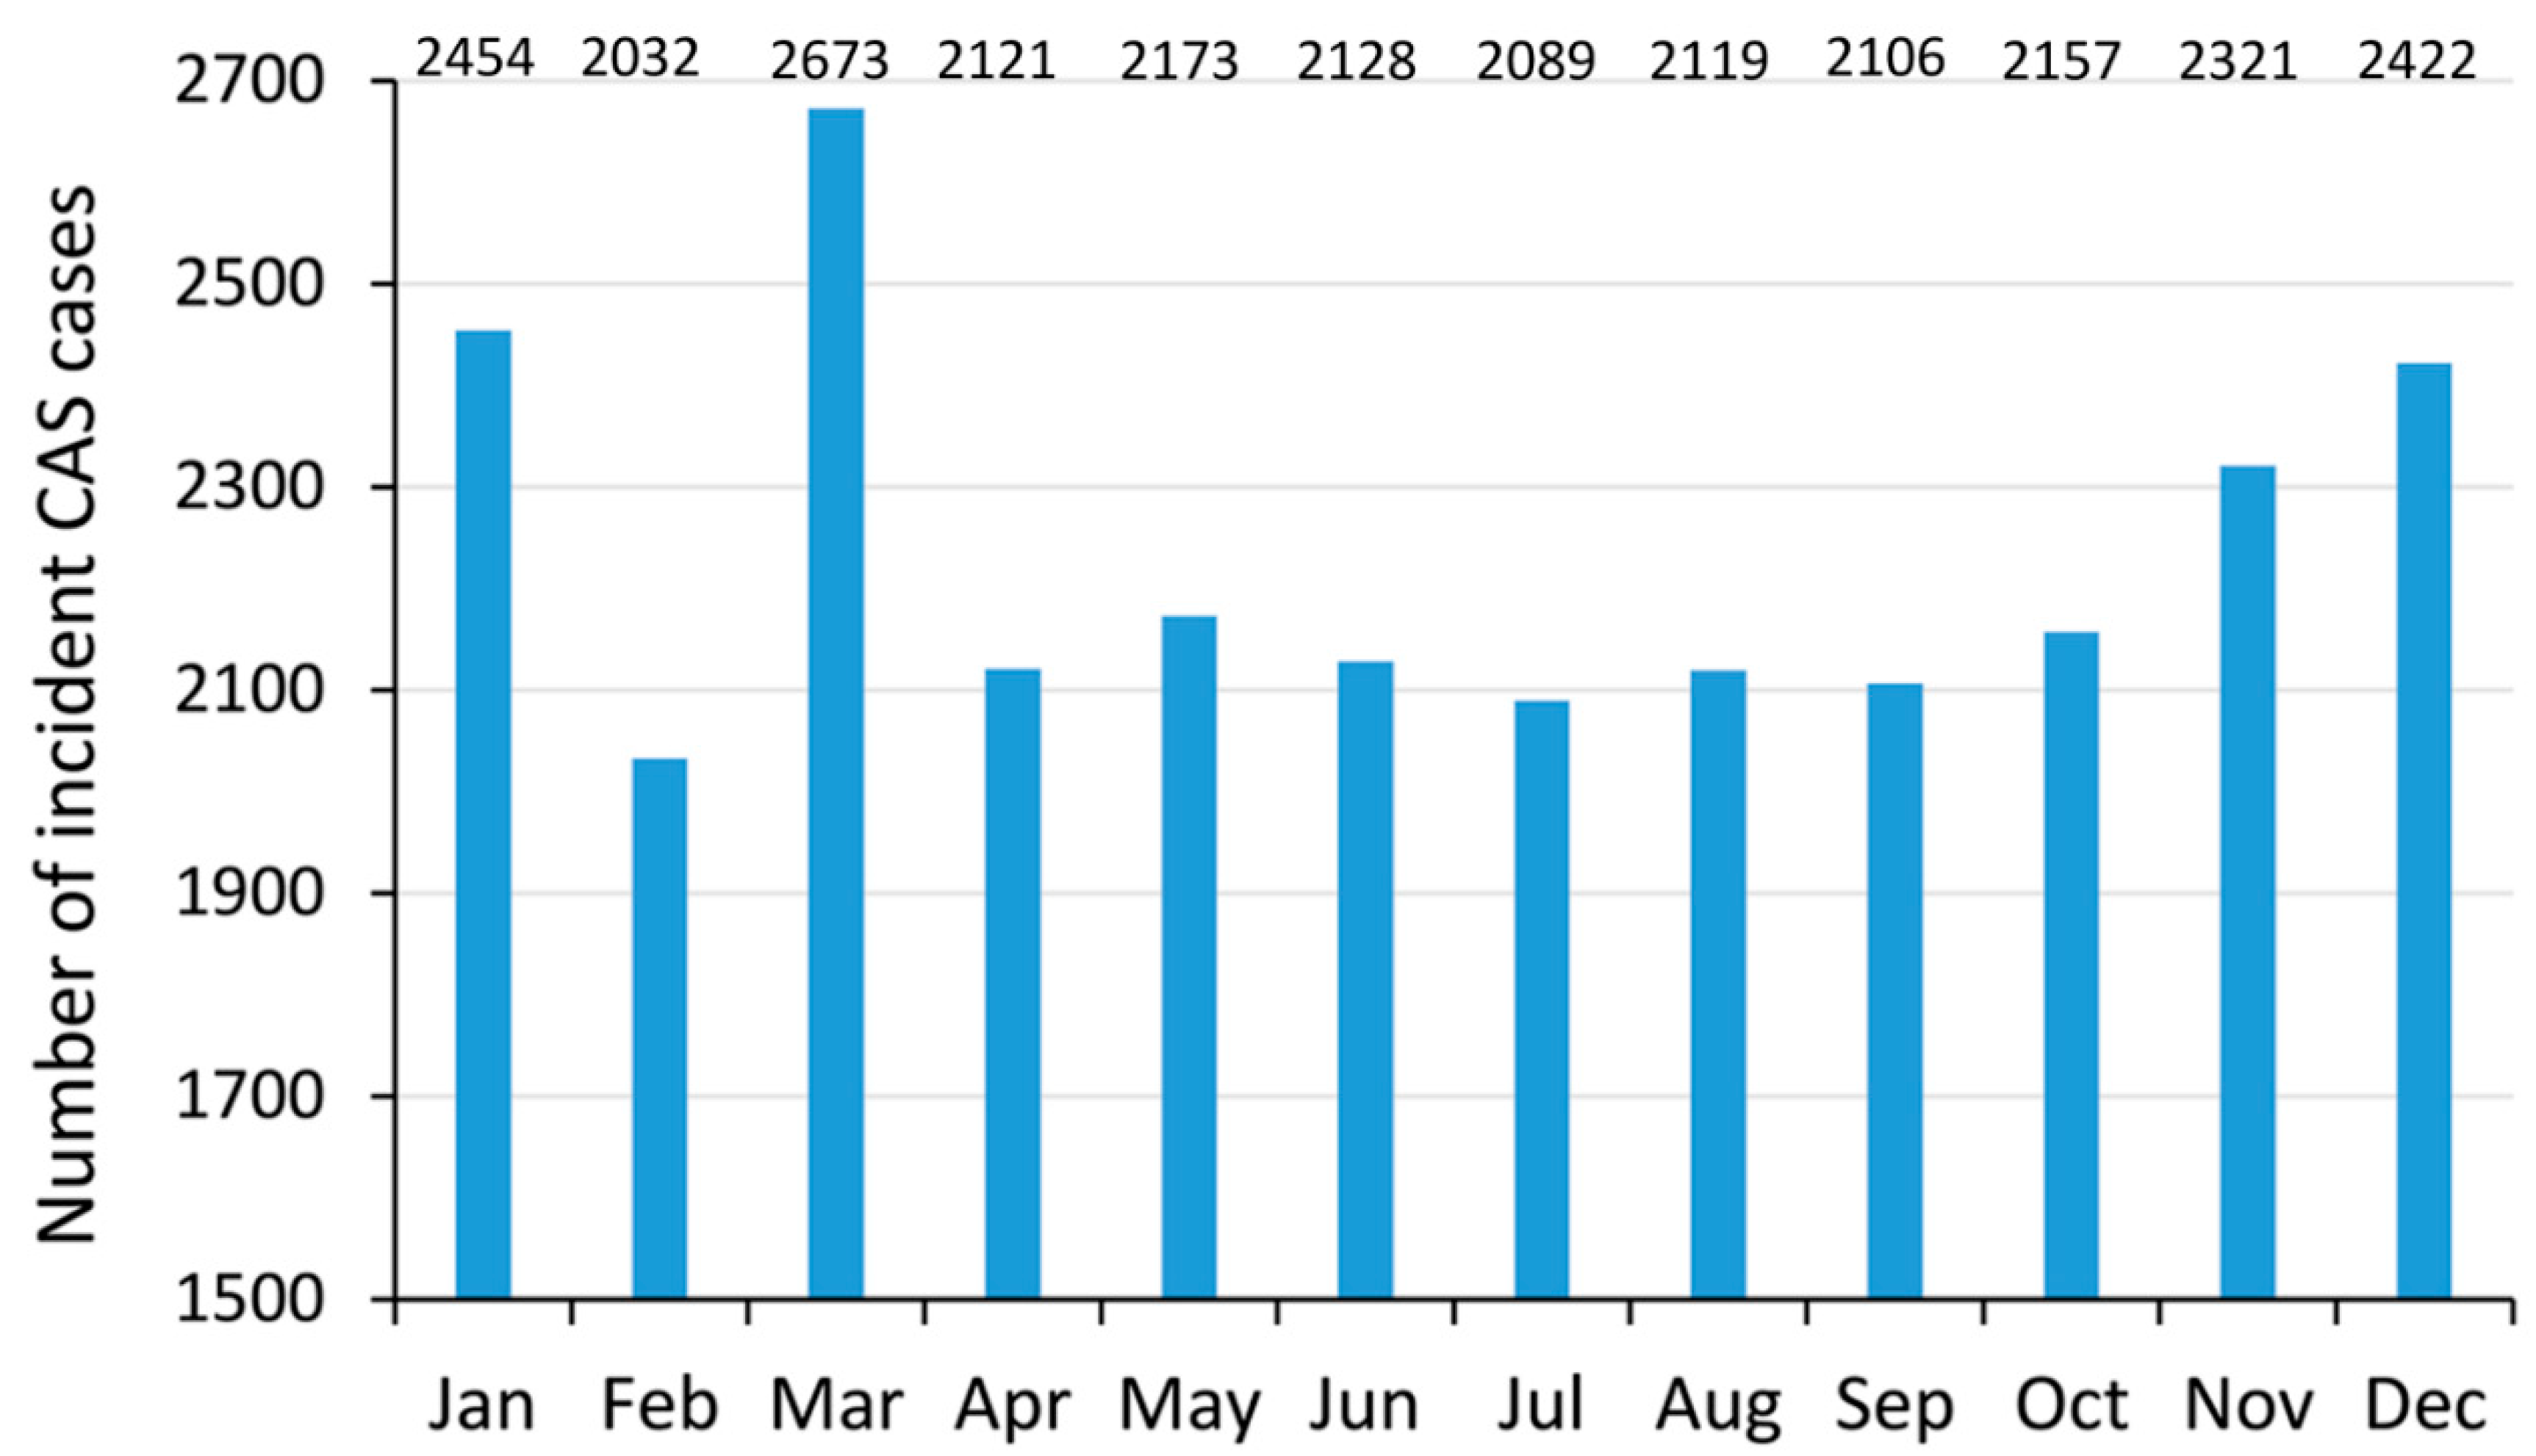
Figure 5.
Hypothesized contributors to the higher CAS burden observed in central-western Taiwan. This conceptual schematic summarizes factors that may plausibly contribute to the regional clustering—population aging, ambient and seasonal air pollution, industrial emissions, topographic pollutant stagnation, comorbidity burden, socioeconomic conditions, and healthcare access. These factors were not formally tested in the present study; the figure is intended as a hypothesis-generating framework to guide future individual-level and spatial analyses. PM₂.₅, particulate matter with aerodynamic diameter ≤2.5 μm; VOCs, volatile organic compounds; NOₓ, nitrogen oxides; SO₂, sulfur dioxide.
Figure 5.
Hypothesized contributors to the higher CAS burden observed in central-western Taiwan. This conceptual schematic summarizes factors that may plausibly contribute to the regional clustering—population aging, ambient and seasonal air pollution, industrial emissions, topographic pollutant stagnation, comorbidity burden, socioeconomic conditions, and healthcare access. These factors were not formally tested in the present study; the figure is intended as a hypothesis-generating framework to guide future individual-level and spatial analyses. PM₂.₅, particulate matter with aerodynamic diameter ≤2.5 μm; VOCs, volatile organic compounds; NOₓ, nitrogen oxides; SO₂, sulfur dioxide.
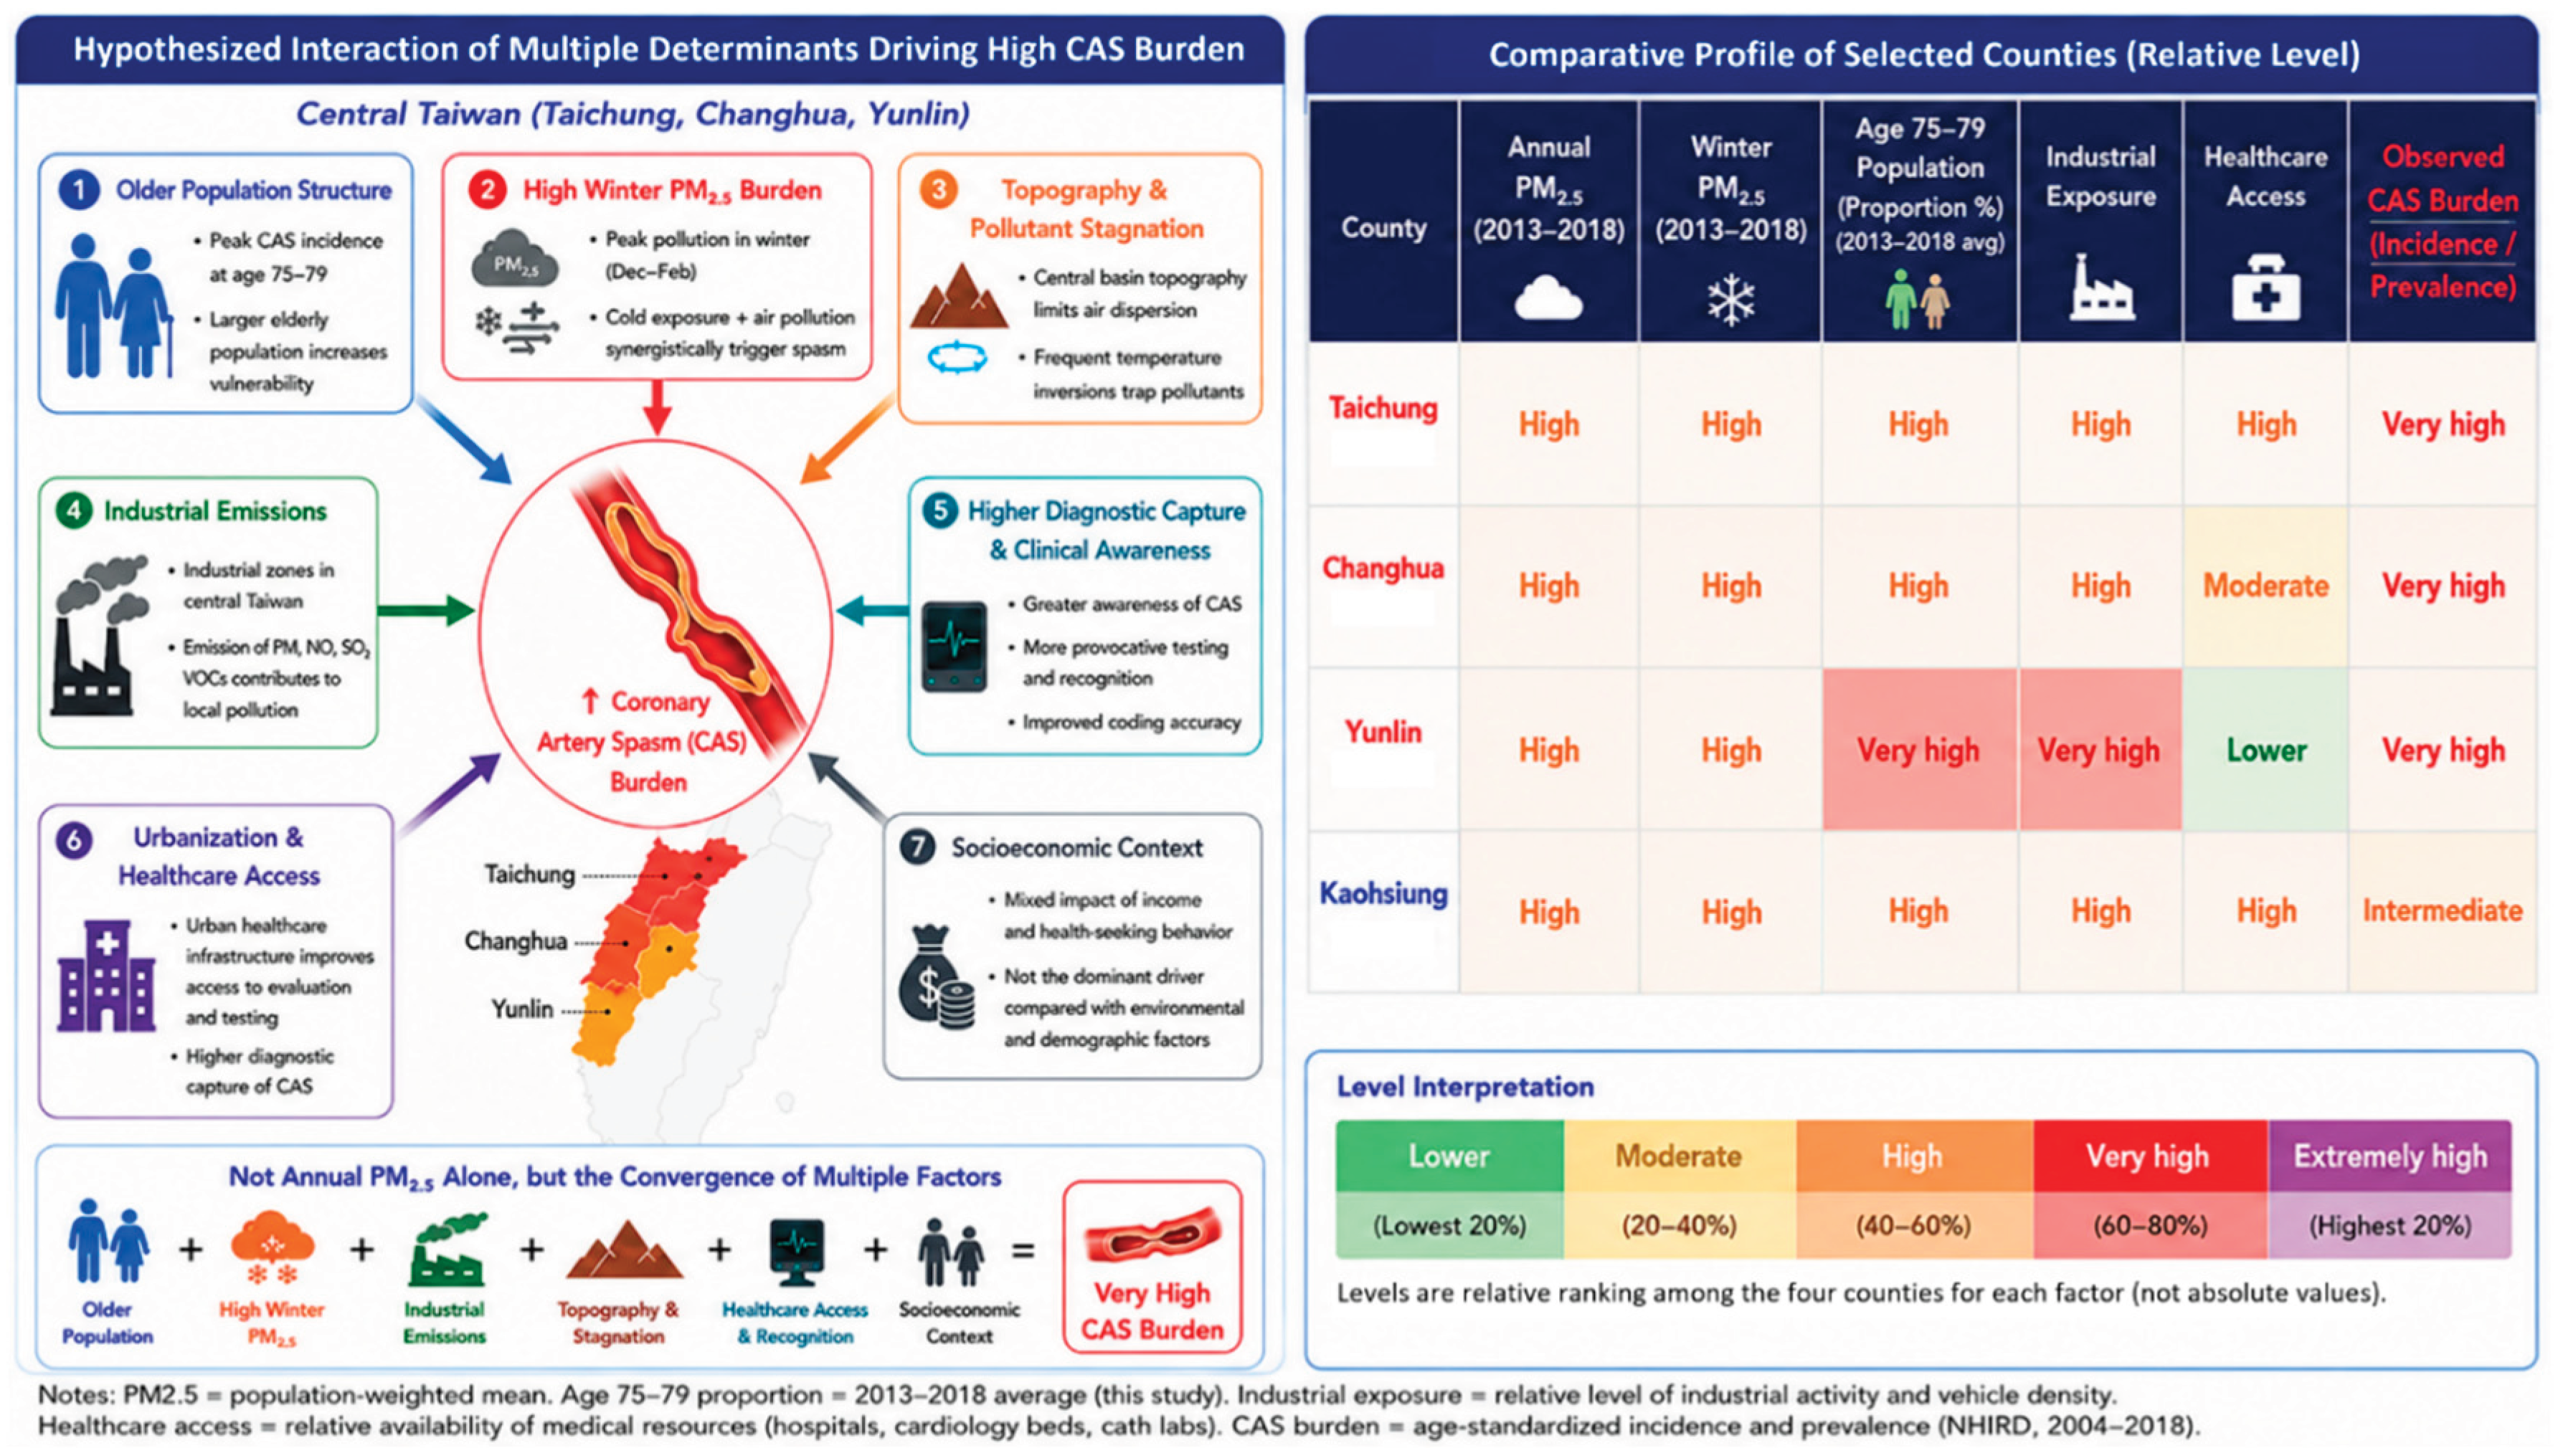

Table 1.
Baseline characteristics of patients with coronary artery spasm.
| Variable | Total (n = 27,974) |
Male (n = 14,057) |
Female (n = 13,917) |
P value |
|---|---|---|---|---|
| Age at diagnosis of CAS (years) | 57.9 ± 14.1 | 57.2 ± 14.0 | 58.7 ± 14.2 | <0.001 |
| Age group | <0.001 | |||
| 20–24 | 369 (1.3) | 175 (1.2) | 194 (1.4) | |
| 25–29 | 441 (1.6) | 204 (1.5) | 237 (1.7) | |
| 30–34 | 785 (2.8) | 429 (3.1) | 356 (2.6) | |
| 35–39 | 1,388 (5.0) | 769 (5.5) | 619 (4.5) | |
| 40–44 | 2,040 (7.3) | 1,159 (8.3) | 881 (6.3) | |
| 45–49 | 2,947 (10.5) | 1,570 (11.2) | 1,377 (9.9) | |
| 50–54 | 3,698 (13.2) | 1,916 (13.6) | 1,782 (12.8) | |
| 55–59 | 3,804 (13.6) | 1,885 (13.4) | 1,919 (13.8) | |
| 60–64 | 3,735 (13.4) | 1,871 (13.3) | 1,864 (13.4) | |
| 65–69 | 3,016 (10.8) | 1,412 (10.0) | 1,604 (11.5) | |
| 70–74 | 2,322 (8.3) | 1,089 (7.8) | 1,233 (8.9) | |
| 75–79 | 1,763 (6.3) | 837 (6.0) | 926 (6.7) | |
| 80–84 | 1,054 (3.8) | 475 (3.4) | 579 (4.2) | |
| 85–89 | 463 (1.7) | 214 (1.5) | 249 (1.8) | |
| ≥90 | 149 (0.5) | 52 (0.4) | 97 (0.7) | |
| Urbanization level of the residence | 0.412 | |||
| Low | 4,748 (17.0) | 2,347 (16.7) | 2,401 (17.3) | |
| Moderate | 12,067 (43.1) | 6,060 (43.1) | 6,007 (43.2) | |
| High | 7,190 (25.7) | 3,665 (26.1) | 3,525 (25.3) | |
| Very High | 3,969 (14.2) | 1,985 (14.1) | 1,984 (14.3) | |
| Monthly income, NTD$ | <0.001 | |||
| Tertile 1 | 8,271 (29.6) | 4,097 (29.2) | 4,174 (30.0) | |
| Tertile 2 | 10,133 (36.2) | 4,722 (33.6) | 5,411 (38.9) | |
| Tertile 3 | 9,570 (34.2) | 5,238 (37.3) | 4,332 (31.1) | |
| Comorbidity | ||||
| Diabetes mellitus | 5,132 (18.4) | 2,542 (18.1) | 2,590 (18.6) | 0.255 |
| Hypertension | 16,778 (60.0) | 8,991 (64.0) | 7,787 (56.0) | <0.001 |
| Dyslipidemia | 8,937 (32.0) | 4,646 (33.1) | 4,291 (30.8) | <0.001 |
| Chronic kidney disease | 2,350 (8.4) | 1,286 (9.2) | 1,064 (7.7) | <0.001 |
| Chronic obstructive pulmonary disease | 2,038 (7.3) | 1,391 (9.9) | 647 (4.7) | <0.001 |
| Gouty arthritis | 1,827 (6.5) | 1,416 (10.1) | 411 (3.0) | <0.001 |
| Hepatitis C virus infection | 530 (1.9) | 250 (1.8) | 280 (2.0) | 0.152 |
| Depression | 1,582 (5.7) | 620 (4.4) | 962 (6.9) | <0.001 |
| Psychotic disorders | 18 (0.1) | 9 (0.1) | 9 (0.1) | 0.983 |
| Anxiety | 5,232 (18.7) | 2,086 (14.8) | 3,146 (22.6) | <0.001 |
| Stroke | 1,498 (5.4) | 826 (5.9) | 672 (4.8) | <0.001 |
| Obstructive coronary artery disease | 10,135 (36.2) | 5,749 (40.9) | 4,386 (31.5) | <0.001 |
| Acute coronary syndrome | 2,450 (8.8) | 1,580 (11.2) | 870 (6.3) | <0.001 |
| Coronary revascularization | 1,418 (5.1) | 1,051 (7.5) | 367 (2.6) | <0.001 |
| Charlson’s Comorbidity Index score | <0.001 | |||
| Mean ± standard deviation | 1.1 ± 1.4 | 1.2 ± 1.5 | 1.0 ± 1.4 | |
| Median [25th, 75th percentiles] | 1 [0, 2] | 1 [0, 2] | 1 [0, 2] |
Data were presented as frequency (percentage) or mean ± standard deviation. CAS: coronary artery spasm; NTD: New Taiwan Dollar.
Table 2.
Overall crude and age-standardized coronary artery spasm prevalence and incidence, 2004–2018.
Table 2.
Overall crude and age-standardized coronary artery spasm prevalence and incidence, 2004–2018.
| Population | Prevalence rate* | Incidence rate* | |||||
|---|---|---|---|---|---|---|---|
| Year | size | Number | Crude (95% CI) | Standardized (95% CI)** | Number | Crude (95% CI) | Standardized (95% CI)** |
| 2004 | 16,593,129 | 1,577 | 9.50 (9.03–9.97) | 9.50 (9.03–9.97) | 942 | 5.68 (5.31–6.04) | 5.68 (5.31–6.04) |
| 2005 | 16,815,228 | 1,955 | 11.63 (11.11–12.14) | 11.44 (10.93–11.96) | 1,238 | 7.36 (6.95–7.77) | 7.26 (6.85–7.67) |
| 2006 | 17,021,654 | 2,171 | 12.75 (12.22–13.29) | 12.33 (11.79–12.86) | 1,179 | 6.93 (6.53–7.32) | 6.73 (6.33–7.12) |
| 2007 | 17,214,809 | 2,822 | 16.39 (15.79–17.00) | 15.59 (14.99–16.19) | 1,589 | 9.23 (8.78–9.68) | 8.82 (8.37–9.27) |
| 2008 | 17,416,633 | 3,058 | 17.56 (16.94–18.18) | 16.43 (15.82–17.05) | 1,403 | 8.06 (7.63–8.48) | 7.62 (7.20–8.04) |
| 2009 | 17,624,651 | 3,234 | 18.35 (17.72–18.98) | 16.87 (16.24–17.49) | 1,379 | 7.82 (7.41–8.24) | 7.26 (6.85–7.67) |
| 2010 | 17,826,543 | 3,452 | 19.36 (18.72–20.01) | 17.58 (16.94–18.21) | 1,507 | 8.45 (8.03–8.88) | 7.80 (7.37–8.22) |
| 2011 | 18,020,272 | 3,739 | 20.75 (20.08–21.41) | 18.49 (17.83–19.14) | 1,529 | 8.48 (8.06–8.91) | 7.69 (7.27–8.12) |
| 2012 | 18,199,752 | 4,115 | 22.61 (21.92–23.30) | 19.85 (19.18–20.53) | 1,635 | 8.98 (8.55–9.42) | 8.07 (7.64–8.50) |
| 2013 | 18,379,293 | 4,843 | 26.35 (25.61–27.09) | 22.62 (21.89–23.34) | 1,977 | 10.76 (10.28–11.23) | 9.48 (9.01–9.94) |
| 2014 | 18,554,307 | 5,183 | 27.93 (27.17–28.69) | 23.66 (22.92–24.40) | 1,781 | 9.60 (9.15–10.04) | 8.48 (8.04–8.92) |
| 2015 | 18,721,556 | 5,613 | 29.98 (29.20–30.77) | 24.84 (24.08–25.59) | 1,966 | 10.50 (10.04–10.97) | 9.04 (8.58–9.50) |
| 2016 | 18,883,809 | 6,450 | 34.16 (33.32–34.99) | 27.78 (26.98–28.59) | 2,876 | 15.23 (14.67–15.79) | 12.72 (12.17–13.26) |
| 2017 | 19,042,221 | 6,631 | 34.82 (33.98–35.66) | 28.07 (27.27–28.88) | 3,134 | 16.46 (15.88–17.03) | 13.84 (13.27–14.40) |
| 2018 | 19,171,861 | 8,570 | 44.70 (43.75–45.65) | 35.11 (34.20–36.01) | 2,661 | 13.88 (13.35–14.41) | 11.52 (11.00–12.04) |
CI: confidence interval. *Number of cases per 100,000 population size. **Standardized according to the population in 2004 of Taiwan.
Table 3.
Crude and age-standardized coronary artery spasm prevalence and incidence by sex, 2004–2018.
Table 3.
Crude and age-standardized coronary artery spasm prevalence and incidence by sex, 2004–2018.
| Population | Prevalence rate* | Incidence rate* | |||||
|---|---|---|---|---|---|---|---|
| Cohort / Year | size | Number | Crude (95% CI) | Standardized (95% CI)** | Number | Crude (95% CI) | Standardized (95% CI) ** |
| Men | |||||||
| 2004 | 8,378,305 | 808 | 9.64 (8.98–10.31) | 9.64 (8.98–10.31) | 467 | 5.57 (5.07–6.08) | 5.57 (5.07–6.08) |
| 2005 | 8,472,284 | 1,001 | 11.81 (11.08–12.55) | 11.63 (10.90–12.36) | 627 | 7.40 (6.82–7.98) | 7.30 (6.72–7.88) |
| 2006 | 8,554,330 | 1,140 | 13.33 (12.55–14.10) | 12.82 (12.05–13.59) | 621 | 7.26 (6.69–7.83) | 6.99 (6.43–7.56) |
| 2007 | 8,628,000 | 1,455 | 16.86 (16.00–17.73) | 15.92 (15.07–16.78) | 768 | 8.90 (8.27–9.53) | 8.44 (7.82–9.06) |
| 2008 | 8,707,835 | 1,582 | 18.17 (17.27–19.06) | 16.88 (16.00–17.76) | 681 | 7.82 (7.23–8.41) | 7.37 (6.79–7.95) |
| 2009 | 8,787,710 | 1,649 | 18.76 (17.86–19.67) | 17.05 (16.17–17.93) | 686 | 7.81 (7.22–8.39) | 7.14 (6.57–7.72) |
| 2010 | 8,864,987 | 1,754 | 19.79 (18.86–20.71) | 17.71 (16.80–18.61) | 733 | 8.27 (7.67–8.87) | 7.55 (6.96–8.14) |
| 2011 | 8,943,954 | 1,950 | 21.80 (20.83–22.77) | 19.16 (18.22–20.09) | 770 | 8.61 (8.00–9.22) | 7.71 (7.11–8.30) |
| 2012 | 9,017,734 | 2,089 | 23.17 (22.17–24.16) | 19.96 (19.00–20.92) | 792 | 8.78 (8.17–9.39) | 7.77 (7.17–8.36) |
| 2013 | 9,092,594 | 2,445 | 26.89 (25.82–27.96) | 22.73 (21.71–23.76) | 1,006 | 11.06 (10.38–11.75) | 9.65 (8.99–10.32) |
| 2014 | 9,165,660 | 2,626 | 28.65 (27.55–29.75) | 23.83 (22.79–24.88) | 883 | 9.63 (9.00–10.27) | 8.38 (7.76–9.00) |
| 2015 | 9,235,672 | 2,856 | 30.92 (29.79–32.06) | 25.11 (24.03–26.18) | 1,006 | 10.89 (10.22–11.57) | 9.22 (8.57–9.87) |
| 2016 | 9,303,171 | 3,322 | 35.71 (34.49–36.92) | 28.63 (27.49–29.78) | 1,513 | 16.26 (15.44–17.08) | 13.42 (12.64–14.20) |
| 2017 | 9,369,319 | 3,363 | 35.89 (34.68–37.11) | 28.56 (27.42–29.71) | 1,587 | 16.94 (16.10–17.77) | 14.05 (13.25–14.85) |
| 2018 | 9,421,493 | 4,342 | 46.09 (44.72–47.46) | 35.44 (34.17–36.72) | 1,337 | 14.19 (13.43–14.95) | 11.54 (10.81–12.26) |
| Women | |||||||
| 2004 | 8,214,824 | 769 | 9.36 (8.70–10.02) | 9.36 (8.70–10.02) | 475 | 5.78 (5.26–6.30) | 5.78 (5.26–6.30) |
| 2005 | 8,342,944 | 954 | 11.43 (10.71–12.16) | 11.25 (10.53–11.98) | 611 | 7.32 (6.74–7.90) | 7.22 (6.64–7.80) |
| 2006 | 8,467,324 | 1,031 | 12.18 (11.43–12.92) | 11.83 (11.08–12.57) | 558 | 6.59 (6.04–7.14) | 6.45 (5.90–7.00) |
| 2007 | 8,586,809 | 1,367 | 15.92 (15.08–16.76) | 15.26 (14.41–16.10) | 821 | 9.56 (8.91–10.22) | 9.21 (8.55–9.86) |
| 2008 | 8,708,798 | 1,476 | 16.95 (16.08–17.81) | 15.98 (15.11–16.84) | 722 | 8.29 (7.69–8.90) | 7.88 (7.27–8.48) |
| 2009 | 8,836,941 | 1,585 | 17.94 (17.05–18.82) | 16.68 (15.80–17.57) | 693 | 7.84 (7.26–8.43) | 7.38 (6.79–7.97) |
| 2010 | 8,961,556 | 1,698 | 18.95 (18.05–19.85) | 17.44 (16.54–18.35) | 774 | 8.64 (8.03–9.25) | 8.05 (7.43–8.66) |
| 2011 | 9,076,318 | 1,789 | 19.71 (18.80–20.62) | 17.80 (16.89–18.71) | 759 | 8.36 (7.77–8.96) | 7.68 (7.08–8.28) |
| 2012 | 9,182,018 | 2,026 | 22.06 (21.10–23.03) | 19.75 (18.78–20.71) | 843 | 9.18 (8.56–9.80) | 8.38 (7.75–9.00) |
| 2013 | 9,286,699 | 2,398 | 25.82 (24.79–26.86) | 22.50 (21.47–23.52) | 971 | 10.46 (9.80–11.11) | 9.29 (8.63–9.95) |
| 2014 | 9,388,647 | 2,557 | 27.24 (26.18–28.29) | 23.48 (22.44–24.53) | 898 | 9.56 (8.94–10.19) | 8.59 (7.95–9.22) |
| 2015 | 9,485,884 | 2,757 | 29.06 (27.98–30.15) | 24.56 (23.49–25.63) | 960 | 10.12 (9.48–10.76) | 8.85 (8.21–9.49) |
| 2016 | 9,580,638 | 3,128 | 32.65 (31.51–33.79) | 26.92 (25.80–28.04) | 1,363 | 14.23 (13.47–14.98) | 12.00 (11.25–12.75) |
| 2017 | 9,672,902 | 3,268 | 33.79 (32.63–34.94) | 27.58 (26.44–28.71) | 1,547 | 15.99 (15.20–16.79) | 13.62 (12.82–14.42) |
| 2018 | 9,750,368 | 4,228 | 43.36 (42.06–44.67) | 34.76 (33.49–36.04) | 1,324 | 13.58 (12.85–14.31) | 11.51 (10.77–12.24) |
CI: confidence interval. *Number of cases per 100,000 population size. **Standardized according to the population in 2004 of Taiwan.
Table 4.
Prevalence and incidence of CAS: key studies and meta-analyses compared across populations.
Table 4.
Prevalence and incidence of CAS: key studies and meta-analyses compared across populations.
| Study (Year) | Type | Provocative route | Epicardial CAS arteries | Population | Prevalence/Incidence | Notes |
|---|---|---|---|---|---|---|
| Sueda et al. (2004) [7] | Prospective cohort | IC | ≥1 | Japanese | 29.0% prevalence |
|
| Odaka et al. (2017) [17] | Prospective cohort | IC | ≥1 | Japanese | 73.0% prevalence |
|
| Hung et al. (2010) [8] | Prospective cohort | IC | ≥1 | Taiwanese | 56.3% prevalence |
|
| Park et al. (2013) [6] | Prospective cohort | IV | ≥1 | Korean | 29.2% prevalence |
|
| Choi et al. (2019) [18] | Prospective cohort | IC | ≥1 | Korean | 57.6% prevalence |
|
| Bertrand et al. (1982) [9] | Prospective cohort | IV | ≥1 | France | 23.1% prevalence |
|
| Coma-Canella et al. (2006) [19] | Prospective cohort | IC | ≥1 | Spain | 52.5% prevalence |
|
| ACOVA study (2012) [20] | Prospective cohort | IC | ≥1 | Germany | 28.2% prevalence |
|
| Jansen et al. (2021) [21] | Prospective cohort | IC | ≥1 | Netherlands | 45.0% prevalence |
|
| Park et al. (2013) [6] | Prospective cohort | IV | ≥2 | Korean | 16.7% prevalence |
|
| Sueda et al. (2004) [7] | Prospective cohort | IC | ≥2 | Japanese | 24.3% prevalence | |
| Hung et al. (2010) [8] | Prospective cohort | IC | ≥2 | Taiwanese | 19.3% prevalence | Higher than Caucasians, lower than Japanese and Korean |
| Bertrand et al. (1982) [9] | Prospective cohort | IV | ≥2 | France | 7.5% prevalence | Significantly lower than East Asian populations |
| Beltrame et al. (1999) [22] | Review | IV/IC | ≥1 | Japanese/ Caucasians | Japanese: 69-80% prevalence/ Caucasians: 6-37% prevalence |
|
| Woudstra et al. (2023) [4] | Meta-analysis | IV/IC | ≥1 | ANOCA Patients | Asia: 52% prevalence/ Caucasians: 33% prevalence | |
| Kyushu (1988) [12] |
Prospective cohort |
IV | ≥1 | Japanese | 13% prevalence |
|
|
Duke (1984) [11] |
Prospective cohort | IV | ≥1 | USA | 1.7% prevalence |
|
|
Pisa (1978) [23,24] |
Prospective cohort | IV | ≥1 | Italy | 4-5% (-1974) 14% (1974-) prevalence |
|
| Montreal (1983) [25,26] | Prospective cohort | IV | ≥1 | Canada | 4% prevalence |
|
CAD: coronary artery disease; CAS: coronary artery spasm; IC: intracoronary provocation; IV: intravenous provocation.
Disclaimer/Publisher’s Note: The statements, opinions and data contained in all publications are solely those of the individual author(s) and contributor(s) and not of MDPI and/or the editor(s). MDPI and/or the editor(s) disclaim responsibility for any injury to people or property resulting from any ideas, methods, instructions or products referred to in the content. |
© 2026 by the authors. Licensee MDPI, Basel, Switzerland. This article is an open access article distributed under the terms and conditions of the Creative Commons Attribution (CC BY) license (http://creativecommons.org/licenses/by/4.0/).
Copyright: This open access article is published under a Creative Commons CC BY 4.0 license, which permit the free download, distribution, and reuse, provided that the author and preprint are cited in any reuse.


