
Submitted:
23 July 2026
Posted:
24 July 2026
You are already at the latest version
Abstract
Active surveillance of congenital anomalies is essential for identifying spatial patterns,
temporal trends, and risk factors. In Brazil, one of the primary data sources for congenital
anomaly surveillance is the Live Birth Information System (SINASC). However, the large
volume of data and the complexity of its structure pose significant challenges for healthcare
professionals without expertise in programming or data science. In this context, this study
presents three interactive applications for the analysis of SINASC data: one designed for
analyses at the municipal and state levels, and two dedicated to analyses at the healthcare
facility level, with the aim of supporting surveillance activities and identifying regional
disparities. The applications were developed in the R programming language, primarily
using the Shiny package, and provide interactive maps, tables, and graphical summaries,
together with spatial and temporal filtering capabilities. The analyses revealed substantial
regional disparities in the reporting of congenital anomalies, particularly congenital heart
diseases. Differences were also observed across variables such as race/ethnicity, mode
of delivery, maternal educational attainment, and prenatal care indicators, reflecting in-
equalities in access to and quality of healthcare services. These applications facilitate the
exploration and interpretation of SINASC data, thereby strengthening congenital anomaly
surveillance and supporting evidence-based public health decision-making in Brazil.
Keywords:
congenital anomalies
; health surveillance
; SINASC
; shiny
; interactive visual-ization
; R
; spatial analysis
; health inequalities
1. Introduction
Congenital anomalies (CAs) are structural or functional abnormalities that arise during embryonic and fetal development and may be associated with genetic, environmental, or multifactorial causes [1]. They represent a major global public health concern. According to the World Health Organization, approximately 6% of infants worldwide are born with a congenital anomaly, and an estimated 295,000 newborns die each year before completing four weeks of life, making these conditions one of the leading causes of infant mortality and childhood disability [2]. Given this scenario, surveillance of congenital anomalies is essential for public health, as it allows the prevalence of these conditions to be estimated, their evolution over time to be monitored, and potential risk factors to be identified. In addition, surveillance makes it possible to detect unusual patterns and to guide actions related to prevention, early diagnosis, and appropriate referral of cases, thereby contributing to the reduction of infant morbidity and mortality associated with congenital anomalies [3]. From 2015 onward, 34 congenital anomaly surveillance gained prominence both in Brazil and internationally, when an epidemic of microcephaly was recorded in the country. Microcephaly comprises a group of congenital anomalies affecting head circumference and was associated with 37 intrauterine infection by the Zika virus, a condition that became known as congenital Zika syndrome [4]. At that time, the Brazilian Ministry of Health developed actions aimed at surveillance and healthcare for affected children. In 2017, following the end of the 40 epidemic, the need to expand these strategies to other groups of congenital anomalies in the country was identified, thereby enabling the early detection of new health events and the implementation of actions capable of improving the quality of life of affected children [5].
To strengthen these systems, the World Health Organization, in partnership with other international institutions, developed tools for congenital anomaly surveillance, with particular emphasis on the manual Birth defects surveillance: a manual for programme managers and the quick reference guide on congenital anomalies for healthcare professionals [6]. These materials are intended to guide the implementation and improvement of surveillance systems, particularly in low- and middle-income countries, where such systems are still limited or nonexistent. They also promote data collection and the use of this information in public policy planning and in the design of actions for prevention, diagnosis, and healthcare [7]. In Brazil, one of the main tools for congenital anomaly surveillance is the Live Birth Information System (SINASC) [8]. This database contains information on births occurring throughout the national territory, with approximately 44 million births recorded between 2010 and 2025. SINASC includes information on the characteristics of the newborn, the mother, and the pregnancy, as well as a mandatory field for reporting congenital anomalies. Based on these data, it is possible to monitor births and their characteristics, contributing to knowledge about the country’s health situation and to the evaluation of policies and actions related to maternal and child health surveillance [9]. However, SINASC data are difficult to handle and analyze because of their large volume, with more than two million births recorded each year, and the complexity of their organization. This limits access for professionals without training in programming or knowledge of data science tools.
Thus, the objective of this study is to present three applications developed in R [10], an open-source programming language, using the Shiny package [11] and other specific packages, designed for the analysis of SINASC data with a focus on congenital anomalies. The first application provides information on the number of births, the number of cases, and the prevalence of congenital anomalies in Brazilian states and municipalities from 2010 to 2025, using graphs, tables, and maps, as well as temporal and geographic filters that allow the exploration of spatial and temporal patterns. The other two applications focus on the analysis of data by healthcare facility, one centered on Rio Grande do Sul and the other on the states of the Northern region of Brazil, enabling comparisons between distinct regional contexts.
Brazil is a country of continental dimensions, characterized by socioeconomic inequal- ities across its regions, which are reflected in differences in access to healthcare services and have an impact on maternal and child health conditions [12,13,14,15]. States in the Northern region generally present worse social indicators than those in the Southern region of the country. For example, in 2024, while Rio Grande do Sul had a Municipal Human Develop- ment Index (MHDI) of approximately 0.818, states in the Northern region, such as Acre and Amapá, had among the lowest MHDI values in the country, at 0.754 and 0.759, respectively, reflecting lower levels of income, education, and life expectancy [16]. These inequalities are also reflected in health indicators. In 2024, the infant mortality rate in the Southern region 83 was 10.4 deaths per 1,000 live births, whereas the Northern region had the highest infant 84 mortality rate in the country, with 15.7 deaths per 1,000 live births [17]. In addition, from 85 2010 to 2025, Rio Grande do Sul recorded approximately two million live births, whereas 86 the Northern region, comprising seven states, recorded approximately 4.8 million live 87 births, with Acre, Amapá, Rondônia, Roraima, and Tocantins each reporting fewer than 500,000 records. These data highlight not only inequalities in the distribution of births, 89 but also possible differences in neonatal profiles and healthcare conditions, reinforcing the relevance of comparative analyses between these distinct contexts.
In addition to presenting the number of births and the prevalence of congenital anomalies, the applications also include newborn, maternal, and gestational characteris- tics. Therefore, the proposed applications help facilitate access to, visualization of, and interpretation of SINASC data, supporting healthcare professionals and public managers in epidemiological surveillance and in the identification of regional inequalities related to congenital anomalies in Brazil.
2. Materials and Methods
2.1. Data from the Live Birth Information System (SINASC)
The data used in the applications were obtained from the Live Birth Information Sys- tem (SINASC). SINASC was implemented in Brazil in 1990 with the objective of collecting information on all births occurring throughout the national territory. The data are obtained from Live Birth Certificates (DNV), which are mandatory for all births. These certificates are completed by the healthcare professionals responsible for delivery and collected by the Municipal Health Departments, where they are processed and subsequently incorporated into SINASC [18].
The flow of data collection, processing, and consolidation, as well as their use in the development of the applications, is illustrated in Figure 1. Currently, SINASC includes 62 variables characterizing the newborn, the mother, and the pregnancy. For the applications, data from the period 2010 to 2025 were used. In the national-level application, the infor- mation was aggregated by municipality of maternal residence, and only information on the number of births and notifications of anomalies in each group was considered. For the healthcare facility applications, the data were aggregated by healthcare facility code and, in addition to the number of births and anomalies, gestational and individual character- istics were considered, including newborn weight, race/ethnicity, and sex; maternal age, race/ethnicity, and educational attainment; gestational age in weeks; mode of delivery; and the professional responsible for completing the DNV.
2.2. Applications
The processing of SINASC data and the development of the applications were carried out using the R programming language [10], an open-source language widely used for statistical analysis, through the RStudio interface [19]. In the R environment, several packages were used to support data manipulation, organization, and presentation. Data processing was performed mainly using the dplyr [20] and tidyr [21] packages, which allow observations to be filtered, variables of interest to be selected, and data to be organized. The Shiny package [11] was used to develop the applications, enabling the construction of web applications directly from R.
Applications developed with Shiny are structured into two main files: the frontend file (ui) and the backend file (server). The frontend is responsible for defining the user interface, including the layout, visual elements, and interaction mechanisms, such as buttons and filters. These interactions generate inputs that are sent to the server. The backend is responsible for processing these inputs and generating the application outputs, such as graphs, tables, and maps. In Shiny, this communication between the interface and the processing layer is handled through reactive programming, in which outputs are automatically updated whenever the user modifies a variable. Instead of executing the entire code again, Shiny identifies only the components that depend on the change made and updates only those components, making the application more efficient and responsive [22]. The interaction between the frontend and the backend occurs mainly through the input and output objects. The input object stores the information provided by the user through the interface, such as selected filter values or clicked buttons. The output object is used to display the results processed on the server, such as graphs and tables. Figure 2 illustrates the interaction between the server and the user interface.
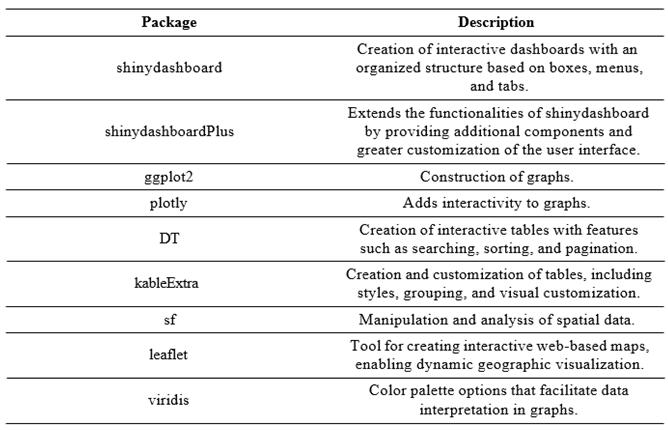
In addition to Shiny, the main packages used to build the applications were: shiny- dashboard [23] and shinydashboardPlus [24] for the application layout; ggplot2 [25], plotly [26], DT [27], and kableExtra [28] for data visualization; sf [29] and leaflet [30] for handling 144 spatial data and creating maps; and viridis [31] for color palettes. The functionality of each package is presented in Table 1. Finally, the applications were hosted on the shinyapps.io 146 platform, allowing web-based access.
3. Results
Although the three applications developed use SINASC data, they perform distinct analyses due to differences in the organization of the data. One application presents in- formation aggregated by municipality of maternal residence, allowing comparisons of prevalence across Brazilian states and municipalities. The other two use data by healthcare facility of birth, including both aggregated information and individual-level data on live 153 births, such as sex, maternal age, and birth weight. One of the healthcare facility applica- 154 tions presents hospitals in the state of Rio Grande do Sul, while the other presents hospitals in the Northern region of Brazil.
3.1. Brazil Application
The application containing data for all of Brazil includes four tabs for data analysis: “Map by Federative Units”, “Map by Municipalities”, “Time Series by Federative Units”, and “Time Series by Municipalities”. All tabs include filters that allow users to select one or more groups of congenital anomalies and the variable of interest, which may be the number of births, the number of births with anomalies, or the prevalence per 10,000 births (Figure 3).
The “Map by Federative Units” tab presents the spatial analysis by state, using maps, graphs, and interactive tables covering all Brazilian states. In this tab, in addition to selecting the anomaly group and the variable of interest, users can select one or more years for analysis. The map displays the distribution of anomalies across the Brazilian territory, allowing visual identification of differences between states (Figure 4). The graphs make it possible to observe variations in prevalence and in the number of cases across states, as well as to compare them with the Brazilian average (Figure 5). The interactive tables provide detailed data by state and anomaly group, allowing specific queries and the download of organized information.
The “Map by Municipalities” tab presents an analysis similar to that of the first tab, but considering municipalities. In this tab, users can also select the year of the data to be displayed, in addition to the standard filters available in the application. Additionally, 175 users can select one or more states to visualize their respective municipalities. This tab also presents a map for visualizing prevalence values and numbers of cases across municipalities 177 (Figure 6), as well as graphs for comparison and tables with a download option.
The final two tabs present time series by state, in the ‘Time Series by Federative Units” 179 tab, and by municipality, in the ‘Time Series by Municipality” tab. In these tabs, users can compare prevalence values and the number of births with anomalies across states and municipalities over the years (Figure 7).
3.2. Healthcare Facility Applications
The healthcare facility applications include three tabs: ‘Map and Analysis by Hospital”, ‘Comparison of Hospitals and States”, and “Comparison by Anomaly Groups”. The first tab presents a map with all healthcare facilities (Figure 8). When an icon is selected, specific information about the hospital is displayed, including the number of births and the prevalence of anomalies, as well as characteristics of the newborn (weight, sex, and race/ethnicity), the mother (age, race/ethnicity, and educational attainment), and the pregnancy and record information (gestational age in weeks, mode of delivery, and the professional responsible for completing the DNV) (Figure 9). This tab also includes two filters, which allow users to select the anomaly group and the years to be considered in the analyses. In addition, it presents a table with all healthcare facilities, containing the total number of births and the prevalence for each selected anomaly group.
The second tab presents comparisons between hospitals. It includes filters for selecting 195 the anomaly group, the year, and the variable to be displayed in the graphs, which may be the prevalence per 1,000 births, the total number of births, or the number of births with anomalies. The application for the North region also includes an additional filter for selecting the state. The results are displayed through graphs and tables, allowing the identification of differences in prevalence and births between healthcare facilities over the 200 years (Figure 10).
The last tab of the applications presents comparisons between hospitals for each 202 anomaly group. In this tab, users can select the years and the variable of interest, which may be the prevalence per 1,000 births or the number of births with anomalies. Graphs are displayed for each group of anomalies, allowing comparisons between hospitals (Figure 11).
4. Discussion
Using the applications, it was possible to identify differences in birth profiles and in the notification of congenital anomalies across Brazilian regions. During the study period, from 2010 to 2025, 44,506,128 births were recorded in SINASC throughout Brazil. The Southeast region accounted for the largest proportion of births (38.90%), followed by the Northeast (28.27%) and the South (13.56%). The Central-West and North regions had the lowest proportions of births, with 8.36% and 10.93%, respectively. Considering the nine groups of anomalies analyzed—congenital heart diseases, abdominal wall defects, limb reduction defects, neural tube defects, oral clefts, hypospadias, microcephaly, indeterminate sex, and Down syndrome—the prevalence in Brazil was 57.57 per 10,000 live births. The states with prevalence above the Brazilian average were Sergipe (83.14), São Paulo (81.51), Pernambuco (70.52), Rio Grande do Sul (65.25), Santa Catarina (62.98), and Ceará (59.97). The states with the lowest prevalence were Maranhão (31.44), Amazonas (35.24), Pará (35.25), Amapá (38.31), and Acre (38.62). These differences in prevalence have already been reported in the literature [15,32,33], indicating a pattern of higher prevalence in the South and Southeast regions compared with the North.
However, these values do not necessarily reflect the true prevalence of congenital anomalies and may be associated with underreporting, especially in regions with more limited access to healthcare services. The diagnosis of many congenital anomalies depends on the quality of prenatal care, the availability of specialized examinations, and the training of healthcare professionals for their recognition and proper reporting. Nevertheless, these services are less accessible in certain regions, which may result in cases not being identified either during pregnancy or at birth, consequently contributing to the underregistration of these conditions.
The distribution of physicians in Brazil is unequal across regions, with a greater concentration of professionals in the South and Southeast regions and lower availability in the North [34]. This pattern is also observed in the availability of specialists, such as pediatricians, gynecologists, and obstetricians, whose presence is greater in more developed regions and more limited in states of the North and Northeast. Inequalities in the quality of prenatal care have also been documented in the literature. The study by Tomasi et al. shows that prenatal care in Brazil presents important regional and social disparities, particularly in the North region, where greater limitations in access to and quality of services are observed [35]. In addition, Lessa et al. highlight the presence of racial inequalities in prenatal care, with worse indicators among Black women compared with White women [14].
These disparities partly reflect the geographic barriers characteristic of the North region, especially in the states of Pará and Amazonas, where riverside communities in inland areas are often located several hours, or even days, away from the nearest city. In these territories, rivers constitute the main and, in many cases, the only route of access to essential services, a situation that is aggravated for pregnant women who require prenatal follow-up or delivery care. Studies conducted in these regions show that travel time to healthcare services may reach 18 hours by river transport, and distances to referral maternity hospitals may reach up to 288 km [36,37]. In this context, inequalities in access to and quality of prenatal care, combined with the lower availability of specialists, compromise the diagnosis of congenital anomalies, contributing to the underestimation of their prevalence, especially in more vulnerable regions such as the North.
When the anomaly groups were analyzed separately, between 2010 and 2025, limb reduction defects presented the highest prevalence, with 25.69 cases per 10,000 births in Brazil, followed by congenital heart diseases, with a prevalence of 10.61. The groups with the lowest prevalence were microcephaly and indeterminate sex, with prevalences of 1.85 and 1.43 per 10,000 live births, respectively. Inequalities in prevalence across regions become particularly evident when considering anomalies that are more difficult to diagnose, such as congenital heart diseases. All states in the North and Northeast regions presented prevalence below the Brazilian average, especially Amazonas, Amapá, Pará, and Maranhão, which had prevalence values below 2.5 cases per 10,000 births. The diagnosis of congenital heart diseases presents additional challenges compared with other anomalies, since their identification depends, in most cases, on specific examinations, such as ultrasound and fetal echocardiography for prenatal diagnosis, or pulse oximetry screening followed by echocardiography for diagnosis in the neonatal period. These resources are not uniformly available across regions [38]. For anomalies that are easier to identify, such as limb reduction defects, regional differences are still present, although less pronounced. Although the lowest prevalence values remain concentrated in the North region, including Maranhão (15.75), Amazonas (16.35), Pará (16.97), and Acre (17.19), the difference in relation to the Brazilian average (25.69) is less expressive than that observed for congenital heart diseases.
In the analysis of healthcare facilities, it was possible to identify the hospitals with the highest notification rates and different gestational characteristics. Overall, healthcare facilities in Rio Grande do Sul presented higher prevalence values than those in the North region. The only anomaly groups for which facilities in the North showed higher prevalence than those in Rio Grande do Sul were abdominal wall defects, oral clefts, microcephaly, and indeterminate sex. In Rio Grande do Sul, the facilities with the highest reporting rates were Hospital Irmandade de Santa Casa de Misericórdia de Porto Alegre, Hospital Materno Infantil Presidente Vargas, and Hospital de Clínicas, all located in the metropolitan region of the state, which is characterized by greater availability of healthcare infrastructure. In the North region, the most prominent hospitals were Hospital de Base Porto Velho, located in Rondônia, Hospital de Clínicas Gaspar Viana, and Hospital Santa Casa de Misericórdia do Pará, both located in Pará.
Regarding maternal characteristics, healthcare facilities in the North region generally recorded lower maternal age and lower educational attainment compared with Rio Grande do Sul. In the North region, the mean maternal age was 25 years, with a first quartile of 20 years and a third quartile of 30 years. In Rio Grande do Sul, the mean maternal age was 27.8 years, with a first quartile of 22 years and a third quartile of 33 years. In both regions, most mothers had between 8 and 11 years of schooling, corresponding to 60.03% in the North region and 56.72% in Rio Grande do Sul. However, the regions differed in the distribution of the remaining educational attainment categories. In the North region, the second most frequent group was 4 to 7 years of schooling (20.70%), whereas in Rio Grande do Sul it was the group with 12 or more years of schooling (25.02%). Low educational attainment, defined as no schooling or up to 3 years of study, was more frequent in the North region (4.27%) than in Rio Grande do Sul (1.37
In addition, in the North region, the predominant race/skin color category was mixed- race, corresponding to 78.78% among mothers and 85.09% among newborns. In Rio Grande do Sul, the most frequent race/skin color category was White, corresponding to 73.04% among mothers and 79.33% among newborns. Regarding other newborn characteristics, a predominance of male newborns was observed in both regions, representing approximately 47.9% of births. Mean birth weight was similar between regions, with 3,157 grams in Rio Grande do Sul and 3,190 grams in the North region. The gestational characteristic that differed between these regions was mode of delivery: while cesarean delivery predomi- nated in Rio Grande do Sul (57.96%), vaginal delivery predominated in the North region (51.78%). Regarding completion of the Live Birth Certificate, in both regions most records were completed by nurses (44%) or classified as “others” (44.87% in Rio Grande do Sul and 48.05% in the North region).
5. Conclusions
The objective of this study was to present three applications developed to support the analysis of SINASC data for congenital anomaly surveillance. Through the use of the R programming language and its packages, it was possible to organize the data, select the variables of interest, and structure this information appropriately for the development of the applications. The Shiny package proved to be an efficient tool for developing interactive applications, allowing, through reactive programming, the automatic updating of results according to user interaction with the available filters. In addition, complementary packages such as ggplot2, plotly, leaflet, sf, and DT were essential for creating dynamic graphs, maps, and tables, making data exploration more intuitive and accessible.
The results obtained from the applications reinforce the existence of regional inequal- ities in the notification and prevalence of congenital anomalies in Brazil, particularly between the South and North regions. These findings are consistent with broader differ- ences in access to healthcare services, availability of specialists, and quality of prenatal care previously reported in the literature. Overall, the applications enable the analysis and interpretation of SINASC data in a more accessible way, especially for professionals 320 without training in programming or knowledge of data science tools.
By bringing together information on births, prevalence of congenital anomalies, and gestational, maternal, and newborn characteristics, these tools contribute to strengthening health surveillance in Brazil. It is also important to highlight that the applications provide distinct types of analyses, enabling both national-level surveillance, through comparisons between municipalities and states using the Brazil application, and individual-level data analysis, supporting hospital-level surveillance through the healthcare facility applications.
Furthermore, the applications support decision-making aimed at reducing health inequalities and improving public policies, by allowing the continuous monitoring of anomalies, the identification of temporal and spatial patterns, and comparisons across different regions, healthcare facilities, and groups of anomalies.
Author Contributions
Conceptualization, MHB and LS-F; methodology, JG and MHB; software, MHB; formal analysis, JG and MHB; resources, MHB; data curation, JG and MHB; writing—original draft preparation, JG, MHB and LS-F; writing—review and editing, JG, MHB and LS-F; visualization, JG and MHB; funding acquisition, LS-F. All authors have read and agreed to the published version of the manuscript.
Funding
This research was funded by Brazilian Ministry of Health TED 98/23 and the APC was funded by Brazilian National Research and Technology Council (CNPQ).
Institutional Review Board Statement
Ethical review and approval were waived for this study due to the use of publicly available, secondary, and anonymized data from the Brazilian Live Birth Information System (SINASC).
Informed Consent Statement
Patient consent was waived due to the use of publicly available, secondary, and anonymized data from the Brazilian Live Birth Information System (SINASC).
Data Availability Statement
The data and source code used to develop the applications presented in this study are publicly available in a GitHub repository, which contains the datasets, R scripts, and Shiny applications. The repository can be accessed at https://github.com/anomaliascongenitas/Apps-Article-Spatial-Modeling-of-Congenital-Anomalies-in-Brazil-Reveals-Regional-Inequalities. In addition, the interactive applications are available online as follows: the nationwide analysis application at https://projetoanomaliascongenitas.shinyapps.io/ac_br/, the application focused on health establishments in the Northern region at https://projetoanomaliascongenitas.shinyapps. io/Vigilancia_norte/, and the application for health establishments in Rio Grande do Sul at https://projetoanomaliascongenitas.shinyapps.io/Vigilancia_ativa_rs/.
Acknowledgments
The authors would like to express their gratitude to Bruno Alano for his contri- bution to the development of the application.
Conflicts of Interest
The authors declare no conflicts of interest.
Abbreviations
The following abbreviations are used in this manuscript:
SINASCLive Birth Information System
CA Congenital Anomalies
IDHM Municipal Human Development Index DNV Live Birth Certificate
References
- Czeizel, A.E. Birth defects are preventable. Int. J. Med. Sci. 2005, 2, 91. [Google Scholar] [CrossRef] [PubMed]
- World Health Organization. Congenital disorders. 2024. Available online: https://www.who.int/health-topics/congenital-anomalies (accessed on 11 May 2026).
- Melo, D.G.; Sanseverino, M.T.V.; Schmalfuss, T.d.O.; Larrandaburu, M. Why are birth defects surveillance programs important? Front. Public Health 2021, 9, 753342. [Google Scholar] [CrossRef] [PubMed]
- Schuler-Faccini, L. Possible association between Zika virus infection and microcephaly—Brazil, 2015. MMWR. Morb. Mortal. Wkly. Rep. 2016, 65. [Google Scholar] [CrossRef] [PubMed]
- Ministério da Saúde. Secretaria de Vigilância em Saúde. Departamento de Análise em Saúde e Vigilância de Doenças Não Transmissíveis. In Saúde Brasil 2020/2021: anomalias congênitas prioritárias para a vigilância ao nascimento, 1 ed.; Ministério da Saúde, 2021; p. 414. [Google Scholar]
- World Health Organization; Centers for Disease Control and Prevention. Birth defects surveillance: a manual for programme managers; World Health Organization, 2020. [Google Scholar]
- World Health Organization. New toolkit aims to improve global birth defects surveillance. 2020. Available online: https://www.who.int/news/item/02-12-2020-new-toolkit-aims-to-improve-global-birth-defects-surveillance (accessed on 11 May 2026).
- Ministério da Saúde. Sistema de Informação sobre Nascidos Vivos (SINASC): 1996 a 2025. Available online: https://dados.gov.br/dados/conjuntos-dados/sistema-de-informacao-sobre-nascidos-vivos-sinasc-1996-a-20201 (accessed on 19 May 2026).
- Ministério da Saúde. SINASC: Sistema de Informações sobre Nascidos Vivos. 2026. Available online: https://www.gov.br/saude/pt-br/composicao/svsa/sistemas-de-informacao/sinasc (accessed on 19 May 2026).
- Wickham, H.; Bryan, J.; Chang, W.; McGowan, L.; François, R.; Grolemund, G.; Lemon, J.; Kassambara, A.; Mundt, F.; Revelle, W. R: A language and environment for statistical computing. J. Open Source Softw. 2020, 8, 1–20. [Google Scholar]
- Chang, W.; Cheng, J.; Allaire, J.; Sievert, C.; Schloerke, B.; Aden-Buie, G.; Xie, Y.; Allen, J.; McPherson, J.; Dipert, A.; et al. Shiny Web Appl. Framew. R 2026. [CrossRef]
- Viacava, F.; Porto, S.M.; Carvalho, C.d.C.; Bellido, J.G. Desigualdades regionais e sociais em saúde segundo inquéritos domiciliares (Brasil, 1998-2013). Ciência Saúde Coletiva 2019, 24, 2745–2760. [Google Scholar] [CrossRef] [PubMed]
- Lourenço, A.E.; dos Reis, A.F.; da Silva Oliveira, M.B.; Linhares, P.V.R.; Almeida, F.V.O.; de Faria Uchôa, I. Desigualdades sociais e seus impactos na saúde. Rev. Ibero-Am. De Humanidades Ciências E Educ. 2026, 12, 1–19. [Google Scholar] [CrossRef]
- Lessa, M.S.d.A.; Nascimento, E.R.; Coelho, E.d.A.C.; Soares, I.d.J.; Rodrigues, Q.P.; Santos, C.A.d.S.T.; Nunes, I.M. Pré-natal da mulher brasileira: desigualdades raciais e suas implicações para o cuidado. Ciência Saúde Coletiva 2022, 27, 3881–3890. [Google Scholar] [CrossRef] [PubMed]
- Souza, S.d.; Carvalho, C.G.; Schuler-Faccini, L. Análise espacial de áreas de risco de anomalias congênitas no Brasil, 2012-2021. Epidemiol. E Serviços De Saúde 2025, 34, e20250240. [Google Scholar] [CrossRef]
- Secretaria de Comunicação Social da Presidência da República. Brasil alcança patamar de muito alto desenvolvimento humano pela primeira vez na história, revela Radar IDHM 2024. Available online: https://www.gov.br/secom/pt-br/acompanhe-a-secom/noticias/2026/05/brasil-alcanca-patamar-muito-alto-desenvolvimento-humano-pela-primeira-vez-na-historia-revela-radar-idhm-2024 (accessed on 14 June 2026).
- Fundação Abrinq pelos Direitos da Criança e do Adolescente. Mortalidade infantil no Brasil: o que dizem os dados? 2026. Available online: https://www.fadc.org.br/noticias/mortalidade-infantil-brasil (accessed on 14 June 2026).
- Ministério da Saúde. Portaria SVS nº 116; Secretaria de Vigilância em Saúde. 11 de fevereiro de 2009, 2009.
- Allaire, J.; et al. RStudio Integr. Dev. Environ. R 2012, 770, 165–171.
- Wickham, H.; François, R.; Henry, L.; Müller, K.; Vaughan, D. Dplyr A Gramm. Data Manip. 2026. [CrossRef]
- Wickham, H.; Vaughan, D.; Girlich, M.; Ushey, K. Tidyr Tidy Messy Data 2025. [CrossRef]
- Wickham, H. Mastering shiny; O’Reilly Media, Inc., 2021. [Google Scholar]
- Chang, W.; Borges, B. Shinydashboard Creat. Dashboards With ’Shiny’ 2025. [CrossRef]
- Granjon, D. shinydashboardPlus Add. More ’AdminLTE2’ Compon. To ’shinydashboard’ 2025. [CrossRef]
- Wickham, H.; Chang, W.; Henry, L.; Pedersen, T.L.; Takahashi, K.; Wilke, C.; Woo, K.; Yutani, H.; Dunnington, D.; van den Brand, T. ggplot2 Creat. Elegant Data Vis. Using Gramm. Graph. 2026. [CrossRef]
- Sievert, C.; Parmer, C.; Hocking, T.; Chamberlain, S.; Ram, K.; Corvellec, M.; Despouy, P. Plotly Creat. Interact. Web Graph. Via ’plotly.js’ 2026. [CrossRef]
- Xie, Y.; Cheng, J.; Tan, X.; Aden-Buie, G. DT A Wrapper JavaScript Libr. ’DataTables’ 2025. [CrossRef]
- Zhu, H. kableExtra Constr. Complex Table With ’kable’ Pipe Syntax 2024. [CrossRef]
- Pebesma, E. Sf Simple Featur. R 2026. [CrossRef]
- Cheng, J.; Schloerke, B.; Karambelkar, B.; Xie, Y.; Aden, G. leaflet: Create Interactive Web Maps with the JavaScript ’Leaflet’ Library 2025. [CrossRef]
- Garnier, S. Viridis Color.-Friendly Color Maps R 2024. [CrossRef]
- Ministério da Saúde. Boletim Epidemiológico: Análise da situação epidemiológica das anomalias congênitas no Brasil, 2010 a 2021. 2023. Available online: http://plataforma.saude.gov.br/anomalias-congenitas/boletim-epidemiologico-SVS-54-2023.pdf (accessed on 14 June 2026).
- Fernandes, Q.H.R.F.; Paixão, E.S.; Costa, M.d.C.N.; Teixeira, M.G.; Rios, J.D.C.; Santo, K.d.S.G.D.; Barreto, M.L.; Acosta, A.X. 417 Tendência temporal da prevalência e mortalidade infantil das anomalias congênitas no Brasil, de 2001 a 2018. Ciência Saúde Coletiva 2023, 28, 969–979. [Google Scholar] [CrossRef] [PubMed]
- Scheffer, M. Demografia Médica no Brasil 2025; Ministério da Saúde, 2025. [Google Scholar]
- Tomasi, E.; Fernandes, P.A.A.; Fischer, T.; Siqueira, F.C.V.; Silveira, D.S.d.; Thumé, E.; Duro, S.M.S.; Saes, M.d.O.; Nunes, B.P.; Fassa, A.G.; et al. Qualidade da atenção pré-natal na rede básica de saúde do Brasil: indicadores e desigualdades sociais. Cad. De Saúde Pública 2017, 33, e00195815. [Google Scholar] [CrossRef]
- Almeida, V.F.d.; Schweickardt, J.C.; Reis, A.E.S.; Vieira Moura, G.P.d.S. Caminhos da população ribeirinha no acesso à urgência e à emergência: desafios e potencialidades. Interface-Comun. Saúde Educ. 2022, 26, e210769. [Google Scholar] [CrossRef]
- Lopes, L.S.; Nogueira, L.M.V.; Andrade, E.G.R.d.; Rodrigues, I.L.A.; Guedes, J.A.; Caldas, R.J.C.; Silva, P.G.C. Childbirth dynamics in the riverside region of the Brazilian Amazon from the perspective of geospatialization. Rev. Bras. De Enferm. 2024, 77, e20240038. [Google Scholar] [CrossRef]
- Pinheiro, D.O.; Varisco, B.B.; Silva, M.B.d.; Duarte, R.S.; Deliberali, G.D.; Maia, C.R.; Jiménez, M.F.; Beitune, P.E. Accuracy of prenatal diagnosis of congenital cardiac malformations. Rev. Bras. De Ginecol. E Obstetrícia 2019, 41, 11–16. [Google Scholar]
Figure 1.
Flowchart illustrating the collection of Live Birth Certificates (DNV), their consolidation in the Live Birth Information System (SINASC), and the processing of these data for application development.
Figure 1.
Flowchart illustrating the collection of Live Birth Certificates (DNV), their consolidation in the Live Birth Information System (SINASC), and the processing of these data for application development.
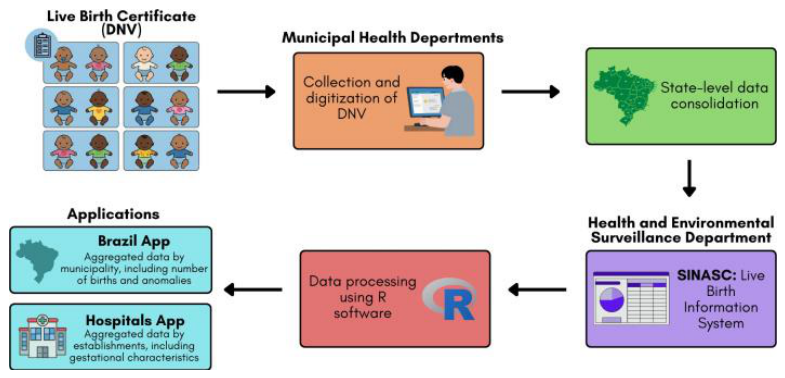
Figure 2.
Structure of a Shiny application, emphasizing the interaction between the frontend and backend through reactive programming.
Figure 2.
Structure of a Shiny application, emphasizing the interaction between the frontend and backend through reactive programming.
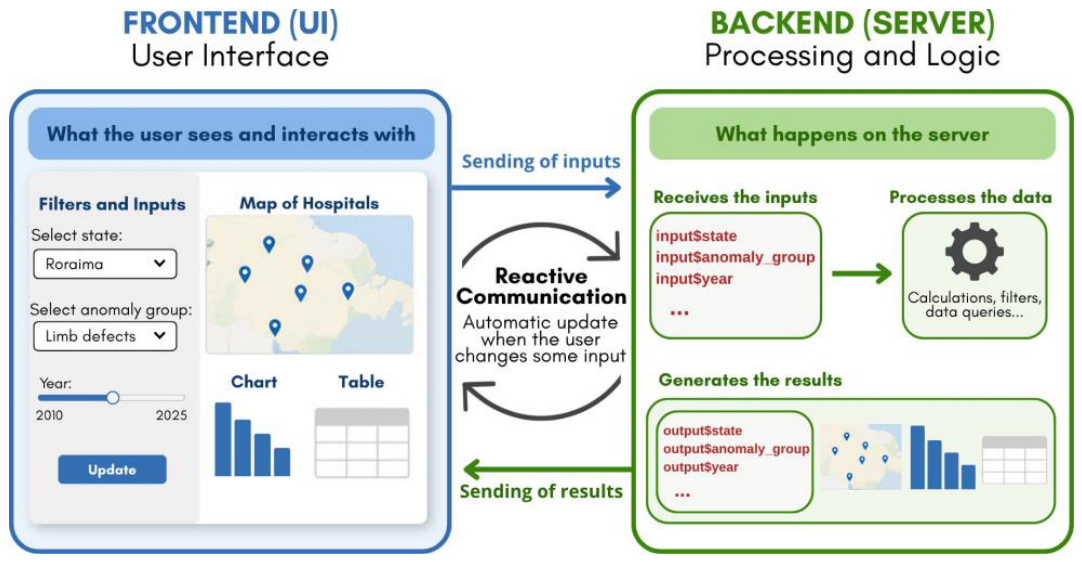
Figure 3.
Application filters available in all tabs. These filters allow the selection of congenital anomalies according to ICD-10 groups (Congenital Heart Diseases, Abdominal Wall Defects, Limb Reduction Defects, Neural Tube Defects, Oral Clefts, Microcephaly, Indeterminate Sex, Down Syn-drome, and Others) and the variable of interest for analysis (number of births, number of births with anomalies, and prevalence at birth per 10,000 births).
Figure 3.
Application filters available in all tabs. These filters allow the selection of congenital anomalies according to ICD-10 groups (Congenital Heart Diseases, Abdominal Wall Defects, Limb Reduction Defects, Neural Tube Defects, Oral Clefts, Microcephaly, Indeterminate Sex, Down Syn-drome, and Others) and the variable of interest for analysis (number of births, number of births with anomalies, and prevalence at birth per 10,000 births).
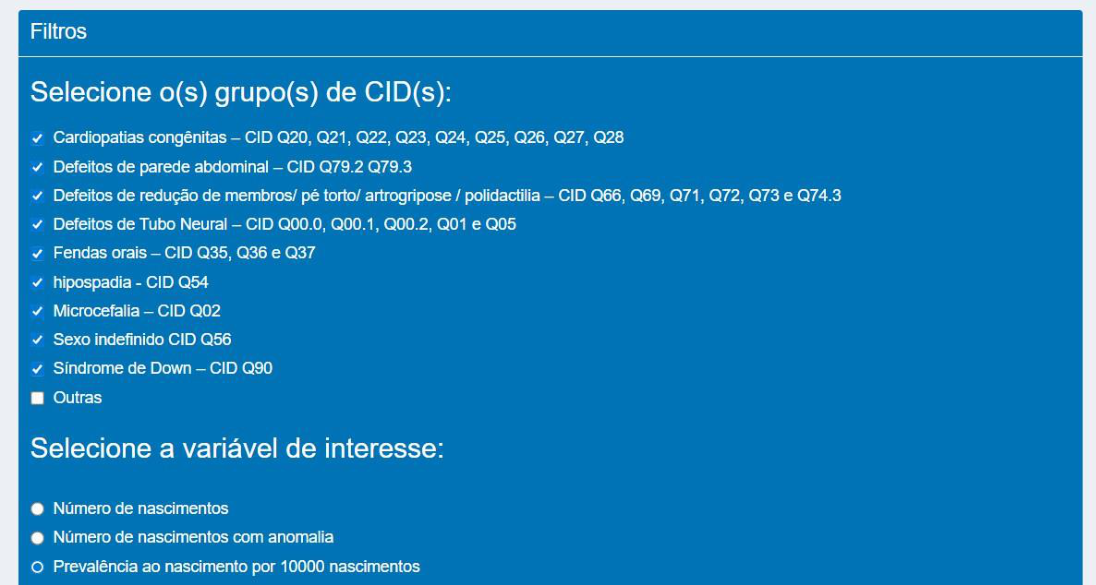
Figure 4.
Map from the “Map by Federative Units” tab considering the nine groups of anomalies and the year 2025. The blue box shows the total number of live births, the red box shows the total number of births with congenital anomalies, and the purple box shows the prevalence in Brazil per 10,000 births. The map colors represent the prevalence per 10,000 births in each state.
Figure 4.
Map from the “Map by Federative Units” tab considering the nine groups of anomalies and the year 2025. The blue box shows the total number of live births, the red box shows the total number of births with congenital anomalies, and the purple box shows the prevalence in Brazil per 10,000 births. The map colors represent the prevalence per 10,000 births in each state.
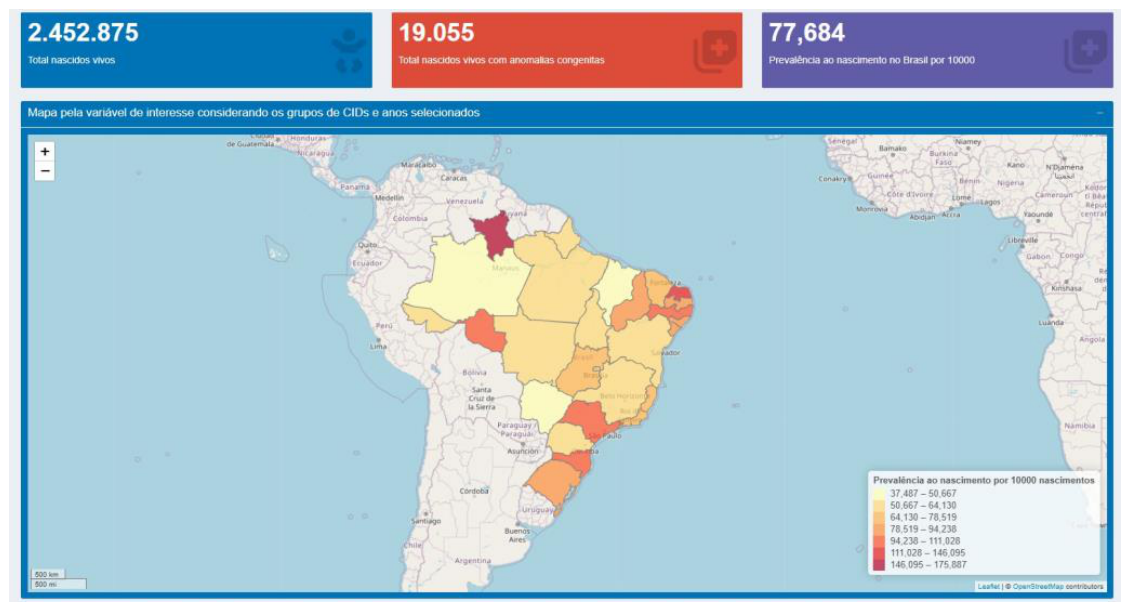
Figure 5.
Graphs from the “Map by Federative Units” tab considering the nine anomaly groups and the prevalence per 10,000 births variable. The first graph considers the year 2025 and compares the prevalence in each state (purple bars) with the Brazilian average (black vertical line). The other graphs compare prevalence values for Brazil as a whole over the years.
Figure 5.
Graphs from the “Map by Federative Units” tab considering the nine anomaly groups and the prevalence per 10,000 births variable. The first graph considers the year 2025 and compares the prevalence in each state (purple bars) with the Brazilian average (black vertical line). The other graphs compare prevalence values for Brazil as a whole over the years.
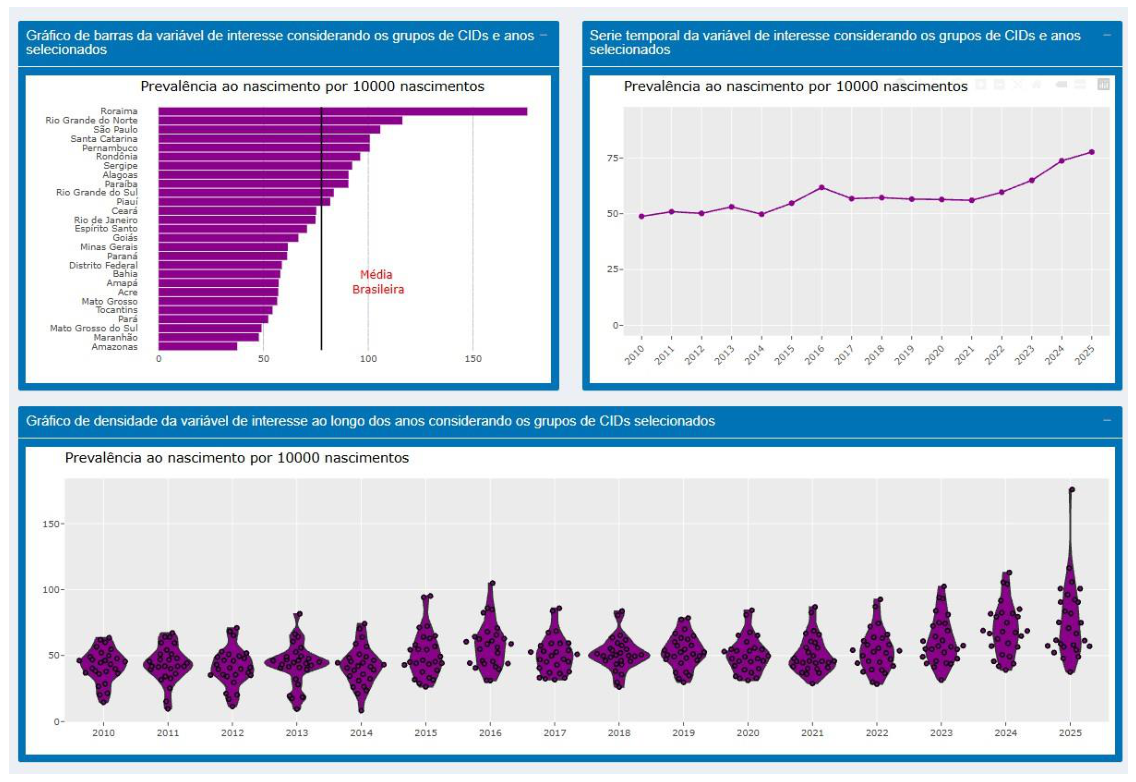
Figure 6.
Map from the “Map by Municipality” tab considering the municipalities of Rio Grande do Sul, the nine anomaly groups, the prevalence per 10,000 births variable, and the year 2025. The blue box shows the total number of live births in the state, the red box shows the total number of births with congenital anomalies, and the purple box shows the prevalence in the state per 10,000 births. The map colors represent the prevalence per 10,000 births in each municipality.
Figure 6.
Map from the “Map by Municipality” tab considering the municipalities of Rio Grande do Sul, the nine anomaly groups, the prevalence per 10,000 births variable, and the year 2025. The blue box shows the total number of live births in the state, the red box shows the total number of births with congenital anomalies, and the purple box shows the prevalence in the state per 10,000 births. The map colors represent the prevalence per 10,000 births in each municipality.
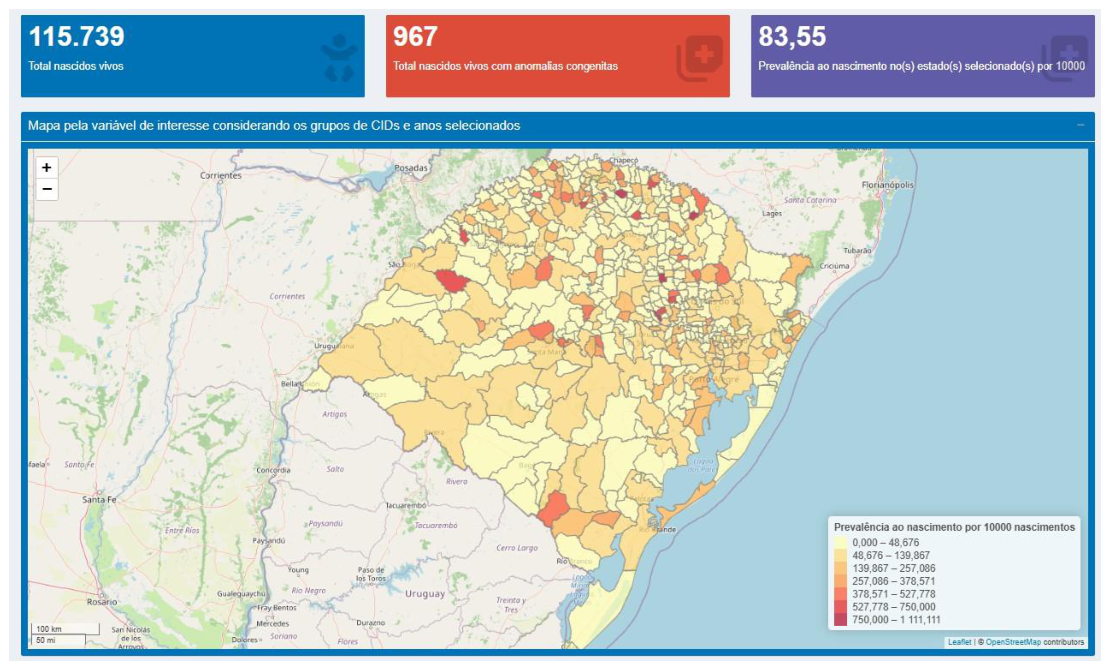
Figure 7.
Time series from the “Time Series by Federative Units” tab considering the states of Rio Grande do Sul, São Paulo, Bahia, Roraima, and Mato Grosso, the nine anomaly groups, and the prevalence per 10,000 births variable.
Figure 7.
Time series from the “Time Series by Federative Units” tab considering the states of Rio Grande do Sul, São Paulo, Bahia, Roraima, and Mato Grosso, the nine anomaly groups, and the prevalence per 10,000 births variable.
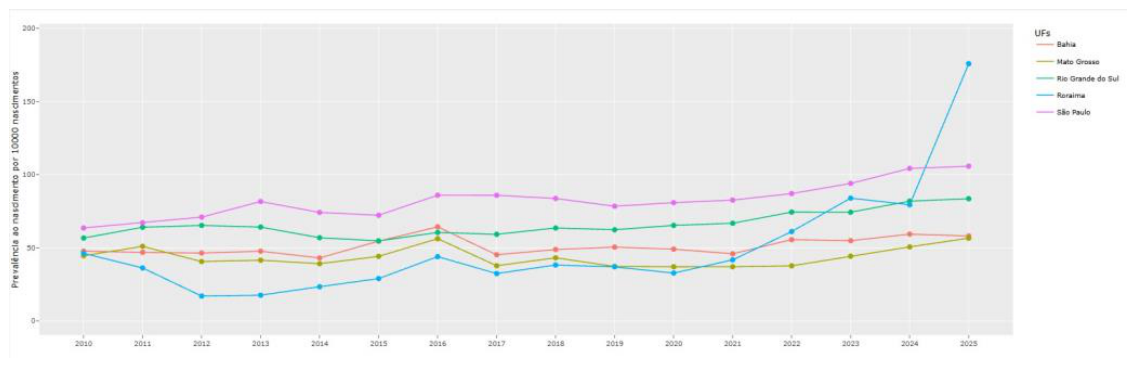
Figure 8.
Maps of healthcare facilities from the “Map and Analysis by Hospital” tab. Each blue icon represents a healthcare facility. The map on the left shows facilities in Rio Grande do Sul, and the map on the right shows facilities in the North region. For the Rio Grande do Sul map, only facilities participating in active surveillance of congenital anomalies were included; for the North region map, facilities with at least 10,000 births were included to improve map visualization.
Figure 8.
Maps of healthcare facilities from the “Map and Analysis by Hospital” tab. Each blue icon represents a healthcare facility. The map on the left shows facilities in Rio Grande do Sul, and the map on the right shows facilities in the North region. For the Rio Grande do Sul map, only facilities participating in active surveillance of congenital anomalies were included; for the North region map, facilities with at least 10,000 births were included to improve map visualization.
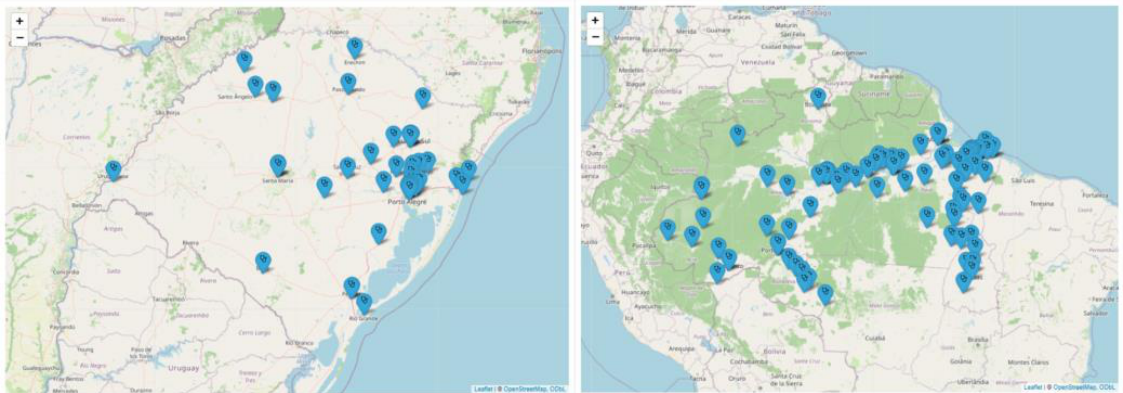
Figure 9.
Graphs of maternal characteristics presented in the “Map and Analysis by Hospital” tab. The selected facility was Hospital Materno Infantil Nossa Senhora de Nazareth, located in the state of Roraima, North region, considering the period from 2010 to 2025. The first graph shows the distribution of maternal age as a histogram and its mean. The second graph shows the distribution of maternal race/skin color: White, Black, Asian, mixed-race, Indigenous, and missing information. The third graph shows maternal educational attainment: none, 1 to 3 years, 4 to 7 years, 8 to 11 years, 12 years or more, ignored, and missing information.
Figure 9.
Graphs of maternal characteristics presented in the “Map and Analysis by Hospital” tab. The selected facility was Hospital Materno Infantil Nossa Senhora de Nazareth, located in the state of Roraima, North region, considering the period from 2010 to 2025. The first graph shows the distribution of maternal age as a histogram and its mean. The second graph shows the distribution of maternal race/skin color: White, Black, Asian, mixed-race, Indigenous, and missing information. The third graph shows maternal educational attainment: none, 1 to 3 years, 4 to 7 years, 8 to 11 years, 12 years or more, ignored, and missing information.
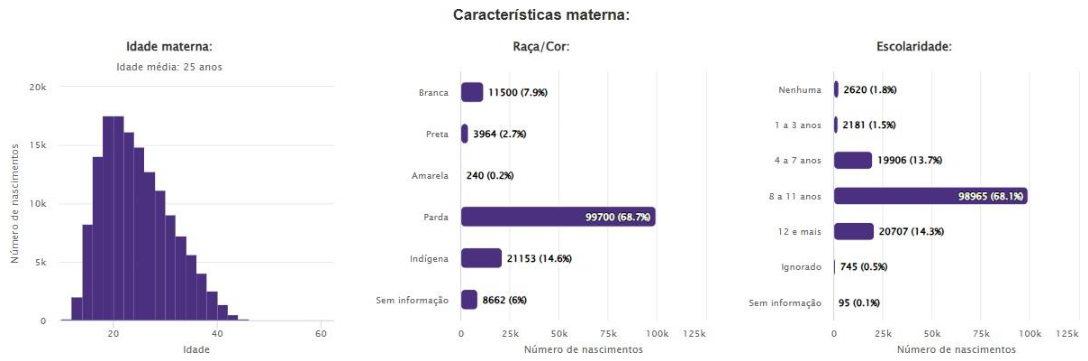
Figure 10.
Comparison graph of healthcare facilities from the “Comparison of Hospitals and States” tab of the Rio Grande do Sul application. The nine anomaly groups, the period from 2010 to 2025, and the prevalence per 1,000 births variable were considered.
Figure 10.
Comparison graph of healthcare facilities from the “Comparison of Hospitals and States” tab of the Rio Grande do Sul application. The nine anomaly groups, the period from 2010 to 2025, and the prevalence per 1,000 births variable were considered.
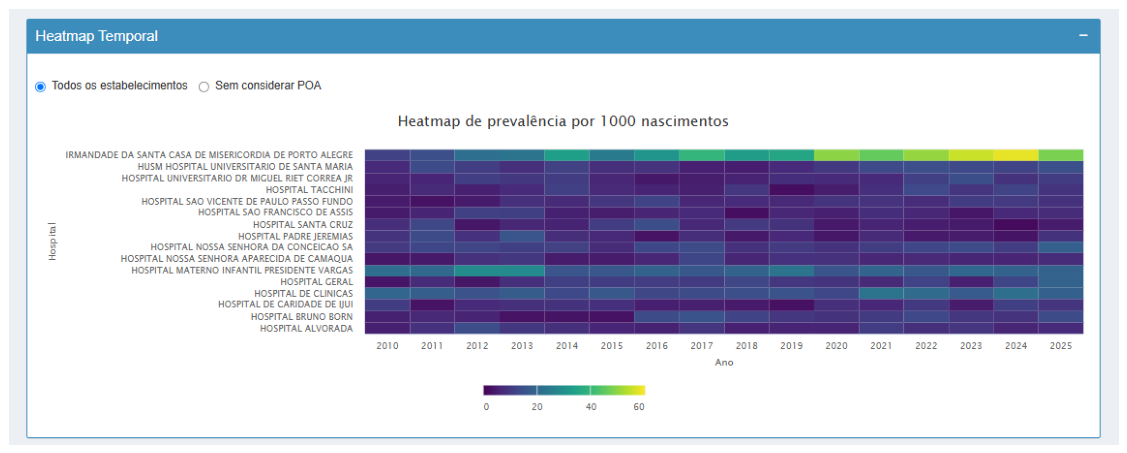
Figure 11.
Comparison graphs of healthcare facilities for congenital heart diseases from the “Compar-ison by Anomaly Groups” tab of the application for the North region. The period from 2010 to 2025 and the prevalence per 1,000 births variable were considered.
Figure 11.
Comparison graphs of healthcare facilities for congenital heart diseases from the “Compar-ison by Anomaly Groups” tab of the application for the North region. The period from 2010 to 2025 and the prevalence per 1,000 births variable were considered.
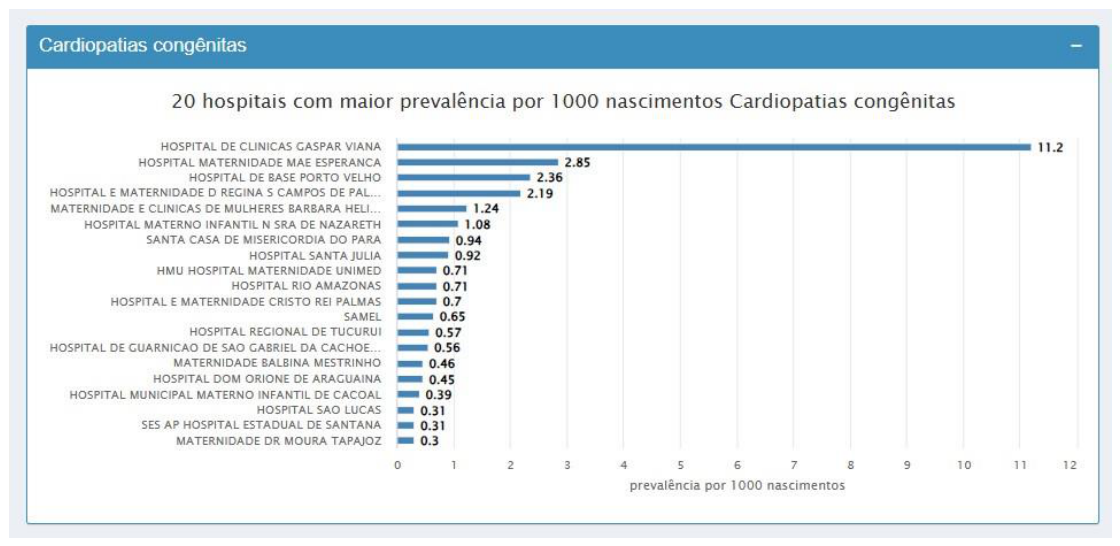

Table 1.
Packages used in the development of the applications and their functionalities.
 |
Disclaimer/Publisher’s Note: The statements, opinions and data contained in all publications are solely those of the individual author(s) and contributor(s) and not of MDPI and/or the editor(s). MDPI and/or the editor(s) disclaim responsibility for any injury to people or property resulting from any ideas, methods, instructions or products referred to in the content. |
© 2026 by the authors. Licensee MDPI, Basel, Switzerland. This article is an open access article distributed under the terms and conditions of the Creative Commons Attribution (CC BY) license (http://creativecommons.org/licenses/by/4.0/).
Copyright: This open access article is published under a Creative Commons CC BY 4.0 license, which permit the free download, distribution, and reuse, provided that the author and preprint are cited in any reuse.