
Submitted:
23 July 2026
Posted:
24 July 2026
You are already at the latest version
Abstract
Nonalcoholic fatty liver disease (NAFLD) is a globally prevalent metabolic disorder for which no pharmacotherapy has been approved. We applied an integrated computational framework to a ten-herb traditional Chinese medicine (TCM) transdermal formula administered via umbilical (Shenque) acupoint therapy, combining network pharmacology, multi-dataset machine learning, immune-infiltration analysis, molecular docking, and molecular dynamics (MD). Network pharmacology of 5276 drug-likeness-filtered compounds yielded 380 shared herb–disease targets. Across three training cohorts (n=346, ComBat-corrected) and an independent validation cohort (GSE167523, n=98), LASSO and random forest identified four hub genes—FOS, HSP90AB1, HIF1A, and MAPK8 (validation AUC 0.760, 0.701, 0.802, and 0.744)—all dysregulated in NAFLD. GSEA highlighted upregulated ECM–receptor interaction and suppressed ribosome, IL-17, and NF-κB signalling, whereas ssGSEA revealed elevated follicular helper and exhausted CD4+ T cells. Three-dimensional screening (transdermal ADMET, ligand similarity, AutoDock Vina) prioritised danshenspiroketallactone as the strongest HSP90AB1 binder (ΔG=−11.7 kcal/mol). Across six complexes, 3×100 ns MD with MM-PBSA confirmed favourable binding (ΔGbind −14.2 to −18.0 kcal/mol). These findings propose a multitarget inflammation–proteostasis–fibrosis mechanism and a “thermal activation–chemical fine-tuning” model for Shenque therapy, generating hypotheses that warrant experimental validation.
Keywords:
NAFLD
; network pharmacology
; machine learning
; immune infiltration
; molecular docking
; molecular dynamics
; traditional Chinese medicine
; transdermal delivery
1. Introduction
Non-alcoholic fatty liver disease (NAFLD) is the most prevalent chronic liver disorder worldwide, affecting approximately 25% of the global adult population—rising to over 75% in individuals with metabolic syndrome [1]. Its spectrum spans simple steatosis through non-alcoholic steatohepatitis (NASH) to cirrhosis and hepatocellular carcinoma; NASH patients face a 20% ten-year risk of cirrhosis progression [2]. Despite this enormous global burden, no pharmacological agent has received regulatory approval specifically targeting NAFLD/NASH, making the discovery of actionable therapeutic targets an urgent clinical priority.
Hepatic inflammation is both a driver and amplifier of NAFLD progression. Persistent inflammatory signalling remodels the liver immune microenvironment, promoting expansion of regulatory T cells, myeloid-derived suppressor cells, and M2-polarised macrophages while impairing immune surveillance [3]. Key inflammatory axes—notably NF-κB, IL-17, and TNF signalling—sustain the lipotoxicity–inflammation–fibrosis vicious cycle [4]. Simultaneously, dysregulation of cellular proteostasis and hypoxia-adaptive signalling (via HSP90 and HIF-1α, respectively) has been implicated in compounding hepatocyte injury [5]. Targeting these interconnected networks simultaneously represents a compelling rationale for multi-component natural product therapies.
Traditional Chinese medicine (TCM) offers a systems-level pharmacological approach that is well suited to the multi-target nature of NAFLD. The formula investigated here, comprising Bupleuri Radix (100 g), Foeniculi Fructus (50 g), Atractylodis Macrocephalae Rhizoma (100 g), Poria (100 g), Crataegi Fructus (50 g), Alismatis Rhizoma (50 g), Scutellariae Radix (100 g), Salviae Miltiorrhizae Radix (90 g), Glycyrrhizae Radix (50 g), and Borneolum (12 g) (total dose: 702 g per formula unit), is administered transdermally via umbilical acupoint (Shenque) therapy. Herbs are ground to ≤10 µm particles, mixed with white vinegar, and applied to the navel and hepatic surface at 40–45°C for 2 h daily. This external route avoids hepatic first-pass metabolism and exploits thermal stimulation as an adjuvant pharmacological signal. However, its molecular basis has not been systematically characterised.
Recent advances in network pharmacology, machine learning, and computational chemistry enable hypothesis-free, systems-level interrogation of such multi-herb formulas [6]. Network pharmacology maps herb–disease target intersections at a proteome-wide scale; machine learning provides unbiased feature selection from high-dimensional transcriptomic data; and molecular dynamics simulation with MM-PBSA free energy calculation offers physicochemically rigorous validation of predicted binding modes [7]. The integration of these approaches has been productively applied to the investigation of other TCM formulas for metabolic liver disease, including danshen-containing formulas with demonstrated activity in NAFLD [8]. And yet no study has applied this full pipeline—including multi-GEO machine learning validation, immune infiltration profiling, and three-dimensional compound screening—to a TCM transdermal formula for NAFLD.
In this study, we applied an integrated computational framework to the ten-herb Shenque transdermal formula, combining network pharmacology, multi-dataset machine learning (training n=346; independent validation n=98), GSEA pathway analysis, CIBERSORT and ssGSEA immune infiltration profiling, three-dimensional compound screening (transdermal ADMET + ligand similarity + molecular docking against two crystal structures), and 3×100 ns MD simulations with MM-PBSA free energy decomposition across six ligand–protein complexes. Our results suggest four hub diagnostic biomarkers (FOS, HSP90AB1, HIF1A, and MAPK8), delineate their potential roles in NAFLD immune dysregulation, and propose a mechanistic model of Shenque therapy that may inform the rational optimisation of TCM transdermal formulas for metabolic liver disease.
2. Results
2.1. Network Pharmacology: Active Constituents, Target Intersection, and Core Network
Given that this formula is administered transdermally, oral bioavailability (OB) was not applied as a screening criterion. Systematic retrieval from TCMSP, HERB, and Swiss Target Prediction identified 5,276 active compounds across ten herbs. After applying a drug-likeness (DL) ≥ 0.18 threshold, 157 core candidate compounds were retained for subsequent target mapping, yielding 811 putative drug targets. The intersection of these 811 drug targets with 3,914 NAFLD-associated disease targets yielded 380 shared candidate targets, which were visualised as a Venn diagram (Figure 1A).
The compound–target–disease network was then constructed, and key hub compounds were identified by degree centrality: quercetin (degree = 358; representative targets: FOS, HSP90AB1, HIF1A), apigenin (degree = 342; FOS, HSP90AB1), luteolin (degree = 222; FOS, HSP90AB1), kaempferol (degree = 198; FOS, HSP90AB1, MAPK8), and baicalein (degree = 125; HSP90AB1, HIF1A).
The 380 shared targets were subsequently subjected to protein–protein interaction (PPI) network construction, followed by topological analysis in Cytoscape using three complementary plugins. cytoNCA (network centrality analysis) applied three successive rounds of median-threshold filtering, sequentially targeting degree, betweenness centrality, and closeness centrality, retaining 46 genes. ClusterViz (molecular complex detection) retained 74 genes and cytoHubba (hub node ranking) retained 40 genes. The union of these three plugin outputs yielded 87 hub-gene candidates for downstream machine-learning analysis. The intersection across all three algorithms defines a stringent core of 23 genes. To supplement this core, a further four-round sequential cytoNCA median-threshold filtering, applied in the order of degree, betweenness centrality, closeness centrality, and eigenvector centrality, identified two additional genes (CASP3, TNF), which were incorporated via union supplementation, yielding 25 core network targets in total. Among these, AKT1, TP53, STAT3, IL6, TNF, FOS, HSP90AB1, HIF1A, and MAPK8 were identified as nodes with the highest centrality (Figure 1B–F). After further intersection with differentially expressed genes and machine learning–based feature selection, 246 hub-gene candidates were retained for network visualisation.
2.2. GO, KEGG, and GSEA Enrichment Analysis
GO enrichment analysis of the 25 core network targets (Figure 2A) identified biological processes, including responses to oxidative stress, regulation of apoptosis, inflammatory response, and lipid metabolic processes. KEGG analysis highlighted enrichment in the NAFLD pathway, hepatocellular carcinoma, PI3K–Akt, TNF signalling, and HIF-1 signalling (Figure 2B–C; adjusted P<0.05). Of note, cancer-related terms (prostate cancer, pancreatic cancer) ranked prominently in the overall KEGG analysis, reflecting the broad overlap between NAFLD and oncogenic signalling networks; the discussion is focused on pathways with established NAFLD relevance.
GSEA against the KEGG gene set collection yielded 32 significantly enriched pathways (|NES|>1.5, adjusted P<0.05; Figure 2D). Pathways upregulated in NAFLD included ECM–receptor interaction (NES=+2.21, adj. P=5.2×10⁻⁵), fructose and mannose metabolism (NES=+2.08, adj. P=0.002), steroid biosynthesis (NES=+2.04, adj. P=0.004), and fatty acid metabolism (NES=+1.70, adj. P=0.041). Pathways downregulated in NAFLD included the ribosome pathway (NES=−2.11, adj. P<0.0001), IL-17 signalling (NES=−2.09, adj. P=0.0003), rheumatoid arthritis (NES=−1.89, adj. P=0.006), oxidative phosphorylation (NES=−1.62, adj. P=0.027), and, at borderline significance, NF-κB signalling (NES=−1.58, adj. P=0.050). Although the rheumatoid arthritis gene set reflects shared inflammatory mediators (TNF, IL-6, and IL-1β) rather than joint-specific pathology, its suppression is consistent with the broader dysregulation of cytokine-driven inflammatory networks in NAFLD. FOS appeared in the leading-edge gene sets of both IL-17 and NF-κB signalling pathways (NES=−1.58, adj. P=0.050), consistent with AP-1 transcriptional dysregulation under chronic hepatic inflammation.
2.3. Machine Learning Identifies Four Core Hub Genes
After ComBat batch correction of the integrated training set (n=346), PCA confirmed convergence of the three cohorts (Figure 3A). LASSO and random forest were applied to 22 candidate genes, yielding eight genes that were consistently selected by both algorithms. After applying the additional criterion of AUC ≥0.70 in the independent validation cohort, four genes, FOS, HSP90AB1, HIF1A, and MAPK8, were retained as core hub genes (Table 1; Figure 3B–E).
FOS ranked the highest in random forest importance (MDA=27.5) and training AUC (0.768; 95% CI, 0.705–0.831), with a validation AUC of 0.760 (95% CI, 0.664–0.856) in GSE167523. HIF1A demonstrated superior external generalisation (validation AUC, 0.802; 95% CI, 0.714–0.890) compared to its moderate training AUC (0.678). MAPK8 showed moderate training AUC (0.558) and robust validation performance (0.744; 95% CI, 0.643–0.845), indicating its biological role in stellate cell activation and fibrogenesis. It is best characterised as a disease-progression-associated rather than purely diagnostic biomarker. HSP90AB1 demonstrated consistently strong performance in both cohorts (training AUC, 0.717; validation AUC, 0.701).
Differential expression analysis in the independent validation cohort (GSE167523) confirmed the significant dysregulation of all four hub genes. FOS was significantly upregulated in NAFLD (logFC=+0.79, adj. P=5.82×10⁻⁵), consistent with AP-1 transcriptional activation under hepatic inflammatory stress in early-stage steatohepatitis. HSP90AB1 was significantly upregulated (logFC=+0.20, adj. P=7.61×10⁻⁴), reflecting elevated chaperone demand under NAFLD-associated proteotoxic stress. HIF1A was significantly upregulated (logFC=+0.53, adj. P=1.92×10⁻⁵), consistent with hypoxia-pathway activation during the progression from simple steatosis to steatohepatitis. MAPK8 was significantly downregulated (logFC=−0.16, adj. P=5.82×10⁻⁵), which may reflect compensatory suppression of JNK1-mediated apoptotic signalling in advanced disease, consistent with its characterisation as a progression-associated rather than early-detection marker (Figure 3F).
Spearman correlation analysis among the four hub genes revealed a significant positive correlation between FOS and HIF1A (ρ=0.139, P=0.01; Figure S2), consistent with their convergent roles in the hepatic hypoxia–inflammation axis.
2.4. Immune Infiltration Analysis Reveals Hub Gene–Immune Microenvironment Crosstalk
CIBERSORT deconvolution of the 22 LM22 immune cell populations identified 102 significant hub gene–immune cell correlation pairs (|r|>0.15, P<0.05; Figure 4A–B). FOS displayed the most pervasive inverse association: strongest with hepatic stellate cells (r=−0.35, P<0.0001), plasma cells (r=−0.28, P<0.0001), and resting dendritic cells (r=−0.27, P<0.001), consistent with AP-1 transcriptional activation amplifying stromal and innate immune signalling, potentially driving plasma cell expansion and dendritic cell suppression via NF-κB–AP-1 crosstalk. HSP90AB1 correlated positively with follicular T helper (Tfh) cells (r=+0.34, P<0.0001) and negatively with monocytes (r=−0.24, P<0.001), potentially reflecting chaperone-dependent antigen-presentation dynamics. HIF1A showed a strong inverse correlation with M0 macrophages (r=−0.71, P<0.0001) and activated dendritic cells (r=−0.58, P<0.0001), consistent with previously reported HIF1A-associated macrophage reprogramming under hepatic hypoxia. MAPK8 correlated most strongly with hepatic stellate cells (r=+0.59, P<0.0001), directly implicating JNK1 in stellate cell activation and fibrogenesis and supporting its designation as a progression-associated rather than purely diagnostic biomarker.
ssGSEA analysis of the 216-sample training cohort (GSE135251; Figure 4C–D) identified three immune cell populations that were significantly elevated in NAFLD after Benjamini–Hochberg correction: Tfh cells (adj. P=0.0006), exhausted CD4+ T cells (adj. P=0.0053), and resting dendritic cells (adj. P=0.032). Tfh cell expansion is consistent with their role in driving B cell-mediated hepatic immune responses and germinal centre reactions in chronic liver inflammation [9]. Exhausted CD4+ T cells reflect the chronic antigen stimulation and immunosuppressive milieu of advanced NAFLD, a pattern increasingly documented in NASH-related immune dysfunction.
2.5. Three-Dimensional Screening Identifies 17 Transdermal-Eligible Candidates
Of 5276 DL-filtered compounds, 17 passed all eight transdermal ADMET criteria (MW 222–354 Da; consensus log P 2.3–4.0; log Kp −5.1 to −6.2 cm/s; TPSA 40–88 Ų). Cross-referencing with ligand-similarity criteria produced 12 Tier-Triple, three Tier-Double, and two Tier-Single compounds (Figure 5A–B). A critical methodological observation emerged: capsaicin—achieving the highest composite similarity score (HSP90-Dice=0.35; MAPK8-Dice=0.37; Tier-Triple)—produced the weakest docking results among all 17 compounds (MAPK8: −7.4 kcal/mol; HSP90AB1: −7.3 kcal/mol). Conversely, danshenspiroketallactone (HSP90-Dice=0.09; below the Dice≥0.15 threshold; Tier-Double based on MAPK8 similarity) achieved the highest binding affinity across the entire dataset (HSP90AB1: −11.7 kcal/mol) (Figure 5C–D). This inverse relationship illustrates a recognised limitation of fingerprint-based virtual screening, whereby structurally dissimilar but high-affinity scaffolds may be missed, a phenomenon we term “scaffold escape”. This observation validates the necessity of explicit structure-based docking as a discriminating step, beyond ligand similarity pre-filtering.
2.6. Molecular Docking Reveals a Terpenoid-Dominant Multi-Target Binding Model
All 17 compounds achieved binding affinities of ≤−7.3 kcal/mol against at least one target (Figure 6A–B). Six complexes representing four structural scaffolds, terpenoid lactone, phenanthrene terpenoid, flavonoid, and alkaloid, were selected for PLIP characterisation and structural visualisation (Figure 6C–D; Table 2).
(i) Danshenspiroketallactone–HSP90AB1 (ΔG=−11.7 kcal/mol; Tier-Double). No direct hydrogen bonds were detected; binding was driven by four π–π stacking interactions (Phe133 and Trp157) and four hydrophobic contacts within the N-terminal ATP pocket. Seven crystallographic water molecules formed a bridging hydrogen bond network, reinforcing the binding interface.
(ii) Epidanshenspiroketallactone–HSP90AB1 (ΔG=−11.5 kcal/mol; Tier-Double). One hydrogen bond (Phe133 [2.99 Å]), four π–π stacking contacts, and five hydrophobic interactions; near-identical binding mode to its diastereomer, confirming scaffold-dependent affinity.
(iii) Glabrene–MAPK8 (ΔG=−9.8 kcal/mol; flavonoid; Tier-Single). Four hydrogen bonds (Ala36, Gln37, Lys55, and Met111) and nine hydrophobic contacts were observed. With MAPK8-Dice=0.13, glabrene represents another example of scaffold-escape binding, achieving the highest MAPK8 affinity.
(iv) Danshenol B–MAPK8 (ΔG=−9.7 kcal/mol; phenanthrene terpenoid; Tier-Double). One hydrogen bond (Asn114 [2.05 Å]) and seven hydrophobic contacts.
(v) Danshenspiroketallactone–MAPK8 (ΔG=−9.7 kcal/mol; Tier-Double). One hydrogen bond (Asn114 [2.26 Å]) and seven hydrophobic contacts confirmed dual-target engagement by a single lead compound.
(vi) Jatrorrizine–MAPK8 (ΔG=−9.3 kcal/mol; alkaloid; Tier-Triple). Three hydrogen bonds (Lys55 [2.29 Å], Asp112 [2.59 Å], Arg69 [3.65 Å, weak]) and four hydrophobic contacts—the strongest Tier-Triple compound, validating the similarity-based screening dimension.
Self-docking validation against co-crystallised ligands yielded RMSD values of 1.098 Å (3ELJ) and 0.733 Å (6N8Y), confirming the reliability of the docking protocol.
2.7. Molecular Dynamics Simulations Confirm Binding Stability
All six complexes maintained structural integrity across the 3×100 ns MD trajectories (Figure 7). Protein backbone RMSD plateaued within 10–20 ns for HSP90AB1 complexes (danshenspiroketallactone: 0.8–1.8 Å; epidanshenspiroketallactone: 1.0–2.2 Å) and within 20–30 ns for MAPK8 complexes (1.5–2.5 Å), the latter consistent with the inherent activation-loop flexibility of JNK1 (Figure 7A). All systems remained below the 3.0 Å stability threshold throughout the simulations.
The ligand RMSD profiles revealed two distinct behaviours (Figure 7B). Glabrene–MAPK8 exhibited the greatest positional stability (1.0–2.0 Å across all three replicates), consistent with its four direct hydrogen bonds anchoring the scaffold. The danshen terpenoid complexes showed higher ligand fluctuations (3–7 Å), reflecting conformational sampling within the binding pocket rather than ligand egress; protein backbone RMSD remained stable throughout, and free energy landscape (FEL) analysis confirmed retention within a single dominant energy basin (Figure S1).
RMSF analysis demonstrated that binding-site residues fluctuated within 0.5–1.5 Å across all six complexes (Figure 7C), with elevated flexibility localised to the distal loop regions uninvolved in ligand coordination. Radius of gyration remained stable throughout all trajectories (HSP90AB1 complexes: 17.1–17.4 Å; MAPK8 complexes: 21.8–23.0 Å), confirming absence of protein unfolding (Figure 7D). Free energy landscape analysis identified a single dominant energy minima for all six complexes, confirming thermodynamic convergence across independent replicates (Figure S1).
2.8. MM-PBSA Binding Free Energies Validate All Six Complexes
MM-PBSA calculations from approximately 4,000 snapshots over the final 40 ns of each trajectory confirmed thermodynamically favourable binding for all six complexes, substantially exceeding the −8 kcal/mol empirical reference cutoff (Table 3; Figure 8). Glabrene–MAPK8 yielded the strongest mean binding free energy (ΔGbind = −18.0 ± 2.2 kcal/mol), consistent with its four direct hydrogen bonds and nine hydrophobic contacts anchoring the flavonoid scaffold within the MAPK8 ATP-binding cleft. Danshenspiroketallactone–HSP90AB1 achieved ΔGbind = −16.7 ± 0.2 kcal/mol with the smallest inter-replicate variability, confirming highly reproducible binding geometry mediated by the crystallographic water-bridge network and four π–π stacking interactions. The remaining four complexes clustered between −14.2 and −16.5 kcal/mol (Table 3).
Energy decomposition revealed a consistent thermodynamic signature for all six complexes (Figure 8B). Van der Waals interactions constituted the dominant favourable contribution in every case (ΔVDW: −37.1 to −41.2 kcal/mol), consistent with the deep hydrophobic burial of terpenoid and flavonoid scaffolds within the ATP-binding pockets. Non-polar desolvation (ΔENPOLAR: −21.3 to −28.2 kcal/mol) provided a secondary favourable term. Electrostatic contributions were modest across all complexes (ΔEEL: −8.5 to −0.5 kcal/mol). The polar solvation penalty (ΔEPB: +4.2 to +9.0 kcal/mol) represented the principal unfavourable component, partially counterbalanced by van der Waals and non-polar contributions.
3. Discussion
This study presents the first fully integrated computational investigation of a TCM transdermal formula for NAFLD, combining network pharmacology with multi-dataset machine learning (training n=346; independent validation n=98), GSEA pathway enrichment, dual-algorithm immune infiltration profiling, three-dimensional compound screening, and 3×100 ns MD simulations with MM-PBSA free energy decomposition across six complexes. Our findings converge on a three-axis mechanistic framework—inflammatory network dysregulation (FOS), proteostasis remodelling (HSP90AB1), and hypoxia–fibrosis coupling (HIF1A/MAPK8)—supported by danshen-derived terpenoid and liquorice-derived flavonoid compounds as potential ligands.
FOS, the most diagnostically powerful hub gene (training AUC 0.768; validation AUC 0.760), was significantly upregulated in NAFLD in the independent validation cohort (logFC=+0.79, adj. P=5.82×10⁻⁵). Acute FOS/AP-1 activation in early steatohepatitis may amplify pro-inflammatory transcriptional programs governing cytokine production and lipid catabolism, which is consistent with the well-characterised role of JNK-mediated AP-1 signalling in NAFLD-associated hepatocyte stress [10]. GSEA analyses positioned FOS in the leading-edge gene sets of both NF-κB (NES=−1.58, adj. P=0.050) and IL-17 (NES=−2.09, adj. P=0.0003) signalling pathways, and CIBERSORT data revealed that FOS expression was inversely correlated with plasma cell infiltration (r=−0.28), suggesting that AP-1-driven inflammatory activation may reshape the hepatic immune microenvironment and contribute to the permissive immunosuppressive milieu associated with NAFLD progression.
HSP90AB1, upregulated in NAFLD (logFC=+0.20, adj. P=7.61×10⁻⁴), may reflect the elevated chaperone demand of NAFLD-associated proteotoxic stress. As the cytosolic β-isoform of HSP90, HSP90AB1 has been reported to stabilise client proteins including HIF1A, AKT1, and steroid receptors [11]. Danshenspiroketallactone—the study’s lead compound (ΔG=−11.7 kcal/mol; MM-PBSA −16.7±0.2 kcal/mol)—binds the N-terminal ATP pocket through four π–π stacking contacts with Phe133 and Trp157, mediated by a seven-molecule crystallographic water-bridge network. The structural dissimilarity of the compound to the co-crystallised KFY ligand (Dice=0.09) combined with its superior affinity exemplifies the scaffold-escape phenomenon described in Section 2.5, highlighting the methodological importance of explicit structure-based docking in natural product drug discovery.
The proposed “thermal activation–chemical fine-tuning” model of Shenque therapy offers a potential mechanistic framework for umbilical moxibustion. Thermal stimulation at 40–45°C may activate HSF1 (heat shock factor 1), driving transcriptional upregulation of HSP90AB1 as an adaptive proteostatic response to thermal stress [12]. Simultaneously, transdermally absorbed terpenoid compounds, particularly danshenspiroketallactone and its epimer, may modulate ATPase activity at the same N-terminal pocket, potentially attenuating the aberrant stabilisation of pro-inflammatory client proteins. This dual action—thermal induction of chaperone availability combined with chemical modulation of its activity—suggests a possible molecular rationale for the synergistic effects of heat application and topical drug delivery in Shenque therapy, although experimental confirmation is required.
MAPK8 (JNK1) is best characterised as a progression-associated rather than diagnostic biomarker (training AUC 0.558; validation AUC 0.744), given its significant downregulation in the independent validation cohort (logFC=−0.16, adj. P=5.82×10⁻⁵), which may reflect compensatory suppression of JNK1-mediated apoptotic signalling in advanced disease. JNK1 is a well-characterised mediator of lipoapoptosis and stellate cell-driven fibrogenesis in NASH [13]. CIBERSORT data connected MAPK8 expression to hepatic stellate cell infiltration (r=+0.59, P=2.2×10⁻²¹), directly implicating JNK1 in stellate cell activation and fibrogenesis. Glabrene (ΔG=−9.8 kcal/mol; MM-PBSA −18.0±2.2 kcal/mol)—a licorice-derived flavonoid—was the most potent MAPK8 binder, forming four hydrogen bonds within the ATP cleft. The substantially stronger MM-PBSA energy relative to its docking score reflects additional solvation and entropic contributions captured in explicit-solvent simulation, positioning glabrene as a candidate for in vitro JNK1 inhibition studies.
Immune infiltration analysis provides a third mechanistic dimension. ssGSEA identified elevated Tfh cells (adj. P=0.0006) and exhausted CD4+ T cells (adj. P=0.0053) in the NAFLD liver. Tfh cell expansion is consistent with emerging evidence of B-cell-mediated adaptive immune dysregulation in NAFLD [9]. The detection of exhausted CD4+ T cells aligns with prior reports of progressive CD4+ T lymphocyte loss and impaired anti-tumour surveillance in NAFLD-associated hepatocarcinogenesis [14]. The formula’s flavonoid constituents (quercetin, kaempferol, luteolin) are established modulators of AP-1 and NF-κB activity [15], while HSP90AB1 inhibition may influence chaperone-dependent immune cell signalling pathways. Collectively, the formula may be associated with the modulation of adaptive immune exhaustion and Tfh-driven B cell activation, beyond potential direct anti-steatotic and anti-fibrotic effects, although these remain speculative without experimental confirmation.
From a methodological perspective, the scaffold-escape observations (danshenspiroketallactone against HSP90AB1; glabrene against MAPK8) highlight a recognised limitation of fingerprint-based virtual screening in natural product discovery: shape- or similarity-based pre-filters may systematically exclude structurally novel scaffolds with high binding affinity. The explicit docking step in our three-dimensional workflow serves as a necessary correction for this bias, recovering high-affinity candidates that ligand-similarity screening alone would have missed. This methodological insight supports the integration of explicit docking as an indispensable step, rather than merely a confirmatory step, in computational natural product workflows.
This study had several limitations. First, all evidence is computational; in vitro target engagement assays (including ATPase inhibition assays for HSP90AB1 and kinase inhibition assays for MAPK8) and in vivo efficacy studies are required before clinical translation. Second, transdermal pharmacokinetics of terpenoid and flavonoid compounds may differ substantially from in silico ADMET estimates; log Kp values provide a first approximation, but skin absorption depends on vehicle composition, temperature, and skin condition. Third, the LM22 CIBERSORT matrix does not include hepatic-specific cell types; our inference of hepatic stellate cell and Kupffer cell associations relied on ssGSEA with published gene-set markers, which may be less precise than direct deconvolution. Fourth, the training datasets comprised cohorts of variable compositions and NAFLD diagnostic criteria, which may introduce residual heterogeneity despite ComBat correction.
4. Materials and Methods
4.1. Retrieval of Active Compounds and Drug Targets
The chemical constituents of the ten herbs were retrieved from the Traditional Chinese Medicine Systems Pharmacology database (TCMSP; https://tcmsp-e.com) [16], with drug-likeness (DL) ≥0.18 as the screening threshold. Oral bioavailability (OB) was excluded from the criteria given the transdermal administration route of the formula. For herbs or ingredients not documented in the TCMSP, the HERB database (http://herb.ac.cn/) was consulted as a supplementary source. To identify the targets of the supplementary compounds, their chemical structures (SMILES strings) were retrieved from PubChem (https://pubchem.ncbi.nlm.nih.gov) and submitted to SwissTargetPrediction (http://www.swisstargetprediction.ch/), and the results were filtered to Homo sapiens. All identified compound names were standardised and mapped to HGNC gene symbols using UniProt annotation. In total, 5,276 active compounds were identified across ten herbs from all databases. After applying the DL ≥0.18 threshold, 157 core candidate compounds were retained for subsequent target mapping and three-dimensional screening.
4.2. Disease Target Collection and Herb–Disease Target Intersection
To systematically identify targets associated with NAFLD, disease-related targets were retrieved from seven comprehensive databases: GeneCards (https://www.genecards.org), OMIM (https://www.omim.org), CTD (https://ctdbase.org), DisGeNET (https://www.disgenet.org), DrugBank (https://go.drugbank.com), GWAS Catalog (https://www.ebi.ac.uk/gwas), and PharmGKB (https://www.pharmgkb.org), using “non-alcoholic fatty liver disease” as the search term. Following data retrieval, the Venn package in R was used for data integration, deduplication, and gene symbol standardisation. A total of 3,914 unique disease targets were identified by taking the union of results across all seven databases. Intersection of the 157 DL-filtered drug targets with these disease targets yielded 380 shared candidate targets for the subsequent network pharmacological analysis.
4.3. Protein–Protein Interaction Network Construction
The 380 intersecting targets were submitted to the STRING database (v12.0; https://string-db.org; minimum interaction confidence, 0.900; Homo sapiens species). The resulting PPI network was imported into Cytoscape (v3.10.0) for topological analysis using the cytoNCA, ClusterViz, and cytoHubba plugins. Nodes in the top quartile of degree and betweenness centralities across all three algorithms were retained. The iterative median-threshold filtering of the union set yielded 25 core network targets and 87 hub-gene candidates for machine learning. After downstream machine learning selection and differential expression filtering, 246 final hub-gene candidates were used for network visualisation (Figure 1A).
4.4. GEO Dataset Acquisition and Batch Correction
Four GEO transcriptomic datasets were retrieved from NCBI GEO. Three datasets constituted the training set: GSE135251 (RNA-seq; 79 controls, 137 NAFLD; total n=216), GSE126848 (RNA-seq; 15 controls, 42 NAFLD; n=57), and GSE48452 (Affymetrix microarray; 24 controls, 49 NAFLD/fibrosis; n=73), combined with 346 samples. RNA-seq libraries were normalised by TMM-voom and microarray data were normalised by RMA. Cross-platform batch effects were removed using ComBat (sva package, R/Bioconductor) [17]. PCA confirmed the effective batch convergence. GSE167523 (RNA-seq; n=98) was used as an independent external validation cohort. Informed consent was obtained from all source studies, which used publicly available de-identified data and required no additional ethical approval.
4.5. Machine Learning Hub Gene Identification
Twenty-two candidate genes (intersection of the 87 hub gene candidates with genes differentially expressed across all three training datasets, adj. P<0.05 by limma) were subjected to two-layer machine learning. LASSO logistic regression (glmnet package; 10-fold cross-validation; λ at 1-SE rule) identified a sparse gene signature [18]. Random forest classification (randomForest package; ntree=500) was trained on the same set; genes with a mean decrease in accuracy (MDA) above the ensemble median threshold were flagged [19]. Genes selected by both algorithms were further filtered by AUC ≥0.70 in the independent validation cohort (pROC package; 2000-replicate bootstrap confidence intervals); those meeting all criteria were designated core hub genes.
4.6. GO, KEGG, and GSEA Enrichment Analyses
Gene Ontology (GO) and KEGG pathway enrichment analyses of the 25 core network targets were performed using clusterProfiler (v4.0), with Benjamini–Hochberg correction (adjusted P<0.05) [20]. GSEA of the 22 hub-gene training expression matrix was conducted against the MSigDB KEGG gene set collection (c2.cp.kegg) using fgsea; pathways with |NES|>1.5 and adjusted P<0.05 were considered significant.
4.7. Immune Infiltration Analysis
Immune cell composition was deconvoluted from the training set (GSE135251, n=216) using CIBERSORT with the LM22 signature matrix (1000 permutations) [21]. The LM22 matrix characterises 22 human haematopoietic cell types and does not directly include hepatic-specific subsets such as hepatic stellate cells or Kupffer cells. Consequently, correlations with these hepatic cell populations were inferred from ssGSEA enrichment scores using published gene set markers, rather than directly from CIBERSORT deconvolution. Hub gene expression was correlated with 22 LM22-defined immune cell populations via Spearman correlation; pairs with |r|>0.15 and P<0.05 were considered significant. Single-sample GSEA (ssGSEA) was performed using the GSVA package to quantify enrichment scores across all training samples, and between-group differences were assessed using the Wilcoxon rank-sum test with Benjamini–Hochberg correction.
4.8. Three-Dimensional Compound Screening
Active compounds were screened in three sequential dimensions. D1–Transdermal ADMET: Eight criteria evaluated via SwissADME: MW ≤500 Da, consensus log P 1–5, skin permeability log Kp ≥−6.0 cm/s, H-bond donors ≤5, H-bond acceptors ≤10, TPSA 40–130 Ų, rotatable bonds ≤10, Lipinski violations ≤1. D2–HSP90AB1 similarity: Dice coefficient vs. the co-crystallised ligand KFY (PDB: 6N8Y) ≥0.15. D3–MAPK8 similarity: Dice coefficient vs. the co-crystallised ligand GS7 (PDB: 3ELJ) ≥0.15. Classification: Triple (D1+D2+D3, n=12), double (D1+D3 or D1+D2, n=3), single (D1 only, n=2). All 17 D1-passing compounds proceeded to explicit docking, regardless of tier, to eliminate scaffold-biased false negatives.
4.9. Molecular Docking
Protein structures were obtained from the RCSB PDB: HSP90AB1 (6N8Y, 1.90 Å) and MAPK8/JNK1 (3ELJ, 2.00 Å). Seven crystallographic water molecules were retained in the 6N8Y ATP-binding pocket (HOH437, 454, 465, 542, 543, 558, and 568). Protein preparation (heteroatom removal, polar hydrogen addition, and Gasteiger charge assignment) was performed using AutoDockTools 1.5.7. Ligand three-dimensional conformations were generated using RDKit MMFF94 optimisation. AutoDock Vina 1.2.3 performed docking (search box 25×25×25 Å centred on the co-crystallised ligand; exhaustiveness=32) [22]. Binding interactions of the six selected complexes were characterised by PLIP (Protein–Ligand Interaction Profiler) [23].
4.10. Molecular Dynamics Simulation and MM-PBSA Calculation
Six complexes underwent 3×100 ns MD simulation in GROMACS 2023 using the AMBER99SB-ILDN force field (protein) and GAFF2 (ligands, parameterised via ACPYPE) [24]. Each was solvated in a TIP3P cubic water box (10 Å padding), charge-neutralised with 0.15 M NaCl, and energy-minimised (steepest descent, 50,000 steps). The equilibration comprised NVT (300 K, 100 ps) and NPT (1 bar, 100 ps) phases with backbone position restraints. Three independent 100-ns production runs were conducted per complex (time step 2 fs; LINCS constraints; PME electrostatics; cut-off 1.2 nm). RMSD, RMSF, radius of gyration, and free energy landscapes were analysed using GROMACS utilities. MM-PBSA binding free energies were calculated from the last 40 ns of each trajectory (approximately 4,000 snapshots at 10-ps intervals) using gmx_MMPBSA (εin=4.0; εout=80.0; ionic strength 0.15 M) [25]. Results are reported as mean±SD across three replicates.
5. Conclusions
This study provides the first integrated computational elucidation of a TCM transdermal formula for NAFLD treatment. Multi-dataset machine learning identified four cross-cohort-validated hub genes—FOS, HSP90AB1, HIF1A, and MAPK8—as potential diagnostic biomarkers and therapeutic targets. Their training set AUC values were 0.768, 0.717, 0.678, and 0.558, respectively, while their validation set AUC values were 0.760, 0.701, 0.802, and 0.744, respectively. Three-dimensional screening and 3×100 ns MD simulations with MM-PBSA identified danshenspiroketallactone and glabrene as priority lead compounds targeting HSP90AB1 and MAPK8, respectively, with all six validated complexes achieving ΔGbind ≤−14 kcal/mol. The proposed “thermal activation–chemical fine-tuning” model—in which Shenque heat stress may upregulate HSP90AB1 while terpenoid compounds potentially modulate its ATPase activity—provides a computational rationale for transdermal moxibustion in metabolic liver disease that warrants experimental validation. These findings establish a mechanistic framework for the rational optimisation of TCM transdermal formulas that target the inflammation–proteostasis–fibrosis axis in NAFLD.
Supplementary Materials
The following supporting information can be downloaded at the website of this paper posted on Preprints.org. Figure S1: Free energy landscape (FEL) plots (PC1 vs. PC2) for the individual replicates and pooled trajectories of the six ligand–protein complexes; Figure S2: Spearman correlation between FOS and HIF1A expression in the training cohort (ρ=0.139, P=0.01).
Author Contributions
Conceptualization, L.G. and N.J.; methodology, N.J. and K.H.; software, N.J. and M.X.; validation, K.H. and M.X.; formal analysis, N.J.; investigation, N.J. and K.H.; data curation, M.X.; writing—original draft preparation, N.J.; writing—review and editing, L.G. and K.H.; visualization, N.J. and M.X.; supervision, L.G.; project administration, L.G.; funding acquisition, L.G. All authors have read and agreed to the published version of the manuscript.
Funding
This research was funded by the General Science and Technology Plan Project of Jiangxi Provincial Health Commission (Grant No. 202410311), the General Science and Technology Plan Project of Jiangxi Provincial Administration of Traditional Chinese Medicine (Grant No. 2024B0035), the National Traditional Chinese Medicine Advantage Specialty Construction Program—Spleen and Stomach Disease Department, Affiliated Hospital of Jiangxi University of Chinese Medicine (Guo Zhong Yi Yao Yi Zheng Han [2024] No. 90), and the Ge Laian Jiangxi Provincial Famous Traditional Chinese Medicine Inheritance Studio (Gan Zhong Yi Yao Ke Jiao Han [2025] No. 5).
Institutional Review Board Statement
Not applicable. This study analysed publicly available, de-identified data from the Gene Expression Omnibus (GEO); no new studies involving humans or animals were performed.
Informed Consent Statement
Not applicable. All analysed datasets were obtained from public repositories in which informed consent had been obtained by the original investigators.
Data Availability Statement
The datasets analysed in this study are publicly available from the Gene Expression Omnibus (https://www.ncbi.nlm.nih.gov/geo) under accession numbers GSE135251, GSE126848, GSE48452, and GSE167523. Protein structures were obtained from the RCSB Protein Data Bank (https://www.rcsb.org) under PDB IDs 6N8Y and 3ELJ. Further data are available from the corresponding author upon reasonable request.
Acknowledgments
The authors thank the Gene Expression Omnibus (https://www.ncbi.nlm.nih.gov/geo) for the GEO datasets and the STRING database (https://string-db.org) for the network data. During the preparation of this manuscript, the authors used generative AI tools (Claude, Anthropic; ChatGPT, OpenAI; and Gemini, Google) for language editing and for coding assistance with data-analysis scripts and visualisation. After using these tools, the authors reviewed and edited the content as needed and take full responsibility for the content of the publication. No AI tool was used to generate the research data, results, conclusions, or any core scientific content.
Conflicts of Interest
The authors declare no conflicts of interest. The funders had no role in the design of the study; in the collection, analyses, or interpretation of data; in the writing of the manuscript; or in the decision to publish the results.
References
- Younossi, Z.M.; Koenig, A.B.; Abdelatif, D.; et al. Global epidemiology of nonalcoholic fatty liver disease—Meta-analytic assessment of prevalence, incidence, and outcomes. Hepatology 2016, 64, 73–84. [Google Scholar] [CrossRef] [PubMed]
- Dulai, P.S.; Singh, S.; Patel, J.; et al. Increased risk of mortality by fibrosis stage in nonalcoholic fatty liver disease: A systematic review and meta-analysis. Hepatology 2017, 65, 1557–1565. [Google Scholar] [CrossRef] [PubMed]
- Tilg, H.; Adolph, T.E.; Moschen, A.R. Multiple parallel hits hypothesis in nonalcoholic fatty liver disease: Revisited after a decade. Hepatology 2021, 73, 833–842. [Google Scholar] [CrossRef] [PubMed]
- Sheka, A.C.; Adeyi, O.; Thompson, J.; et al. Nonalcoholic steatohepatitis: A review. JAMA 2020, 323, 1175–1183. [Google Scholar] [CrossRef] [PubMed]
- Nie, Z.; Xiao, C.; Wang, Y.; et al. Heat shock proteins (HSPs) in non-alcoholic fatty liver disease (NAFLD): From molecular mechanisms to therapeutic avenues. Biomark. Res. 2024, 12, 120. [Google Scholar] [CrossRef] [PubMed]
- Hopkins, A.L. Network pharmacology: The next paradigm in drug discovery. Nat. Chem. Biol. 2008, 4, 682–690. [Google Scholar] [CrossRef] [PubMed]
- Hollingsworth, S.A.; Dror, R.O. Molecular dynamics simulation for all. Neuron 2018, 99, 1129–1143. [Google Scholar] [CrossRef] [PubMed]
- Biao, Y.; Li, J.; He, J.; et al. Protective effect of Danshen Zexie Decoction against non-alcoholic fatty liver disease through inhibition of the ROS/NLRP3/IL-1β pathway by Nrf2 signaling activation. Front. Pharmacol. 2022, 13, 877924. [Google Scholar] [CrossRef] [PubMed]
- Liu, J.; Ding, M.; Bai, J.; et al. Decoding the role of immune T cells: A new territory for improvement of metabolic-associated fatty liver disease. iMeta 2023, 2, e76. [Google Scholar] [CrossRef] [PubMed]
- Min, R.W.M.; Aung, F.W.M.; Liu, B.; et al. Mechanism and therapeutic targets of c-Jun N-terminal kinases activation in nonalcoholic fatty liver disease. Biomedicines 2022, 10, 2035. [Google Scholar] [CrossRef] [PubMed]
- Li, J.; Buchner, J. Structure, function and regulation of the Hsp90 machinery. Biomed. J. 2013, 36, 106–117. [Google Scholar] [CrossRef] [PubMed]
- Morimoto, R.I. The heat shock response: Systems biology of proteotoxic stress in aging and disease. Cold Spring Harb. Symp. Quant. Biol. 2011, 76, 91–99. [Google Scholar] [CrossRef] [PubMed]
- Seki, E.; Brenner, D.A.; Karin, M. A liver full of JNK: Signaling in regulation of cell function and disease pathogenesis, and clinical approaches. Gastroenterology 2012, 143, 307–320. [Google Scholar] [CrossRef] [PubMed]
- Ma, C.; Kesarwala, A.H.; Eggert, T.; et al. NAFLD causes selective CD4+ T lymphocyte loss and promotes hepatocarcinogenesis. Nature 2016, 531, 253–257. [Google Scholar] [CrossRef] [PubMed]
- Serafini, M.; Peluso, I. Functional foods for health: The interrelated antioxidant and anti-inflammatory role of fruits, vegetables, herbs, spices and cocoa in humans. Curr. Pharm. Des. 2016, 22, 6701–6715. [Google Scholar] [CrossRef] [PubMed]
- Ru, J.; Li, P.; Wang, J.; et al. TCMSP: A database of systems pharmacology for drug discovery from herbal medicines. J. Cheminform. 2014, 6, 13. [Google Scholar] [CrossRef] [PubMed]
- Johnson, W.E.; Li, C.; Rabinovic, A. Adjusting batch effects in microarray expression data using empirical Bayes methods. Biostatistics 2007, 8, 118–127. [Google Scholar] [PubMed]
- Tibshirani, R. Regression shrinkage and selection via the lasso. J. R. Stat. Soc. Ser. B 1996, 58, 267–288. [Google Scholar] [CrossRef]
- Breiman, L. Random forests. Mach. Learn. 2001, 45, 5–32. [Google Scholar] [CrossRef]
- Yu, G.; Wang, L.G.; Han, Y.; He, Q.Y. clusterProfiler: An R package for comparing biological themes among gene clusters. OMICS 2012, 16, 284–287. [Google Scholar] [CrossRef] [PubMed]
- Newman, A.M.; Liu, C.L.; Green, M.R.; et al. Robust enumeration of cell subsets from tissue expression profiles. Nat. Methods 2015, 12, 453–457. [Google Scholar] [CrossRef] [PubMed]
- Trott, O.; Olson, A.J. AutoDock Vina: Improving the speed and accuracy of docking with a new scoring function, efficient optimization, and multithreading. J. Comput. Chem. 2010, 31, 455–461. [Google Scholar] [PubMed]
- Salentin, S.; Schreiber, S.; Haupt, V.J.; et al. PLIP: Fully automated protein–ligand interaction profiler. Nucleic Acids Res. 2015, 43, W443–W447. [Google Scholar] [CrossRef] [PubMed]
- Abraham, M.J.; Murtola, T.; Schulz, R.; et al. GROMACS: High performance molecular simulations through multi-level parallelism from laptops to supercomputers. SoftwareX 2015, 1–2, 19–25. [Google Scholar] [CrossRef]
- Valdés-Tresanco, M.S.; Valdés-Tresanco, M.E.; Valiente, P.A.; Moreno, E. gmx_MMPBSA: A new tool to perform end-state free energy calculations with GROMACS. J. Chem. Theory Comput. 2021, 17, 6281–6291. [Google Scholar] [CrossRef] [PubMed]
Figure 1.
Network pharmacology analysis. (A) Venn diagram of herb compound targets ∩ NAFLD disease targets, yielding 380 shared candidate targets for downstream PPI network analysis; 246 hub-gene candidates were retained after sequential PPI filtering, machine learning, and differential expression analysis for network visualisation. (B) STRING PPI network of 25 core targets; edge width reflects confidence score; node colour encodes betweenness centrality. (C) Compound–target–disease network visualised in Cytoscape; node size proportional to degree; five hub compounds labelled. (D) cytoHubba hub node ranking visualisation. (E) cytoNCA/ClusterViz node selection. (F) Three-algorithm Venn diagram (cytoNCA n=46; ClusterViz n=74; cytoHubba n=40; intersection=23 genes; supplemented by CASP3 and TNF to yield 25 core network targets).
Figure 1.
Network pharmacology analysis. (A) Venn diagram of herb compound targets ∩ NAFLD disease targets, yielding 380 shared candidate targets for downstream PPI network analysis; 246 hub-gene candidates were retained after sequential PPI filtering, machine learning, and differential expression analysis for network visualisation. (B) STRING PPI network of 25 core targets; edge width reflects confidence score; node colour encodes betweenness centrality. (C) Compound–target–disease network visualised in Cytoscape; node size proportional to degree; five hub compounds labelled. (D) cytoHubba hub node ranking visualisation. (E) cytoNCA/ClusterViz node selection. (F) Three-algorithm Venn diagram (cytoNCA n=46; ClusterViz n=74; cytoHubba n=40; intersection=23 genes; supplemented by CASP3 and TNF to yield 25 core network targets).
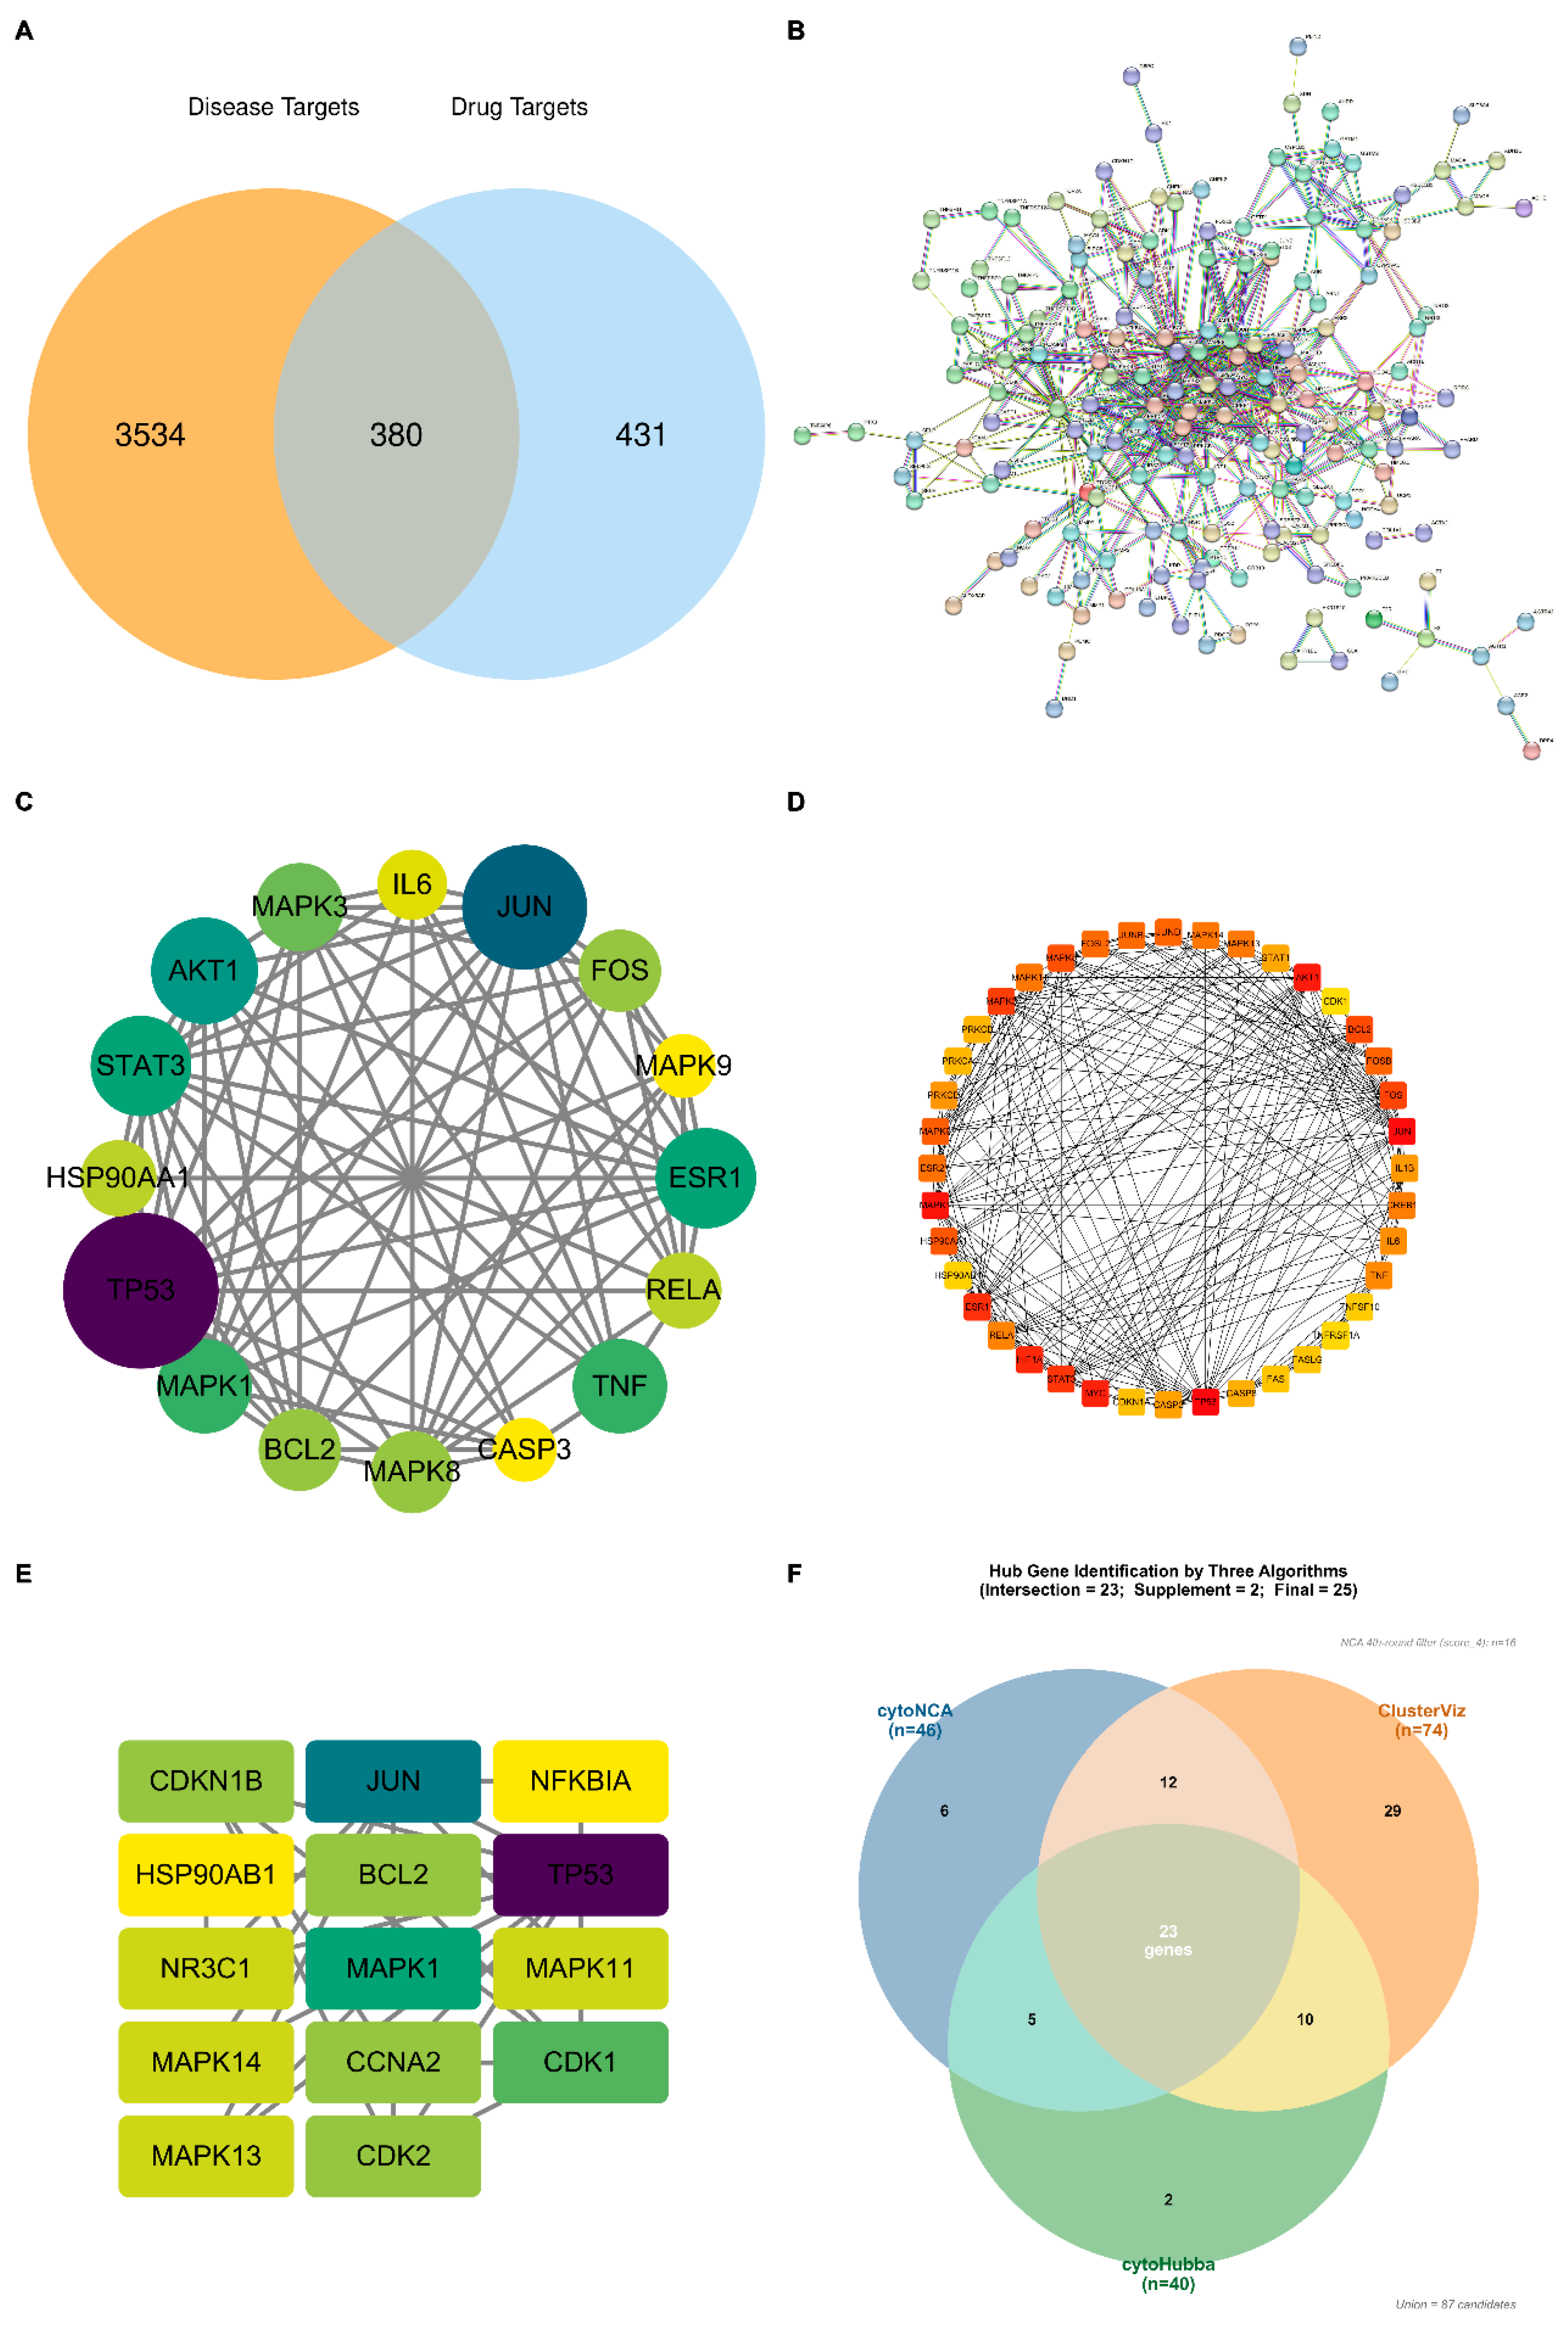
Figure 2.
Pathway enrichment analyses. (A) GO enrichment bubble plot (top 20 biological process terms; bubble size=gene count; colour=adjusted P). (B) KEGG bar plot (top 20 pathways). (C) KEGG cnet plot showing hub gene–pathway associations. (D) GSEA NES bar plot of 32 significantly enriched pathways (|NES|>1.5, adjusted P<0.05); red=positively enriched in NAFLD; blue=negatively enriched.
Figure 2.
Pathway enrichment analyses. (A) GO enrichment bubble plot (top 20 biological process terms; bubble size=gene count; colour=adjusted P). (B) KEGG bar plot (top 20 pathways). (C) KEGG cnet plot showing hub gene–pathway associations. (D) GSEA NES bar plot of 32 significantly enriched pathways (|NES|>1.5, adjusted P<0.05); red=positively enriched in NAFLD; blue=negatively enriched.
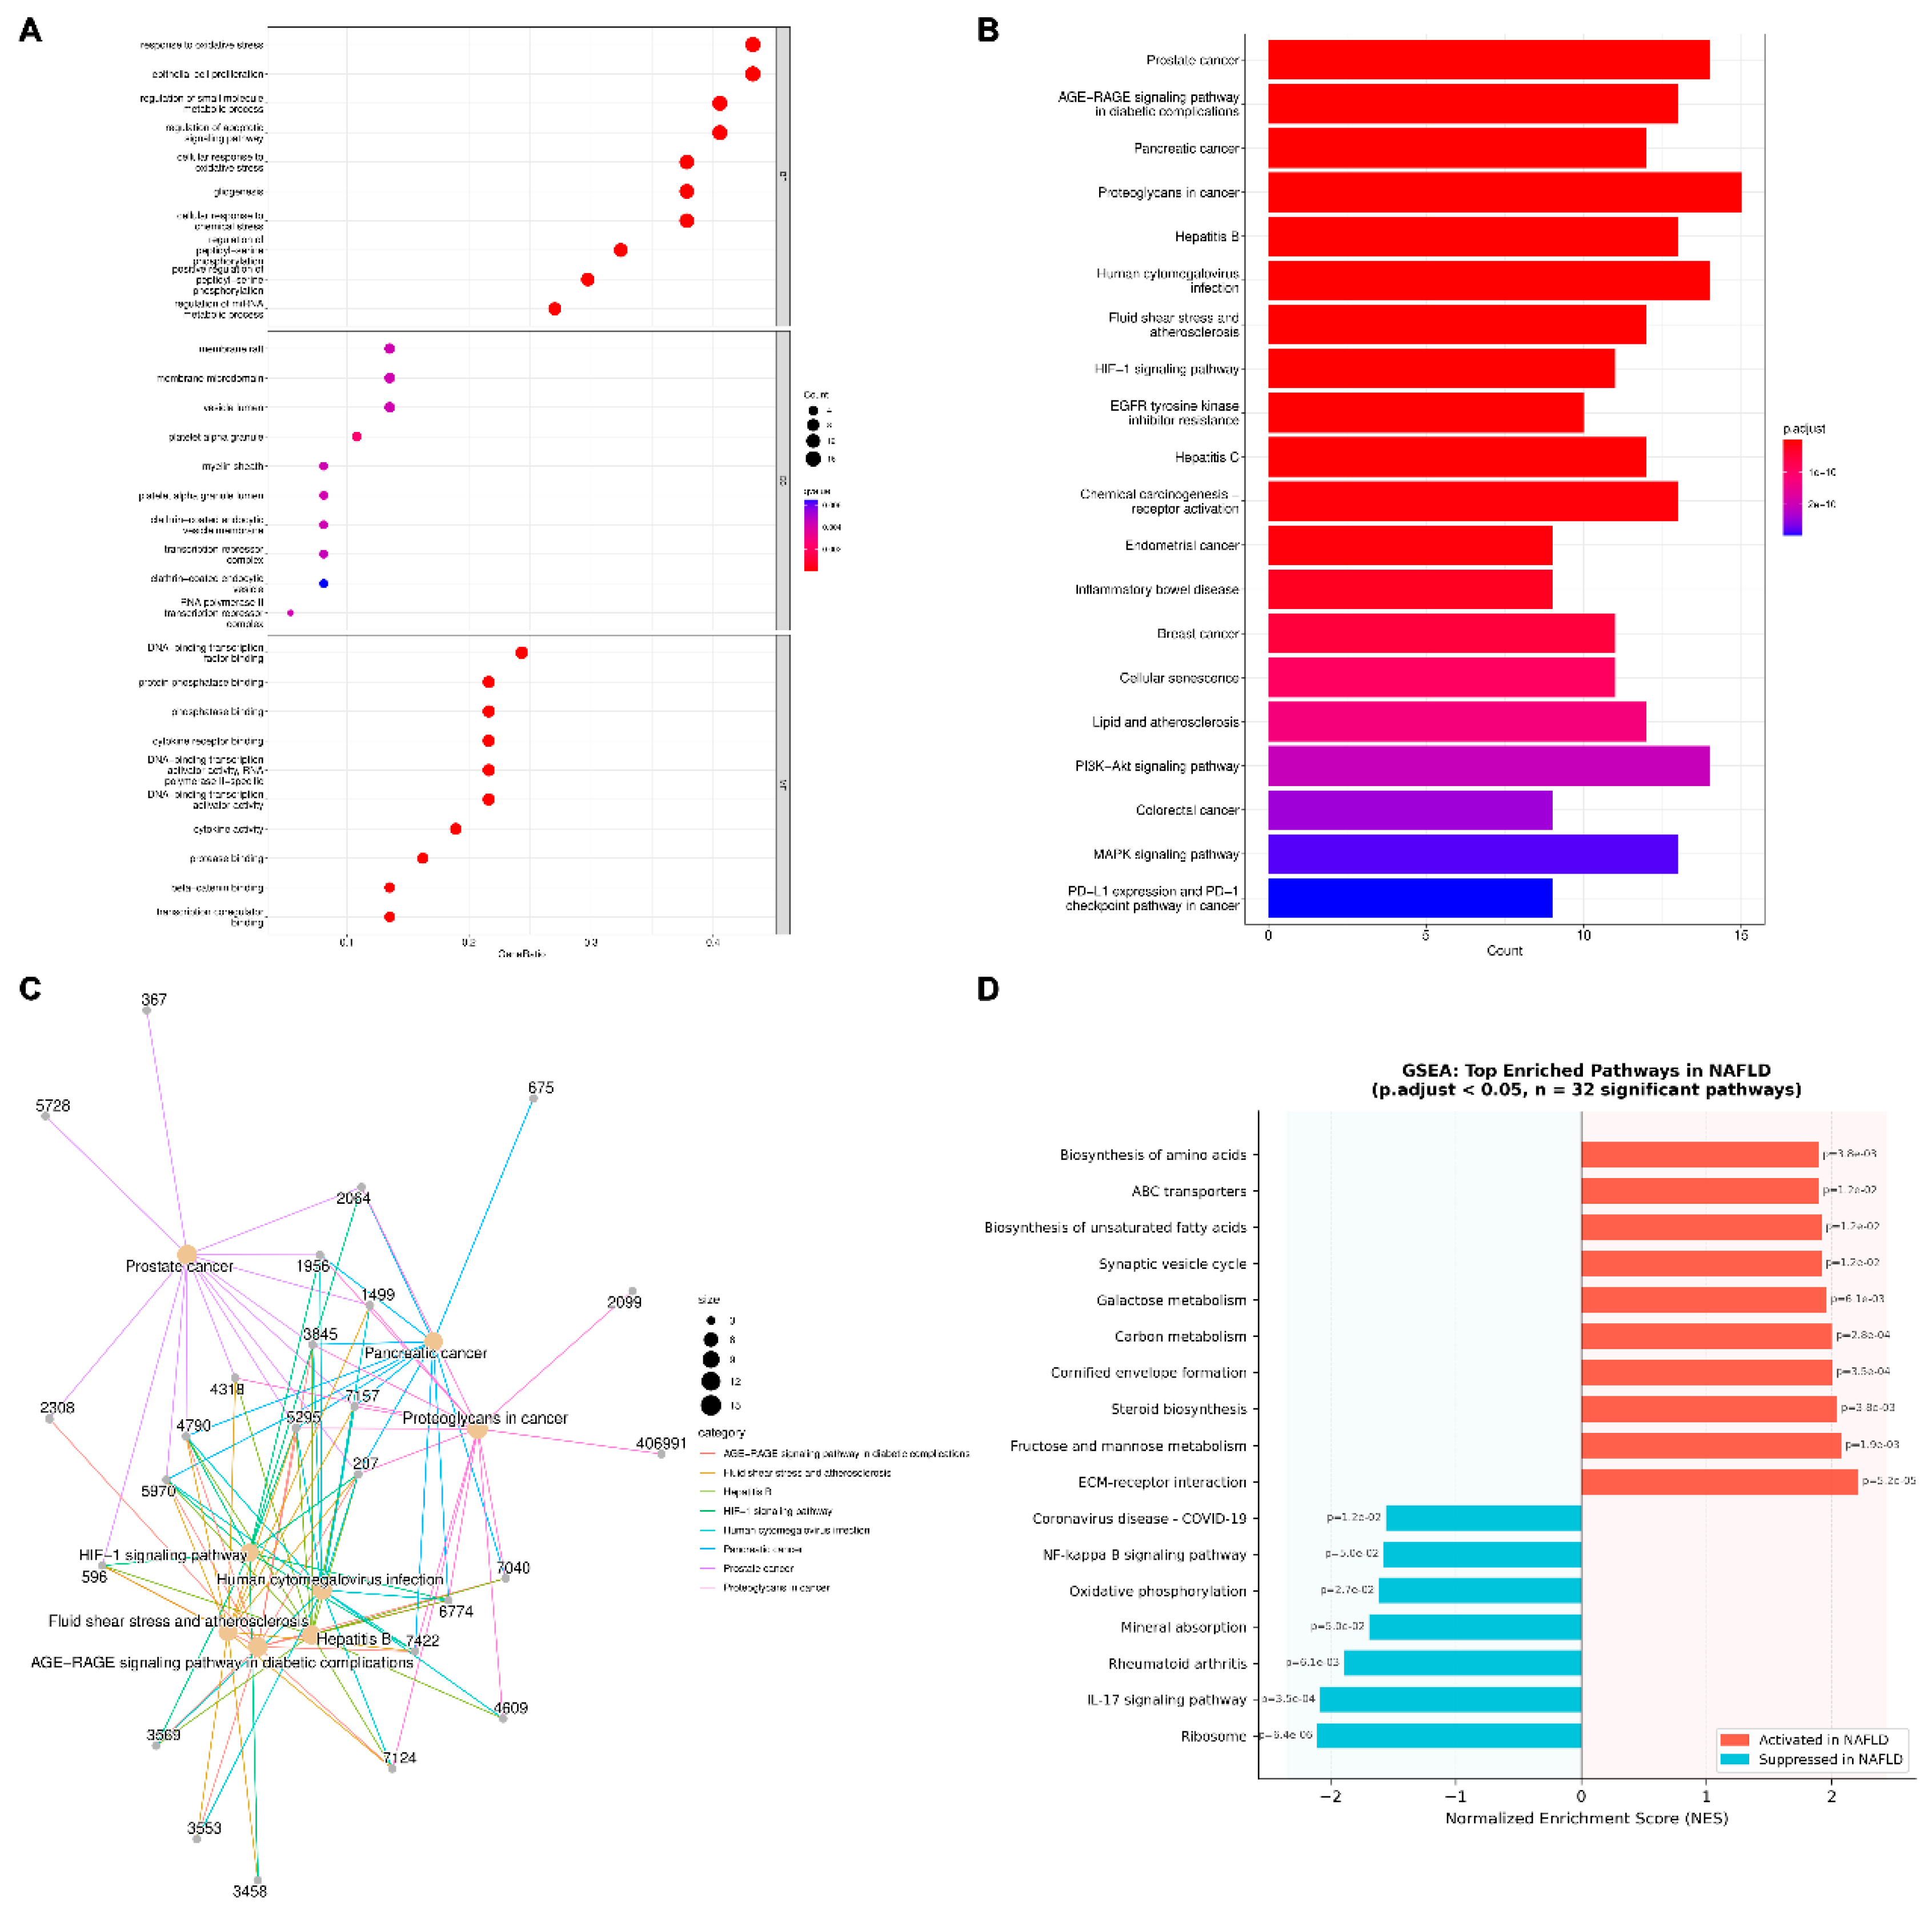
Figure 3.
Machine learning hub gene identification and validation. (A) PCA before and after ComBat batch correction (n=346). (B) LASSO cross-validation curve. (C) Random forest variable importance plot (MDA) for all 22 candidate genes. (D) AUC comparison bar chart for all eight algorithm-selected genes in training and GSE167523 validation sets; red dashed line=AUC 0.70. (E) ROC curves in training set (GSE135251+GSE126848+GSE48452) and external validation set (GSE167523). (F) Expression boxplots of four hub genes in NAFLD vs. control (GSE167523 validation cohort, TMM normalised); ** adj. P<0.0001; * adj. P<0.001.
Figure 3.
Machine learning hub gene identification and validation. (A) PCA before and after ComBat batch correction (n=346). (B) LASSO cross-validation curve. (C) Random forest variable importance plot (MDA) for all 22 candidate genes. (D) AUC comparison bar chart for all eight algorithm-selected genes in training and GSE167523 validation sets; red dashed line=AUC 0.70. (E) ROC curves in training set (GSE135251+GSE126848+GSE48452) and external validation set (GSE167523). (F) Expression boxplots of four hub genes in NAFLD vs. control (GSE167523 validation cohort, TMM normalised); ** adj. P<0.0001; * adj. P<0.001.
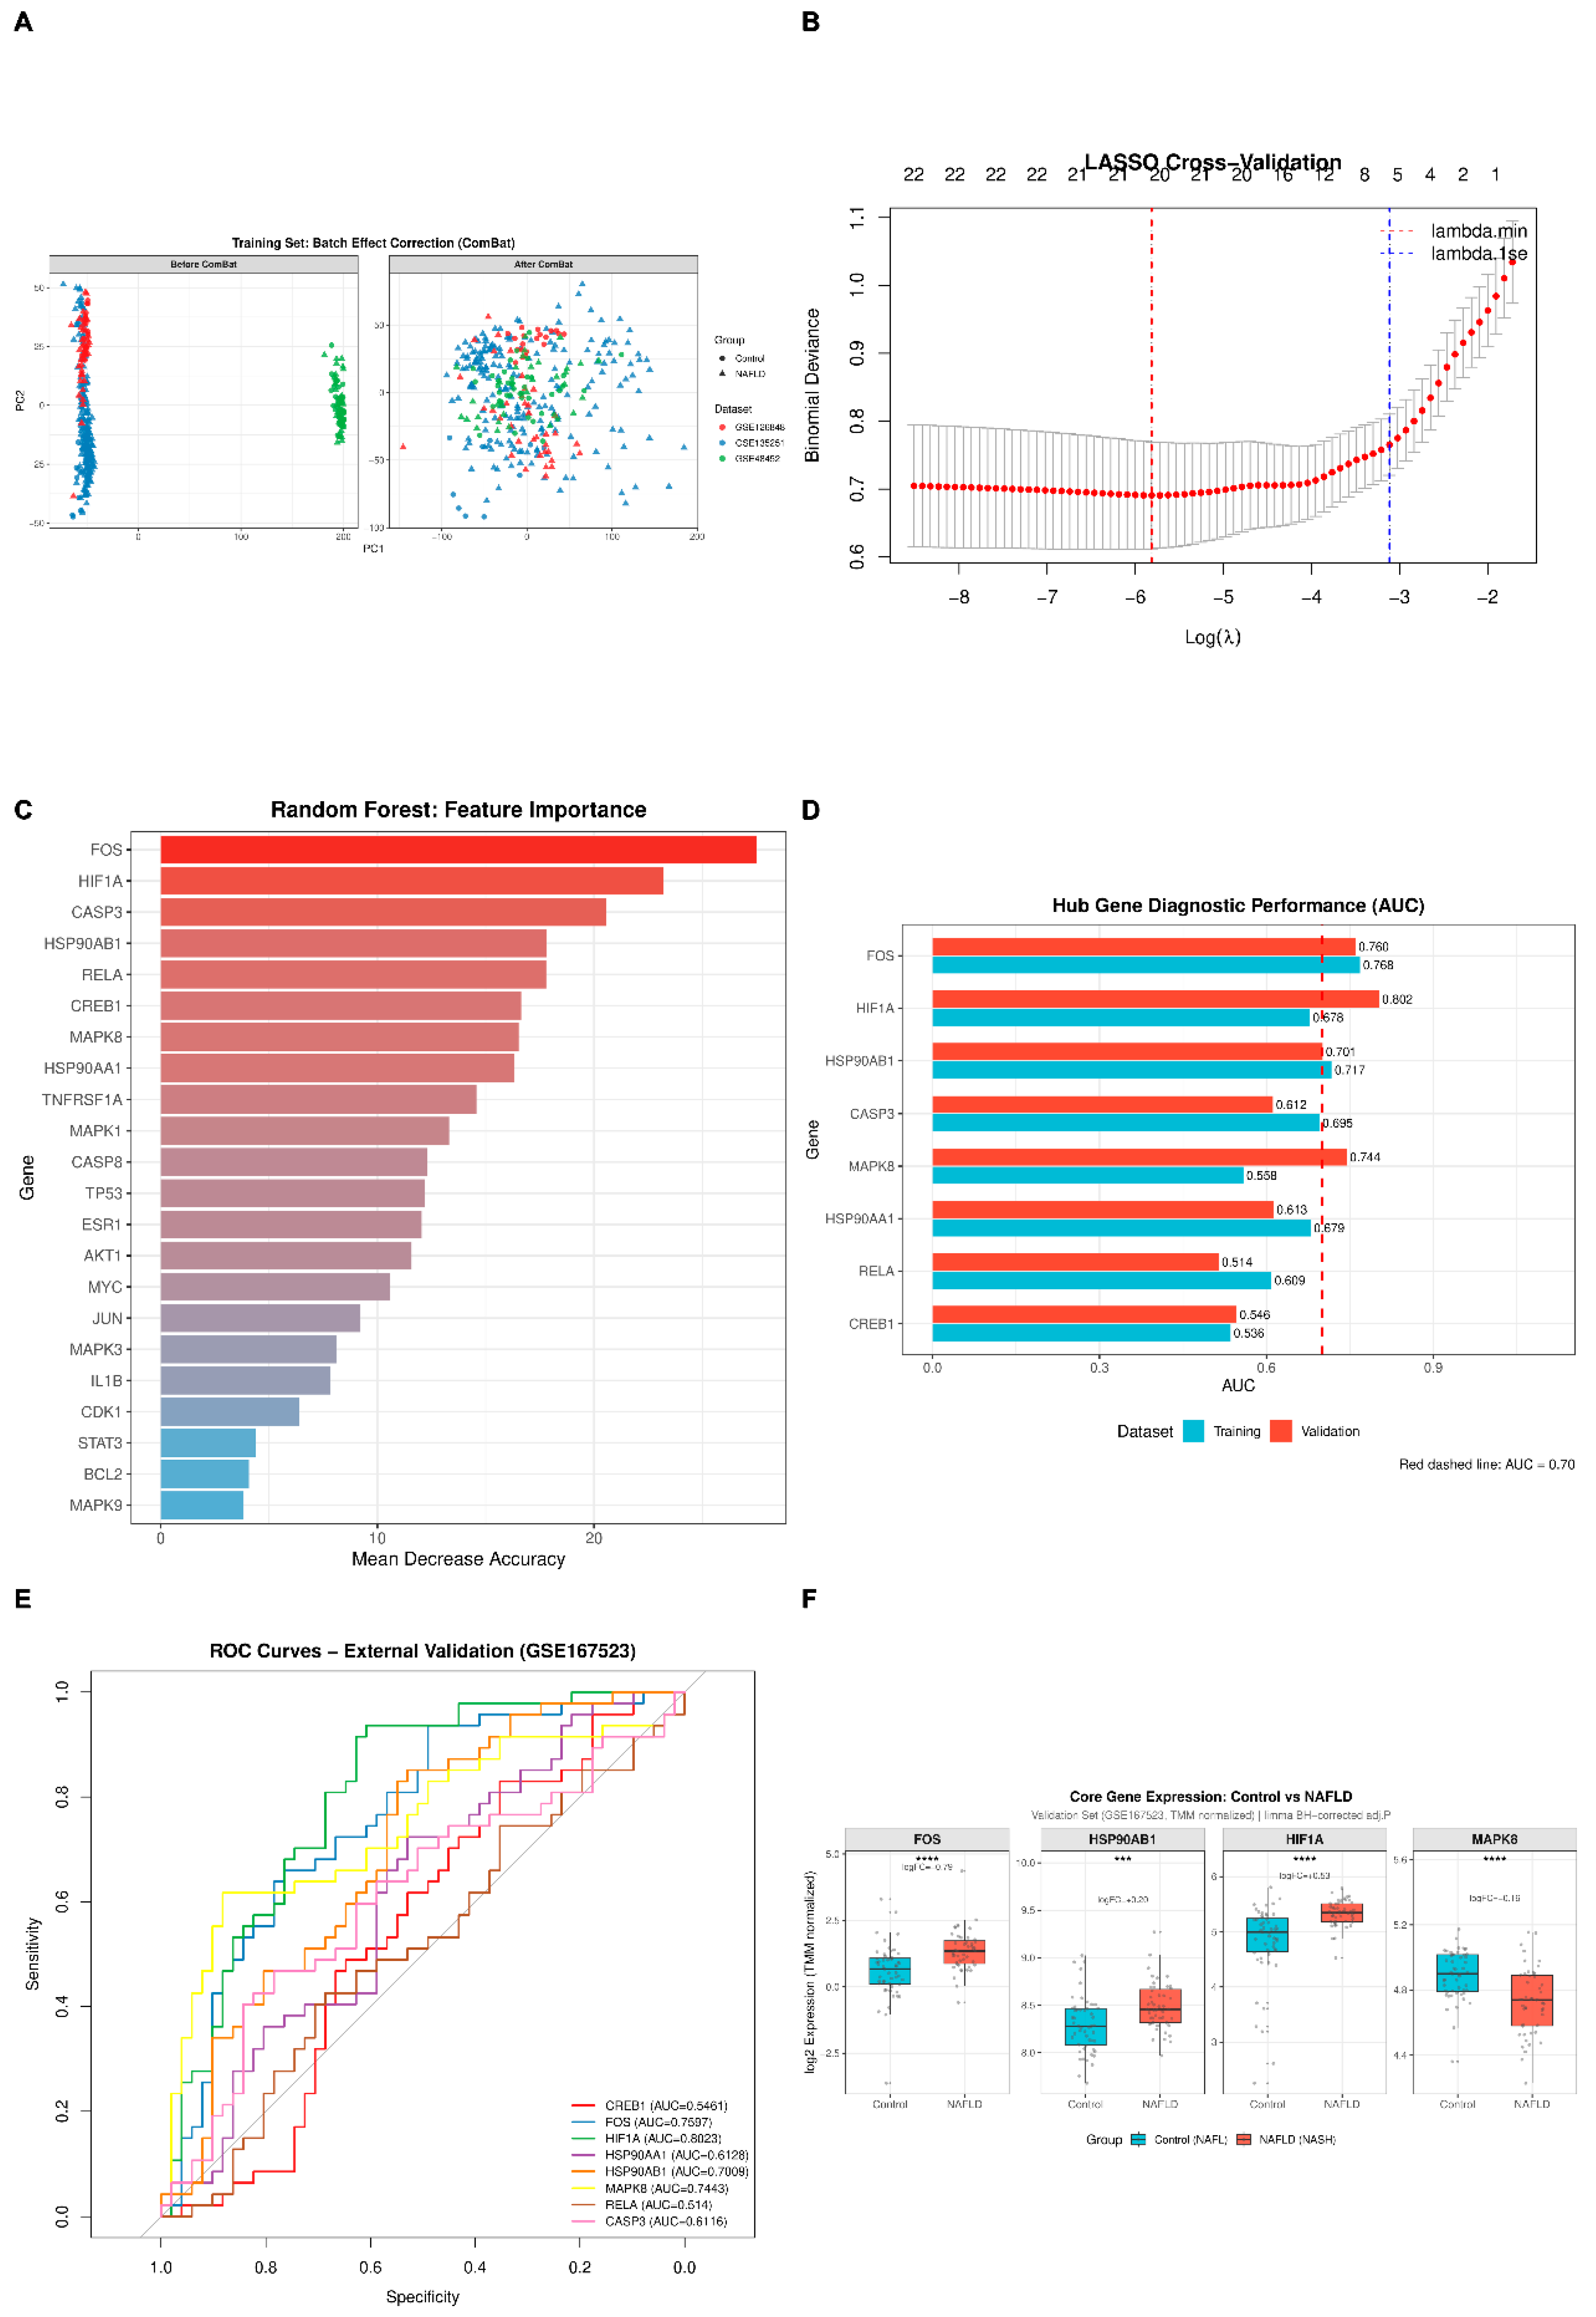
Figure 4.
Immune infiltration analysis. (A) Spearman correlation heatmap of four hub genes × 22 immune cell populations (LM22 signature matrix); highlighted cells: |r|>0.15, P<0.05; 102 significant pairs total. (B) Bubble plot of significant hub gene–immune cell pairs (bubble size=|r|; colour=direction). (C) ssGSEA immune enrichment score heatmap (n=216 samples grouped by NAFLD status; hepatic cell populations inferred via published gene-set markers). (D) ssGSEA mean difference bar plot (NAFLD−Control); cells with Benjamini–Hochberg adjusted P<0.05 are labelled.
Figure 4.
Immune infiltration analysis. (A) Spearman correlation heatmap of four hub genes × 22 immune cell populations (LM22 signature matrix); highlighted cells: |r|>0.15, P<0.05; 102 significant pairs total. (B) Bubble plot of significant hub gene–immune cell pairs (bubble size=|r|; colour=direction). (C) ssGSEA immune enrichment score heatmap (n=216 samples grouped by NAFLD status; hepatic cell populations inferred via published gene-set markers). (D) ssGSEA mean difference bar plot (NAFLD−Control); cells with Benjamini–Hochberg adjusted P<0.05 are labelled.
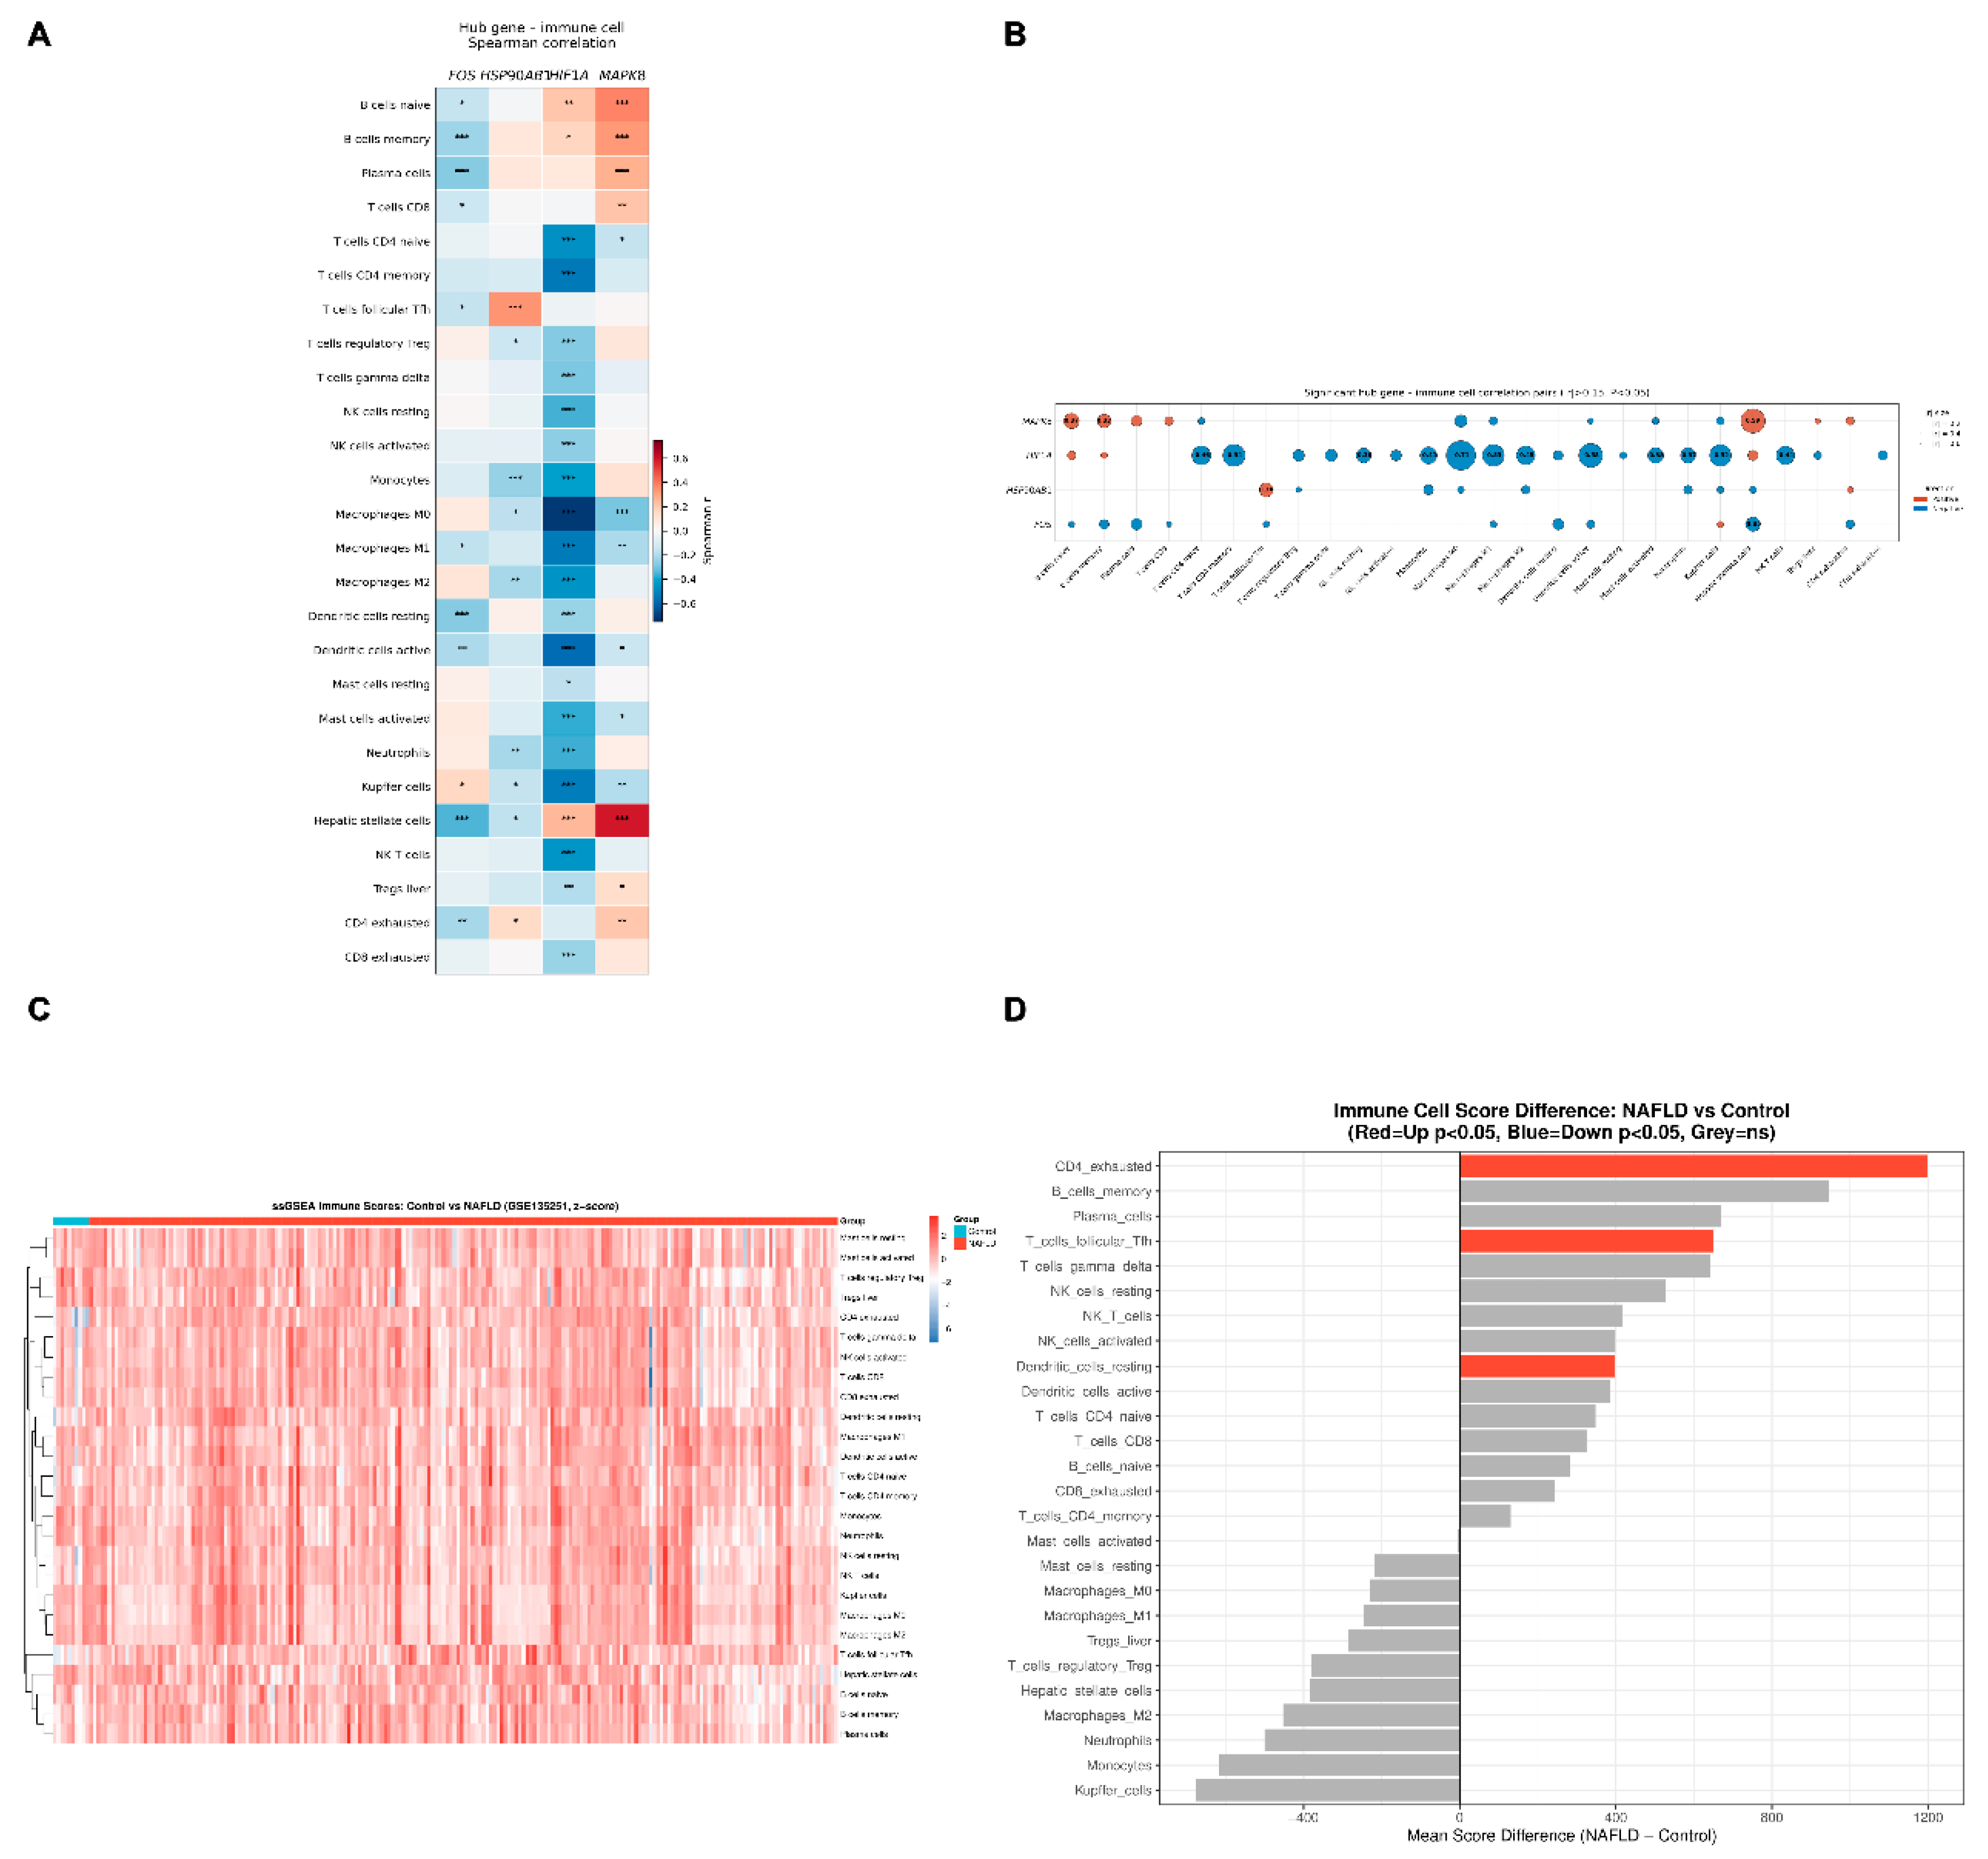
Figure 5.
Three-dimensional compound screening results. (A) Three-circle Venn diagram of ADMET (n=17), HSP90AB1-similarity (n=101), and MAPK8-similarity (n=139) filters; triple intersection=12 compounds. (B) Screening funnel from 5276 DL-filtered compounds through each sequential filter. (C) Composite ranking bar chart of all 17 ADMET-passing compounds (score=0.4×ADMET+0.3×HSP90 Dice+0.3×MAPK8 Dice; colour=tier). (D) Similarity space scatter plot; x-axis=HSP90-Dice; y-axis=MAPK8-Dice; bubble size=composite score; colour=tier. Capsaicin (highest similarity, weakest docking) and danshenspiroketallactone (low HSP90 similarity, highest binding affinity) are annotated to illustrate the scaffold-escape phenomenon.
Figure 5.
Three-dimensional compound screening results. (A) Three-circle Venn diagram of ADMET (n=17), HSP90AB1-similarity (n=101), and MAPK8-similarity (n=139) filters; triple intersection=12 compounds. (B) Screening funnel from 5276 DL-filtered compounds through each sequential filter. (C) Composite ranking bar chart of all 17 ADMET-passing compounds (score=0.4×ADMET+0.3×HSP90 Dice+0.3×MAPK8 Dice; colour=tier). (D) Similarity space scatter plot; x-axis=HSP90-Dice; y-axis=MAPK8-Dice; bubble size=composite score; colour=tier. Capsaicin (highest similarity, weakest docking) and danshenspiroketallactone (low HSP90 similarity, highest binding affinity) are annotated to illustrate the scaffold-escape phenomenon.
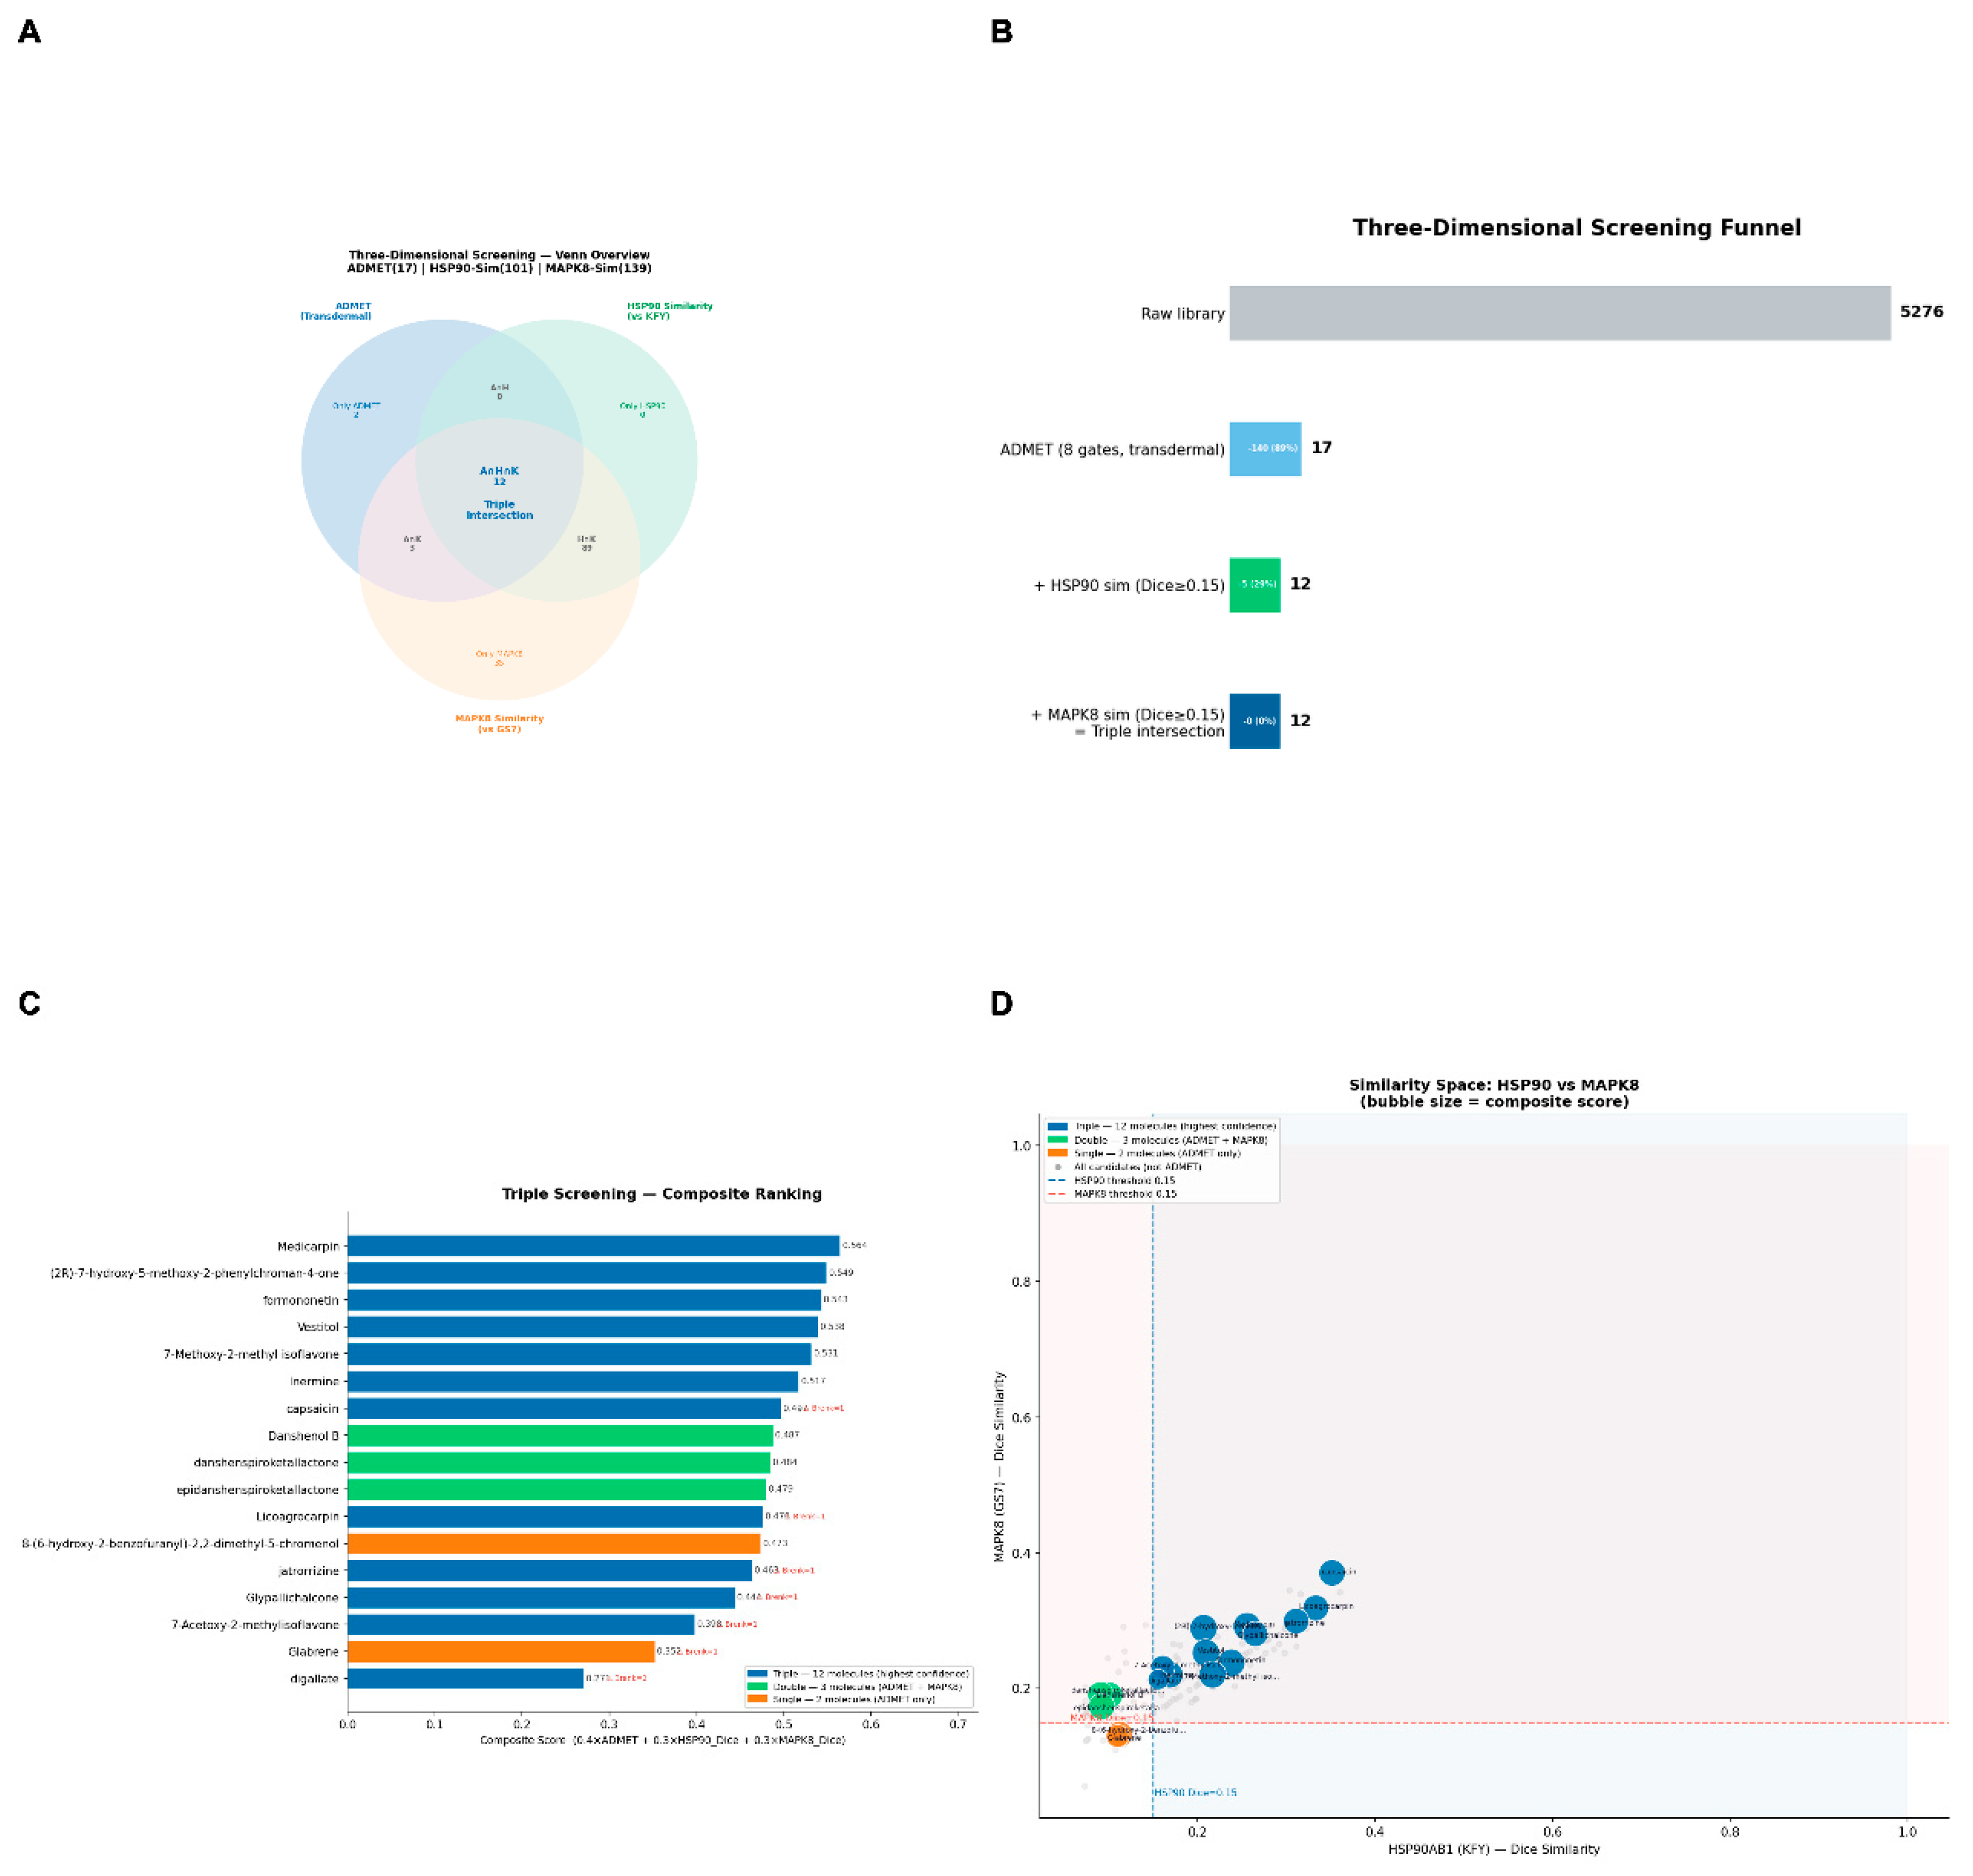
Figure 6.
Molecular docking results. (A) Bar chart of binding affinities (kcal/mol) for all 17 ADMET-passing compounds against HSP90AB1 (6N8Y) and MAPK8 (3ELJ). (B) Dual-target binding affinity scatter plot (HSP90AB1 vs. MAPK8); colour=tier; selected complexes labelled. (C) Three-dimensional surface representations of the six selected complexes within respective binding pockets. (D) Two-dimensional PLIP interaction diagrams; hydrogen bonds=green dashed lines; hydrophobic contacts=pink arcs; π–π stacking=orange lines.
Figure 6.
Molecular docking results. (A) Bar chart of binding affinities (kcal/mol) for all 17 ADMET-passing compounds against HSP90AB1 (6N8Y) and MAPK8 (3ELJ). (B) Dual-target binding affinity scatter plot (HSP90AB1 vs. MAPK8); colour=tier; selected complexes labelled. (C) Three-dimensional surface representations of the six selected complexes within respective binding pockets. (D) Two-dimensional PLIP interaction diagrams; hydrogen bonds=green dashed lines; hydrophobic contacts=pink arcs; π–π stacking=orange lines.
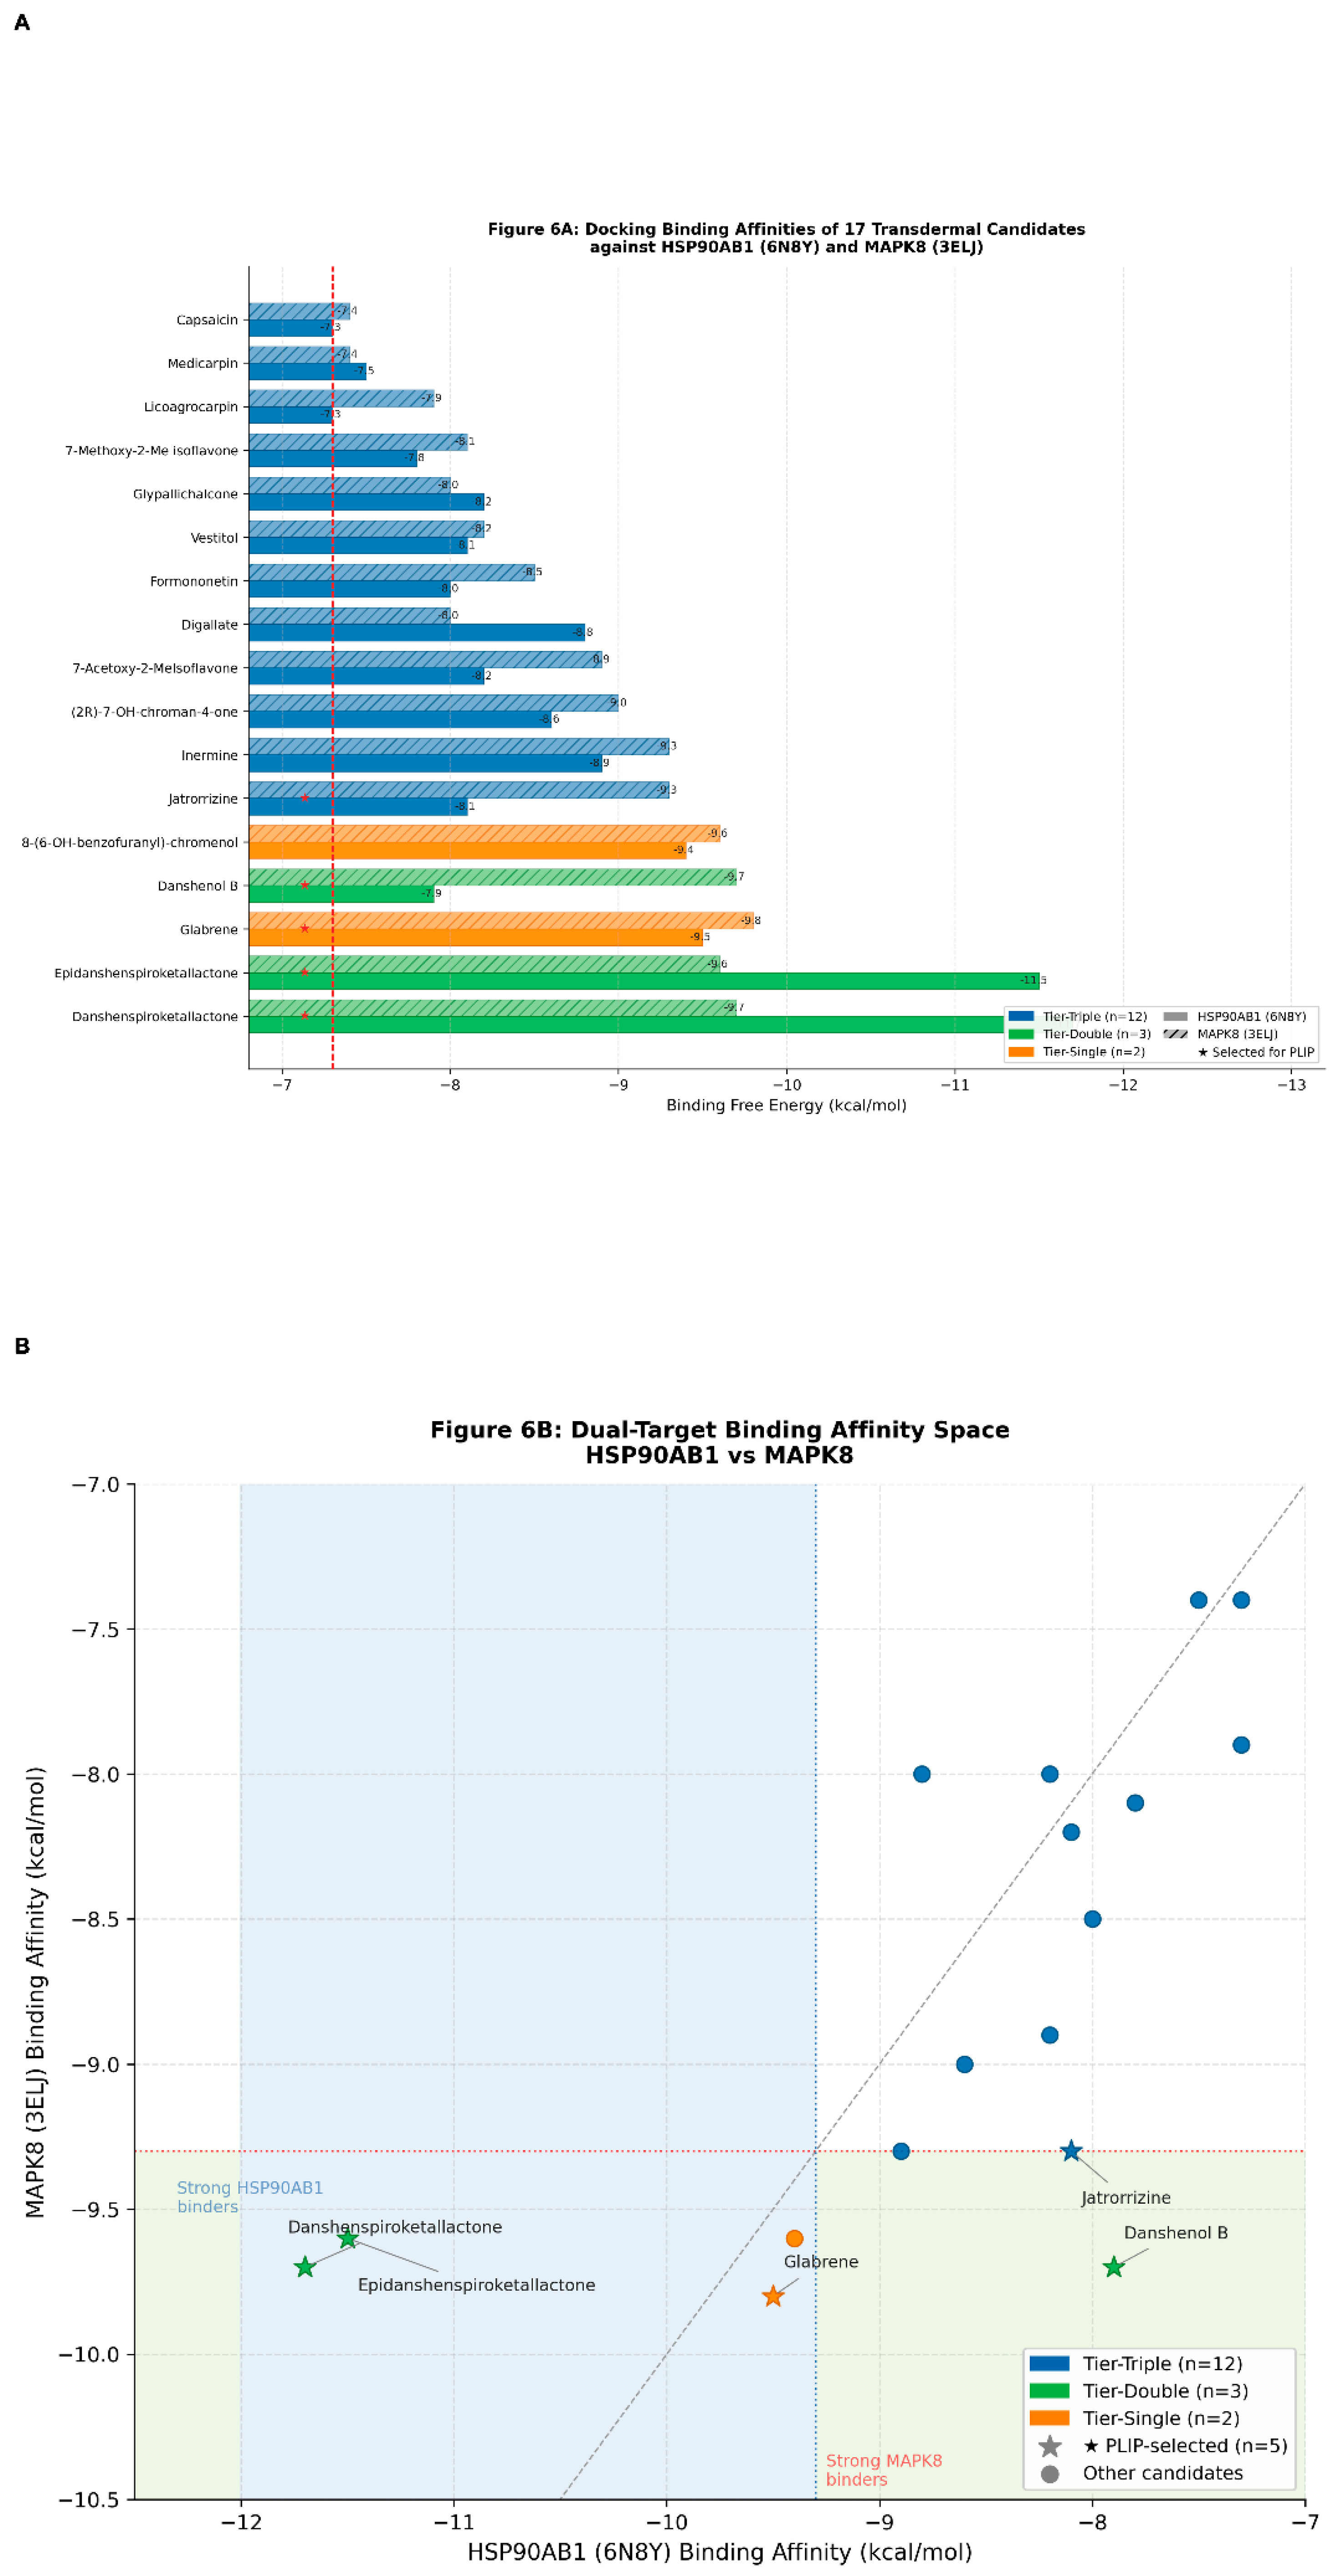
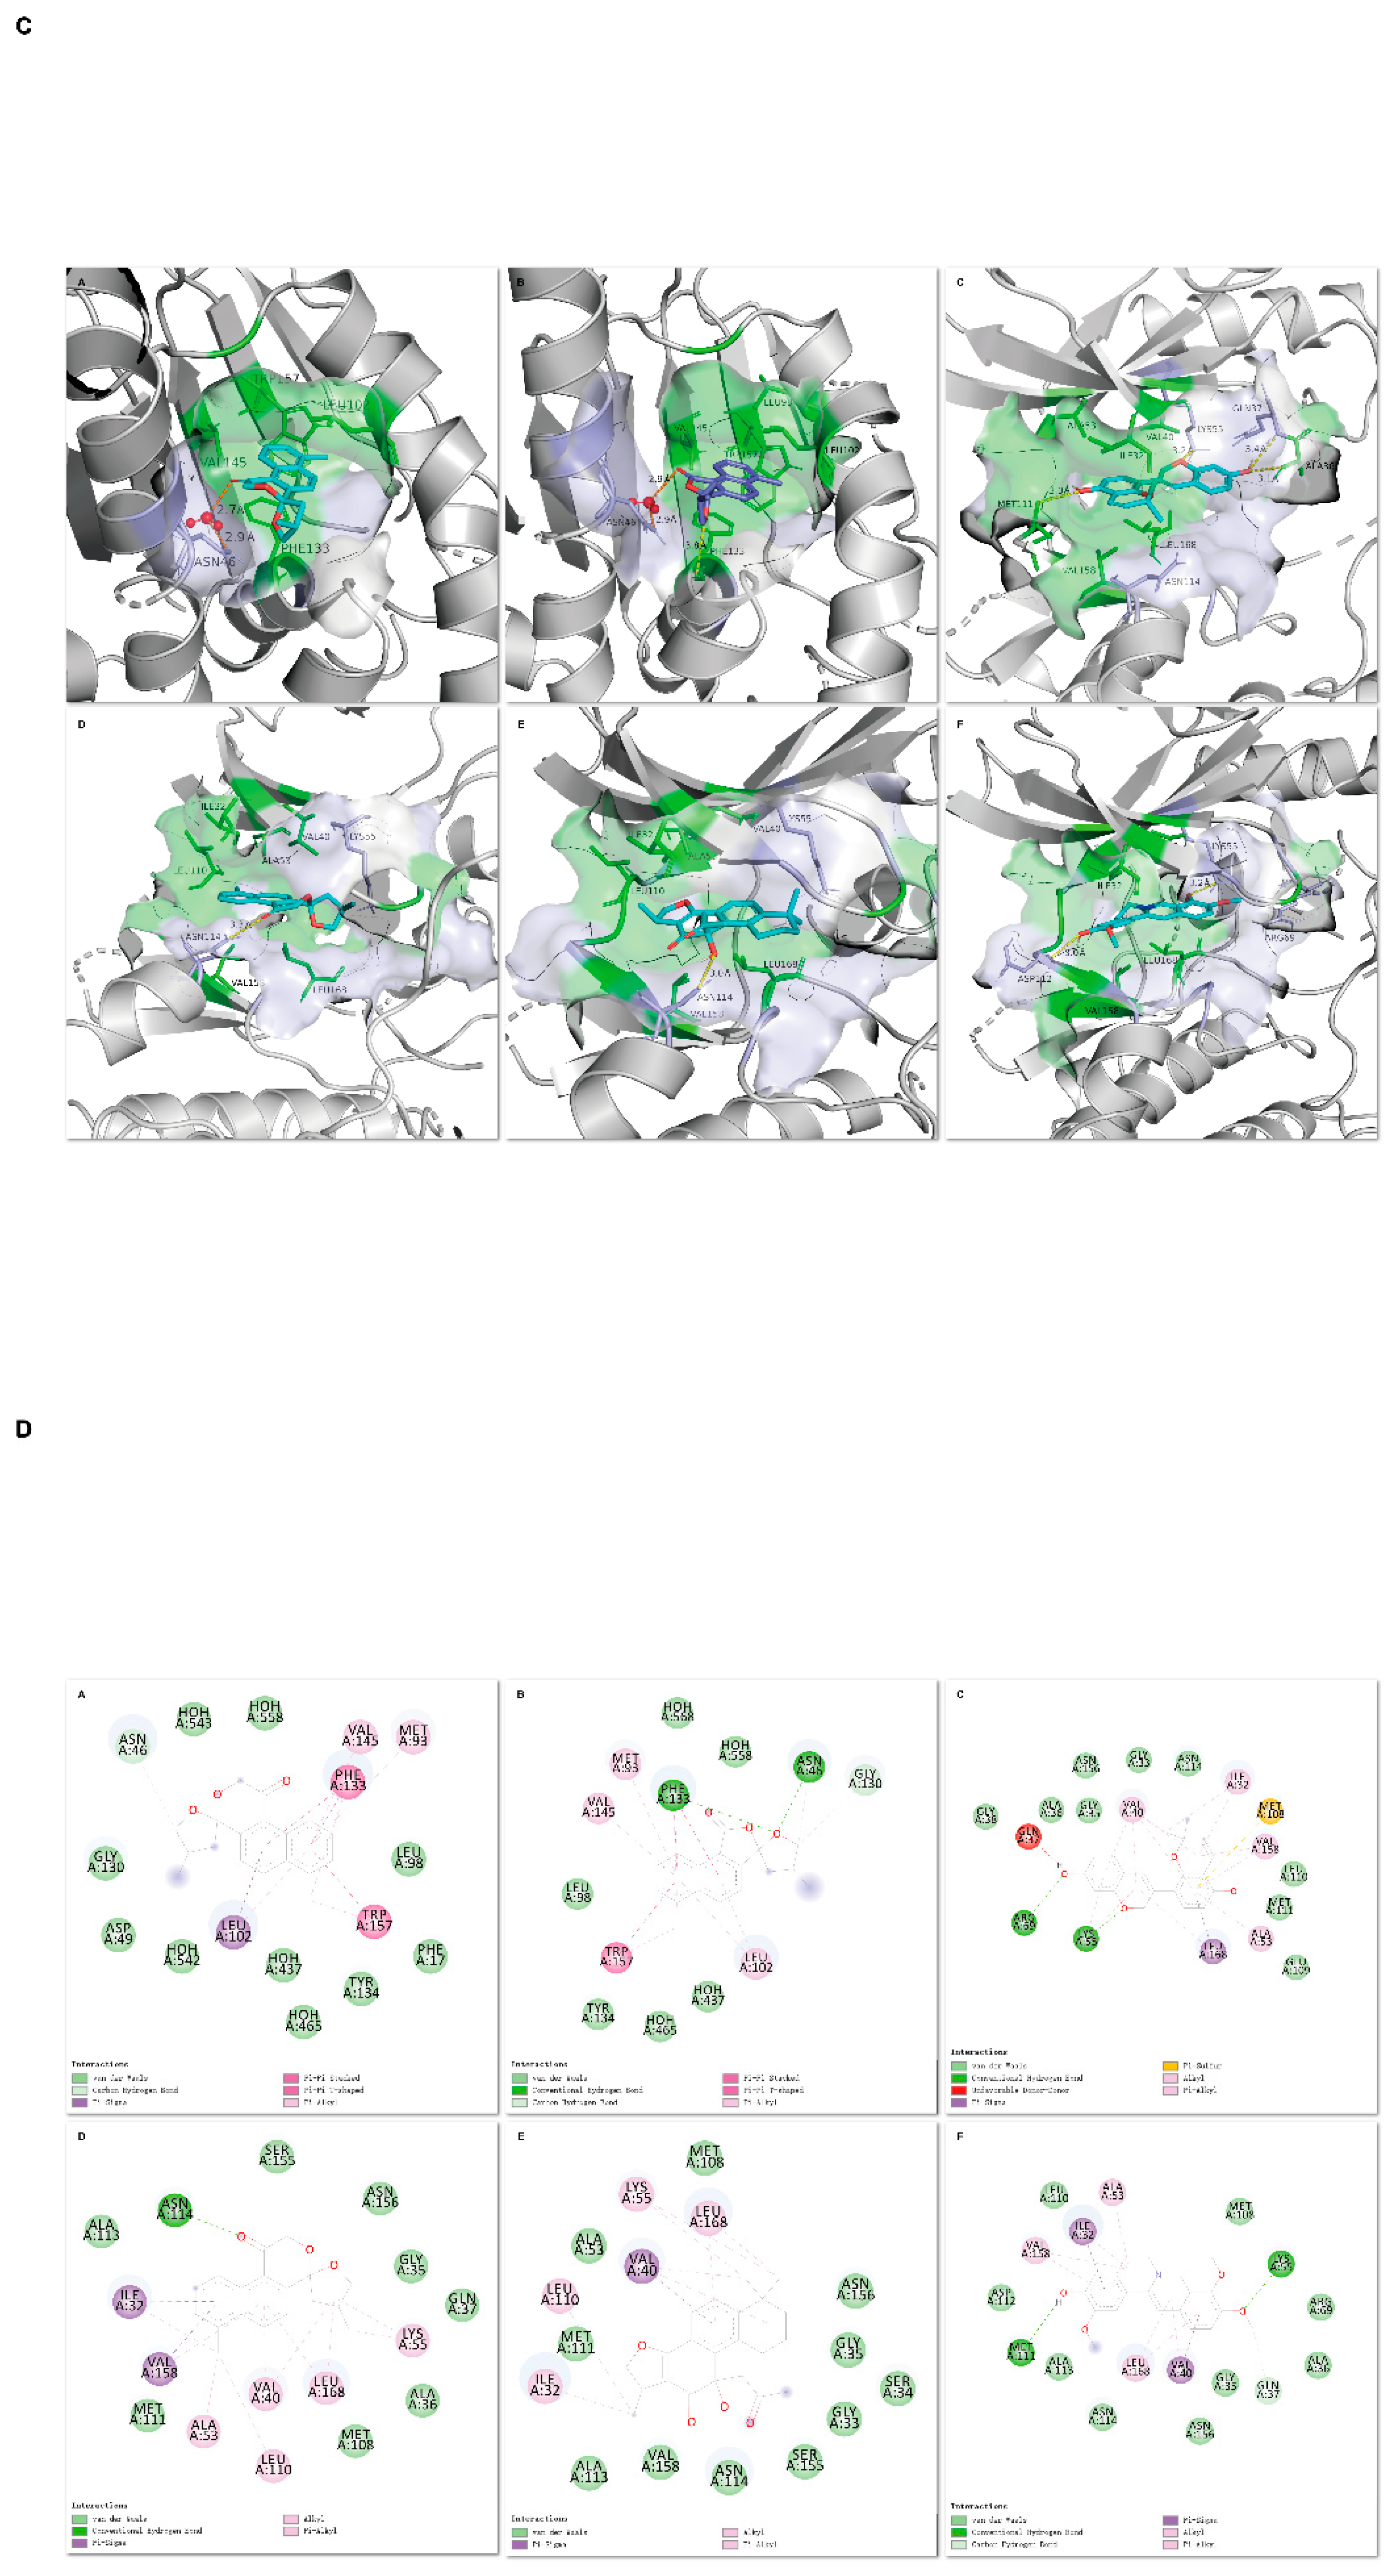
Figure 7.
Molecular dynamics simulation results. (A) Protein backbone RMSD for all six complexes across 3×100 ns trajectories. (B) Ligand RMSD profiles. (C) Protein RMSF profiles; red line=mean. (D) Radius of gyration (Rg) across trajectories. Free energy landscape (FEL) analysis confirmed single dominant energy minima for all six complexes; FEL plots (PC1 vs. PC2) for individual replicates and pooled trajectories are provided in Figure S1.
Figure 7.
Molecular dynamics simulation results. (A) Protein backbone RMSD for all six complexes across 3×100 ns trajectories. (B) Ligand RMSD profiles. (C) Protein RMSF profiles; red line=mean. (D) Radius of gyration (Rg) across trajectories. Free energy landscape (FEL) analysis confirmed single dominant energy minima for all six complexes; FEL plots (PC1 vs. PC2) for individual replicates and pooled trajectories are provided in Figure S1.
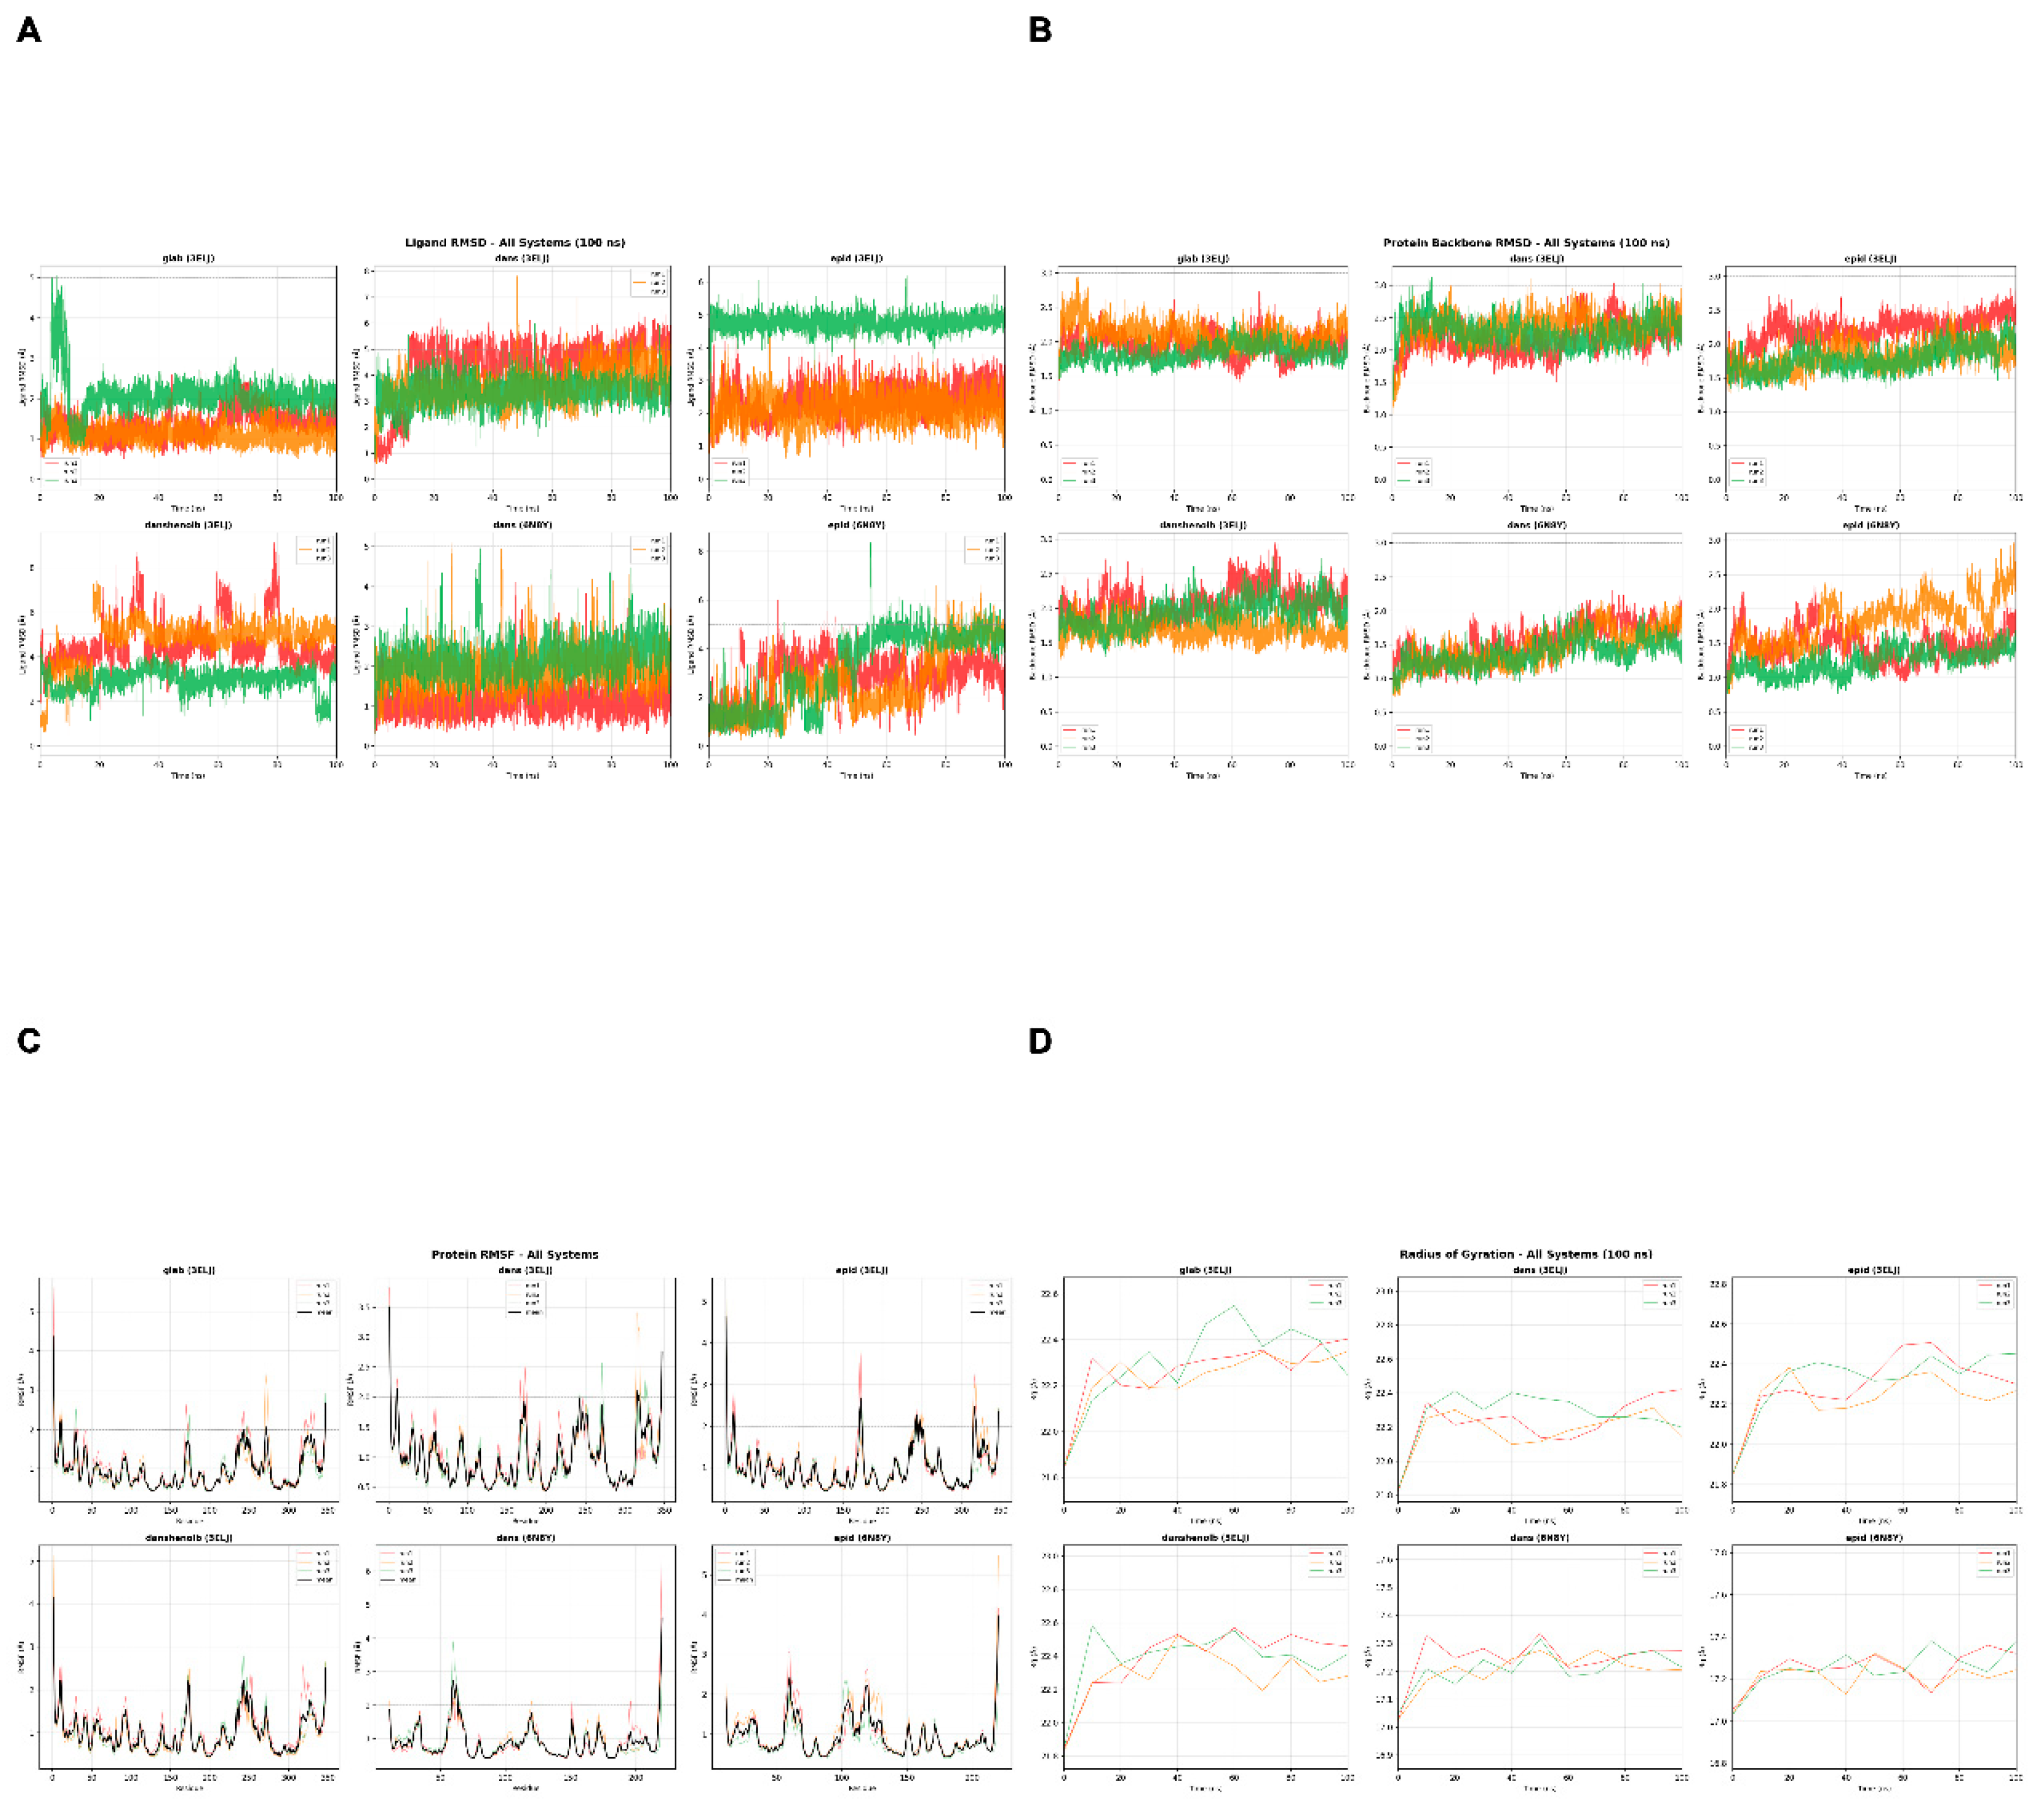
Figure 8.
MM-PBSA binding free energies. (A) Bar chart of ΔGbind (mean±SD) for six complexes from 3×100 ns simulations; dashed line=−8 kcal/mol empirical reference cutoff. (B) Grouped energy component decomposition chart (ΔEvdW, ΔEEEL, ΔEPB, ΔENPOLAR, ΔEDISPER) for all six complexes. (C) Per-complex energy component panels; green=favourable; red=unfavourable contributions.
Figure 8.
MM-PBSA binding free energies. (A) Bar chart of ΔGbind (mean±SD) for six complexes from 3×100 ns simulations; dashed line=−8 kcal/mol empirical reference cutoff. (B) Grouped energy component decomposition chart (ΔEvdW, ΔEEEL, ΔEPB, ΔENPOLAR, ΔEDISPER) for all six complexes. (C) Per-complex energy component panels; green=favourable; red=unfavourable contributions.
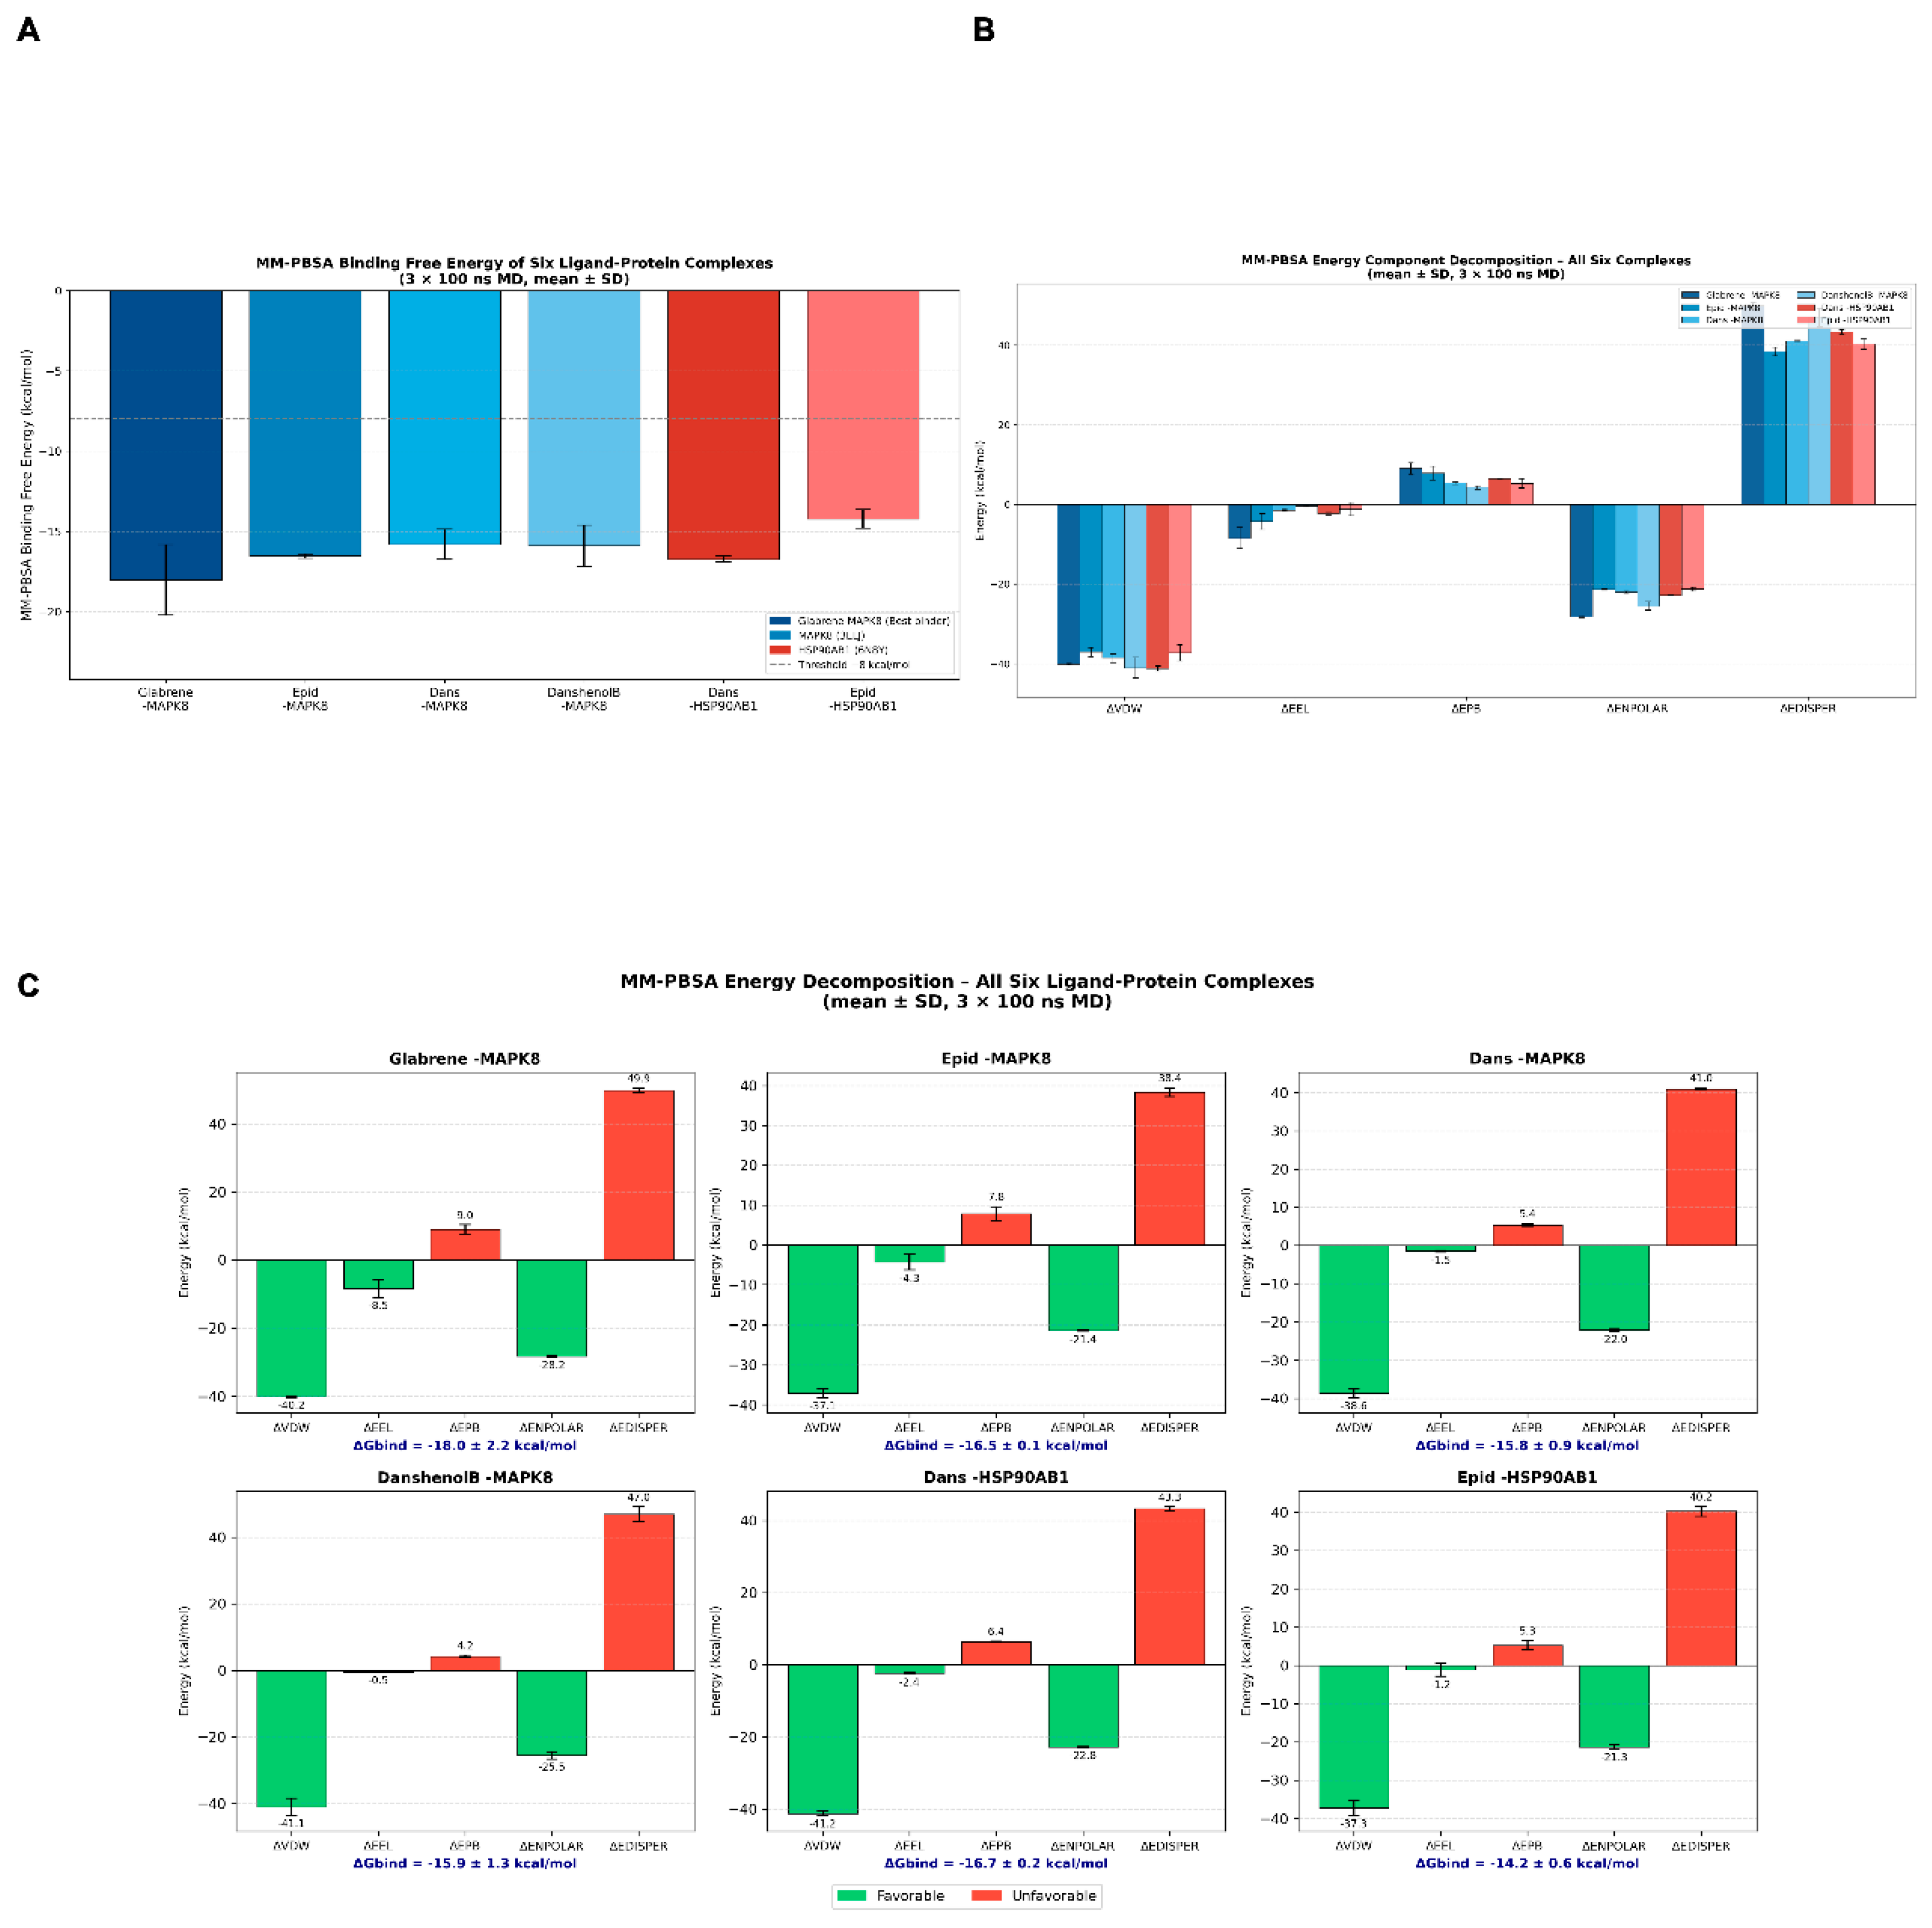

Table 1.
Diagnostic performance of four hub genes in training and independent validation cohorts.
| Gene | Train AUC | Train 95% CI | Val. AUC | Val. 95% CI | RF MDA | logFC (val.) |
|---|---|---|---|---|---|---|
| FOS | 0.768 | 0.705–0.831 | 0.760 | 0.664–0.856 | 27.5 | +0.79 **** |
| HSP90AB1 | 0.717 | 0.652–0.782 | 0.701 | 0.597–0.805 | 17.8 | +0.20 *** |
| HIF1A | 0.678 | 0.610–0.745 | 0.802 | 0.714–0.890 | 23.2 | +0.53 **** |
| MAPK8 | 0.558 | 0.492–0.625 | 0.744 | 0.643–0.845 | 16.5 | −0.16 **** |
** adj. P<0.0001; * adj. P<0.001. AUC, area under the ROC curve; CI, bootstrap 95% confidence interval (2,000 replicates); RF MDA, random forest mean decrease in accuracy; logFC, log₂ fold-change in the GSE167523 independent validation cohort (NAFLD vs. Control, limma BH-corrected).
Table 2.
PLIP-characterised binding interactions of the six selected ligand–protein complexes.
| Complex | Target | ΔG (kcal/mol) | H-bonds | Key residues | Hydrophobic | π–π stack | Tier |
|---|---|---|---|---|---|---|---|
| Danshenspiroketallactone | HSP90AB1 | −11.7 | 0 | — (water bridge) | 4 | 4 | Double |
| Epidanshenspiroketallactone | HSP90AB1 | −11.5 | 1 | Phe133 [2.99 Å] | 5 | 4 | Double |
| Glabrene | MAPK8 | −9.8 | 4 | Ala36, Gln37, Lys55, Met111 | 9 | 0 | Single |
| Danshenol B | MAPK8 | −9.7 | 1 | Asn114 [2.05 Å] | 7 | 0 | Double |
| Danshenspiroketallactone | MAPK8 | −9.7 | 1 | Asn114 [2.26 Å] | 7 | 0 | Double |
| Jatrorrizine | MAPK8 | −9.3 | 3 | Lys55, Asp112, Arg69 (weak) | 4 | 0 | Triple |
Table 3.
MM-PBSA binding free energies of six ligand–protein complexes (mean±SD, 3×100 ns MD).
| Complex | ΔGbind (kcal/mol) | ΔEvdW | ΔEEEL | ΔEPB | ΔENPOLAR | ΔEDISPER |
|---|---|---|---|---|---|---|
| Glabrene–MAPK8 | −18.0 ± 2.2 | −40.2 | −8.5 | +9.0 | −28.2 | +49.9 |
| Epidanshenspiroketallactone–MAPK8 | −16.5 ± 0.1 | −37.1 | −4.3 | +7.8 | −21.4 | +38.4 |
| Danshenspiroketallactone–HSP90AB1 | −16.7 ± 0.2 | −41.2 | −2.4 | +6.4 | −22.8 | +43.3 |
| Danshenspiroketallactone–MAPK8 | −15.8 ± 0.9 | −38.6 | −1.5 | +5.4 | −22.0 | +41.0 |
| Danshenol B–MAPK8 | −15.9 ± 1.3 | −41.1 | −0.5 | +4.2 | −25.5 | +47.0 |
| Epidanshenspiroketallactone–HSP90AB1 | −14.2 ± 0.6 | −37.3 | −1.2 | +5.3 | −21.3 | +40.2 |
Energy components derived from approximately 4,000 snapshots over the final 40 ns of each 100-ns trajectory using gmx_MMPBSA. ΔGbind=ΔEvdW+ΔEEEL+ΔEPB+ΔENPOLAR+ΔEDISPER. Values are mean±SD of three independent 100-ns replicates.
Disclaimer/Publisher’s Note: The statements, opinions and data contained in all publications are solely those of the individual author(s) and contributor(s) and not of MDPI and/or the editor(s). MDPI and/or the editor(s) disclaim responsibility for any injury to people or property resulting from any ideas, methods, instructions or products referred to in the content. |
© 2026 by the authors. Licensee MDPI, Basel, Switzerland. This article is an open access article distributed under the terms and conditions of the Creative Commons Attribution (CC BY) license (http://creativecommons.org/licenses/by/4.0/).
Copyright: This open access article is published under a Creative Commons CC BY 4.0 license, which permit the free download, distribution, and reuse, provided that the author and preprint are cited in any reuse.