

Submitted:
23 July 2026
Posted:
24 July 2026
You are already at the latest version
Abstract
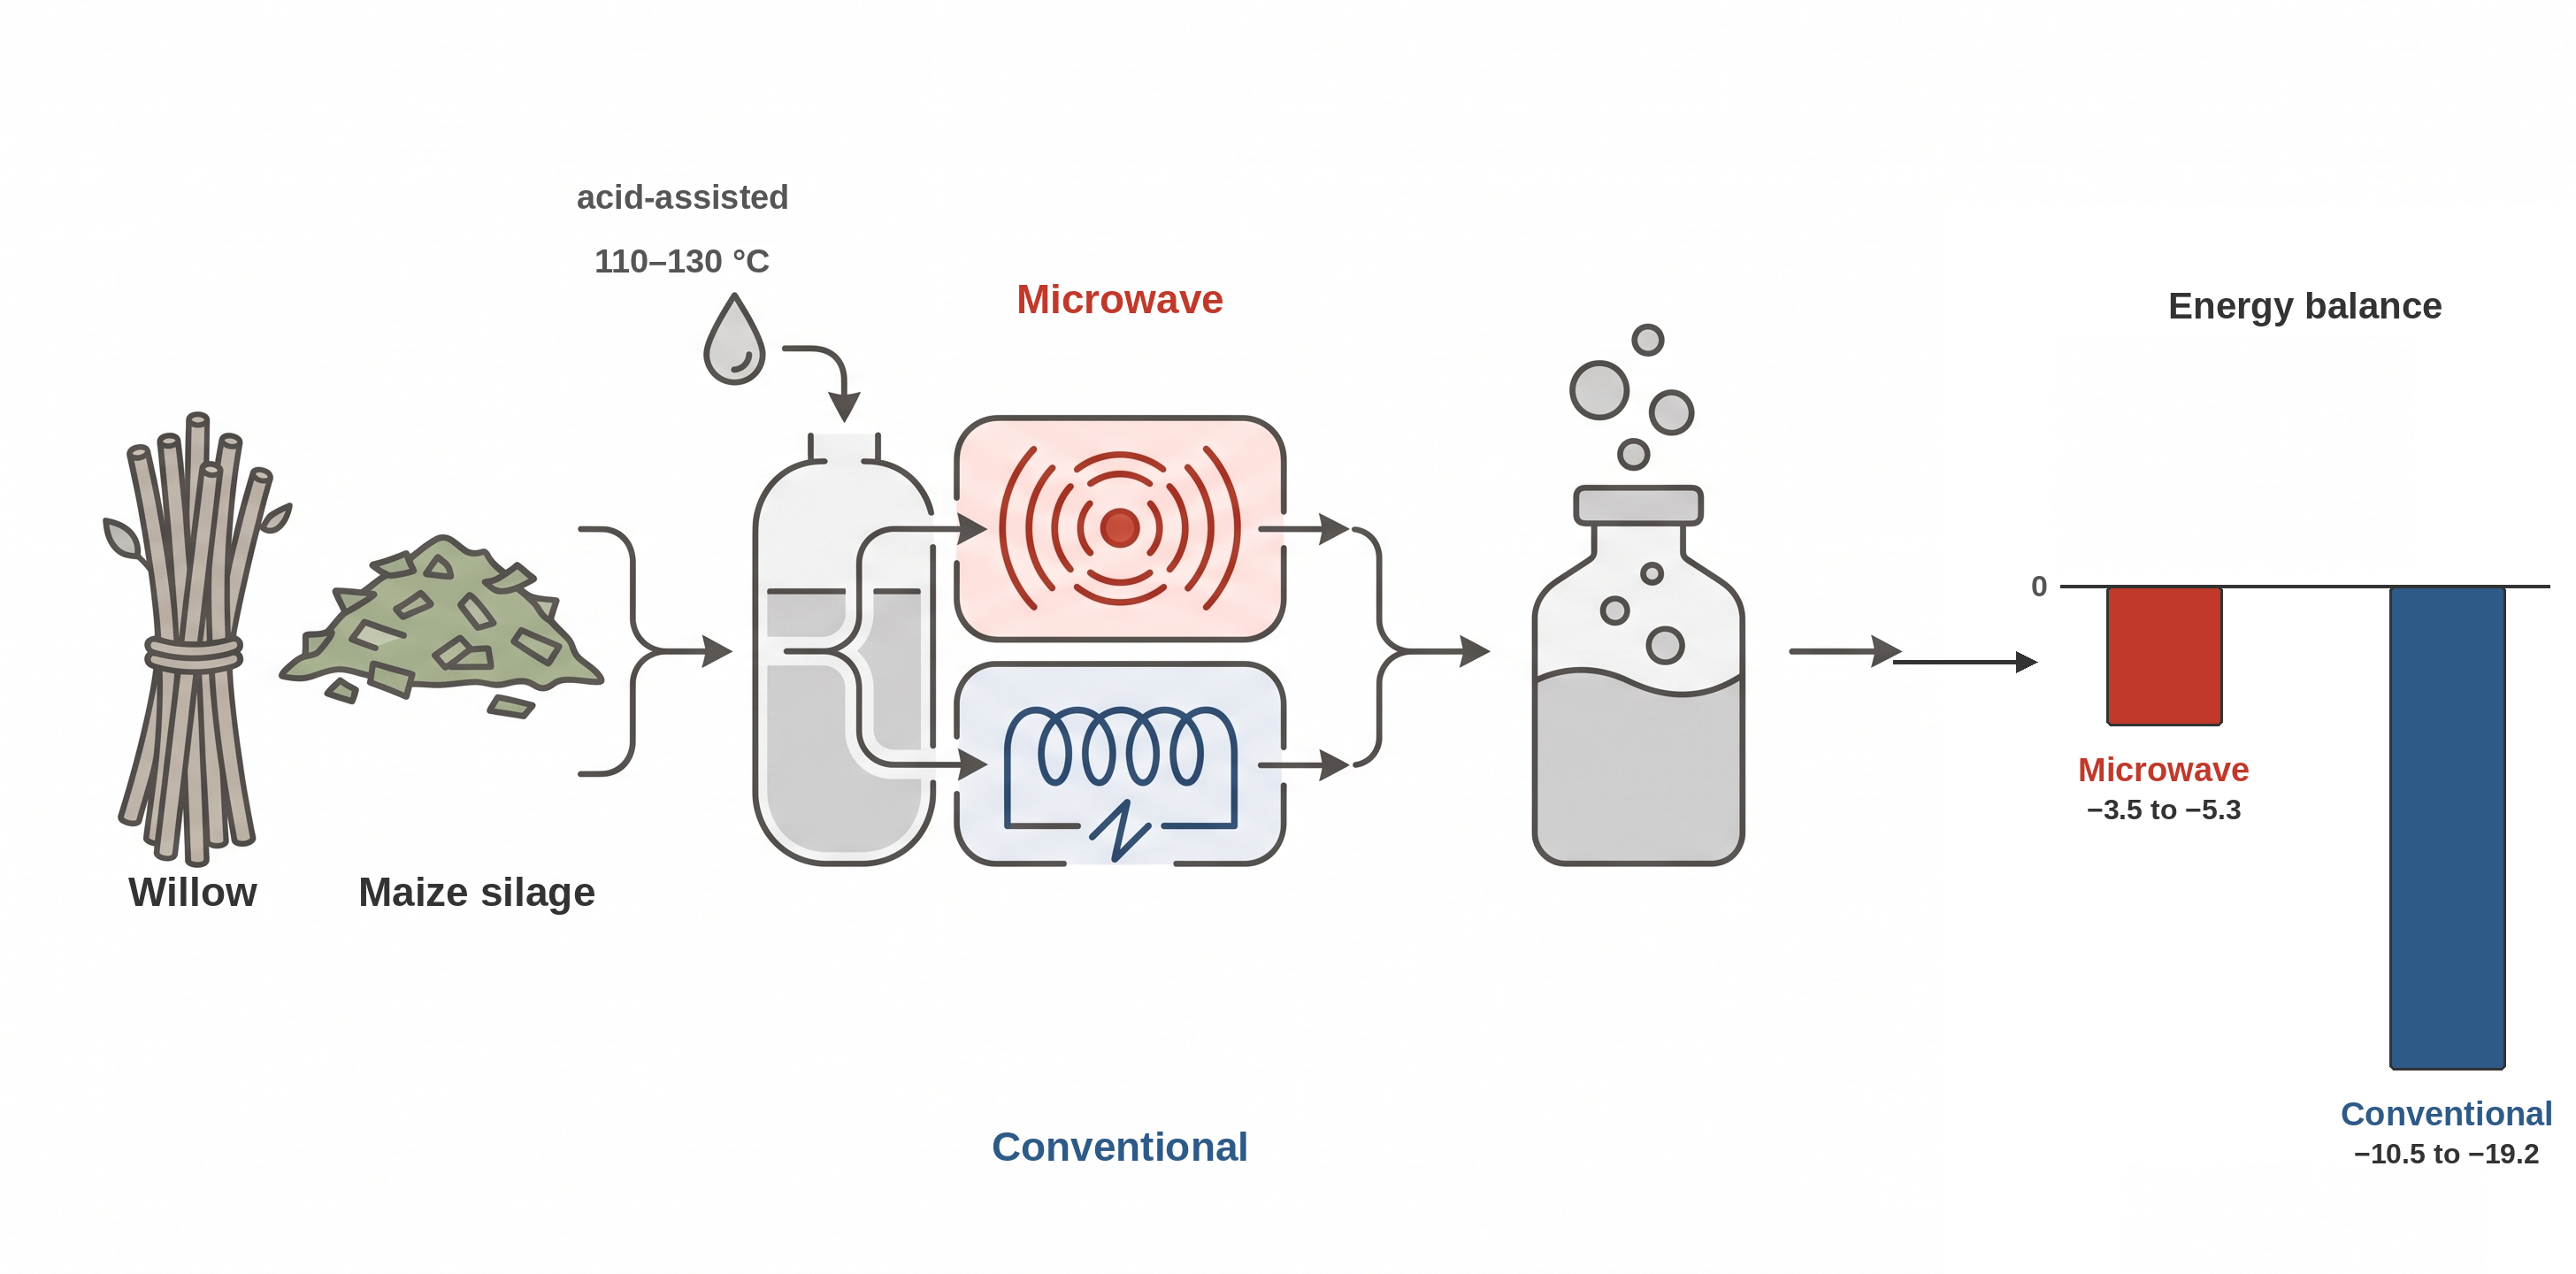
Hydrothermal pretreatment is widely proposed to improve the anaerobic digestibility of lignocellulosic biomass, yet whether it repays its own energy input is rarely quantified. We compare microwave and conventional (conductive) acid-assisted thermohydrolysis of willow (Salix viminalis) and maize silage at 110-130 °C, coupling biochemical methane potential (BMP, n = 3) with an incremental energy balance against an untreated control. Substrate, heating mode and temperature were all significant (p < 0.001), heating mode dominating. Maize silage responded monotonically, reaching 306.0 ± 4.0 NmL CH4 g−1 VS at 130 °C under microwave heating (+31.4%), whereas willow behaved erratically: its best variant reached 310.6 ± 2.5 NmL CH4 g−1 VS (+28.9%), yet two conductively heated variants fell below the control. Furanic by-products stayed at trace levels, well below inhibitory thresholds, excluding toxicity. Critically, no variant recovered its own energy input: every treatment was net-negative, the least unfavourable being microwave heating at 110 °C (-3.57 and -3.48 kJ g−1 DM). Heating mode changed the penalty three- to fivefold, microwave being superior in all six paired comparisons. Under the mild conditions tested, acid-assisted thermohydrolysis is not self-financing in energy terms; where applied for other reasons, microwave heating is the only defensible option.
Keywords:
anaerobic digestion
; biomethane
; microwave pretreatment
; hydrothermal pretreatment
; net energy balance
; lignocellulose
; Salix
; maize silage
1. Introduction
Anaerobic digestion (AD) is a mature route for converting organic matter into biogas and, after upgrading, biomethane, and it is expected to play a growing role in reaching climate-neutrality targets. It remains one of the most practical routes for recovering energy from low-grade lignocellulosic materials, although its efficiency is constrained by the natural recalcitrance of the plant cell wall [1]. Lignocellulosic feedstocks — both woody short-rotation crops such as willow (Salix spp.) and herbaceous silages such as maize silage — are attractive because of their high organic content and land productivity, but their recalcitrant cell-wall structure limits hydrolysis, which is the rate-limiting step of their anaerobic digestion [2,3]. Reported methane potentials illustrate this constraint: untreated willow typically yields on the order of 198–246 NmL CH4 g−1 biomass [2], and woody biomass exceeds 0.25 L CH4 g−1 VS only for the less recalcitrant clones [4], whereas maize silage, being less lignified, reaches roughly 196–402 NmL CH4 g−1 VS depending on variety, ripeness and ensiling [5,6], with the ensiling regime itself further modulating digestibility and gas yield [7]. Individual lignocellulose components exert distinct effects on methane productivity and on the structure of the methanogenic community, so the contrast between willow and maize silage must be read at the level of structural composition and not merely as an effect of the heating technology [8]; within willow itself, fermentation efficiency is tied closely to woody-tissue traits, particularly lignin content [9]. The chemistry of the pretreatment matters more for willow than its severity alone: aqueous ammonia soaking, an alkaline route, raised the methane yield of willow by 94-162% while solubilising almost no sugars (an 8.9% increase in soluble xylose), against 37-41% for wheat straw and 25-27% for miscanthus [10]. This is consistent with the broader observation that pretreatments directed at hemicellulose removal are poorly suited to biogas production, whereas those that remove lignin deliver the highest methane yields, and that part of the response is mediated by a shift in the microbial community rather than by substrate structure alone [11].
A pretreatment step is therefore commonly applied to disrupt the lignocellulosic matrix and accelerate hydrolysis. Current reviews stress that the technological appeal of any pretreatment rests on a trade-off between improved biodegradability on one side and energy cost, reagent consumption and the risk of inhibitor formation on the other [12]. Its effectiveness is, however, strongly substrate-dependent: a recent meta-analysis showed that the methane-yield response to pretreatment is governed by the predominant chemical composition of the feedstock, and that mismatched pretreatments can be non-beneficial or even adverse [13]. This makes side-by-side evaluation on chemically contrasting substrates more informative than single-substrate optimisation.
Hydrothermal pretreatment solubilises hemicellulose and increases substrate accessibility, but its benefit is bounded by severity. For willow sawdust specifically, microwave-assisted liquid hot water treatment raised the methane yield by 42.2% at 215 °C and 48.8% at 230 °C, while enhancing hemicellulose solubilisation and leaving lignin and cellulose largely intact — at the cost of rising furan and organic-acid concentrations [14]. The benefit is thus bounded from both sides: above a temperature threshold, sugar degradation generates furanic (furfural, 5-hydroxymethylfurfural, HMF) and phenolic by-products [3,15]. For lignocellulosic AD these compounds inhibit methanogenesis only above comparatively high concentrations — HMF typically becomes noticeably inhibitory above ~0.2 g L−1 and furfural around 1 g L−1, while phenolic model compounds representative of lignin degradation (gallic and tannic acid) show no inhibition up to 2 g L−1 [16,17] — so at low by-product concentrations the main penalty of over-severe treatment is more plausibly the formation of poorly degradable condensation products than direct inhibition. Hydrothermal pretreatment of Napier grass, for example, gave the highest methane yield at 175 °C but formed HMF and furfural at 200 °C that impaired methanogenesis [3].
Most hydrothermal studies rely on conventional (conductive) heating. Microwave heating is an alternative that delivers rapid, volumetric energy input and may alter the selectivity of solubilisation. Microwave thermohydrolysis has been shown to release more soluble sugars and to raise biogas yield from maize silage relative to conventional heating at matched temperature and duration [18], and microwave pretreatment combined with acids or other chemical agents has been reported to improve the anaerobic degradability of maize silage [19] and of lignocellulosic waste biomass [20]. An independent comparison of convective and microwave hydrothermal pretreatment, including an energy balance, reached the same qualitative conclusion for Napier grass [21]. Each of these studies, however, examines a single substrate. Whether the advantage of microwave heating is general or substrate-specific therefore remains open, and it cannot be settled without a matched comparison across feedstocks of contrasting cell-wall chemistry. Such a comparison — a woody short-rotation crop and a herbaceous silage pretreated under an identical acid-assisted protocol, with full liquid-phase characterisation, biomethane potential and an energy balance evaluated on a common basis — has not been reported.
Accordingly, this study compares microwave and conventional hydrothermal pretreatment of willow and maize silage across matched temperatures (110–130 °C). We hypothesise that microwave heating attains a more favourable energy return than conventional heating at equal temperature through faster, more selective heating, and the response to pretreatment is substrate-specific. The liquid-phase chemistry, biochemical methane potential and the pretreatment energy balance are evaluated jointly to determine whether mild hydrothermal pretreatment is energetically justifiable and, if so, under which heating mode.
2. Materials and Methods
2.1. Feedstock
Two lignocellulosic substrates of contrasting botanical origin were used: chips of common osier (Salix viminalis, willow) and maize silage (Zea mays). Both were characterised for total, mineral and volatile solids. Elemental composition (C, N, H) was determined with a Flash 2000 elemental analyser (Thermo Scientific). Fibre fractions were determined by detergent fractionation using a semi-automatic ANKOM220 fibre analyser, yielding neutral detergent fibre (NDF), acid detergent fibre (ADF) and acid detergent lignin (ADL); cellulose was calculated as ADF − ADL, hemicellulose as NDF − ADF, and lignin was taken as ADL. The characteristics of both feedstocks are summarised in Table 1. The volatile fraction accounted for 94.7% of the willow dry matter and 88.4% of that of the maize silage. After hydration to 90% moisture the willow contained 11.71% TS (11.09% VS of fresh mass) and the maize silage 10.0% TS (8.84% VS of fresh mass).
2.2. Hydrothermal Pretreatment
Substrate preparation followed an identical protocol for both feedstocks. Both substrates were first comminuted to a particle size of 5-10 mm and then hydrated with water to 90% moisture content. A 10% hydrochloric acid solution was then added at a fixed dose of 7% relative to the substrate dry matter, and the mixture was shaken for 60 min at 130 rpm (IKA KS 4000 shaker) to ensure uniform acid distribution before thermal treatment.
Thermohydrolysis was carried out in a purpose-built HL-P reactor operated at fractional-technical scale. The unit comprises two chambers (Figure 1). Pretreatment took place in the upper, thermally insulated chamber, a 2.4 L PTFE vessel charged through a feed hopper and equipped with a motor-driven stirrer. Because PTFE is transparent to microwaves, the same vessel can be heated either by a magnetron or conventionally; the two modes are used alternately and never simultaneously, which is what allows them to be compared on the same charge and in the same vessel. The charge was stirred throughout heating to keep the temperature uniform, and the temperature was measured by a sensor immersed in the biomass rather than at the chamber wall. Pressure was not regulated: it developed autogenously from the vapour pressure of the hydrated charge at the set temperature, and the chamber is rated to 180 °C and approximately 3-4 bar. The unit is controlled from an HMI panel, which allows the target temperature, the ramp time and the holding time to be set. After the holding period the charge is decompressed automatically into the larger lower chamber, which is fitted with a safety valve, a pressure gauge and a solenoid drain valve, and is emptied manually.
Treatments were run under two heating regimes — microwave and conventional (resistive) heating — at three process temperatures (110, 120 and 130 °C) with a holding time of 20 min (Table 2). The acid dose was held constant across all treated variants, so that heating mode and temperature were the only experimental variables. An untreated sample (no acid, no thermal treatment) served as the control. Following the reactor manual, heating is switched off once the set temperature is reached; during the subsequent holding period only stirring operates.
2.3. Liquid- Phase Charecterisation
After pretreatment, the liquid fraction was analysed for chemical oxygen demand (COD) and total phenolics using Hach cuvette tests (LCK 914 and LCK 346, respectively), and for total, inorganic and organic carbon (TC, IC, TOC) with a Shimadzu analyser. Five- and six-carbon sugars (glucose and xylose) were determined in the filtrate with Megazyme Assay Kits.
Furanic by-products (HMF and furfural) were quantified by high-performance liquid chromatography (Sykam system: S 1125 pump, S 5300 sample injector, S 3345 PDA detector, S 4115 column oven) on a Zorbax SB-C18 column (4.6 × 150 mm, Agilent). Separation used a methanol:water (1:1) mobile phase, previously filtered through 0.22 µm membrane filters, at a flow rate of 0.300 mL/min with an injection volume of 20 µL; detection was at 280 nm. Calibration curves were constructed from six dilution levels of a 0.5 g/L standard mixture of furfural and HMF (Sigma-Aldrich), each injected in triplicate (R2 = 0.9998). Samples were stored frozen at −15 °C, thawed, centrifuged for 10 min at 4500 rpm, and the supernatant analysed. All liquid-phase determinations are reported as the mean of three replicates (n = 3).
2.4. Biochemoical Methane Potential
Methane potential was determined in an Automatic Methane Potential Test System (AMPTS II, Bioprocess Control, Sweden), in which carbon dioxide is absorbed before volumetric measurement, so the recorded volume corresponds to methane; the resolution of the volumetric cells was 10 mL. Digestion was mesophilic: the 500 mL bioreactors were held in a water bath at a constant 36 °C and stirred intermittently (30 s every 10 min at 100 rpm). The inoculum was anaerobic sludge obtained from an agricultural biogas plant, with a total solids content of 20.37 mg g−1, of which 13.14 mg g−1 was volatile (organic) and 7.23 mg g−1 mineral. Each bottle had a working volume of 200 mL, comprising the weighed substrate made up to volume with inoculum (8.06 g of willow with 192 mL of inoculum; 10.1 g of maize silage with 190 mL). Both substrates were loaded at an identical organic loading of 0.894 g VS per bottle (4.47 kg VS m−3), corresponding to 8.06 g of hydrated willow (11.09% VS of fresh mass) and approximately 10.1 g of hydrated maize silage (8.84% VS); the difference in weighed mass reflects the different volatile-solids content of the two hydrated substrates. Assays were run against inoculum-only blanks. Each bottle was operated until its daily methane production fell below 5 mL CH4 d−1, in accordance with the manufacturer’s recommendation, so the duration of the assay differed between bottles (6-21 days); maize silage reached this criterion considerably earlier than willow. Methane yield was calculated as net methane production (sample minus inoculum blank) divided by the substrate VS loaded, and is expressed as NmL CH4 g−1 VS. Biogas composition (CH4, CO2) was determined by gas chromatography (Agilent 7890A GC) equipped with a thermal conductivity detector (TCD)
2.5. Energy Balance
The pretreatment energy input was estimated from the rated power of the reactor and the measured time required to reach the set temperature (microwave module 0.9 kW; resistive heater 1.05 kW, confirmed with the manufacturer). Because heating is switched off once the set temperature is reached and only stirring operates during the 20-min holding phase, energy was attributed to the heating phase only. This is a conservative treatment for conventional heating, since any regulator duty during holding would further increase its input. The input was normalised per gram of dry matter (≈ 200 g DM per 2-L charge). The energy output was calculated from the measured methane yield using the lower heating value of methane (35.8 kJ NL−1). Two balances were then derived for each variant. The gross balance was taken as the methane energy of the treated variant minus the pretreatment input. The incremental balance — the metric that answers whether pretreatment is energetically justified — was taken as the additional methane energy relative to the untreated control minus the pretreatment input, since the control yields methane without any energy input. The incremental balance is used throughout as the primary criterion. These values are estimates based on rated power and measured heating time rather than direct wattmeter measurements, and are reported as such.
2.6. Data Analysis
Results are expressed as means ± standard deviation (n = 3). Effects on methane yield were assessed with a three-way factorial analysis of variance (Type II sums of squares) fitted to the treated variants, with substrate, heating mode and temperature as fixed factors and all interactions included. Each treated variant was compared with its untreated control using Dunnett-type two-sided contrasts against the pooled within-variant error, with a multiplicity adjustment across the six comparisons per substrate. Cumulative methane curves were described with the modified Gompertz model, from which the maximum methane potential (Pmax), the maximum production rate (Rm) and the lag phase (λ) were estimated by non-linear least squares. Relationships between liquid-phase composition and methane yield were examined by Pearson correlation across the six pretreated variants of each substrate; the untreated control was excluded, since it received no pretreatment and its liquid-phase composition therefore reflects the feedstock rather than the treatment. The assay followed established recommendations for BMP testing regarding inoculum handling, blanks and substrate-to-inoculum ratio [22]. Analyses were performed in Statistica (version 13, StatSoft/TIBCO Software).
3. Results and Discussion
3.1. Solubilisation and Sugar Release
Hydrothermal treatment markedly increased the release of soluble carbohydrates from both substrates, and the effect intensified with temperature (Table 3, Figure 2). For willow, glucose rose from 14 mg L−1 in the control to 124 mg L−1 after microwave treatment at 130 °C, while xylose — the dominant sugar, reflecting the hemicellulosic origin of the solubilised fraction — increased from 194 to 412 mg L−1 over the same range. Maize silage released more sugar than willow at the highest severity, reaching 174 mg L−1 glucose and 502 mg L−1 xylose at 130 °C under microwave heating, consistent with its less recalcitrant, non-woody matrix.
At matched temperature the heating mode governed the selectivity of solubilisation. Microwave heating consistently released more hemicellulosic xylose than conventional heating, most clearly at low severity: for willow at 110 °C, xylose reached 361 mg L−1 under microwave versus 208 mg L−1 under conventional heating. Soluble COD followed the same monotonic rise with temperature and was substantially higher for maize silage (19.1 → 37.5 g O2 L−1) than for willow (10.2 → 14.7 g O2 L−1), indicating a larger pool of dissolved organic matter released from the silage
3.2. Formation of by-Products
Furanic by-products remained at trace levels throughout (Table 3, Figure 3a-d). HMF did not exceed 0.92 mg/L in any variant: it rose from 0.04 mg/L in the untreated willow control to 0.62 mg/L after microwave treatment at 130 °C, and from 0.19 to 0.92 mg/L for maize silage over the same range. Furfural behaved differently between the two substrates — in maize silage it increased steadily with severity, from 2.01 mg/L in the control to 8.29 mg/L at 130 °C under microwave heating, whereas in willow it was highest in the untreated control (0.26 mg/L) and fell below the limit of quantification in all microwave-treated variants.
These concentrations are two to three orders of magnitude below the levels reported to inhibit methanogenesis (HMF above approximately 0.2 g/L, furfural around 1 g/L, and phenolic model compounds of lignin origin showing no inhibition up to 2 g/L [16]). The highest furfural concentration measured here (8.29 mg/L, i.e. 0.0083 g/L) is about 120 times below its inhibitory threshold, the highest HMF (0.92 mg/L) roughly 200 times below, and the highest phenolics concentration (159.9 mg/L) more than twelve times below. Direct inhibitor toxicity can therefore be excluded as a factor controlling the methane yields reported in this study.
Total phenolics followed opposite trends in the two feedstocks (Figure 3e,f). In maize silage they rose with temperature, from 112.3 mg/L in the control to 159.9 mg/L at 130 °C under microwave heating, as expected from progressive lignin depolymerisation. In willow they did the reverse: the untreated control carried the highest phenolic load of the entire study (190.0 mg/L), and every treated variant fell below it, down to 80.0 mg/L after conductive heating at 130 °C.
Taken together with the furfural data, this pattern is best explained by condensation chemistry rather than by a failure of the pretreatment to mobilise phenolics. Willow is naturally rich in water-extractable phenolics — Salix species accumulate salicylates and phenolic glycosides — which accounts for the high concentration leached by the untreated control without any thermal or acid treatment [23]. Under acidic thermal conditions such phenolics are known to repolymerise and to condense with furanic aldehydes, yielding insoluble humins and pseudo-lignin that deposit on the solid residue [3,15,17]. Such a sink would remove phenolics and furfural from the liquid phase simultaneously, which is precisely what is observed: willow phenolics fell by 32-58% relative to the control while furfural fell from 0.26 mg/L to below the limit of quantification, even though 361-412 mg/L of xylose had been released and was available for dehydration. Maize silage, whose untreated control carried a much lower native phenolic load, shows the opposite behaviour, with both phenolics and furfural accumulating as severity increases. The two substrates therefore differ not only in how much they solubilise but in the fate of what is solubilised.
3.3. Biochemical Methane Potential
Because both substrates were digested at an identical organic loading, their methane yields are directly comparable (Figure 4, Table 3). The factorial analysis resolved all three main effects (p < 0.001 for substrate, heating mode and temperature; R2 = 0.993, residual SD = 3.21 NmL CH4 g−1 VS). The heating mode carried by far the largest effect (F = 1137), and the three-way interaction was also significant (F = 396, p < 0.001), indicating that the pattern of response to heating mode and temperature differs fundamentally between the two feedstocks.
Maize silage responded in an orderly manner. Every treated variant equalled or exceeded the untreated control (232.9 ± 3.1 NmL CH4 g−1 VS), microwave heating surpassed conductive heating at every temperature, and yields rose monotonically with temperature under both modes, reaching 306.0 ± 4.0 NmL CH4 g−1 VS at 130 °C under microwave heating (+31.4%, p < 0.001). All contrasts against the control were significant except conductive heating at 110 °C (+3.5%, not significant).
Willow behaved erratically. Its highest yield, 310.6 ± 2.5 NmL CH4 g−1 VS, was obtained by microwave heating at 130 °C (+28.9%, p < 0.001), and conductive heating at 120 °C also improved the yield markedly (284.9 ± 2.5; +18.2%, p < 0.001). Microwave heating at 110 °C also raised the yield significantly (263.1 ± 2.2; +9.1%, p < 0.001). However, two variants fell significantly below the untreated control (241.1 ± 5.7): conductive heating at 110 °C (198.4 ± 3.3; −17.7%, p < 0.001) and at 130 °C (222.8 ± 1.3; −7.6%, p < 0.001), while microwave heating at 120 °C was indistinguishable from the control. Mild acid-assisted thermohydrolysis of this recalcitrant woody substrate can therefore reduce the methane yield as readily as it increases it, and the outcome is not a monotonic function of severity. Yield losses under acid-assisted thermal treatment have been reported before: in wheat straw, thermal-sulfuric acid pretreatment lowered the methane yield by 29-44% relative to the untreated control, an effect attributed there to furfural and HMF accumulation [24]. The present case differs mechanistically, since the furanic concentrations measured here remain two to three orders of magnitude below inhibitory levels (Section 3.2), which points to the loss of degradable carbon into condensation products rather than to inhibitor toxicity.
The measured values correspond to 48-75% of the theoretical maximum for carbohydrate substrates (415 NmL CH4 g−1 VS by the Buswell relationship), i.e. within the range physically attainable for partially lignified biomass. The methane content of the biogas, expressed as CH4/(CH4+CO2), was comparable across all variants (67-71%), so the differences in potential reflect the extent of substrate conversion rather than gas quality. The yields are consistent with reported potentials for willow (approximately 198-246 NmL CH4 g−1 biomass) [2] and maize silage (approximately 196-402 NmL CH4 g−1 VS) [5,6].
An unexpected outcome is that the two substrates delivered comparable methane potentials from their untreated controls despite markedly different composition — willow contained 13.2% lignin and 43.9% cellulose against 10.3% and 7.7% recorded for maize silage — the controls differing by only 3.5% (241.1 versus 232.9 NmL CH4 g−1 VS). What separated the substrates was not the ultimate yield but the rate at which it was reached (Section 3.5).
3.4. Linking Liquid-Phase Chemistry to Methane Yield
Rising soluble sugar concentrations with temperature did not translate into proportional methane gains, and for willow the highest-severity variants did not maximise yield (Figure 5). A comparison of several physicochemical pretreatments applied to a single corn stover feedstock under identical digestion conditions likewise found that the greatest organic-matter solubilisation did not correspond to the greatest methane yield [25]. Because furanic and phenolic by-products remained two to three orders of magnitude below inhibitory thresholds (Section 3.2), this ceiling cannot be attributed to toxicity. It is instead consistent with the limited additional bioaccessibility gained under mild conditions and with the formation of poorly degradable condensation products. For willow the liquid-phase data provide direct evidence for the latter: phenolics and furfural both disappeared from solution as severity increased (Section 3.2), which is the expected signature of repolymerisation into humins and pseudo-lignin on the solid residue. That the two willow variants with the lowest methane yields (conductive heating at 110 and 130 °C, both significantly below the untreated control) were also those with the lowest residual phenolic concentrations is consistent with this interpretation, although the present design cannot establish the link causally. Microwave irradiation has been shown to disrupt the lignocellulosic structure of corn straw and release cellulose, hemicellulose and their derivatives, with the effect confirmed by SEM, FTIR and XRD and a methane gain of up to 73.1% [26]. The more selective hemicellulose solubilisation achieved under microwave heating — higher xylose release at comparable HMF formation — is consistent with its generally higher or comparable methane yields relative to conventional heating.
3.5. Methane Production Kinetics
The modified Gompertz model described the cumulative curves well for every variant (Figure 6; R2 = 0.979-0.996; Table 4). The most striking difference between the substrates lies in the production rate rather than in the potential: the maximum rate reached 75-112 NmL CH4 g−1 VS d−1 for maize silage against only 10.9-22.4 NmL CH4 g−1 VS d−1 for willow, a five- to eightfold difference. Maize silage consequently approached its plateau within about a week, whereas willow was still producing methane at the end of the assay. This distinction is of direct practical relevance, because the retention time — and hence the digester volume — is governed by the rate, not by the ultimate potential.
Within each substrate, microwave heating raised the maximum rate for willow (up to 22.4 against 10.9-17.2 NmL CH4 g−1 VS d−1 under conductive heating), consistent with its higher yields. For maize silage the rate was already high in the untreated control (112.4 NmL CH4 g−1 VS d−1) and pretreatment did not accelerate it further; the benefit for this substrate lay in the extent of conversion rather than its rate. The lag phase was effectively absent in all variants (λ ≤ 0.4 d), which independently corroborates the absence of inhibition inferred from the by-product concentrations (Section 3.2).
One consequence of the differing kinetics deserves emphasis. For willow, the Gompertz Pmax exceeded the measured 21-day yield by roughly 20-25% (for example 300.9 against 241.1 NmL CH4 g−1 VS for the control), indicating that the assay was terminated before this substrate had fully plateaued and that its methane potential is therefore somewhat underestimated. For maize silage the two agreed closely (226.6 against 232.9), confirming that the assay duration was sufficient. Since the truncation applies equally to all willow variants, the comparisons between heating modes and temperatures remain valid, but the absolute willow values should be read as conservative.
3.6. Net Energy Balance of the Pretreatment
The energy assessment is the decisive result of this study (Table 5, Figure 7). The criterion applied here follows the principle that a pretreatment is justified only when its energy balance is positive [27]. This threshold is not arbitrary: an energy assessment of thermal and microwave pretreatments concluded that treatments below 100 °C tend to return a positive energy balance, whereas those at or above 100 °C generally do not [28]. The present temperature window (110-130 °C) lies entirely above that threshold. Microwave heating reached the set temperatures in roughly half the time of conventional heating and consequently required 2-3 times less input energy; at 120 °C, for instance, the input was 5.40 kJ g−1 DM under microwave heating versus 17.64 kJ g−1 DM under conductive heating.
The decisive comparison, however, is not the gross methane energy of a treated variant but the additional methane it delivers relative to an untreated control, which requires no energy input at all. On this incremental basis, no variant tested here recovered its own energy input. The additional methane energy gained through pretreatment was modest — at most +2.36 kJ g−1 DM (willow, microwave 130 °C) and +2.32 kJ g−1 DM (maize silage, microwave 130 °C) — while the lowest input required was 4.32 kJ g−1 DM. Every variant was therefore net-negative, the least unfavourable being microwave heating at 110 °C for both willow (-3.57 kJ g−1 DM) and maize silage (-3.48 kJ g−1 DM). For two willow variants treated conductively the additional methane energy was itself negative (-1.45 and -0.62 kJ g−1 DM at 110 and 130 °C), i.e. pretreatment reduced rather than increased the recoverable energy).
The heating mode nonetheless remains decisive, because it changes the magnitude of the penalty three- to fivefold. Microwave variants clustered between -3.5 and -5.3 kJ g−1 DM, whereas conductive heating fell between -10.5 and -19.2 kJ g−1 DM — microwave heating was superior in all six paired comparisons. Since the methane gain achieved by the two heating modes was of comparable magnitude, this difference is driven almost entirely by the input side. Importantly, this comparison is insensitive to the normalisation of the methane data: the incremental methane term is identical for both heating modes at a given temperature, so the ranking of heating modes depends only on the measured heating energy.
The dissociation between yield and energy return is instructive. For both substrates the highest-yielding variant was microwave heating at 130 °C, yet the least unfavourable energy balance was obtained at 110 °C, because the additional methane gained between 110 and 130 °C did not cover the additional heating energy. Conductive heating at 120 °C illustrates the point more sharply still: for willow it delivered the second-highest yield of the study (284.9 NmL CH4 g−1 VS, +18.2%) at an incremental cost of -16.15 kJ g−1 DM, four to five times worse than any microwave variant. Optimising pretreatment on methane yield alone would therefore select the wrong operating point on both counts — the wrong temperature and, more importantly, the wrong heating technology. The practical implication is that mild acid-assisted thermohydrolysis cannot be justified on energy grounds alone; if it is applied for other reasons — most plausibly to exploit the five- to eightfold faster kinetics of maize silage or to shorten the retention time of willow — microwave heating is the only mode for which the penalty remains within a plausible trade-off.
Two qualifications are important and strengthen rather than weaken this conclusion. First, the input estimate is conservative for conventional heating, since the energy consumed by the temperature regulator during the holding phase was excluded; the real balance of conductive heating is therefore likely to be worse than reported. Second, on a strict net-energy basis the untreated control, which requires no energy input, returned more energy than any pretreated variant, because the methane gain achievable under mild conditions was too small to offset even the low microwave input. The practical message is therefore not that pretreatment maximises net energy under these conditions, but that if hydrothermal pretreatment is applied, microwave heating reduces the penalty to a plausible margin whereas conductive heating multiplies it, so microwave is the only defensible mode even though neither returns a net energy gain under these conditions.
Since all treatment variants showed a negative net energy balance, it is necessary to determine which changes could enable recovery of the energy used for pretreatment. At a moisture content of 90%, a 2 L charge contains 1.8 kg of water and only 0.2 kg of dry matter; therefore, most of the energy is used to heat the water. The minimum heat required to raise the charge from ambient temperature to 110, 120, and 130°C is 3.52, 3.91, and 4.30 kJ·g−1 DM, respectively (Table 6).
Comparison of these values with the measured energy consumption confirms the advantage of microwave heating. The ratio of the thermodynamic minimum to the actual energy input was 82%, 72%, and 57% at the respective temperatures, which is consistent with the device specification of a 0.9 kW power draw and 800 W microwave output. For conventional heating, this ratio was only 22–33%, mainly because of heat losses through the reactor walls. The decrease in microwave heating efficiency from 82% to 57% with increasing temperature resulted from the longer heating time and greater energy losses. This indicates that the energy consumption of the microwave treatment was already close to the thermodynamic minimum.
A second option for improving the balance is to increase methane yield, although this is limited by stoichiometry. Assuming the Buswell value of 415 NmL CH4·g−1 VS as the maximum theoretical limit, the greatest possible increase in energy relative to the untreated control is 5.90 kJ·g−1 DM for willow and 5.76 kJ·g−1 DM for maize silage. At 130°C, however, the microwave energy input alone was 7.56 kJ·g−1 DM. Therefore, treatment at this temperature could not achieve a positive energy balance even with complete substrate conversion. At 110 and 120°C, a positive balance would theoretically be possible, but it would require conversion close to the stoichiometric maximum, which is unlikely for partially lignified biomass.
The greatest potential therefore lies in increasing the dry matter content of the charge. Since the energy input per gram of dry matter decreases as the solids concentration increases, energy break-even would be reached at approximately 28% DM for maize silage treated with microwaves at 120°C, approximately 33% DM at 130°C, and approximately 32% DM for willow treated at 130°C. This is particularly relevant because the raw maize silage contained 33% DM. The negative balance therefore resulted primarily from diluting the charge to a moisture content of 90%, rather than from the heating process itself.
A similar effect could be achieved by recovering 65–80% of the thermal energy, for example from the steam released during decompression. Another option is to recover the energy contained in the liquid phase. Anaerobic digestion of the hydrolysate generated during microwave-assisted hydrothermal pretreatment as a co-substrate, instead of discarding it, may increase the overall energy gain of the process [29]. In the present balance, the soluble sugars, organic acids, and phenolic compounds released into the liquid phase (Section 3.2) were included only to the extent that they were digested together with the solid fraction.
4. Conclusion
Microwave and conventional acid-assisted thermohydrolysis of willow and maize silage were compared under matched conditions and at an identical organic loading, combining liquid-phase characterisation and biochemical methane potential with an energy balance of the pretreatment step. A three-way factorial analysis resolved substrate, heating mode and temperature, with the heating mode carrying the largest effect and a significant three-way interaction: maize silage responded in an orderly manner, rising monotonically to +31.4% over the untreated control, whereas the more recalcitrant willow responded erratically, gaining up to +28.9% in its best variant yet falling significantly below the control in two conductively heated ones. Gompertz fits showed the substrates to differ five- to eightfold in maximum methane rate rather than in ultimate potential, with no lag phase in any variant. Furanic and phenolic by-products remained two to three orders of magnitude below reported inhibitory thresholds, so the yield ceiling is attributed to limited additional bioaccessibility and to condensation products rather than to inhibitor toxicity.
Expressed incrementally against an untreated control — the only basis on which the question can properly be answered — none of the treatments repaid its own energy input. The additional methane energy never exceeded 2.4 kJ g−1 DM, while the cheapest pretreatment cost 4.3 kJ g−1 DM. Under the mild conditions studied, acid-assisted thermohydrolysis is therefore not self-financing in energy terms, and reporting only the gross energy of the treated stream would have obscured this.
The heating mode nonetheless governs the magnitude of the penalty. Microwave heating reached the target temperatures with 2-3 times less energy and confined the incremental deficit to between -3.5 and -5.3 kJ g−1 DM, against -10.5 to -19.2 kJ g−1 DM for conductive heating, and was superior in all six paired comparisons; for both substrates the highest-yielding variant (130 °C) was not the one with the best energy return (110 °C). Where pretreatment is applied for reasons other than energy return — shorter retention time, smaller digester volume, or co-production of fermentable sugars — microwave heating is the only defensible option, and conductive heating cannot be recommended for either substrate.
Author Contributions
Conceptualization, A.N. and M.Z.; methodology, A.N. and M.Z.; validation, A.N.; formal analysis, A.N, M.D.; investigation, writing—original draft preparation, A.N.; writing—review and editing, A.N.; visualization, A.N..; supervision, M.Z. All authors have read and agreed to the published version of the manuscript.
Funding
This study was part of the project “Development of pretreatment technology for lignocellulosic biomass in context to second generation biofuel production”, carried out under the LIDER XIII programme and financed by the National Centre for Research and Development, grant no. LIDER 13/0050/2022. Co-financing amount: PLN 1,410,000.00.
Data Availability Statement
The data presented in this study are available on request from the corresponding author.
Acknowledgments
During the preparation of this work, the authors used an AI-based assistant (Claude, Anthropic) to support translation, language editing, and the preparation of the graphical abstract. After using this tool, the authors reviewed and edited the content as necessary and take full responsibility for the content of the publication.
Conflicts of Interest
The authors declare no conflicts of interest.
References
- Kamperidou, V.; Terzopoulou, P. Anaerobic digestion of lignocellulosic waste materials. Sustainability 2021, 13, 12810. [Google Scholar] [CrossRef]
- Ohlsson, J.A.; Harman-Ware, A.E.; Sandgren, M.; Schnurer, A. Biomass recalcitrance in willow under two biological conversion paradigms: enzymatic hydrolysis and anaerobic digestion. BioEnergy Res. 2020, 13, 260–270. [Google Scholar] [CrossRef]
- Phuttaro, C.; Sawatdeenarunat, C.; Surendra, K.C.; Boonsawang, P.; Chaiprapat, S.; Khanal, S.K. Anaerobic digestion of hydrothermally-pretreated lignocellulosic biomass: influence of pretreatment temperatures, inhibitors and soluble organics on methane yield. Bioresour. Technol. 2019, 284, 128–138. [Google Scholar] [CrossRef] [PubMed]
- Turick, C.E.; Peck, M.W.; Chynoweth, D.P.; Jerger, D.E.; White, E.H.; Zsuffa, L.; Kenney, W.A. Methane fermentation of woody biomass. Bioresour. Technol. 1991, 37, 141–147. [Google Scholar] [CrossRef]
- Gao, R.; Yuan, X.; Zhu, W.; Wang, X.; Chen, S.; Cheng, X.; Cui, Z. Methane yield through anaerobic digestion for various maize varieties in China. Bioresour. Technol. 2012, 118, 611–614. [Google Scholar] [CrossRef] [PubMed]
- Pilarski, K.; Pilarska, A.A.; Pietrzak, M.B.; Iglinski, B. Bioenergy from maize silage by anaerobic digestion: batch kinetics in relation to biochemical composition. Energies 2026, 19, 1105. [Google Scholar] [CrossRef]
- Kupryaniuk, K.; Witaszek, K.; Vaskina, I.; Filipek-Kazmierczak, S.; Kupryaniuk, J.; Solowiej, P.; Dach, J. The effect of corn ensiling methods on digestibility and biogas yield. Energies 2025, 18, 188. [Google Scholar] [CrossRef]
- Pokoj, T.; Klimiuk, E.; Bulkowska, K.; Kowal, P.; Ciesielski, S. Effect of individual components of lignocellulosic biomass on methane production and methanogen community structure. Waste Biomass Valorization 2020, 11, 1421–1433. [Google Scholar] [CrossRef]
- Dudits, D.; Cseri, A.; Torok, K.; Sass, L.; Zombori, Z.; Ferenc, G.; Poor, P.; Borbely, P.; Czekus, Z.; Vankova, R.; Dobrev, P.; Szanto, J.; Bagi, Z.; Kovacs, K.L. Triploid hybrid vigor in above-ground growth and methane fermentation efficiency of energy willow. Front. Plant Sci. 2022, 13, 770284. [Google Scholar] [CrossRef] [PubMed]
- Jurado, E.; Gavala, H.N.; Skiadas, I.V. Enhancement of methane yield from wheat straw, miscanthus and willow using aqueous ammonia soaking. Environ. Technol. 2013, 34, 2069–2075. [Google Scholar] [CrossRef] [PubMed]
- Mirmohamadsadeghi, S.; Karimi, K.; Azarbaijani, R.; Parsa Yeganeh, L.; Angelidaki, I.; Nizami, A.-S.; Bhat, R.; Dashora, K.; Vijay, V.K.; Aghbashlo, M.; Gupta, V.K.; Tabatabaei, M. Pretreatment of lignocelluloses for enhanced biogas production: a review on influencing mechanisms and the importance of microbial diversity. Renew. Sustain. Energy Rev. 2021, 135, 110173. [Google Scholar] [CrossRef]
- Khan, M.U.; Usman, M.; Ashraf, M.A.; Dutta, N.; Luo, G.; Zhang, S. A review of recent advancements in pretreatment techniques of lignocellulosic materials for biogas production: opportunities and limitations. Chem. Eng. J. Adv. 2022, 10, 100263. [Google Scholar] [CrossRef]
- Anacleto, T.M.; Kozlowsky-Suzuki, B.; Bjorn, A.; Shakeri Yekta, S.; Masuda, L.S.M.; de Oliveira, V.P.; Enrich-Prast, A. Methane yield response to pretreatment is dependent on substrate chemical composition: a meta-analysis on anaerobic digestion systems. Sci. Rep. 2024, 14, 1240. [Google Scholar] [CrossRef] [PubMed]
- Antonopoulou, G.; Papadopoulou, K.; Alexandropoulou, M.; Lyberatos, G. Liquid hot water treatment of woody biomass at different temperatures: the effect on composition and energy production in the form of gaseous biofuels. Sustain. Chem. Pharm. 2024, 38, 101485. [Google Scholar] [CrossRef]
- Tan, Z.; Li, X.; Yang, C.; Liu, H.; Cheng, J.J. Inhibition and disinhibition of 5-hydroxymethylfurfural in anaerobic fermentation: a review. Chem. Eng. J. 2021, 424, 130560. [Google Scholar] [CrossRef]
- Pekarova, S.; Dvorackova, M.; Stloukal, P.; Ingr, M.; Sera, J.; Koutny, M. Quantitation of the inhibition effect of model compounds representing plant biomass degradation products on methane production. BioResources 2017, 12, 2421–2432. [Google Scholar] [CrossRef]
- Monlau, F.; Sambusiti, C.; Barakat, A.; Quemeneur, M.; Trably, E.; Steyer, J.-P.; Carrere, H. Do furanic and phenolic compounds of lignocellulosic and algae biomass hydrolyzate inhibit anaerobic mixed cultures? A comprehensive review. Biotechnol. Adv. 2014, 32, 934–951. [Google Scholar] [CrossRef] [PubMed]
- Nowicka, A.; Dudek, M.; Debowski, M.; Markowski, M.; Bialobrzewski, I.; Zielinski, M. Influence of microwave thermohydrolysis on biomass digestion. Energies 2025, 18, 1370. [Google Scholar] [CrossRef]
- Nowicka, A.; Zielinski, M.; Debowski, M.; Dudek, M. Progress in the production of biogas from maize silage after acid-heat pretreatment. Energies 2021, 14, 8018. [Google Scholar] [CrossRef]
- Debowski, M.; Zielinski, M.; Nowicka, A.; Kazimierowicz, J. Influence of microwave-assisted chemical thermohydrolysis of lignocellulosic waste biomass on anaerobic digestion efficiency. Energies 2024, 17, 4207. [Google Scholar] [CrossRef]
- Saritpongteeraka, K.; Kaewsung, J.; Charnnok, B.; Chaiprapat, S. Comparing low-temperature hydrothermal pretreatments through convective heating versus microwave heating for Napier grass digestion. Processes 2020, 8, 1221. [Google Scholar] [CrossRef]
- Filer, J.; Ding, H.H.; Chang, S. Biochemical methane potential (BMP) assay method for anaerobic digestion research. Water 2019, 11, 921. [Google Scholar] [CrossRef]
- Baker, P.; Charlton, A.; Johnston, C.; Leahy, J.J.; Lindegaard, K.; Pisano, I.; Prendergast, J.; Preskett, D.; Skinner, C. A review of Willow (Salix spp.) as an integrated biorefinery feedstock. Ind. Crops Prod. 2022, 189, 115823. [Google Scholar] [CrossRef]
- Rahmani, A.M.; Tyagi, V.K.; Kazmi, A.A.; Ojha, C.S.P. Hydrothermal and thermal-acid pretreatments of wheat straw: methane yield, recalcitrant formation, process inhibition, kinetic modeling. Energy 2023, 283, 129083. [Google Scholar] [CrossRef]
- Fernandez-Rodriguez, M.J.; Mushtaq, M.; Tian, L.; Jimenez-Rodriguez, A.; Rincon, B.; Gilroyed, B.H.; Borja, R. Evaluation and modelling of methane production from corn stover pretreated with various physicochemical techniques. Waste Manag. Res. 2022, 40, 846–858. [Google Scholar] [CrossRef]
- Wang, C.; Shao, Z.; Qiu, L.; Hao, W.; Qu, Q.; Sun, G. The solid-state physicochemical properties and biogas production of the anaerobic digestion of corn straw pretreated by microwave irradiation. RSC Adv. 2021, 11, 3575–3584. [Google Scholar] [CrossRef] [PubMed]
- Witaszek, K.; Pilarski, K.; Niedbala, G.; Pilarska, A.A.; Herkowiak, M. Energy efficiency of comminution and extrusion of maize substrates subjected to methane fermentation. Energies 2020, 13, 1887. [Google Scholar] [CrossRef]
- Balasundaram, G.; Vidyarthi, P.K.; Gahlot, P.; Arora, P.; Kumar, V.; Kumar, M.; Kazmi, A.A.; Tyagi, V.K. Energy feasibility and life cycle assessment of sludge pretreatment methods for advanced anaerobic digestion. Bioresour. Technol. 2022, 357, 127345. [Google Scholar] [CrossRef] [PubMed]
- Zhao, Z.; Shao, Z.; Qu, Q.; Ji, M.; Cheng, D.; Guo, X. Promoting the overall energy profit through using the liquid hydrolysate during microwave hydrothermal pretreatment of wheat straw as co-substrate for anaerobic digestion. Sci. Total Environ. 2023, 857, 159463. [Google Scholar] [CrossRef] [PubMed]
Figure 1.
Schematic of the HL-P thermohydrolysis reactor: (1) substrate feed hopper; (2) motor and stirrer of the upper chamber; (3) upper reaction chamber, a 2.4 L PTFE vessel; (4) drain on the lower cover fitted with a solenoid valve; (5) lower discharge tank with manual tilting mechanism, safety valve and pressure gauge; (6) magnetron; (7) fan; (8) electrical control box with the HMI panel and emergency stop. The upper chamber can be heated either by the magnetron or conventionally; after the holding period the charge is decompressed into the lower tank.
Figure 1.
Schematic of the HL-P thermohydrolysis reactor: (1) substrate feed hopper; (2) motor and stirrer of the upper chamber; (3) upper reaction chamber, a 2.4 L PTFE vessel; (4) drain on the lower cover fitted with a solenoid valve; (5) lower discharge tank with manual tilting mechanism, safety valve and pressure gauge; (6) magnetron; (7) fan; (8) electrical control box with the HMI panel and emergency stop. The upper chamber can be heated either by the magnetron or conventionally; after the holding period the charge is decompressed into the lower tank.
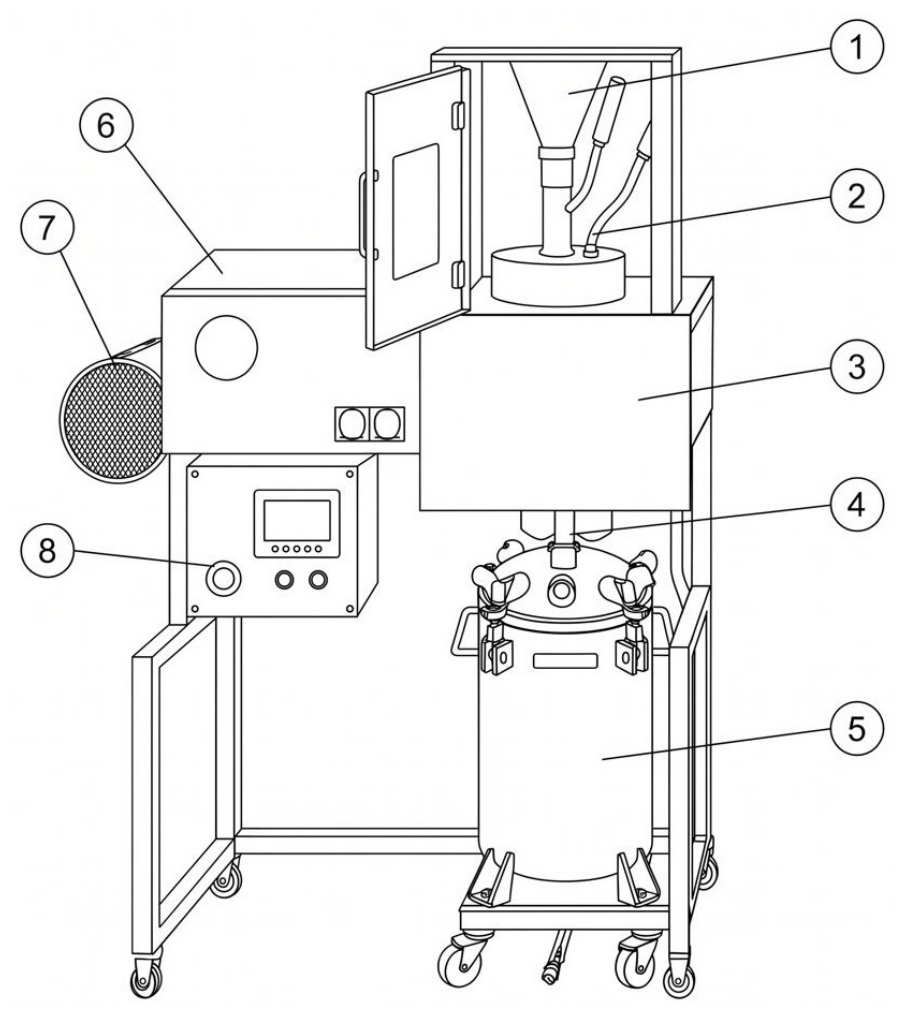
Figure 2.
Liquid-phase composition after pretreatment: (a,b) glucose; (c,d) chemical oxygen demand. Panels (a,c) willow, (b,d) maize silage. Bars are means (n = 3); the dashed line marks the untreated control. Red bars, microwave heating; blue bars, conventional (conductive) heating.
Figure 2.
Liquid-phase composition after pretreatment: (a,b) glucose; (c,d) chemical oxygen demand. Panels (a,c) willow, (b,d) maize silage. Bars are means (n = 3); the dashed line marks the untreated control. Red bars, microwave heating; blue bars, conventional (conductive) heating.
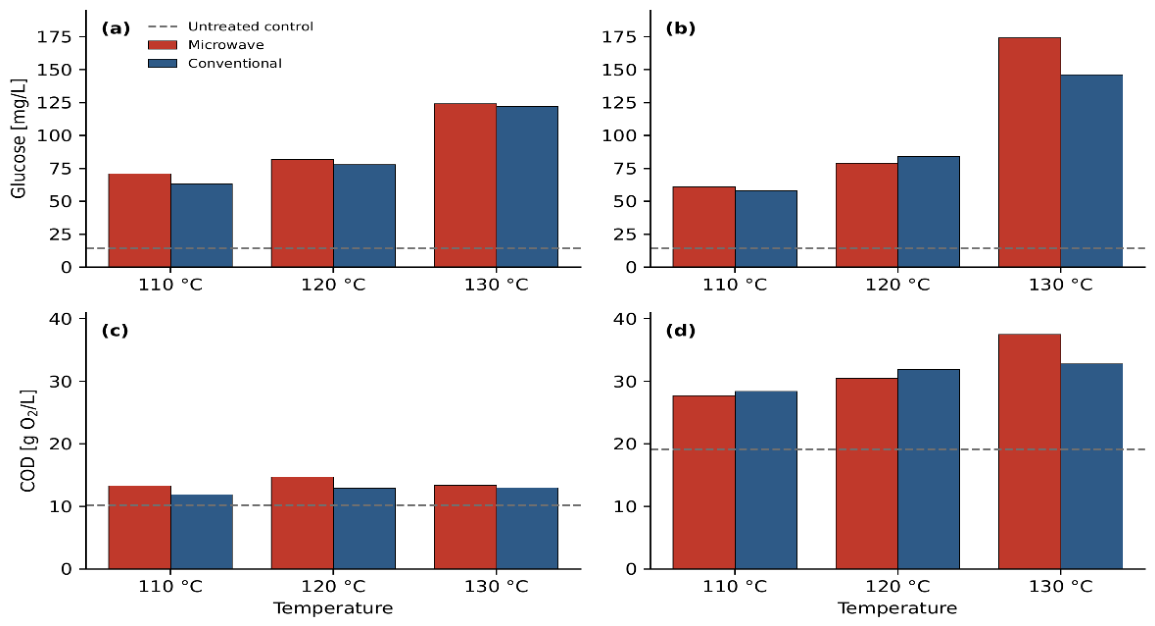
Figure 3.
Furanic and phenolic by-products after pretreatment: (a,b) 5-hydroxymethylfurfural (HMF); (c,d) furfural; (e,f) total phenolics. Panels (a,c,e) willow, (b,d,f) maize silage. HMF and furfural were determined by HPLC; phenolics by the Hach LCK 346 cuvette test. In (c) the willow microwave variants fell below the limit of quantification (< LOQ). Bars are means (n = 3); the dashed line marks the untreated control. Each row uses its own y-axis scale, and panels (c) and (d) additionally differ from one another, since willow furfural was roughly thirty times lower than that of maize silage.
Figure 3.
Furanic and phenolic by-products after pretreatment: (a,b) 5-hydroxymethylfurfural (HMF); (c,d) furfural; (e,f) total phenolics. Panels (a,c,e) willow, (b,d,f) maize silage. HMF and furfural were determined by HPLC; phenolics by the Hach LCK 346 cuvette test. In (c) the willow microwave variants fell below the limit of quantification (< LOQ). Bars are means (n = 3); the dashed line marks the untreated control. Each row uses its own y-axis scale, and panels (c) and (d) additionally differ from one another, since willow furfural was roughly thirty times lower than that of maize silage.
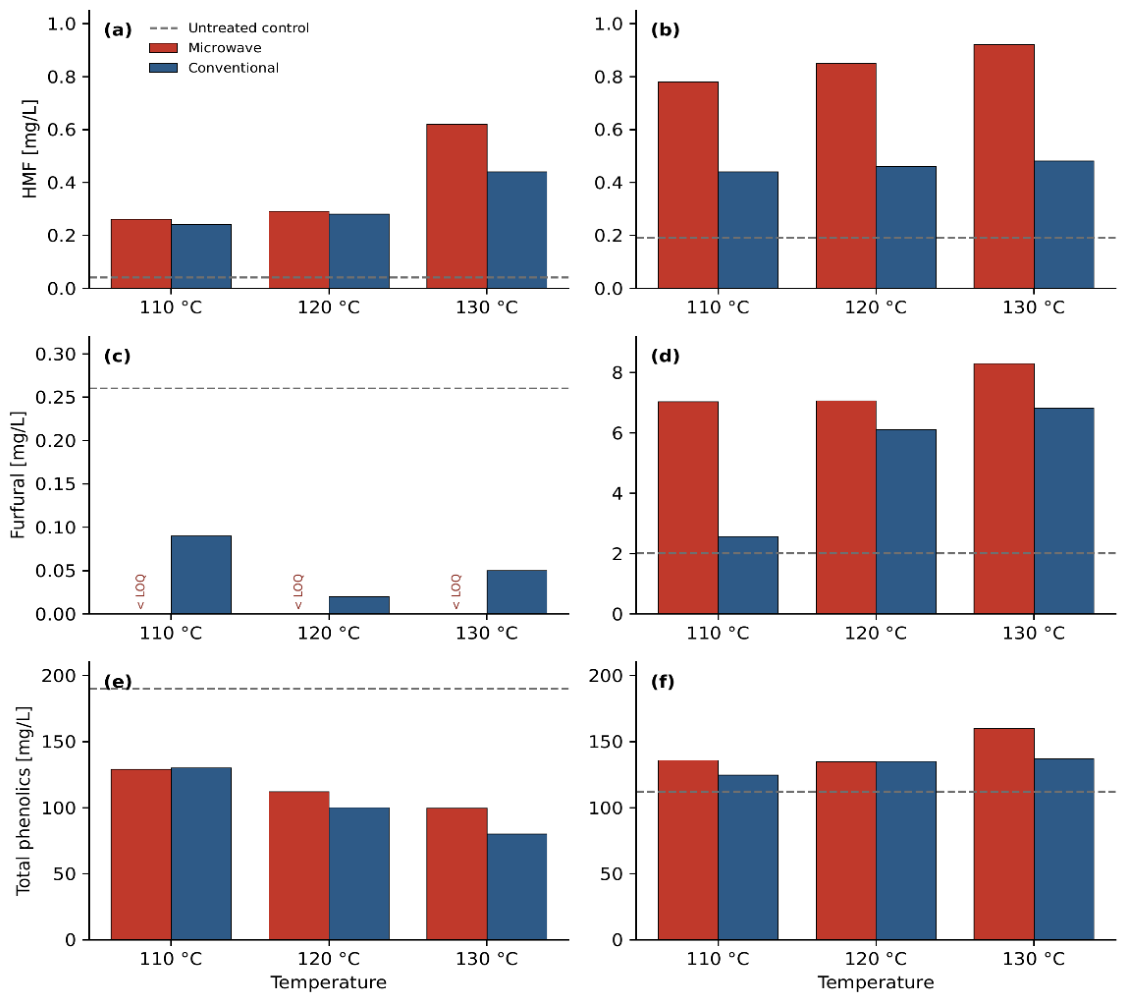
Figure 4.
Biochemical methane potential of (a) willow and (b) maize silage, expressed as net methane per gram of VS (mean ± SD, n = 3). Significance of Dunnett-type contrasts against the untreated control: *** p < 0.001; ns, not significant. The dashed line and shaded band show the control mean ± SD.
Figure 4.
Biochemical methane potential of (a) willow and (b) maize silage, expressed as net methane per gram of VS (mean ± SD, n = 3). Significance of Dunnett-type contrasts against the untreated control: *** p < 0.001; ns, not significant. The dashed line and shaded band show the control mean ± SD.
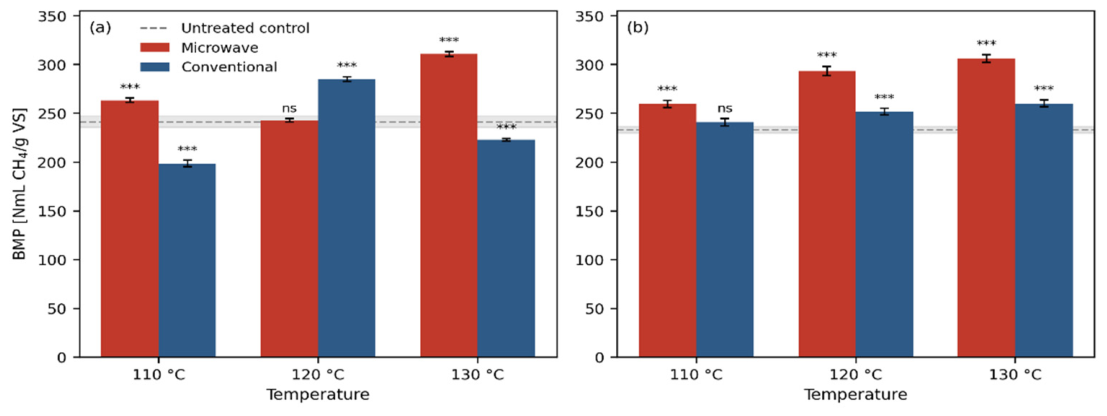
Figure 5.
Relationship between the sugars released into the liquid fraction (glucose + xylose) and the methane yield of the corresponding variant; r denotes the Pearson correlation coefficient.
Figure 5.
Relationship between the sugars released into the liquid fraction (glucose + xylose) and the methane yield of the corresponding variant; r denotes the Pearson correlation coefficient.
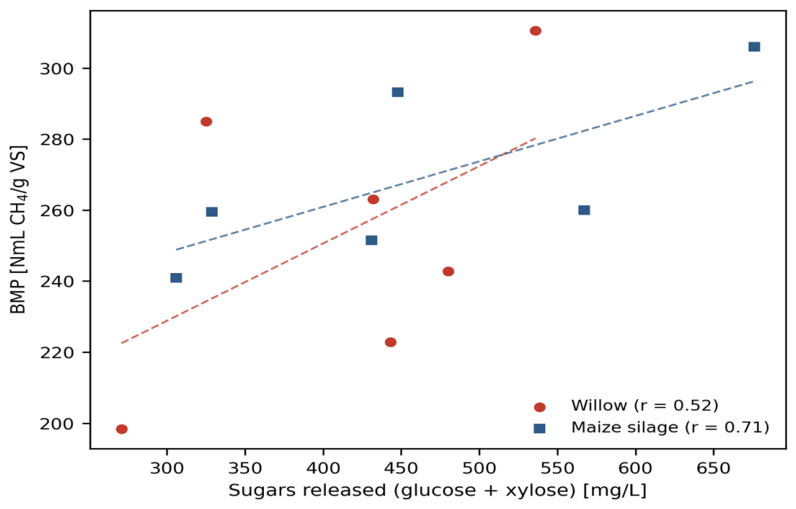
Figure 6.
Cumulative net methane production per gram of VS during the batch assay for (a) willow and (b) maize silage (means, n = 3). Solid lines, microwave heating; dashed lines, conventional heating; black line, untreated control.
Figure 6.
Cumulative net methane production per gram of VS during the batch assay for (a) willow and (b) maize silage (means, n = 3). Solid lines, microwave heating; dashed lines, conventional heating; black line, untreated control.
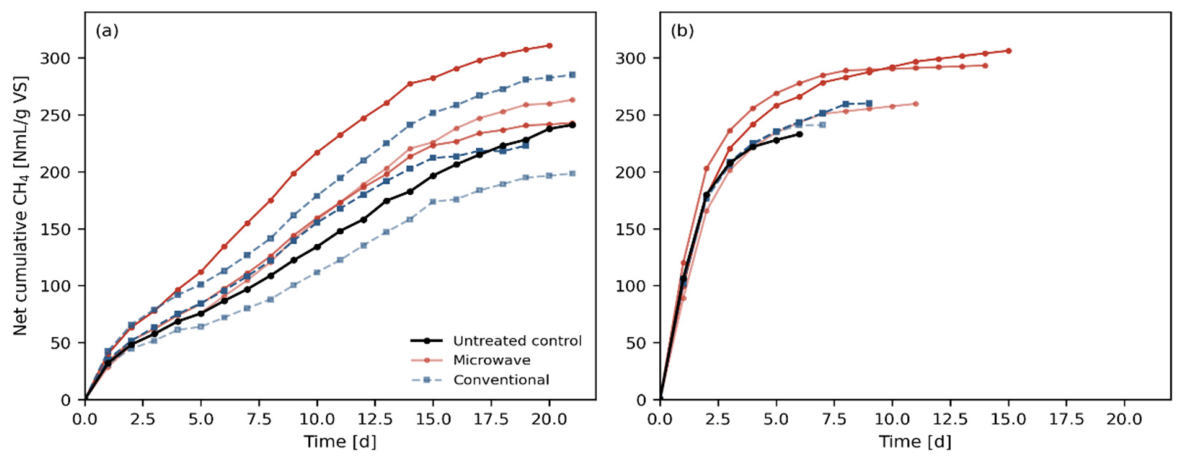
Figure 7.
Incremental net energy of the pretreatment step for (a) willow and (b) maize silage, defined as the additional methane energy relative to the untreated control minus the pretreatment energy input. Values are annotated for each bar in kJ per gram of dry matter; every variant falls below break-even.
Figure 7.
Incremental net energy of the pretreatment step for (a) willow and (b) maize silage, defined as the additional methane energy relative to the untreated control minus the pretreatment energy input. Values are annotated for each bar in kJ per gram of dry matter; every variant falls below break-even.
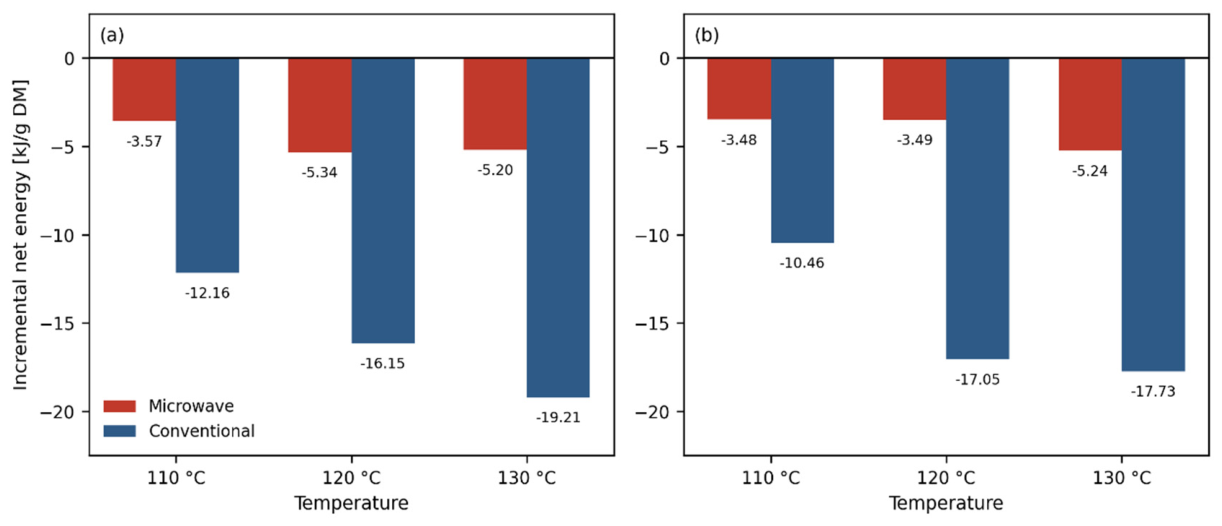

Table 1.
Characteristics of the raw feedstocks.
| Parameter | Willow (Salix viminalis) | Maize silage (Zea mays) |
| Total solids [mg/g] | 512.33 | 330.27 |
| Volatile solids [mg/g] | 485.27 | 291.92 |
| Mineral solids [mg/g] | 27.06 | 38.35 |
| Lignin (ADL) [%] | 13.22 | 10.28 |
| Cellulose (ADF − ADL) [%] | 43.85 | 7.69 |
| Hemicellulose (NDF − ADF) [%] | 14.17 | 5.45 |
Table 2.
Experimental design.
| Item | Description |
| Substrates | Willow chips (Salix viminalis); maize silage (Zea mays) |
| Heating modes | Microwave (MW); conventional resistive heating (Conv.) |
| Temperatures | 110, 120, 130 °C |
| Hydration | to 90% moisture; shaken 60 min at 130 rpm (IKA KS 4000) |
| Holding time | 20 min |
| Acid | 10% HCl solution, fixed dose of 7% of substrate dry matter |
| Control | Untreated substrate (no acid, no heating) |
| Replication | n = 3 (liquid-phase analyses and BMP assays) |
| Liquid-phase analytics | COD and phenolics: Hach LCK 914/LCK 346; sugars: Megazyme; HMF and furfural: HPLC |
| BMP assay | AMPTS II, 21-day batch, ISR ≈ 3.5:1 (VS basis) |
| Variants per substrate | 7 (control + 3 temperatures × 2 heating modes) |
Table 3.
Liquid-phase composition after pretreatment and the resulting biochemical methane potential (means, n = 3).
Table 3.
Liquid-phase composition after pretreatment and the resulting biochemical methane potential (means, n = 3).
| Substrate | Variant | COD [g/L] | Phenolics [mg/L] | HMF [mg/L] | Furfural [mg/L] | Glucose [mg/L] | Xylose [mg/L] | BMP [NmL/g VS] |
| Willow | Control | 10.2 | 190.0 | 0.04 | 0.26 | 14 | 194 | 241.1 ± 5.7 |
| Willow | Conv. 110 °C | 11.9 | 130.0 | 0.24 | 0.09 | 63 | 208 | 198.4 ± 3.3 |
| Willow | Conv. 120 °C | 12.9 | 100.0 | 0.28 | 0.02 | 78 | 247 | 284.9 ± 2.5 |
| Willow | Conv. 130 °C | 13.0 | 80.0 | 0.44 | 0.05 | 122 | 321 | 222.8 ± 1.3 |
| Willow | MW 110 °C | 13.3 | 129.0 | 0.26 | < LOQ | 71 | 361 | 263.1 ± 2.2 |
| Willow | MW 120 °C | 14.7 | 112.0 | 0.29 | < LOQ | 82 | 398 | 242.7 ± 1.9 |
| Willow | MW 130 °C | 13.4 | 99.5 | 0.62 | < LOQ | 124 | 412 | 310.6 ± 2.5 |
| Maize silage | Control | 19.1 | 112.3 | 0.19 | 2.01 | 14 | 184 | 232.9 ± 3.1 |
| Maize silage | Conv. 110 °C | 28.4 | 124.7 | 0.44 | 2.57 | 58 | 248 | 240.9 ± 3.8 |
| Maize silage | Conv. 120 °C | 31.9 | 134.8 | 0.46 | 6.10 | 84 | 347 | 251.5 ± 3.4 |
| Maize silage | Conv. 130 °C | 32.8 | 136.8 | 0.48 | 6.83 | 146 | 421 | 260.0 ± 3.5 |
| Maize silage | MW 110 °C | 27.7 | 135.8 | 0.78 | 7.03 | 61 | 268 | 259.5 ± 3.7 |
| Maize silage | MW 120 °C | 30.5 | 134.7 | 0.85 | 7.07 | 79 | 369 | 293.2 ± 4.6 |
| Maize silage | MW 130 °C | 37.5 | 159.9 | 0.92 | 8.29 | 174 | 502 | 306.0 ± 4.0 |
Table 4.
Modified Gompertz parameters fitted to the cumulative methane curves.
| Substrate | Variant | Pmax [NmL/g VS] | Rm [NmL/g VS/d] | Lag λ [d] | R2 |
| Willow | Control | 300.9 | 13.0 | 0.00 | 0.993 |
| Willow | Conv. 110 °C | 254.9 | 10.9 | 0.00 | 0.988 |
| Willow | Conv. 120 °C | 329.0 | 17.2 | 0.00 | 0.991 |
| Willow | Conv. 130 °C | 254.6 | 15.3 | 0.00 | 0.990 |
| Willow | MW 110 °C | 306.3 | 16.7 | 0.37 | 0.995 |
| Willow | MW 120 °C | 272.3 | 16.2 | 0.00 | 0.993 |
| Willow | MW 130 °C | 335.7 | 22.4 | 0.00 | 0.996 |
| Maize silage | Control | 226.6 | 112.4 | 0.11 | 0.995 |
| Maize silage | Conv. 110 °C | 235.8 | 103.7 | 0.08 | 0.993 |
| Maize silage | Conv. 120 °C | 240.5 | 96.5 | 0.04 | 0.989 |
| Maize silage | Conv. 130 °C | 248.5 | 91.1 | 0.00 | 0.983 |
| Maize silage | MW 110 °C | 251.4 | 80.9 | 0.00 | 0.989 |
| Maize silage | MW 120 °C | 286.3 | 100.1 | 0.00 | 0.985 |
| Maize silage | MW 130 °C | 292.2 | 75.1 | 0.00 | 0.979 |
Table 5.
Energy balance of the pretreatment step (estimates based on rated power and measured heating time).
Table 5.
Energy balance of the pretreatment step (estimates based on rated power and measured heating time).
| Substrate | Heating | T [°C] | E_in [kJ/g DM] | E_out [kJ/g DM] | ΔE_out vs control | Gross net | Incremental net |
| Willow | Control | — | 0 | 8.17 | — | — | — |
| Willow | Microwave | 110 | 4.32 | 8.92 | +0.75 | +4.60 | −3.57 |
| Willow | Microwave | 120 | 5.40 | 8.23 | +0.06 | +2.83 | −5.34 |
| Willow | Microwave | 130 | 7.56 | 10.53 | +2.36 | +2.97 | −5.20 |
| Willow | Conventional | 110 | 10.71 | 6.73 | −1.45 | −3.98 | −12.16 |
| Willow | Conventional | 120 | 17.64 | 9.66 | +1.49 | −7.98 | −16.15 |
| Willow | Conventional | 130 | 18.59 | 7.56 | −0.62 | −11.03 | −19.21 |
| Maize silage | Control | — | 0 | 7.37 | — | — | — |
| Maize silage | Microwave | 110 | 4.32 | 8.22 | +0.84 | +3.90 | −3.48 |
| Maize silage | Microwave | 120 | 5.40 | 9.28 | +1.91 | +3.88 | −3.49 |
| Maize silage | Microwave | 130 | 7.56 | 9.69 | +2.32 | +2.13 | −5.24 |
| Maize silage | Conventional | 110 | 10.71 | 7.63 | +0.25 | −3.08 | −10.46 |
| Maize silage | Conventional | 120 | 17.64 | 7.96 | +0.59 | −9.68 | −17.05 |
| Maize silage | Conventional | 130 | 18.59 | 8.23 | +0.86 | −10.36 | −17.73 |
Table 6.
Energy input compared with the thermodynamic minimum for heating the charge.
| T [°C] | Theoretical minimum [kJ/g DM] | MW input [kJ/g DM] | MW efficiency | Conventional input [kJ/g DM] | Conv. efficiency |
| 110 | 3.52 | 4.32 | 82% | 10.71 | 33% |
| 120 | 3.91 | 5.40 | 72% | 17.64 | 22% |
| 130 | 4.30 | 7.56 | 57% | 18.59 | 23% |
Disclaimer/Publisher’s Note: The statements, opinions and data contained in all publications are solely those of the individual author(s) and contributor(s) and not of MDPI and/or the editor(s). MDPI and/or the editor(s) disclaim responsibility for any injury to people or property resulting from any ideas, methods, instructions or products referred to in the content. |
© 2026 by the authors. Licensee MDPI, Basel, Switzerland. This article is an open access article distributed under the terms and conditions of the Creative Commons Attribution (CC BY) license (http://creativecommons.org/licenses/by/4.0/).
Copyright: This open access article is published under a Creative Commons CC BY 4.0 license, which permit the free download, distribution, and reuse, provided that the author and preprint are cited in any reuse.