

Submitted:
22 July 2026
Posted:
23 July 2026
You are already at the latest version
Abstract
Shrimp farming constitutes a strategic productive activity for Ecuador; however, monitoring of shrimp ponds still relies on manual observations, fragmented records, and qualitative criteria that hinder the early detection of visual conditions of operational interest. In this context, the present study proposes a prototype adaptive intelligent system to support the visual monitoring of shrimp ponds through computer vision. The proposal integrates image capture, visual information processing, organized record storage, and alert visualization in an administrative dashboard. The evaluation was conducted using public datasets employed as experimental approximations to three visual signals of interest: feed accumulation, surface changes, and foam presence. In this work, anomaly detection is understood as the preliminary identification of visual signals associated with possible anomalous conditions or conditions of operational interest. The results show high performance in feed accumulation, with mAP50 values above 0.98 for BOX and MASK; moreover, the bootstrap analysis revealed a statistically significant advantage of YOLOv11m-seg over YOLOv8m-seg for the shrimp class. In surface changes, YOLOv8n and YOLOv11n achieved mAP50 values of 0.884 and 0.885, respectively, with no statistically significant differences in F1-score. In foam presence, the models achieved mAP50 values of 0.767 and 0.758, respectively, and the bootstrap analysis confirmed non-significant differences between architectures, reflecting the visual complexity of this signal. Inference times of 3.9–21.2 ms/img support the use of the prototype for frequent monitoring. It is concluded that the proposed system effectively integrates computer vision, inference services, and alert visualization to support visual inspection, event prioritization, and operational management of shrimp ponds.
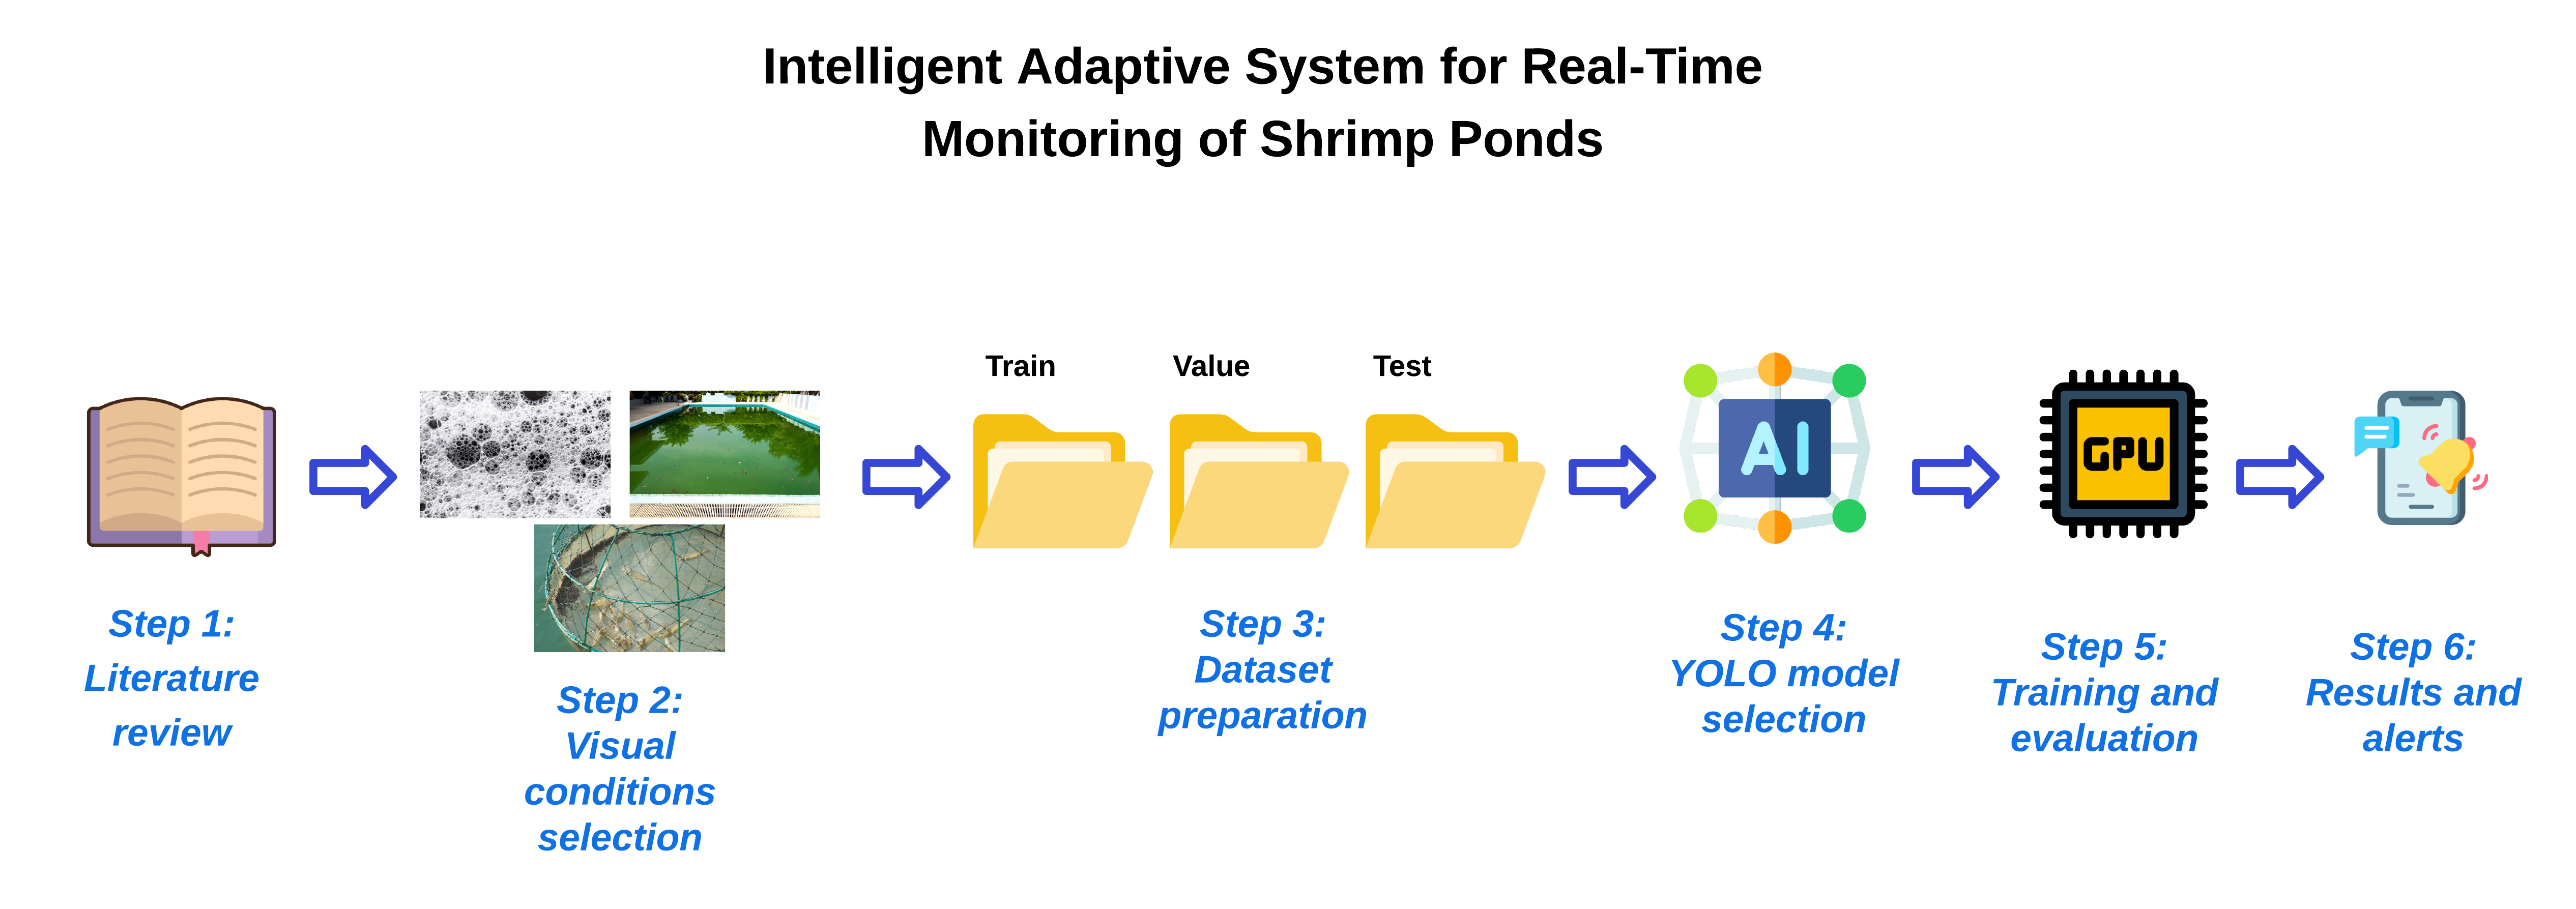
Keywords:
computer vision
; intelligent aquaculture
; shrimp ponds
; preliminary anomaly detection
; operational visual signals
; YOLOv8
; YOLOv11
; Android
; FastAPI
; AWS
1. Introduction
The shrimp aquaculture industry represents one of the relevant productive sectors for Ecuador, especially in the coastal provinces where shrimp farming activity sustains employment, exports, and local economic value chains. In this context, the continuous supervision of grow-out ponds is a critical task, since the operational visual conditions of the pond can anticipate unfavorable situations for crop development. Nevertheless, a significant proportion of producers still depend on manual inspections, scattered records, and qualitative assessments that hinder the timely identification of risk situations.
Traditional monitoring presents several limitations, since human observation is subject to fatigue, staff availability, and variability of criteria among operators. Moreover, the visual events that appear in the ponds can evolve rapidly, so that a delayed detection reduces response capacity. This situation becomes more critical for small and medium-sized producers, who typically face economic constraints to incorporate specialized monitoring infrastructure and require accessible, scalable solutions compatible with mobile devices. In addition, the absence of organized visual records limits the traceability of the events observed in each pond and hinders the construction of local datasets to train or fine-tune artificial intelligence models adapted to the Ecuadorian shrimp farming context.
In recent years, computer vision and detection neural networks have been used to automate different monitoring tasks in aquaculture. In fish management, these methods have been applied to the recognition, tracking, and visual analysis of organisms, evidencing their usefulness to complement manual observation [7,8]. In crustaceans, image-based systems have also enabled the study of behaviors relevant to production and the generation of operational information from aquaculture scenes [12]. In a complementary manner, other studies have addressed shrimp counting, size estimation, and the analysis of body variables through visual processing [23,26]. In the feeding domain, models have been proposed to detect uneaten pellets and feed residues, including YOLO-based variants [14,28,29]. Nevertheless, the application of these approaches in shrimp ponds faces specific challenges, such as lighting variations, turbidity, reflections, small objects, low availability of public datasets, and differences between images captured under controlled conditions and real production scenarios.
Faced with this problem, the present work proposes a prototype adaptive intelligent system to support the visual monitoring of shrimp ponds. The solution integrates computer vision based on YOLO neural networks and a mobile/web architecture oriented toward the capture, processing, and visualization of preliminary alerts. In particular, the system combines an Android mobile application, inference services through FastAPI, storage in PostgreSQL on AWS, and an administrative web dashboard. From the artificial intelligence component, YOLOv8 and YOLOv11 variants are evaluated on public datasets that represent analogous or reference visual signals. Consequently, the expression anomaly detection is used in a preliminary sense, as the detection of signals associated with possible anomalies, and not as operational validation in real shrimp ponds.
The main preliminary contributions of this work are as follows:
- An integrated three-layer architecture is proposed to support the visual monitoring of shrimp ponds, combining a mobile application, an inference API, and an administrative web dashboard.
- A comparative experimental workflow between YOLOv8 and YOLOv11 variants is built, using homogeneous training and evaluation configurations per condition.
- The experimental evaluation is organized into three categories of visual signals associated with possible anomalies, using public datasets as an initial approximation.
- Preliminary results are presented that allow the identification of strengths and limitations of lightweight models prior to validation in real shrimp ponds.
2. Related Work
As a general background, intelligent decision-support systems have been used in scenarios that require analyzing dynamic information, identifying patterns, and transforming operational records into useful knowledge for management. In this regard, previous studies have explored clustering methods, data simplification, trajectory analysis, and behavior detection, approaches linked to the processing of information from real environments and to the generation of interpretable results to guide decisions [37,38].
Likewise, these studies highlight the importance of defining methodologies capable of reducing data complexity, preserving their relevant elements, and facilitating interpretation within computational systems. This perspective is relevant for research that integrates capture, automatic processing, event classification, and visualization of results, since it allows moving from isolated records to structured information for monitoring conditions of interest [39,44].
These antecedents allow the introduction of the general logic of the present work: capturing data from a real environment, processing it through intelligent models, and presenting results that facilitate decision-making. From this general perspective, the review now turns toward studies directly related to aquaculture, shrimp farming, computer vision, automatic monitoring, and the detection of operational visual signals in production systems.
Computer vision has become established as a useful tool for automating observation tasks in aquaculture. Its applications include the recognition, monitoring, and management of fish, with the potential to reduce dependence on manual inspections [7]. Likewise, the use of cameras and machine learning in precision aquaculture allows continuous information about organisms and the environment to be obtained [8]. Segmentation using Mask R-CNN to measure morphological features in fish demonstrates the capacity of vision models to extract biological indicators from images [13].
In shrimp, several studies have used images to estimate productive and body condition variables. These applications include the non-destructive estimation of fresh weight through visual recognition and machine learning, as well as the estimation of the body weight of Litopenaeus vannamei based on morphometric features extracted from images [17,18].
In a complementary manner, other investigations have addressed length estimation, visual assessment of the digestive tract, shrimp counting, and the measurement of size and stomach fullness level in intelligent shrimp farming systems [25,26]. Together, these works support the notion that visual analysis can generate relevant productive indicators; however, they focus mainly on biological measurements rather than on operational visual pond alerts.
Automatic feeding and feed control have also been addressed in the aquaculture literature. The comparison between time-based and demand-based feeding systems in semi-intensive shrimp farming shows the importance of optimizing supply to improve productive management [15]. In a complementary manner, feed management strategies and the use of automatic feeders in Litopenaeus vannamei highlight that adequate administration reduces waste and improves efficiency [16].
From computer vision, models from the YOLO family have been used to detect uneaten pellets and feed residues in underwater images, including proposals oriented toward real-time detection [14,29]. In shrimp, approaches based on visual detection and lightweight architectures, such as YOLO-Shrimp, support the use of this type of model to identify signals associated with feeding; however, most of these studies focus on residual feed and not on an integrated mobile/web monitoring system [27,28].
Another related line corresponds to IoT and artificial intelligence systems for aquaculture monitoring. These solutions have been applied to the monitoring of water quality and species survival in ponds, as well as to the integration of sensors, connectivity, and artificial intelligence to support productive decisions [19,20]. Together, these works show that the combination of connected infrastructure and intelligent models can strengthen the continuous monitoring of environmental variables in aquaculture systems.
In the specific case of shrimp production, models have been proposed for the early detection of anomalies in water quality, as well as Edge-IoT systems to classify shrimp health conditions in real time [22,35]. These antecedents show important advances in intelligent monitoring; however, they are oriented mainly toward physicochemical variables, sensors, or general classification, rather than toward the visual detection of surface-level operational signals or those associated with feeding.
Based on these antecedents, a specific gap is identified: integrating lightweight computer vision models with a mobile/web architecture that enables image capture, processing, result storage, and the visualization of alerts per shrimp pond. The present work is positioned within this gap by proposing a functional prototype and evaluating YOLOv8 and YOLOv11 variants on these operational signals.
3. Materials and Methods
The study was initially structured under a bibliographic-documentary design, based on the review and analysis of scientific articles and academic literature related to shrimp aquaculture, shrimp pond monitoring, and the application of artificial intelligence models for image analysis. This process allowed the identification of object detection architectures employed in recent research, criteria for dataset construction and labeling in aquaculture contexts, operational visual signals of interest, and evaluation metrics applicable to the development of the project. Based on the gap identified in related work, the study was organized into four complementary phases: review of background literature, design of the technological architecture, preparation of visual datasets, and experimental evaluation of detection models.
Additionally, the research presents an experimental character, since it involves the practical implementation of a preliminary detection process for visual signals associated with possible anomalies through computational vision. For this purpose, a controlled environment was configured in which the public datasets, the training/validation/test partitions, the input size, the random seed, and the main training parameters were kept constant. The contrasted variable was the model architecture, comparing YOLOv8 versus YOLOv11 variants to evaluate their effect on the detection of three reference visual conditions: feed accumulation, foam presence, and surface changes.
From a methodological standpoint, the evaluation was oriented toward the quantitative measurement of the performance of the trained models. For this purpose, indicators derived from confusion matrices were considered, such as instances, true positives (TP), true negatives (TN), false positives (FP), and false negatives (FN), together with detection metrics such as precision, recall, F1-score, mAP@50, mAP@50–95, and AUC–ROC curves. In addition, for the lightweight detection models, the average inference time in milliseconds per image was considered, in order to assess the computational efficiency of the architectures. This set of metrics allowed the objective comparison of the performance of the evaluated architectures, the analysis of their capacity to detect the visual conditions of interest, and the identification of their strengths and limitations within a monitoring system for shrimp ponds.
3.1. Intelligent Monitoring System
The present work proposes the design and implementation of an intelligent monitoring system based on computer vision, capable of identifying operational visual signals through YOLOv8 and YOLOv11 models. The solution integrates an Android mobile application for image capture and analysis, an API developed in Python with FastAPI, storage on AWS infrastructure, and an administrative web dashboard built in Angular, forming a three-layer architecture oriented toward small and medium-sized shrimp producers. The temporal evaluation is expressed through the average inference time per image for the lightweight models evaluated, an indicator sufficient to provide an initial assessment of their computational efficiency within the prototype. Figure 1 summarizes the interaction between the mobile application, the inference services, the database, and the administrative dashboard.
3.2. Technological Components and System Integration
The inference results are stored together with the operational monitoring data. The proposed solution uses Amazon S3 for the storage of the analyzed images and PostgreSQL, on the Amazon RDS platform, for the registration of users, ponds, assignments, monitoring records, results, and alerts. This structure ensures traceability between each image, the associated pond, the responsible user, and the detected visual condition.
The administrative web dashboard, developed in Angular, complements the mobile application through modules for authentication, control panel, user management, pond management, assignments, monitoring, and alert visualization. Service consumption is carried out through HTTP clients secured with a JWT token. In the deployment, the mobile API was hosted on Amazon EC2, the web API was implemented on AWS Lambda using Mangum, the frontend was published on Amazon S3 and distributed through Amazon CloudFront, while API Gateway acted as the HTTP exposure point for the services.
3.3. Datasets Used
The evaluation was organized into three independent visual approaches, each associated with an operational signal of interest for shrimp pond monitoring. This methodological decision is due to the fact that the available datasets come from different sources, present different visual domains, non-equivalent classes, and heterogeneous annotation formats. Integrating them directly into a single multiclass dataset could introduce biases, labeling inconsistencies, and poorly controlled comparisons between conditions. For this reason, the datasets were treated separately in order to preserve the specificity of each approach, maintain comparable experimental conditions within each task, and evaluate the models according to the visual difficulty of each case. Consequently, this experimental stage does not correspond to an integrated multiclass dataset, nor does it yet demonstrate the simultaneous detection of the three signals within the same image or video stream; rather, it evaluates condition-specific specialized detectors. Table 1 summarizes the composition and experimental partition used.
3.4. Evaluated Visual Approaches
The visual approaches were defined based on observable signals that can support the inspection of shrimp ponds. Each one was associated with a specific dataset and with a detection or segmentation task adjusted to its visual characteristics. This separation allowed each signal to be analyzed according to the type of annotation available and prevented differences in origin, scale, resolution, capture environment, or class definition from affecting the interpretation of the results. Therefore, the results per approach should be interpreted as independent evaluations; simultaneous detection would require an integrated dataset with homogeneous annotations for feed, surface changes, and foam, or an integration strategy for multiple detectors validated on common images.
3.4.1. Approach 1: Feed Accumulation
The feed accumulation approach refers to the visual identification of signals associated with uneaten feed in the feeding area. In shrimp farming systems, checking the feed remaining on feeding trays or plates is important for adjusting dosage, reducing waste, and preventing the deterioration of water quality. However, this check is usually performed manually and may vary according to the operator’s judgment. In addition, feed residues can be small, have irregular shapes, and blend visually with the background or with the shrimp, which makes automatic detection difficult in aquaculture environments. In this work, accumulation is interpreted contextually through the observation of the feeding tray and the presence of shrimp in its immediate surroundings, as illustrated in Figure 2.
For the feed accumulation approach, the ShrimpFarming dataset was used, oriented toward the visual monitoring of aquaculture tanks with Penaeus vannamei [23]. The images were captured at real RiaSearch facilities in Portugal, using a Raspberry Pi Camera Module 3 Wide positioned above the feeding tray, under variable natural lighting conditions and at different times of day. The dataset used contains images of 512 × 512 pixels with annotations in YOLO format for two classes: shrimp and plate. The final configuration consisted of 765 training images, 135 validation images, and 240 test images, with a total of 1140 images. For their analysis, the YOLOv8m-seg and YOLOv11m-seg segmentation models were employed, with the purpose of complementing the visual detection of the shrimp and the feeding tray with accumulation criteria associated with the area of interest.
3.4.2. Approach 2: Surface Changes
The surface changes approach is oriented toward the detection of floating objects and visible debris on the water surface, using inland water scenes as a reference. In the context of shrimp pond monitoring, this type of signal can be associated with the presence of floating material, organic residues, external objects, or surface patterns that require operational inspection. Figure 3 shows an example of this type of visual signal.
For the surface changes approach, the IWHR_AI_Lable_Floater_V1 dataset was used [45], composed of inland water images featuring floating objects. This dataset allowed the representation of visual conditions analogous to those that can be observed in shrimp ponds, such as debris, floating material, or objects visible on the water surface. The images include variations in scale, lighting, reflections, and background conditions, factors relevant for evaluating the generalization capacity of the detector in heterogeneous scenes.
The original annotations, available in Pascal VOC format, were converted to YOLO format by normalizing the coordinates of each bounding box with respect to the image dimensions. For training, the labels were grouped into a single class, called floater, and the dataset was divided into 2400 training images, 300 validation images, and 300 test images. Verification of the training subset confirmed 2400 label files, with no empty files, and 18,906 annotated instances, equivalent to an approximate average of 7.9 objects per image.
For their analysis, the YOLOv8n and YOLOv11n detection models were used under comparable conditions, with input images of 640 × 640 pixels, batches of 16 images, a fixed seed of 42, and early stopping with a patience of 20 epochs. Due to the larger size of the dataset, the maximum training limit was set at 100 epochs, allowing early stopping to define the effective convergence point.
3.4.3. Approach 3: Foam Presence
The foam presence approach corresponds to the identification of visible foam formations on the water surface. In grow-out ponds, foam can appear due to the accumulation of organic matter, aeration, water movement, presence of residues, or changes in surface characteristics. Although it does not always represent a severe anomaly by itself, its persistence or increase can serve as a preventive signal to review the condition of the pond. Figure 4 presents a representative example.
For the foam presence approach, the “Ocean Surface Foam” dataset was used, obtained from the Roboflow platform [46]. This dataset groups images with foam patterns on aquatic surfaces and was used as a visual reference to represent surface conditions comparable to those that could be observed in shrimp ponds. The set includes 3086 images distributed into 2681 for training, 271 for validation, and 134 for testing, with annotations in a single class, foam, in YOLO format. For their analysis, the YOLOv8n and YOLOv11n detection models were used, maintaining the same training configuration applied in the surface changes approach, in order to ensure comparability between both signals evaluated with nano-scale architectures.
3.5. Preprocessing and Experimental Configuration
Each dataset was organized separately into training, validation, and test subsets, according to the corresponding visual approach. The annotations were adapted to the format required by YOLO, so that each element of interest was associated with its class and its location within the image. This organization allowed a comparable experimental structure to be maintained across the three evaluated approaches.
For the surface changes and foam presence approaches, two detection neural networks were trained: YOLOv8n and YOLOv11n. Nano variants were selected due to their lower computational cost and their compatibility with lightweight inference scenarios. For the feed accumulation approach, due to the use of the ShrimpFarming dataset and its activity annotations, YOLOv8m-seg and YOLOv11m-seg were trained, oriented toward segmenting the plate and shrimp classes. Each architecture was trained on the corresponding dataset under controlled conditions, in order to compare its performance under each evaluated visual condition. A single multiclass model with the three signals was not trained, nor was an integrated dataset evaluated in which the classes coexisted simultaneously. Table 2 presents the general training parameters.
The evaluation was carried out using the test subsets defined during data preparation. For each dataset, the results generated by the trained models were compared with the ground-truth labels of the images, applying the same analysis criteria to ensure an equivalent assessment. Performance was examined through model evaluation metrics such as precision, recall, and results derived from the confusion matrix. According to the nature of each approach, bounding-box detection was considered for the patterns visible on the water surface, and a joint evaluation of localization and segmentation was considered for the feed accumulation condition, including the plate and shrimp classes, in accordance with the experimental procedure described.
4. Results
4.1. Validation of the Data Used
The three datasets described in Section 3 were used as the basis for evaluating the performance of the selected YOLO variants. The organization into independent datasets responds to the distinct nature of each visual approach: feed accumulation as the segmentation of shrimp and feeding tray, surface changes as the detection of floating objects, and foam presence as the identification of diffuse surface patterns.
This separation makes it possible to avoid an aggregated interpretation that could obscure relevant differences between tasks. The feed accumulation approach relies on instance annotations and requires the simultaneous evaluation of localization and segmentation; the surface approach prioritizes the detection of small or scattered objects on water; and the foam approach depends on visual regions with less defined edges. For this reason, the results are presented individually before synthesizing the overall behavior of the system.
4.2. Model Comparison Procedure
The comparison was performed by contrasting the predictions generated by each model with the ground-truth annotations of the test set. For the three approaches, precision, recall, F1-score, mAP50, and mAP50-95 were analyzed. In feed accumulation, BOX and MASK metrics were differentiated, since these are segmentation models. In addition, confusion matrices were used to identify the main distribution of errors, and AUC–ROC curves were employed when the structure of the dataset allowed a stable discriminative reading.
The analysis was carried out independently for each approach. This organization avoids directly comparing phenomena with different visual difficulties and allows the results to be interpreted according to the operational function of each detector within the monitoring system. In monitoring scenarios, it is not enough to know the overall mAP value: it is also necessary to identify whether the errors correspond to omissions of relevant events, false alarms, or confusions with the background.
4.3. Results Obtained
4.3.1. Results for the Feed Accumulation Approach
The feed accumulation approach evaluates the joint segmentation of shrimp and feeding tray based on the ShrimpFarming dataset. In this scenario, the plate class represents the area of interest associated with feed supply, while shrimp allows the characterization of organism presence around that area. The analysis considers the visual context of the tray and the shrimp, which allows an assessment of the models’ capacity to localize and segment relevant elements within the aquaculture scene.
From the perspective of shrimp farming monitoring, this formulation is relevant because the feeding tray functions as a spatial reference for interpreting organism activity and possible feed accumulation. Correct detection of the plate class provides stability to the system, since it defines a constant region of interest, while segmentation of the shrimp class makes it possible to estimate the presence of shrimp around that area. Therefore, the analysis focuses not only on the overall mAP value but also on the distribution of errors by class, summarized in Table 3.
The confusion matrices in Figure 5 show that both models correctly identified all instances of plate, with no false positives or false negatives for this class. Confusions are concentrated in the shrimp class, mainly due to the visual similarity between small organisms, background, and overlapping areas. YOLOv11m-seg reduced the number of shrimp false negatives compared to YOLOv8m-seg, although both models maintained high performance.
This behavior suggests that the plate class is visually stable and easily separable from the background under the dataset conditions, whereas shrimp represents a more demanding task. In practice, false negatives for shrimp could lead to an underestimation of activity around the tray, while false positives could produce an overestimated reading of organism presence. Nevertheless, F1-score values above 92% for shrimp indicate that both models maintain an adequate balance between precision and recall.
In the BOX evaluation, precision and recall values close to 1 indicate that the models identified most of the relevant objects and generated few incorrect detections. Precision reflects how reliable the detections made were, while recall shows the proportion of present objects that were found. In this case, both models exceeded 0.96 in these metrics, evidencing stable behavior in locating shrimp and feeding trays through bounding boxes. In addition, mAP50 values above 0.98 indicate that the detections adequately matched the ground-truth annotations when a moderate overlap criterion was applied; in contrast, mAP50–95, close to 0.90, shows that performance decreases slightly when a more precise localization is required.
The MASK evaluation analyzes not only whether the object was detected, but also how accurately its shape was delineated. Therefore, although mAP50 remains above 0.98, mAP50–95 decreases to values close to 0.81. This difference means that the models correctly recognize the objects but have greater difficulty accurately tracing their contours under stricter criteria. This situation is expected for the shrimp class, because the organisms may appear overlapped, with elongated shapes, small sizes, and poorly defined edges. Overall, the results show that the approach is reliable for locating the region of interest and detecting the presence of organisms, although fine-grained shrimp segmentation remains the most demanding component.
From an operational perspective, these results show that the feed accumulation approach is the most stable scenario in the study, mainly due to the presence of the feeding tray as a constant visual reference. In the plate class, both models achieved maximum performance, so no practical difference is observed between architectures. In the shrimp class, the bootstrap analysis of the F1-score showed a mean of 0.8941 for YOLOv8m-seg and 0.9025 for YOLOv11m-seg; furthermore, the 95% confidence interval for the YOLOv11–YOLOv8 difference was [0.0025, 0.0147], not including zero. This indicates a statistically significant advantage of YOLOv11m-seg for shrimp detection in this test set. Even so, this reading should be taken with caution, since the images come from a controlled environment and do not by themselves confirm the presence of residual feed in real shrimp ponds.
Figure 6 shows the bootstrap distribution of the F1-score for the shrimp class. Each bar represents the frequency with which a given F1-score was obtained when resampling the test set, while the black line indicates the estimated mean F1-score for each model and the dotted lines delimit the 95% confidence interval. For YOLOv8m-seg, the distribution is concentrated around 0.8941, with an interval from 0.8856 to 0.9016; for YOLOv11m-seg, the concentration shifts toward 0.9025, with an interval from 0.8944 to 0.9107. This means that, when resampling is repeated, YOLOv11m-seg tends to obtain slightly higher F1-score values for the shrimp class. In addition, the confidence interval for the difference between the models was positive and did not include zero, supporting a statistically significant improvement in this test set. However, because the distributions still overlap, the improvement should be interpreted as a limited advantage for this class, rather than as general superiority across all scenarios.
For this dataset, the interpretation of mAP50 is prioritized, since this metric makes it possible to assess whether the detections adequately match the ground-truth annotations under a moderate overlap criterion. As shown in Figure 7, both models rapidly improve their performance during the first epochs and then remain at values close to 0.98. This behavior indicates that learning stabilizes early and that improvements between epochs are limited after the first iterations. Therefore, the interpretation should not rely solely on the mAP50 curve, but also on the class-specific analysis and bootstrap estimation, which make it possible to assess whether the observed differences between models have statistical support.
4.3.2. Results for the Surface Changes Approach
The surface changes approach evaluates the detection of visible objects or debris on the water surface using a dataset oriented toward floating elements. In this scenario, the floater class represents visual signals that may be associated with debris, floating bodies, or elements unrelated to the normal behavior of the crop. The analysis focuses on assessing the models’ ability to localize these patterns through bounding boxes, given that their shape, size, and position can vary across images.
From the perspective of shrimp farming monitoring, this formulation is relevant because visible changes on the surface can serve as early signals of conditions requiring operator review. Accurate detection of the floater class makes it possible to identify areas where objects or debris appear on the water surface, providing useful information for prioritizing pond inspection. Accordingly, the analysis focuses on model evaluation metrics and on the distribution of correct and incorrect detections summarized in Table 4.
The final evaluation of this approach was performed on the test set, comprising 300 images and 2344 annotated instances of the floater class. In this case, the main challenge lies in recognizing small or scattered objects that can be confused with reflections, ambiguous debris, or texture variations. Unlike the feed accumulation approach, where a more clearly defined reference zone exists, here the models must localize visual signals with variable shapes, sizes, and positions. For this reason, even small differences in recall and mAP50 are relevant, as higher sensitivity may favor the early detection of visible changes on the water surface.
The overall metrics show favorable performance for surface-change detection. YOLOv8n achieved an mAP50 of 88.4% and an mAP50–95 of 64.1%, while YOLOv11n obtained 88.5% and 64.1%, respectively. The 0.1 percentage point difference in mAP50 is very small at the descriptive level and should not, by itself, be interpreted as a conclusive improvement. This result should be read in light of the full set of metrics: YOLOv8n retains slightly higher precision, recall, and F1-score values, whereas YOLOv11n achieves a marginally higher mAP50 and a slightly lower inference time, at 3.9 ms/img compared to 4.1 ms/img.
Figure 8 presents the bootstrap distribution of the F1-score for the surface-change approach. YOLOv8n obtained a mean F1-score of 0.8699, with an interval of 0.8482 to 0.8914, while YOLOv11n achieved 0.8689, with an interval of 0.8472 to 0.8894. These values show very close and largely overlapping distributions. Moreover, the confidence interval for the YOLOv11–YOLOv8 difference was [-0.0101, 0.0080], which includes zero; therefore, the difference between the two models cannot be considered statistically significant for this test set. In practical terms, both models exhibit very similar performance, and the choice between them may be based on operational criteria such as inference speed or false-alarm control.
From an operational perspective, these results indicate that the models generally recognize the presence of floating objects or alterations on the water surface, although localization is not always equally precise when greater overlap between the predicted and ground-truth boxes is required. This explains the difference between mAP50 and mAP50–95: the detector may correctly identify the visual event, but the bounding box may not fully match its actual edges. For an early warning system, this behavior is useful, since the main objective is to alert the operator to the presence of a visible alteration in the pond and to guide subsequent inspection.
The confusion matrices in Figure 9 confirm that both models exhibit a very similar error distribution. YOLOv8n recorded 1993 true positives and YOLOv11n 1988, a small difference relative to the 2344 instances evaluated. The false positives and false negatives indicate that the main challenge lies not only in recovering floating objects but also in distinguishing them from reflections, ambiguous debris, or surface water textures.
Overall, these results show that the surface changes approach can function as an early warning mechanism to signal the presence of floating objects or alterations in the pond. The difference between mAP50 and mAP50–95 suggests that the models generally detect the visual event, although the bounding box does not always precisely fit its edges when a stricter overlap criterion is applied. From an operational standpoint, this behavior is acceptable, since the main purpose of the system is to alert the operator to a visible condition requiring review, rather than to delimit the object with perfect accuracy. In this scenario, YOLOv11n is competitive for frequent inference or deployment with limited computational resources, whereas YOLOv8n may be preferable when the goal is to slightly reduce false alarms. In both cases, detections should be interpreted as events subject to confirmation, particularly in the presence of intense reflections, shadows, or high contrast surface textures.
Figure 10 presents the AUC–ROC curves obtained for the surface changes analysis using YOLOv8n and YOLOv11n.
The AUC–ROC curves confirm high discriminative capacity in both models, with values of 0.934 for YOLOv8n and 0.932 for YOLOv11n. This difference is minimal and follows the same trend observed in the overall metrics, where both models showed practically equivalent results for detecting visible changes on the water surface.
4.3.3. Results for the Foam Presence Approach
The foam presence approach evaluates the models’ ability to identify visible foamy regions on the water surface. In the context of shrimp farming monitoring, this signal can function as a preventive indicator, as its appearance or persistence may be related to the accumulation of organic matter, aeration, water movement, or changes in the surface conditions of the pond. Unlike floating objects, foam does not always present a stable shape or clearly defined edges, meaning its detection requires distinguishing irregular patterns that can be confused with reflections, glare, or wave action.
Table 5 summarizes the performance of YOLOv8n and YOLOv11n on the test set. This subset consisted of 36 images and 9951 annotated instances, after reorganizing the dataset at the scene level and unifying the labels into the foam class. YOLOv8n achieved slightly higher values in precision, recall, F1-score, mAP50, and mAP50–95, although the differences with respect to YOLOv11n were small. Therefore, the interpretation of the table should consider not only the mAP value but also the balance between false detections and omissions, since foam can be confused with reflections, glare, wave action, or similar surface textures.
The results in Table 5 show that foam detection was more challenging than the previous approaches. YOLOv8n correctly identified 7843 instances, with 2322 false positives and 2108 false negatives, while YOLOv11n recorded 7818 true positives, 2358 false positives, and 2133 false negatives. The similarity between the two models indicates that there is no marked difference between architectures; rather, the main difficulty stems from the visual nature of foam, characterized by irregular, overlapping regions with poorly defined edges.
The F1-score of approximately 78% in both cases reflects a moderate balance between precision and recall. This means that the models are able to detect a substantial proportion of foamy regions, but still produce a relevant number of errors. False positives may arise when reflections, surface glare, or wave action present textures similar to foam, whereas false negatives may occur when foam is fragmented, of low density, or has low contrast relative to the water. Therefore, in an operational implementation, these detections should be treated as preliminary alerts and could be reinforced through temporal rules, such as confirming the presence of foam across several consecutive frames. Figure 11 shows the distribution of these errors for both models.
The detection metrics show small differences between the two architectures. YOLOv8n obtained an mAP50 of 0.767 and mAP50–95 of 0.588, while YOLOv11n achieved 0.758 and 0.584, respectively. In descriptive terms, YOLOv8n retains a slight advantage in detection accuracy, but YOLOv11n showed a shorter inference time, at 17.8 ms/img compared to 21.2 ms/img for YOLOv8n. Therefore, model selection depends on the operational criterion: prioritizing a slight improvement in detection accuracy or favoring a faster response for frequent monitoring.
Figure 12 presents the bootstrap distribution of the F1-score for the foam-presence approach. YOLOv8n obtained a mean F1-score of 0.7723, with a 95% confidence interval between 0.7588 and 0.7832, while YOLOv11n achieved a mean F1-score of 0.7808, with an interval between 0.7713 and 0.7900. Although YOLOv11n shows a slightly higher mean, the confidence interval for the YOLOv11–YOLOv8 difference was [-0.0021, 0.0214], which includes zero. Therefore, the difference cannot be considered statistically significant for this test set. This result reinforces that foam is a difficult visual signal: small variations in texture, glare, and density can affect the F1-score, meaning that detections should be interpreted as preliminary alerts rather than definitive automatic decisions.
In the AUC–ROC analysis, YOLOv8n achieved a value of 0.707 and YOLOv11n obtained 0.691, as shown in Figure 13. These values lie above the random classifier baseline and reflect moderate discriminative capacity for foam presence. The difference between models was small but favored YOLOv8n. This behavior is consistent with the visual difficulty of the phenomenon, characterized by dense, overlapping regions with poorly defined edges.
From the perspective of shrimp farming monitoring, these results show that foam detection is the most complex scenario and should be interpreted as a preliminary alert rather than a definitive automatic decision. Unlike a floating object or the feeding tray, foam does not always have clear boundaries and can be confused with reflections, surface glare, wave action, or water textures. Accordingly, the moderate mAP and AUC–ROC values indicate that the model identifies relevant patterns but still retains a significant proportion of false positives and false negatives. In a real world implementation, this detector should be combined with temporal rules, for example, confirming the presence of foam across several consecutive frames before triggering a higher priority alert.
4.4. General Comparison of Results
Table 6 summarizes the main indicators obtained across the three approaches. Overall, the results show that the scenarios present different levels of difficulty. Feed accumulation achieved high values with the segmentation models, particularly for the plate class; surface changes showed the best performance among the lightweight detection models; and foam presence maintained moderate values due to the visual complexity of dense and diffuse regions.
The joint reading of the results shows that each approach presents a different level of difficulty. Feed accumulation achieved the highest performance, largely due to the presence of a visually well-defined class such as the feeding tray. Surface changes also showed favorable performance, although with greater exposure to false detections caused by reflections, ambiguous debris, or water textures. Foam presence, in contrast, was the most complex scenario, as its regions tend to be irregular, diffuse, and visually similar to surface glare or wave action. Therefore, the interpretation of the results should take into account the visual nature of each condition, rather than relying solely on numerical comparisons between architectures.
In terms of application, these results support the feasibility of the system as a support tool for prioritizing inspections, recording relevant visual events, and generating early alerts. However, they also show that detections should not be assumed as definitive automatic decisions, but rather as signals requiring confirmation by the producer or responsible technician. Furthermore, validation using images captured directly in real shrimp ponds remains necessary to verify the system’s performance under diverse production conditions, including variations in lighting, turbidity, reflections, and surface water dynamics.
5. Discussion
5.1. Interpretation of the Results Obtained
The results obtained demonstrate that YOLO models constitute a viable alternative for incorporating computer vision into shrimp farming monitoring systems. Beyond the numerical comparison between metrics, the behavior of each approach should be analyzed in relation to the visual nature of the signal being evaluated, the size of the objects, the definition of their edges, the variability of the background, and the degree of similarity between the class of interest and the aquatic environment. For this reason, the discussion focuses on explaining why the models responded differently to each condition and what implications this behavior has for an operational alert system.
The comparison between YOLOv8 and YOLOv11 was carried out under homogeneous training configurations within each approach, keeping the data partition, input size, batch size, seed, and main training parameters constant. This experimental condition allows the observed differences to be interpreted as an effect of each architecture’s behavior with respect to the visual signal being evaluated.
In the feeding condition, the best performance can be explained by the presence of a more structured scene and by the existence of a relatively stable visual reference: the feeding tray. The plate class exhibits more consistent shape, size, contrast, and location than the other visual signals evaluated, which facilitates its separation from the background and reduces ambiguity during detection. This stability allows the model to learn more repeatable visual features and generate predictions with lower dispersion. In practical terms, this condition is favorable for monitoring, as the tray functions as a visual anchor point for interpreting activity or accumulation around a specific area. In contrast, the shrimp class accounted for most of the errors, owing to the organisms’ small size, overlap between individuals, posture variations, and chromatic similarity to the background. This difference confirms that the interpretation of the approach should be carried out on a per-class basis rather than relying solely on global averages.
These findings can be compared with previous studies focused on detecting residual feed in aquaculture. Real-time detection of uneaten pellets in underwater images using an improved YOLOv4 network, as well as the identification of uneaten feed with an enhanced YOLOv5 variant, constitute direct precedents for this task [29,30]. Similarly, feed waste detection in shrimp farming using YOLO and the development of a lightweight model for shrimp feed residues demonstrate the applicability of this model family to shrimp farming scenarios [27,28]. Compared with these works, the present proposal integrates visual analysis within a mobile/web architecture that includes storage, traceability, and an administrative dashboard.
In the surface condition, YOLOv8n and YOLOv11n showed similar performance, with YOLOv11n showing a slight advantage in mAP50 and a shorter inference time. This improvement can be explained by a better trade-off between representational capacity and computational cost in the YOLOv11n variant, which allows it to maintain competitive localization with fewer parameters and lower complexity. In tasks involving small or scattered floating objects, a more efficient architecture may favor generalization when the visual differences between the object, reflections, and water texture are subtle. Nevertheless, the observed advantage was small and should not be interpreted as absolute superiority, but rather as a favorable trend when frequent inference and deployment under limited computational resources are prioritized.
For its part, YOLOv8 maintains competitive performance and, in some indicators, a slightly more conservative behavior with respect to false detections. In the surface-change condition, YOLOv8n achieved marginally higher precision, recall, and F1-score values, suggesting a somewhat more stable response when the operational objective is to reduce false alarms without sacrificing event recovery. This characteristic is relevant in shrimp ponds, where reflections, shadows, or ambiguous debris can trigger unwanted detections. YOLOv8 should therefore not be regarded as an architecture surpassed by YOLOv11, but rather as a robust alternative when predictive stability, false-positive control, and consistency in visually noisy scenarios are prioritized.
The detection of surface changes is more complex than the detection of the feeding tray, as floating objects do not have a fixed shape or location. In addition, they may appear partially covered, at variable scales, or mixed with glare, shadows, and wave patterns. These factors explain why the models identify the presence of the visual event more easily than they delimit its exact boundaries. From an operational standpoint, this behavior remains useful, since the system’s objective is to generate an early visual alert and guide the operator’s inspection, rather than to produce a perfectly precise geometric delimitation of the debris or floating object.
In the foam condition, performance was lower than that observed in the other tasks because foam does not behave as a rigid object nor present clearly defined geometric boundaries. Unlike the feeding tray or certain floating objects, foam can fragment, merge with other regions, vary in density, and adopt irregular patterns within a single image. Its edges tend to be diffuse, and its texture can be confused with reflections, surface glare, turbulence, or wave action. This affects both classification and localization, as the model must determine whether a given region truly corresponds to foam or to a normal variation of the water surface. Consequently, the problem does not consist solely of detecting a class, but of visually separating a diffuse condition from other natural surface patterns in the pond.
The slight advantage of YOLOv8n in the foam condition is particularly relevant to the discussion, as it shows that the most recent version does not necessarily improve performance across all visual signals. For this dataset, YOLOv8n was able to better preserve certain local texture details or respond more sensitively to dense, irregular regions, which is reflected in its higher mAP50, mAP50–95, and AUC–ROC values relative to YOLOv11n. In contrast, YOLOv11n maintained very similar performance with a shorter inference time, making it attractive for frequent monitoring despite its slightly lower mAP50. Consequently, the difficulty associated with foam detection is not primarily explained by a limitation of a specific architecture, but rather by the visual ambiguity of the phenomenon itself. This condition should therefore be interpreted as a preventive signal within the alert system, where the temporal persistence of detections can provide greater reliability than a single, isolated prediction.
The comparison between YOLOv8 and YOLOv11, therefore, does not reveal a single overall winner across all conditions. YOLOv11 offers efficiency advantages and shorter inference times among the lightweight models evaluated, while YOLOv8 retains highly competitive performance and may be more favorable when the visual signal demands greater sensitivity to texture or when the goal is to reduce false alarms. This finding is important for the proposed system, as model selection depends not only on mAP but also on the type of signal, the computational cost, and the operational alerting criterion.
Overall, the results show that the differences between approaches reflect a hierarchy of visual complexity. Feed detection performs best due to the presence of a stable reference and classes with more consistent patterns; surface changes present intermediate difficulty owing to the variability of objects and backgrounds; and foam represents the most challenging case because of its diffuse, deformable nature and its visual similarity to other water patterns. This interpretation allows the results to be understood beyond their numerical values and guides the operational use of each detector within the prototype.
5.2. Study Limitations
A significant limitation concerns the use of public datasets of heterogeneous sizes. Although the test set for the feeding condition contains 240 images and provides a consistent basis for comparing segmentation models, its scenes originate from tanks rather than from open shrimp ponds in Guayas. Similarly, the other datasets represent useful visual signals but do not substitute for local validation under real production environments. Furthermore, the three signals were evaluated using independent sets and training processes, meaning that the study does not yet demonstrate a simultaneous detector based on an integrated, multiclass dataset. Regarding temporal performance, the study reports the average per-image inference time for the lightweight surface and foam models, allowing an initial assessment of their computational feasibility within the prototype. Accordingly, a subsequent stage should incorporate images captured directly in the field, under different environmental conditions, times of day, turbidity levels, and operational states, and build an integrated dataset that enables the joint training or validation of feed, surface-change, and foam detection.
5.3. Implications for Shrimp Farming Monitoring
Another aspect to consider is technological integration. Although the prototype includes a mobile application, an API, a database, and a web dashboard, its deployment in real-world environments will require strengthening security mechanisms, credential management, user control, alert traceability, and connectivity stability. These improvements are necessary to advance from an academic prototype toward an operational solution.
6. Conclusions
This article presents a prototype of an adaptive intelligent system for the visual monitoring of shrimp ponds using computer vision. The proposed system integrates a mobile application, processing services, results storage, and an administrative web dashboard, with the aim of recording visual events, organizing monitoring traceability, and facilitating alert visualization. In this sense, the main contribution of this work is not limited to the use of detection models, but extends to the integration of a functional workflow for capturing images, analyzing them, storing the results, and presenting them in a useful manner for the operational monitoring of the pond.
The results obtained show that the evaluated YOLO models are able to differentiate visual signals of operational interest, with performance levels consistent with the complexity of each condition. In feed accumulation, the segmentation models achieved mAP50 values above 0.98 for both BOX and MASK, with the plate class standing out as a stable visual reference. For the shrimp class, the bootstrap analysis of the F1-score showed a statistically significant advantage of YOLOv11m-seg over YOLOv8m-seg, with a 95% confidence interval for the difference of [0.0025, 0.0147]. In surface changes, YOLOv8n and YOLOv11n achieved mAP50 values of 0.884 and 0.885, respectively, and AUC–ROC values above 0.93; however, the F1-score bootstrap analysis indicated that the difference between architectures was not statistically significant, meaning that both models offer solid performance for detecting floating objects or alterations on the water surface.
Foam presence constituted the most demanding visual scenario, yet the models maintained useful results for an alert system, with mAP50 values of 0.767 for YOLOv8n and 0.758 for YOLOv11n. The bootstrap analysis showed a mean F1-score of 0.7723 for YOLOv8n and 0.7808 for YOLOv11n, with a non-significant difference between architectures, confirming that the main difficulty stems from the visual nature of foam rather than from an isolated limitation of a specific model. From a computational standpoint, the reported inference times show favorable behavior for frequent monitoring: in surface changes, 4.1 ms/img was obtained with YOLOv8n and 3.9 ms/img with YOLOv11n, while in foam detection, 21.2 ms/img and 17.8 ms/img were recorded, respectively. Overall, these results support the usefulness of the prototype as a technological tool to assist visual inspection, prioritize events, and strengthen the operational management of shrimp ponds through traceable visual alerts.
Author Contributions
Conceptualization, G.R., D.A.-R. and R.N.-T.; methodology, D.A.-R., R.N.-T., R.T.-B. and C.G.-R.; software, D.A.-R. and R.N.-T.; validation, D.A.-R., R.N.-T., G.R. and R.T.-B.; formal analysis, D.A.-R., R.N.-T., L.L. and W.H.; investigation, D.A.-R., R.N.-T., G.R. and D.R.; resources, G.R., D.R., J.B.-M. and C.G.-R.; data curation, D.A.-R. and R.N.-T.; writing—original draft preparation, D.A.-R. and R.N.-T.; writing—review and editing, G.R., R.T.-B., L.L., W.H., D.R., J.B.-M. and C.G.-R.; visualization, D.A.-R. and R.N.-T.; supervision, G.R., R.T.-B., L.L., W.H. and C.G.-R.; project administration, G.R., D.R., J.B.-M. and C.G.-R.; funding acquisition, G.R., D.R., J.B.-M. and C.G.-R. All authors have read and agreed to the published version of the manuscript.
Funding
The authors gratefully acknowledge the financial support provided by the Vicerrectorado de Investigación e Innovación Social of the Universidad Bolivariana del Ecuador, whose backing contributed to the development and publication of this work.
Institutional Review Board Statement
Not applicable.
Informed Consent Statement
Not applicable.
Data Availability Statement
The image dataset supporting this article has been deposited in Zenodo and is publicly available under the Creative Commons Attribution 4.0 International (CC BY 4.0) license. The dataset can be accessed via the following DOI: https://doi.org/10.5281/zenodo.20819015.
Acknowledgments
The authors gratefully acknowledge the methodological support provided by the Instituto Latinoamericano de Futuros de la Educación through the WISE: AI Literacy Hub research network (PROY-INB-UBE-030) of the Universidad Bolivariana del Ecuador, whose guidance contributed to the development of this study. The authors also acknowledge the technical support provided by the Artificial Intelligence Research Group of the Universidad Bolivariana del Ecuador (GIIA).
Use of Artificial Intelligence Tools Statement
During the preparation of this manuscript, the authors used ChatGPT (GPT-5.2, OpenAI) for language editing, text organization, and improvements in clarity and readability. The authors carefully reviewed and edited the generated content and take full responsibility for the content of this publication.
Conflicts of Interest
The authors declare no conflicts of interest.
References
- Kajornkasirat, S.; Ruangsri, J.; Sumat, C.; Intaramontri, P. Online Analytics for Shrimp Farm Management to Control Water Quality Parameters and Growth Performance. Sustainability 2021, 13, 5839. [CrossRef]
- Terven, J.; Córdova-Esparza, D.M.; Romero-González, J.A. A Comprehensive Review of YOLO Architectures in Computer Vision: From YOLOv1 to YOLOv8 and YOLO-NAS. Machine Learning and Knowledge Extraction 2023, 5, 1680–1716. [CrossRef]
- Wang, Z.; Zhang, X.; Su, Y.; Li, W.; Yin, X.; Li, Z.; Ying, Y.; Wang, J.; Wu, J.; Miao, F.; Zhao, K. Abnormal Behavior Monitoring Method of Larimichthys crocea in Recirculating Aquaculture System Based on Computer Vision. Sensors 2023, 23, 2835. [CrossRef]
- Iman, M.; Arabnia, H.R.; Rasheed, K. A Review of Deep Transfer Learning and Recent Advancements. Technologies 2023, 11, 40. [CrossRef]
- Ali, M.L.; Zhang, Z. The YOLO Framework: A Comprehensive Review of Evolution, Applications, and Benchmarks in Object Detection. Computers 2024, 13, 336. [CrossRef]
- Capetillo-Contreras, O.; Pérez-Reynoso, F.D.; Zamora-Antuñano, M.A.; Álvarez-Alvarado, J.M.; Rodríguez-Reséndiz, J. Artificial Intelligence-Based Aquaculture System for Optimizing the Quality of Water: A Systematic Analysis. Journal of Marine Science and Engineering 2024, 12, 161. [CrossRef]
- Zion, B. The Use of Computer Vision Technologies in Aquaculture–A Review. Computers and Electronics in Agriculture 2012, 88, 125–132. [CrossRef]
- Føre, M.; Frank, K.; Norton, T.; Svendsen, E.; Alfredsen, J.A.; Dempster, T.; Eguiraun, H.; Watson, W.; Stahl, A.; Sunde, L.M.; Schellewald, C.; Skøien, K.R.; Alver, M.O.; Berckmans, D. Precision Fish Farming: A New Framework to Improve Production in Aquaculture. Biosystems Engineering 2018, 173, 176–193. [CrossRef]
- Barbedo, J.G.A. A Review on the Use of Computer Vision and Artificial Intelligence for Fish Recognition, Monitoring, and Management. Fishes 2022, 7, 335. [CrossRef]
- Liu, D.; Zhang, X.; Wang, Z.; Zhang, J. Application of Deep Learning-Based Object Detection Techniques in Fish Aquaculture: A Review. Journal of Marine Science and Engineering 2023, 11, 867. [CrossRef]
- Zhang, Y.; Phillips, P.; Wang, X.; Li, W.; Liu, Y.; Gong, J.; Ma, X.; Sun, X.; Zhang, Y.; Wang, X. Intelligent Fish Feeding Based on Machine Vision: A Review. Aquacultural Engineering 2023, 102, 102333. [CrossRef]
- Wang, Y.; Li, D.; Li, L.; Wang, J.; Zhang, X. Automatic Monitoring of Relevant Behaviors for Crustacean Production in Aquaculture. Animals 2021, 11, 2700. [CrossRef]
- Yu, C.; Fan, X.; Hu, Z.; Xia, X.; Zhao, Y.; Li, R.; Bai, Y. Segmentation and Measurement Scheme for Fish Morphological Features Based on Mask R-CNN. Information Processing in Agriculture 2023, 10, 100–111. [CrossRef]
- Xu, W.; Yu, H.; Cheng, Z.; Liu, Y.; Wang, X.; Li, D. Detection of Uneaten Fish Food Pellets in Underwater Images Based on Improved YOLOv5. Aquacultural Engineering 2023, 102, 102338.
- Reis, J.; Novriadi, R.; Swanepoel, A.; Jingping, G.; Rhodes, M.; Davis, D.A. Optimizing Feed Automation: Improving Timer-Feeder and On-Demand Systems in Semi-Intensive Pond Culture of Shrimp Litopenaeus vannamei. Aquaculture 2020, 519, 734759. [CrossRef]
- Ullman, C.; Rhodes, M.; Davis, D.A. Feed Management and the Use of Automatic Feeders in the Pond Production of Pacific White Shrimp Litopenaeus vannamei. Aquaculture 2021, 532, 735975. [CrossRef]
- Lai, Q.; Li, W.; Zhang, J.; Yuan, X.; Sun, X.; Li, J.; Liu, S. Non-Destructive Estimation of Shrimp Fresh Weight Using an Eyeball Recognition Method and Machine Learning. Aquacultural Engineering 2019, 86, 102000.
- Saleh, A.; Akbar, M.A.; Kim, H.C. Vision-Based Body Weight Estimation of Pacific White Shrimp Using Morphometric Features and Machine Learning. Computers and Electronics in Agriculture 2024, 218, 108714.
- Kanwal, S.; Abdullah, M.; Kumar, S.; Arshad, S.; Shahroz, M.; Zhang, D.; Kumar, D. An Optimal Internet of Things-Driven Intelligent Decision-Making System for Real-Time Fishpond Water Quality Monitoring and Species Survival. Sensors 2024, 24, 7842. [CrossRef]
- Huang, Y.P.; Khabusi, S.P. Artificial Intelligence of Things (AIoT) Advances in Aquaculture: A Review. Processes 2025, 13, 73. [CrossRef]
- Trigka, M.; Dritsas, E. A Comprehensive Survey of Machine Learning Techniques and Models for Object Detection. Sensors 2025, 25, 214. [CrossRef]
- Villamar-Barros, H.; Coronel-Reyes, J.; Haro-Sarango, A. Early Anomaly Detection in Shrimp Pond Water Quality Using Supervised and Unsupervised Machine Learning Models. Digital 2026, 6, 27. [CrossRef]
- Correia, T.; et al. Image-Based Shrimp Aquaculture Monitoring. Sensors 2025, 25, 248.
- Yusoff, M.; et al. The Prototype of a Smart Underwater Surveillance System for Shrimp Farming. In Proceedings of AMCON; IEEE, 2018.
- Correia, T.; et al. AI-assisted Automated Pipeline for Length Estimation, Visual Assessment of the Digestive Tract and Counting of Shrimp in Aquaculture Production. In Proceedings of VISAPP; 2021; pp. 710–716.
- Pham, H.; et al. Counting and measuring the size and stomach fullness levels for an intelligent shrimp farming system. Connection Science 2023.
- Ariyanto, R.; et al. The Waste Detection System of Shrimp Feeding with a Waterproof Camera using YOLO Algorithm. Journal of Physics: Conference Series 2022, 2312, 012083.
- Hu, X.; et al. YOLO-Shrimp: A Lightweight Detection Model for Shrimp Feed Residues Fusing Multi-Attention Features. Sensors 2026, 26, 791. [CrossRef]
- Li, D.; et al. Real-time detection of uneaten feed pellets in underwater images for aquaculture using an improved YOLO-V4 network. Computers and Electronics in Agriculture 2021.
- Zhou, C.; et al. A method for detecting uneaten feed based on improved YOLOv5. Computers and Electronics in Agriculture 2023.
- Li, Y.; et al. Instance Segmentation of Shrimp Based on Contrastive Learning. Applied Sciences 2023, 13, 6979.
- Author, A.; et al. Shrimp Body Weight Estimation in Aquaculture Ponds Using Morphometric Features Based on Underwater Image Analysis and Machine Learning Approach. Revue d’Intelligence Artificielle 2022, 36.
- Author, A.; et al. Computer Vision Based Estimation of Shrimp Population Density and Size. In Proceedings of ISEE; IEEE, 2021.
- Tran, H.; et al. An Integrated IoT and AI Monitoring System for Early Shrimp Disease Detection in Vietnam. Science and Technology Development Journal 2024.
- Nguyen, T.; et al. Edge-IoT ConvNeXt-CBAM System for Real-Time Classification of Shrimp Health Conditions. In Proceedings of ATC; IEEE, 2025.
- Abdullah, A.; et al. IoT Based Automated Fish Farm Aquaculture Monitoring System. In Proceedings of ICISET; IEEE, 2018.
- Reyes, G.; Lanzarini, L.; Hasperué, W.; Bariviera, A.F. GPS trajectory clustering method for decision making on intelligent transportation systems. Journal of Intelligent & Fuzzy Systems 2020, 38, 5529–5535.
- Reyes, G.; Tolozano-Benites, R.; Lanzarini, L.; Estrebou, C.; Bariviera, A.F.; et al. Methodology for the Identification of Vehicle Congestion Based on Dynamic Clustering. Sustainability 2023, 15, 16575. [CrossRef]
- Reyes, G.; Lanzarini, L.; Hasperué, W.; Bariviera, A.F. Proposal for a Pivot-Based Vehicle Trajectory Clustering Method. Transportation Research Record 2022, 2676, 281–295.
- Reyes, G.; Lanzarini, L.; Estrebou, C.; Bariviera, A.F. Dynamic grouping of vehicle trajectories. Journal of Computer Science & Technology 2022, 22, 141–150.
- Reyes, G.; Lanzarini, L.C.; Estrebou, C.A.; Maquilón, V. Vehicular flow analysis using clusters. In Proceedings of the XXVII Congreso Argentino de Ciencias de la Computación (CACIC); 2021.
- Lanzarini, L.C.; Hasperué, W.; Villa Monte, A.; Jimbo Santana, P.; et al. Minería de datos, minería de textos y Big Data. In Proceedings of the XXI Workshop de Investigadores en Ciencias de la Computación (WICC); 2019.
- Zambrano, G.R.; Vera, L.O. Reference architecture for an intelligent transportation system. International Journal of Innovation and Applied Studies 2016, 15, 175.
- Reyes, G.; Estrada, V.; Tolozano-Benites, R.; Maquilón, V. Batch Simplification Algorithm for Trajectories over Road Networks. ISPRS International Journal of Geo-Information 2023, 12, 399. [CrossRef]
- Qiao, X.; et al. IWHR_AI_Lable_Floater_V1: An annotated dataset for floating object detection in inland waters. Scientific Data 2025. Available online: https://www.nature.com/articles/s41597-025-04594-9.
- Sevil, Y. Foam Analysis Dataset, Version 14. Roboflow Universe, 2024. Available online: https://universe.roboflow.com/ykselcan-sevil/foam-analysis.
Figure 1.
Architecture of the proposed monitoring system. Authors’ own elaboration.
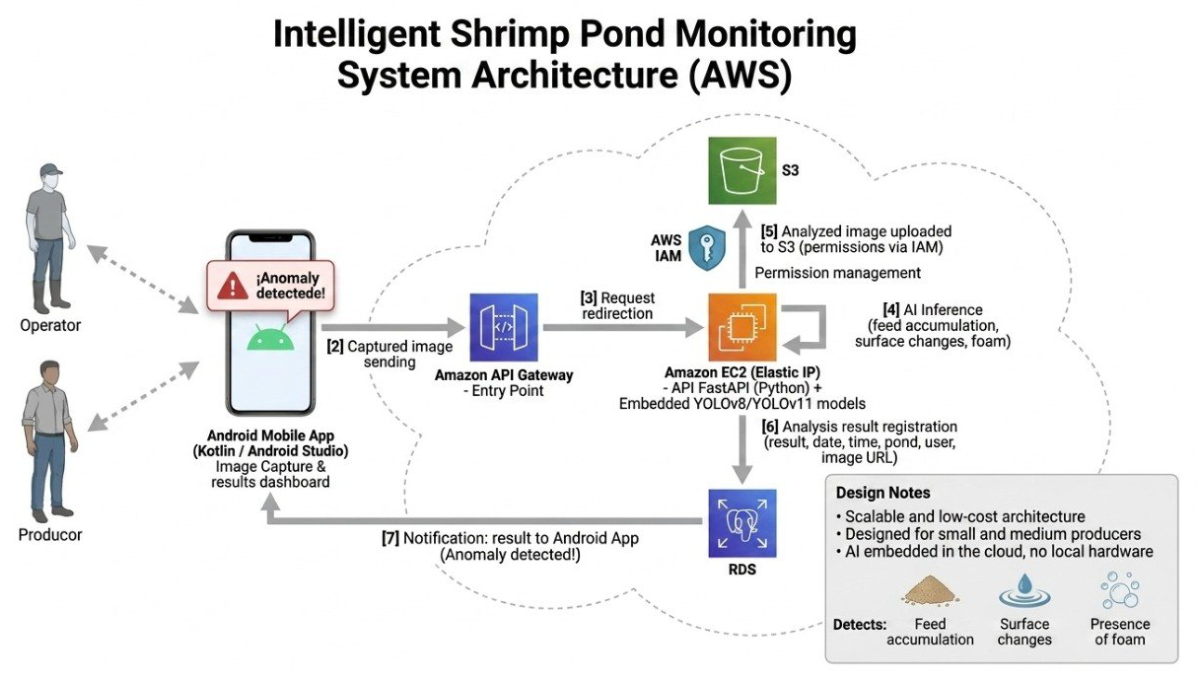
Figure 2.
Example of visual detection of shrimp feed residues in a context associated with the feeding tray. Source: Taken from Hu et al. [28].
Figure 2.
Example of visual detection of shrimp feed residues in a context associated with the feeding tray. Source: Taken from Hu et al. [28].
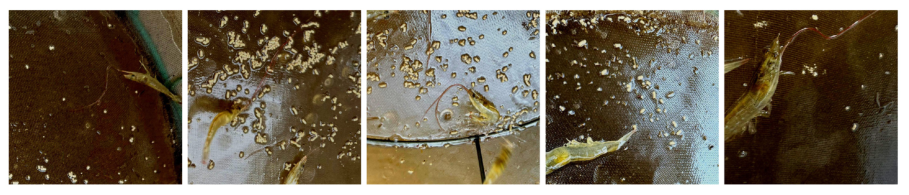
Figure 3.
Surface changes associated with floating objects and visible debris on bodies of water. This type of scene can represent anomalous conditions that may be used as a reference to generate visual alerts in shrimp ponds. Source: Taken from Qiao et al. [45].
Figure 3.
Surface changes associated with floating objects and visible debris on bodies of water. This type of scene can represent anomalous conditions that may be used as a reference to generate visual alerts in shrimp ponds. Source: Taken from Qiao et al. [45].
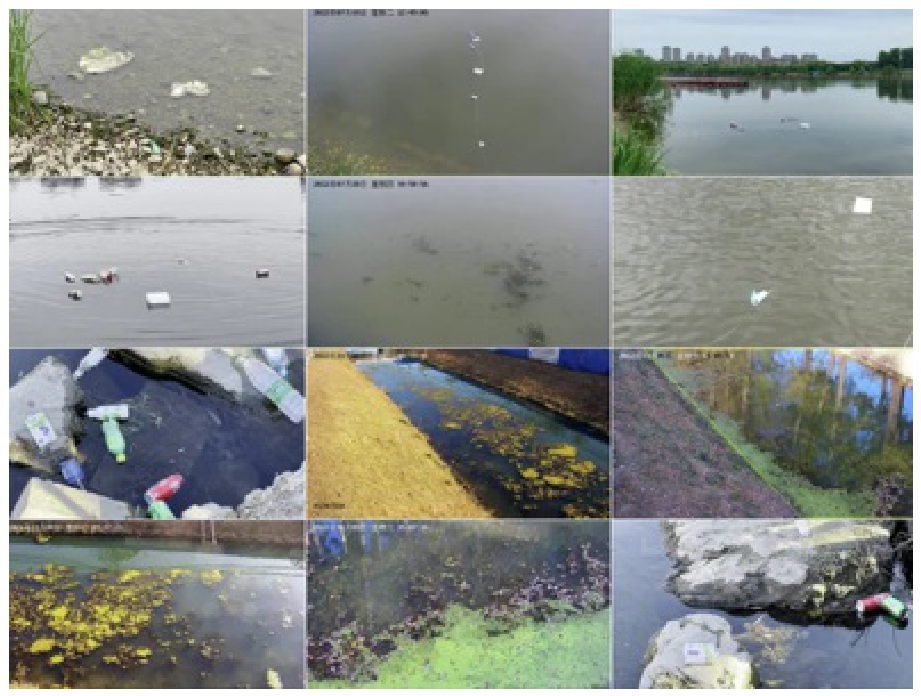
Figure 4.
Foam presence on the water surface, characterized by irregular regions and diffuse boundaries that can be confused with reflections or surface textures. This condition is considered a preventive visual signal for initiating inspection or temporal monitoring within the monitoring system. Source: Taken from Sevil [46].
Figure 4.
Foam presence on the water surface, characterized by irregular regions and diffuse boundaries that can be confused with reflections or surface textures. This condition is considered a preventive visual signal for initiating inspection or temporal monitoring within the monitoring system. Source: Taken from Sevil [46].
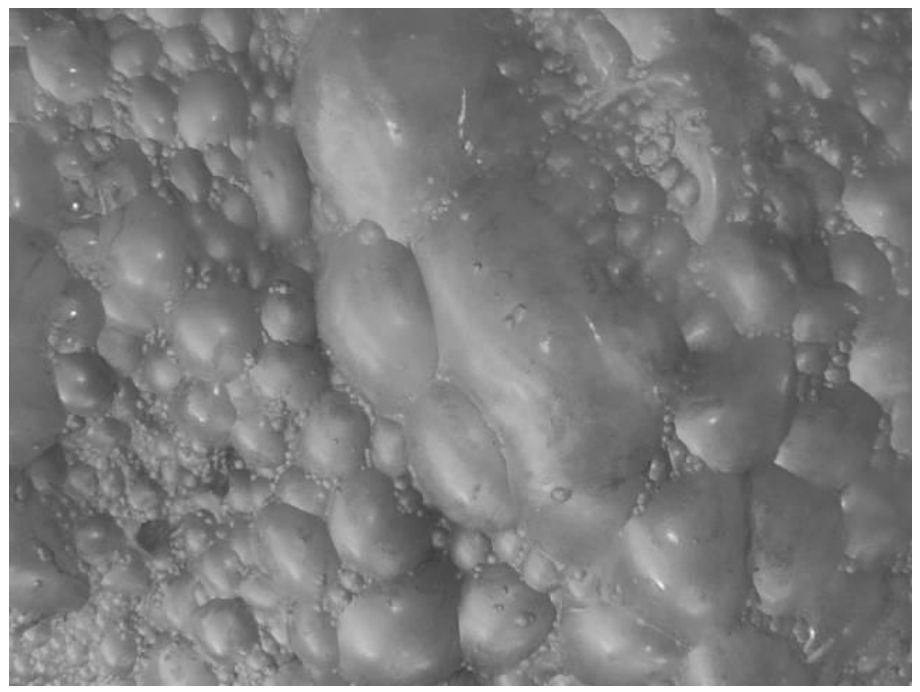
Figure 5.
Confusion matrices for the feed accumulation dataset.
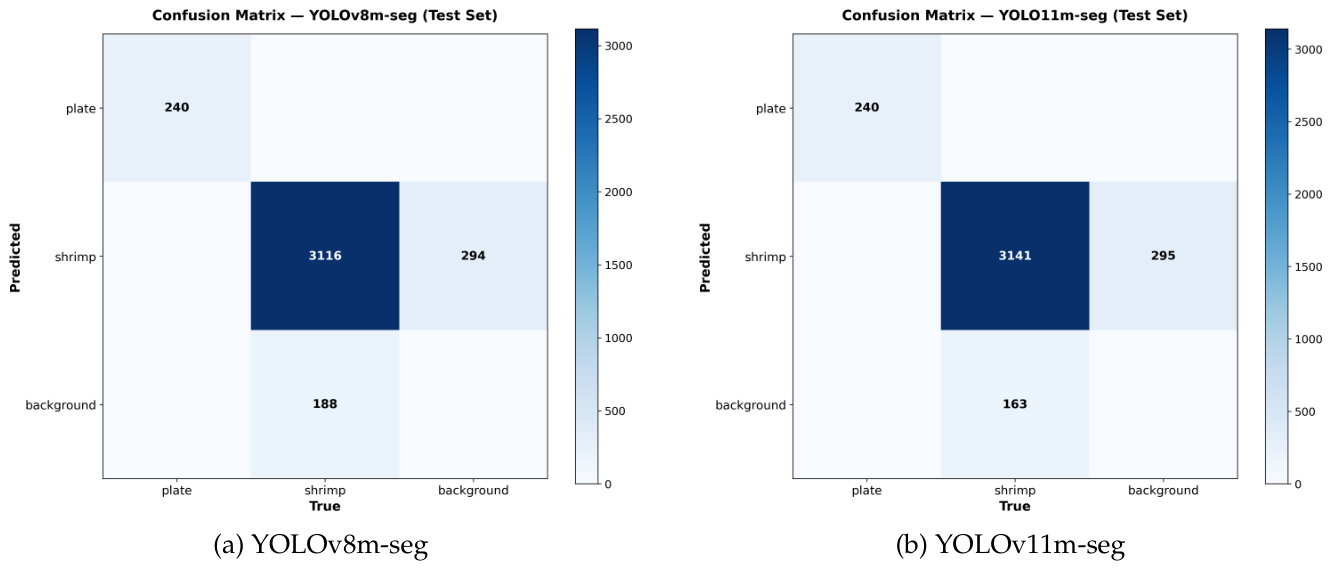
Figure 6.
Bootstrap distribution of the F1-score for the shrimp class in the feed accumulation dataset.
Figure 6.
Bootstrap distribution of the F1-score for the shrimp class in the feed accumulation dataset.
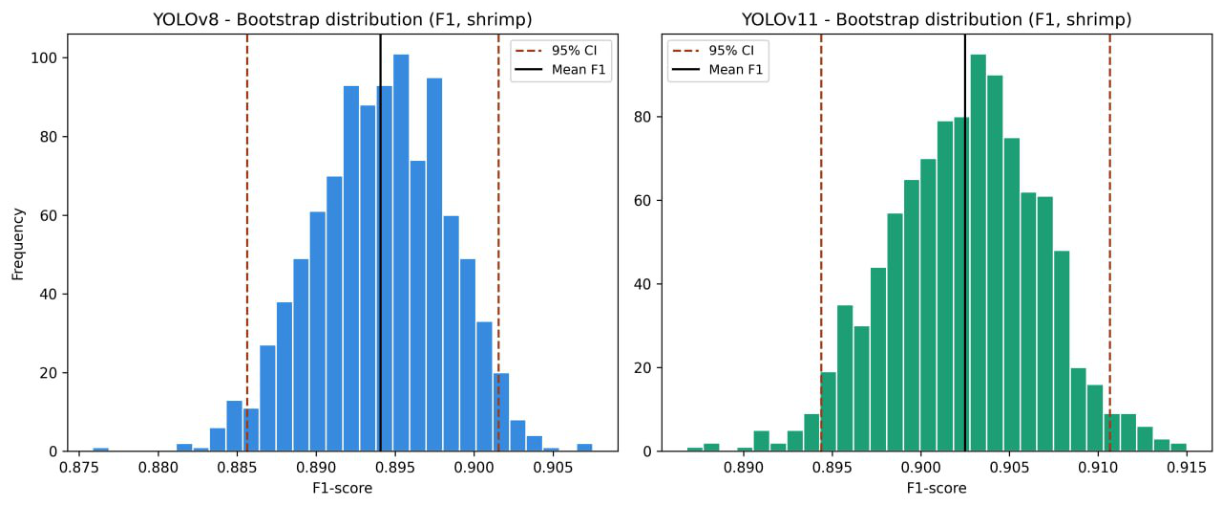
Figure 7.
Evolution of mAP50 during model training on the feed accumulation dataset.
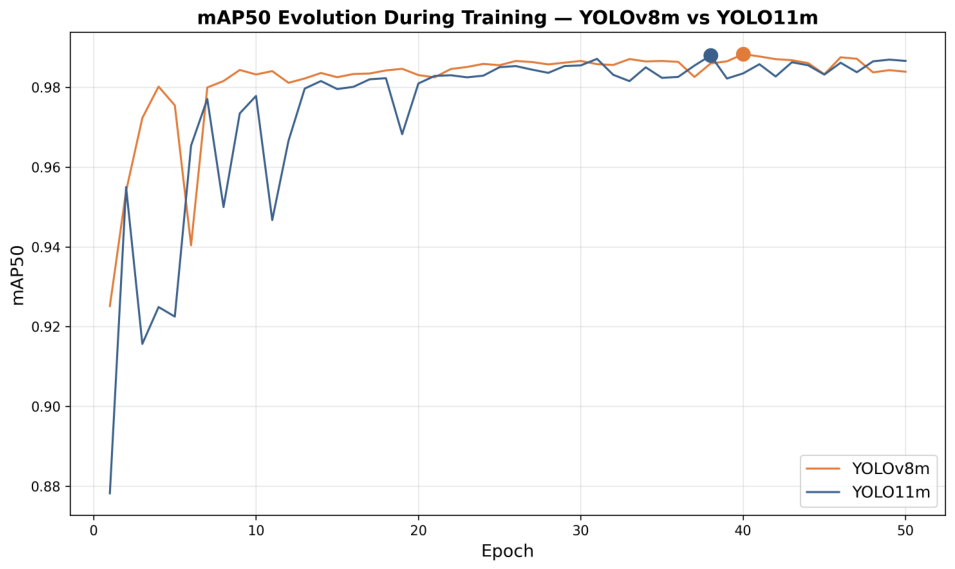
Figure 8.
Bootstrap distribution of the F1-score for the surface changes dataset.
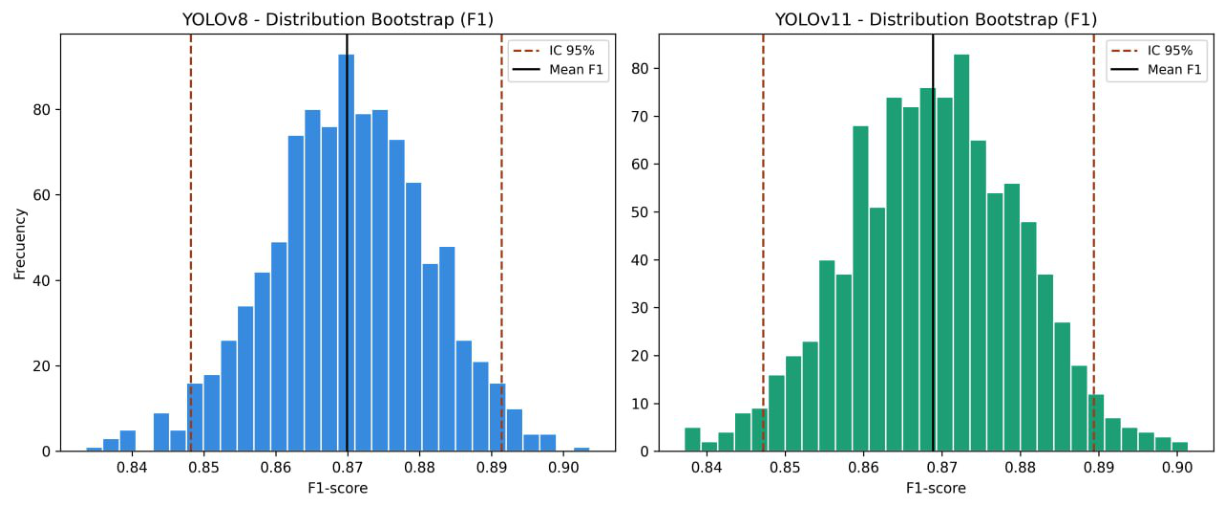
Figure 9.
Confusion matrices for the surface changes dataset.
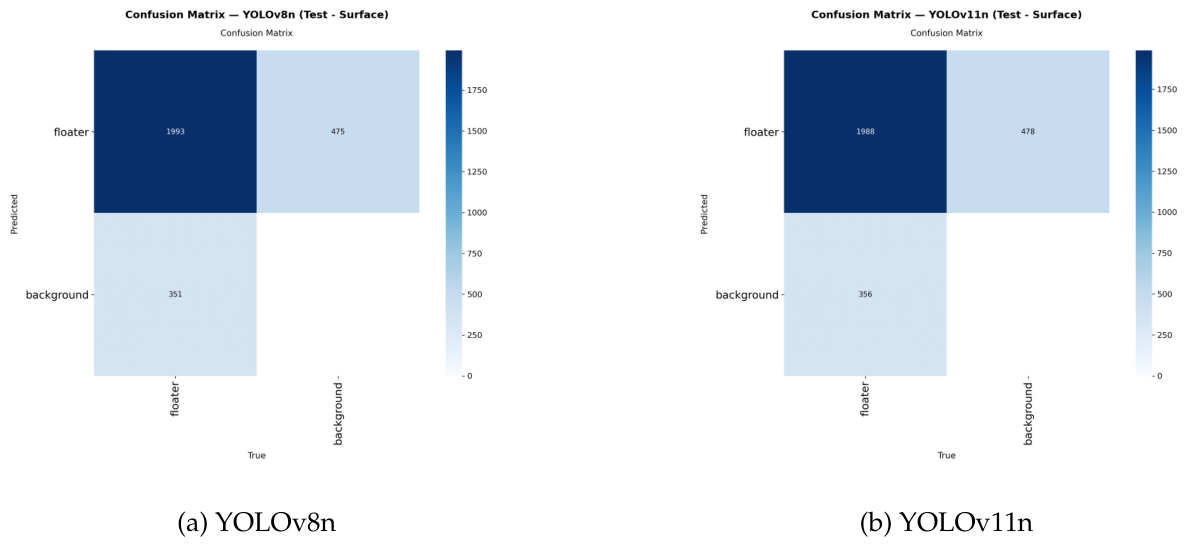
Figure 10.
AUC–ROC curves for the surface changes dataset.
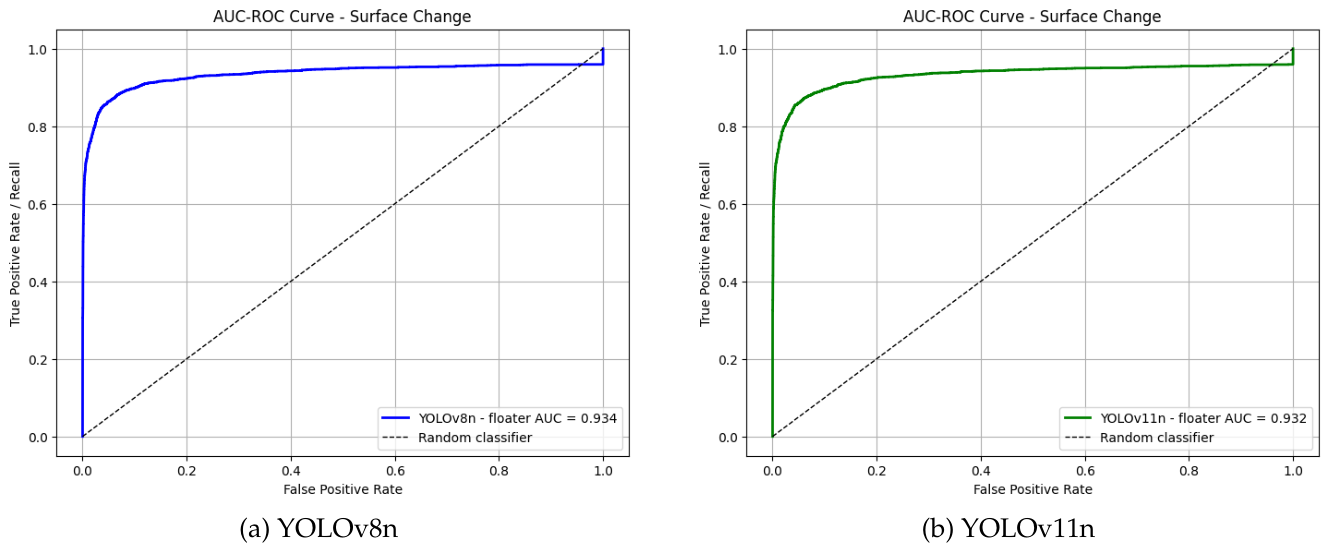
Figure 11.
Confusion matrices for the foam presence dataset.
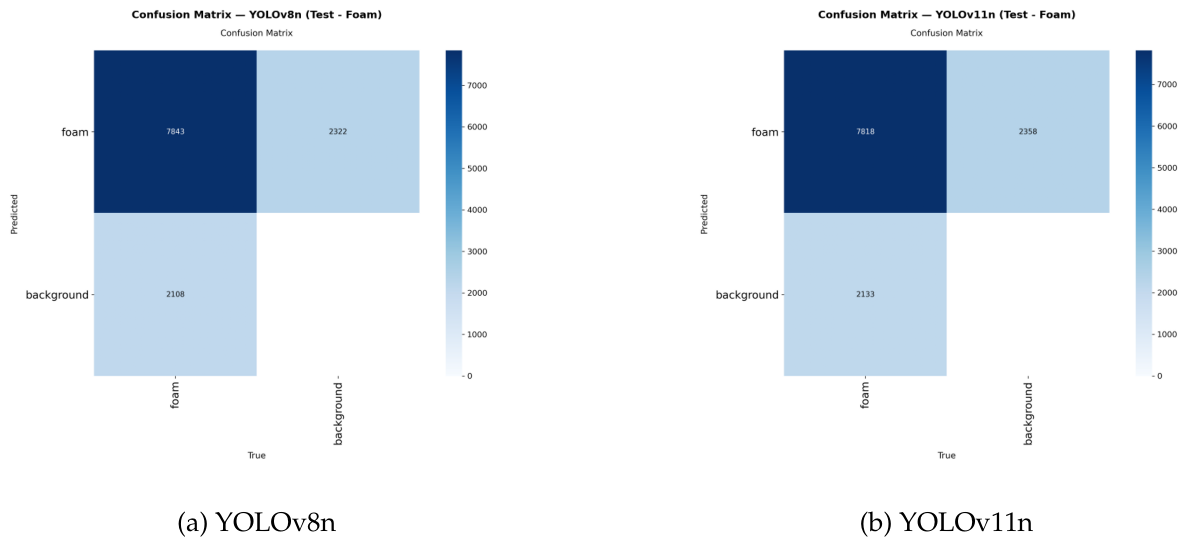
Figure 12.
Bootstrap distribution of the F1-score for the foam presence dataset.
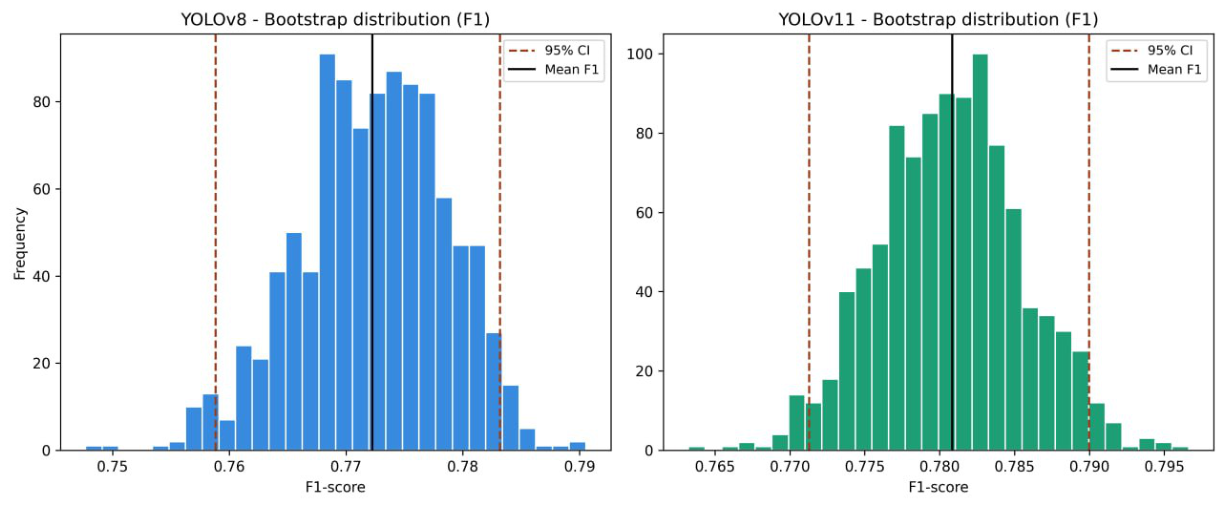
Figure 13.
AUC–ROC curves for the foam presence dataset.
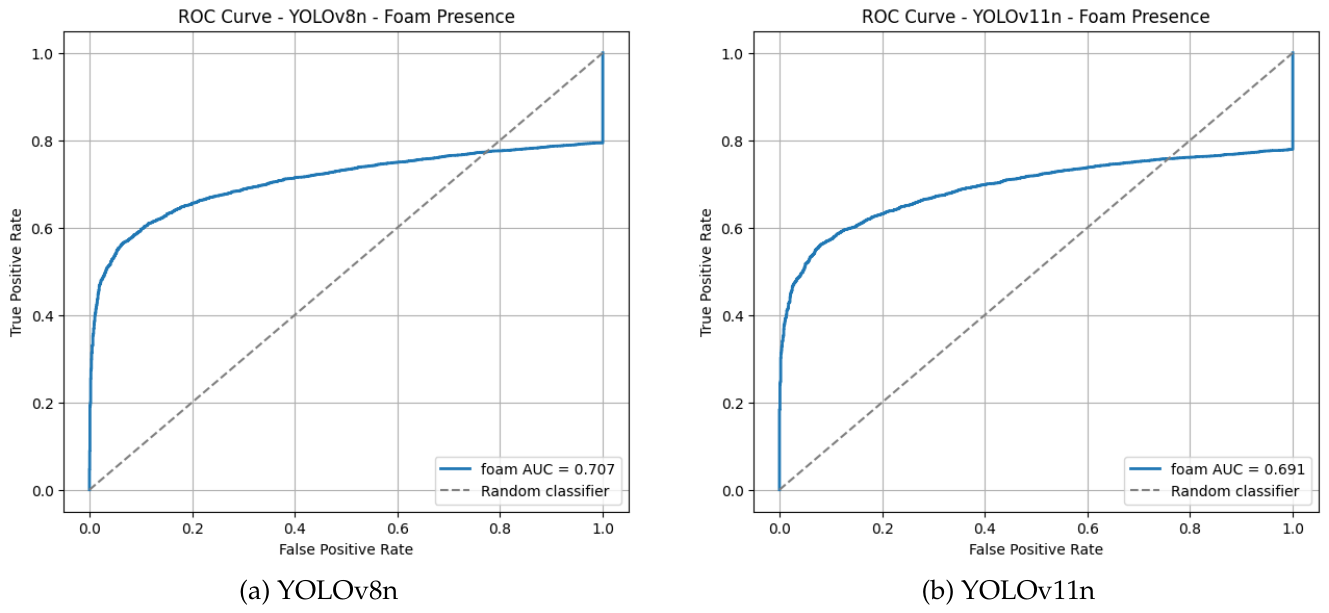

Table 1.
Datasets used in the experimental evaluation.
| Approach | Classes | Total | Experimental split | ||
| Training | Validation | Test | |||
| Feed accumulation | plate, shrimp | 1140 | 765 | 135 | 240 |
| Surface changes | floater | 3000 | 2400 | 300 | 300 |
| Foam presence | foam | 362 | 291 | 35 | 36 |
Table 2.
General training parameters.
| Parameter | Value |
| Compared models | YOLOv8n and YOLOv11n for detection; YOLOv8m-seg and YOLOv11m-seg for feed segmentation |
| Image size | 640 × 640 px for foam and surface changes; 512 × 512 px for feed |
| Batch size | 16 images |
| Maximum epochs | 50 for foam and feed; 100 for surface changes |
| Patience | 20 epochs for foam and surface changes; 15 epochs for feed |
| Seed | 42 |
| Metrics | Precision, recall, F1-score, mAP@50, mAP@50–95, and BOX/MASK metrics according to the evaluated task |
Table 3.
Class-specific results for the feed accumulation dataset.
| Model | Class | Inst. | TP | TN | FP | FN | Prec. | Rec. | F1 | mAP50 | mAP50–95 |
| YOLOv8m-seg | plate | 240 | 240 | – | 0 | 0 | 100 | 100 | 100 | 99.5 | 99.5 |
| YOLOv8m-seg | shrimp | 3304 | 3116 | – | 294 | 188 | 91.38 | 91.38 | 92.82 | 97.3 | 79.3 |
| YOLOv11m-seg | plate | 240 | 240 | – | 0 | 0 | 100 | 100 | 100 | 99.5 | 99.5 |
| YOLOv11m-seg | shrimp | 3304 | 3141 | – | 295 | 163 | 91.41 | 95.07 | 93.2 | 97.0 | 80.1 |
Note: Inst.: instances; Prec.: precision; Rec.: recall. Interpretation of the model’s confusion matrix based on BOX metrics. Authors’ own elaboration.
Table 4.
Results of YOLOv8n and YOLOv11n on the surface changes dataset.
| Model | Class | Inst. | VP | VN | FP | FN | Prec. | Rec. | F1 | mAP50 | mAP50–95 | ms/img |
| YOLOv8n | floater | 2344 | 1993 | – | 475 | 351 | 80,75 | 85,03 | 82,83 | 88,4 | 64,1 | 4,1 |
| YOLOv11n | floater | 2344 | 1988 | – | 478 | 356 | 80,62 | 84,81 | 82,66 | 88,5 | 64,1 | 3,9 |
Note: Inst.: instances; Prec.: precision; Rec.: recall; ms/img: average inference time per image. Interpretation of the confusion matrices for the YOLOv8n and YOLOv11n models. Authors’ own elaboration.
Table 5.
Results of YOLOv8n and YOLOv11n on the foam presence dataset.
| Model | Class | Inst. | VP | VN | FP | FN | Prec. | Rec. | F1 | mAP50 | mAP50–95 | ms/img |
| YOLOv8n | foam | 9951 | 7843 | – | 2322 | 2108 | 77,16 | 78,82 | 77,98 | 76,7 | 58,8 | 21,2 |
| YOLOv11n | foam | 9951 | 7818 | – | 2358 | 2133 | 76,83 | 78,56 | 77,69 | 75,8 | 58,4 | 17,8 |
Note: Inst.: instances; Prec.: precision; Rec.: recall; ms/img: average inference time per image. Interpretation table of the confusion matrices for the YOLOv8n and YOLOv11n models. Authors’ own elaboration.
Table 6.
Comparative summary of results by approach.
| Approach | Model | mAP50 | mAP50-95 | AUC–ROC | ms/img |
| Feed accumulation (BOX) | YOLOv8m-seg | 0.982 | 0.897 | Not defined for plate | – |
| Feed accumulation (BOX) | YOLOv11m-seg | 0.985 | 0.898 | Not defined for plate | – |
| Feed accumulation (MASK) | YOLOv8m-seg | 0.982 | 0.810 | Not defined for plate | – |
| Feed accumulation (MASK) | YOLOv11m-seg | 0.986 | 0.817 | Not defined for plate | – |
| Surface changes | YOLOv8n | 0.884 | 0.641 | 0.934 | 4,1 |
| Surface changes | YOLOv11n | 0.885 | 0.640 | 0.932 | 3,9 |
| Foam presence | YOLOv8n | 0.767 | 0.588 | 0.707 | 21,2 |
| Foam presence | YOLOv11n | 0.758 | 0.584 | 0.691 | 17,8 |
Disclaimer/Publisher’s Note: The statements, opinions and data contained in all publications are solely those of the individual author(s) and contributor(s) and not of MDPI and/or the editor(s). MDPI and/or the editor(s) disclaim responsibility for any injury to people or property resulting from any ideas, methods, instructions or products referred to in the content. |
© 2026 by the authors. Licensee MDPI, Basel, Switzerland. This article is an open access article distributed under the terms and conditions of the Creative Commons Attribution (CC BY) license (http://creativecommons.org/licenses/by/4.0/).
Copyright: This open access article is published under a Creative Commons CC BY 4.0 license, which permit the free download, distribution, and reuse, provided that the author and preprint are cited in any reuse.