

Submitted:
22 July 2026
Posted:
23 July 2026
You are already at the latest version
Abstract
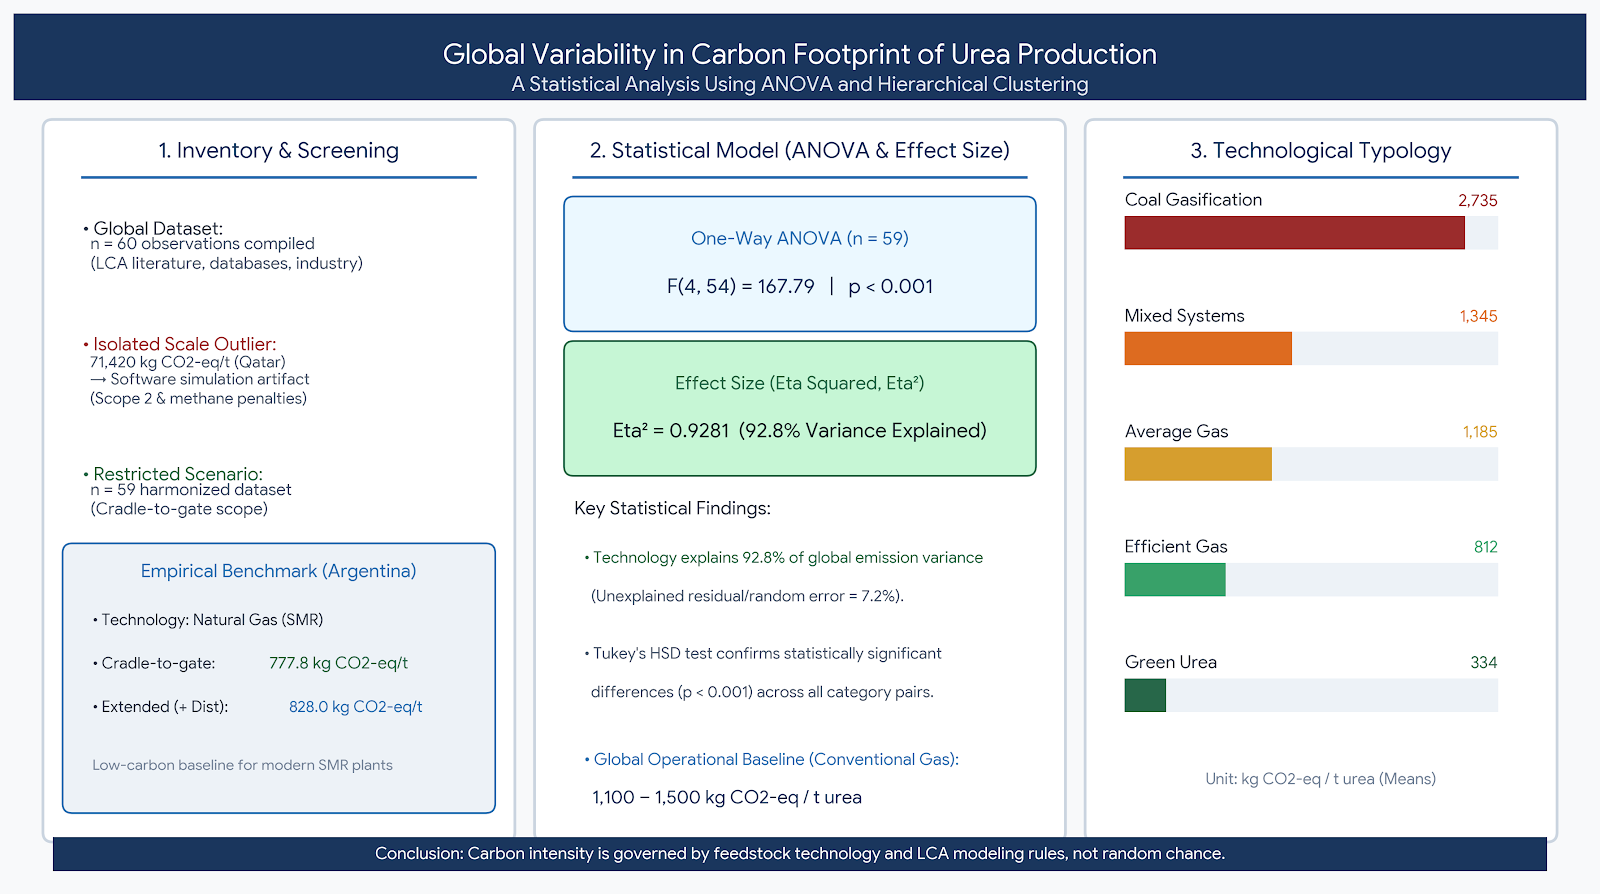
The global carbon footprint of urea production exhibits substantial variability, hindering comparative assessments and decarbonization strategies in agricultural supply chains. This study identified and quantified the structural determinants driving this dispersion by synthesizing an international inventory (n = 60) combining Life Cycle Assessment databases, literature, and empirical industrial data. Methodologically, an extreme theoretical outlier (71,420 kg CO₂-eq/t urea) was isolated, and a refined dataset (n = 59) was evaluated using one-way ANOVA, Tukey's HSD test, and Ward's hierarchical clustering. Statistical analysis confirmed that a five-category technological typology—Coal, Mixed Systems, Average Gas, Efficient Gas, and Green Urea—is highly robust (F(4, 54) = 167.79; p < 0.001), with technology explaining 92.8% of global emission variance (η2 = 0.9281). Mean impacts ranged from 2,735 kg CO₂-eq/t for coal to 334 kg CO₂-eq/t for green urea. Primary data from an Argentine plant (777.8 kg CO₂-eq/t cradle-to-gate) defined a practical lower bound for fossil systems, while commercial operations cluster within a baseline of 1,100–1,500 kg CO₂-eq/t. We conclude that urea carbon intensity is governed by feedstock technology and life-cycle accounting choices, providing an essential quantitative framework for inventory harmonization.
Keywords:
greenhouse gas intensity
; Life Cycle Assessment (LCA)
; nitrogen fertilizers
; industrial mitigation
; decarbonization
1. Introduction
In the architecture of modern agriculture, crop nutrition is the key driver to ensure food security and farmer’s profitability. Yet, in today's international markets, agronomic efficiency is no longer evaluated separately—it is now intrinsically linked to the carbon intensity of the entire value chain.
For export chains in the Southern Cone region—particularly those devoted to strategic grains such as maize and wheat—measuring and reporting the carbon footprint have become a non-tariff barrier and a critical competitiveness factor at destination ports (e.g., the European Union and its clean supply chain regulations). Sectoral studies demonstrate that, on average, nitrogen fertilization accounts for 27% to 58% of the total carbon footprint of wheat and of maize, respectively, delivered to the export port [3,4]. Therefore, any attempt to decarbonize agriculture requires, on a mandatory basis, an audit of the origin and manufacturing technology of the fertilizer used.
The main commercial obstacle encountered by producers in Argentina is the application of punitive "default" methodologies. Globally referenced commercial life cycle assessment (LCA) databases, such as Ecoinvent or Agri-footprint, usually calculate input footprints using the "market mix" construct or generic geographical averages. For urea, these global averages typically range from 1,100 to 1,500 kg CO₂-eq / t.
Applying these generic emission factors unfairly penalizes agricultural production that uses state-of-the-art technologies. The global supply of urea is deeply heterogeneous: obsolete plants and highly carbon-intensive routes (such as coal gasification in Asia) coexist with modern, integrated natural gas-based petrochemical complexes. If carbon certification models fail to discriminate the technological origin of the input, the farmer's field efficiency is overshadowed by the foreign manufacturer's inefficiencies.
To address the limitations of indexed global averages, this research incorporates primary inventory data from a modern petrochemical complex located in the Southern Cone (Bahía Blanca, Argentina) [25]. This system operates under an industrial configuration based on steam methane reforming (SMR) of natural gas with a high level of thermal integration. The evaluation of this empirical case study allows us to contrast theoretical life cycle models against real operational boundaries of low- carbon intensity. This approach provides a crucial quantitative reference for evaluating agricultural supply chains in emerging economies and expanding the geographical representativeness of current literature [25].
The audited primary data for the Bahía Blanca plant establish a footprint of 777.8 kg CO₂-eq / t under a cradle-to-gate scope. Even when incorporating the regional distribution stage, the value stabilizes at 828.0 kg CO₂-eq / t, demonstrating a limited logistical impact (≈6.4%) that validates a highly efficient supply chain.
This study aimed at identifying the structural factors that account for global variability, and proposes an empirically validated global typology of urea production systems based on an international compilation of life cycle inventories, identifying five technological regimes with statistically significant differences in carbon intensity.
2. Materials and Methods
This study is based on an extended systematic review approach and an integrative analysis of the evidence regarding the carbon footprint of global urea production. A review encompassing scientific literature, LCA databases, and industrial sources published up to 2026 was conducted. Unlike previous studies, the adopted approach is not limited to a comparison of values; rather, it seeks to identify the structural determinants driving the observed variability.
2.1. Search Strategy and Source Selection
We searched relevant literature across various digital platforms and academic databases, including Google Scholar, alongside AI-assisted search tools, with the aim of covering a broad and updated spectrum of reported carbon footprint values for urea manufacturing. We considered peer-reviewed scientific articles, institutionally supported technical reports, and studies based on explicit methodologies—primarily LCA. Sources lacking methodological traceability, commercial documents, and publications that did not specify system boundaries or emission factors were excluded. This screening process ensured the consistency and quality of the database.
2.2. Database Construction
Based on the selected sources, an integrated database composed of 60 carbon footprint observations of urea production was constructed, from diverse international sources, including academic studies, industrial reports, and secondary datasets. The functional unit was homogeneously expressed in kilograms of CO₂ equivalent per metric ton of urea (kg CO₂-eq / t). The database includes information derived from the scientific literature, industrial reports, LCA databases, and prospective scenarios associated with emerging technologies (e.g., green urea, Carbon Capture, Utilization, and Storage -CCUS-).
Primary operational data from Argentina [25] were incorporated to this database, with values of 777.8 kg CO₂-eq / t of urea under a cradle-to-gate scope, and 828.0 kg CO₂-eq / t when including the regional distribution stage. This represents a logistics-induced increase of approximately 50 kg CO₂-eq / t (≈6.4%). The inclusion of these primary data complements the bibliographical evidence with recent industrial inventory information, thereby providing greater empirical robustness to the analysis. Extreme values were analyzed both in terms of their inclusion and exclusion with the aim to evaluate their influence on the overall model structure.
The values for Argentina are positioned at the lower bound of the observed range for natural gas-based systems, indicating an outstanding comparative environmental performance. The difference between the cradle-to-gate value and the value including distribution allows us to estimate the relative contribution of logistics. Although this logistical impact remains limited (≈6.4%), it becomes relevant in contexts of high manufacturing efficiency. In summary, this case study provides a consistent empirical baseline for advanced technological configurations, contributing to a more precise definition of the lower emission boundaries within conventional fossil fuel-based production systems. The analysis was further complemented by the use of recognized LCA databases, specifically ecoinvent (v3.12) and Agri-footprint (v7.0), accessed via SimaPro software (v9.6.0.1), which allowed us to validate value consistency and to enhance cross-study comparability.
2.3. Treatment of Methodological Heterogeneity
Given that the evaluated studies present variations in their system boundaries (primarily cradle-to-gate and, to a lesser extent, cradle-to-field), as well as in energy assumptions and emission factors, priority was given to consistency in the functional unit, 1 ton of urea, while preserving the original methodological context of each study to avoid biases arising from arbitrary adjustments. Consequently, the results should be interpreted as analytically comparable, though not strictly equivalent in methodological terms.
2.4. Classification of Production Systems
An analytical classification of urea production systems was made based on their primary structural determinants. Five distinct categories were defined:
- Green urea (emerging technologies),
- High-efficiency natural gas-based systems,
- Average natural gas-based systems,
- Mixed, intermediate-efficiency, or transitional systems,
- Coal-based systems.
The classification into technological typologies was based on the prevailing energy input type and the production process configuration reported in each source, allowing for the grouping of systems with comparable operational characteristics. This classification was used to group observations for subsequent statistical analysis, serving as an exploratory tool to identify structural patterns within the distribution rather than assuming random dispersion.
2.5. Statistical Analysis
A descriptive statistical analysis was performed, including measures of central tendency, dispersion, and distribution shape, to characterize global variability and detect potential outliers. To evaluate differences among the defined categories, a one-way analysis of variance (ANOVA) [22] was applied at a significance level of α = 0.05. Before the analysis, the assumptions of independence and homogeneity of variances were exploratorily verified. Because of the sample size and the heterogeneous nature of the literature sources, the analysis should be interpreted in exploratory terms, although ANOVA is widely considered robust against moderate deviations from its underlying assumptions.
Additionally, a Tukey's Honest Significant Difference (HSD) post-hoc test [31] was conducted to identify statistically significant differences between specific pairs of categories. To quantify the magnitude of these differences and determine the proportion of variance attributable to the technological factor, the effect size was estimated using eta squared (η²) [26].
2.6. Hierarchical Cluster Analysis (Clustering)
A hierarchical cluster analysis was implemented to evaluate the existence of natural groupings within the sample and empirically validate the proposed technological classification. The model was structured using the ordinary Euclidean distance as a dissimilarity metric and Ward's method [12,33] as the internal variance optimization algorithm. The analysis was initially applied to the full dataset of 60 compiled cases.
Due to the intrinsic sensitivity of Ward's method to large-scale observations, a sensitivity analysis was conducted using a restricted scenario (n = 59). This methodological approach allowed us to isolate the effects of distributional distortion and theoretical polarization induced by extreme outliers—specifically the highly dissimilar theoretical simulation study by Al-Yafei et al. [2] thereby ensuring an optimal resolution to explore the gradients and interactions of both conventional and prospective production systems in the resulting dendrogram (Figure 2).
2.7. Limitations
This study presents certain limitations related to the inherent methodological heterogeneity of the primary sources, variations in system boundaries, study scopes, and the uncertainty involved in some industrial data and prospective scenarios. Consequently, the statistical results must be interpreted within an exploratory framework. Nevertheless, the breadth and diversity of the constructed database enable the identification of robust patterns within the global variability of the carbon footprint of urea production.
3. Results
3.1. Global Distribution of the Carbon Footprint
The carbon footprint of urea production exhibits a wide range, spanning from 326 to 71,420 kg CO2-eq / t, with a mean of 2,497.71 kg CO2-eq / t and a median of 1,301.53 kg CO2-eq / t. Distribution displays a positive skewness, influenced by extreme values in high carbon-intensity systems (Figure 1 and Figure 2). The observed extreme value (71,420 kg CO2-eq / t) corresponds to an estimate with specific methodological assumptions and is retained in the analysis for its illustrative role regarding structural variability. In the restricted scenario (n = 59), which excludes this extreme value, the mean normalizes to 1,329.53 kg CO2-eq / t.
The ANOVA revealed highly significant differences among the technological categories (F = 167.79; p < 0.001), confirming that the carbon footprint of urea production varies systematically with the type of production system.
3.2. Technological Segmentation of the Carbon Footprint (Cluster Analysis)
The hierarchical cluster analysis performed on the restricted scenario (n = 59), excluding the extreme value from Qatar, identified five natural groupings of observations that reflect distinct technological pathways within global urea production. The resulting structure is a continuous gradient of carbon intensity, extending from very low-emission renewable systems to high-intensity, coal-based conventional processes (Figure 1 and Figure 2).
Cluster 1. Green urea: The first cluster includes the lowest carbon footprint systems observed in the international literature, with values close to 326–350 kg CO2-eq / t of urea. This group comprises green urea scenarios based on renewable hydrogen produced via electrolysis powered by hydroelectric or dedicated renewable sources. The included studies mainly correspond to prospective configurations and advanced technological transition models. These systems constitute the lower emission limit identified in the sample and represent the most consistent trajectory toward deep decarbonization of the industrial sector.
Cluster 2. Efficient natural gas: The second cluster comprises modern natural gas based plants with high levels of energy integration, heat recovery, and process optimization. Values are concentrated approximately between 700 and 950 kg CO2-eq / t urea. This group consists of high-performance industrial facilities, including the Argentine case, alongside other technologically advanced configurations reported in Europe, the Middle East, and Asia. This cluster represents the lower limit achievable among fossil-based technologies currently available at a commercial scale.
Cluster 3. Average natural gas: The third cluster corresponds to the prevailing operational core of the global industry. It groups conventional natural gas-based systems with standard levels of efficiency and environmental performance. The values range approximately between 1,100 and 1,400 kg CO2-eq / t urea, in line with the averages reported in international databases such as ecoinvent and Agri-footprint. This group concentrates the largest proportion of observations in the sample and can be interpreted as the representative baseline for contemporary global urea production.
Cluster 4. Mixed systems and intermediate efficiency configurations: The fourth cluster includes systems characterized by a combination of factors that increase carbon intensity relative to average natural gas systems. This group is composed of legacy plants, low energy efficiency configurations, aggregated regional inventories, and some systems incorporating carbon capture technologies that fail to achieve sufficient reductions to be excluded from the conventional emission range. The values are distributed approximately between 1,400 and 2,000 kg CO2-eq / t urea. This cluster constitutes a transition zone between conventional natural gas systems and coal-based technologies.
Cluster 5. Coal-based systems: The fifth cluster gathers the systems with the highest carbon intensity across the entire restricted sample. It is primarily composed of urea plants linked to supply chains based on coal gasification, particularly in China and other regions that heavily rely on solid fuels. Typical emissions range between 2,100 and 2,800 kg CO2-eq / t urea. The high intensity observed is due to both the nature of the feedstock and the higher energy demands of the process. This group defines the upper limit of environmental performance among technologies currently used at an industrial scale.
Figure 1.
Technological regimes (hierarchical clusters) for the carbon footprint of urea production (n = 59, excluding the Qatari outlier).
Figure 1.
Technological regimes (hierarchical clusters) for the carbon footprint of urea production (n = 59, excluding the Qatari outlier).
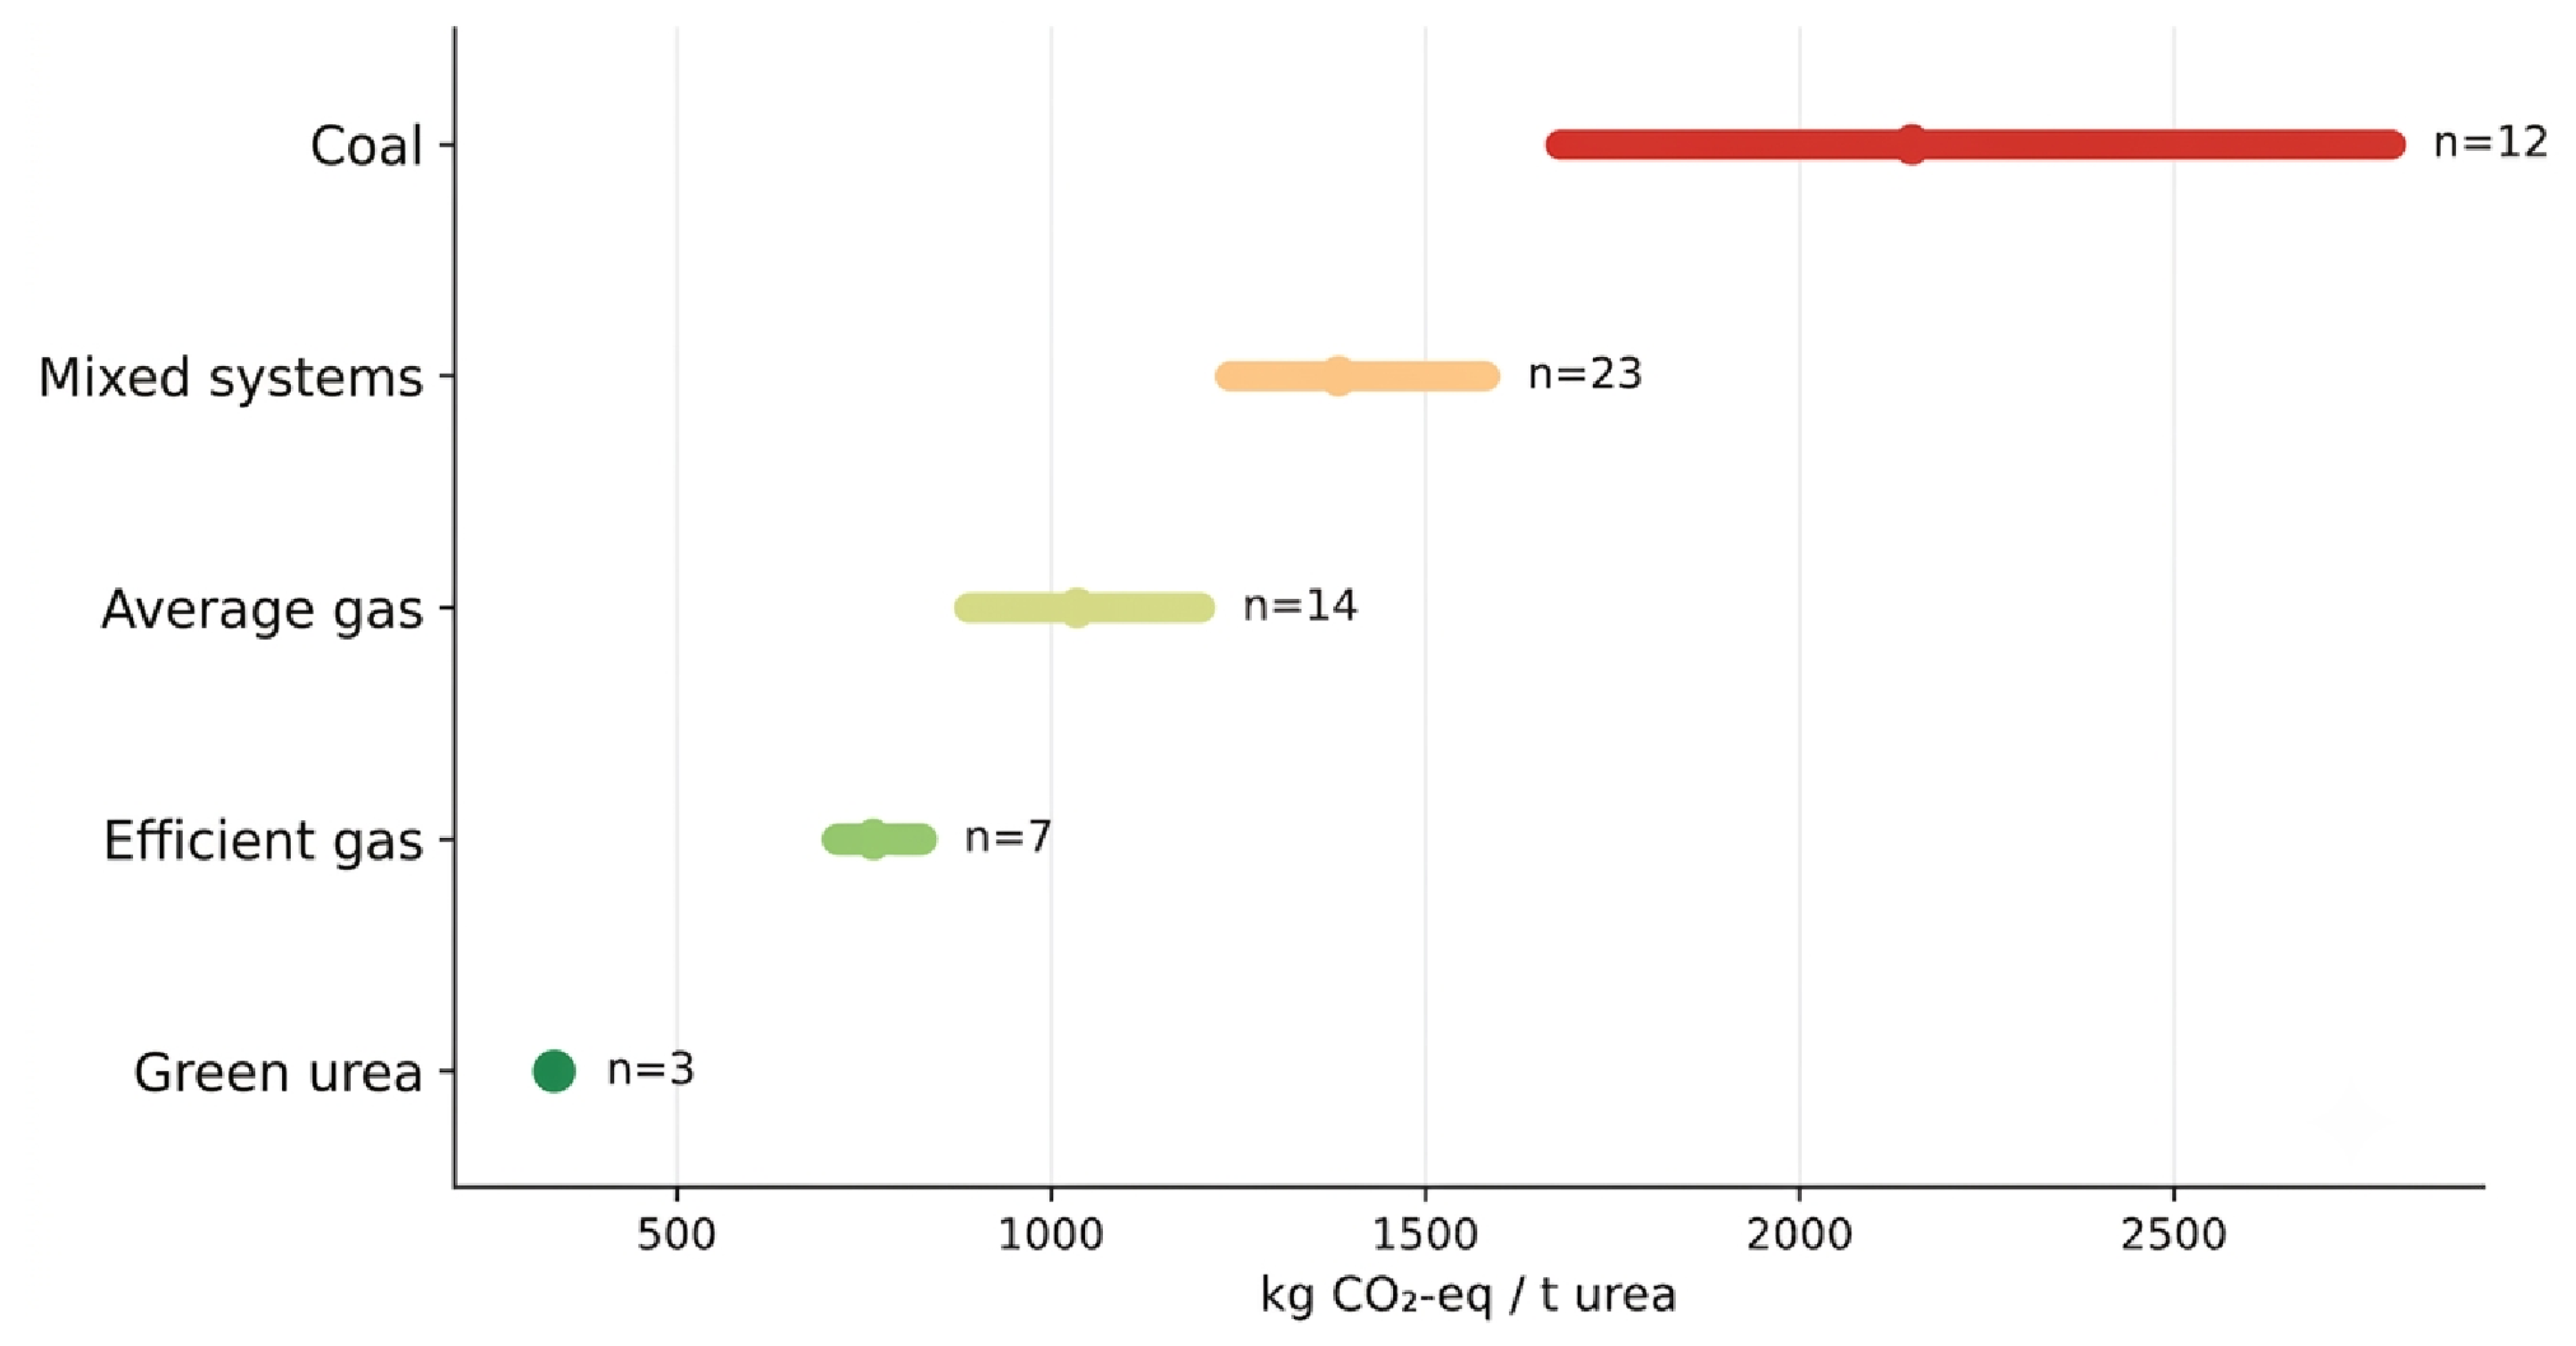
Figure 2.
Technological regimes (hierarchical clusters) for the carbon footprint of urea production (n = 59) based on linkage distance (Ward's method and ordinary Euclidean distance).
Figure 2.
Technological regimes (hierarchical clusters) for the carbon footprint of urea production (n = 59) based on linkage distance (Ward's method and ordinary Euclidean distance).
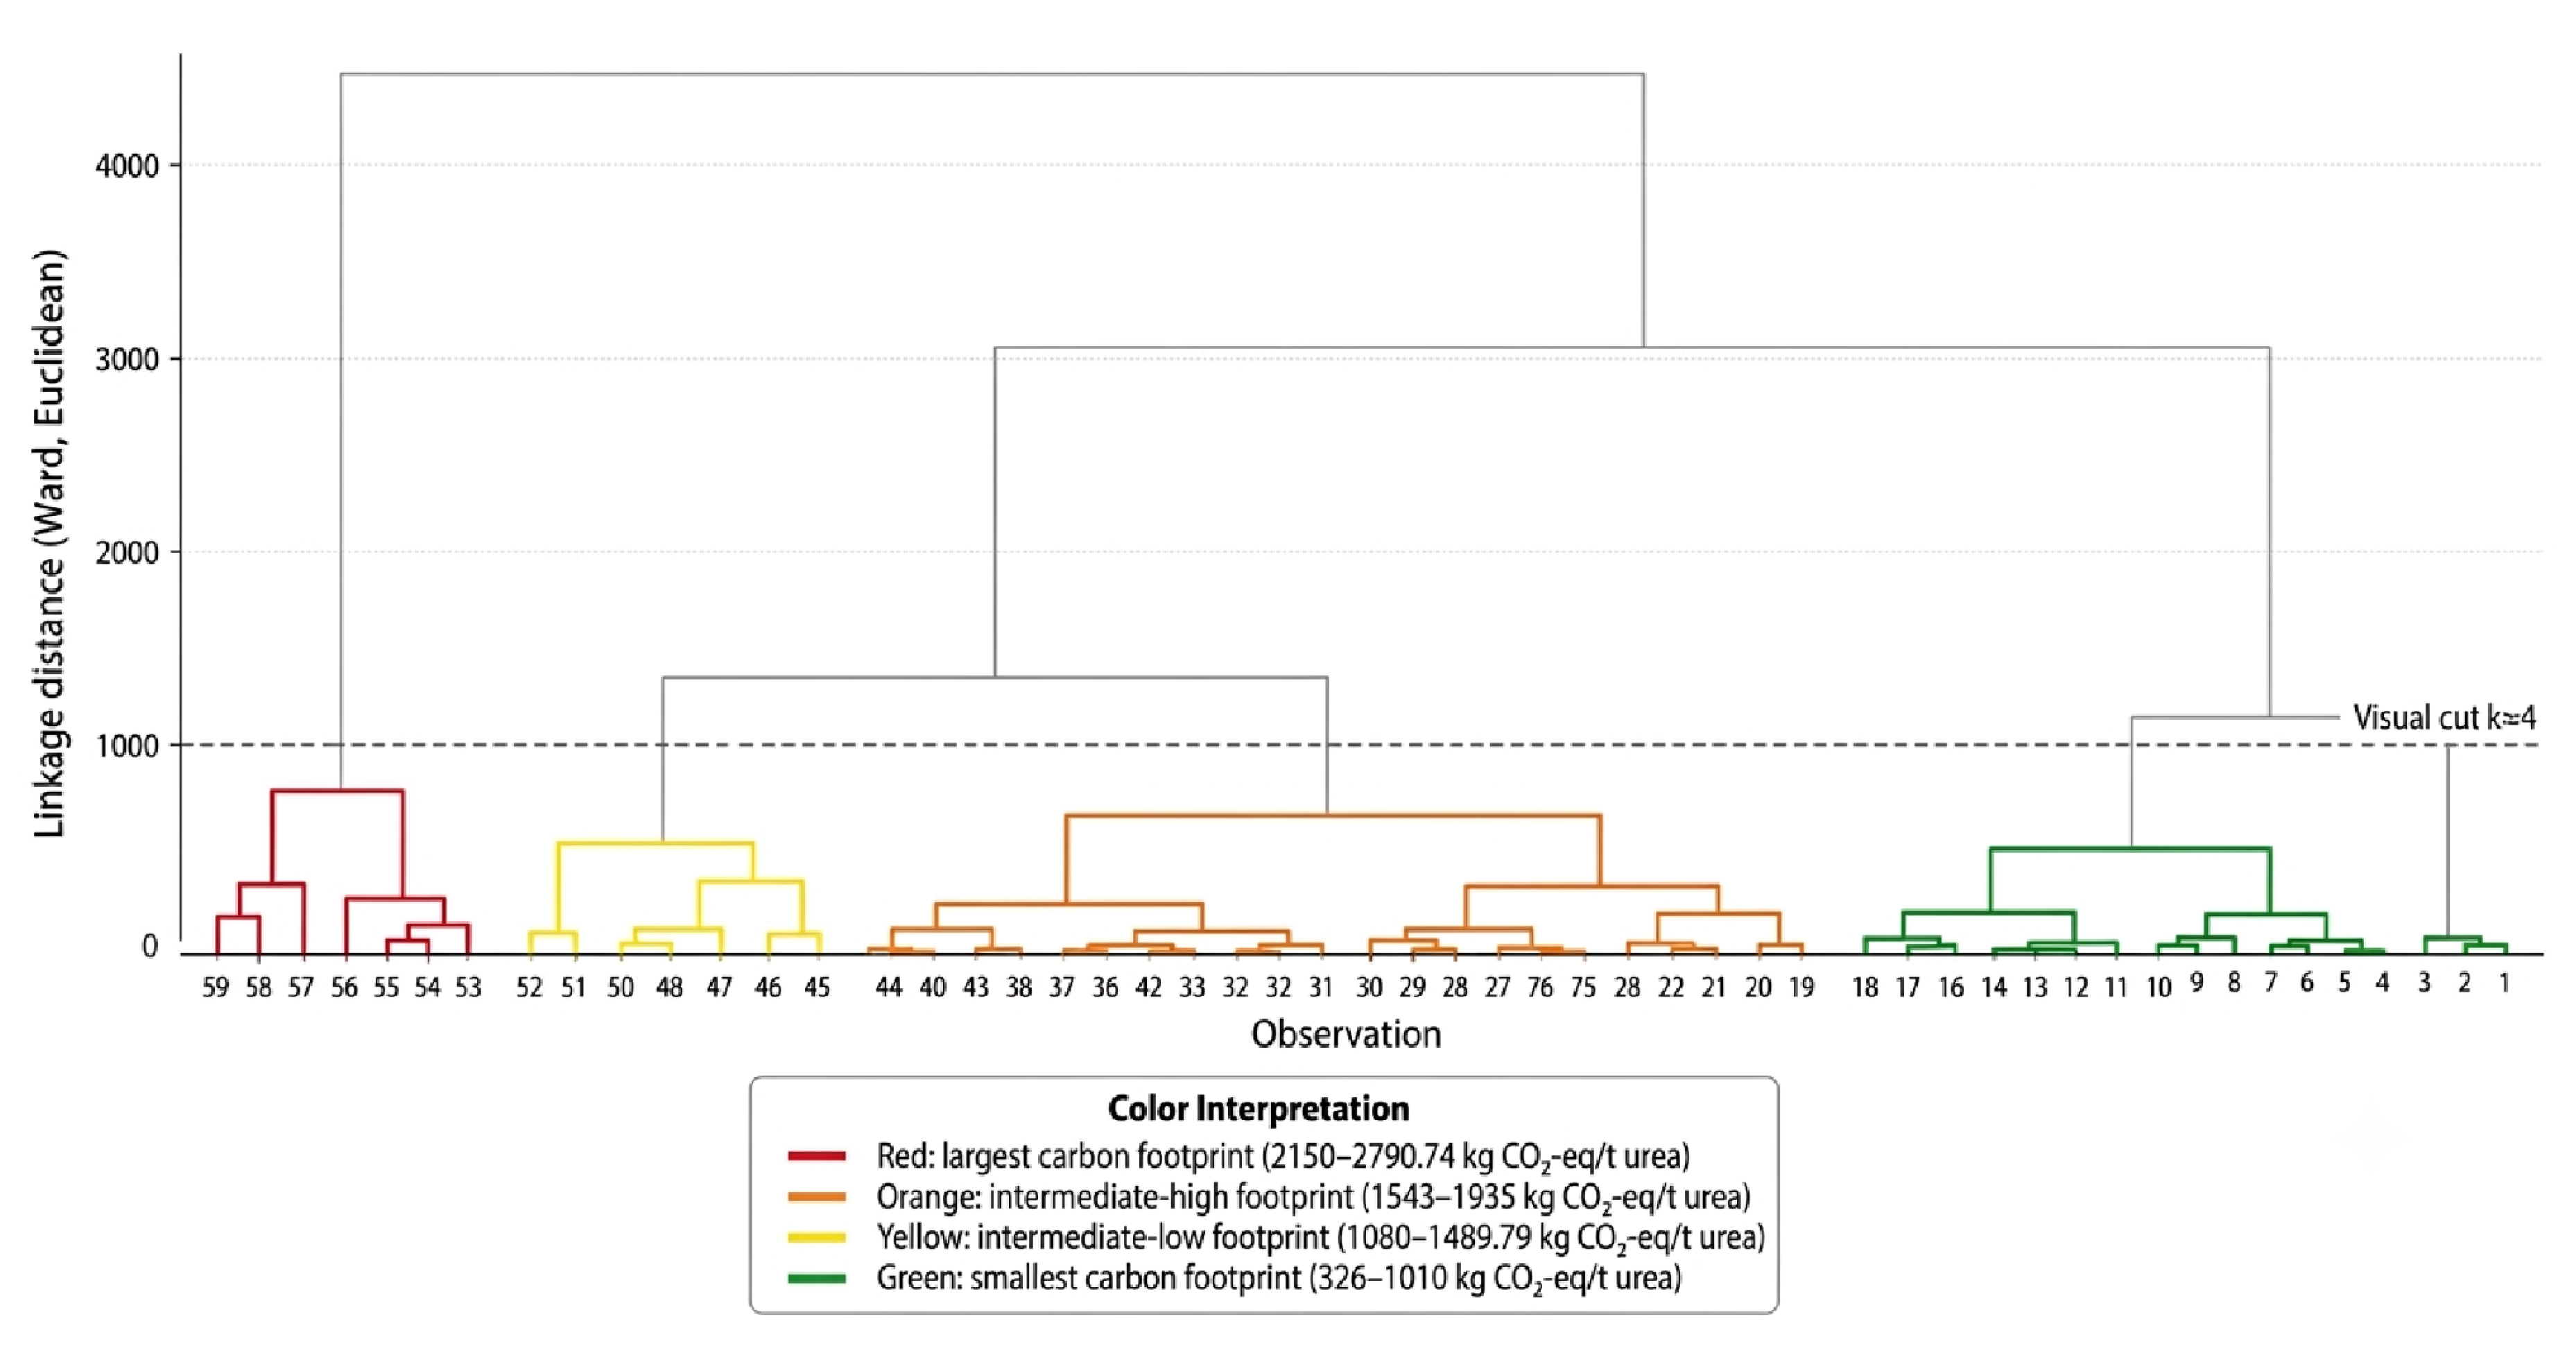
Figure 3 presents a detailed comparison of the carbon footprint associated with global urea production, broken down by key geographic regions and expressed in kg CO₂-eq / t. The comparative analysis reveals a marked technological and energetic heterogeneity across the evaluated regions. The global average is 1,426.38 kg CO₂-eq / t, a baseline benchmark that places China as the leading country in terms of overall emission intensity. This behavior is directly linked to the heavy reliance of China on coal as the primary raw material and energy source for ammonia synthesis. Conversely, regions such as North America, Europe, the Middle East and Africa exhibit a more efficient environmental performance. This fact is driven by a production matrix based mainly on natural gas, coupled with the operation of plants utilizing cogeneration technologies and optimized emission recovery systems. This regional disparity highlights the profound influence of both the primary energy source (coal versus natural gas) and the age and efficiency of industrial complexes on the international sustainability profile of the fertilizer.

Table 1.
Carbon footprint of urea production by source (kg CO2 eq / t).
| Source | kg CO2-eq / t urea |
|---|---|
|
326.00 |
|
326.11 |
|
350.00 |
|
714.00 |
|
714.30 |
|
733.00 |
|
751.00 |
|
777.80 |
|
814.00 |
|
828.00 |
|
890.00 |
|
910.00 |
|
910.00 |
|
920.00 |
|
960.00 |
|
980.00 |
|
1,000.00 |
|
1,010.00 |
|
1,080.00 |
|
1,100.00 |
|
1,170.00 |
|
1,180.00 |
|
1,180.00 |
|
1,200.00 |
|
1,238.77 |
|
1,240.00 |
|
1,250.00 |
|
1,270.00 |
|
1,278.28 |
|
1,301.53 |
|
1,356.33 |
|
1,360.00 |
|
1,380.00 |
|
1,383.00 |
|
1,390.00 |
|
1,403.13 |
|
1,428.85 |
|
1,434.66 |
|
1,342.18 |
|
1,480.26 |
|
1,301.53 |
|
1,394.53 |
|
1,435.91 |
|
1,489.79 |
|
1,543.00 |
|
1,543.00 |
|
1,580.35 |
|
1,680.00 |
|
1,725.47 |
|
1,730.00 |
|
1,882.00 |
|
1,935.00 |
|
2,150.00 |
|
2,200.00 |
|
2,210.00 |
|
2,300.00 |
|
2,510.00 |
|
2,680.00 |
|
2,790.74 |
|
71,420.00 |
| Mean | 2,497.71 |
| Standard deviation | 9,064.10 |
| Mean + 1 SD | 11,561.81 |
| Mean - 1 SD | -6,566.39 |
Figure 3.
Carbon footprint of urea production in kg CO₂-eq / t urea (n = 59, excluding the Qatari outlier).
Figure 3.
Carbon footprint of urea production in kg CO₂-eq / t urea (n = 59, excluding the Qatari outlier).
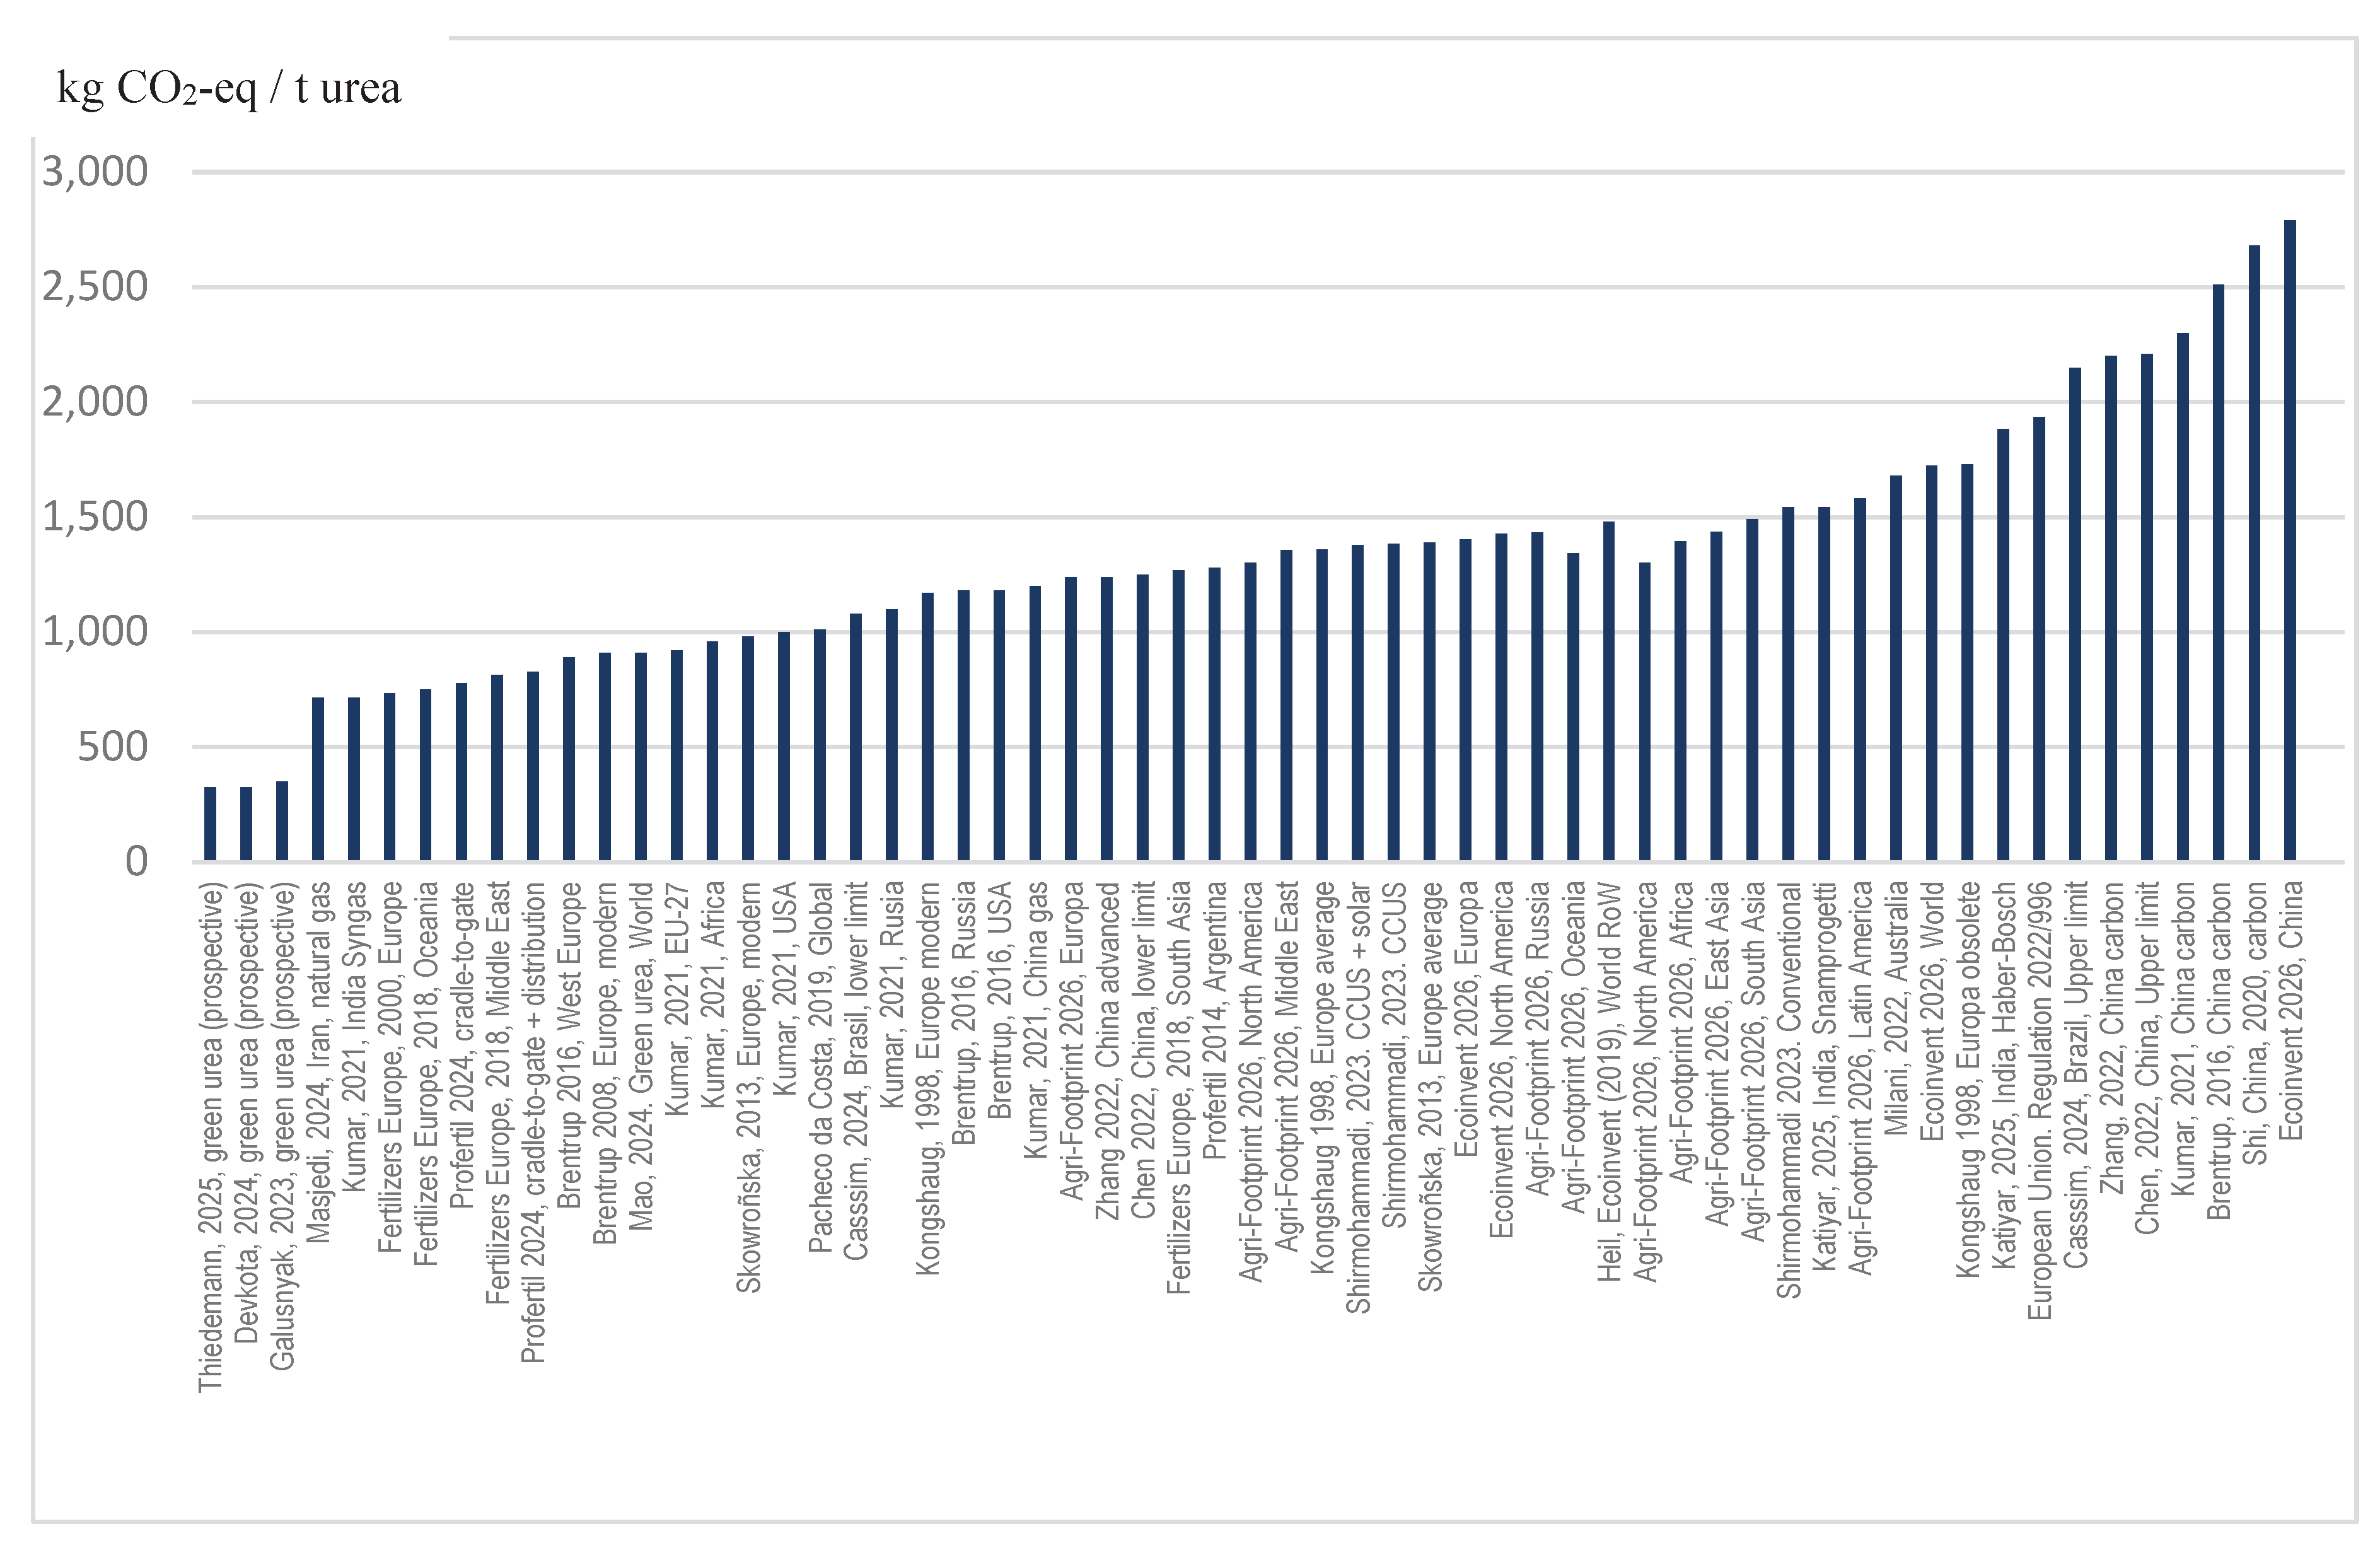
Table 2.
Descriptive statistics of studies on the carbon footprint of urea production.
| Mean | 2,497.71 |
| Standard error | 1,170.17 |
| Median | 1,301.53 |
| Mode | 910 |
| Standard deviation | 9,064.10 |
| Sample variance | 82,157,973.14 |
| Kurtosis | 59.57 |
| Skewness | 7.71 |
| Range | 7.11 |
| Minimum | 326 |
| Maximum | 71.420 |
| Sum | 149,862.52 |
| Count | 60 |
3.3. Technological Determinants and the Role of Outliers
The global distribution of the carbon footprint of urea production exhibits a structural polarization directly related to the technological boundaries of the energy supply and to decisions regarding life cycle modeling. Within the lower range, prospective green urea scenarios establish an absolute lower bound (326–350 kg CO₂-eq / t urea), underpinned by 100% renewable vectors [10,14,30]. This block is adjacent to high-thermal efficiency natural gas systems and advanced reforming processes, whose profiles stabilize at about 700 kg CO₂-eq / t urea [18,20]. Conversely, the upper bound of conventional commercial inventories is dominated by coal gasification-based systems, with steadily scaling impacts at between 2,200 and 2,700 kg CO₂-eq / t urea [6,15,34].
However, the most significant methodological finding of the analyzed dispersion corresponds to the study by Al-Yafei et al. [2] for an integrated blue ammonia and urea plant in Qatar. This case reports an extreme value of 71,420 kg CO₂-eq / t urea, becoming the absolute outlier of the dataset. It should be noted that the magnitude of this estimate is not due to a thermodynamic inefficiency of the actual process—where, on the contrary, in-situ CO₂ capture reduces direct emissions by 19.4%—but rather from the architecture of the simulation model. By employing steady-state software (Aspen HYSYS), the authors perform an exhaustive Scope 2 accounting, coupling the indirect energy demands to highly elevated local electricity grid emission factors and methane leakage penalties (2%) within the simulated thermal units.
The Qatari case (2025) demonstrates that the global variability of carbon footprint is not solely a metric of industrial performance, but a reflection of severe methodological divergences in the construction of LCA models. Far from being an anomaly that can be discarded, this value justifies the statistical splitting of our analysis into a restricted scenario (n = 59), thereby isolating the scale bias of theoretical simulations.
3.4. Range of Industrial Representativeness and Baseline
After controlling for the effects of outliers and frontier technologies, the statistical analysis demonstrated that the global production matrix of urea is highly standardized. Most current commercial systems worldwide are concentrated within an intermediate and highly homogeneous range between 1,100 and 1,500 kg CO₂-eq / t urea.
This interval, which consistently integrates both empirical inventories from operational plants [23] and indexed regional averages in international life cycle databases [1,11,15], must be interpreted as the true baseline of the global industry under the techno-economic conditions of the current decade. Values within this range reflect the typical balance of conventional natural gas-based systems, where internal emission fluctuations no longer depend on the core synthesis process, but rather on geographic variations in the electricity grid mix and logistical penalties associated with regional transportation and storage.
3.5. Results by Typology
3.5.1. Natural Gas-Based Systems
Natural gas-based systems present the lowest carbon intensity among current fossil-based technologies. In their most efficient configurations, values range between about 700 and 900 kg CO₂-eq / t [13,18,20], whereas under global average operational conditions, those systems reach values between 1,100 and 1,400 kg CO₂-eq / t [5,11,15].
3.5.2. Mixed or Intermediate-Efficiency Systems
Systems characterized by lower energy efficiency or mixed process configurations exhibit intermediate values, typically ranging between 1,200 and 1,800 kg CO₂-eq / t, depending on the age of the technology and the level of emission control implemented [17]; Skowrońska & Filipek, 2013).
3.5.3. Coal-Based Systems
3.5.4. Emerging Technologies
Emerging technologies aimed at decarbonization display a heterogeneous behavior. On the one hand, green urea scenarios based on renewable hydrogen present significantly lower impacts, of about 300–400 kg CO₂-eq / t [10,30]. On the other hand, technologies incorporating carbon capture show only partial reductions, with values within the range of 1,300–1,500 kg CO₂-eq / t [28].
3.6. Positioning of the Argentine Case Study
The incorporation of primary operational data from the Argentine urea plant provides a highly relevant industrial benchmark within the global analysis of the carbon footprint of urea production. The estimated values reach 777.8 kg CO₂-eq / t urea under a cradle-to-gate scope, and 828.0 kg CO₂-eq / t when the regional distribution stage is incorporated. This value represents an absolute logistic-driven increase of approximately 50 kg CO₂-eq / t (≈6.4%).
From a descriptive perspective, both values are positioned at the lower bound of the range, corresponding to conventional natural gas-based systems, indicating an outstanding environmental performance compared to most values reported internationally. In relative terms, the Argentine cradle-to-gate value lies clearly below the typical baseline reference levels for conventional natural gas technologies, indicating a high level of operational and energy efficiency.
In quantitative terms, the difference between the pure manufacturing system (cradle-to-gate) and the extended system incorporating distribution allows us to quantify the relative weight of logistical stages. Although the observed increase does not substantially alter the relative positioning of the system, it evidences that distribution is a non-negligible component within the total emission balance, particularly in contexts where the manufacturing phases exhibit high levels of efficiency.
From a qualitative perspective, the results suggest that the evaluated production system corresponds to a technologically advanced configuration within natural gas-based schemes. The observed low carbon intensity is consistent with the adoption of energy optimization practices, process integration, and potential improvements in the management of raw materials and utilities. In addition, the narrow gap between the cradle-to-gate value and the extended distribution value indicates a relatively efficient supply chain with limited logistical penalties.
Taken together, the data from Argentina provide statistically sound empirical evidence of a real-world industrial case study that successfully defines the practical lower bound achievable within conventional fossil fuel-based production systems. This result becomes particularly relevant in the context of global analysis by providing a precise operational performance reference that combines technical efficiency with real manufacturing conditions.
3.7. One-Way Analysis of Variance (ANOVA)
To determine whether the technological source and the production system configuration have a statistically significant effect on the urea carbon footprint, a one-way ANOVA was conducted for the harmonized restricted scenario (n = 59). This analysis excluded the scale distortion of the theoretical Qatari model, ensuring analytical consistency with the previous hierarchical cluster analysis. The degrees of freedom and variance indicators were recalculated under the F(4, 54) structure to reflect the totality of the remaining biological and industrial sample, categorizing the data into five groups: coal, high-efficiency natural gas, average natural gas, market mixes, and green urea.
The descriptive statistics (Table 3) reveal pronounced differences in the mean emission values (kg CO₂-eq / t urea):
Coal: Mean = 2,735
Market mixes: Mean = 1,345
Average natural gas: Mean = 1,185
High-efficiency natural gas: Mean = 812
Green urea: Mean = 334
3.8. Post-Hoc Analysis Using Tukey's Test
To identify the categories that present significant pairwise differences between them, Tukey's honestly significant difference (HSD) test was applied for multiple comparisons of means with p-value adjustment, yielding the following critical contrasts:
Coal vs. High-efficiency natural gas: The mean difference is –1,560.7 kg CO₂-eq / t, representing one of the most critical gaps in this study (adjusted p < 0.001). This result demonstrates the severe environmental penalty associated with solid fuel-based supply chains.
Green urea vs. Conventional technologies: Green urea (renewable energy vectors) differs significantly (adjusted p < 0.001) from all fossil-based alternatives, consolidating its status as a disruptive pathway toward deep decarbonization.
Natural gas gradient: A statistically significant difference (adjusted p < 0.01) is confirmed between high-efficiency gas plants (mean = 812 kg CO₂-eq / t) and both market mixes and average natural gas. This result validates the central proposal of this work to break down the natural gas block into independent subcategories according to their operational integration and logistical performance (Table 4).
This result strengthens the conclusions derived from Figure 1 (Cluster analysis). While the hierarchical clustering demonstrated how observations naturally group based on variance distances, the ANOVA provides parametric and mathematical confirmation that geographical boundaries, thermal efficiency, and feedstock type induce real, clear step-change variations in the global urea emission profile.
3.9. Effect Size Analysis (Eta Squared, η²)
The ANOVA was complemented by the calculation of effect size using Eta squared (η²) [26]. This statistical metric quantifies the proportion of the total variance in the dependent variable (carbon footprint) that is attributable to the clustering factor (technological categorization).
The mathematical expression for effect size determination is defined as follows:
η² = SSBetweenGroups / SSTotal
Based on the components processed in the ANOVA table for the restricted scenario (Table 3), the model parameters are identified as:
Numerator (SSBetweenGroups): 12,396,180
Denominator (SSTotal): 13,356,540
Eta squared (η²): 0.9281This result indicates that approximately 92.8% of the total variability in the carbon footprint of global urea production can be explained by the technological categorization proposed in this study. According to the conventional interpretation criteria established by Cohen [9], whereby any value exceeding 0.14 is classified as a large effect, the obtained η² of 0.9281 provides empirical evidence of an extremely large and statistically dominant effect.
This result demonstrates that once the scale bias from the Qatari outlier is controlled for, the intrinsic differences among manufacturing pathways (high-efficiency natural gas, average natural gas, coal, market mixes, and green urea) constitute highly robust structural explanatory variables, relegating the random error or minor inventory discrepancies less than 7.2% of the behavior of the global dataset.
4. Discussion
4.1. Dual Nature of Variability: Coexistence of Structural and Methodological Determinants
The results obtained reveal that the high dispersion in the carbon footprint of global urea production is not merely a random or chaotic phenomenon. On the contrary, it responds to a systematic dual nature: it is determined, in the first instance, by intrinsic structural differences within the manufacturing systems (technology, efficiency, and feedstock) and, simultaneously, by the methodological architecture employed in Life Cycle Assessment (LCA) modeling.
On the one hand, methodological variability has a distorting scale effect that radically alters comparability among studies. The finding of the Qatari case study [2] provides the most acute example: a theoretical value of 71,420 kg CO₂-eq / t urea that does not derive from thermodynamic obsolescence of the actual facility, but rather from modeling decisions in simulation software, punitive Scope 2 assumptions, and the adoption of exceptionally high local electricity grid emission factors. This behavior demonstrates that researchers’ choices regarding system boundaries, allocation procedures, and secondary databases can inflate or skew the final metric, independently of real-world operational efficiency.
On the other hand, once the extreme methodological bias is controlled for through the restricted scenario (n = 59), the structural determinants of the industry emerge with absolute clarity. Results of ANOVA and distribution analysis quantitatively confirm that technological factors predominantly explain the sector's behavior. The large effect size obtained (Eta squared [η²] = 0.9281) demonstrates parametrically that 92.8% of the remaining variance is due to actual technological segmentation (coal, average gas, high-efficiency gas, market mixes, and green urea) rather than to sampling errors. Each technological category indeed represents a clearly differentiated emission regime.
Consequently, the concept of a "global average value" loses analytical relevance. The urea carbon footprint must be interpreted through this dual lens: a direct reflection of the physical technology of the plant combined with the rigor of the methodological carbon accounting rules used for carbon footprint modeling.
Within this segmented ecosystem, conventional natural gas-based systems define the bulk of the actual production matrix. The internal variability of this block responds to gradients of thermal optimization and scale. Here, recent industrial evidence provides a critical empirical anchor: the audited values for the Argentine case study [25], situated in the range of 777.8–828.0 kg CO₂-eq / t (cradle-to-gate and extended with distribution), are firmly positioned at the lower bound of the natural gas segment, with respect to the average models indexed in the literature.
4.2. The Dominant Role of Feedstock and Ammonia Synthesis
Among the identified determining factors of carbon footprint, the type of feedstock used for hydrogen production—primarily natural gas or coal—emerges as the most critical determinant of carbon intensity. Natural gas-based systems consistently present lower emissions due to higher energy efficiency and lower intrinsic emission factors, whereas coal-based processes exhibit significantly higher intensities.
This result is consistent with the way the ammonia synthesis process works via the Haber-Bosch method, in which hydrogen is obtained through hydrocarbon steam reforming. Given that approximately 80–90% of the total energy consumption of the system is concentrated at this stage, any variation in the energy source or process efficiency has a direct and extended impact on the final carbon footprint.
In addition, the analysis shows that even within the same feedstock category, there are significant differences associated with technological efficiency, which explains the separation between "high-efficiency" and "average" natural gas systems. This reflects the technological evolution of the sector, in which improvements in energy efficiency, waste heat recovery, and process optimization have led to a gradual reduction in emissions over the recent decades.
4.3. Importance of Emission Control and Process Efficiency
In addition to the feedstock type, the level of emission control, particularly of nitrous oxide (N₂O), constitutes a key factor in explaining the observed differences. Although energy-derived CO₂ accounts for the largest fraction of emissions, N₂O—with a significantly higher global warming potential (GWP)—can contribute significantly when adequate capture or abatement systems are absent.
In this context, the differences between modern and old plants reflect variations not only in energy efficiency but also in the implementation of emission mitigation technologies. This explains why systems that appear similar in terms of feedstock can exhibit markedly different carbon footprints.
4.4. Existence of a "Global Operational Core"
One of the central findings of this study is the identification of a value range in which most observations are concentrated, approximately between 1,100 and 1,500 kg CO₂-eq / t. This range, corresponding primarily to natural gas-based systems under standard operating conditions, can be interpreted as the "global operational core" of the urea industry.
This concept is particularly relevant for comparative evaluation and benchmarking, since it allows for a clear differentiation among: a) values representative of current system performance, b) values associated with advanced or emerging technologies, and c) values corresponding to lagging technological configurations.
Within this framework, the positioning of specific production systems—such as the Argentine case study—acquires a clearer meaning, since it can be evaluated relative to this central operational range.
4.5. Methodological Divergences in Green Urea Modeling
The evaluation of transition scenarios toward decarbonization schemes shows a pronounced quantitative discontinuity in the indexed literature. While certain prospective models optimized in virtual environments (e.g., [10]) report a GWP of just 326 kg CO₂-eq / t urea for pathways based on dedicated hydroelectric power and exogenous carbon capture, the global perspective analysis of Mao et al. [19] establishes a baseline of 910 kg CO₂-eq / t urea for the reconfiguration of the Bosch-Meiser process.
This nearly threefold variation between authors does not constitute a calculation error; rather, it responds to a fundamental divergence in Technology Readiness Level (TRL) and the predictive versus systemic nature of boundary assumptions:
Predictive idealized-state modeling: Inventories positioned at the lower bound of the literature (326 kg CO₂-eq / t) operate under a predictive approach using process simulation software (e.g., Aspen Plus). These configurations assume a continuous supply of renewable energy vectors with Scope 2 emission factors equivalent to zero, avoiding renewable intermittency penalties, extreme compression requirements, and transport losses associated with industrial-scale hydrogen.
Modeling of systemic balance and infrastructural inertia: Conversely, the value reported by Mao et al. [19] is based on the physical and thermodynamic inertia of real-world industrial systems. This approach recognizes that the intrinsic stoichiometry of urea fixes a residual amount of CO₂ per ton that maintains parity with the emissions associated with urea manufacturing. When alternative pathways (thermochemical, electrochemical, and photochemical) are evaluated, the authors internalize the energy degradation of the transitional feedstock, the actual conversion efficiencies of commercial electrolyzers, and the carbon penalty linked to the purification of residual gas streams.
This polarization within the next-generation urea segment symmetrically replicates the distortion observed at the opposite end of the sample with the theoretical Qatari anomaly (71,420 kg CO₂-eq / t). Both phenomena demonstrate that the carbon footprint of nitrogen fertilizers is severely parameterized by the researcher's methodological decisions. While pure simulation environments tend to project utopian decarbonization frontiers or hyperbolic inefficiencies, analyses anchored in the industry's real physical mass and energy balances act as a reality regulator. This demonstrates that the transition toward climate sustainability in this sector will face severe energy efficiency constraints before approaching the minimum theoretical limits described in prospective literature.
4.6. Temporal And Intra-Site Variability Induced by Methodological and Database Evolution: The Case Study of Urea in Argentine
The pronounced dispersion observed in the global inventory not only is manifested across different geographic regions or process technologies but can also be recorded intra-site over time, driven by both the evolution of allocation standards and the transition toward highly region-specific primary data. A paradigmatic case within the analyzed inventory is the carbon footprint of granular urea produced in Bahía Blanca, Argentina. The cradle-to-gate value for this site experienced a 39.1% reduction, dropping from 1,278.28 kg CO₂-eq / t in the 2014 baseline evaluation to 777.80 kg CO₂-eq / t in the verified 2024 inventory. Although the core technological configuration of the plant remained structurally identical—based on Steam Methane Reforming (SMR) coupled with an ammonia-urea synthesis loop featuring high design energy integration—the sensitivity analysis of the inventories reveals that this divergence responds to a synergy between the strict redefinition of system boundaries and the consolidation of real-world operational decarbonization milestones.
First, the strict adoption of the ISO 14067:2018 standard and the GHG Protocol Product Standard in the 2024 evaluation optimized the treatment of the carbon mass balance at the life cycle boundary. The CO₂ generated as an unavoidable byproduct in the methane reforming section, which is subsequently captured and stoichiometrically integrated into the urea synthesis loop, is not considered a direct emission to the atmosphere at the factory gate stage. Under the current international standard, this flow is accurately reported as embedded or temporarily stored carbon within the fertilizer product. Consequently, direct Scope 1 emission intensity legitimately decreases during the cradle-to-gate stage, formally transferring the carbon release burden downstream to the agricultural use phase, specifically during urea hydrolysis in the soil. The methodological models applied in 2014 lacked this level of harmonization and granularity in the net boundary balance, resulting in an implicit double-counting that penalized the producer during the manufacturing phase.
Second, a substantial reduction in the uncertainty and overestimation of indirect emission factors (upstream and grid inputs) is confirmed. While the 2014 evaluation relied on generic global Life Cycle Inventory (LCI) databases (early versions of ecoinvent) that applied excessively conservative default factors for methane leakage and flaring in the local extraction basin, the 2024 modeling incorporated a specific, verified emission factor for natural gas of 0.347 kg CO₂-eq / m³ (equivalent to 9.36 kg CO₂-eq / GJ based on net calorific value). This factor is directly in line with Argentina's National Greenhouse Gas Inventory (INGEI), eliminating the geographic bias of secondary datasets. Likewise, the national electricity grid emission factor (Scope 2) realistically reflected the deep decarbonization of the Argentine energy matrix over the past decade, driven by the massive penetration of commercial renewable generation into the national interconnected system.
Third, the 2024 inventory transparently captures continuous improvements in energy efficiency and environmental management of the company's physical assets. Between both studies, the company implemented an electricity supply decarbonization strategy through the long-term hiring of certified wind energy via the Renewable Energy Term Market (MATER), significantly reducing operational indirect Scope 2 emissions. Additionally, engineering optimizations were adopted at the plant to increase process thermal efficiency, with advanced purge gas recirculation for energy recovery standing out.
This intra-site behavior demonstrates that direct comparisons from the scientific literature without critical screening (simplistic meta-analyses) introduce severe analytical biases. Therefore, the temporal variability observed for natural gas-based urea shows that low-carbon emission profiles in the industry depend not only on the methodological maturity of accounting standards and national inventories but also on the industry’s adaptive capacity to integrate clean energy vectors and maximize the recovery of residual streams within the SMR process.
4.7. Limitations of Carbon Capture Technologies
In contrast to green urea, systems incorporating Carbon Capture, Utilization, and Storage (CCUS) technologies exhibit more limited reductions in their carbon footprint, often remaining within the range of the "global operational core." This result suggests that while these technologies can contribute to emission mitigation, they do not necessarily imply a radical transformation of the production system.
This finding raises questions regarding the strategic role of these technologies in the sector's transition, particularly when compared to solutions based on electrification and renewable energies.
4.8. Implications for Public Policies and Markets
The findings demonstrate that the use of generic or default emission factors within the boundary frameworks of the European Union's Carbon Border Adjustment Mechanism (CBAM) induces punitive regulatory asymmetries for developing countries that possess efficient infrastructure. The capacity to discriminate inventories based on actual technological architecture rather than on aggregated geographical averages is a critical methodological requirement to avoid distortions in cross-border carbon taxes and to ensure transparent climate accounting in global fertilizer markets.
4.9. Conceptual Contribution of the Work
Finally, the main contribution of this study lies in the generation of an analytical framework that enables the interpretation of the urea carbon footprint not as a single point-value, but as a system structured by technological configurations. The proposed classification, validated through empirical evidence, constitutes a valuable tool for academic analysis and in public policy and corporate management contexts.
The statistical significance observed across all comparisons reinforces the empirical validity of the proposed classification, showing that each technological category represents a statistically different emission regime. Accordingly, the classification developed in this study undergoes a transition from being a conceptual tool to being a quantitatively validated analytical model.
Overall, these results provide convergent evidence that variability in the urea carbon footprint is structurally determined and that it can be robustly captured using the proposed classification framework. The outcomes are consistent with recent discussions on industrial decarbonization, in which the optimization of existing systems and the adoption of emerging technologies are proposed as complementary rather than mutually exclusive strategies.
5. Conclusions
This study demonstrates that the observed variability in the carbon footprint of global urea production is not driven by random dispersion, but rather follows a systematic structure dominated by technological differences. Empirical evidence, supported by statistical analyses that are reliable and consistent across multiple approaches (distributional, hierarchical, and comparative), confirms that technological typology constitutes the primary determinant of environmental performance within this manufacturing system.
The results reveal a clear segmentation among production regimes, with coal-based systems being located at the upper bound of emission intensity, natural gas-based systems in intermediate positions –exhibiting high internal heterogeneity–, and emerging low-emission technologies at the lower bound. This configuration reflects discrepancies not only in energy inputs but also in efficiency levels, technological integration, and operational optimization.
In this context, the incorporation of recent industrial evidence, represented by the Argentine case study [25], provides a key element for interpreting the results. The observed values, situated at the lower limit of natural gas-based systems, empirically anchor the achievable performance frontier under real-world operating conditions. This outcome not only validates the consistency of the proposed classification framework but also demonstrates that there are specific margins for improvement within conventional systems, even without radical alterations to the energy matrix.
From a sustainability perspective, these findings suggest that emission reduction strategies in urea production should consider both the transition toward low-emission technologies and the optimization potential in existing systems. In particular, the differentiation observed in natural gas-based systems indicates that incremental efficiency improvements can yield significant emission reductions in the short and mid-term, serving as a bridge toward deeper decarbonization pathways.
Collectively, this work contributes to a better understanding of the environmental structure of the global urea production system, providing an analytical framework that integrates empirical evidence, statistical validation, and technological significance. This approach allows us not only to characterize the current state of the system but also to identify benchmarks and plausible trajectories for its transformation toward more sustainable production schemes.
Author Contributions
Conceptualization, Rodolfo Bongiovanni and Leticia Tuninetti; methodology, Rodolfo Bongiovanni and Leticia Tuninetti; software, Sergio Romagnoli and Leticia Tuninetti; validation, Mirta Toribio; formal analysis, Rodolfo Bongiovanni and Leticia Tuninetti; investigation, Rodolfo Bongiovanni, Leticia Tuninetti and Sergio Romagnoli; data curation, Rodolfo Bongiovanni, Leticia Tuninetti and Sergio Romagnoli; writing—original draft preparation, Rodolfo Bongiovanni and Leticia Tuninetti; writing—review and editing, Rodolfo Bongiovanni and Leticia Tuninetti; visualization, Rodolfo Bongiovanni and Leticia Tuninetti; supervision, Mirta Toribio; project administration, Mirta Toribio. All authors have read and agreed to the published version of the manuscript.
Funding
This research received no external funding.
Data Availability Statement
The data supporting the findings and conclusions of this study are fully available within the body of the article, its supplementary tables, and through the explicit bibliographic references and Digital Object Identifiers (DOIs) cited in the text. Primary data for the regional industrial case study were derived from publicly available corporate carbon footprint reports, while global inventory datasets were compiled from open-access literature and commercial Life Cycle Assessment (LCA) databases (e.g., ecoinvent and Agri-footprint) as detailed in Table 1 and the Reference section.
Acknowledgments
During the preparation of this work, the authors used Gemini (Google) during the final drafting stage to translate the manuscript from its original Spanish version into English. The core scientific and intellectual components of this research—including the comprehensive literature review, global data mining, dataset compilation, and advanced statistical analysis (one-way ANOVA and hierarchical clustering)—were independently conceptualized, executed, and finalized entirely by the human authors prior to any AI intervention. Following the translation phase, the authors thoroughly reviewed, verified, and edited the resulting text to guarantee scientific accuracy and adherence to LCA nomenclature, and they take full responsibility for the final content of this publication.
Conflicts of Interest
The authors declare the following financial and personal relationships which may be considered as potential competing interests: Co-author Mirta Toribio is a permanent staff member at Profertil S.A., the regional urea production company whose industrial facility provided the primary datasets for the empirical case study analyzed in this manuscript. To ensure scientific honesty, transparency, and methodological rigor, this corporate participation was strictly framed as an industrial validation of empirical regional inventories within the Life Cycle Assessment (LCA) framework. The primary operating data from the plant were supplied to establish a real-world low-carbon benchmark for natural gas-based urea manufacturing, contrasting with theoretical or simulated literature. The data collection, statistical modeling, and meta-analysis of the global inventory (n = 59) were independently executed and validated by the academic and institutional co-authors (from INTA and INTI). Profertil S.A. provided technical insights regarding operational parameters but had no role in the design of the statistical analysis, the interpretation of the global literature review, or the decision to submit the manuscript for publication..
References
- Agri-footprint Agri-footprint-database. Simapro. 2026. Available online: https://simapro.com/products/agri-footprint-database/.
- Al-Yafei, H., AlNouss, A., Aseel, S., Al-Tamimi, T., Al-Mannaei, H., Ibrahim, H., . . . Al-Kuwari, A. Shades of sustainability: A comprehensive analysis of the carbon footprint in conventional blue ammonia and urea manufacturing processes. Sustain. Energy Technol. Assess. 2025, 84, 104712. [CrossRef]
- Bongiovanni, R.; Tuninetti, L. Huella de Carbono de la cadena de trigo de Argentina. LALCA: Revista Latino-Americana em Avaliação do Ciclo de Vida, 2021. Available online: http://lalca.acv.ibict.br/lalca/article/view/5551.
- Bongiovanni, R.; Tuninetti, L.; Vigneau, P.; Gayo, S. Carbon footprint of maize produced in Argentina. RIA 51 N.º. 1 April 2025. [CrossRef]
- Brentrup, F.; Palliere, C. GHG emissions and energy efficiency in European nitrogen fertiliser production and use. Proc. International Fertiliser Society, York, UK, December 11; 2008. [Google Scholar]
- Brentrup, F.; Hoxha, A.; Christensen, B. Carbon footprint analysis of mineral fertilizer production in Europe and other world regions. Based on CFC. 2016. Available online: https://www.fertilizerseurope.com/initiative/carbon-footprint-calculator/. https://www.researchgate.net/publication/312553933.
- Cassim, B.; Lisboa, I.; Besen, M.; Otto, R.; Cantarella, H.; Inoue, T.; Batista, M. Nitrogen: from discovery, plant assimilation, sustainable usage to current enhanced efficiency fertilizers technologies – A review. Rev. Bras. Cienc. Solo 2024, 48, e0230037. [Google Scholar] [CrossRef]
- Chen, Y., Lyu, Y., Yang, X., Zhang, X., Pan, H., Wu, J., . . . Luo, H. Performance comparison of urea production using one set of integrated indicators considering energy use, economic cost and emissions’ impacts: A case from China. Energy 2022, 254 Part C, 124489, ISSN 0360-5442. [CrossRef]
- Cohen, J. Statistical power analysis for the behavioral sciences, 2nd ed.; Lawrence Erlbaum Associates, 1988. [Google Scholar]
- Devkota, S.; Karmacharya, P.; Maharjan, S.; Khatiwada, D.; Uprety, B. Decarbonizing urea: Techno-economic and environmental analysis of a model hydroelectricity and carbon capture based green urea production. Appl. Energy 2024, 372, 123789. [Google Scholar] [CrossRef]
- ecoinvent. Ecoinvent database. Simapro. 2026. Available online: https://simapro.com/products/ecoinvent/.
- Everitt, B.; Landau, S.; Leese, M.; Stahl, D. Cluster analysis, 5th ed.; Wiley, 2011. [Google Scholar]
- Fertilizers Europe. (2000). PRODUCTION OF UREA and UREA AMMONIUM NITRATE. Best Available Techniques or Pollution Prevention and Control in the European Fertilizer Industry Booklet No. 5. Fertilizers Europe, European Fertilizer Manufacturers’ Association, Bélgica. Available online: https://www.fertilizerseurope.com/wp-content/uploads/2019/08/Booklet_5_final.pdf.
- Galusnyak, S.C.; Petrescu, L.; Sandu, V.-C.; Cormos, C.-C. Environmental impact assessment of green ammonia coupled with urea and ammonium nitrate production. J. Environ. Manag. 2023, 343, 118215. [Google Scholar] [CrossRef] [PubMed]
- Heil, A. Urea production, as N. Ecoinvent. Selected Database: version 3.6. 2019. Available online: https://v36.ecoquery.ecoinvent.org/Details/UPR/a4ef49b8-b7cd-401c-802b-0931c48bae0e/8b738ea0-f89e-4627-8679-433616064e82.
- Katiyar, A.; Gedam, V.V. Life cycle assessment of urea production: Environmental impact comparison of two fertilizer technologies in Northern India. Sci. Total Environ. 2025, 971, 179034. [Google Scholar] [CrossRef] [PubMed]
- Kongshaug, G. ENERGY CONSUMPTION AND GREENHOUSE GAS EMISSIONS IN FERTILIZER PRODUCTION. Hydro Agri Europe, Norway. International Fertilizer Industry Association. IFA Technical Conference. Marrakech, Morocco, 28 September-1 October 1998; 1998. Available online: https://www.fertilizer.org/images/Library_Downloads/1998_ifa_marrakech_kongshaug.pdf.
- Kumar, P.; Verma, S.; Gupta, A.; Paul, A. R.; Jain, A.; Haque, N. Life Cycle Analysis for The Production of Urea Through Syngas. IOP Conf. Ser. Earth Environ. Sci. 2021, 795, 012031. Available online: https://iopscience.iop.org/article/10.1088/17. [CrossRef]
- Mao, C.; Byun, J.; MacLeod, H. Green urea production for sustainable agriculture. Joule 2024, 8, 1224–1238. [Google Scholar] [CrossRef]
- Masjedi, S.K.; Kazemi, A.; Moeinnadini, M.; Khaki, E.; Olsen, S.I. Urea production: An absolute environmental sustainability assessment. Science of The Total Environment 2024, 908. ISSN 0048-9697. [Google Scholar] [CrossRef] [PubMed]
- Milani, D.; Kiani, A.; Haque, N.; Giddey, S.; Feron, P. Green pathways for urea synthesis: A review from Australia's perspective. Sustain. Chem. Clim. Action 2022, 1, 100008. [Google Scholar] [CrossRef]
- Montgomery, D.C. Design and analysis of experiments, 9th ed.; John Wiley & Sons, 2017. [Google Scholar]
- Pacheco-da-Costa, T.; Westphalen, G.; Dalla-Nora, F.; de-Zorzi, B.; Silveira-da-Rosa, G. Technical and environmental assessment of coated urea production with a natural polymeric suspension in spouted bed to reduce nitrogen losses. J. Clean. Prod. 2019. [Google Scholar] [CrossRef]
- Profertil. Cálculo de la huella de carbono - Informe 2 - Fase 1 - Etapa 1 Profertil, S.A. - PwC; 2014. [Google Scholar]
- Profertil. (2024). Product Carbon Footprint Report Profertil Granulated Urea. PCF Report - Urea Profertil 2024 - v1.1.
- Richardson, J.T. Eta squared and partial eta squared as measures of effect size in educational research. Educ. Res. Rev. 2011, 6, 135–147. [Google Scholar] [CrossRef]
- Shi, L.; Liu, L.; Yang, B.; Sheng, G.; Xu, T. Evaluation of Industrial Urea Energy Consumption (EC) Based on Life Cycle Assessment (LCA). Sustainability 2020, 12, 3793. [Google Scholar] [CrossRef]
- Shirmohammadi, R.; Aslani, A.; Batuecas, E.; Ghasempour, R.; Romeo, L.; Petrakopoulou, F. A comparative life cycle assessment for solar integration in CO2 capture utilized in a downstream urea synthesis plant. J. CO2 Util. 2023, 74, 102534. [Google Scholar] [CrossRef]
- Skowroñska, M.; Filipek, T. Life cycle assessment of fertilizers: a review. Int. Agrophys. 2013, 2014, 28, 101–110. [Google Scholar] [CrossRef]
- Thiedemann, T.M.; Wark, M. A Compact Review of Current Technologies for Carbon Capture as Well as Storing and Utilizing the Captured CO2. Processes 2025, 13, 283. [Google Scholar] [CrossRef]
- Tukey, J.W. Comparing individual means in the analysis of variance. Biometrics 1949, 5, 99–114. [Google Scholar] [CrossRef]
- Unión Europea. Reglamento 2022/996. 2022. Available online: https://eur-lex.europa.eu/legal-content/ES/TXT/HTML/?uri=CELEX:32022R0996#anx_IX.
- Ward, J.H. Hierarchical grouping to optimize an objective function. J. Am. Stat. Assoc. 1963, 58, 236–244. [Google Scholar] [CrossRef]
- Zhang, Y.; Liu, H.; Li, J. Life cycle assessment of ammonia synthesis in China. Int. J. LifeCycle Assess. 2022, 27, 50–61. [Google Scholar] [CrossRef]
Table 3.
Results of the one-way ANOVA for the restricted scenario (n = 59).
| Source of variation | Sum of squares | Degrees of freedom | Mean square | F | p-value |
|---|---|---|---|---|---|
| Between groups (technologies) | 12,396,180 | 4 | 3,099,045 | 167.79 | < 0.001 |
| Within groups (residual/error) | 960,36 | 54 | 18,468 | — | — |
| Total | 13,356,540 | 58 |
Table 4.
Pairwise comparison matrix using Tukey's post-hoc test for urea technological categories (n = 59, restricted scenario).
Table 4.
Pairwise comparison matrix using Tukey's post-hoc test for urea technological categories (n = 59, restricted scenario).
| Group 1 | Group 2 | Mean difference (kg CO₂-eq / t) | Lower CI | Upper CI | Adjusted p-value | Significant difference |
|---|---|---|---|---|---|---|
| Coal | High-efficiency gas | –1,560.70 | –1,763.60 | –1,357.80 | < 0.001 | Yes |
| Coal | Average gas | –1,117.30 | –1,294.64 | –939.96 | < 0.001 | Yes |
| Coal | Mixed systems | –703.47 | –920.66 | –486.27 | < 0.001 | Yes |
| Coal | Green urea | –2,071.78 | –2,361.37 | –1,782.19 | < 0.001 | Yes |
| High-efficiency gas | Average gas | 443.40 | 294.07 | 592.74 | < 0.001 | Yes |
| High-efficiency gas | Mixed systems | 857.23 | 662.24 | 1,052.23 | < 0.001 | Yes |
| High-efficiency gas | Green urea | –511.08 | –784.42 | –237.74 | < 0.001 | Yes |
| Average gas | Mixed systems | 413.83 | 245.59 | 582.07 | < 0.001 | Yes |
| Average gas | Green urea | –954.49 | –1,209.42 | –699.55 | < 0.001 | Yes |
| Mixed systems | Green urea | –1,368.32 | –1,652.43 | –1,084.21 | < 0.001 | Yes |
Disclaimer/Publisher’s Note: The statements, opinions and data contained in all publications are solely those of the individual author(s) and contributor(s) and not of MDPI and/or the editor(s). MDPI and/or the editor(s) disclaim responsibility for any injury to people or property resulting from any ideas, methods, instructions or products referred to in the content. |
© 2026 by the authors. Licensee MDPI, Basel, Switzerland. This article is an open access article distributed under the terms and conditions of the Creative Commons Attribution (CC BY) license (http://creativecommons.org/licenses/by/4.0/).
Copyright: This open access article is published under a Creative Commons CC BY 4.0 license, which permit the free download, distribution, and reuse, provided that the author and preprint are cited in any reuse.