
Submitted:
22 July 2026
Posted:
22 July 2026
You are already at the latest version
Abstract
Featuring considerable tensile ductility and multiple cracking behavior, polyethylene fiber-reinforced engineered cementitious composites (PE-ECC) are promising cement-based materials for engineering construction. However, establishing accurate design models for evaluating the mechanical properties of PE-ECC is a challenging task owing to the complex material components. This study presents an interpretable data-driven framework for predicting the mechanical properties of PE-ECC using mixture-of-experts (MoE) learning. A database comprising 383 deduplicated material-level records from 90 verified literature sources was compiled for modelling the compressive strength, ultimate tensile strain, ultimate tensile strength and first-cracking tensile strength of PE-ECC. An MoE prediction model was developed by integrating XGBoost, LightGBM, CatBoost, WDBPANN and TabPFN through out-of-fold stacking and learned gating. The model achieved coefficient of determination (R2) values of 0.971, 0.950, 0.970 and 0.954 for the four mechanical properties, respectively. SHAP, ALE and response maps were used to examine the fitted nonlinear associations between the reported mixture variables and each target property. Based on these relationships, support-filtered virtual screening was conducted within the database-supported design space to identify candidate mixtures for subsequent experimental verification. The framework links target-specific prediction with mixture-response interpretation and confines screening to regions supported by reported PE-ECC mixtures.
Keywords:
PE-ECC
; mixture-of-experts learning
; mechanical property prediction
; mixture-response interpretation
; support-filtered virtual screening
1. Introduction
Engineered cementitious composites (ECC) are strain-hardening cementitious materials designed to maintain tensile load after matrix cracking through fiber bridging and distributed multiple cracking. Compared with ordinary concrete, ECC shows higher tensile deformability, tighter crack-width control and better damage tolerance, which makes it attractive for repair and strengthening, link slabs, high-ductility structural components, 3D-printable cementitious materials and durability-oriented construction systems [1,2,3,4,5,6,7,8]. Polyethylene fiber-reinforced ECC (PE-ECC) has received particular attention because PE fibers provide high tensile strength, chemical stability and strong crack-bridging potential. For PE-ECC, however, increasing matrix strength alone does not guarantee stable tensile strain hardening. A denser matrix may increase compressive strength and first-cracking stress, but continued load transfer after cracking also depends on the fibers being well distributed and able to bridge successive cracks. PE-ECC mixture design must therefore balance matrix strength, crack initiation, post-cracking resistance and tensile deformation.
These four properties cover complementary engineering requirements: compressive capacity, crack initiation, post-cracking tensile resistance and deformation through multiple cracking. Considering them together is useful when screening PE-ECC for repair, strengthening and other high-ductility applications, where strength and deformation compatibility must be balanced.
Reliable prediction of PE-ECC mechanical properties is important for reducing trial-and-error mixture design and for selecting promising mixtures before laboratory testing. This prediction task is difficult because the reported mechanical properties are governed by several coupled mixture variables. Binder composition and W/B affect hydration, pore structure, matrix strength and cracking resistance. S/B changes the matrix skeleton and the amount of paste available for fiber dispersion. Fiber volume, length, diameter, modulus and tensile strength describe the reported fiber parameters, but the resulting tensile behavior also depends on fiber orientation, dispersion and fiber-matrix interaction [9,10,11,12,13,14,15,16,17]. Empirical equations are usually too restrictive for such a heterogeneous mixture space. Micromechanical models provide the fundamental design criteria for ECC, including the stress and energy conditions for steady-state multiple cracking, but their direct use requires pullout laws, matrix fracture toughness, fiber orientation, crack spacing and crack-width information [1,2,3,13,14,15,16]. In literature-derived PE-ECC datasets, these micromechanical quantities are usually not reported together with mixture proportions. Accordingly, the present analysis is built on the information that is consistently available across published PE-ECC studies: reported mixture proportions, fiber parameters and the main mechanical test results.
Machine-learning models have been used to represent nonlinear mixture-property relationships in cementitious materials. Ensemble learning and stacking can improve prediction stability by combining learners with different regression behaviours [18,19,20,21,22,23,24,25]. This is relevant to PE-ECC literature data, where records come from different binder systems, sand contents, fiber parameters, curing regimes and testing protocols. A single learner may fit one part of this heterogeneous response space well but perform less consistently in another. The present MoE framework therefore combines five base learners through stacking and learned gating to construct target-specific PE-ECC response models.
Machine learning has already been applied to ECC, SHCC and PE-ECC. Recent PE-ECC studies have used optimized explainable ensemble models to predict tensile performance and identify influential variables [20]. Broader ECC studies have predicted mechanical properties and analyzed mixture effects using machine-learning models [21,22]. The materials-genome strategy for ECC has linked raw material attributes, mixture proportions, property prediction and inverse design [26]. SHCC multi-objective studies have further combined mechanical performance, environmental impact and material cost in mixture optimization [27]. Several gaps nevertheless remain for PE-ECC. Databases that mix different ECC or SHCC fiber systems may obscure trends specific to polyethylene-fiber mixtures. First-cracking tensile strength is also reported and modelled less consistently than peak tensile strength or tensile strain, although it marks the transition from the uncracked matrix to post-cracking load transfer. In addition, feature-importance rankings alone do not show how fitted trends depend on binder closure, W/B and S/B, or how crack initiation differs from peak tensile resistance. Finally, prediction-based screening may enter poorly supported regions and is seldom checked against complete multi-response records before new candidates are proposed. The present study addresses these gaps using a PE-ECC database and separate MoE models for the four properties. It then examines their relationships with the reported mixture variables and restricts screening to the supported mixture space.
This study develops an interpretable MoE framework to predict PE-ECC mechanical properties, examine their relationships with the reported mixture variables and support mixture screening. A PE-ECC-only literature database was constructed from reported binder, sand and fiber variables. Target-specific MoE models were trained for compressive strength, ultimate tensile strain, ultimate tensile strength and first-cracking tensile strength by combining XGBoost, LightGBM, CatBoost, WDBPANN and TabPFN through stacking and learned gating. The fitted models were interpreted using SHAP, ALE, two-factor response maps and response surfaces to examine how binder composition, W/B, S/B and reported fiber parameters affect PE-ECC strength, tensile deformation and first cracking. The interpreted trends were then used for support-filtered virtual screening within the database-supported design space. The mechanically feasible candidates were compared using material-level embodied carbon (EC) and material cost (Cost) calculated from literature factors. Figure 1 summarizes the workflow from PE-ECC database construction to MoE prediction, mechanism interpretation and mixture screening.
2. PE-ECC Database and Reported Mixture Variables
2.1. Database Scope and Target Responses
A PE-ECC-only database was assembled from published material-level records. The database was restricted to mixtures reinforced with polyethylene-family fibers, including PE and UHMWPE fibers, so that the learned trends were not mixed with those of PVA-, PP-, steel- or hybrid-fiber systems. Matrix-only mortars and component-level structural tests were also excluded. In this study, one material-level record refers to one PE-ECC mixture with reported mixture information and at least one target mechanical property.
The database contained 383 deduplicated material-level PE-ECC records from 90 verified literature sources [4,5,6,7,8,9,28,29,30,31,32,33,34,35,36,37,38,39,40,41,42,43,44,45,46,47,48,49,50,51,52,53,54,55,56,57,58,59,60,61,62,63,64,65,66,67,68,69,70,71,72,73,74,75,76,77,78,79,80,81,82,83,84,85,86,87,88,89,90,91,92,93,94,95,96,97,98,99,100,101,102,103,104,105,106,107,108,109,110,111]. Four target properties were considered: compressive strength (fc′), ultimate tensile strain (εt), ultimate tensile strength (ft), and first-cracking tensile strength (ft0). The corresponding valid record numbers were 308, 368, 368 and 304, respectively. Missing target values were not filled by interpolation or by using other properties; each response model was trained only with records that reported the corresponding target.
First-cracking tensile strength was extracted only from uniaxial tensile records. Reported first-cracking stress or strength values were used when they were tabulated directly. When the value was not tabulated, it was read from bilinear tensile models, reported average cracking stresses or clearly readable tensile stress-strain curves. Records that reported only peak tensile strength, calculated bridging stress, matrix cracking strength or flexural first-cracking strength were left without an ft0 value, rather than converted to uniaxial first-cracking tensile strength.
Figure 2 presents the statistical distribution of the input variables in the PE-ECC database. The collected mixtures do not uniformly cover the design space. Several SCM-related variables contain many zero values and are concentrated at several replacement levels, while W/B and S/B are distributed within relatively narrow practical ranges. The reported fiber parameters are also concentrated around commonly used PE-fiber configurations, indicating that non-standard fiber parameters are limited in both number and range. The later SHAP, ALE and two-factor plots therefore need to be read against this distribution. Trends in well-populated regions carry stronger evidence; sparse regions are treated as lower-support parts of the database.
2.2. Reported Mixture and Fiber Variables
The PE-ECC database provides information regarding the mixture proportions and fiber characteristics of each material-level record. Twelve reported variables were employed as model inputs, including OPC/B, FA/B, SF/B, GGBFS/B, LP/B, W/B, S/B, Vf, Lf, Df, Ef and fiber tensile strength. These variables describe the relative proportions of cementitious components, water and sand contents relative to binder, and the reported dosage, dimensions and material properties of PE-family fibers.
According to the material-genome concept, the mechanical properties of ECC are closely related to both raw material attributes and mixture proportions. In the present literature-derived database, however, detailed raw material attributes were not consistently available. Therefore, the present study used the reported mixture and fiber variables as the material-level descriptors for model development and response interpretation.
For the normalized binder fractions used in the database, the cementitious components satisfy the following closure relation:
Thus, OPC/B, FA/B, SF/B, GGBFS/B and LP/B were interpreted as a closed binder composition. A change in one binder fraction necessarily changes the balance of the remaining binder components. W/B and S/B were treated as ratio variables describing water availability and sand content relative to binder, respectively.
For the mechanism-oriented SHAP, ALE and two-factor analyses, the discussion mainly focused on ten mixture-design variables: OPC/B, FA/B, SF/B, GGBFS/B, LP/B, W/B, S/B, Vf, Lf and Df. Ef and fiber tensile strength were retained as model inputs but were not emphasized in the SHAP discussion because their reported ranges were narrow and largely reflected differences among the PE-fiber products used in the source studies.
These reported variables were used in the target-specific MoE models described in Section 3.
3. MoE Learning Method and Model Validation
3.1. MoE Architecture and Learning Sequence
Four target-specific learning tasks were constructed for fc′, εt, ft and ft0. All four models used the same 12 reported mixture and fiber variables. For each response, however, the training records were limited to mixtures that actually reported that response; a missing fc′, εt, ft or ft0 value was not inferred from the other measured responses.
Missing target values were retained as missing. Missing input values were filled using the median from the same source where available and otherwise the database median, with each affected record identified in the accompanying data file. For each target, the available records were divided into training and evaluation subsets at an approximately 8:2 ratio.
Although the database contains 383 records, coverage is uneven across the 12 input variables because the records span different binder systems, sand contents, fiber configurations, curing conditions and test protocols. The base set comprised XGBoost, LightGBM and CatBoost as tree-based learners, WDBPANN as a neural-network learner and TabPFN as a tabular learner [112,113,114,115].
Each base learner generated out-of-fold predictions for the training records. These predictions were combined with base-learner disagreement and local-support descriptors as the inputs to the stacking layer. Four meta learners, Bayesian ridge, Huber regression, ElasticNet and a Huber-loss gradient-boosting regressor, were then combined by a learned softmax gate to obtain the final target-specific prediction. The Huber-based components were included to limit the influence of a small number of atypical observations on the stacking fit. The learned gate was used only for prediction.
The target-specific MoE prediction is written as:
In Eqs. (2) and (3), the base learners first provide target-specific predictions, and the meta-learner outputs are then combined by a softmax gate. All level-1 predictions used to train the meta learners and the gate were generated out of fold, so each training record was predicted by base learners that had not been fitted on that record. The same data-partition and evaluation procedure was applied to the reference models and the MoE model.
Local support was measured in the standardized feature space using k-nearest-neighbour distance, local density, Mahalanobis distance and the observed-envelope flag. These quantities entered the stacking layer and also identified predictions made in sparse parts of the database. Gate weights, disagreement and local-support descriptors were not used for material interpretation in Section 4.
The main hyperparameters included tree depth, learning rate, sampling ratio and regularization terms for the tree models, and hidden width, dropout rate and training epochs for WDBPANN. Hyperparameters were selected separately for each response using Optuna within the same training protocol.
Figure 3 summarizes the stacking sequence. Out-of-fold predictions from the five base learners were combined with disagreement and local-support descriptors, then passed to the target-specific meta-learning and gating layers for fc′, εt, ft and ft0. The material interpretation in Section 4 uses the reported variables and fitted property trends rather than gate weights or support descriptors.
3.2. Model Prediction Performance
The prediction performance of the target-specific MoE models was evaluated using out-of-fold validation during model development and the designated evaluation records for final reporting. The coefficient of determination (R²), root mean square error (RMSE), and mean absolute error (MAE) were adopted as statistical indicators. The values reported in Table 1 correspond to the evaluation records.
The performance indices of the four MoE models are listed in Table 1. The obtained R² values for fc′, εt, ft, and ft0 were 0.971, 0.950, 0.970, and 0.954, respectively. The corresponding RMSE/MAE values were 5.952/1.226 MPa, 0.562/0.305%, 0.585/0.307 MPa, and 0.449/0.239 MPa, respectively. Under the reported evaluation protocol, the MoE models reproduced the four reported PE-ECC properties with high accuracy.
Figure 4 compares the MoE model with XGBoost and WDBPANN on the same evaluation records. They provide tree-based and neural-network reference results, respectively. The size of the difference between the MoE and the two reference models varies among the four targets.
The reference-model results are closer to the MoE result for fc′ and differ more for εt, ft and ft0. Combining the five base learners reduces dependence on a single regression form and gives the larger tensile-target improvement shown in Figure 4. This comparison concerns predictive performance under the adopted evaluation protocol; the material trends are examined separately in Section 4.
Figure 5 compares the reported and predicted values of the four PE-ECC properties. Most points lie close to the ideal prediction line, although the tensile-related targets show wider scatter than fc′. Together with the metrics in Table 1, these parity plots support analysis of fitted property trends within the reported PE-ECC range.
4. Mechanism Analysis of PE-ECC Mixture-Response Relationships
4.1. Comparison of the Four PE-ECC Properties
A change in mixture composition does not affect the four properties in parallel. A direction that raises fc′ or ft0 may leave ft or εt unchanged or reduce it. Section 4 therefore examines each fitted property trend before comparing their differences in Section 4.5.
ECC micromechanics provides the material basis for this interpretation. Stable multiple cracking requires sufficient fiber-bridging stress and complementary energy relative to the matrix cracking demand [1,2,3]. The present database was compiled from published PE-ECC mixture records, for which pullout curves, matrix fracture toughness, crack spacing and crack-width data are rarely available in a comparable form. The following analysis therefore remains at the mixture-response level and examines how reported binder, sand and fiber variables are associated with fc′, εt, ft and ft0 within the collected PE-ECC range.
Figure 6 summarizes the SHAP importance of the reported mixture variables for the four properties. The rankings differ among the targets. For fc′, W/B ranks first, in agreement with the established influence of water content on matrix compactness and compressive strength [10,11,12]. The binder-fraction rankings are examined as compositional changes in Section 4.2.
For εt, the important variables are distributed among W/B, binder fractions, S/B and the nominal fiber variables. Tensile ductility is not governed by matrix densification alone. Distributed cracking requires the matrix cracking resistance to remain compatible with the bridging capacity developed by the fibers. W/B and binder composition influence matrix properties and rheology, while Vf, Lf and Df specify the reported fiber dosage and dimensions. At fixed Vf, smaller Df increases the nominal number of fibers available to cross a crack plane, whereas longer Lf increases embedment length and aspect ratio. The realized contribution also depends on fiber dispersion and orientation [1,2,3,13,14,15,16].
W/B, S/B and the nominal fiber variables rank prominently in both the ft0 and ft models, but their ALE profiles and two-factor maps differ. The following analysis examines where these two tensile-strength measures differ within the reported PE-ECC range.
Figure 7 shows the normalized ALE profiles of the ten mixture-design variables used in the mechanism-oriented analysis. The ALE values were normalized by the IQR of the corresponding target; therefore, the curves are used to compare the relative variation of the fitted property values within the database range rather than absolute increments in strength or strain. Together with the SHAP ranking in Figure 6, the ALE profiles provide information on the direction and nonlinearity of the mixture-response relationships.
The W/B profiles separate the strength-related properties from tensile ductility. The fitted values of fc′, ft and ft0 decrease as W/B increases, whereas εt changes only slightly and non-monotonically. Lower W/B can produce a denser and stronger matrix, but distributed cracking also depends on the balance between matrix cracking demand and fiber-bridging capacity [1,2,3,10,11,12,13,16].
The binder-fraction profiles also differ among the four targets. Within the sampled range, the higher fitted values of fc′, ft and ft0 occur mainly at higher OPC/B, whereas the higher part of the εt profile occurs at larger FA/B or GGBFS/B. SF/B and LP/B show no common monotonic trend across the four properties. Because the binder fractions are compositionally coupled, these profiles describe changes in the overall binder composition rather than isolated component effects.
Higher S/B is associated with larger fitted fc′ and ft0, while εt and ft decline toward the upper end of the S/B range. Increasing S/B reduces the paste available around particles and fibers and can intensify particle-fiber interference, which may hinder uniform fiber distribution and distributed cracking [13,14,15,17].
The reported fiber parameters mainly influence the tensile properties. fc′ is nearly insensitive to Vf, Lf and Df, whereas εt, ft and ft0 vary more clearly with these variables. Increasing Lf is associated with higher fitted tensile values, and smaller Df is favorable for εt and ft. At fixed Vf, these changes increase aspect ratio, embedment length and the nominal number of fibers intersecting a crack plane. The Vf profile, especially for εt, is not strictly monotonic; increasing fiber volume is beneficial only when matrix rheology permits adequate dispersion and the matrix cracking resistance remains compatible with fiber bridging [1,2,3,13,14,15,16].
Overall, Figure 7 indicates that the four PE-ECC properties show different mixture-response patterns. The strength-related properties are mainly associated with W/B, binder composition and matrix skeleton, whereas εt is more sensitive to the combined effects of binder composition, S/B and nominal fiber dosage and geometry. Because these variables are coupled in actual PE-ECC mixture design, the subsequent two-factor plots are used to examine whether the one-variable tendencies observed in Figure 7 remain valid under combined changes of mixture variables.
Figure 8 shows four selected two-factor response maps based on the variables highlighted in Figure 7. The maps compare where higher predicted values of fc′, εt, ft and ft0 appear within the collected PE-ECC mixture range.
For fc′, the W/B-SF/B map is mainly controlled by W/B. The higher-strength region remains at low W/B, while SF/B modifies the fitted strength level within this low-W/B range. This pattern is consistent with lower W/B increasing matrix compactness and silica fume contributing through particle packing and pozzolanic reaction [10,11,12].
For εt, the higher-strain region lies at moderate W/B and in FA-containing compositions rather than along the low-W/B band that gives the highest fc′. Distributed cracking requires the matrix cracking demand to remain below the available fiber-bridging capacity. A very dense matrix can raise that demand, whereas an excessively weak matrix may provide insufficient stress transfer; neither condition necessarily maximizes εt. High-volume-FA ECC studies likewise associate FA-rich matrices with lower matrix cracking resistance and greater tensile ductility [1,2,3,11,13,16].
Both ft and ft0 remain higher toward low W/B, but their changes along S/B are not parallel. The S/B difference is examined in Section 4.3.
Each target in Figure 8 has its own color scale, so colors show variation within each property and are not directly comparable among properties. The following subsections examine the binder, sand and fiber variables in turn.
4.2. Effects of Binder Composition and W/B on Strength and Tensile Behavior
Lower W/B generally increases matrix compactness and reduces capillary porosity, which accounts for the strong W/B gradient in the strength maps [10,11,12]. Because the binder fractions in Eq. (1) sum to unity, they are interpreted as a composition rather than as independent dosages. A greater GGBFS/B increases the slag proportion. Its latent hydraulic reaction can contribute to later-age matrix strength, while changes in fresh-state rheology may also affect fiber dispersion [10,116,117]. LP/B introduces a different balance: cement dilution can reduce matrix strength and cracking resistance, whereas particle packing and nucleation can improve compactness and early hydration [12,89,117].
Figure 9 shows a low-W/B high-value region for fc′ across the selected binder planes. The higher εt values occur at moderate W/B and in FA- or GGBFS-containing compositions, while ft and ft0 remain closer to the low-W/B region. The tensile-strain region is displaced from the part of the mixture space associated with the highest matrix strength.
Figure 10 shows pronounced composition gradients in the OPC/B-FA/B and FA/B-SF/B maps. Higher fc′, ft and ft0 occur more often in OPC-rich or SF-containing regions, whereas higher εt appears more often in FA- or FA-GGBFS-containing regions. Because the binder fractions vary together, these trends refer to joint binder states rather than isolated component effects. The FA-GGBFS regions with higher εt may reflect a balance among matrix cracking resistance, slag reaction and the fresh-state conditions needed for fiber dispersion [10,116,117]. The LP/B panels show localized high-value areas rather than a monotonic band, consistent with the competing effects of cement dilution, particle packing and nucleation [12,89,117].
Figure 11 tests whether the W/B-FA/B and W/B-SF/B patterns persist as a third binder fraction changes. Across the εt panels, higher values remain concentrated near moderate W/B and FA-containing compositions at the represented SF/B levels. Across the fc′ panels, varying FA/B changes the fitted magnitude without displacing the high-value region from low W/B. Taken with Figure 9 and Figure 10, the strength-related properties are concentrated mainly in low-W/B, OPC- or SF-rich regions, whereas higher εt occurs more often in FA- or GGBFS-containing regions. The LP/B panels show no stable monotonic gradient over the sampled range. Section 4.3 next examines S/B and the reported fiber variables.
4.3. Effects of S/B and Fiber Parameters on Tensile Behavior
The following maps examine S/B together with the reported fiber dosage and dimensions, building on the binder-composition and W/B results above.
The W/B-S/B maps in Figure 12 place high ft mainly at low W/B and low-to-moderate S/B, whereas ft0 remains high across a broader low-W/B region. This difference is compatible with ECC micromechanics: first cracking depends primarily on the matrix cracking threshold, while peak tensile stress also depends on the bridging law after cracking [1,2,3,16].
For εt, the higher values lie at moderate W/B and lower S/B, outside the region of highest matrix strength. At lower S/B, the larger paste fraction and reduced particle-fiber interference may favor a more uniform fiber distribution [13,14,15,17]. In the S/B-Vf map, the same region extends toward the higher-Vf part of the supported range; ft and ft0 vary less sharply along S/B alone.
Figure 13 focuses on Vf, Lf and Df. Higher fitted tensile values occur mainly at higher Vf, longer Lf and smaller Df. At fixed Vf, smaller Df increases the nominal number of fibers that can intersect a crack plane, while longer Lf increases aspect ratio and embedment length; the actual bridging behavior remains dependent on orientation, dispersion and fiber-matrix interaction [3,13,14,15,16]. Taken with Figure 12, these maps show that the effects of fiber dosage and dimensions vary with S/B. This interaction motivates the εt/FI analysis in Section 4.4.
4.4. Tensile Strain per Nominal Fiber Index and Post-Cracking Stress Increment
Section 4.3 showed that Vf, Lf and Df are associated with the tensile properties. To compare tensile strain against their combined dosage and dimensions, Figure 14 normalizes εt by a simple nominal fiber index:
where Vf is expressed in percent and Lf/Df is the fiber aspect ratio. FI combines the reported fiber dosage and aspect ratio. The ratio εt/FI is used to compare the tensile strain developed at a similar nominal fiber index; it is not a direct measure of fiber-bridging efficiency.
Figure 14 maps εt/FI across the reported PE-ECC mixture space. Higher values occur mainly at lower S/B, moderate-to-high W/B and FA-containing binder compositions. This distribution shows that tensile strain relative to FI varies with matrix and sand proportions. FI represents fiber dosage and aspect ratio, whereas matrix cracking resistance and the conditions governing fiber distribution also affect the strain developed at a given FI [13,14,15,16,17].
Two derived indicators were used to compare first cracking with peak tensile stress:
where Δft denotes the stress increase from first cracking to peak tensile strength, and ρt is the corresponding strength ratio. These two indicators describe the reported tensile stress gain after the first crack, and are used to compare ft0 and ft in the database.
Figure 15 shows considerable variation in Δft among records with comparable ft0. The W/B coloring likewise shows no monotonic increase in Δft with ft0. This scatter is compatible with the two micromechanical conditions for strain hardening: crack initiation depends on the matrix cracking threshold, whereas stress development after cracking depends on the available bridging law and complementary energy [1,2,3].
Figure 14 and Figure 15 show that nominal fiber geometry and first-cracking stress alone do not determine the subsequent tensile behavior. Matrix and sand conditions affect the strain developed for a given FI, and mixtures with similar ft0 can develop different Δft values [1,2,3,13,14,15,16]. These results are compared across all four properties in Section 4.5.
4.5. Synthesis of the Four PE-ECC Responses
Figure 16 brings together four response surfaces for cross-target comparison: W/B-SF/B for fc′, W/B-FA/B for εt, and W/B-S/B for ft and ft0. The surfaces locate the higher fitted values within the reported PE-ECC mixture range.
The fc′ surface is dominated by W/B. Its higher-value ridge remains at low W/B in the W/B-SF/B plane, while SF/B mainly changes the height and shape of this low-W/B region. The εt surface occupies a different region: higher predicted tensile strain appears closer to moderate W/B and FA-containing binder states, rather than in the lowest-W/B high-strength region. This contrast summarizes the central difference between strength development and tensile deformation in PE-ECC.
Although both ft and ft0 are higher at low W/B, the ft surface is more confined to low-to-moderate S/B, whereas ft0 remains broadly aligned with the low-W/B region. The mixture direction associated with peak tensile strength is therefore not identical to that associated with first cracking.
5. High-Performance Mixture Features and Constrained Mixture Screening
5.1. Reported-Record Benchmark for High-Performance PE-ECC Mixtures
Complete four-target reported records were first used as a benchmark for identifying the high-strain and high-strength PE-ECC region. The benchmark was based on records that simultaneously reported fc′, εt, ft and ft0, so that high tensile strain and high peak tensile strength could be examined without losing the first-cracking value.
In Figure 17, the high-performance window is defined by the upper-quartile region of reported εt and ft. Twenty-three complete reported records fall in this window. Applying the same εt-ft thresholds to the MoE predictions selected 17 records. Sixteen also lie in the reported window, corresponding to 16/17 of the model-selected set and 16/23 of the reported window. This overlap provides the reported-record benchmark for the subsequent virtual screening.
The high-performance records occupy the upper-right part of the εt-ft field and tend to have lower W/B, lower S/B and higher FI. Their binder compositions generally contain less OPC/B and more GGBFS/B, LP/B and SCMtotal. Here, SCMtotal is the sum of FA/B, SF/B, GGBFS/B and LP/B. This distribution is compatible with the response maps in Section 4, where higher εt occurs more often at lower S/B and greater total binder replacement than in the OPC-rich, low-W/B strength region.
5.2. Generation and Filtering of Virtual Candidates Within the Database-Supported Design Space
Virtual candidates were generated around reported PE-ECC records to sample additional mixtures within the supported variable range. A pool of 5000 candidates was produced by perturbing reported mixture records within the prescribed bounds while retaining the reported variable ranges and fiber-material information.
Each virtual point was tied to one parent record with complete reported mixture variables; the parent pool contained 382 records. Binder fractions were perturbed around the parent composition, clipped to non-negative values and renormalized to closure. W/B, S/B, Vf, Lf and Df were perturbed around the parent values and then clipped to the database Q5-Q95 range. Fiber modulus and fiber tensile strength were inherited from the parent record because these are material properties rather than mixture proportions.
The generation step used three constraints. First, the perturbed binder fractions were renormalized to satisfy the binder-closure condition, OPC/B + FA/B + SF/B + GGBFS/B + LP/B = 1. Second, W/B, S/B, Vf, Lf and Df were restricted to the database-supported Q5-Q95 range. Third, the generated candidates were filtered by applicability-domain measures in the model feature space. A candidate was retained only when its kNN distance and Mahalanobis distance were below the 95th-percentile support limits calculated from the reported records.
Applicability-domain filtering retained 4000 of the 5000 generated candidates. The support limits were kNN distance ≤ 3.667 and Mahalanobis distance ≤ 5.675, both calculated from the distribution of reported records in the standardized feature space. The retained candidates were evaluated using their predicted mechanical properties, EC, Cost, FI, SCMtotal, Δft, ρt and applicability-domain diagnostics.
Nineteen database records and 130 support-filtered virtual mixtures satisfied the mechanical constraints. The virtual set samples additional feasible combinations near reported records without extending the search beyond the stated support limits.
5.3. Screening Results and Carbon-Cost Decision Map
The virtual candidates were screened under the same mechanical requirements used for the database-only check. The screening thresholds were set from the reported-record benchmark: εt and ft were required to exceed their reported upper-quartile values, 7.793% and 10.295 MPa, respectively; fc′ was required to exceed the reported median value, 81.555 MPa. These thresholds were applied to fc′, εt and ft; Δft > 0 was applied as the fourth screening constraint. ft0 and Δft were also retained as indicators for comparing the feasible candidates:
Here, req denotes the required value for a given screening case. For material-level carbon and cost comparison, the inventory sums were written as:
Material-level embodied carbon and material cost are derived indicators rather than measured target properties in the database. In this section, EC denotes material-level embodied carbon calculated from literature factors, and Cost denotes the corresponding material cost.
The factors listed in Table 2 were adopted from [26,27]. For a one-cubic-meter mixture estimate, ingredient masses can be obtained from reported ratios using a volume-balance calculation and literature densities. The material-level embodied carbon and material cost are then computed using Eqs. (7) and (8), where mi is the mass of ingredient i, ei is the unit embodied-carbon factor and ci is the unit material-cost factor. The represented ingredients are OPC, FA, SF, GGBFS, LP, sand, water and PE fiber. Chemical admixtures are not included because they are not consistently reported.
The comparison is a material-level relative screening. The EC and Cost values are literature-factor-based estimates and do not represent a complete life-cycle assessment or project-specific construction cost. Transportation, mixing, curing, construction, service life and regional cost differences are outside the calculation.
Because EC and Cost are calculated from literature factors, the carbon-cost ranking should be read with factor sensitivity in mind. Changes in local prices, cement carbon intensity, by-product allocation factors or PE-fiber inventory values can shift the low-carbon and low-cost ranks. For this reason, the mechanical feasibility filter and the carbon-cost ranking are kept separate: the same candidate list can be recalculated with a different factor set without changing the MoE-predicted mechanical properties.
Candidate ranking was performed only within the feasible virtual set. For each candidate, the four mechanical properties were min-max normalized and averaged to obtain the mechanical score. EC and Cost were converted to carbon and cost scores by reversing their normalized values, so that larger scores represented lower EC or Cost. The balanced score was calculated as the average of the mechanical, carbon and cost scores.
Four representative virtual candidates were selected from the feasible set to illustrate different decision preferences: mechanical priority, low carbon, low cost and a balance among mechanical performance, EC and Cost. The candidate for mechanical priority was selected using the mechanical ranking score, the low-carbon and low-cost candidates were selected by the minimum EC and minimum Cost among feasible candidates, and the balanced candidate was selected using a normalized score that combines mechanical performance, EC and Cost. Their values are reported in Table 3.
Table 3 reports the summary variables used to compare the four representative candidates. The table is used for comparing decision preferences rather than for presenting a complete mixture-design specification.
Figure 18 plots the support-filtered virtual candidates in the EC-Cost plane. Grey points denote all retained virtual candidates, and the highlighted points denote those satisfying the mechanical constraints. The four larger markers identify the representative candidates listed in Table 3. The feasible points occupy a limited part of the retained EC-Cost distribution.
The EC-Cost map shows how the four representative candidates occupy different parts of the decision space. Among the representative candidates, the mechanical-priority option gives the highest predicted fc′, εt, ft and ft0, but it also has the highest EC. The low-carbon and low-cost candidates occupy different parts of the EC-Cost plane, showing that reducing EC does not necessarily give the lowest material cost. The balanced candidate provides an intermediate choice with predicted εt = 8.10%, predicted ft = 16.06 MPa, EC = 428.3 kg CO2-e/m3 and Cost = 424.9 USD/m3.
5.4. Candidate Interpretation and Verification Scope
The representative candidates are used to show how different engineering priorities lead to different mixture choices. The mechanical-priority candidate combines low W/B, low S/B and the highest FI among the four representatives, which is consistent with its high predicted strength and tensile performance. This option is useful when the main objective is to maximize mechanical performance after the feasibility constraints are met, but it does not minimize EC or Cost.
The low-carbon and balanced candidates both have high SCMtotal values. Their larger total binder replacement lowers the factor-based EC estimate while retaining the predicted tensile requirements. The low-carbon candidate gives EC = 409.1 kg CO2-e/m3, whereas the balanced candidate gives EC = 428.3 kg CO2-e/m3 with a higher predicted ft. The low-cost candidate gives Cost = 355.8 USD/m3, but its predicted tensile and compressive strengths are lower than those of the mechanical-priority and balanced candidates. The four candidates thus represent different engineering priorities.
The database-only and virtual screenings give different factor-based candidate ranges. The database-only low-carbon candidate had EC = 580.9 kg CO2-e/m3, whereas the virtual low-carbon candidate has EC = 409.1 kg CO2-e/m3. The database-only low-cost candidate had Cost = 405.1 USD/m3, whereas the virtual low-cost candidate has Cost = 355.8 USD/m3. The lower estimates in the virtual set occur at nearby support-filtered compositions that require laboratory confirmation.
The four candidates are therefore proposed for laboratory verification, not as final optimized designs. Direct tensile tests, crack-pattern measurements, pullout tests and fiber-dispersion characterization are needed to verify whether the predicted balance among strength, tensile ductility, EC and Cost can be achieved experimentally.
6. Conclusions
This study used a PE-ECC-only literature database to connect reported binder, sand and fiber variables with four mechanical properties: fc′, εt, ft and ft0. The fitted mixture-level trends from published PE-ECC records were then used for database-supported mixture screening. The main conclusions are as follows.
- A PE-ECC-only database containing 383 deduplicated material-level records from 90 verified literature sources was established. Twelve reported binder, sand and fiber variables were used as model inputs. The valid record numbers were 308 for fc′, 368 for εt, 368 for ft and 304 for ft0. Missing target values were not inferred from other properties, so each target-specific model was trained only with records that reported the corresponding target value.
- The target-specific MoE stacking ensemble reproduced the four reported PE-ECC properties with high accuracy. The R² values were 0.971, 0.950, 0.970 and 0.954 for fc′, εt, ft and ft0, respectively. The improvement over the single-model references was larger for the tensile-related targets, for which the reference-model results were less consistent.
- The response interpretation shows that the four targets follow different mixture trends. fc′ is mainly associated with low W/B. εt does not follow the same densification path and is favored by mixture regions with suitable matrix cracking resistance, paste availability and reported fiber dosage and dimensions. The W/B-S/B maps further show that the high-ft region is more confined to low-to-moderate S/B, whereas ft0 remains more continuously associated with the low-W/B region.
- Binder variables should be read as a closed composition rather than as independent SCM dosages. Within this composition, W/B remains the main coordinate for matrix-strength development, while FA-, GGBFS-, SF- and LP-containing states modify the fitted property values through changes in dilution, packing, pozzolanic or latent-hydraulic contribution and paste availability. These trends are mixture-level interpretations based on reported variables and require targeted tests for direct verification of hydration, pore structure, fracture behavior and crack-pattern development.
- The database-only screening identified 19 feasible reported records, and the support-filtered virtual screening identified 130 feasible candidates. Representative mechanical-priority, low-carbon, low-cost and balanced candidates were compared using material-level EC and Cost values. These candidates and their surrounding feasible region provide mixture ranges for subsequent laboratory verification rather than final optimized PE-ECC designs.
Supplementary Materials
The following supporting information is submitted with this manuscript: Data S1: PE-ECC literature dataset used in this study (PE_ECC_Dataset.xlsx).
Author Contributions
Conceptualization, Y.W. and L.L.; Methodology, Y.W. and L.L.; Software, Y.W.; Validation, Y.W. and L.L.; Formal Analysis, Y.W.; Investigation, Y.W.; Resources, L.L.; Data Curation, Y.W.; Writing – Original Draft Preparation, Y.W.; Writing – Review & Editing, Y.W. and L.L.; Visualization, Y.W.; Supervision, L.L.; Project Administration, L.L.; Funding Acquisition, L.L. All authors have read and agreed to the published version of the manuscript.
Funding
This research was funded by the National Natural Science Foundation of China, grant number 52278519.
Data Availability Statement
The data presented in this study are available in the accompanying dataset. Additional information is available from the corresponding author upon reasonable request.
Conflicts of Interest
The authors declare no conflicts of interest. The funders had no role in the design of the study; in the collection, analyses, or interpretation of data; in the writing of the manuscript; or in the decision to publish the results.
References
- Li, V.C.; Leung, C.K.Y. Steady-State and Multiple Cracking of Short Random Fiber Composites. J. Eng. Mech. 1992, 118, 2246–2264. [Google Scholar] [CrossRef]
- Li, V.C. On engineered cementitious composites (ECC): A review of the material and its applications. J. Adv. Concr. Technol. 2003, 1, 215–230. [Google Scholar] [CrossRef]
- Yang, E.-H.; Wang, S.; Yang, Y.; Li, V.C. Fiber-Bridging Constitutive Law of Engineered Cementitious Composites. J. Adv. Concr. Technol. 2008, 6, 181–193. [Google Scholar] [CrossRef]
- Yu, K.-Q.; Lu, Z.-D.; Dai, J.-G.; Shah, S.P. Direct Tensile Properties and Stress-Strain Model of UHP-ECC. J. Mater. Civ. Eng. 2020, 32, 04019334. [Google Scholar] [CrossRef]
- Cai, M.; Zhu, H.; Wan, Y.; Zhu, H.; Rabczuk, T.; Zhuang, X. Using ultrafine fly ash to achieve low-carbon, high strength and high toughness engineered cementitious composites LC-HSTC. Case Stud. Constr. Mater. 2024, 20, e03259. [Google Scholar] [CrossRef]
- Liu, L.; Xiao, J.; Wu, Z. The effect of fiber content on the static and dynamic performance of PE-ECC. Case Stud. Constr. Mater. 2024, 20, e03041. [Google Scholar] [CrossRef]
- Li, L.; Cai, Z.; Yu, K.; Zhang, Y.X.; Ding, Y. Performance-based design of all-grade strain hardening cementitious composites with compressive strengths from 40 MPa to 120 MPa. Cem. Concr. Compos. 2019, 97, 202–217. [Google Scholar] [CrossRef]
- Yu, K.; Wang, Y.; Yu, J.; Xu, S. A strain-hardening cementitious composites with the tensile capacity up to 8%. Constr. Build. Mater. 2017, 137, 410–419. [Google Scholar] [CrossRef]
- Li, Y.; Li, J.; Yang, E.-H.; Guan, X. Investigation of matrix cracking properties of engineered cementitious composites (ECCs) incorporating river sands. Cem. Concr. Compos. 2021, 123, 104204. [Google Scholar] [CrossRef]
- Lothenbach, B.; Scrivener, K.; Hooton, R.D. Supplementary cementitious materials. Cem. Concr. Res. 2011, 41, 1244–1256. [Google Scholar] [CrossRef]
- Wang, S.; Li, V.C. Engineered cementitious composites with high-volume fly ash. ACI Mater. J. 2007, 104, 233–241. [Google Scholar] [CrossRef] [PubMed]
- Lothenbach, B.; Le Saout, G.; Gallucci, E.; Scrivener, K. Influence of limestone on the hydration of Portland cements. Cem. Concr. Res. 2008, 38, 848–860. [Google Scholar] [CrossRef]
- Li, M.; Li, V.C. Rheology, fiber dispersion, and robust properties of Engineered Cementitious Composites. Mater. Struct. 2013, 46, 405–420. [Google Scholar] [CrossRef]
- Li, Z.; Zhou, J.; Leung, C.K.Y. Fiber distribution in strain-hardening cementitious composites (SHCC): Experimental investigation and its correlation with matrix flowability and tensile strength. Cem. Concr. Compos. 2025, 160, 106068. [Google Scholar] [CrossRef]
- Li, Z.; Zhou, J.; Leung, C.K.Y. Fiber orientation distribution in strain hardening cementitious composites (SHCC): Experimental investigation and consideration of processing effect. Cem. Concr. Res. 2023, 170, 107190. [Google Scholar] [CrossRef]
- Zhu, B.; Pan, J.; Zhang, M.; Leung, C.K.Y. Predicting the strain-hardening behaviour of polyethylene fibre reinforced engineered cementitious composites accounting for fibre-matrix interaction. Cem. Concr. Compos. 2022, 134, 104770. [Google Scholar] [CrossRef]
- Sahmaran, M.; Lachemi, M.; Hossain, K.M.A.; Ranade, R.; Li, V.C. Influence of aggregate type and size on ductility and mechanical properties of engineered cementitious composites. ACI Mater. J. 2009, 106, 308–316. [Google Scholar] [CrossRef] [PubMed]
- Lundberg, S.M.; Lee, S.-I. A unified approach to interpreting model predictions. Adv. Neural Inf. Process. Syst. 2017, 30, 4765–4774. [Google Scholar]
- Apley, D.W.; Zhu, J. Visualizing the Effects of Predictor Variables in Black Box Supervised Learning Models. J. R. Stat. Soc. Ser. B Stat. Methodol. 2020, 82, 1059–1086. [Google Scholar] [CrossRef]
- Tabar, M.E.; Katlav, M.; Turk, K. Explainable ensemble algorithms with grey wolf optimization for estimation of the tensile performance of polyethylene fiber-reinforced engineered cementitious composite. Mater. Today Commun. 2025, 44, 112028. [Google Scholar] [CrossRef]
- Chen, W.; Fediuk, R.; Yu, J.; Nikolayevich, K.; Vatin, N.; Bazarov, D.; Yu, K. Performance prediction and analysis of engineered cementitious composites based on machine learning. Dev. Built Environ. 2024, 18, 100459. [Google Scholar] [CrossRef]
- Hossain, S.; Uddin, M.N.; Yan, K.; Hossain, M.M.; Golder, M.S.H.; Hoque, M.A. Prediction of the mechanical performance of polyethylene fiber-based engineered cementitious composite (PE-ECC). Low.-Carbon Mater. Green Constr. 2024, 2, 9. [Google Scholar] [CrossRef]
- Hollmann, N.; Müller, S.; Purucker, L.; Krishnakumar, A.; Körfer, M.; Hoo, S.B.; Schirrmeister, R.T.; Hutter, F. Accurate predictions on small data with a tabular foundation model. Nature 2025, 637, 319–326. [Google Scholar] [CrossRef] [PubMed]
- Wolpert, D.H. Stacked generalization. Neural Netw. 1992, 5, 241–259. [Google Scholar] [CrossRef]
- Jacobs, R.A.; Jordan, M.I.; Nowlan, S.J.; Hinton, G.E. Adaptive Mixtures of Local Experts. Neural Comput. 1991, 3, 79–87. [Google Scholar] [CrossRef] [PubMed]
- Chen, W.; Liang, L.; Jiang, F.; Tang, Z.; Sun, X.; Yu, J.; Li, V.C.; Yu, K. New opportunity: Materials genome strategy for engineered cementitious composites (ECC) design. Cem. Concr. Compos. 2025, 159, 106009. [Google Scholar] [CrossRef]
- Mahjoubi, S.; Barhemat, R.; Guo, P.; Meng, W.; Bao, Y. Prediction and multi-objective optimization of mechanical, economical, and environmental properties for strain-hardening cementitious composites. J. Clean. Prod. 2021, 329, 129665. [Google Scholar] [CrossRef]
- Bi, Y.; Yang, C.; Zhu, F.; Chen, J.; Pan, Y. Study on the freeze-thaw cycles and carbonization of ultra-high molecular weight polyethylene fiber reinforced engineered cementitious composite for link slab. Constr. Build. Mater. 2023, 400, 132371. [Google Scholar] [CrossRef]
- Xie, S. Experimental research on basic mechanical performance of engineered cementitious composites in Urumqi area. Master's Thesis, Xinjiang University, 2017. [Google Scholar]
- Teng, F.; Ye, J.; Yu, J.; Li, H.; Weng, Y.; Mechtcherine, V. Development of strain-hardening cementitious composites (SHCC) as bonding materials to enhance interlayer and flexural performance of 3D printed concrete. Cem. Concr. Compos. 2024, 152, 105657. [Google Scholar] [CrossRef]
- Wei, J.; Wu, C.; Chen, Y.; Leung, C.K.Y. Shear strengthening of reinforced concrete beams with high strength strain-hardening cementitious composites (HS-SHCC). Mater. Struct. 2020, 53, 102. [Google Scholar] [CrossRef]
- Wu, M. Study on mechanical properties of hybrid fiber-reinforced cementitious composites. Master's Thesis, Shanghai University of Engineering Science, 2020. [Google Scholar]
- Wu, J.-D.; Guo, L.-P.; Qin, Y.-Y. Preparation and characterization of ultra-high-strength and ultra-high-ductility cementitious composites incorporating waste clay brick powder. J. Clean. Prod. 2021, 312, 127813. [Google Scholar] [CrossRef]
- Xia, C. Study on dynamic properties of high-strength and high-ductility cementitious composites (HSHDCC). Master's Thesis, Jiangnan University, 2021. [Google Scholar]
- Zafar, M.S.; Bakshi, A.; Hojati, M. Toward 3D-printable engineered cementitious composites: Mix design proportioning, flowability, and mechanical performance. In Tran-SET; 2022; Volume 2022, pp. 102–114. [Google Scholar] [CrossRef]
- Zhang, Z.; Yang, F.; Liu, J.-C.; Wang, S. Eco-friendly high strength, high ductility engineered cementitious composites (ECC) with substitution of fly ash by rice husk ash. Cem. Concr. Res. 2020, 137, 106200. [Google Scholar] [CrossRef]
- Zhang, Q.; Xiao, J.; Zhang, K.; Duan, Z. Mechanical behavior of seawater sea-sand recycled concrete columns confined by engineered cementitious composite under eccentric compression. J. Build. Eng. 2022, 45, 103497. [Google Scholar] [CrossRef]
- Zhang, D.; Tu, H.; Li, Y.; Weng, Y. Effect of fiber content and fiber length on the dynamic compressive properties of strain-hardening ultra-high performance concrete. Constr. Build. Mater. 2022, 328, 127024. [Google Scholar] [CrossRef]
- Zhang, Z.; Li, Z.; He, J.; Shi, X. High-strength engineered cementitious composites with nanosilica incorporated: Mechanical performance and autogenous self-healing behavior. Cem. Concr. Compos. 2023, 135, 104837. [Google Scholar] [CrossRef]
- Zheng, Y.; Chen, Z.; Zhang, J.; Zhang, Y. Tensile properties and deterioration mechanism of PE-ECC after composite salt freeze-thaw cycles. Compos. Mater. Sci. Eng. 2024, 10, 32–39. [Google Scholar]
- Zhou, Y.; Xi, B.; Sui, L.; Zheng, S.; Xing, F.; Li, L. Development of high strain-hardening lightweight engineered cementitious composites: Design and performance. Cem. Concr. Compos. 2019, 104, 103370. [Google Scholar] [CrossRef]
- Lei, Z. Study on strain-hardening behavior of ultra-high-performance concrete based on fiber surface modification. Master's Thesis, Beijing Jiaotong University, 2020. [Google Scholar]
- Li, Y. Experimental study on preparation and properties of high-ductility fiber-reinforced engineered cementitious composites. Master's Thesis, Lanzhou Jiaotong University, 2023. [Google Scholar]
- Yu, J.; Jiang, F.; Xing, Q.; Yang, Q.; Li, M. Mechanical and self-healing performances of crumb rubber modified high-strength engineered cementitious composites. Front. Mater. 2021, 8, 811110. [Google Scholar] [CrossRef]
- Xu, N.; Qian, Y.; Yu, J.; Leung, C.K.Y. Tensile performance of 3D-printed Strain-Hardening Cementitious Composites (SHCC) considering material parameters, nozzle size and printing pattern. Cem. Concr. Compos. 2022, 132, 104601. [Google Scholar] [CrossRef]
- Yan, W. Study on basic mechanical properties of ECC with recycled composite powder. Master's Thesis, Zhengzhou University, 2022. [Google Scholar]
- Ye, J.; Teng, F.; Yu, J.; Yu, S.; Du, H.; Zhang, D.; Ruan, S.; Weng, Y. Development of 3D printable engineered cementitious composites with incineration bottom ash (IBA) for sustainable and digital construction. J. Clean. Prod. 2023, 422, 138639. [Google Scholar] [CrossRef]
- Sui, L.; Zhong, Q.; Yu, K.; Xing, F.; Li, P.; Zhou, Y. Flexural Fatigue Properties of Ultra-High Performance Engineered Cementitious Composites (UHP-ECC) Reinforced by Polymer Fibers. Polymers 2018, 10, 892. [Google Scholar] [CrossRef] [PubMed]
- Du, G.; Sun, Y.; Qian, Y. Flexural performance of nature-inspired 3D-printed strain-hardening cementitious composites (3DP-SHCC) with Bouligand structures. Cem. Concr. Compos. 2024, 149, 105494. [Google Scholar] [CrossRef]
- Ding, Y.; Ou, X.; Qi, H.; Xiong, G.; Nishiwaki, T.; Liu, Y.; Liu, J. Interlayer bonding performance of 3D printed engineered cementitious composites (ECC): Rheological regulation and fiber hybridization. Cem. Concr. Compos. 2024, 154, 105805. [Google Scholar] [CrossRef]
- Guan, X.; Li, Y.; Liu, T.; Zhang, C.; Li, H.; Ou, J. An economical ultra-high ductile engineered cementitious composite with large amount of coarse river sand. Constr. Build. Mater. 2019, 201, 461–472. [Google Scholar] [CrossRef]
- Fan, W.; Zhuge, Y.; Ma, X.; Chow, C.W.K.; Gorjian, N. Strain hardening behaviour of PE fibre reinforced calcium aluminate cement (CAC) - Ground granulated blast furnace (GGBFS) blended mortar. Constr. Build. Mater. 2020, 241, 118100. [Google Scholar] [CrossRef]
- Hu, W.; Zhang, D.; Ftwi, E.; Ellis, B.R.; Li, V.C. Development of sustainable low carbon Engineered Cementitious Composites with waste polyethylene fiber, sisal fiber and carbonation curing. Resour. Conserv. Recycl. 2023, 197, 107096. [Google Scholar] [CrossRef]
- Huang, B.-T.; Wu, J.-Q.; Yu, J.; Dai, J.-G.; Leung, C.K.Y.; Li, V.C. Seawater sea-sand engineered/strain-hardening cementitious composites (ECC/SHCC): Assessment and modeling of crack characteristics. Cem. Concr. Res. 2021, 140, 106292. [Google Scholar] [CrossRef]
- Curosu, I.; Liebscher, M.; Mechtcherine, V.; Bellmann, C.; Michel, S. Tensile behavior of high-strength strain-hardening cement-based composites (HS-SHCC) made with high-performance polyethylene, aramid and PBO fibers. Cem. Concr. Res. 2017, 98, 71–81. [Google Scholar] [CrossRef]
- Choi, J.-I.; Park, S.-E.; Kim, Y.; Yang, K.; Kim, Y.Y.; Lee, B.Y. Highly ductile behavior and sustainability of engineered cementitious composites reinforced by PE based selvage fibers. Cem. Concr. Compos. 2022, 134, 104729. [Google Scholar] [CrossRef]
- Cheng, H.; Sun, H.; Zhang, Z.; Wang, J.; Zhang, X.; Du, P. Effect of modified PE fiber grafted with nano-SiO2 on the tensile properties of high-strength engineering cementitious composites. Constr. Build. Mater. 2024, 420, 135618. [Google Scholar] [CrossRef]
- Tan, Y.; Zhao, B.; Xiao, H.; Long, X.; Wan, X. Effect of capillary crystalline waterproofing agent on mechanical and self-healing properties of PE-ECC. Yangtze River 2023, 54, 206–215. [Google Scholar]
- Cai, M.; Zhu, H.; Rabczuk, T.; Zhuang, X. Investigation of mixing techniques for full-strength-grade engineered cementitious composites (ECCs): Mechanical properties and microstructure. J. Build. Eng. 2024, 95, 110136. [Google Scholar] [CrossRef]
- Cai, M.; Zhu, H.; Rabczuk, T.; Zhuang, X. Comparative analysis of spinning techniques on the performance of full-strength-grade engineered cementitious composites: Mechanical characteristics, pore structure, fiber distribution, micromorphology. J. Build. Eng. 2024, 97, 110793. [Google Scholar] [CrossRef]
- Cai, M.; Zhu, H.; Wan, Y.; Zhu, H.; Zhuang, X. Development and mechanical properties of green ultra-high-toughness fiber concrete. J. Tongji Univ. Nat. Sci. 2024, 52, 1000–1009. [Google Scholar]
- Chen, Y.; Yu, J.; Leung, C.K.Y. Use of high strength Strain-Hardening Cementitious Composites for flexural repair of concrete structures with significant steel corrosion. Constr. Build. Mater. 2018, 167, 325–337. [Google Scholar] [CrossRef]
- Lu, C.; Yuan, Z.; Yang, C.; Hou, D.; Yao, Y. Tensile properties of PVA and PE fiber reinforced engineered cementitious composites containing coarse silica sand. J. Build. Eng. 2023, 75, 106913. [Google Scholar] [CrossRef]
- Mao, W.-H.; Liu, J.-P.; Ding, Y. High-modulus and low-shrinkage hybrid-fiber reinforced engineered cementitious composites (ECC). Mater. Struct. 2022, 55, 87. [Google Scholar] [CrossRef]
- Nguyễn, H.H.; Choi, J.-I.; Park, S.-E.; Cha, S.L.; Huh, J.; Lee, B.Y. Autogenous healing of high strength engineered cementitious composites (ECC) using calcium-containing binders. Constr. Build. Mater. 2020, 265, 120857. [Google Scholar] [CrossRef]
- Ogura, H.; Nerella, V.N.; Mechtcherine, V. Developing and Testing of Strain-Hardening Cement-Based Composites (SHCC) in the Context of 3D-Printing. Materials 2018, 11, 1375. [Google Scholar] [CrossRef] [PubMed]
- Qiu, M.; Qian, Y.; Sun, Y.; Leung, C.K.Y. Flexural performance of concrete beams via 3D printing stay-in-place formwork followed by casting of normal concrete. J. Sustain. Cem.-Based Mater. 2025, 14, 417–430. [Google Scholar] [CrossRef]
- Shang, X.-Y.; Yu, J.-T.; Li, L.-Z.; Lu, Z.-D. Shear strengthening of fire damaged RC beams with stirrup reinforced engineered cementitious composites. Eng. Struct. 2020, 210, 110263. [Google Scholar] [CrossRef]
- Su, J.-Y.; Chen, G.; Pan, H.-S.; Lin, J.-X.; Zhang, J.; Zhuo, K.-X.; Chen, Z.-B.; Guo, Y.-C. Rubber modified high strength-high ductility concrete: Effect of rubber replacement ratio and fiber length. Constr. Build. Mater. 2023, 404, 133243. [Google Scholar] [CrossRef]
- Liu, D.; Yu, J.; Qin, F.; Zhang, K.; Zhang, Z. Mechanical performance of high-strength engineering cementitious composites (ECC) with hybriding PE and steel fibers. Case Stud. Constr. Mater. 2023, 18, e01961. [Google Scholar] [CrossRef]
- Lu, Z.; Yao, J.; Leung, C.K.Y. Using graphene oxide to strengthen the bond between PE fiber and matrix to improve the strain hardening behavior of SHCC. Cem. Concr. Res. 2019, 126, 105899. [Google Scholar] [CrossRef]
- Hussein, M.; Kunieda, M.; Nakamura, H. Strength and ductility of RC beams strengthened with steel-reinforced strain hardening cementitious composites. Cem. Concr. Compos. 2012, 34, 1061–1066. [Google Scholar] [CrossRef]
- Jiang, J.; Luo, J.; Yu, J.; Wang, Z. Performance Improvement of a Fiber-Reinforced Polymer Bar for a Reinforced Sea Sand and Seawater Concrete Beam in the Serviceability Limit State. Sensors 2019, 19, 654. [Google Scholar] [CrossRef] [PubMed]
- Kamal, A.; Kunieda, M.; Ueda, N.; Nakamura, H. Evaluation of crack opening performance of a repair material with strain hardening behavior. Cem. Concr. Compos. 2008, 30, 863–871. [Google Scholar] [CrossRef]
- Kim, M.-J.; Choi, H.-J.; Shin, W.; Oh, T.; Yoo, D.-Y. Development of impact resistant high-strength strain-hardening cementitious composites (HS-SHCC) superior to reactive powder concrete (RPC) under flexure. J. Build. Eng. 2021, 44, 102652. [Google Scholar] [CrossRef]
- Lei, D.-Y.; Guo, L.-P.; Li, Y.; Zheng, Z.; Liu, J.-P.; Li, S.-C.; Wang, P.-G.; Li, C.-C.; Mechtcherine, V.; Li, Z.-H.; Zeng, D.-Z.; Zhong, B.-M. The investigating on mechanical properties of ultra-high strength and ultra-high ductility cementitious composites (UHS-UHDCC). J. Build. Eng. 2021, 43, 102486. [Google Scholar] [CrossRef]
- Liu, T.; Bai, R.; Chen, Z.; Li, Y.; Yang, Y. Tailoring of polyethylene fiber surface by coating silane coupling agent for strain hardening cementitious composite. Constr. Build. Mater. 2021, 278, 122263. [Google Scholar] [CrossRef]
- Liang, L.; Yang, J.; Lv, G.; Lei, Z.; Li, X.; Liu, Q. Surface-Functionalized Nanocelluloses as Viscosity-Modifying Agents in Engineered Cementitious Composites. Front. Mater. 2021, 8, 783176. [Google Scholar] [CrossRef]
- Li, Y.; Li, J.; Yang, E.-H.; Guan, X. Mechanism study of crack propagation in river sand Engineered Cementitious Composites (ECC). Cem. Concr. Compos. 2022, 128, 104434. [Google Scholar] [CrossRef]
- Huo, Y.; Liu, T.; Lu, D.; Han, X.; Sun, H.; Huang, J.; Ye, X.; Zhang, C.; Chen, Z.; Yang, Y. Dynamic tensile properties of steel fiber reinforced polyethylene fiber-engineered/strain-hardening cementitious composites (PE-ECC/SHCC) at high strain rate. Cem. Concr. Compos. 2023, 143, 105234. [Google Scholar] [CrossRef]
- Xu, L.Y.; Huang, B.T.; Qian, L.P.; Dai, J.G. Enhancing long-term tensile performance of engineered cementitious composites (ECC) using sustainable artificial geopolymer aggregates. Cem. Concr. Compos. 2022, 133, 104676. [Google Scholar] [CrossRef]
- Yang, M.; Hu, D.; Xu, L.; Lin, R.; Li, W.; Zhang, G. Study on mix-ratio optimization of high-toughness cement-based composites. Urban Roads Bridg. Flood Control 2025, No. 1, 251–255. [Google Scholar]
- Gou, H.; Sofi, M.; Zhang, Z.; Zhu, M.; Zhu, H.; Mendis, P. Combined printable and mechanical analysis of 3D-printed green high-strength, lightweight engineered cementitious composites. Cem. Concr. Compos. 2024, 149, 105506. [Google Scholar] [CrossRef]
- Zhou, Y.; Zhong, Q.; Xing, F.; Sui, L.; Huang, Z.; Guo, M. Influence of cyclic loading on the tensile fracture characteristics of ultra-high performance engineered cementitious composites. Constr. Build. Mater. 2020, 240, 117937. [Google Scholar] [CrossRef]
- Liang, L.; Lu, X.; Ding, Y.; Yu, J.; Li, V.C.; Yu, K. High-modulus engineered cementitious composites: Design mechanism and performance characterization. Cem. Concr. Compos. 2024, 154, 105782. [Google Scholar] [CrossRef]
- Yu, K.; Ding, Y.; Zhang, Y.X. Size effects on tensile properties and compressive strength of engineered cementitious composites. Cem. Concr. Compos. 2020, 113, 103691. [Google Scholar] [CrossRef]
- Yan, L.; Zhao, J.; Wang, Z.; Liang, F.; Li, Q.; Chen, H.; Feng, G.; Wu, C.; Wang, Y.; Hou, P. Tensile-enhanced design and microstructural mechanism of engineered cementitious composites with ultrafine supplementary cementitious materials. Constr. Build. Mater. 2026, 515, 145683. [Google Scholar] [CrossRef]
- Wang, Y.; Liu, F.; Yu, J.; Dong, F.; Ye, J. Effect of polyethylene fiber content on physical and mechanical properties of engineered cementitious composites. Constr. Build. Mater. 2020, 251, 118917. [Google Scholar] [CrossRef]
- Yu, K.; Lin, M.; Tian, L.; Ding, Y. Long-term stable and sustainable high-strength engineered cementitious composite incorporating limestone powder. Structures 2023, 47, 530–543. [Google Scholar] [CrossRef]
- Ding, Y.; Yu, K.; Mao, W. Compressive performance of all-grade engineered cementitious composites: Experiment and theoretical model. Constr. Build. Mater. 2020, 244, 118357. [Google Scholar] [CrossRef]
- Yu, K.-Q.; Dai, J.-G.; Lu, Z.-D.; Poon, C.-S. Rate-dependent tensile properties of ultra-high performance engineered cementitious composites (UHP-ECC). Cem. Concr. Compos. 2018, 93, 218–234. [Google Scholar] [CrossRef]
- Liao, Q.; Yu, J.; Dong, F.; Su, Y.; Yu, K. FRP bars reinforced seawater sea-sand engineered cementitious composites beams with various salinities: Shear behaviors and cost effectiveness. J. Build. Eng. 2024, 83, 108452. [Google Scholar] [CrossRef]
- Chen, B.; Hou, L.; Yan, R.-G.; Zhang, X.-Y.; Meng, H.; Li, J.-T. Flexural Performance and Flexural Toughness Evaluation Method of High-Strength Engineered Cementitious Composites. Buildings 2025, 15, 4003. [Google Scholar] [CrossRef]
- Wang, T.; Deng, Z. Hybrid fiber-reinforced strain hardening cementitious composites: experimental and theoretical studies. J. Chin. Inst. Eng. 2025, 49, 563–578. [Google Scholar] [CrossRef]
- Nguyễn, P.H.; Park, S.-E.; Nguyễn, H.H.; Kim, Y.; Lee, B.Y. Influential factor analysis of slag-based engineered cementitious composites using Taguchi robust method. J. Struct. Integr. Maint. 2024, 9, 2317529. [Google Scholar] [CrossRef]
- Deng, Z.; Li, W. High-Performance Cementitious Composites with Tensile Strain Capacity Up to 18%. J. Compos. Sci. 2025, 9, 502. [Google Scholar] [CrossRef]
- Bai, M.; Xiao, J.; Gao, Y.; Ding, T. Pore structure characteristics and mechanical property of engineered cementitious composites (ECC) incorporating recycled sand. Constr. Build. Mater. 2023, 408, 133721. [Google Scholar] [CrossRef]
- Zhang, Y.; Wan, Y.; Zhu, D.; Wu, J.; Huang, B.; Yang, R. Quasi-static test on RC slab-column joints locally strengthened with high-strength and high-ductility PE-ECC. China Civ. Eng. J. 2025, 58, 14–26. Available online: https://manu36.magtech.com.cn/Jwk_tmgcxb/CN/abstract/abstract1971.shtml (accessed on 20 July 2026).
- Zhao, Q.; Yang, Z.; Zhang, X.; Xia, Z.; Xiong, K.; Yan, J. An Experimental Study on the Mechanical Properties and ANN-Based Prediction of a Tensile Constitutive Model of ECCs. Polymers 2025, 17, 3183. [Google Scholar] [CrossRef] [PubMed]
- Kim, M.-J.; Chun, B.; Choi, H.-J.; Shin, W.; Yoo, D.-Y. Effects of Supplementary Cementitious Materials and Curing Condition on Mechanical Properties of Ultra-High-Performance, Strain-Hardening Cementitious Composites. Appl. Sci. 2021, 11, 2394. [Google Scholar] [CrossRef]
- Zhou, Y.; Xi, B.; Yu, K.; Sui, L.; Xing, F. Mechanical Properties of Hybrid Ultra-High Performance Engineered Cementitous Composites Incorporating Steel and Polyethylene Fibers. Materials 2018, 11, 1448. [Google Scholar] [CrossRef] [PubMed]
- Arce, G.A.; Hassan, M.M.; Game, D.E. Development of novel ultra-high performance engineered cementitious composites (UHP-ECC) for durable and resilient transportation infrastructure. Tran-SET Project 20CLSU08, Transportation Consortium of South-Central States, Louisiana State University, 2021. Available online: https://repository.lsu.edu/transet_pubs/101 (accessed on 20 July 2026).
- Huang, B.-T.; Wu, J.-Q.; Yu, J.; Dai, J.-G.; Leung, C.K.Y. High-strength seawater sea-sand Engineered Cementitious Composites (SS-ECC): Mechanical performance and probabilistic modeling. Cem. Concr. Compos. 2020, 114, 103740. [Google Scholar] [CrossRef]
- Bai, M.; Wu, Y.; Xiao, J.; Ding, T.; Yu, K. Workability and hardened properties of 3D printed engineered cementitious composites incorporating recycled sand and PE fibers. J. Build. Eng. 2023, 71, 106477. [Google Scholar] [CrossRef]
- Zhang, C.; Lu, R.; Li, Y.; Guan, X. Effect of crystalline admixtures on mechanical, self-healing and transport properties of engineered cementitious composite. Cem. Concr. Compos. 2021, 124, 104256. [Google Scholar] [CrossRef]
- Zhao, X.; Cai, L.; Ji, X.; Zeng, W.; Liu, J. Mechanical Properties of Polyethylene Fiber Reinforced Ultra High Performance Concrete (UHPC). Materials 2022, 15, 8734. [Google Scholar] [CrossRef] [PubMed]
- Said, S.H.; Razak, H.A. The effect of synthetic polyethylene fiber on the strain hardening behavior of engineered cementitious composite (ECC). Mater. Des. 2015, 86, 447–457. [Google Scholar] [CrossRef]
- Zhu, M.; Zhang, M.; Meng, X.; Chen, B.; Lang, L. A study on the mechanical properties of eco-friendly low-cost polyethylene fiber-reinforced engineered cementitious composites. J. Build. Eng. 2025, 102, 112017. [Google Scholar] [CrossRef]
- Wu, J.-D.; Guo, L.-P.; Chen, B.; Lyu, B.-C.; Fei, X.-P.; Bian, R.-S. Effect of PE fiber coated by polydopamine and nano-SiO2 on the strain hardening behavior of ultra-high-strength and high-ductility cementitious composites. Cem. Concr. Compos. 2023, 136, 104852. [Google Scholar] [CrossRef]
- Qiao, S.H. Study on mechanical properties and durability of engineered cementitious composites. Master's Thesis, Taiyuan University of Technology, 2023. [Google Scholar]
- Xie, L.; Sun, X.; Yu, Z.; Zhang, Z.; Xu, X.; Yu, K. Multiaxial shear performance of coarse-aggregate ECC: Damage evolution and interfacial characteristics. Cem. Concr. Compos. 2025, 164, 106280. [Google Scholar] [CrossRef]
- Friedman, J.H. Greedy function approximation: A gradient boosting machine. Ann. Stat. 2001, 29, 1189–1232. [Google Scholar] [CrossRef]
- Chen, T.; Guestrin, C. XGBoost: A scalable tree boosting system. In Proceedings of the 22nd ACM SIGKDD International Conference on Knowledge Discovery and Data Mining, San Francisco, CA, USA, 13-17 August 2016; pp. 785–794. [Google Scholar] [CrossRef]
- Ke, G.; Meng, Q.; Finley, T.; Wang, T.; Chen, W.; Ma, W.; Ye, Q.; Liu, T.-Y. LightGBM: A highly efficient gradient boosting decision tree. Adv. Neural Inf. Process. Syst. 2017, 30, 3146–3154. [Google Scholar]
- Prokhorenkova, L.; Gusev, G.; Vorobev, A.; Dorogush, A.V.; Gulin, A. CatBoost: Unbiased boosting with categorical features. Adv. Neural Inf. Process. Syst. 2018, 31, 6638–6648. [Google Scholar]
- Kim, J.-K.; Kim, J.-S.; Ha, G.J.; Kim, Y.Y. Tensile and fiber dispersion performance of ECC (engineered cementitious composites) produced with ground granulated blast furnace slag. Cem. Concr. Res. 2007, 37, 1096–1105. [Google Scholar] [CrossRef]
- Zhou, J.; Qian, S.; Sierra Beltran, M.G.; Ye, G.; van Breugel, K.; Li, V.C. Development of engineered cementitious composites with limestone powder and blast furnace slag. Mater. Struct. 2010, 43, 803–814. [Google Scholar] [CrossRef]
Figure 1.
Workflow for PE-ECC property prediction, interpretation and mixture screening.
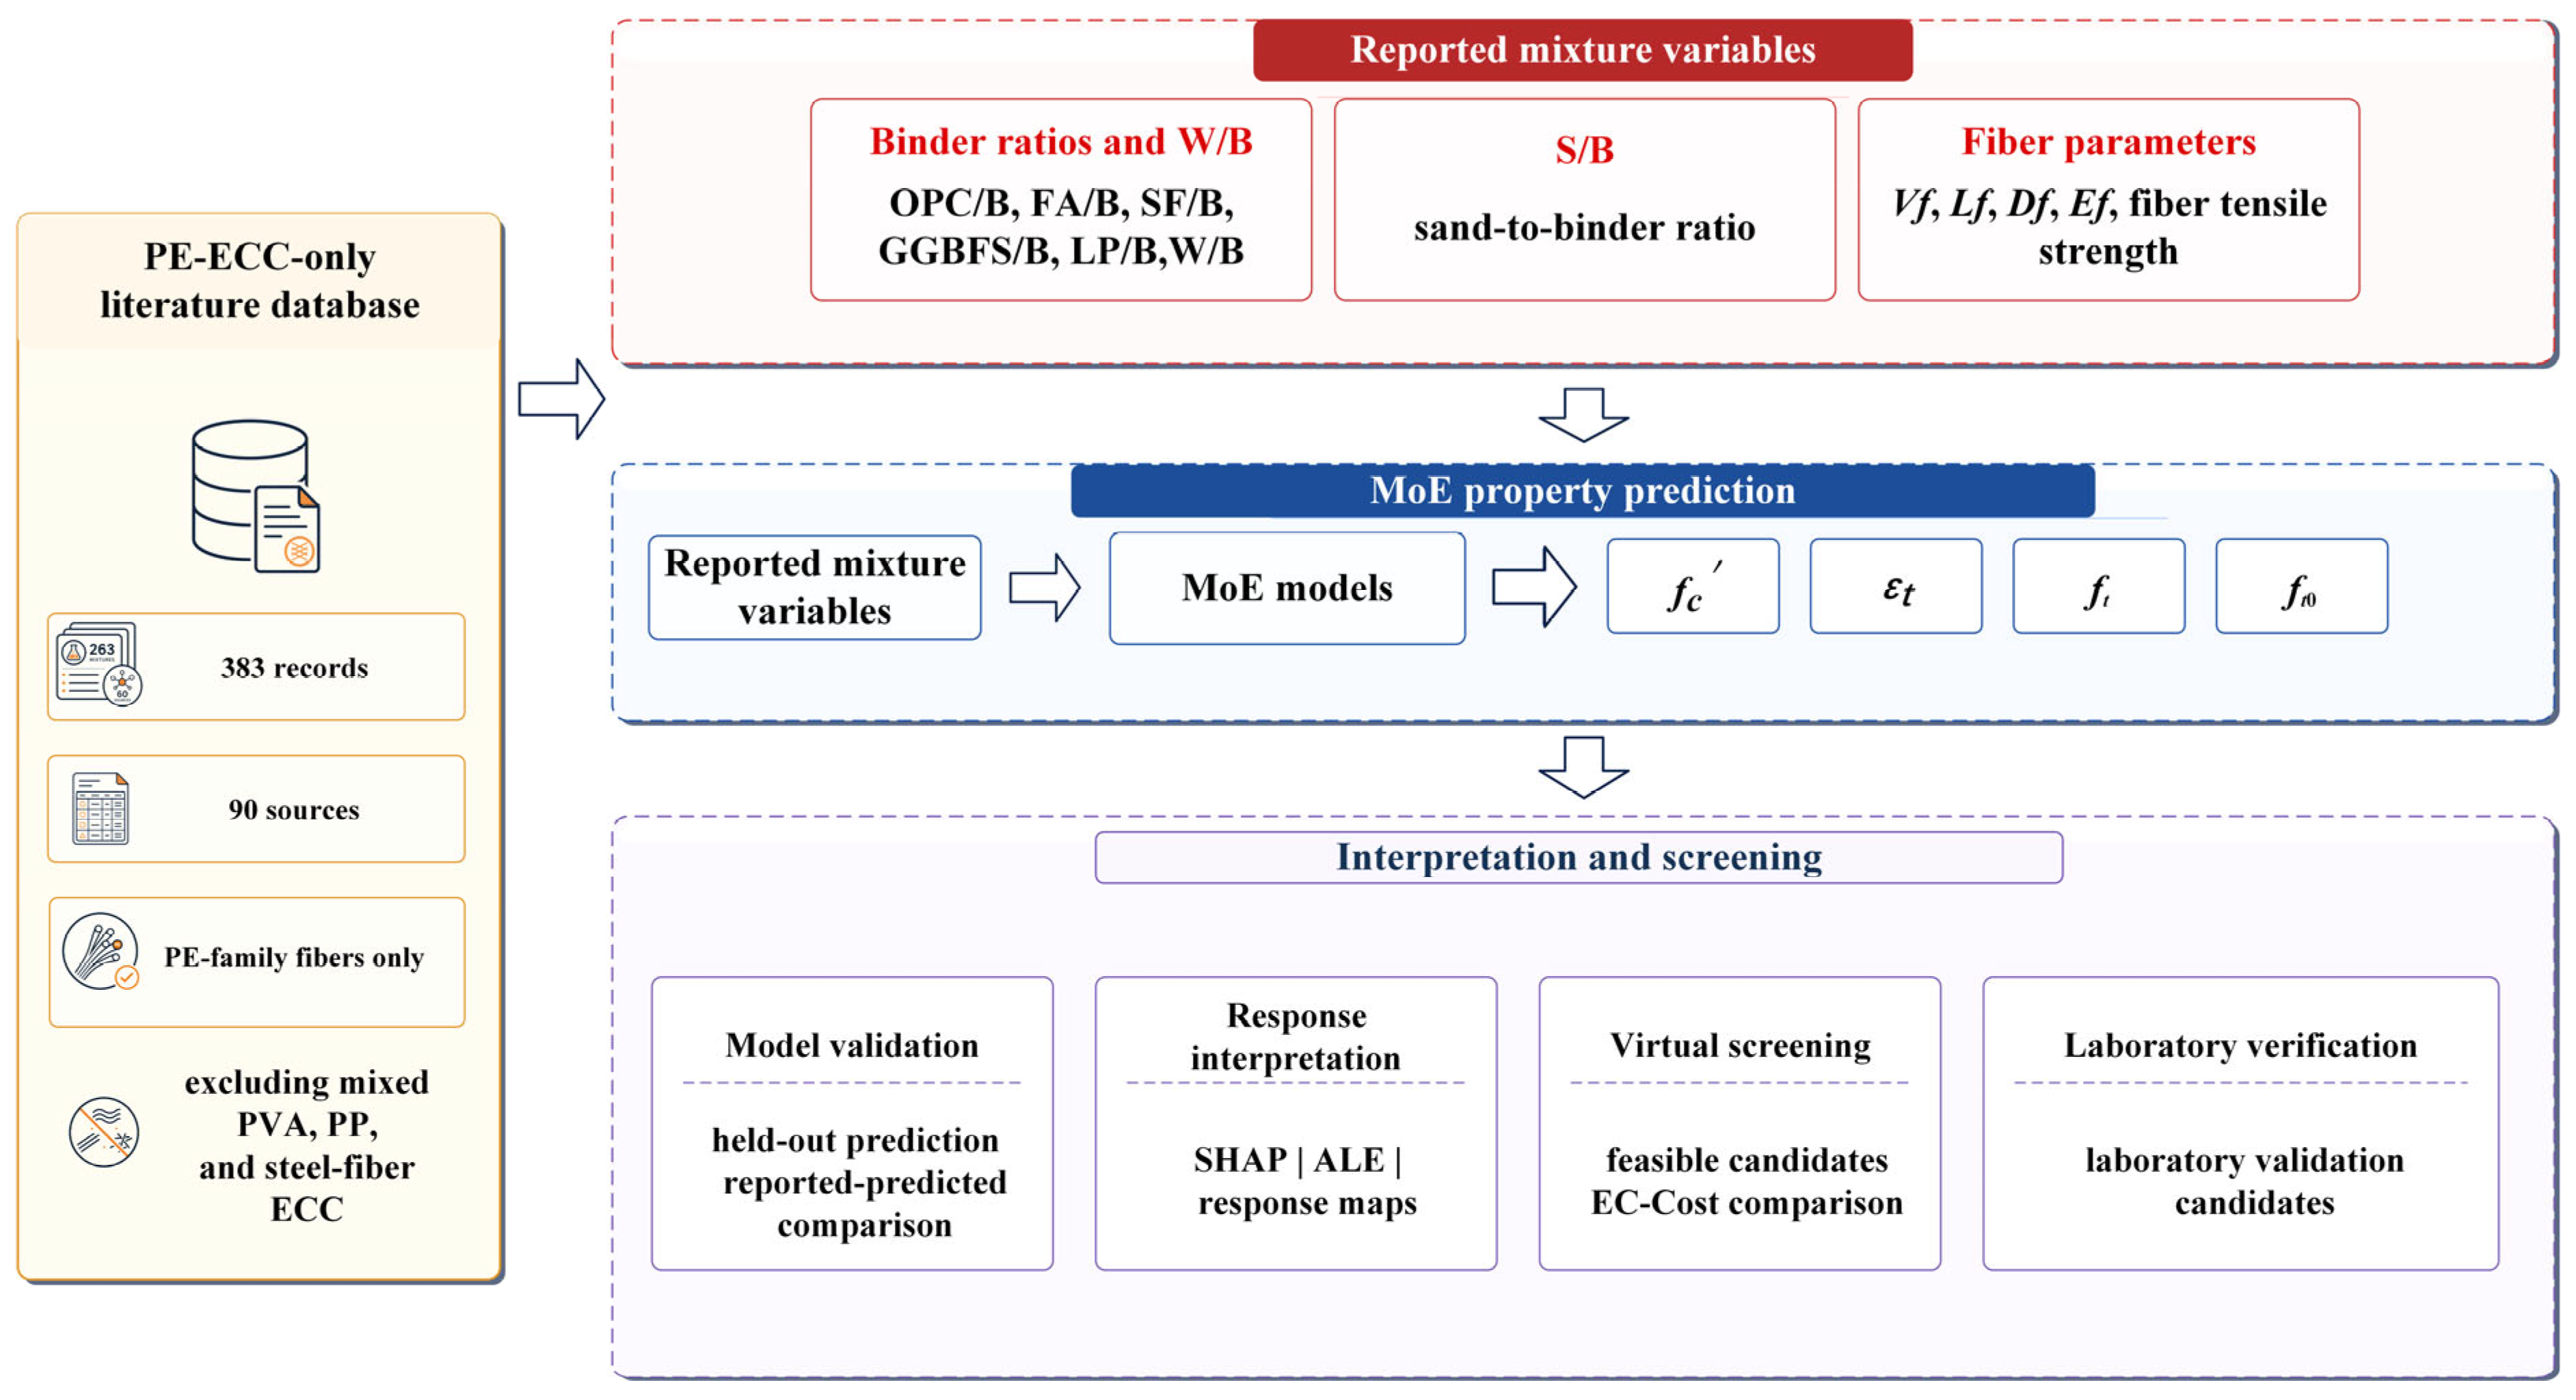
Figure 2.
Distribution of reported mixture and fiber variables in the PE-ECC database: (a) OPC/B; (b) FA/B; (c) SF/B; (d) GGBFS/B; (e) LP/B; (f) W/B; (g) S/B; (h) Vf; (i) Lf; (j) Df; (k) Ef; (l) fiber strength; (m) fc′; (n) εt; (o) ft; (p) ft0.
Figure 2.
Distribution of reported mixture and fiber variables in the PE-ECC database: (a) OPC/B; (b) FA/B; (c) SF/B; (d) GGBFS/B; (e) LP/B; (f) W/B; (g) S/B; (h) Vf; (i) Lf; (j) Df; (k) Ef; (l) fiber strength; (m) fc′; (n) εt; (o) ft; (p) ft0.
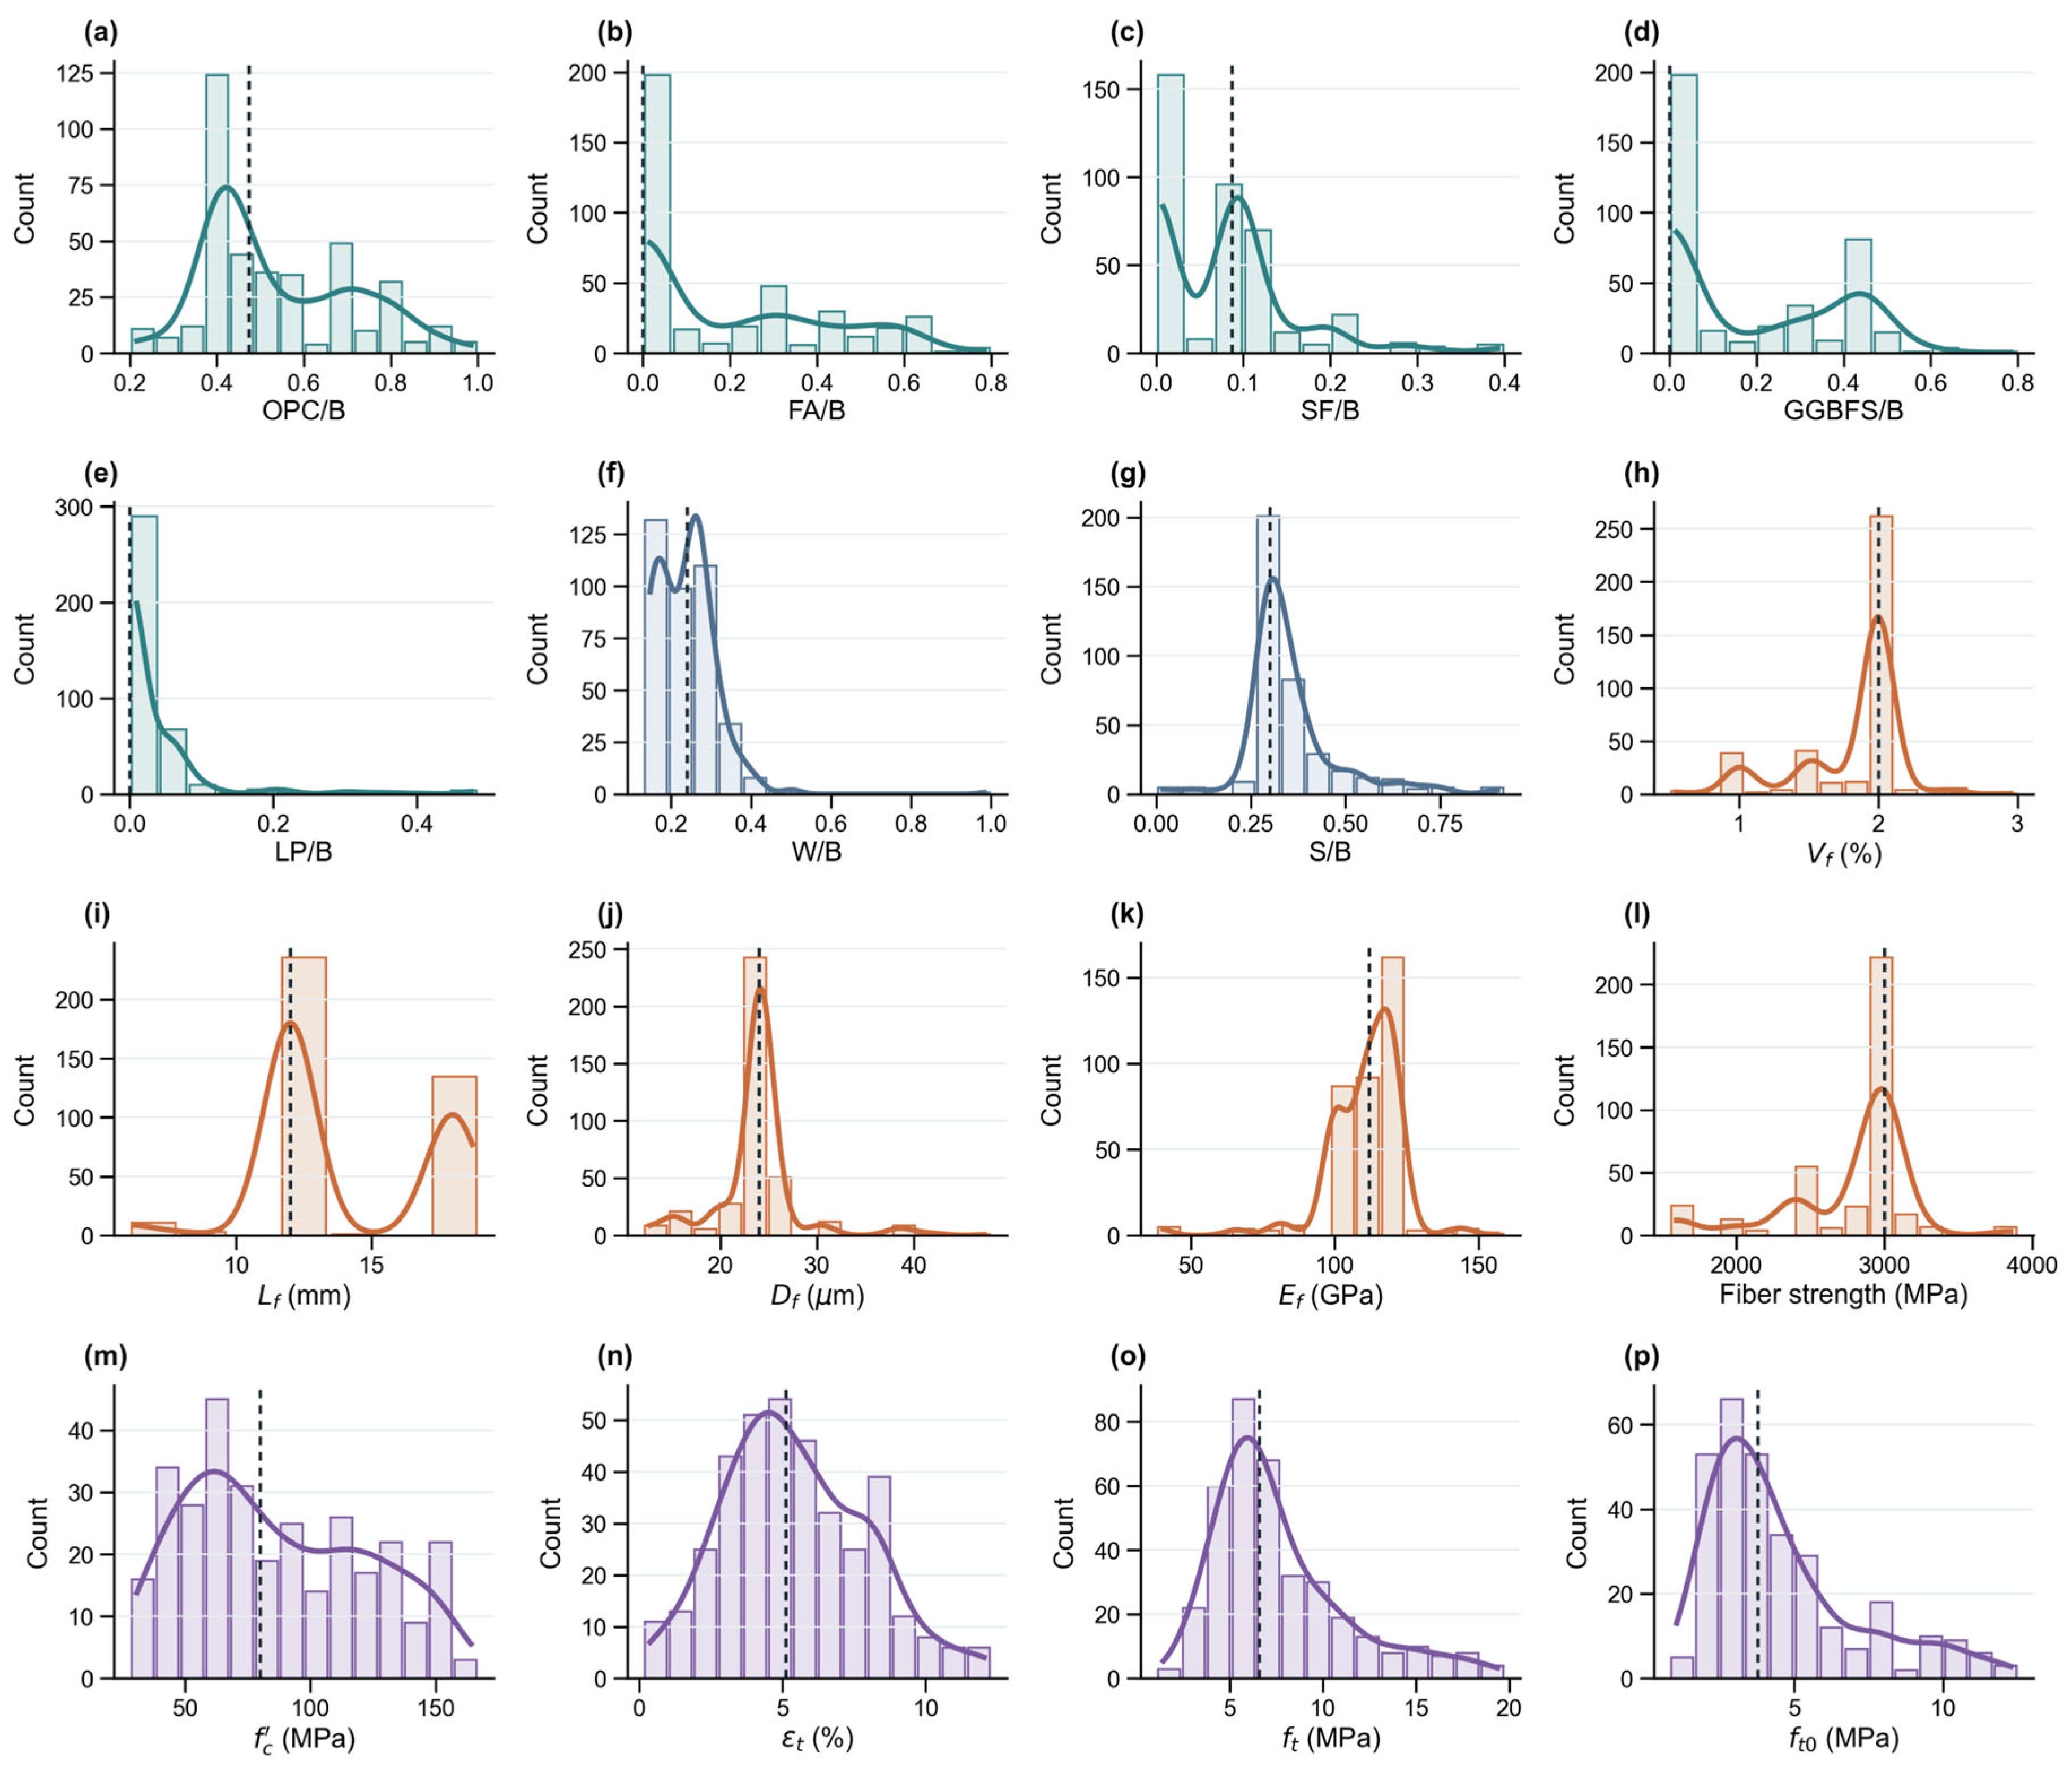
Figure 3.
Architecture of the MoE stacking model for predicting the four PE-ECC properties.
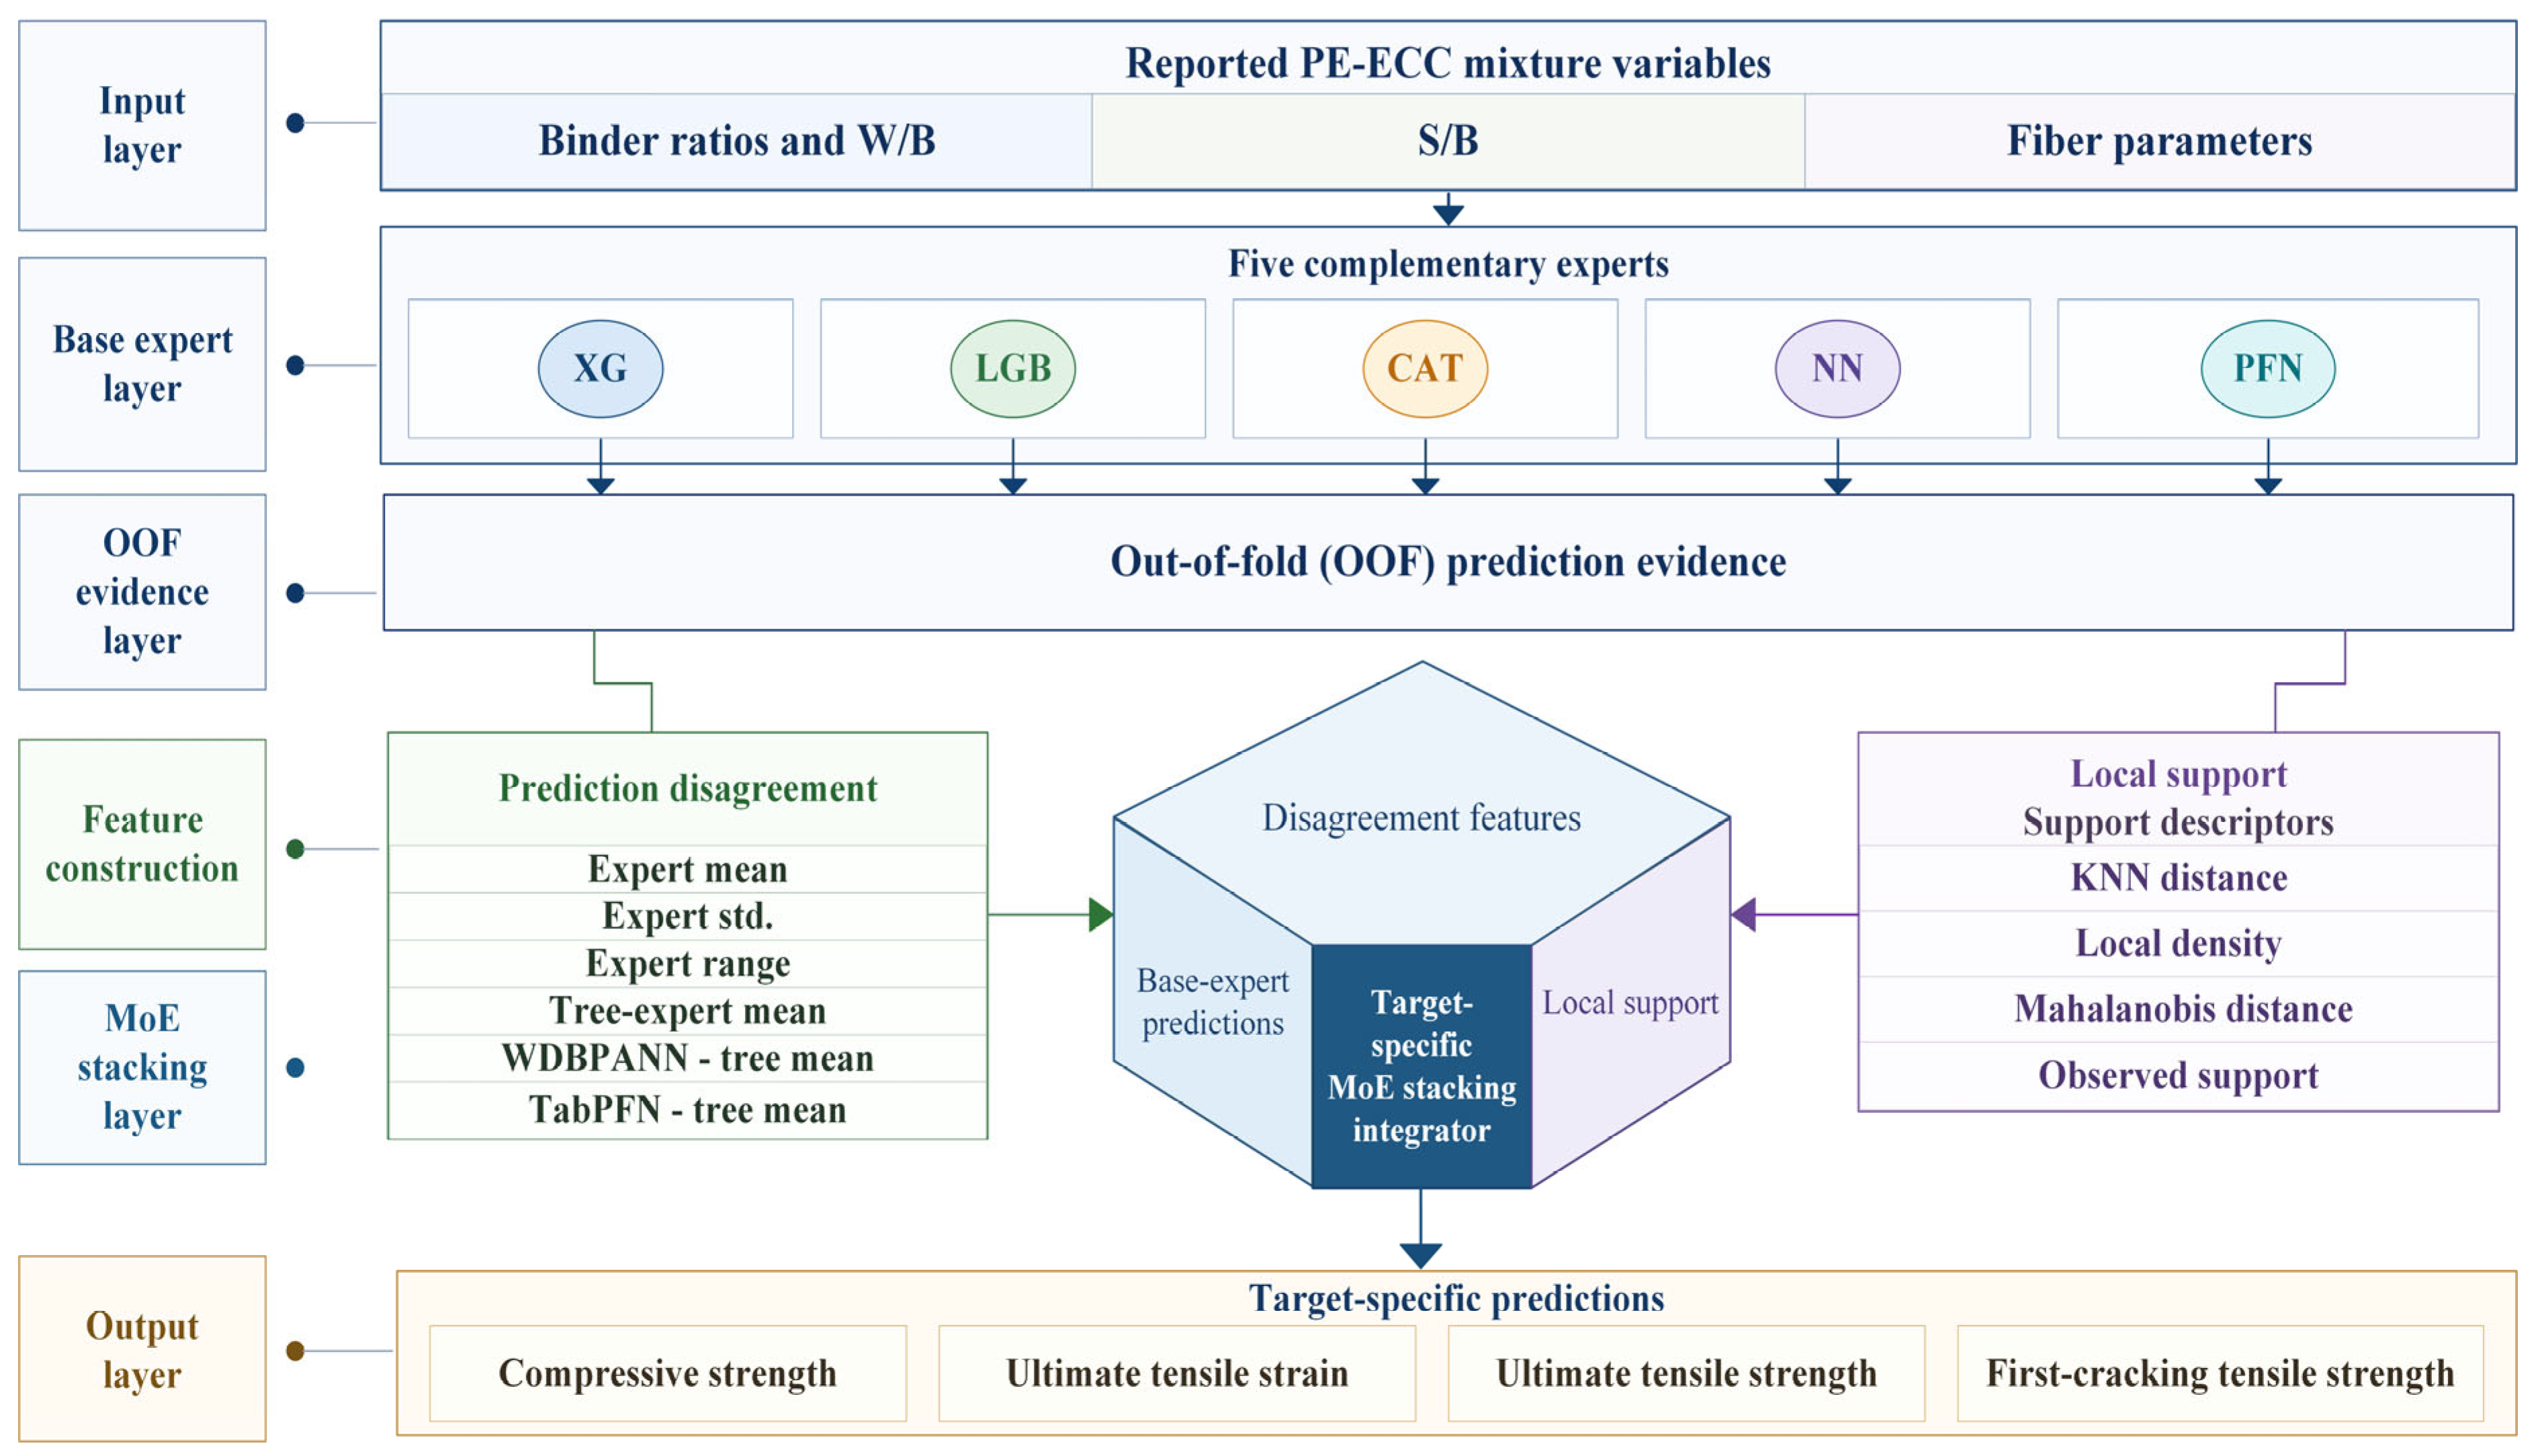
Figure 4.
Prediction performance of the MoE model and the two reference models.
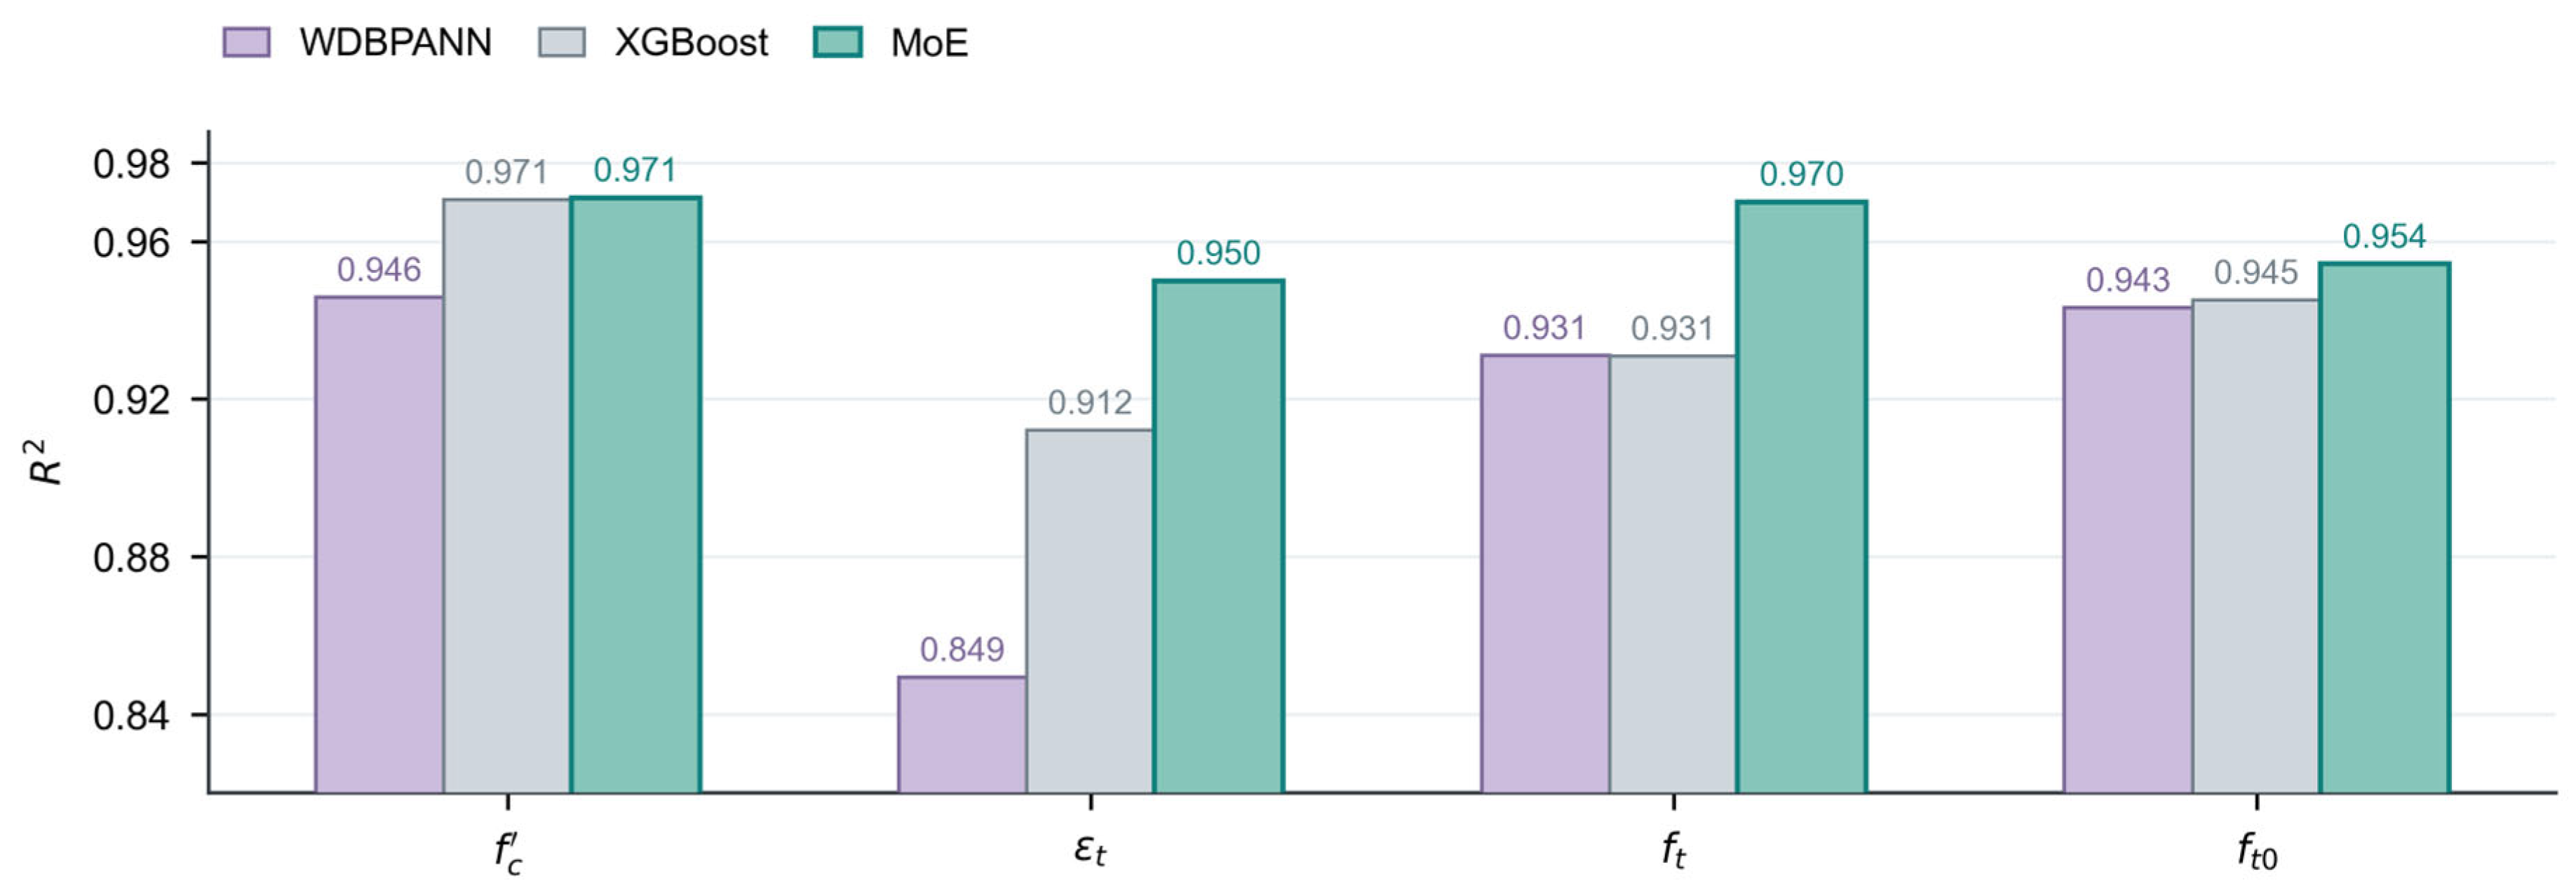
Figure 5.
Reported and predicted values for the four properties: (a) fc′; (b) εt; (c) ft; (d) ft0.
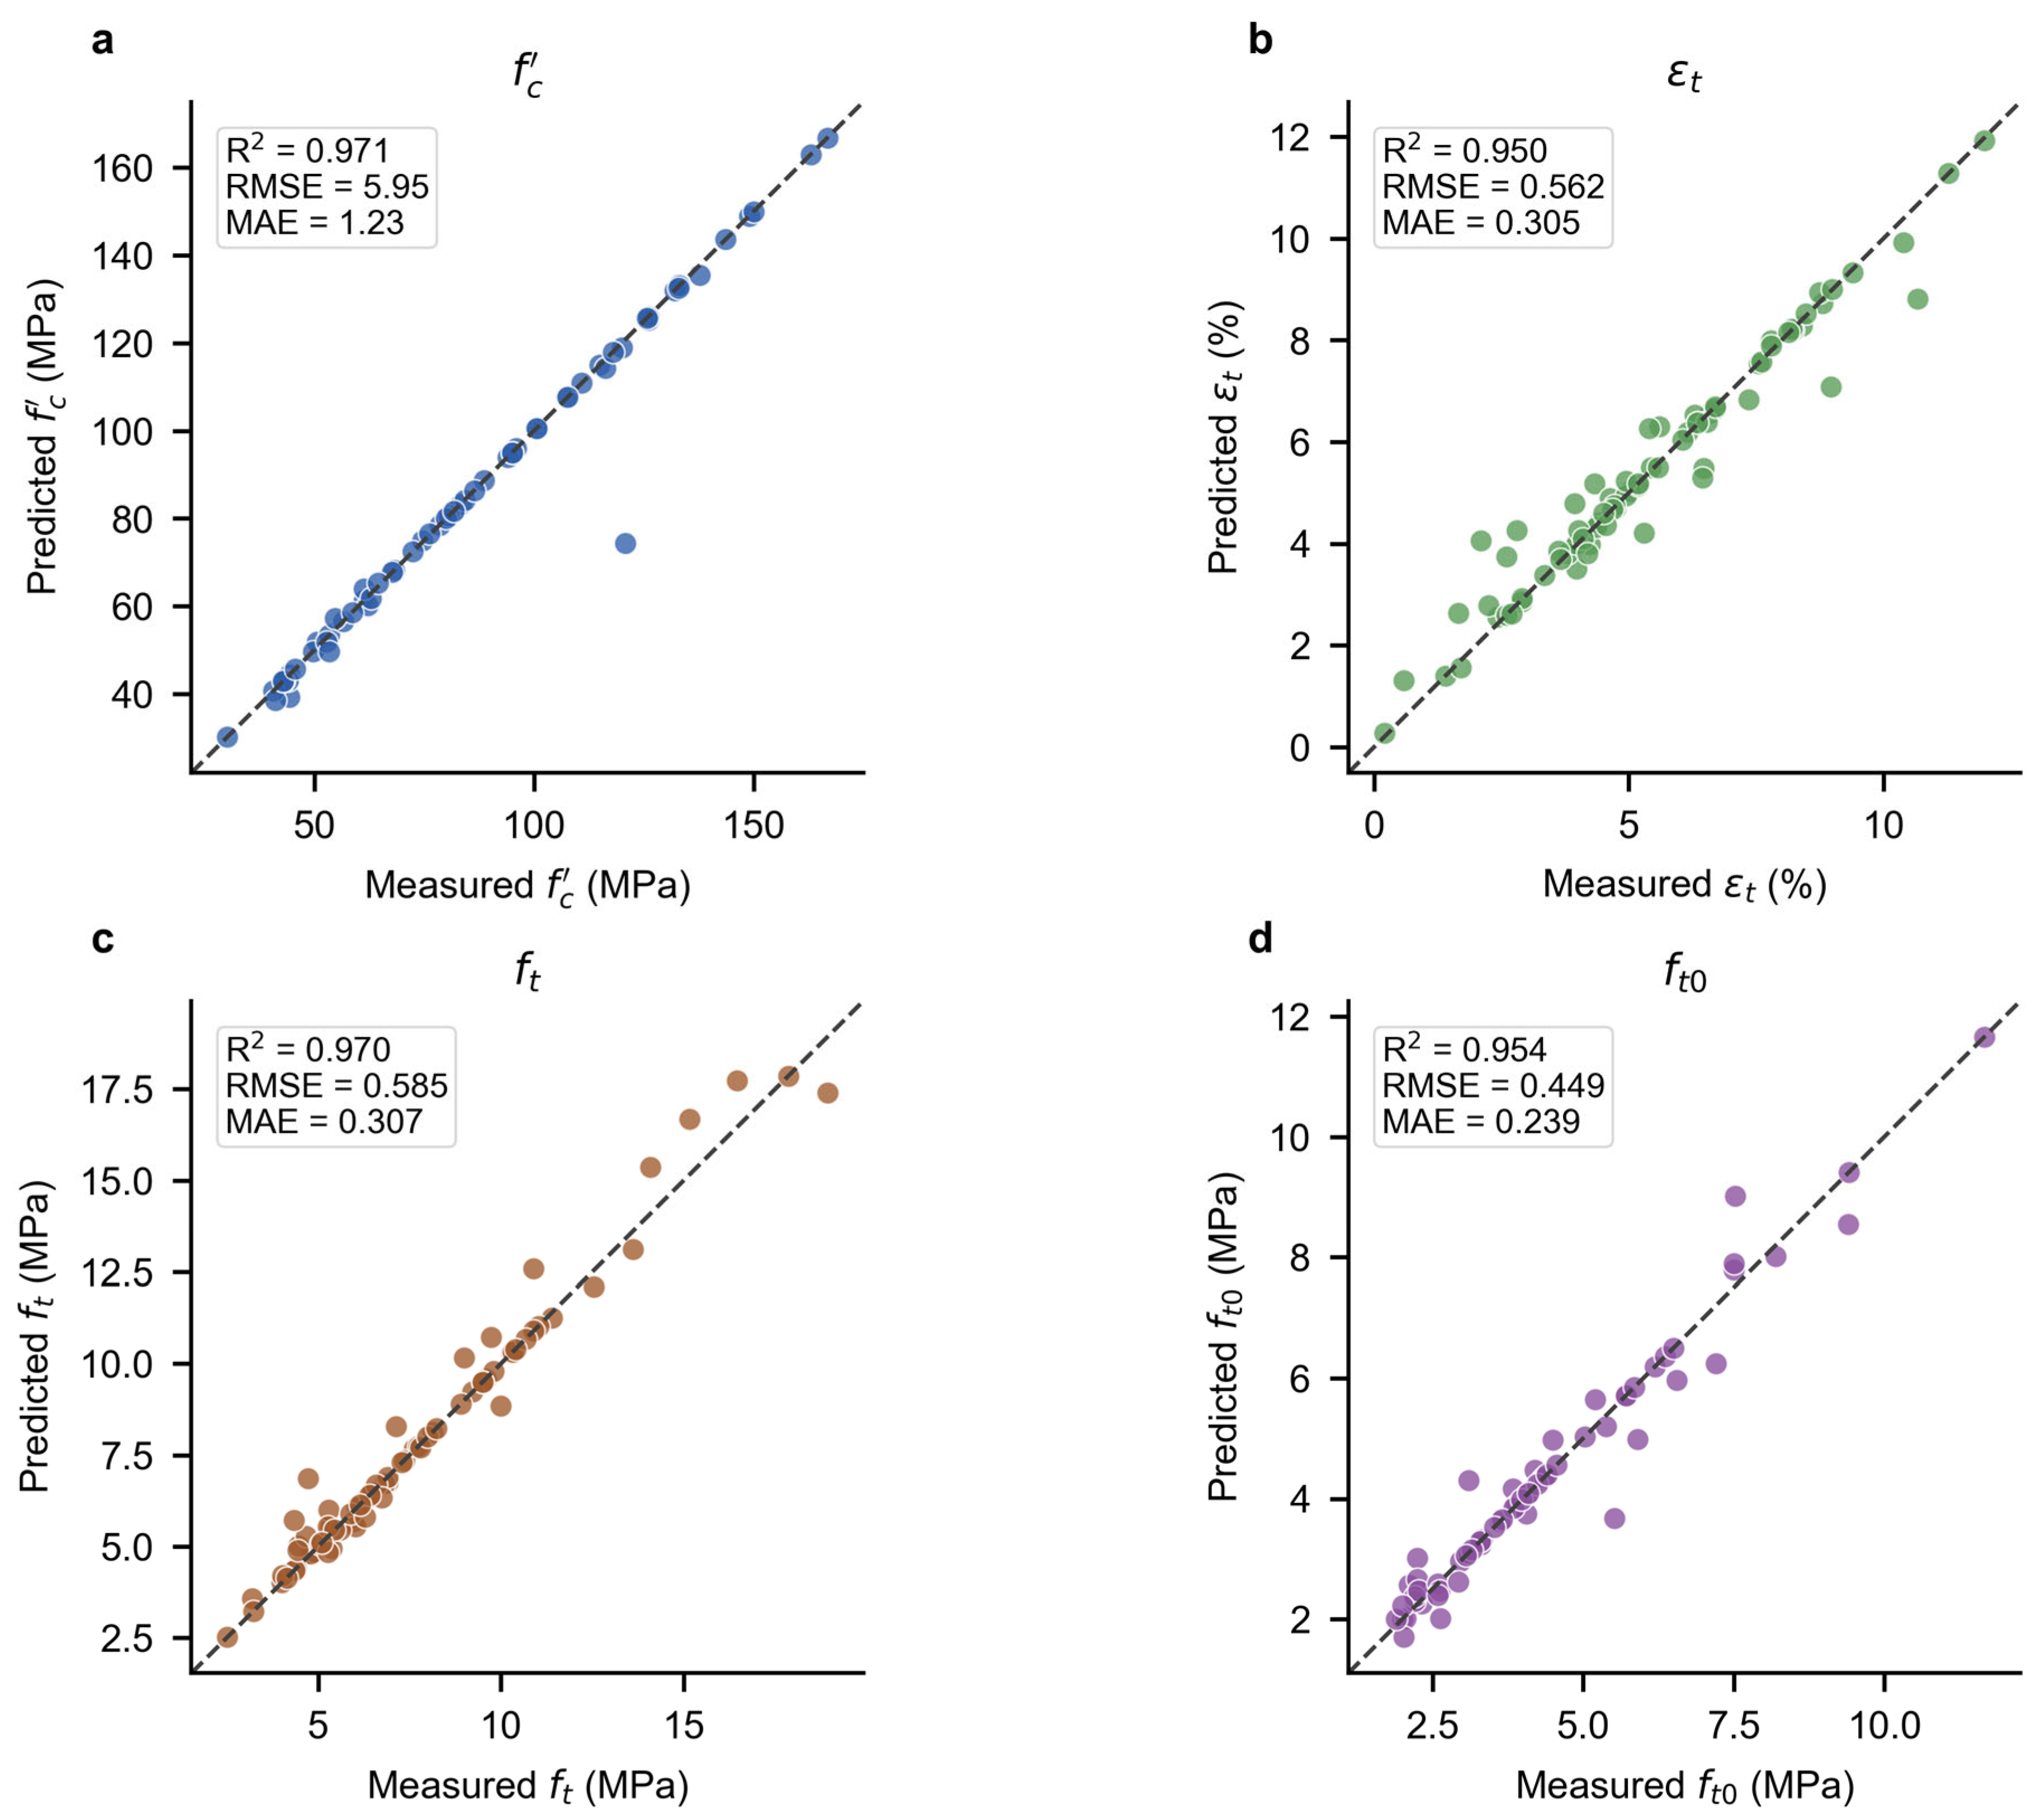
Figure 6.
SHAP analysis of the reported mixture variables: (a) mean absolute SHAP values normalized within each property; (b) Spearman correlation between variable values and SHAP values.
Figure 6.
SHAP analysis of the reported mixture variables: (a) mean absolute SHAP values normalized within each property; (b) Spearman correlation between variable values and SHAP values.
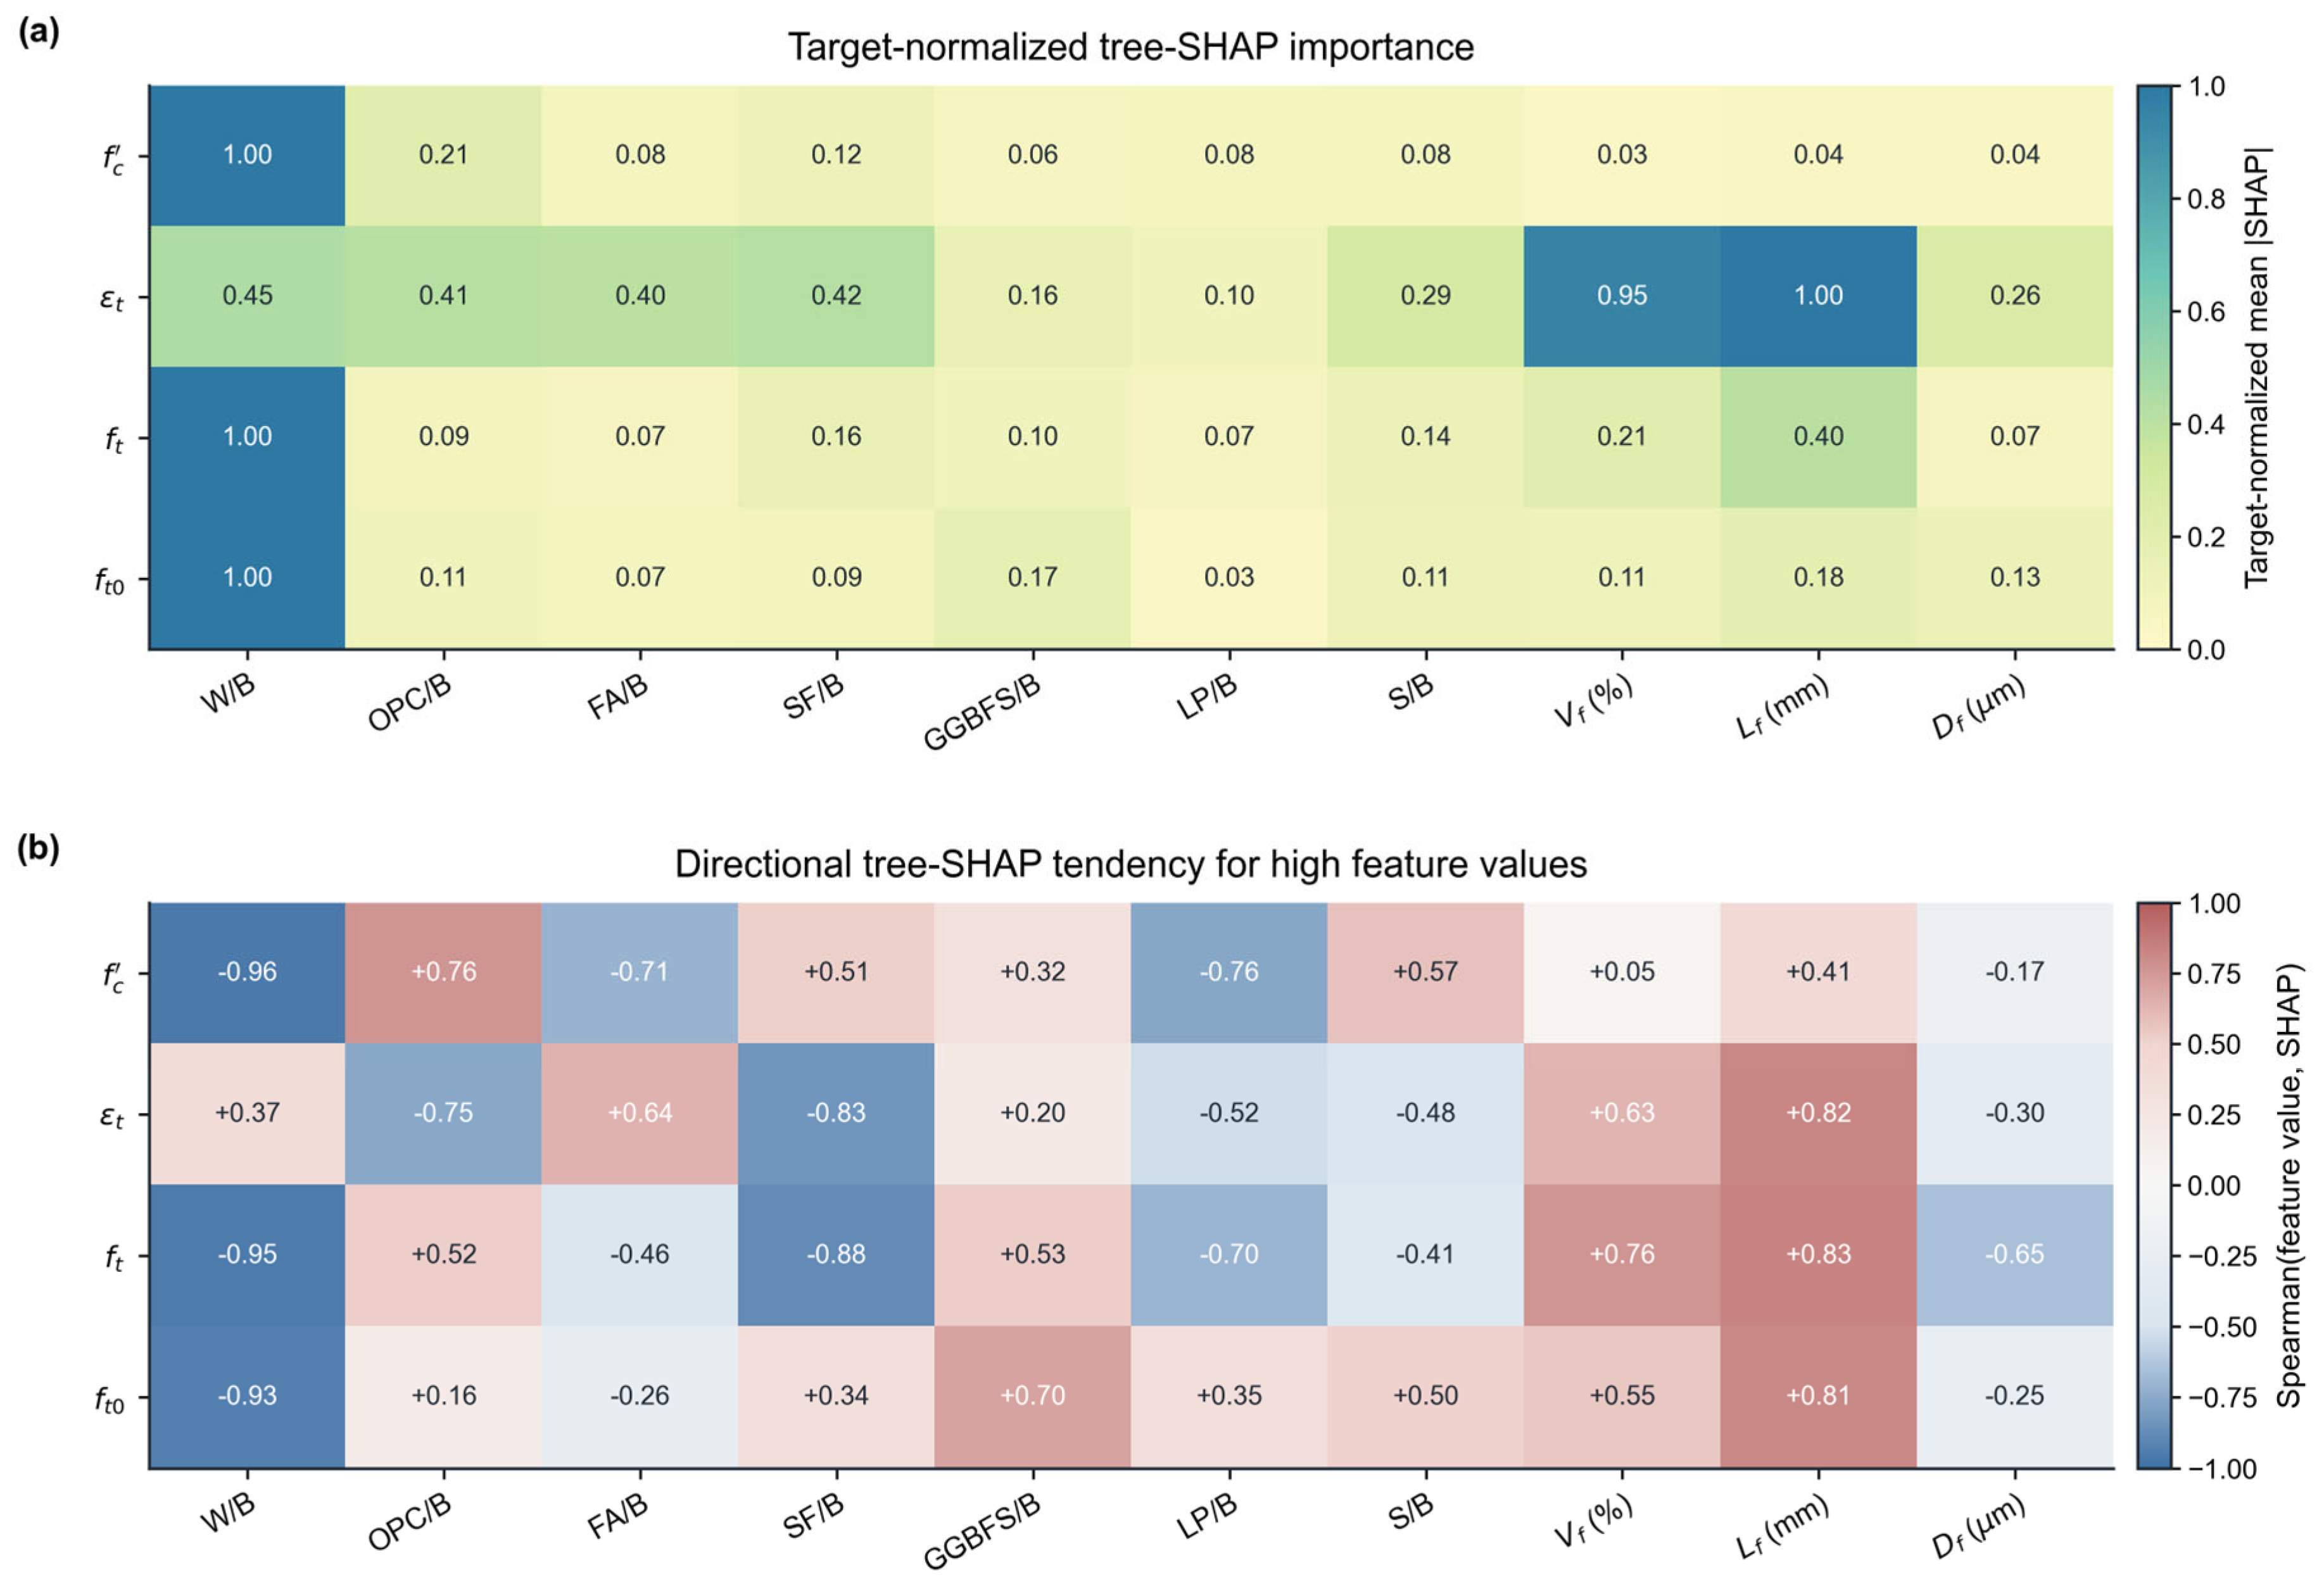
Figure 7.
ALE profiles for the selected reported mixture variables: (a) OPC/B; (b) FA/B; (c) LP/B; (d) GGBFS/B; (e) SF/B; (f) S/B; (g) W/B; (h) Vf; (i) Df; (j) Lf.
Figure 7.
ALE profiles for the selected reported mixture variables: (a) OPC/B; (b) FA/B; (c) LP/B; (d) GGBFS/B; (e) SF/B; (f) S/B; (g) W/B; (h) Vf; (i) Df; (j) Lf.
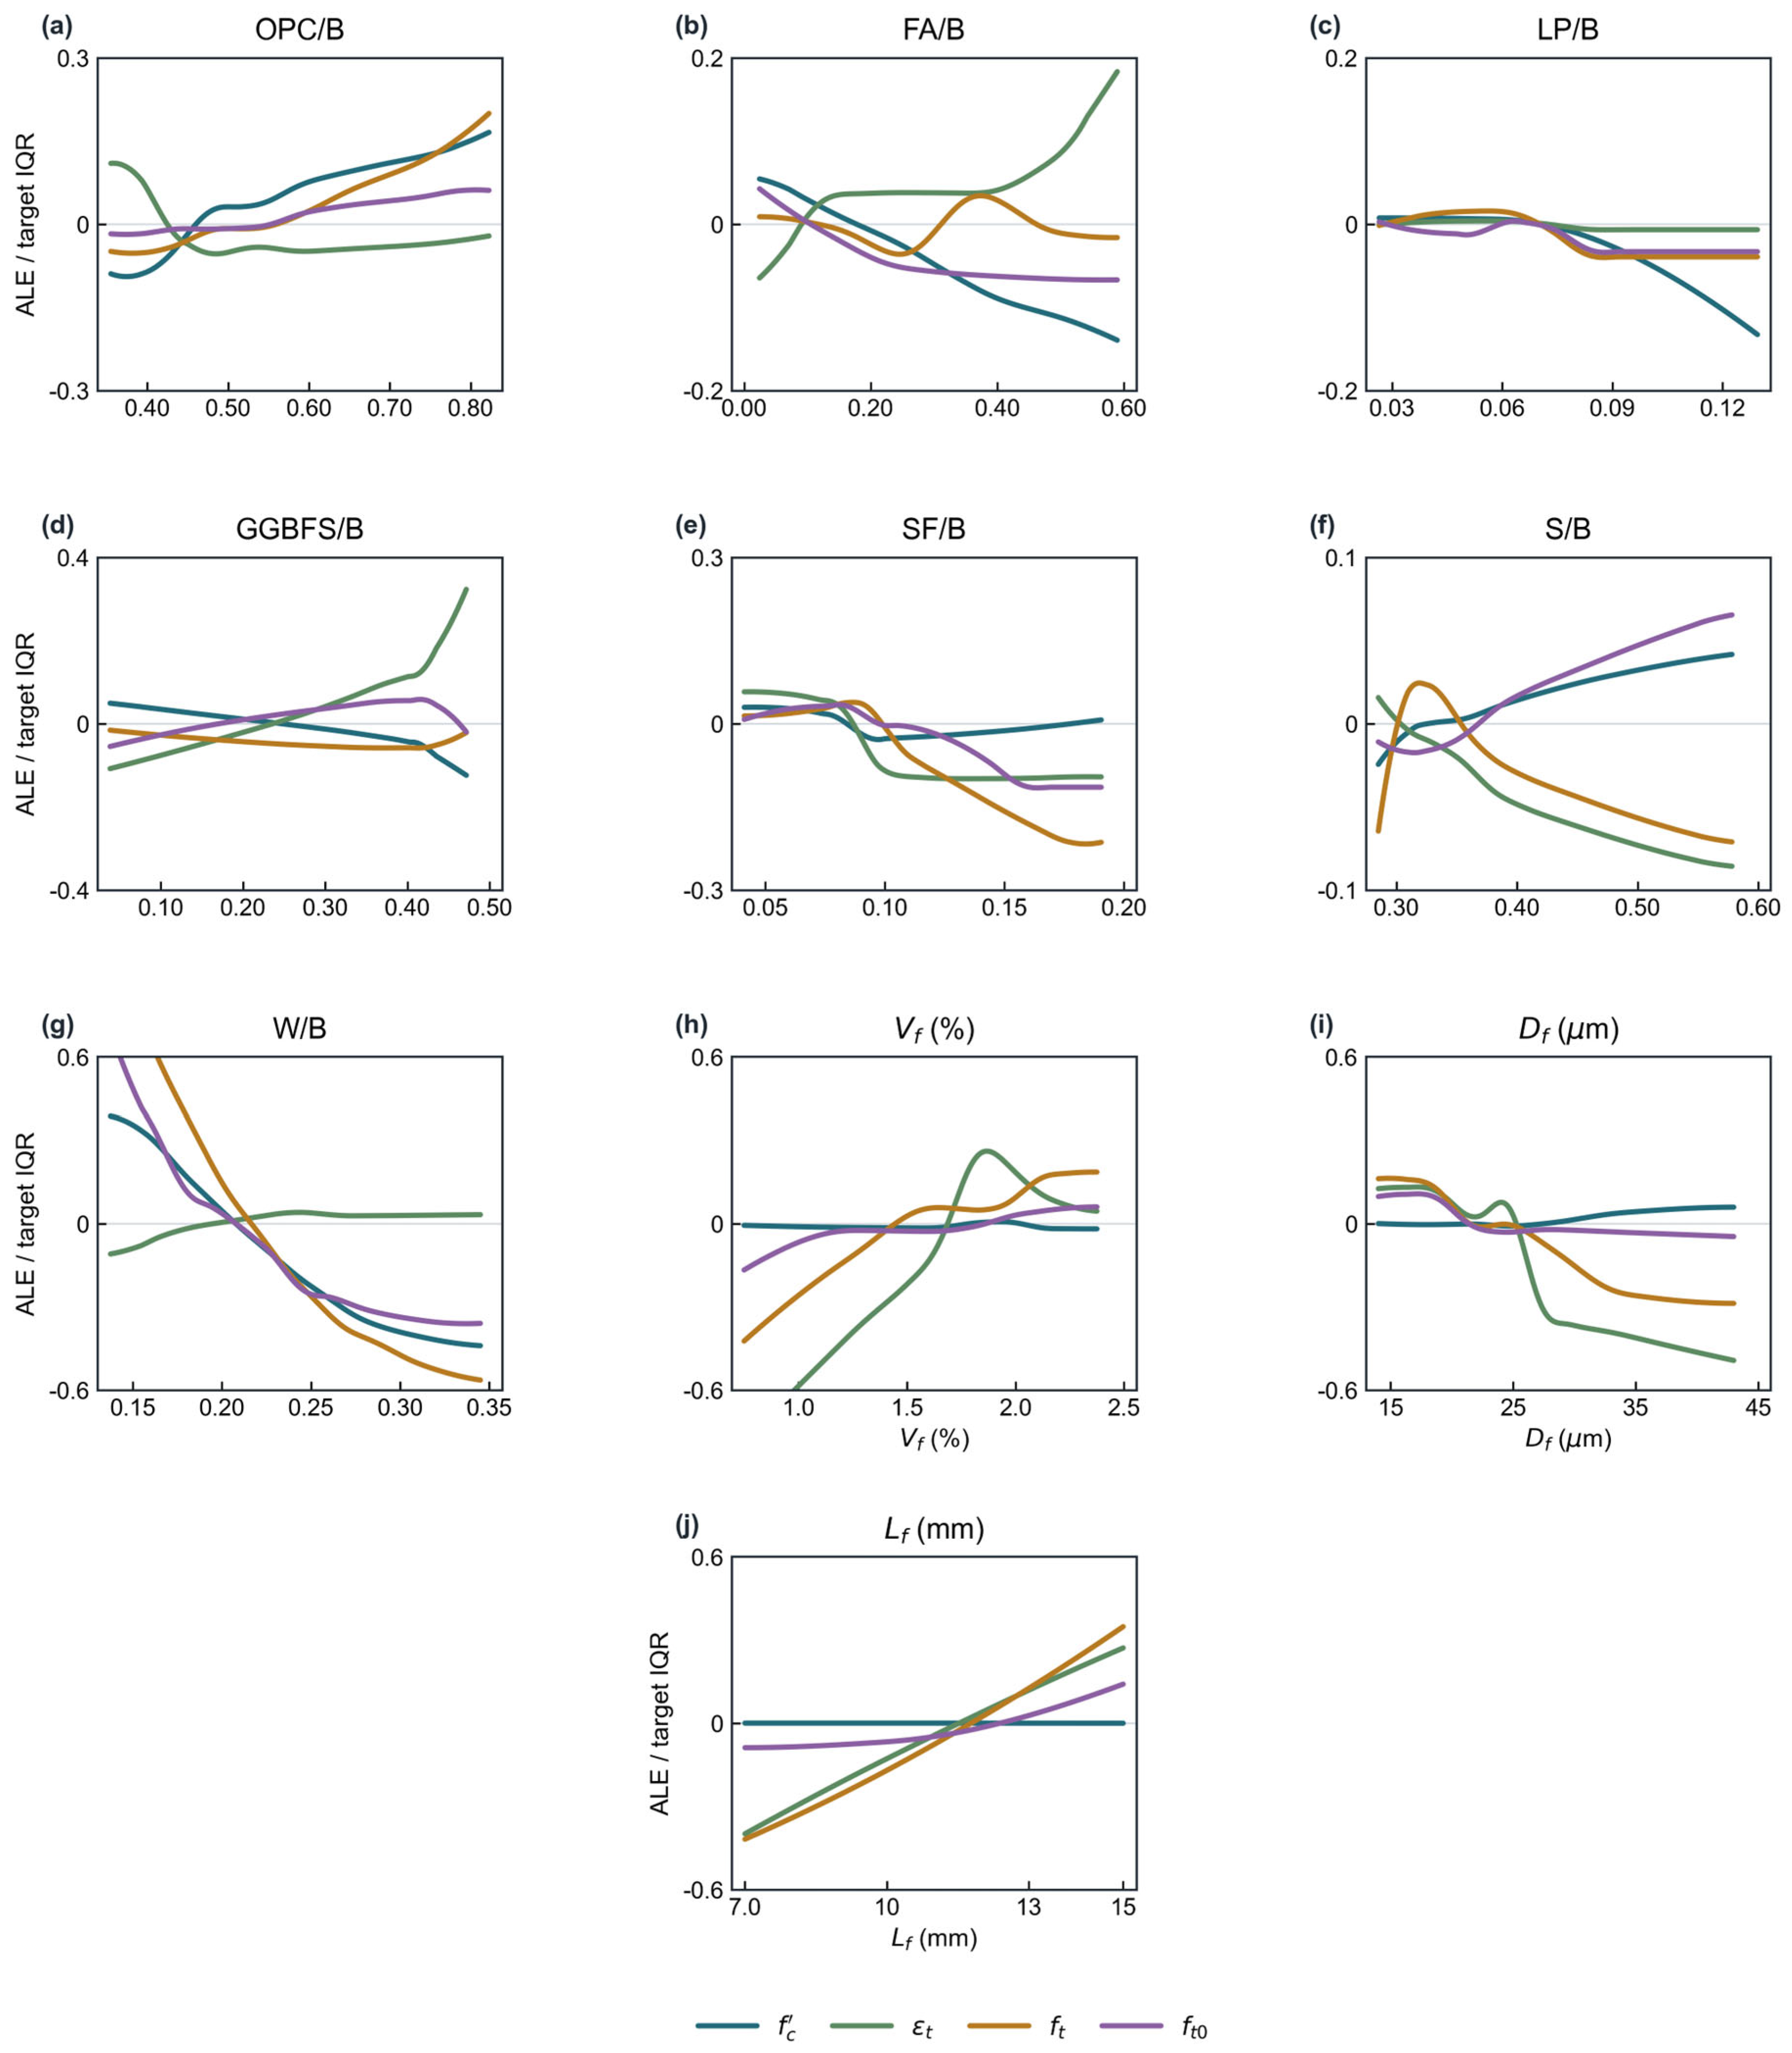
Figure 8.
Response maps for selected pairs of reported mixture variables: (a) fc′ for W/B × SF/B; (b) εt for W/B × FA/B; (c) ft for W/B × S/B; (d) ft0 for W/B × S/B.
Figure 8.
Response maps for selected pairs of reported mixture variables: (a) fc′ for W/B × SF/B; (b) εt for W/B × FA/B; (c) ft for W/B × S/B; (d) ft0 for W/B × S/B.
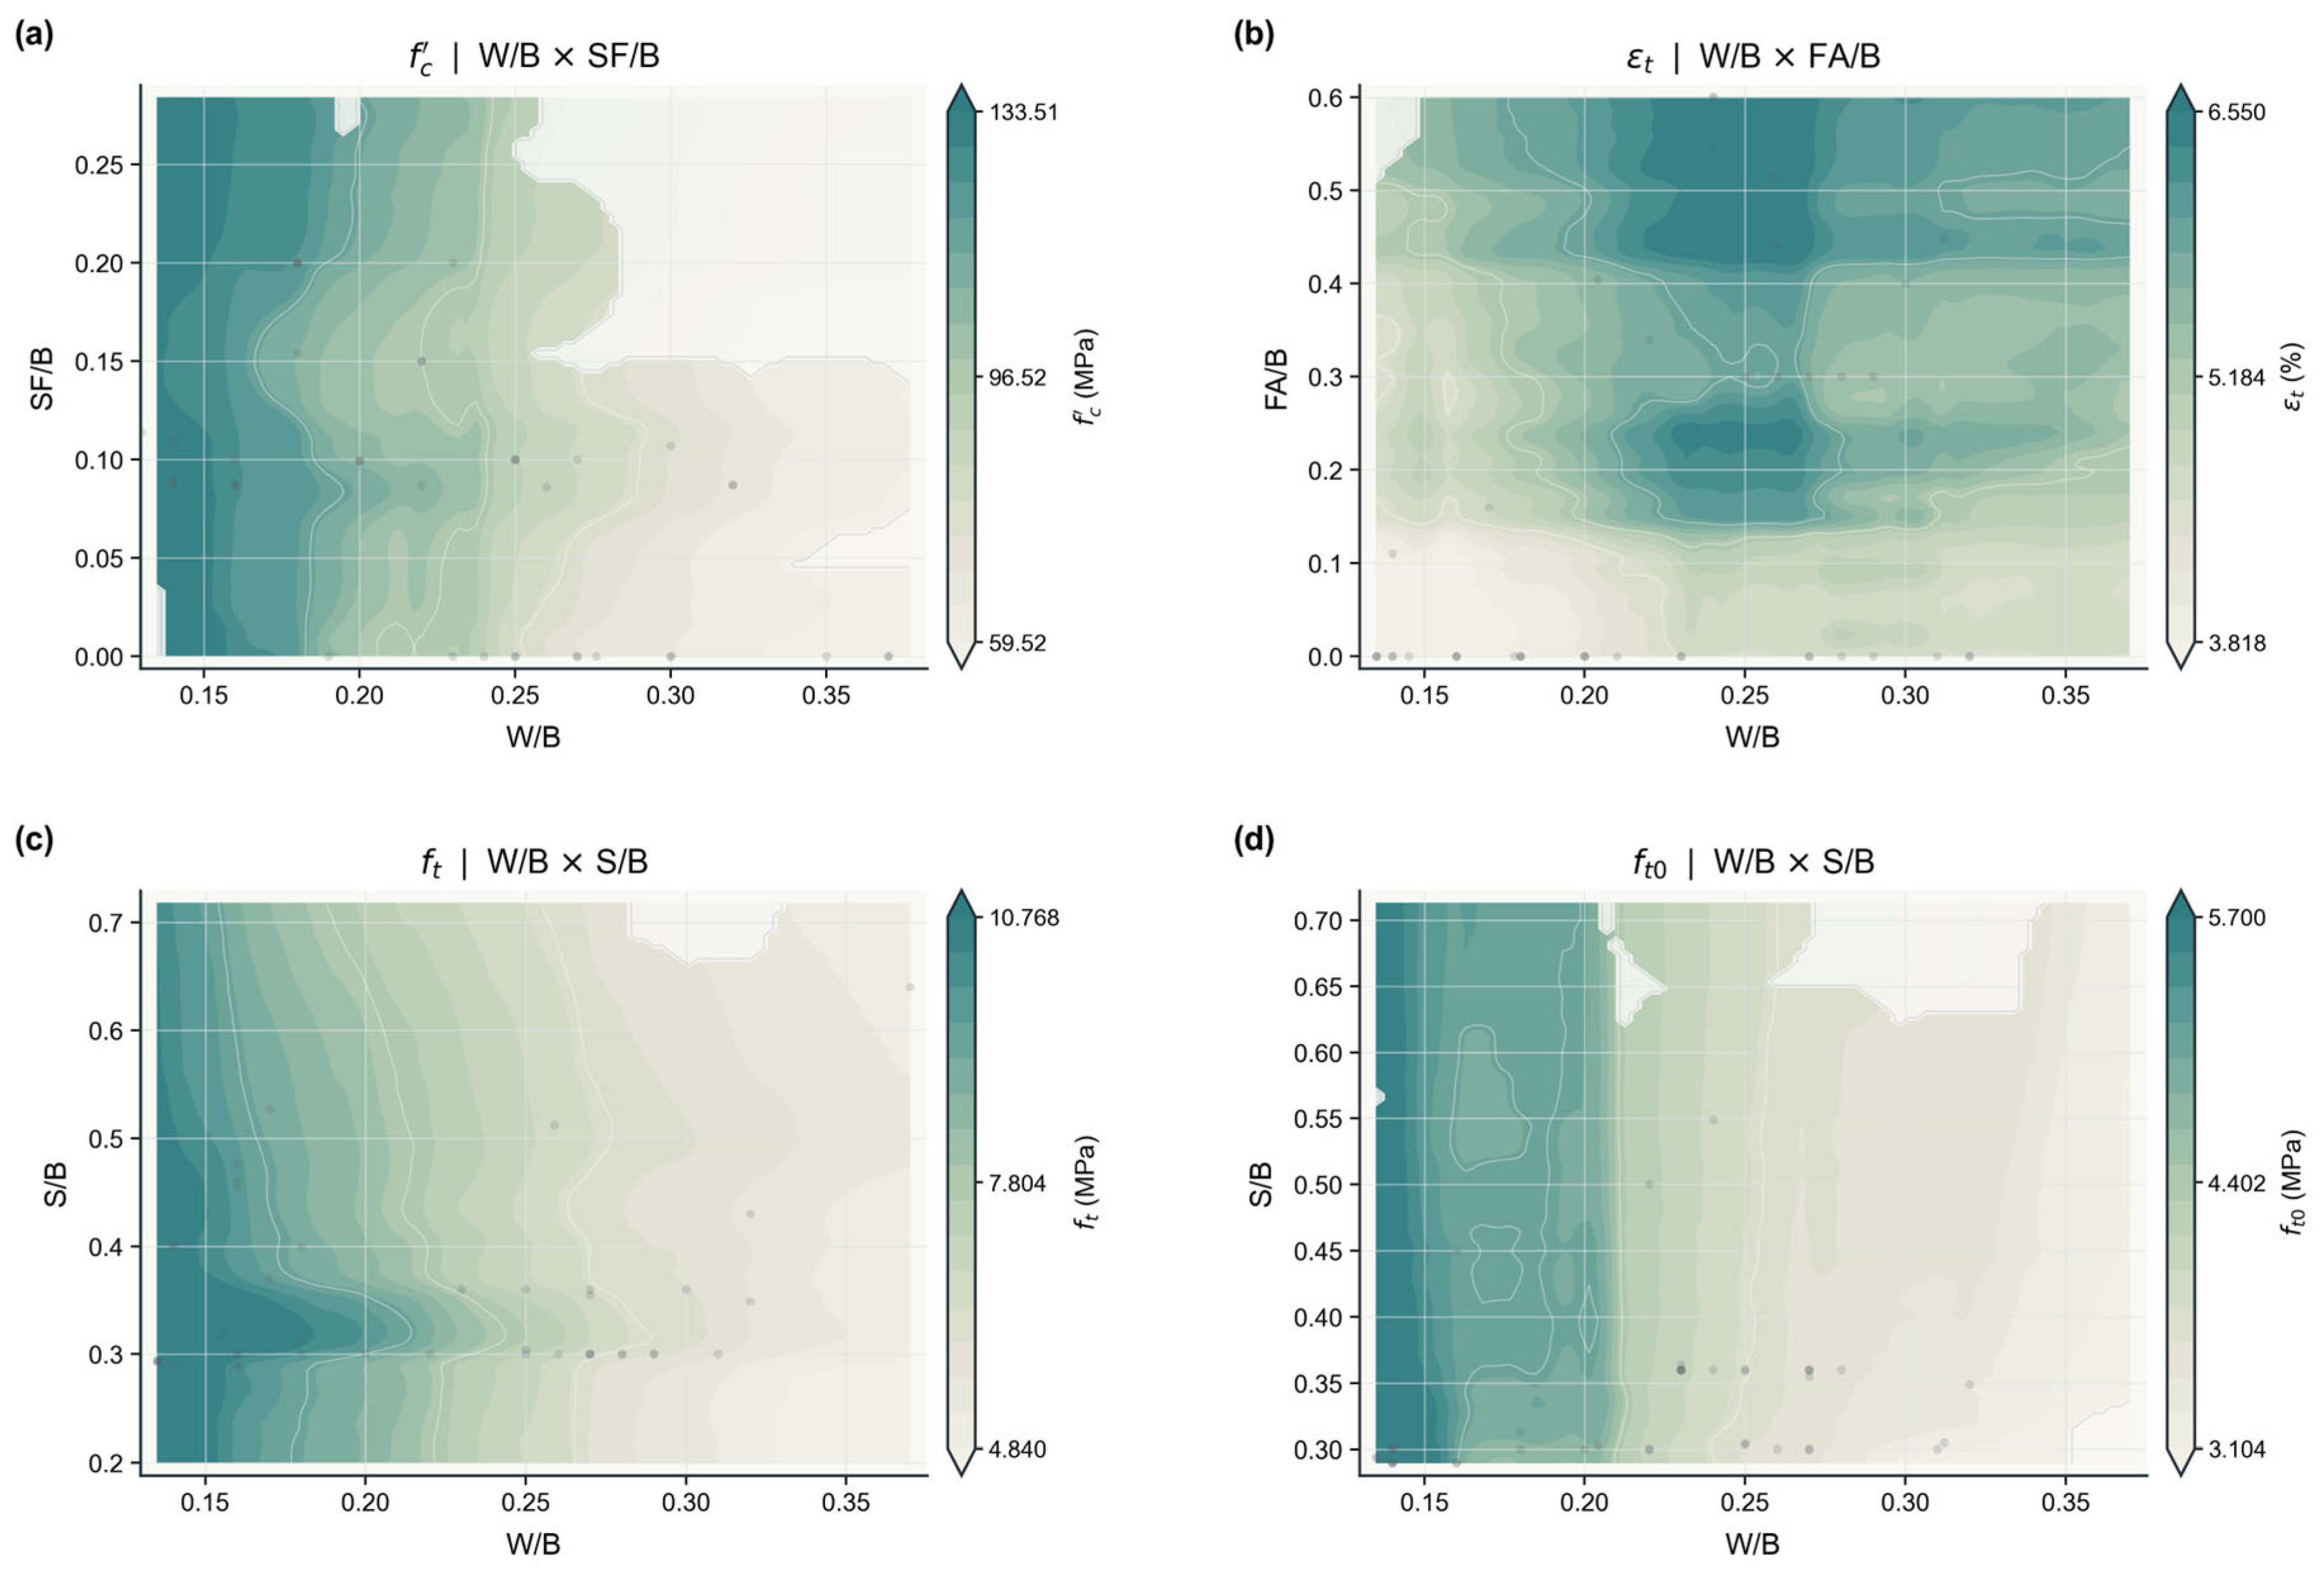
Figure 9.
Response maps of W/B and binder composition. Rows show (a) fc′, (b) εt, (c) ft and (d) ft0; columns show OPC/B, FA/B, SF/B, GGBFS/B and LP/B.
Figure 9.
Response maps of W/B and binder composition. Rows show (a) fc′, (b) εt, (c) ft and (d) ft0; columns show OPC/B, FA/B, SF/B, GGBFS/B and LP/B.
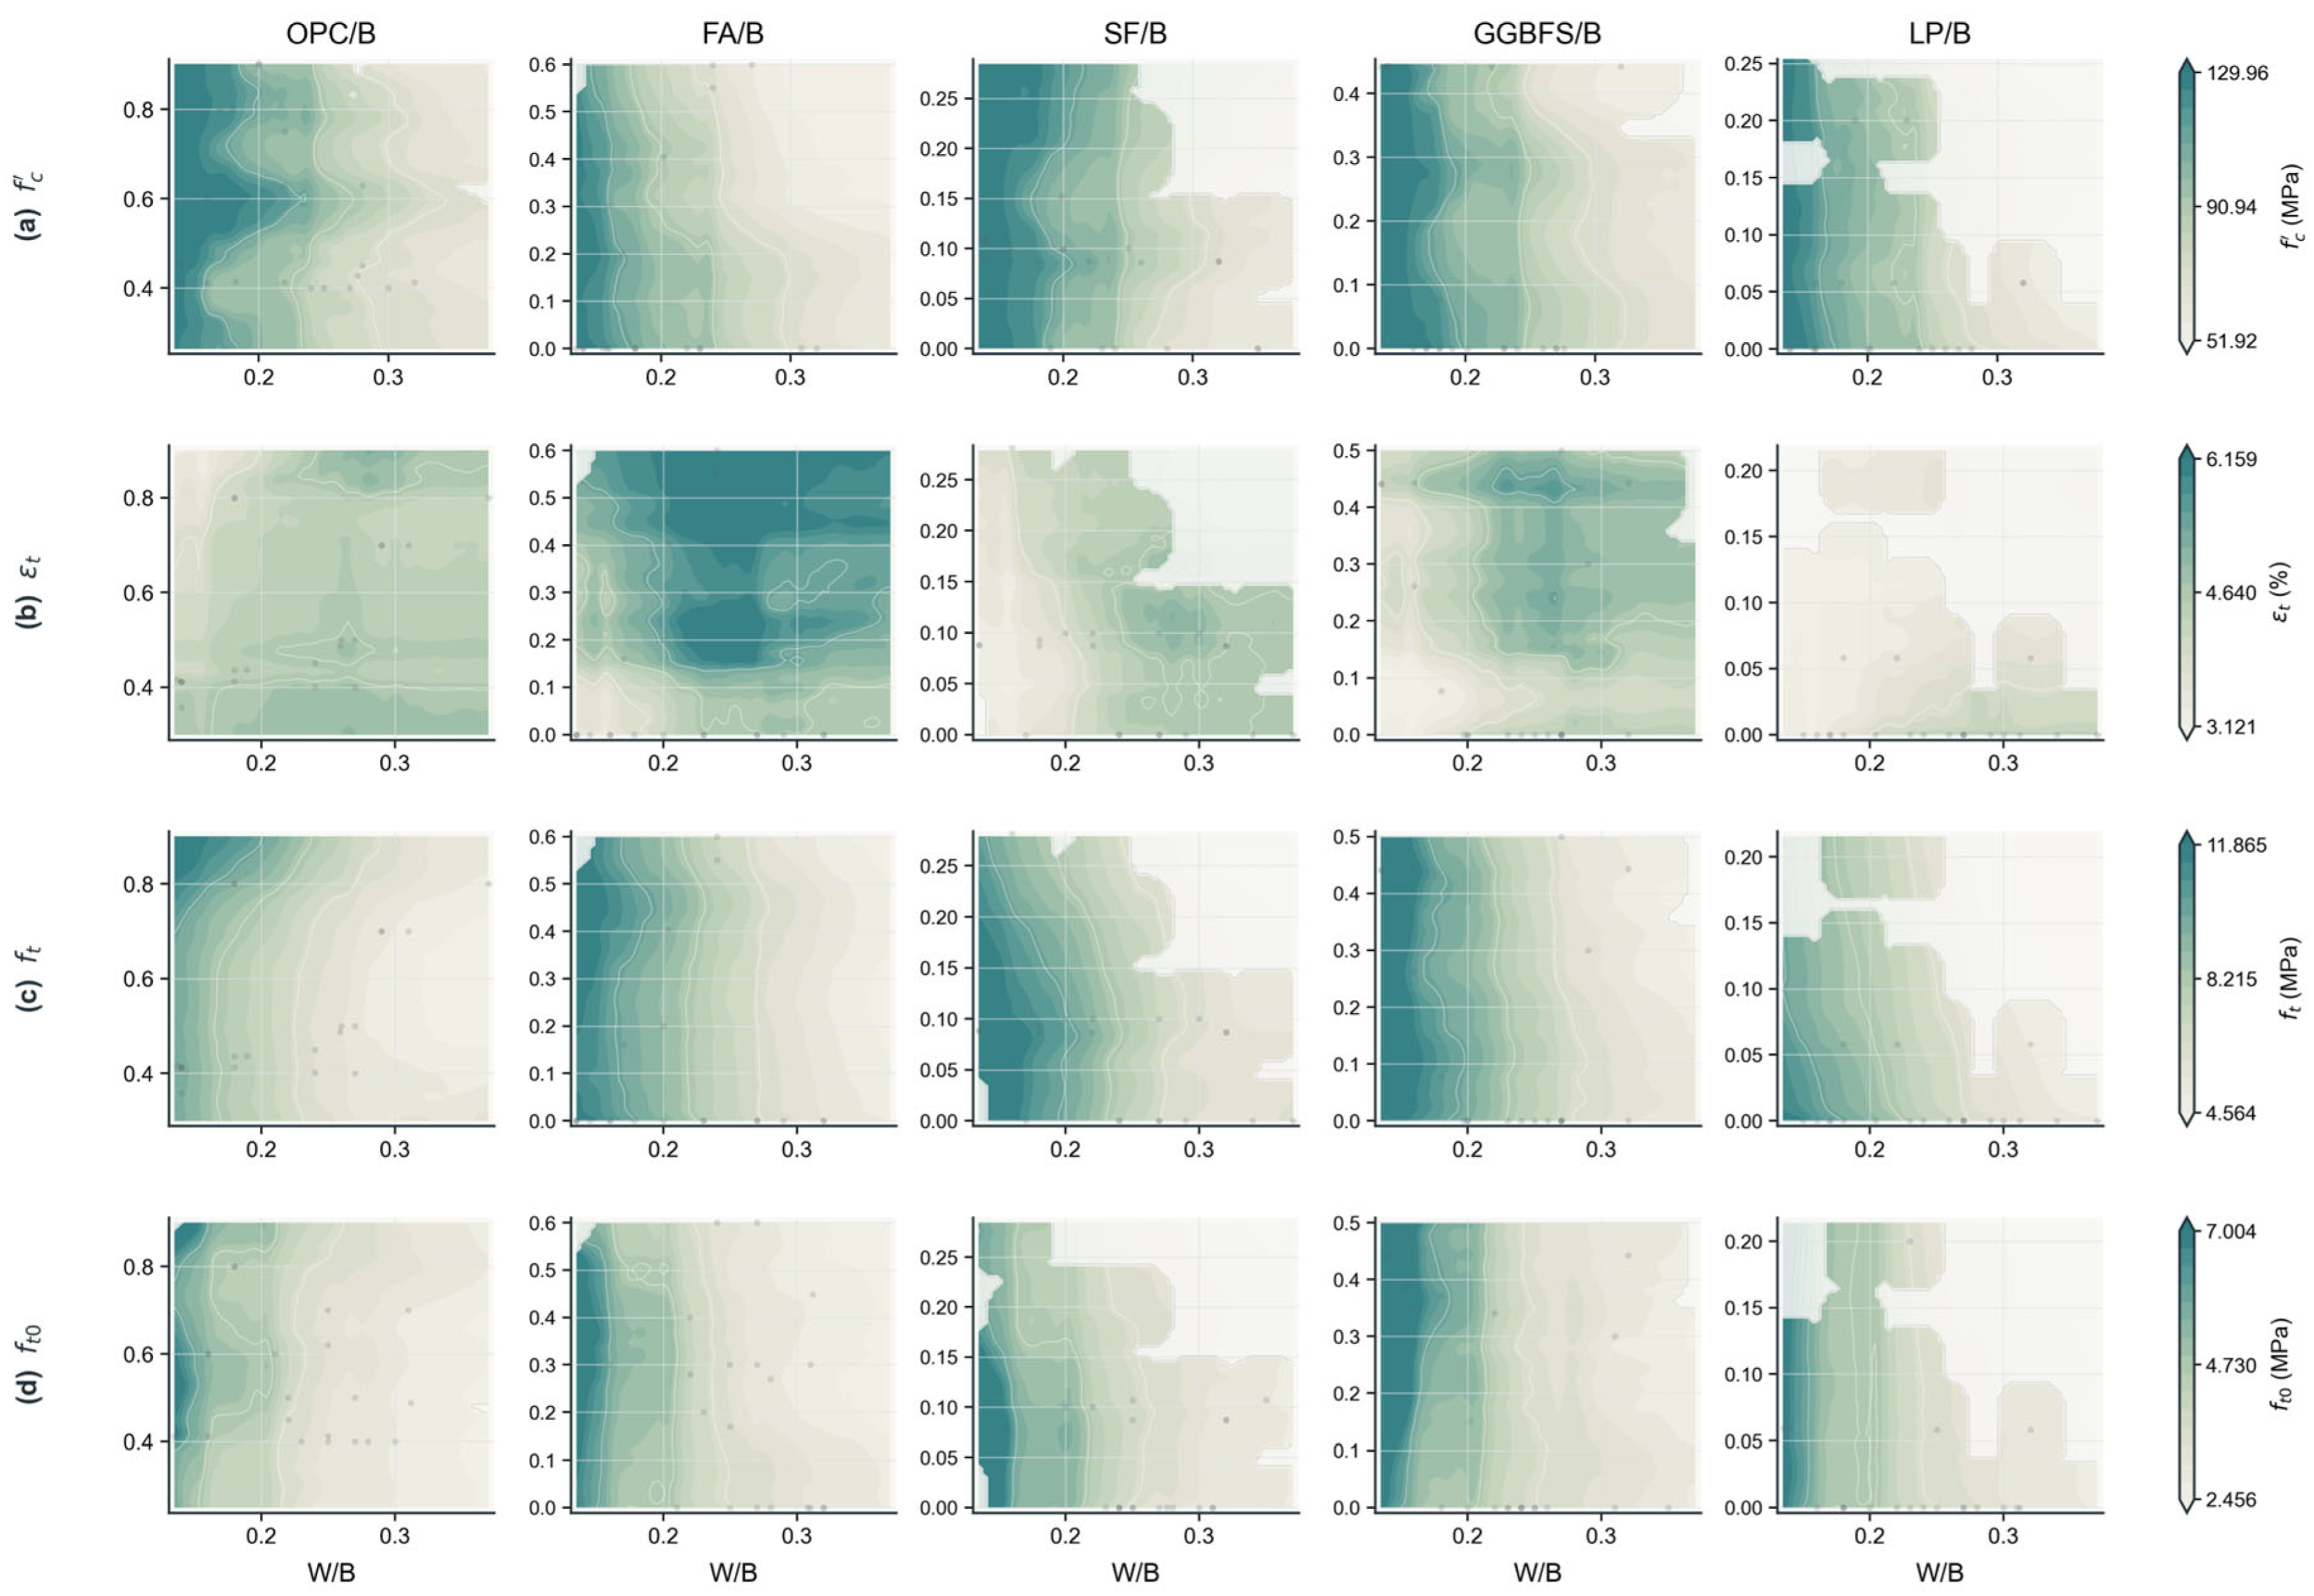
Figure 10.
Response maps for pairs of binder fractions. Rows show (a) fc′, (b) εt, (c) ft and (d) ft0; columns show OPC/B × FA/B, OPC/B × SF/B, FA/B × SF/B, FA/B × GGBFS/B and SF/B × LP/B.
Figure 10.
Response maps for pairs of binder fractions. Rows show (a) fc′, (b) εt, (c) ft and (d) ft0; columns show OPC/B × FA/B, OPC/B × SF/B, FA/B × SF/B, FA/B × GGBFS/B and SF/B × LP/B.
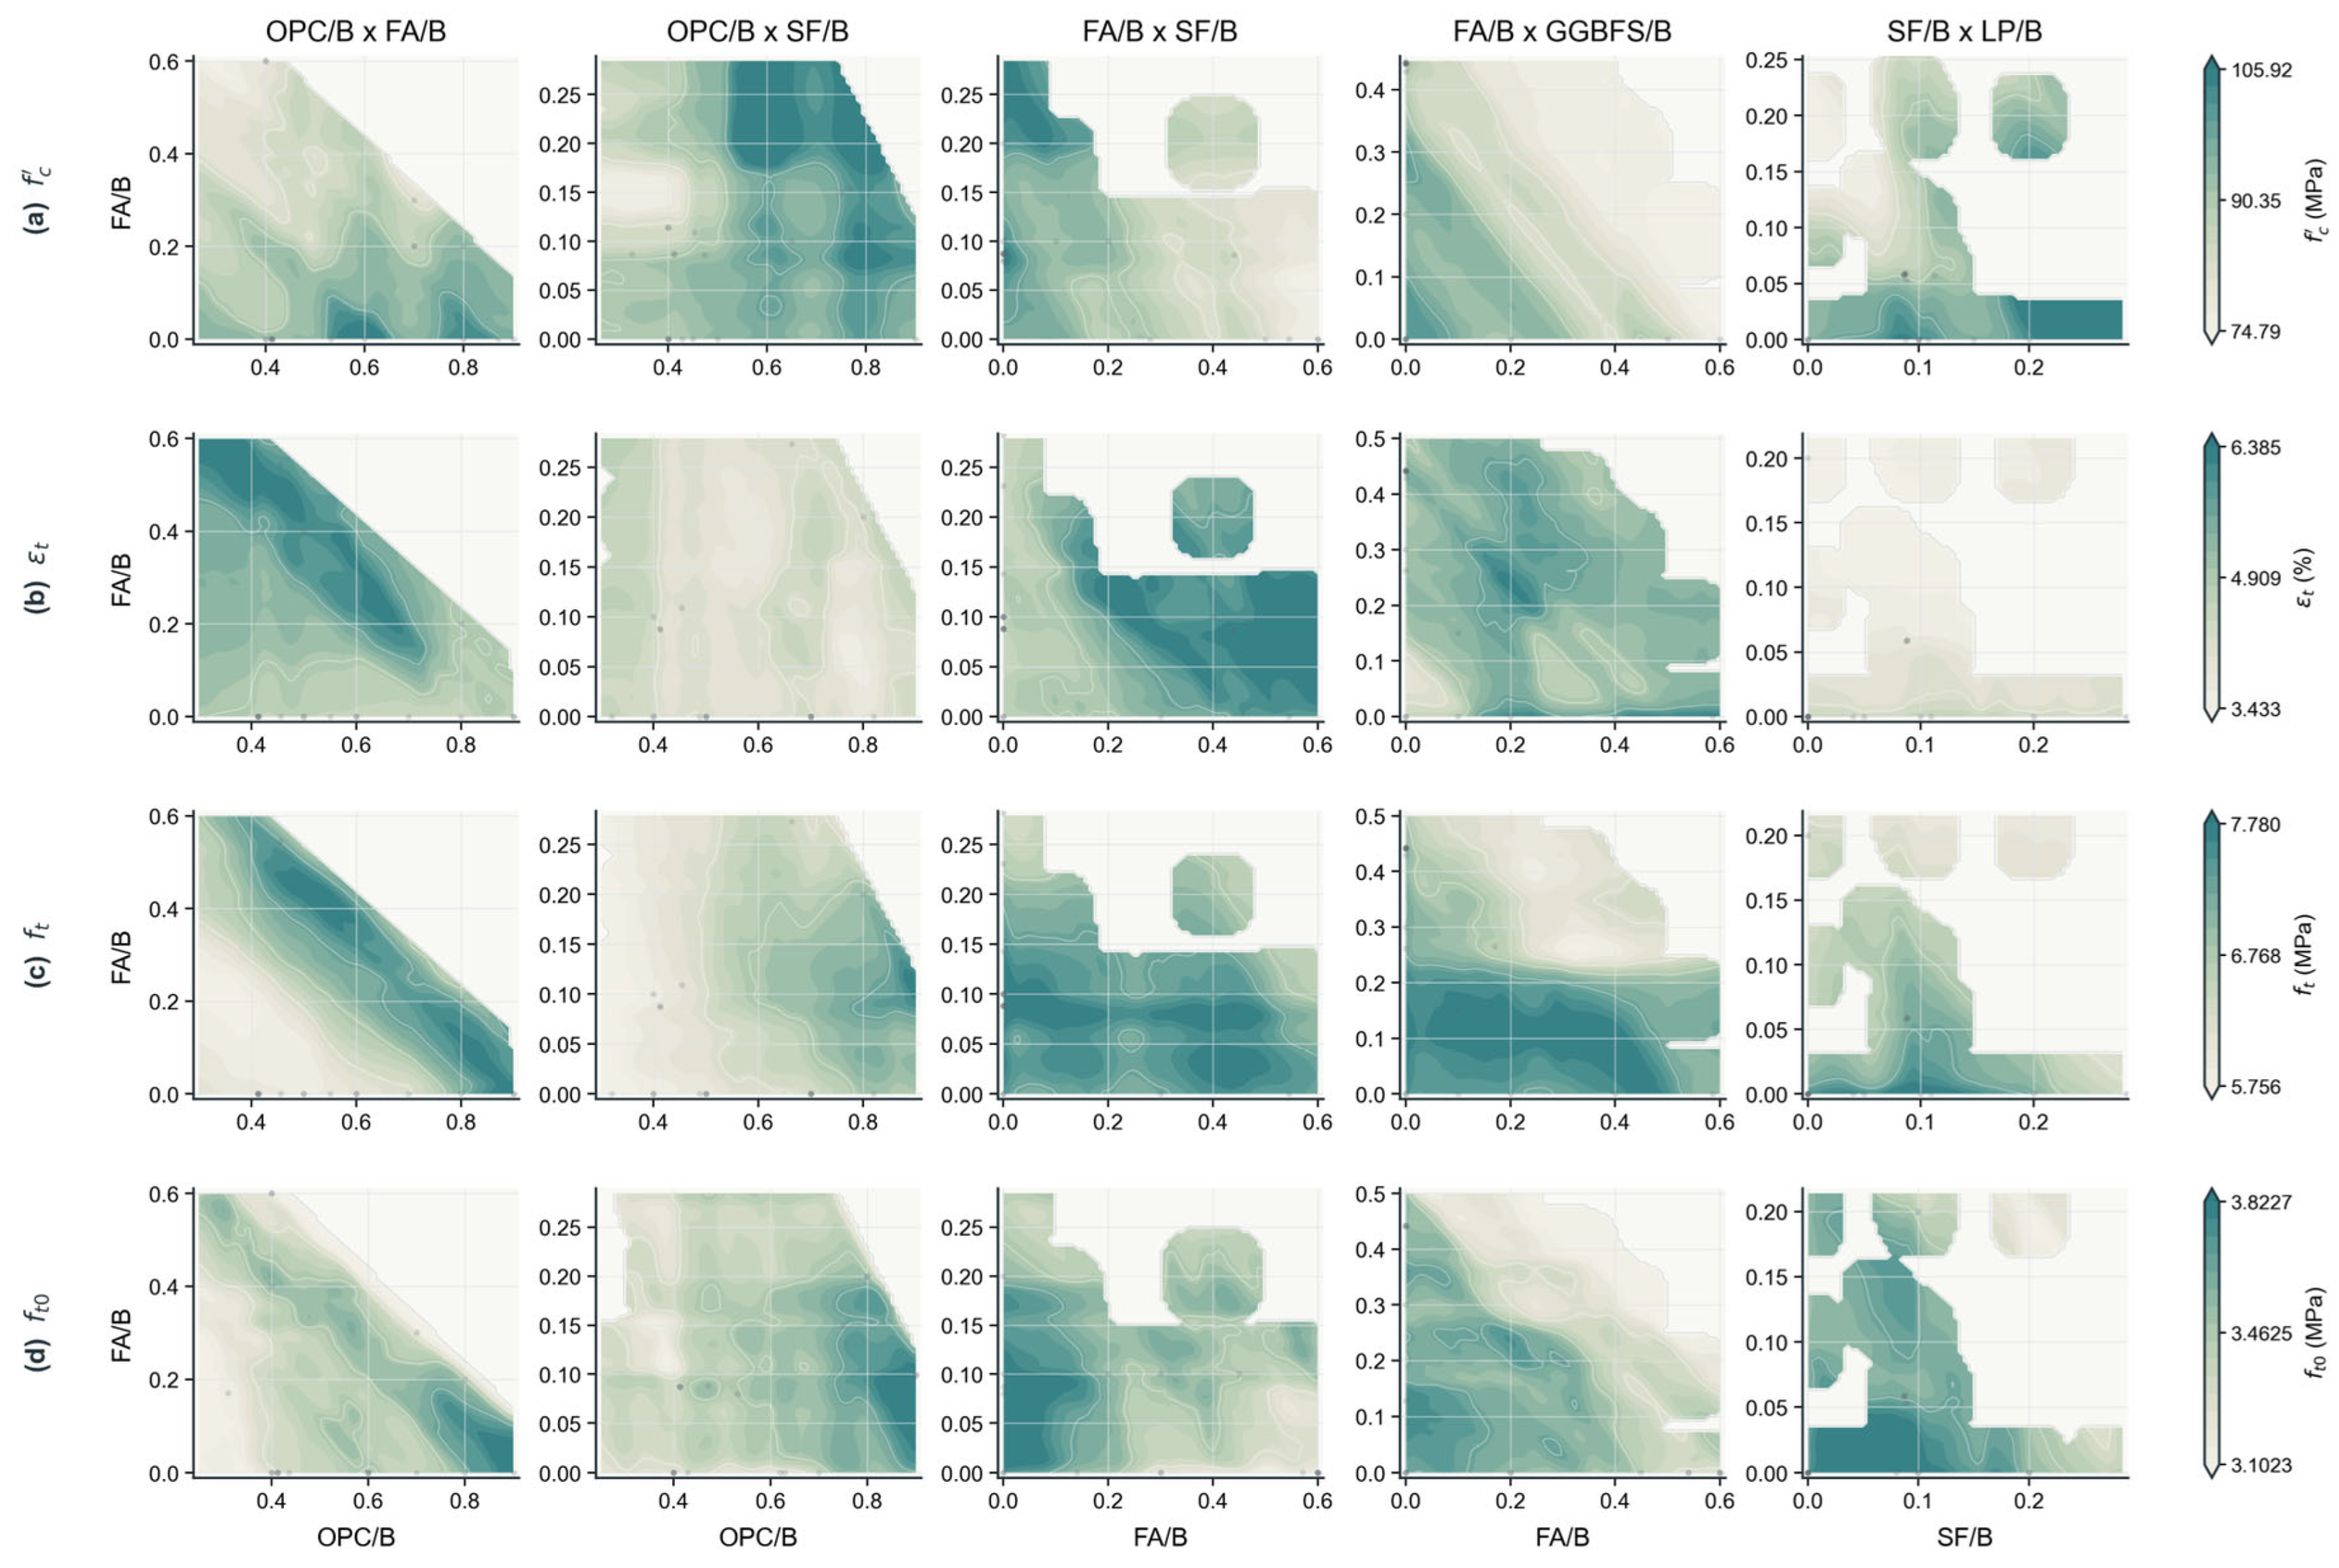
Figure 11.
Predicted tensile strain and compressive strength at selected binder fractions: (a) εt at SF/B = 0; (b) εt at SF/B = 0.10; (c) εt at SF/B = 0.13; (d) fc′ at FA/B = 0; (e) fc′ at FA/B = 0.35; (f) fc′ at FA/B = 0.545.
Figure 11.
Predicted tensile strain and compressive strength at selected binder fractions: (a) εt at SF/B = 0; (b) εt at SF/B = 0.10; (c) εt at SF/B = 0.13; (d) fc′ at FA/B = 0; (e) fc′ at FA/B = 0.35; (f) fc′ at FA/B = 0.545.
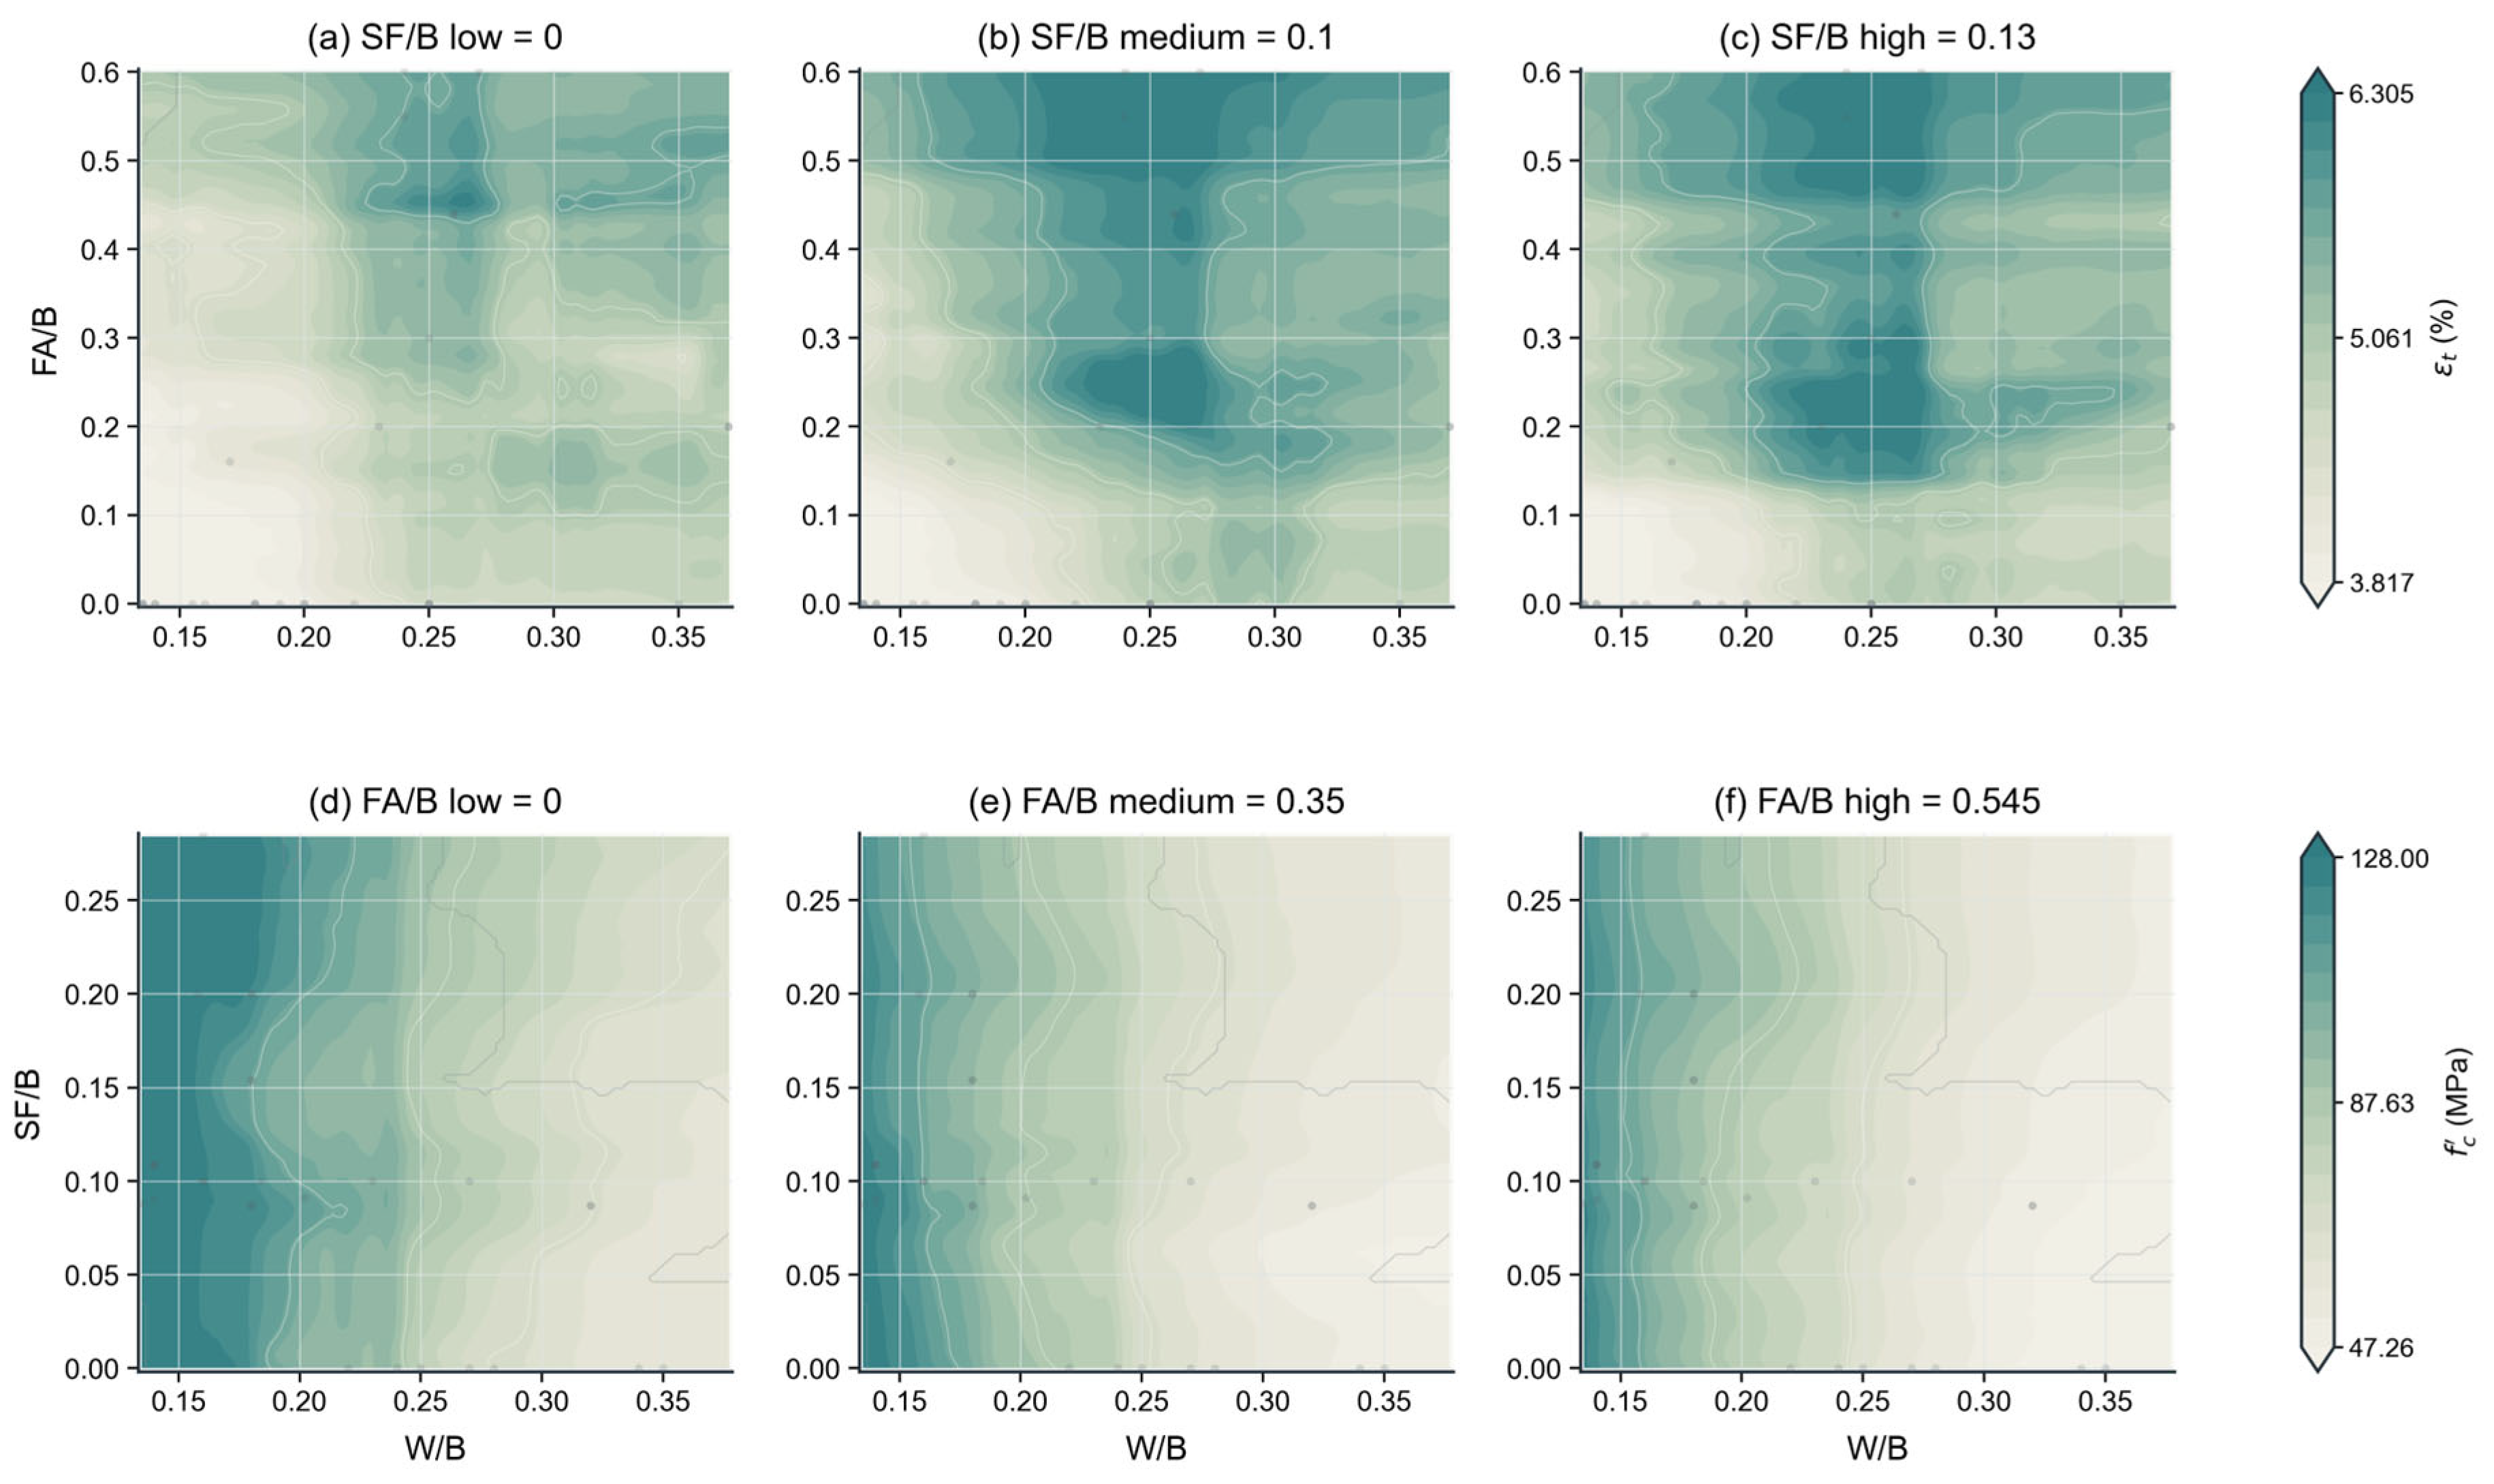
Figure 12.
Response maps for S/B and reported fiber parameters. Rows show (a) εt, (b) ft and (c) ft0; columns show W/B × S/B, S/B × Vf and Vf × Lf using the reported 12 and 18 mm fiber lengths.
Figure 12.
Response maps for S/B and reported fiber parameters. Rows show (a) εt, (b) ft and (c) ft0; columns show W/B × S/B, S/B × Vf and Vf × Lf using the reported 12 and 18 mm fiber lengths.
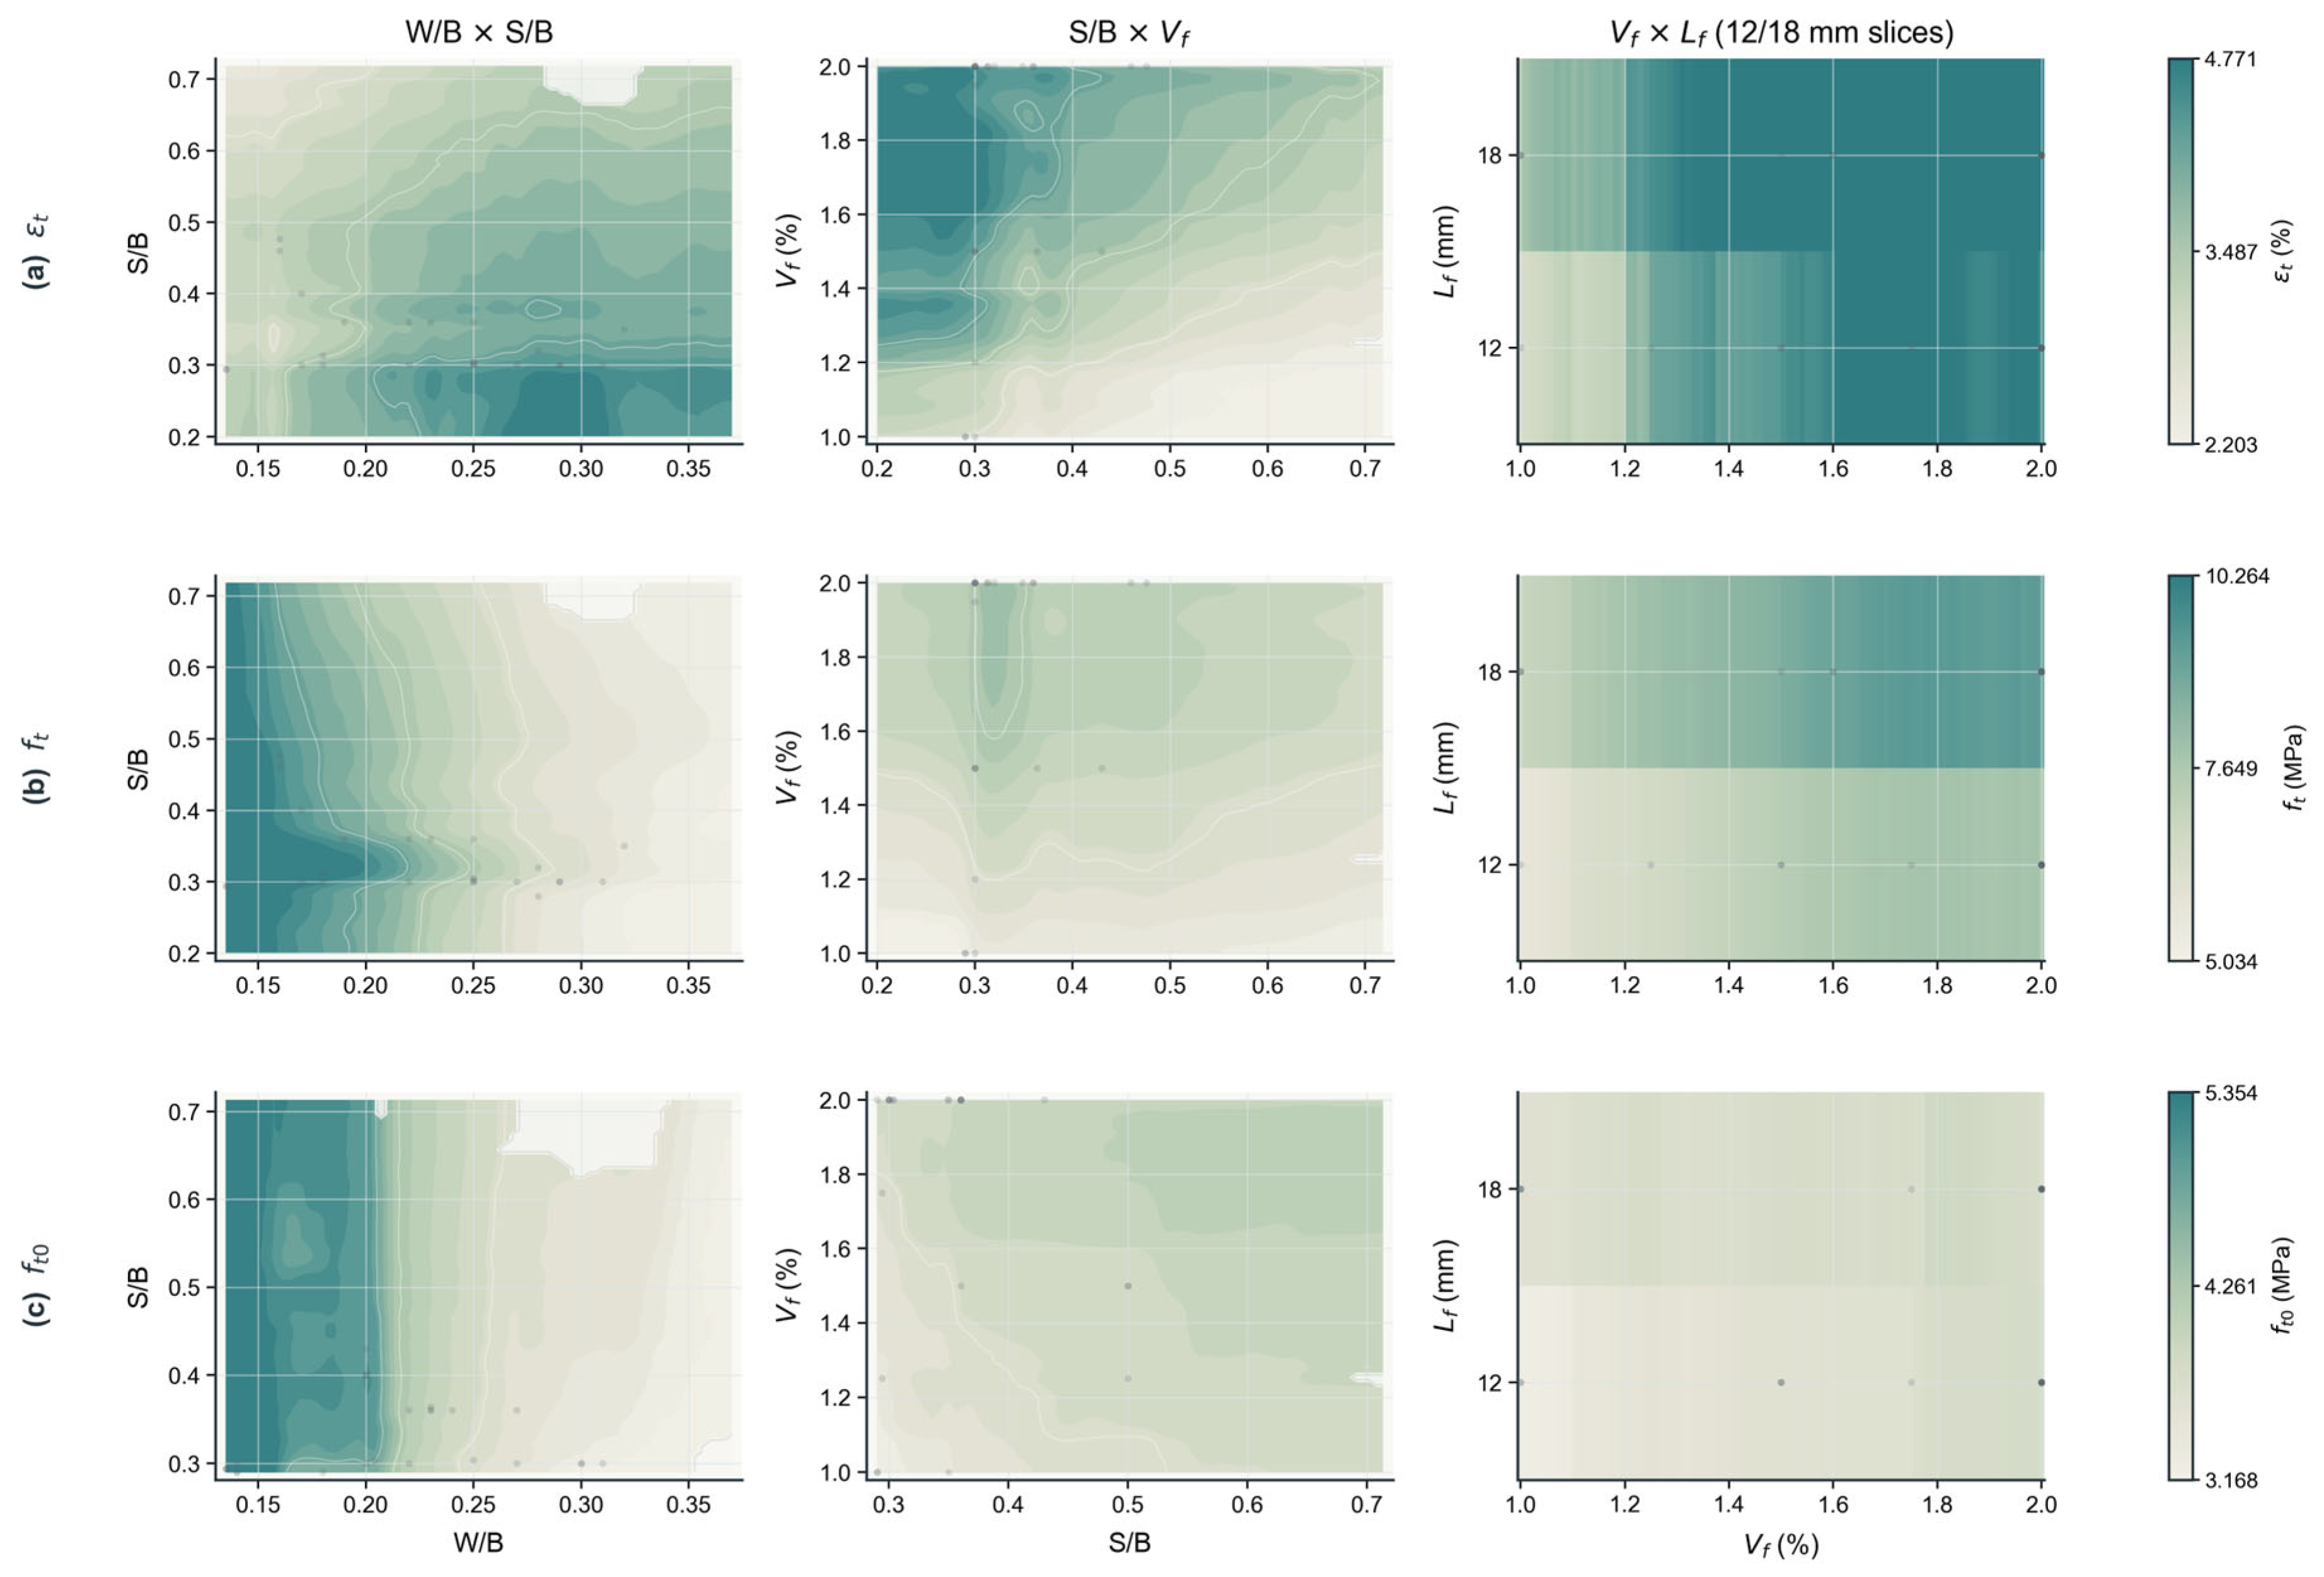
Figure 13.
Response maps of tensile strain and peak tensile strength for the reported fiber dosage and dimensions: (a) εt for Vf × Df; (b) εt for Lf × Df; (c) ft for Vf × Df; (d) ft for Lf × Df.
Figure 13.
Response maps of tensile strain and peak tensile strength for the reported fiber dosage and dimensions: (a) εt for Vf × Df; (b) εt for Lf × Df; (c) ft for Vf × Df; (d) ft for Lf × Df.
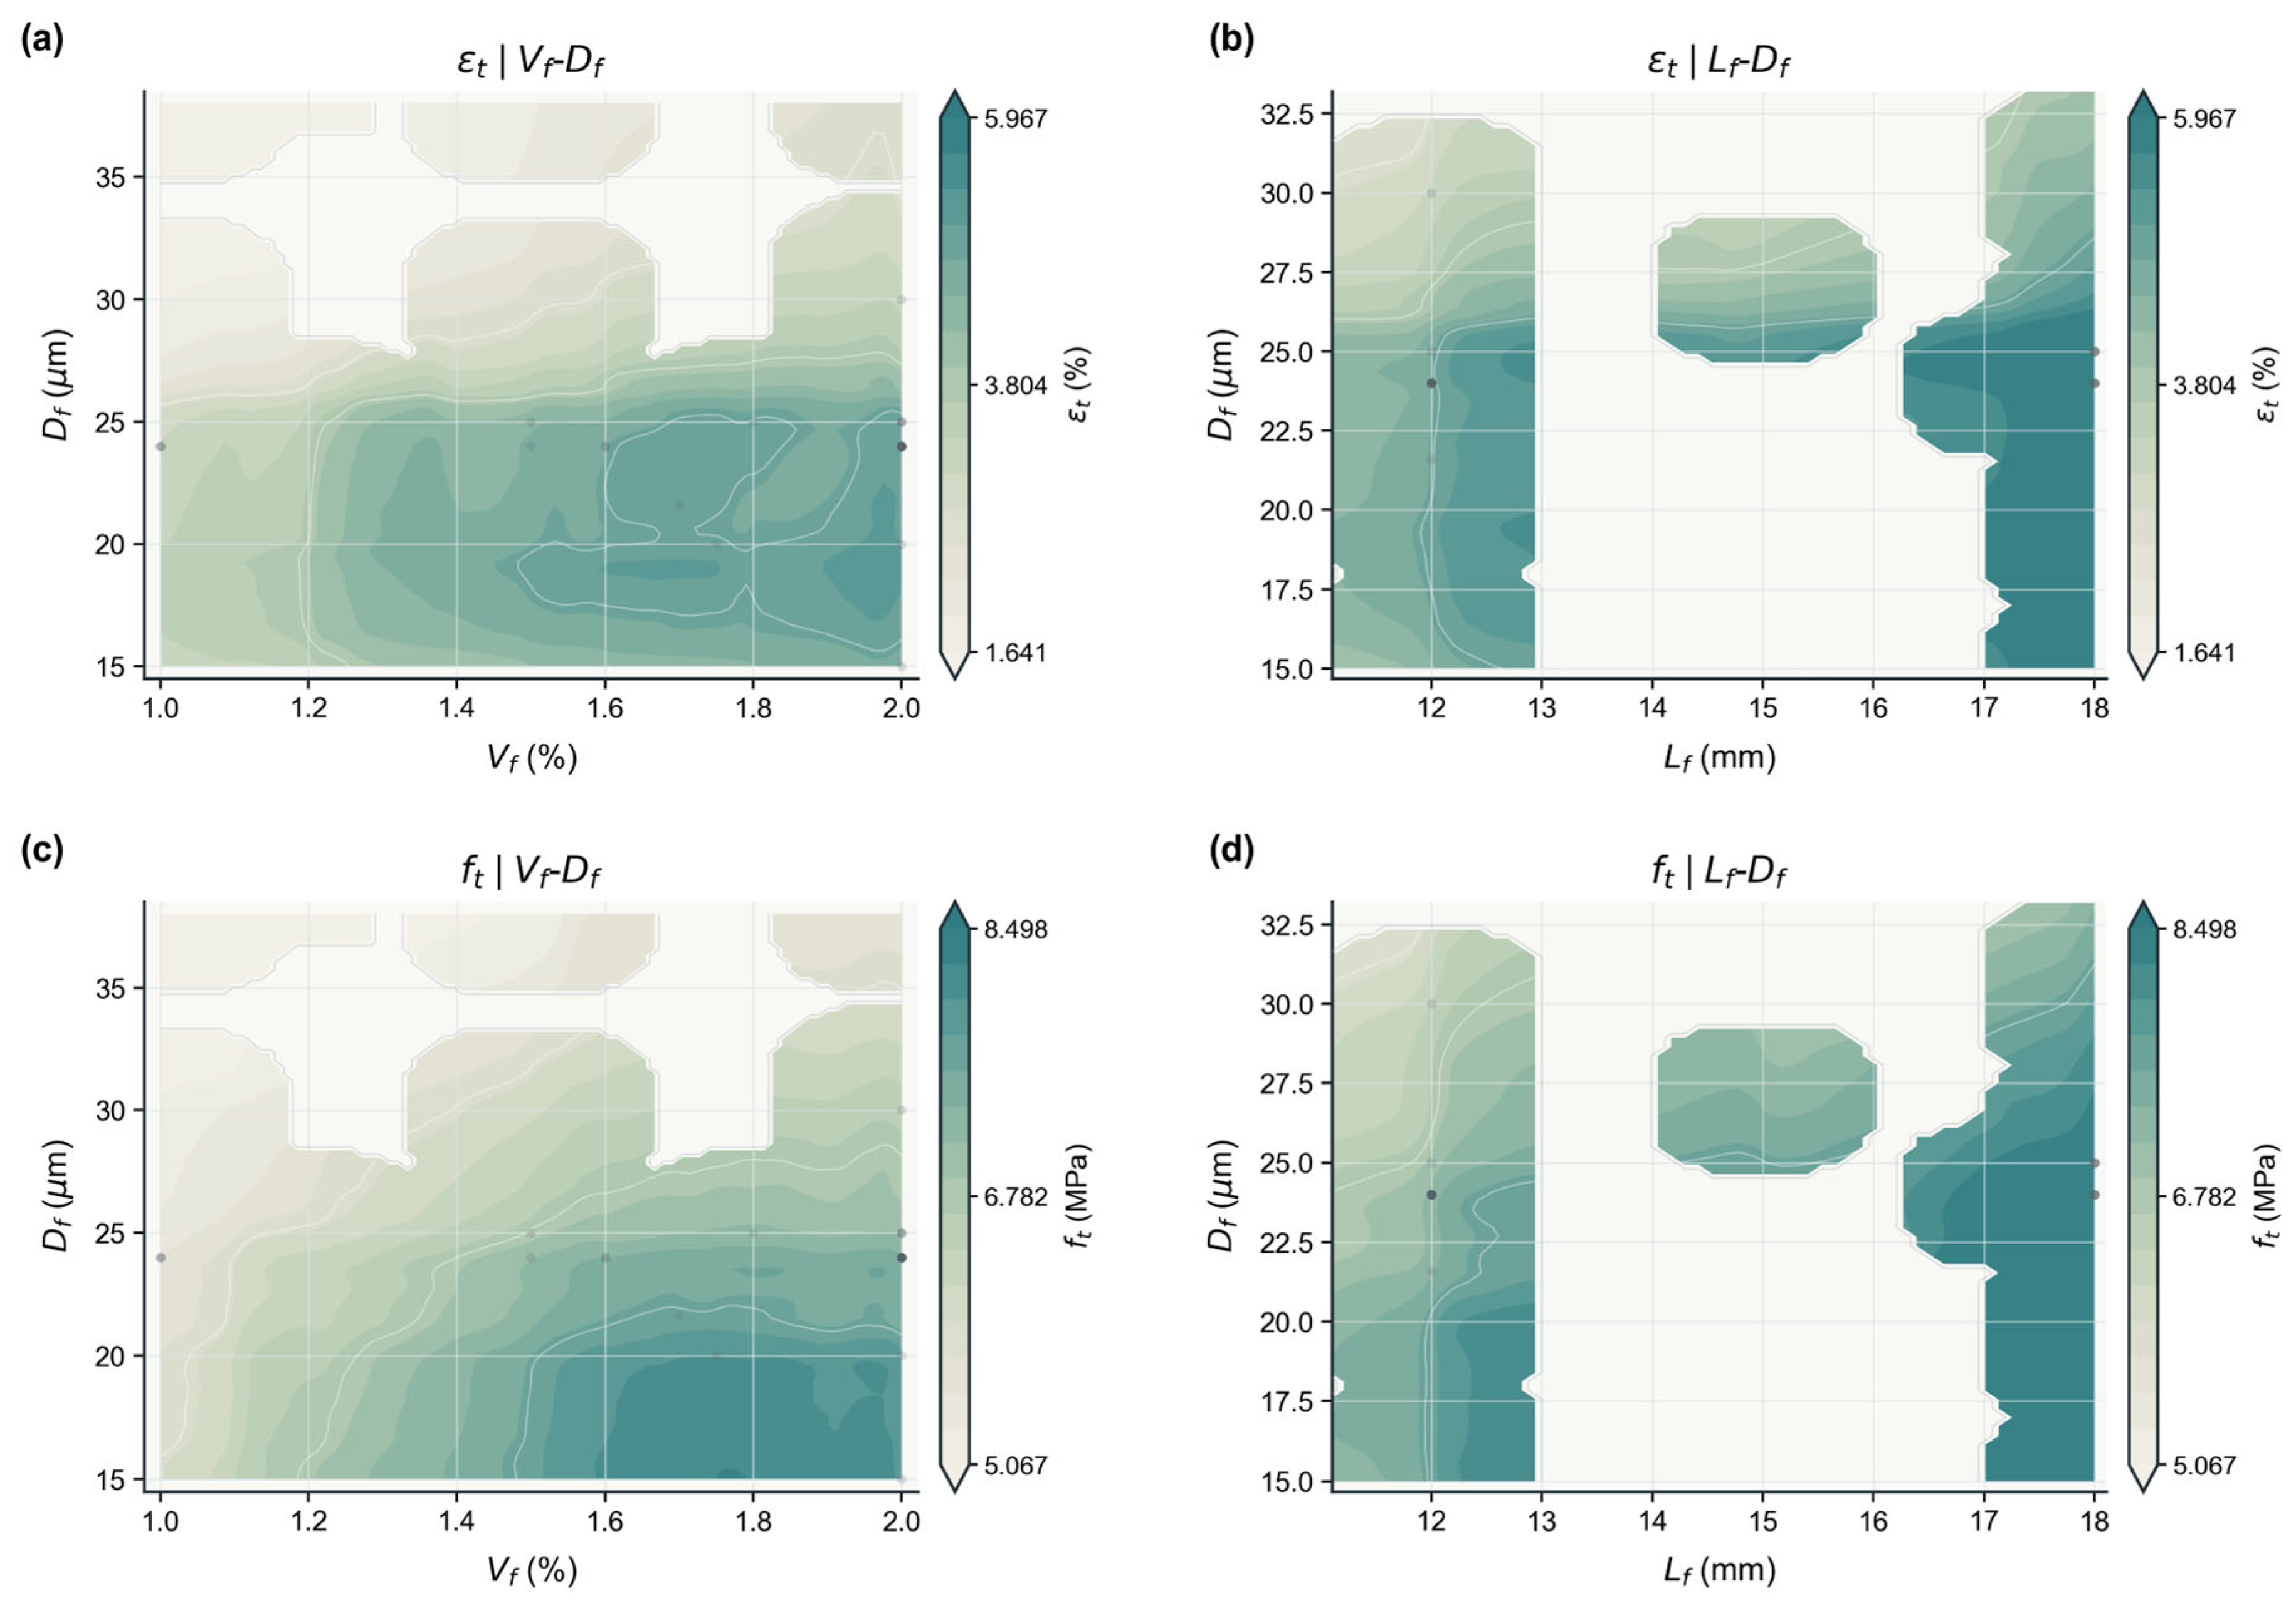
Figure 14.
Tensile strain normalized by the nominal fiber index: (a) W/B × S/B; (b) W/B × FA/B; (c) OPC/B × FA/B.
Figure 14.
Tensile strain normalized by the nominal fiber index: (a) W/B × S/B; (b) W/B × FA/B; (c) OPC/B × FA/B.
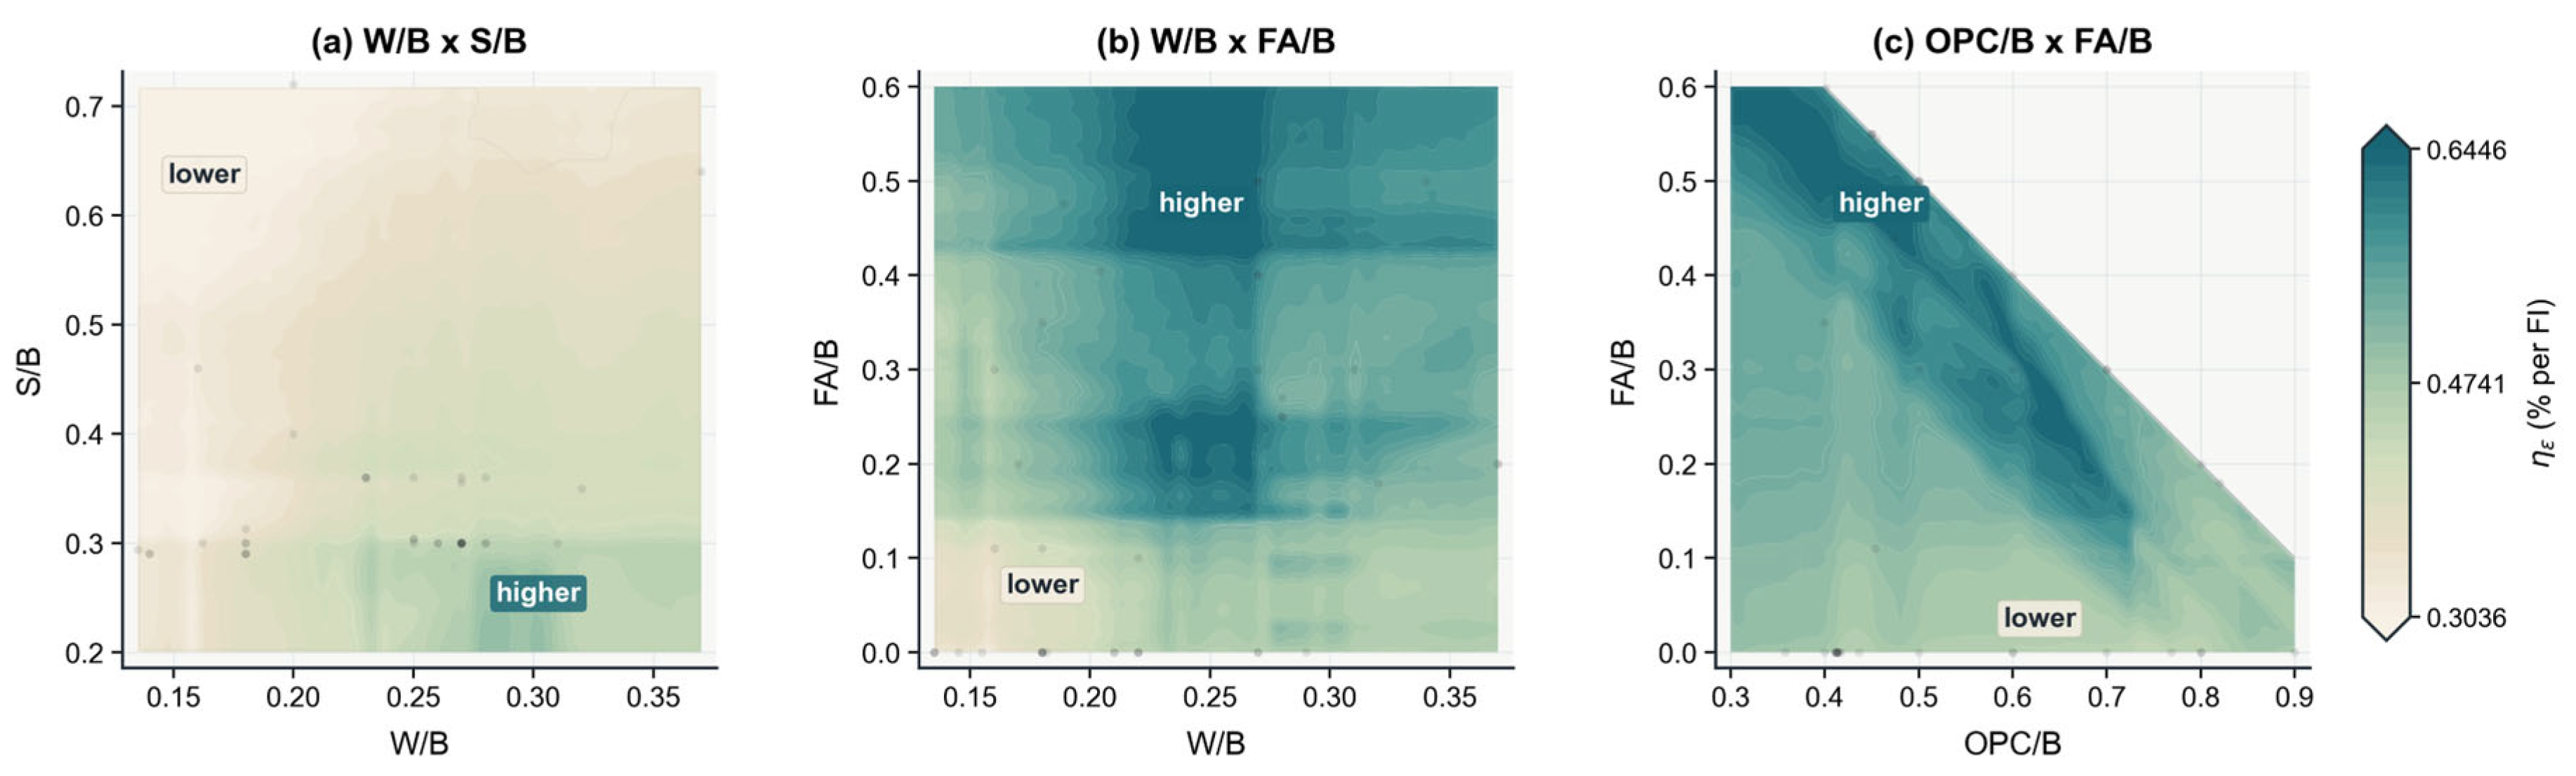
Figure 15.
First-cracking and peak tensile stresses: (a) ft versus ft0, colored by εt; (b) distribution of Δft; (c) Δft versus W/B, colored by S/B.
Figure 15.
First-cracking and peak tensile stresses: (a) ft versus ft0, colored by εt; (b) distribution of Δft; (c) Δft versus W/B, colored by S/B.
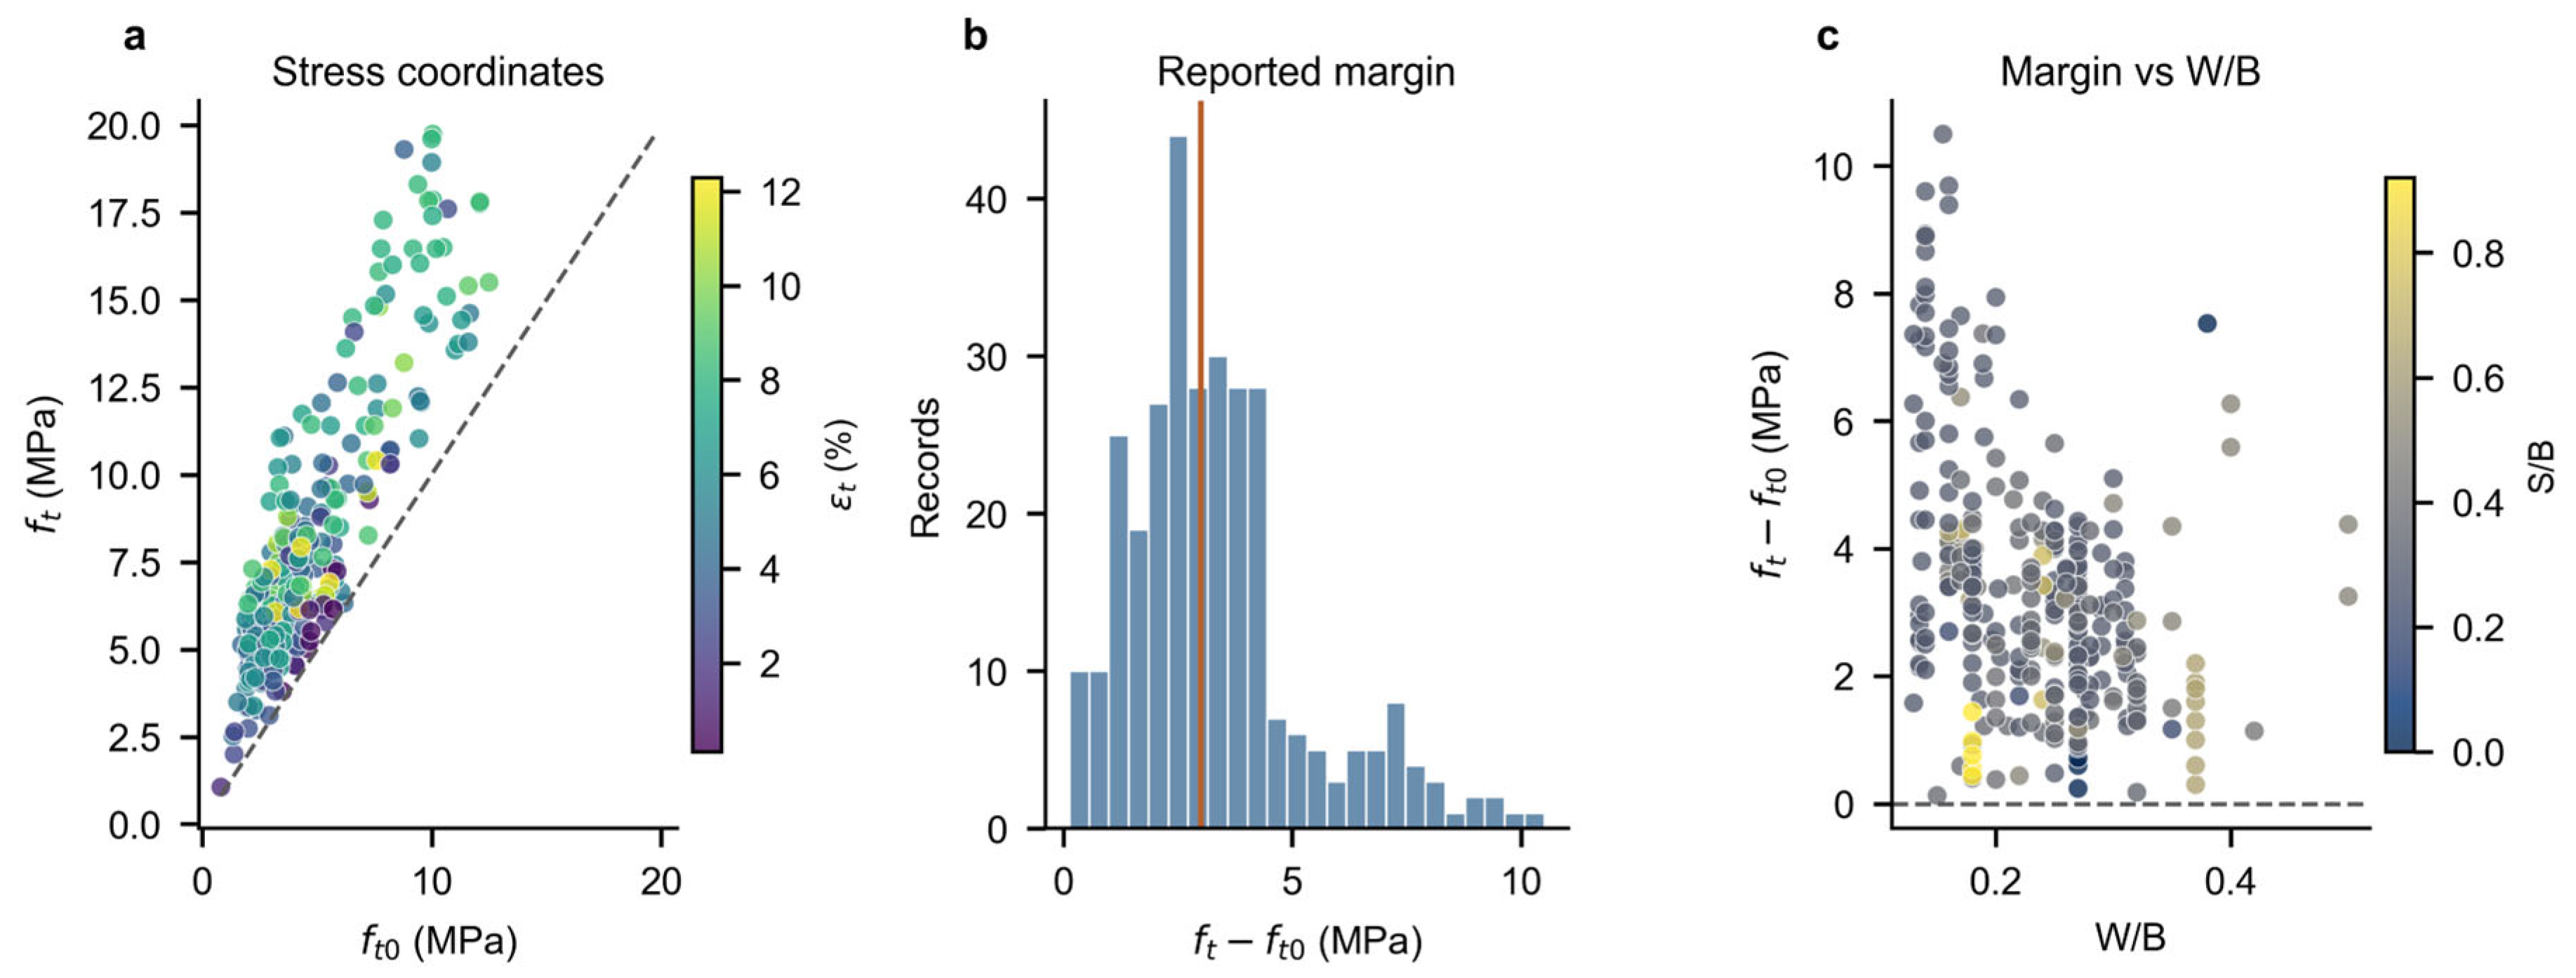
Figure 16.
Response surfaces of the four PE-ECC properties: (a) fc′ for W/B × SF/B; (b) εt for W/B × FA/B; (c) ft for W/B × S/B; (d) ft0 for W/B × S/B.
Figure 16.
Response surfaces of the four PE-ECC properties: (a) fc′ for W/B × SF/B; (b) εt for W/B × FA/B; (c) ft for W/B × S/B; (d) ft0 for W/B × S/B.
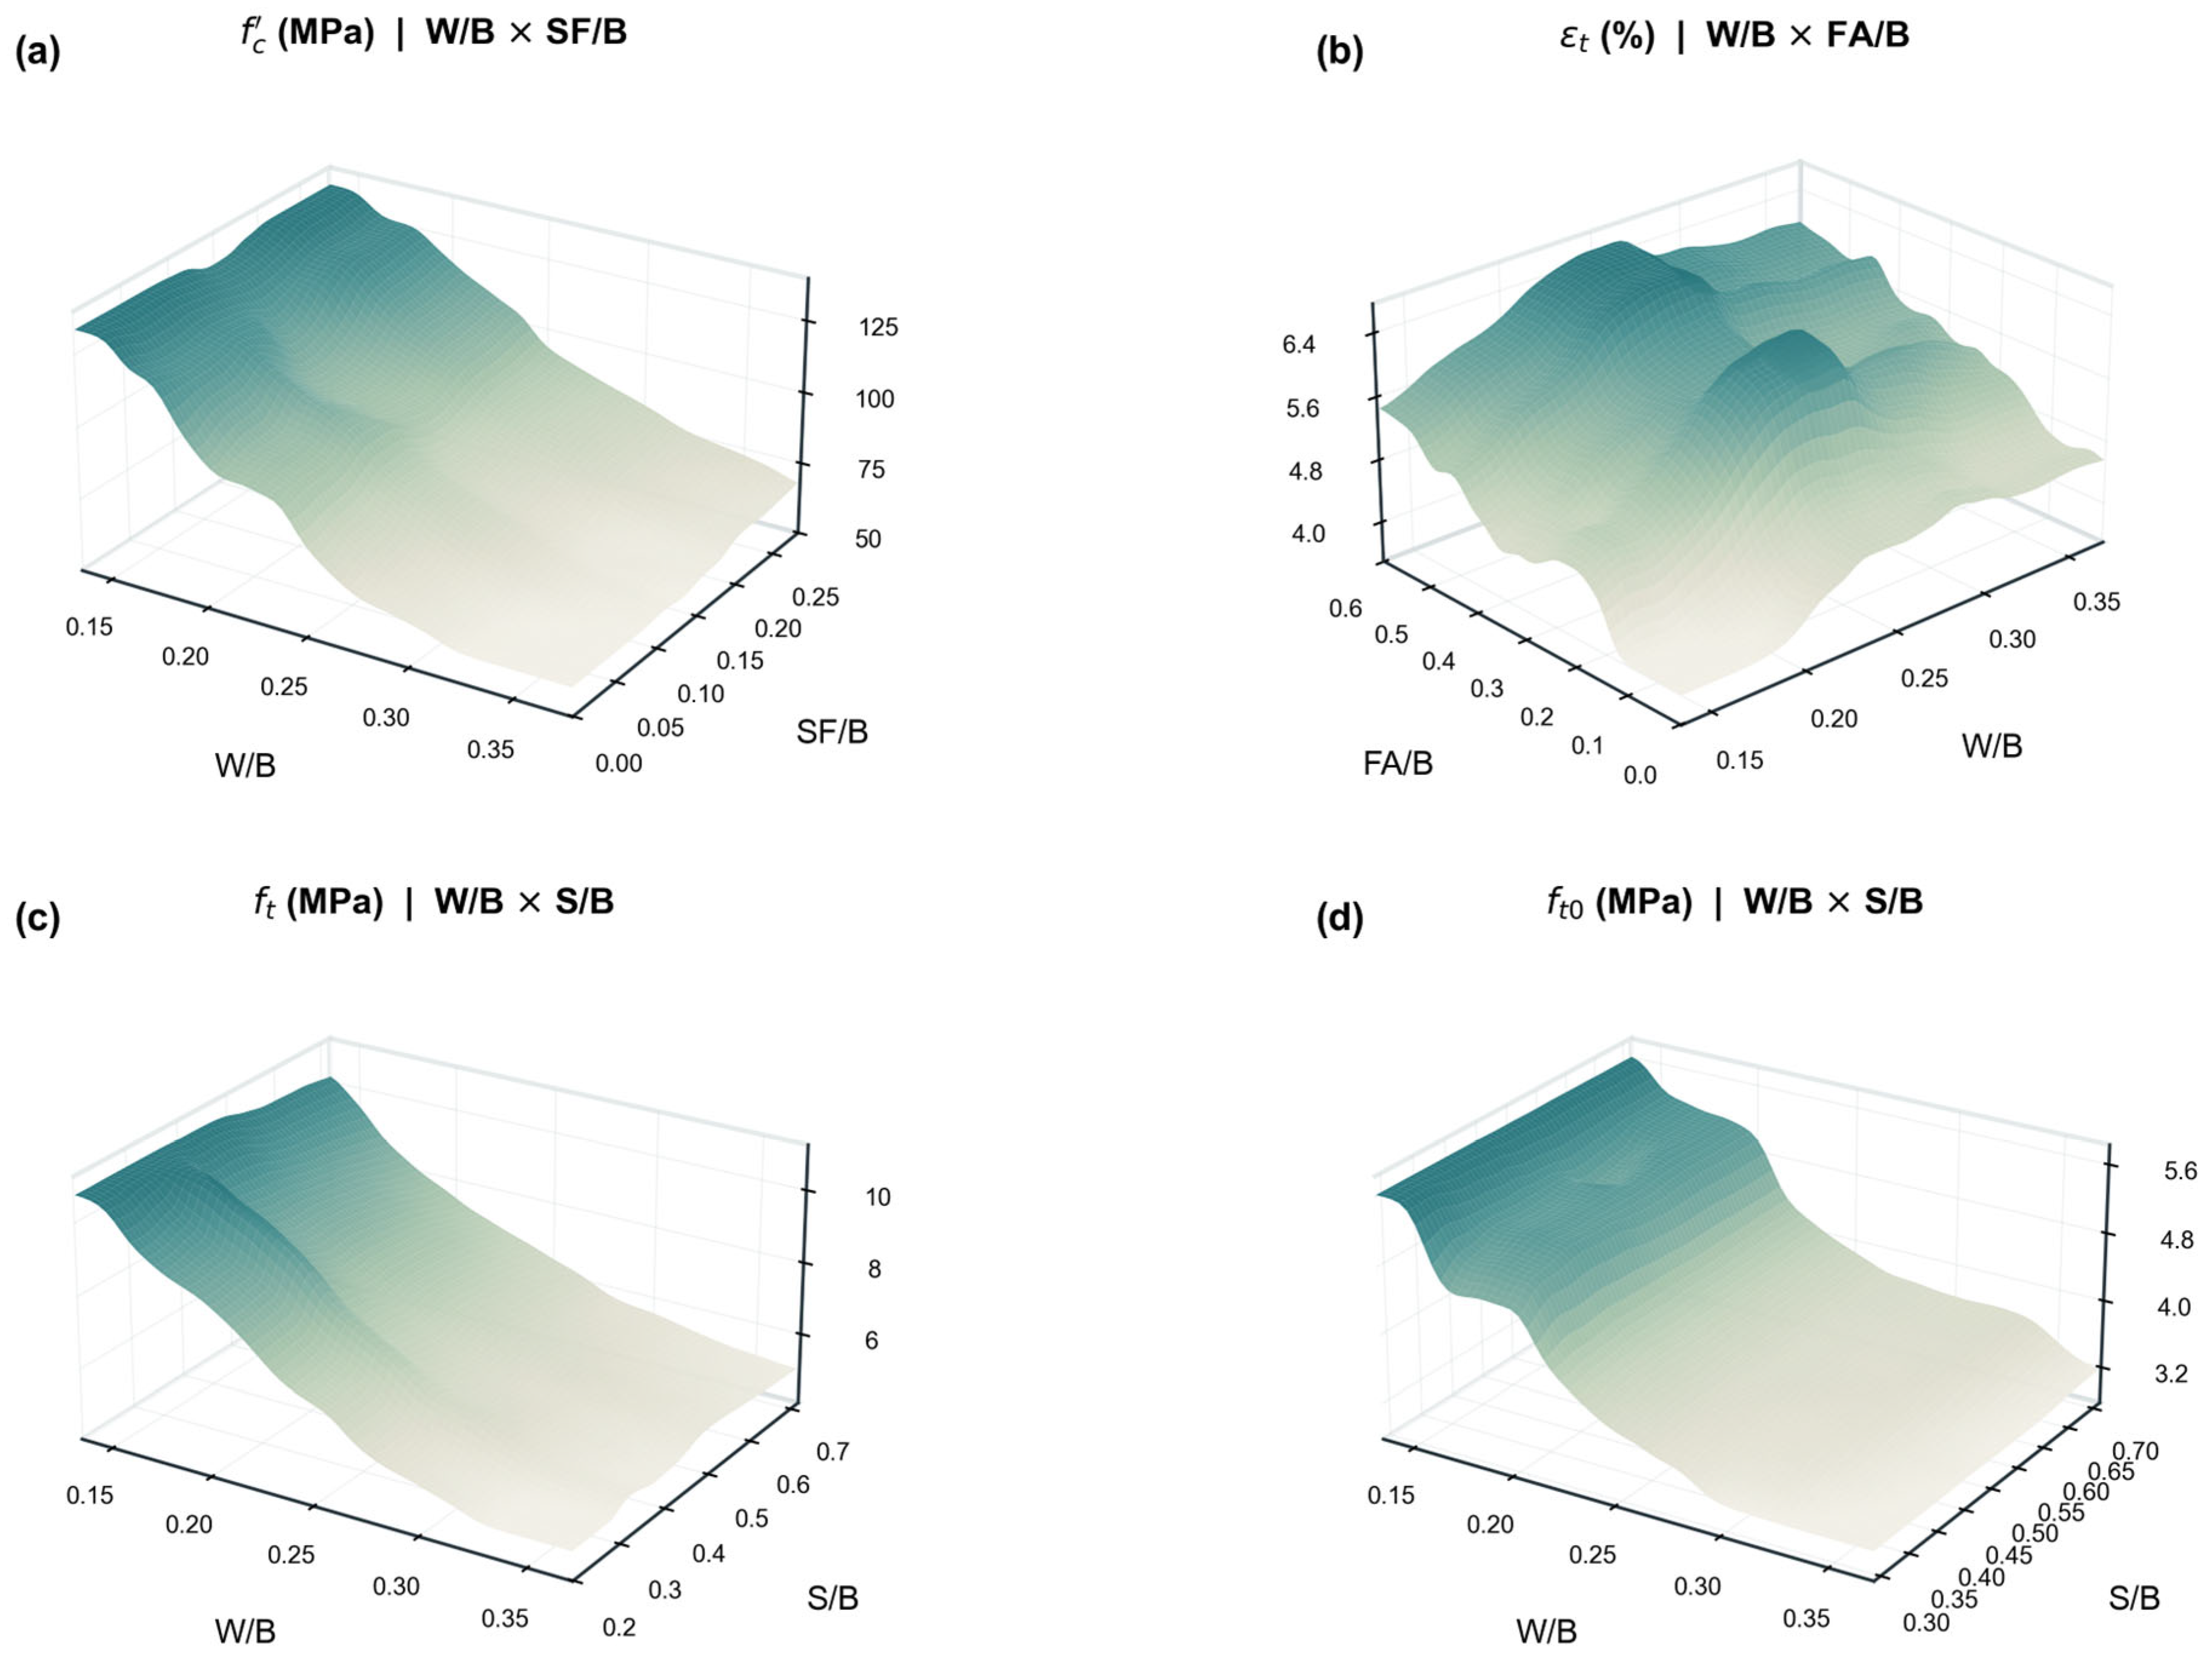
Figure 17.
Comparison of regions with high εt and ft in the reported data and model predictions: (a) reported records meeting both thresholds; (b) predicted records meeting both thresholds and their overlap with the reported set; (c) median differences in mixture and tensile variables normalized by the database IQR; (d) corresponding differences in binder fractions.
Figure 17.
Comparison of regions with high εt and ft in the reported data and model predictions: (a) reported records meeting both thresholds; (b) predicted records meeting both thresholds and their overlap with the reported set; (c) median differences in mixture and tensile variables normalized by the database IQR; (d) corresponding differences in binder fractions.
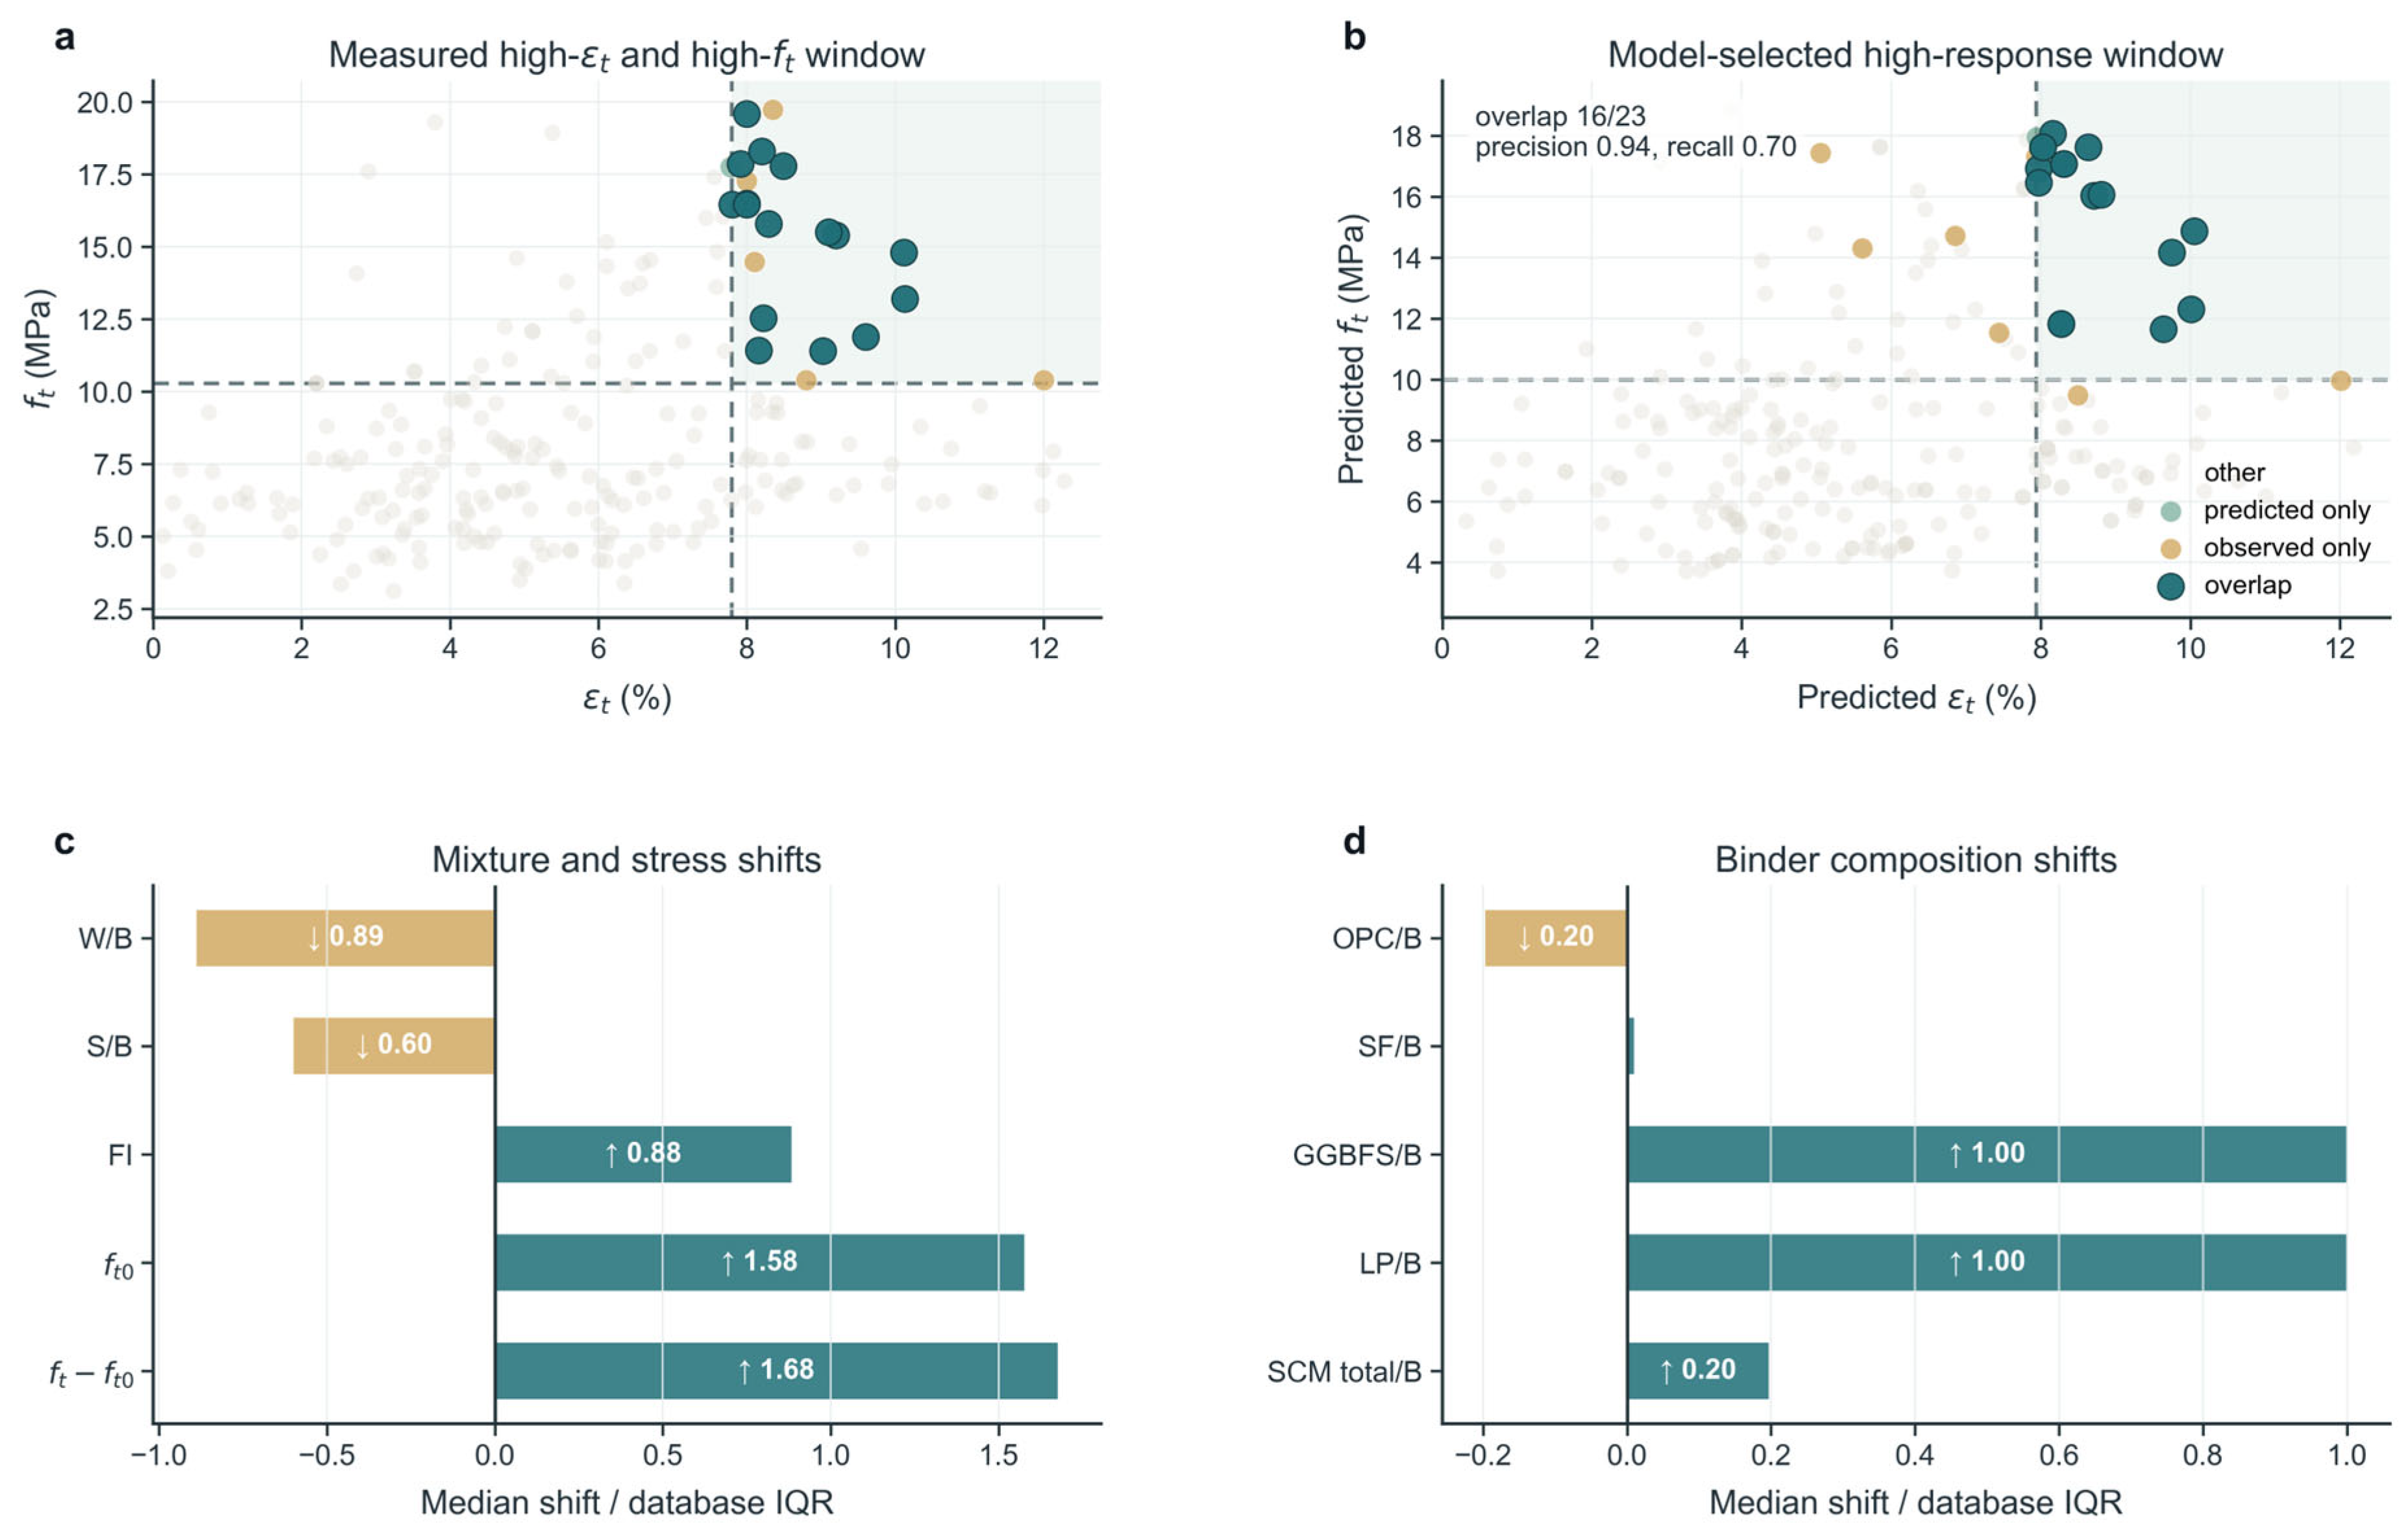
Figure 18.
Material-level EC and Cost of the virtual PE-ECC candidates that satisfy the applicability-domain and mechanical criteria.
Figure 18.
Material-level EC and Cost of the virtual PE-ECC candidates that satisfy the applicability-domain and mechanical criteria.
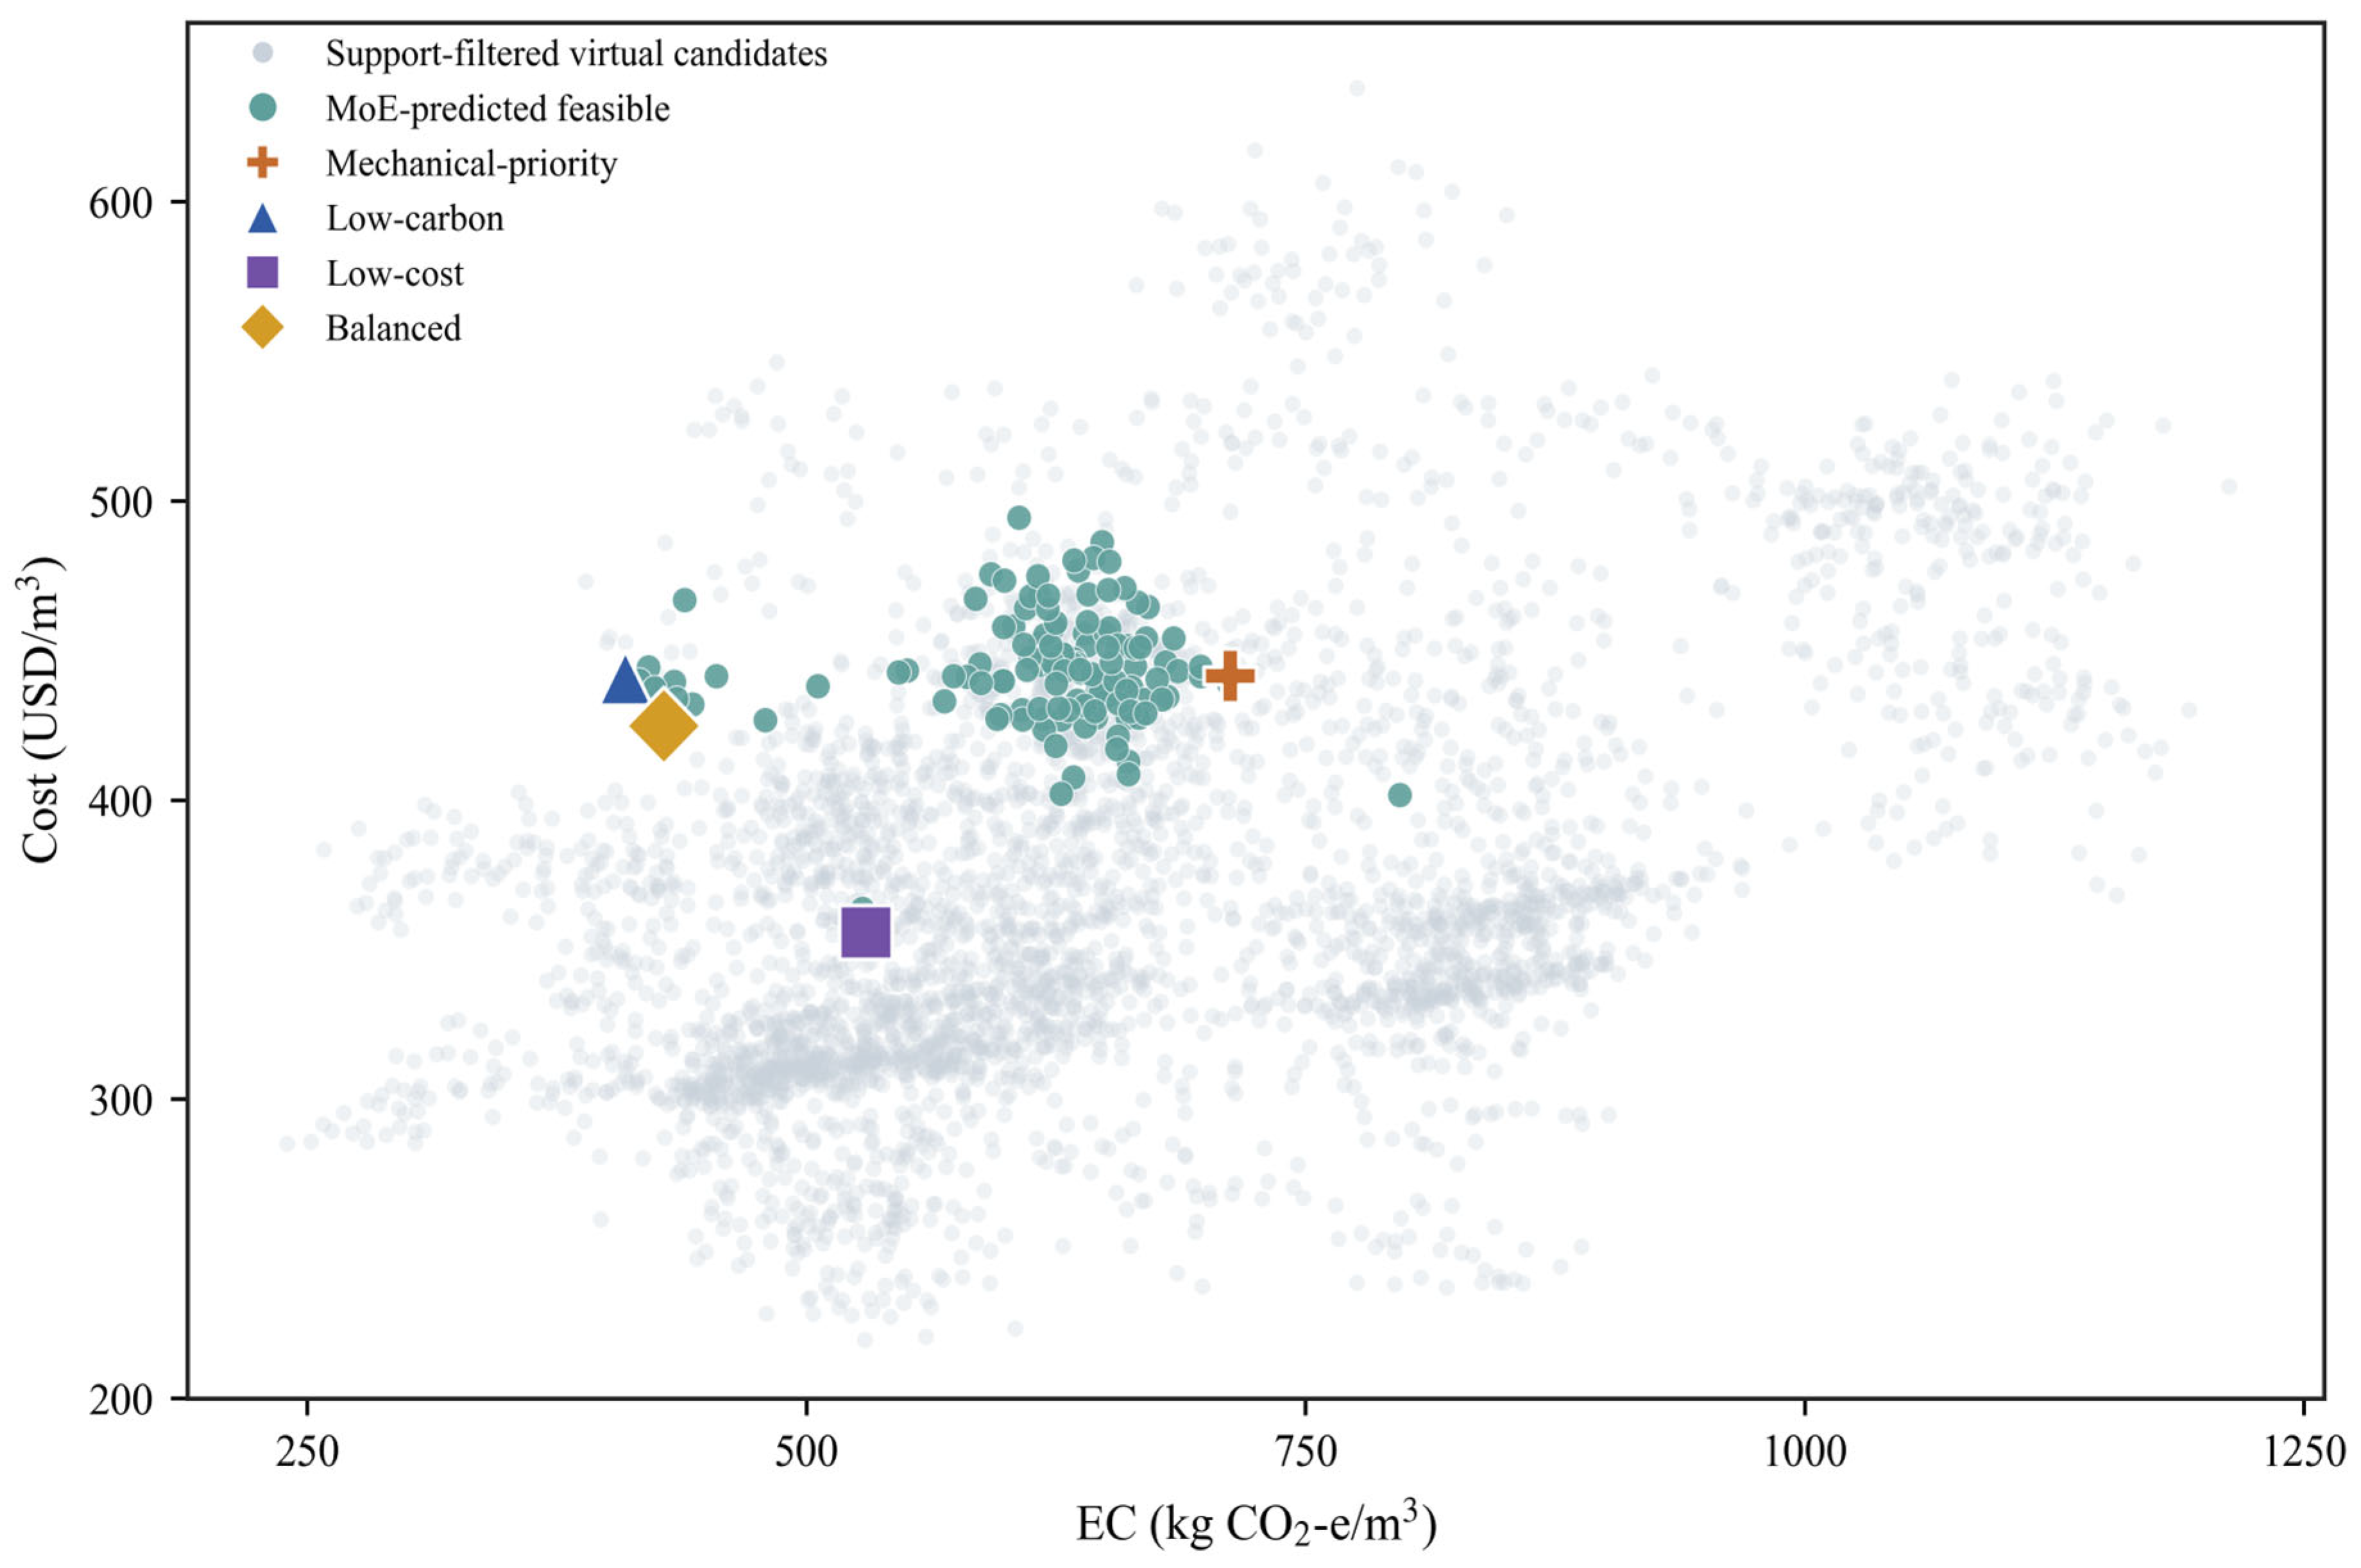

Table 1.
Target-specific model performance.
| Target | Valid n | R2 | RMSE | MAE |
| fc′ | 308 | 0.971 | 5.952 MPa | 1.226 MPa |
| εt | 368 | 0.950 | 0.562% | 0.305% |
| ft | 368 | 0.970 | 0.585 MPa | 0.307 MPa |
| ft0 | 304 | 0.954 | 0.449 MPa | 0.239 MPa |
Table 2.
Literature factors used for material-level EC and Cost estimation in virtual screening.
| Component | Symbol | Density (kg/m3) | EC factor (kg CO2-e/kg) | Cost factor (USD/kg) |
| Ordinary Portland cement | OPC | 3130 | 0.832 | 0.11 |
| Fly ash | FA | 2350 | 0.009 | 0.046 |
| Limestone powder | LP | 2700 | 0.017 | 0.122 |
| Ground granulated blast-furnace slag | GGBFS | 2880 | 0.019 | 0.10 |
| Silica fume | SF | 2170 | 0.0003 | 0.50 |
| Sand | S | 2640 | 0.0025 | 0.014 |
| Water | W | 1000 | 0.0003 | 0 |
| PE fiber | PE fiber | 970 | 4.08 | 11.0 |
Table 3.
Representative virtual PE-ECC candidates within the database-supported design space.
| Preference | W/B | S/B | SCMtotal | FI |
fc′ (MPa) |
εt (%) |
ft (MPa) |
ft0 (MPa) |
EC (kg CO2-e/m3) |
Cost (USD/m3) |
| Mechanical-priority | 0.140 | 0.31 | 0.55 | 18.00 | 140.2 | 8.26 | 19.13 | 9.81 | 712.3 | 441.5 |
| Low-carbon | 0.148 | 0.31 | 0.76 | 14.98 | 127.5 | 7.90 | 14.39 | 7.72 | 409.1 | 440.8 |
| Low-cost | 0.184 | 0.42 | 0.61 | 15.00 | 96.2 | 7.82 | 11.43 | 5.05 | 529.7 | 355.8 |
| Balanced | 0.140 | 0.30 | 0.76 | 14.91 | 128.6 | 8.10 | 16.06 | 7.86 | 428.3 | 424.9 |
Disclaimer/Publisher’s Note: The statements, opinions and data contained in all publications are solely those of the individual author(s) and contributor(s) and not of MDPI and/or the editor(s). MDPI and/or the editor(s) disclaim responsibility for any injury to people or property resulting from any ideas, methods, instructions or products referred to in the content. |
© 2026 by the authors. Licensee MDPI, Basel, Switzerland. This article is an open access article distributed under the terms and conditions of the Creative Commons Attribution (CC BY) license (http://creativecommons.org/licenses/by/4.0/).
Copyright: This open access article is published under a Creative Commons CC BY 4.0 license, which permit the free download, distribution, and reuse, provided that the author and preprint are cited in any reuse.


