

Submitted:
21 July 2026
Posted:
22 July 2026
You are already at the latest version
Abstract
Background: Dengue is one of the most important mosquito-borne viral diseases in Mexico, where transmission is shaped by complex interactions among environmental, demographic, urban, land-use, and climatic conditions. However, long-term national ecological analyses integrating these factors remain limited. This study evaluated ecological associations between environmental, demographic, urban, land-use, and climatic indicators and dengue incidence trends in Mexico from 1990 to 2021. Methods: A national ecological time-series study was conducted using annual aggregated data obtained from official public databases. Dengue fever and severe dengue incidence rates were analyzed in relation to environmental, land-use, urban, demographic, and climatic indicators. Exploratory simple and multiple linear regression analyses were performed, and autoregressive integrated moving average models with exogenous variables (ARIMAX) were used to evaluate temporal associations while accounting for autocorrelation. Results: In simple regression analyses, urban population, population density, renewable internal freshwater resources, forest area, and average annual temperature were significantly associated with dengue incidence. For severe dengue, renewable internal freshwater resources showed the highest explanatory capacity in simple regression analyses (R² = 0.33). In multivariable models, forest area remained positively associated with severe dengue incidence (β = 64.29; p = 0.006), whereas renewable internal freshwater resources showed an inverse association (β = −0.087; p = 0.002). After accounting for temporal autocorrelation, none of the environmental or demographic indicators remained statistically significant in ARIMAX models; however, renewable internal freshwater resources showed the strongest association with severe dengue incidence (p = 0.062). The severe dengue model included a significant first-order moving-average component (MA(1), p < 0.001), indicating short-term temporal dependence in annual incidence rates. Conclusions: Environmental, demographic, urban, land-use, and climatic indicators were associated with long-term national dengue incidence trends in Mexico. Renewable internal freshwater resources emerged as one of the most consistent ecological indicators across analyses, highlighting the relevance of water availability and management within integrated dengue prevention strategies. The temporal dependence observed for severe dengue suggests that ecological time-series analyses may contribute to improving epidemiological surveillance and generating hypotheses for future regional studies.
Keywords:
dengue virus
; arbovirus
; Aedes aegypti
; ecological study
; time-series analysis
; climate variability
; urbanization
; epidemiological surveillance
1. Introduction
Accelerated urban growth and environmental modifications have substantially transformed ecosystems worldwide during recent decades. Although urbanization has promoted economic development, infrastructure expansion, and improved access to services, it has also generated densely populated settlements with deficiencies in basic services and environmental degradation. These conditions may facilitate the transmission of infectious diseases [1,2].
Among these diseases, dengue represents one of the most important mosquito-borne viral infections worldwide. Dengue is caused by a flavivirus with four serotypes (DENV-1, DENV-2, DENV-3, and DENV-4) and is transmitted primarily by mosquitoes of the genus Aedes, particularly Aedes aegypti and Aedes albopictus. Clinically, the disease may range from mild febrile illness to severe and potentially fatal forms. During recent decades, dengue has shown marked geographic expansion, with recurrent epidemics and a sustained increase in cases in tropical and subtropical regions [3,4].
Several environmental, land-use, urban, demographic, and climatic factors have been associated with dengue transmission [5,6,7,8,9,10,11,12]. These factors include forest coverage, land-use changes, agricultural land use, accelerated urbanization, population density, demographic growth, and limitations in access to potable water. Climatic variables, particularly increasing temperature, also directly influence vector dynamics by favoring mosquito reproduction, survival, and viral transmission capacity [13,14,15,16,17].
Unplanned urbanization may facilitate vector proliferation through domestic water storage, accumulation of solid waste, and high concentrations of susceptible populations. In addition, environmental modification, land-use changes, and the expansion of peri-urban areas may promote the adaptation and dispersion of Aedes aegypti and Aedes albopictus, increasing the risk of transmission in new regions [5,6,37]. Likewise, environmental and land-use indicators may reflect broader ecological changes that influence vector habitats and human-vector interaction.
Environmental conditions may also influence dengue transmission through indirect mechanisms. Limited access to reliable freshwater resources may promote domestic water storage practices that create favorable breeding sites for Aedes mosquitoes. Similarly, changes in vegetation cover and land use may alter ecological conditions associated with vector distribution and transmission dynamics [38,39].
In Mexico, dengue remains one of the most important vector-borne public health problems. Although the highest burden has historically been concentrated in tropical and coastal regions, increasing human mobility, urban expansion, environmental modification, and climatic variability may contribute to the emergence and persistence of outbreaks in areas previously considered low risk [8,9,32,33,34].
Despite the recognized importance of these factors, information regarding their combined long-term association with dengue incidence in Mexico remains limited. Furthermore, few studies have integrated environmental, land-use, urban, demographic, and climatic indicators using long-term national ecological time-series analyses while accounting for temporal autocorrelation. Temporal dependence may influence observed associations in ecological datasets and should be considered when evaluating long-term trends. Therefore, the aim of this study was to evaluate ecological associations between environmental, demographic, and climatic indicators and dengue incidence at the national level in Mexico.
2. Materials and Methods
2.1. Study Design and Setting
An ecological retrospective time-series study was conducted in Mexico during the period 1990–2021 to evaluate the association between environmental, land-use, urban, demographic, and climatic variables and dengue incidence trends at the national level.
The study used aggregated annual data obtained from official public databases. The ecological approach was selected to evaluate long-term temporal patterns and population-level associations between environmental, demographic, climatic, and urban indicators and dengue incidence over time.
2.2. Data Sources and Variables
The dependent variable was the annual dengue incidence rate per 100,000 inhabitants. Data regarding annual dengue cases and incidence rates were obtained from the official epidemiological surveillance records of the Mexican Ministry of Health [19].
Data corresponding to dengue fever and dengue hemorrhagic fever were collected for the period 1990–2016. For the period 2017–2021, records of non-severe dengue, dengue with warning signs, and severe dengue were obtained. Due to changes in dengue clinical classification during the study period, non-severe dengue cases were grouped as dengue fever, whereas dengue with warning signs and severe dengue were grouped as severe dengue to maintain comparability across the study period.
Independent variables included environmental, land-use, urban, demographic, and climatic indicators.
Environmental and land-use variables included forest area (% of land area), permanent cropland (% of land area), and renewable internal freshwater resources per capita (m3).
Urban and demographic variables included population living in urban agglomerations of more than one million inhabitants, annual population growth (%), urban population (% of total population), and population density (inhabitants/km2).
Average annual temperature was included as a climatic variable.
Environmental, urban, and demographic variables were obtained from the World Bank Development Indicators database, whereas temperature data were obtained from the Mexican National Meteorological Service [20]. All data sources were official, publicly available, and open-access databases. The final analytical dataset used in all statistical analyses is provided as Supporting Information (S1 Dataset).
All data sources were official, publicly available, and open-access databases.
2.3. Statistical Analysis
Descriptive analyses were performed for all study variables. All variables included in the analyses are presented in S1 Dataset.
Exploratory simple and multiple linear regression analyses were conducted to evaluate associations between independent variables and dengue incidence rates.
Spearman correlation coefficients were calculated because several variables demonstrated non-normal distributions and long-term temporal trends. Statistical significance was established at an alpha level < 0.05.
Correlation matrices were additionally examined to evaluate the direction and magnitude of relationships among environmental, land-use, urban, demographic, and climatic variables. Correlation findings were considered during interpretation of multivariable regression coefficients. Results are presented in Supplementary Table S1.
Because several environmental, demographic, and climatic indicators demonstrated long-term temporal trends, time-series analyses were additionally performed using Autoregressive Integrated Moving Average models with exogenous variables (ARIMAX) to evaluate temporal associations between explanatory variables and dengue incidence trends while accounting for temporal autocorrelation.
Model selection was based on the Akaike Information Criterion (AIC).
Statistical analyses were conducted using R statistical software version 4.3.2 (2023-10-31 ucrt).The study adhered to the principles of the Declaration of Helsinki.
Because the study was based exclusively on aggregated secondary data obtained from publicly available official databases, no direct intervention involving human participants or identifiable personal information was performed. Therefore, informed consent was not required.
The study protocol was reviewed and approved by the Local Health Research Committee No. 3605 under institutional registration number R-2025-3605-007.
3. Results
3.1. Simple Linear Regression Analysis
In the exploratory simple linear regression analysis, average annual temperature demonstrated the highest explanatory capacity for dengue fever incidence, with an R2 value of 0.20, indicating that approximately 20% of the observed variability in dengue fever incidence could be explained by this variable (Table 1).
Urban population and population density demonstrated positive and statistically significant associations with dengue fever incidence. In contrast, freshwater availability per capita and forest area showed negative coefficients, suggesting inverse associations with dengue incidence.
For severe dengue incidence, most evaluated variables demonstrated statistically significant associations. Freshwater availability exhibited the greatest explanatory capacity, with an R2 of 0.33, indicating that approximately 33% of the observed variability in severe dengue incidence could be explained by this variable.
Forest area demonstrated negative coefficients in both dengue fever and severe dengue models, whereas permanent cropland demonstrated positive coefficients, suggesting higher incidence rates in areas with greater proportions of agricultural land use. Average annual temperature also showed positive associations with both dengue fever and severe dengue incidence.
Correlation analyses revealed strong correlations among several environmental, urban, and demographic indicators, particularly between forest area, freshwater availability, urban population, and population density (Supplementary Table S1). These findings suggest substantial interrelationships among explanatory variables and provide context for the interpretation of subsequent multivariable analyses.
3.2. Multiple Linear Regression Analysis
In exploratory multivariable regression models, forest area, freshwater availability, population density, and average annual temperature demonstrated the greatest contribution to overall model fit. The explanatory capacity of the model was greater for severe dengue, with an adjusted R2 of 0.463, indicating that approximately 46% of the observed variability in incidence rates was explained by the included variables. For dengue fever incidence, the adjusted R2 was 0.205 (Table 2).
In the severe dengue model, forest area demonstrated a positive association after multivariable adjustment (β = 64.29; p = 0.006), whereas freshwater availability demonstrated a negative association (β = -0.087; p = 0.002). In contrast, population density and average annual temperature were not significantly associated with severe dengue incidence after adjustment.
For dengue fever incidence, none of the evaluated variables remained statistically significant in the multivariable model. Overall, the severe dengue model demonstrated greater explanatory capacity than the dengue fever model, as reflected by higher adjusted R2 values and stronger overall model significance.
3.3. ARIMAX Models
ARIMAX models were developed to evaluate temporal associations between environmental, land-use, urban, demographic, and climatic variables and dengue incidence trends while accounting for temporal autocorrelation. The dengue fever model corresponded to an ARIMA(0,0,0) model with exogenous regressors, whereas the severe dengue model corresponded to an ARIMA(0,0,1) model incorporating a first-order moving-average component (Table 3).
Observed and ARIMAX-adjusted incidence rates are presented in Figure 1 and Figure 2. Figure 1 shows the temporal evolution of dengue fever incidence, whereas Figure 2 presents severe dengue incidence rates during the study period.
Forest area demonstrated positive coefficients in both ARIMAX models, whereas freshwater availability demonstrated negative coefficients, indicating inverse temporal associations with dengue incidence. Population density showed positive coefficients in both models, while average annual temperature demonstrated a positive coefficient in the dengue fever model and a slightly negative coefficient in the severe dengue model.
After accounting for temporal autocorrelation, none of the exogenous variables remained statistically significant at the conventional 0.05 level. However, freshwater availability showed the strongest association with severe dengue incidence (p = 0.062).
The severe dengue model demonstrated better overall fit than the dengue fever model, as reflected by lower AIC and BIC values. In addition, the MA(1) parameter was statistically significant (p < 0.001), suggesting the presence of short-term temporal dependence in severe dengue incidence rates.
Temporal analyses demonstrated cyclical fluctuations in dengue incidence, with recurrent epidemic peaks observed throughout the study period.
4. Discussion
The present study evaluated the association between environmental, land-use, urban, demographic, and climatic variables and dengue incidence trends in Mexico during the period 1990–2021. Overall, the findings suggest that urbanization, freshwater availability, environmental conditions, and land-use changes may contribute to dengue transmission dynamics in Mexico.
Previous studies conducted in Taiwan, Vietnam, Brazil, Colombia, and other endemic regions have reported associations between urbanization, population density, climatic variability, and dengue incidence [10,11,13,14,26,27]. Similarly, our results showed positive associations between urban population indicators, population density, and dengue incidence rates. These findings support the important role of urban environments in dengue transmission, where high population density and increased human–vector contact may facilitate virus circulation. However, the associations observed with environmental and land-use indicators suggest that dengue transmission dynamics are influenced by a broader set of ecological and demographic factors.
An important finding of this study was the consistent inverse association observed between freshwater availability and dengue incidence. Although the strength of this association varied across analytical approaches, freshwater availability remained one of the most consistent indicators throughout the study. This finding is biologically plausible because limited access to reliable water sources may promote household water-storage practices that create favorable breeding sites for Aedes mosquitoes [39]. These results highlight the potential importance of water access and water-management policies as complementary components of dengue prevention and control strategies.
Environmental and land-use indicators also demonstrated associations with dengue incidence. Forest area showed inverse associations in simple regression analyses but positive associations in multivariable models, particularly for severe dengue. This apparent inconsistency may reflect the complex interrelationships among environmental, demographic, and climatic variables, as well as differences between unadjusted and adjusted analyses. Forest coverage may therefore represent broader ecological and environmental processes that influence mosquito habitats, vector adaptation, and human exposure.
One possible explanation involves the ecological plasticity of Aedes albopictus, a mosquito species capable of colonizing peri-urban and vegetated environments [38]. Unlike Aedes aegypti, A. albopictus can utilize natural breeding sites such as tree holes and may facilitate dengue transmission in areas located near forest ecosystems. Consequently, environmental modification and land-use changes may alter transmission dynamics through multiple ecological pathways.
Average annual temperature was positively associated with dengue incidence in simple regression analyses. This observation is consistent with previous studies showing that increasing temperatures may accelerate mosquito development, shorten the extrinsic incubation period of the virus, and increase biting frequency and vector survival. However, these associations were less evident after multivariable adjustment and time-series analyses, suggesting that temperature likely interacts with other environmental and demographic factors rather than acting independently.
The significant temporal component identified in the severe dengue model suggests that dengue incidence may be influenced by processes operating across consecutive years. Although the present study was not designed to evaluate predictive relationships between epidemic periods, this finding is consistent with the cyclical behavior of dengue observed in endemic regions and recently documented in Mexico. Factors such as population immunity, serotype circulation, vector abundance, and environmental conditions may contribute to temporal patterns that extend beyond a single transmission season [40,41,42]. These temporal dependencies could potentially contribute to the development of early-warning systems for severe dengue outbreaks and should be explored in future studies.
The present study has several limitations. First, its ecological design may be subject to ecological fallacy because analyses were conducted using aggregated national-level indicators rather than individual-level data. Second, Because analyses were conducted using national annual aggregated data, the study was not designed to evaluate subnational heterogeneity or identify local determinants of dengue transmission. Therefore, the observed associations should be interpreted as ecological relationships at the national level rather than causal determinants operating within individual states or municipalities. Third, changes in dengue clinical classification during the study period may have affected temporal comparability. Finally, additional environmental, socioeconomic, and vector-related factors not included in this study may also influence dengue transmission dynamics.
Despite these limitations, the study provides valuable long-term evidence regarding the relationship between environmental, land-use, urban, demographic, and climatic factors and dengue incidence in Mexico. The findings suggest that environmental conditions, freshwater availability, urbanization, and land-use changes may contribute to dengue transmission dynamics. Strengthening environmental surveillance, improving access to potable water, monitoring urban expansion, and integrating climatic indicators into epidemiological early-warning systems may contribute to dengue prevention and control strategies.
Future studies incorporating regional analyses, vector distribution, viral serotypes, socioeconomic indicators, and higher-resolution environmental data are needed to better understand the complex determinants of dengue transmission and to improve forecasting and early-warning systems in Mexico.
5. Conclusions
Environmental, land-use, urban, demographic, and climatic factors demonstrated associations with dengue incidence trends in Mexico during the period 1990–2021.
Freshwater availability, urbanization, forest coverage, and environmental conditions were associated with long-term national trends in dengue incidence.. These findings suggest that environmental surveillance, improved access to potable water, and monitoring of urban and land-use changes may contribute to dengue prevention and control strategies.
The temporal dependence observed in severe dengue models suggests that dengue transmission may be influenced by processes operating across consecutive years. Understanding these temporal patterns may contribute to the development of epidemiological early-warning systems.
Supplementary Materials
The following supporting information can be downloaded at the website of this paper posted on Preprints.org, S1 Dataset. Annual dengue incidence rates and environmental, land-use, urban, demographic, and climatic indicators used in the analyses, Mexico, 1990–2021.
Funding
This study did not receive external funding. All project-related expenses were covered by the investigators.
References
- Misslin R, Telle O, Daudé E, Vaguet A, Paul RE. Urban climate versus global climate change-what makes the difference for dengue? Ann N Y Acad Sci. 2016;1382(1):56-72. [CrossRef]
- Yin S, Ren C, Shi Y, Hua J, Yuan HY, Tian LW. A systematic review on modeling methods and influential factors for mapping dengue-related risk in urban settings. Int J Environ Res Public Health. 2022;19(22):15265. [CrossRef]
- Akter R, Hu W, Naish S, Banu S, Tong S. Joint effects of climate variability and socioecological factors on dengue transmission: epidemiological evidence. Trop Med Int Health. 2017;22(6):656-669. [CrossRef]
- Abdullah NAMH, Dom NC, Salleh SA, Dapari R, Precha N. Dengue’s climate conundrum: how vegetation and temperature shape mosquito populations and disease outbreaks. BMC Public Health. 2025;25(1):4. [CrossRef]
- Joyce AL, Alvarez FS, Hernandez E. Forest coverage and socioeconomic factors associated with dengue in El Salvador, 2011-2013. Vector Borne Zoonotic Dis. 2021;21(8):602-613. [CrossRef]
- Gao P, Pilot E, Rehbock C, Gontariuk M, Doreleijers S, Wang L, et al. Land use and land cover change and its impacts on dengue dynamics in China: a systematic review. PLoS Negl Trop Dis. 2021;15(10):e0009879. [CrossRef]
- Seidahmed OME, Lu D, Chong CS, Ng LC, Eltahir EAB. Patterns of urban housing shape dengue distribution in Singapore at neighborhood and country scales. Geohealth. 2018;2(1):54-67. [CrossRef]
- Gibb R, Colón-González FJ, Lan PT, Huong PT, Nam VS, Duoc VT, et al. Interactions between climate change, urban infrastructure and mobility are driving dengue emergence in Vietnam. Nat Commun. 2023;14(1):8179. [CrossRef]
- Struchiner CJ, Rocklöv J, Wilder-Smith A, Massad E. Increasing dengue incidence in Singapore over the past 40 years: population growth, climate and mobility. PLoS One. 2015;10(8):e0136286. [CrossRef]
- Lin PS, Liu WL, Chen CD, Wen TH, Chen CH, Chen LW, et al. Micro-scale urbanization-based risk factors for dengue epidemics. Int J Biometeorol. 2024;68(1):133-141. [CrossRef]
- Nguyen-Tien T, Do DC, Le XL, Dinh TH, Lindeborg M, Nguyen-Viet H, et al. Risk factors of dengue fever in an urban area in Vietnam: a case-control study. BMC Public Health. 2021;21(1):664. [CrossRef]
- Tauil PL. Urbanização e ecologia do dengue. Cad Saude Publica. 2001;17 Suppl:99-102.
- Masrani AS, Nik Husain NR, Musa KI, Yasin AS. Trends and spatial pattern analysis of dengue cases in Northeast Malaysia. J Prev Med Public Health. 2022;55(1):80-87. [CrossRef]
- Santos JPC, Honório NA, Barcellos C, Nobre AA. A perspective on inhabited urban space: land use and occupation, heat islands, and precarious urbanization as determinants of territorial receptivity to dengue in the city of Rio de Janeiro. Int J Environ Res Public Health. 2020;17(18):6537. [CrossRef]
- Wu PC, Lay JG, Guo HR, Lin CY, Lung SC, Su HJ. Higher temperature and urbanization affect the spatial patterns of dengue fever transmission in subtropical Taiwan. Sci Total Environ. 2009;407(7):2224-2233. [CrossRef]
- Agha SB, Tchouassi DP, Turell MJ, Bastos ADS, Sang R. Entomological assessment of dengue virus transmission risk in three urban areas of Kenya. PLoS Negl Trop Dis. 2019;13(8):e0007686. [CrossRef]
- Ho SH, Lim JT, Ong J, Hapuarachchi HC, Sim S, Ng LC. Singapore’s 5 decades of dengue prevention and control-Implications for global dengue control. PLoS Negl Trop Dis. 2023;17(6):e0011400. [CrossRef]
- World Bank Group. World Development Indicators [Internet]. Available from: https://data.worldbank.org/indicator.
- Dirección General de Epidemiología. Boletín epidemiológico de las enfermedades sujetas a vigilancia epidemiológica [Internet]. Disponible en: https://www.gob.mx/salud/documentos/boletinepidemiologico-sistema-nacional-de-vigilancia-epidemiologica-sistema-unico-de-informacion-261547.
- Servicio Meteorológico Nacional. Normales climatológicas y registros históricos de temperatura [Internet]. Comisión Nacional del Agua. Disponible en: https://smn.conagua.gob.mx/.
- Kuri-Morales P, Correa-Morales F, González-Acosta C, Sánchez-Tejeda G, Dávalos-Becerril E, Juárez-Franco MF, et al. First report of Stegomyia aegypti (=Aedes aegypti) in Mexico City, Mexico. Med Vet Entomol. 2017;31:240-242.
- Dávalos-Becerril E, Correa-Morales F, González-Acosta C, Santos-Luna R, Peralta-Rodríguez J, Pérez-Rentería C, et al. Urban and semi-urban mosquitoes of Mexico City: a risk for endemic mosquito-borne disease transmission. PLoS One. 2019;14:e0212987.
- Gutiérrez B, da Silva Candido D, Bajaj S, Rodriguez Maldonado AP, Ayala FG, Rodriguez MLT, et al. Convergent trends and spatiotemporal patterns of Aedes-borne arboviruses in Mexico and Central America. PLoS Negl Trop Dis. 2023;17(9):e0011169. [CrossRef]
- Mejía-Guevara MD, Correa-Morales F, González-Acosta C, Dávalos-Becerril E, Peralta-Rodríguez JL, Martínez-Gaona A, et al. El mosquito del dengue en la Ciudad de México. Invasión incipiente de Aedes aegypti y sus potenciales riesgos. Gac Med Mex. 2020;156(5):388-395. [CrossRef]
- Hernández Bautista PF, Cabrera Gaytán DA, Vallejos Parás A, Alejo Martínez OM, Arriaga Nieto L, Rocha Reyes BL, et al. Correlation of geographic variables with the incidence rate of dengue fever in Mexico: a 38-year study. Microorganisms. 2024;12(12):2661. [CrossRef]
- Barcellos C, Matos V, Lana RM, Lowe R. Climate change, thermal anomalies, and the recent progression of dengue in Brazil. Sci Rep. 2024;14(1):5948. [CrossRef]
- Shragai T, Pérez-Pérez J, Del Pilar Quimbayo-Forero M, Rojo R, Harrington LC, Rúa-Uribe G. Distance to public transit predicts spatial distribution of dengue virus incidence in Medellín, Colombia. Sci Rep. 2022;12(1):8333. [CrossRef]
- Liu K, Zhu Y, Xia Y, Zhang Y, Huang X, Huang J, et al. Dynamic spatiotemporal analysis of indigenous dengue fever at street-level in Guangzhou city, China. PLoS Negl Trop Dis. 2018;12(3):e0006318. [CrossRef]
- De Agustín M, Acero JL, Aguilera AI, Garcia Lozano M. Central America Urbanization Review: Making Cities Work for Central America. Washington (DC): World Bank; 2017.
- Instituto Nacional de Estadística y Geografía. Población rural y rural ampliada en México, 2000 [Internet]. Disponible en: https://www.inegi.org.mx/.
- Ren H, Wu W, Li T, Yang Z. Urban villages as transfer stations for dengue fever epidemic: a case study in Guangzhou, China. PLoS Negl Trop Dis. 2019;13(4):e0007350.
- Delmelle E, Hagenlocher M, Kienberger S, Casas I. A spatial model of socioeconomic and environmental determinants of dengue fever in Cali, Colombia. Acta Trop. 2016;164:169-176.
- Kolimenakis A, Heinz S, Wilson ML, Winkler V, Yakob L, Michaelakis A, et al. The role of urbanisation in the spread of Aedes mosquitoes and the diseases they transmit—A systematic review. PLoS Negl Trop Dis. 2021;15(9):e0009631. [CrossRef]
- Dzul-Manzanilla F, Correa-Morales F, Che-Mendoza A, Palacio-Vargas J, Sánchez-Tejeda G, González-Roldan JF, et al. Identifying urban hotspots of dengue, chikungunya, and Zika transmission in Mexico to support risk stratification efforts: a spatial analysis. Lancet Planet Health. 2021;5(5):e277-e285.
- Mendoza-Cano O, Danis-Lozano R, Trujillo X, Huerta M, Ríos-Silva M, Lugo-Radillo A, et al. Spatial patterns and clustering of dengue incidence in Mexico: analysis of Moran’s index across 2,471 municipalities from 2022 to 2024. PLoS One. 2025;20(5):e0324754. [CrossRef]
- Dirección General de Epidemiología. Panorama Epidemiológico de Dengue. México, 2022-2024 [Internet]. Disponible en: https://www.gob.mx/salud/acciones-y-programas/informacion-epidemiologica.
- Instituto de Salud Carlos III. Protocolo de vigilancia del dengue. España, julio de 2024 [Internet]. Disponible en: https://cne.isciii.es/servicios/enfermedades-transmisibles/enfermedades-a-z/dengue.
- Benedict MQ, Levine RS, Hawley WA, Lounibos LP. Spread of Aedes albopictus and Aedes aegypti in the Americas. Vector Borne Zoonotic Dis. 2007;7(1):76-85.
- Gubler DJ. Dengue, urbanization and globalization: the unholy trinity of the 21st century. Trop Med Health. 2011;39(4 Suppl):3-11.
- Reich NG, Shrestha S, King AA, Rohani P, Lessler J, Kalayanarooj S, et al. Interactions between serotypes of dengue highlight epidemiological impact of cross-immunity. J R Soc Interface. 2013;10(86):20130414. [CrossRef]
- Briseno-Ramirez J, De Arcos-Jiménez JC, López-Yáñez AM, Damián-Negrete RM, Vargas-Becerra PN, Salas-Salazar LK, et al. Trends and cyclical patterns of dengue disease in Mexico: A 40-year time series analysis. Ann Epidemiol. 2025;112:53-63. [CrossRef]
- Lourenço J, Recker M. Dengue serotype immune-interactions and their consequences for vaccine impact predictions. Epidemics. 2016;16:40-48. [CrossRef]
Figure 1.
Observed and ARIMAX-adjusted dengue fever incidence rates in Mexico, 1990–2021.
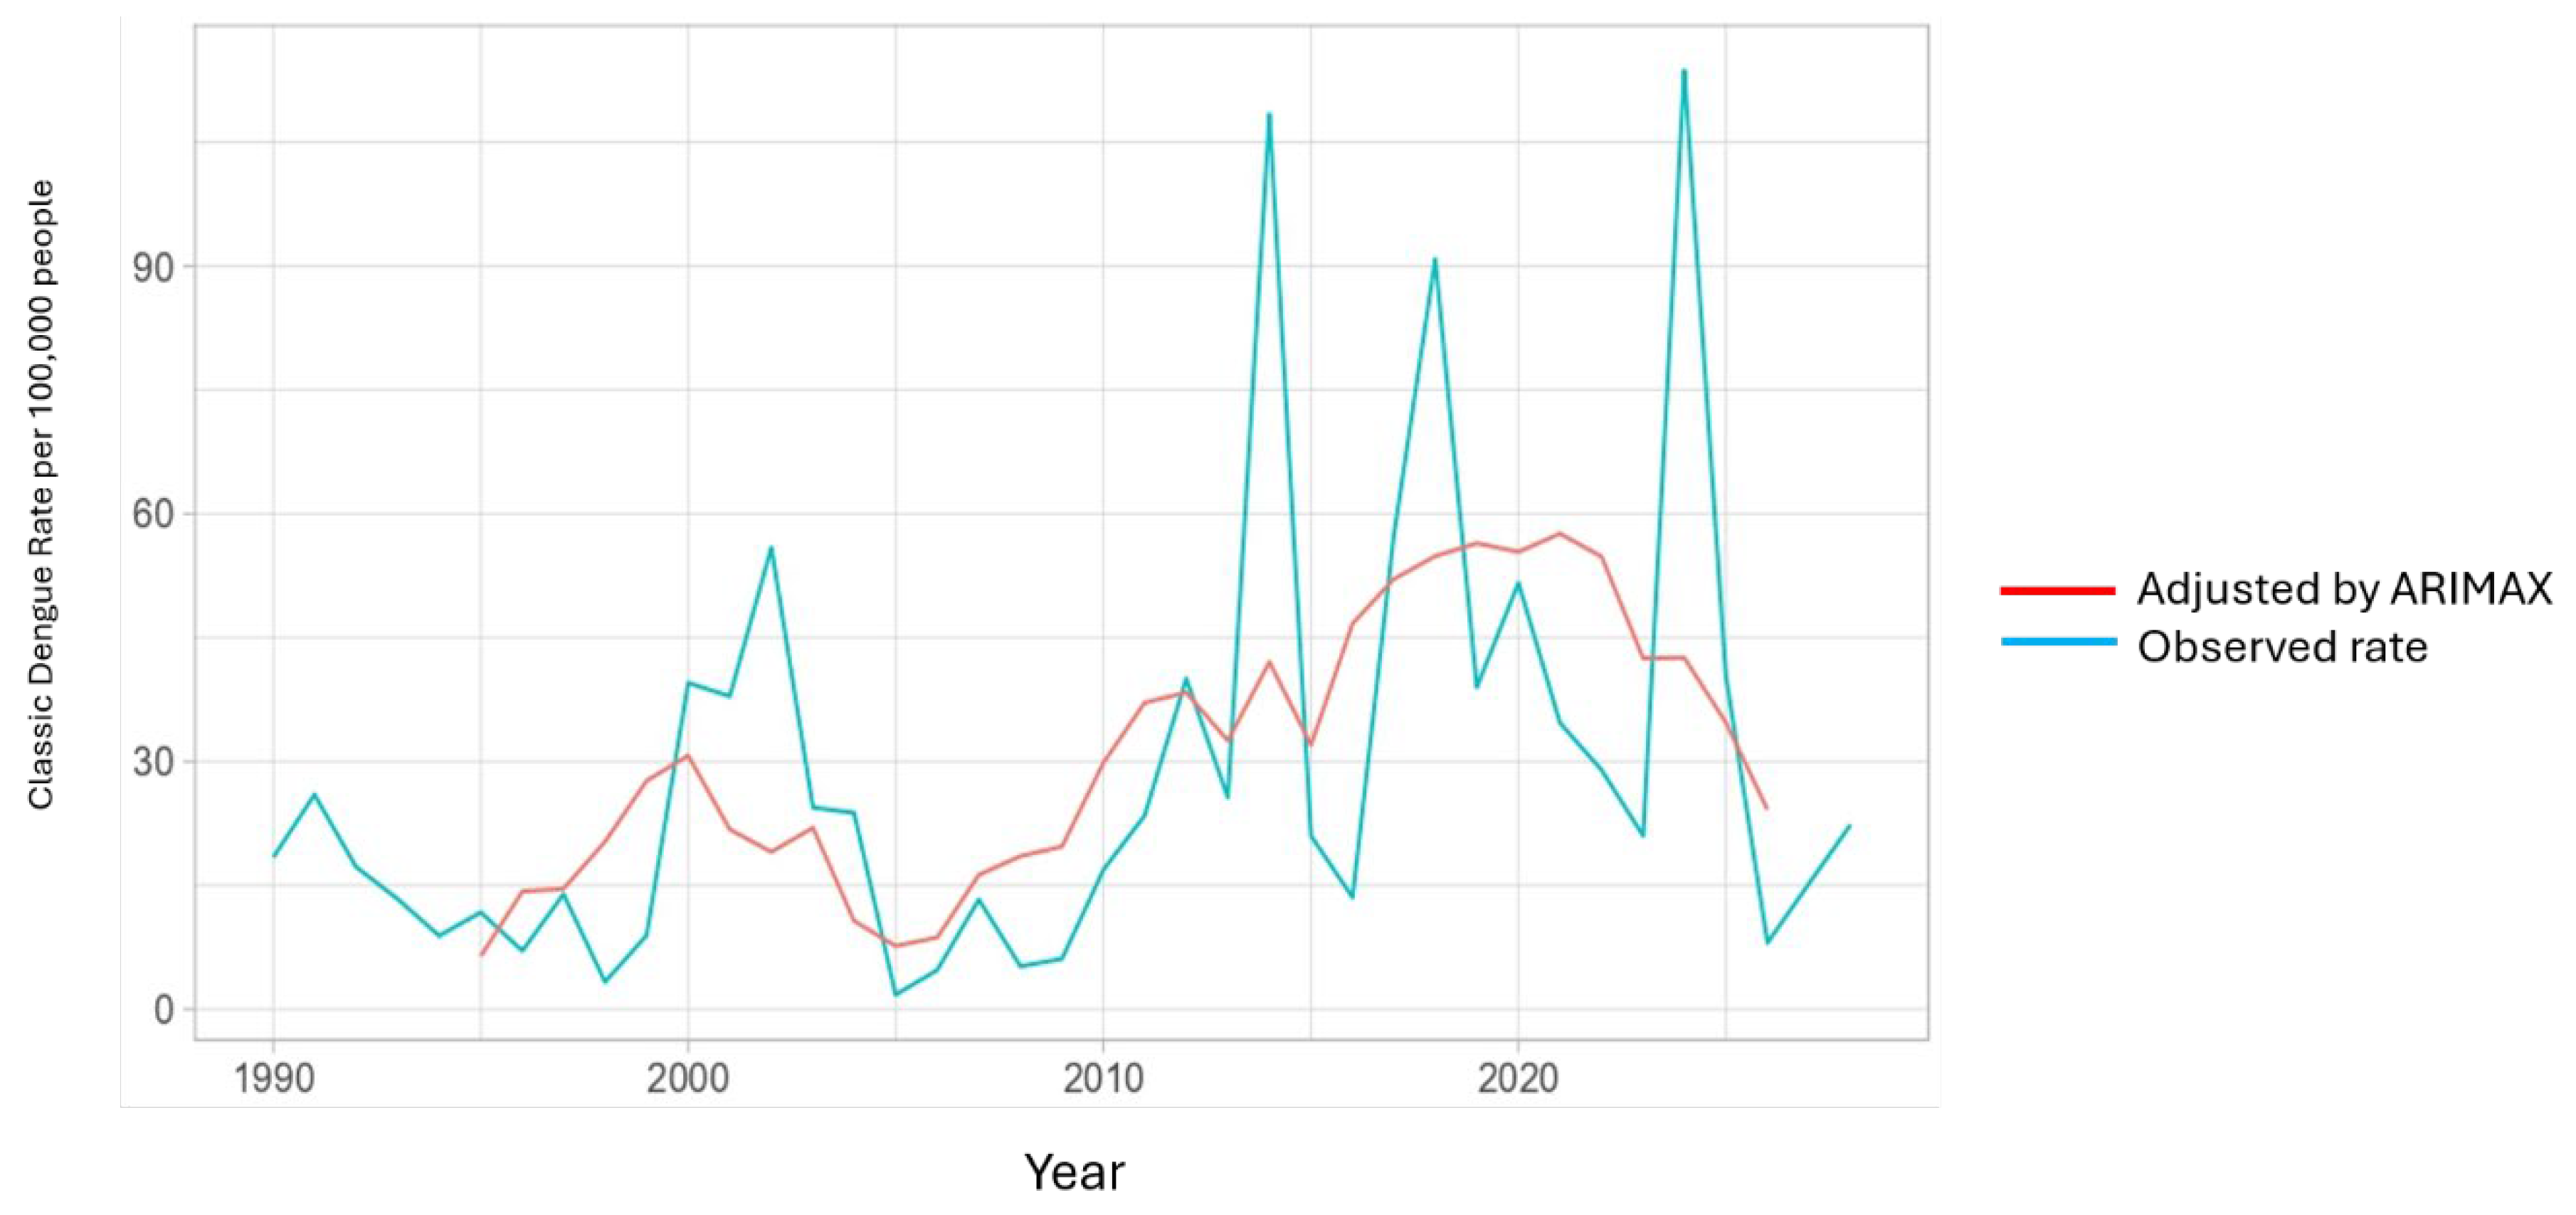
Figure 2.
Observed and ARIMAX-adjusted severe dengue incidence rates in Mexico, 1990–2021.
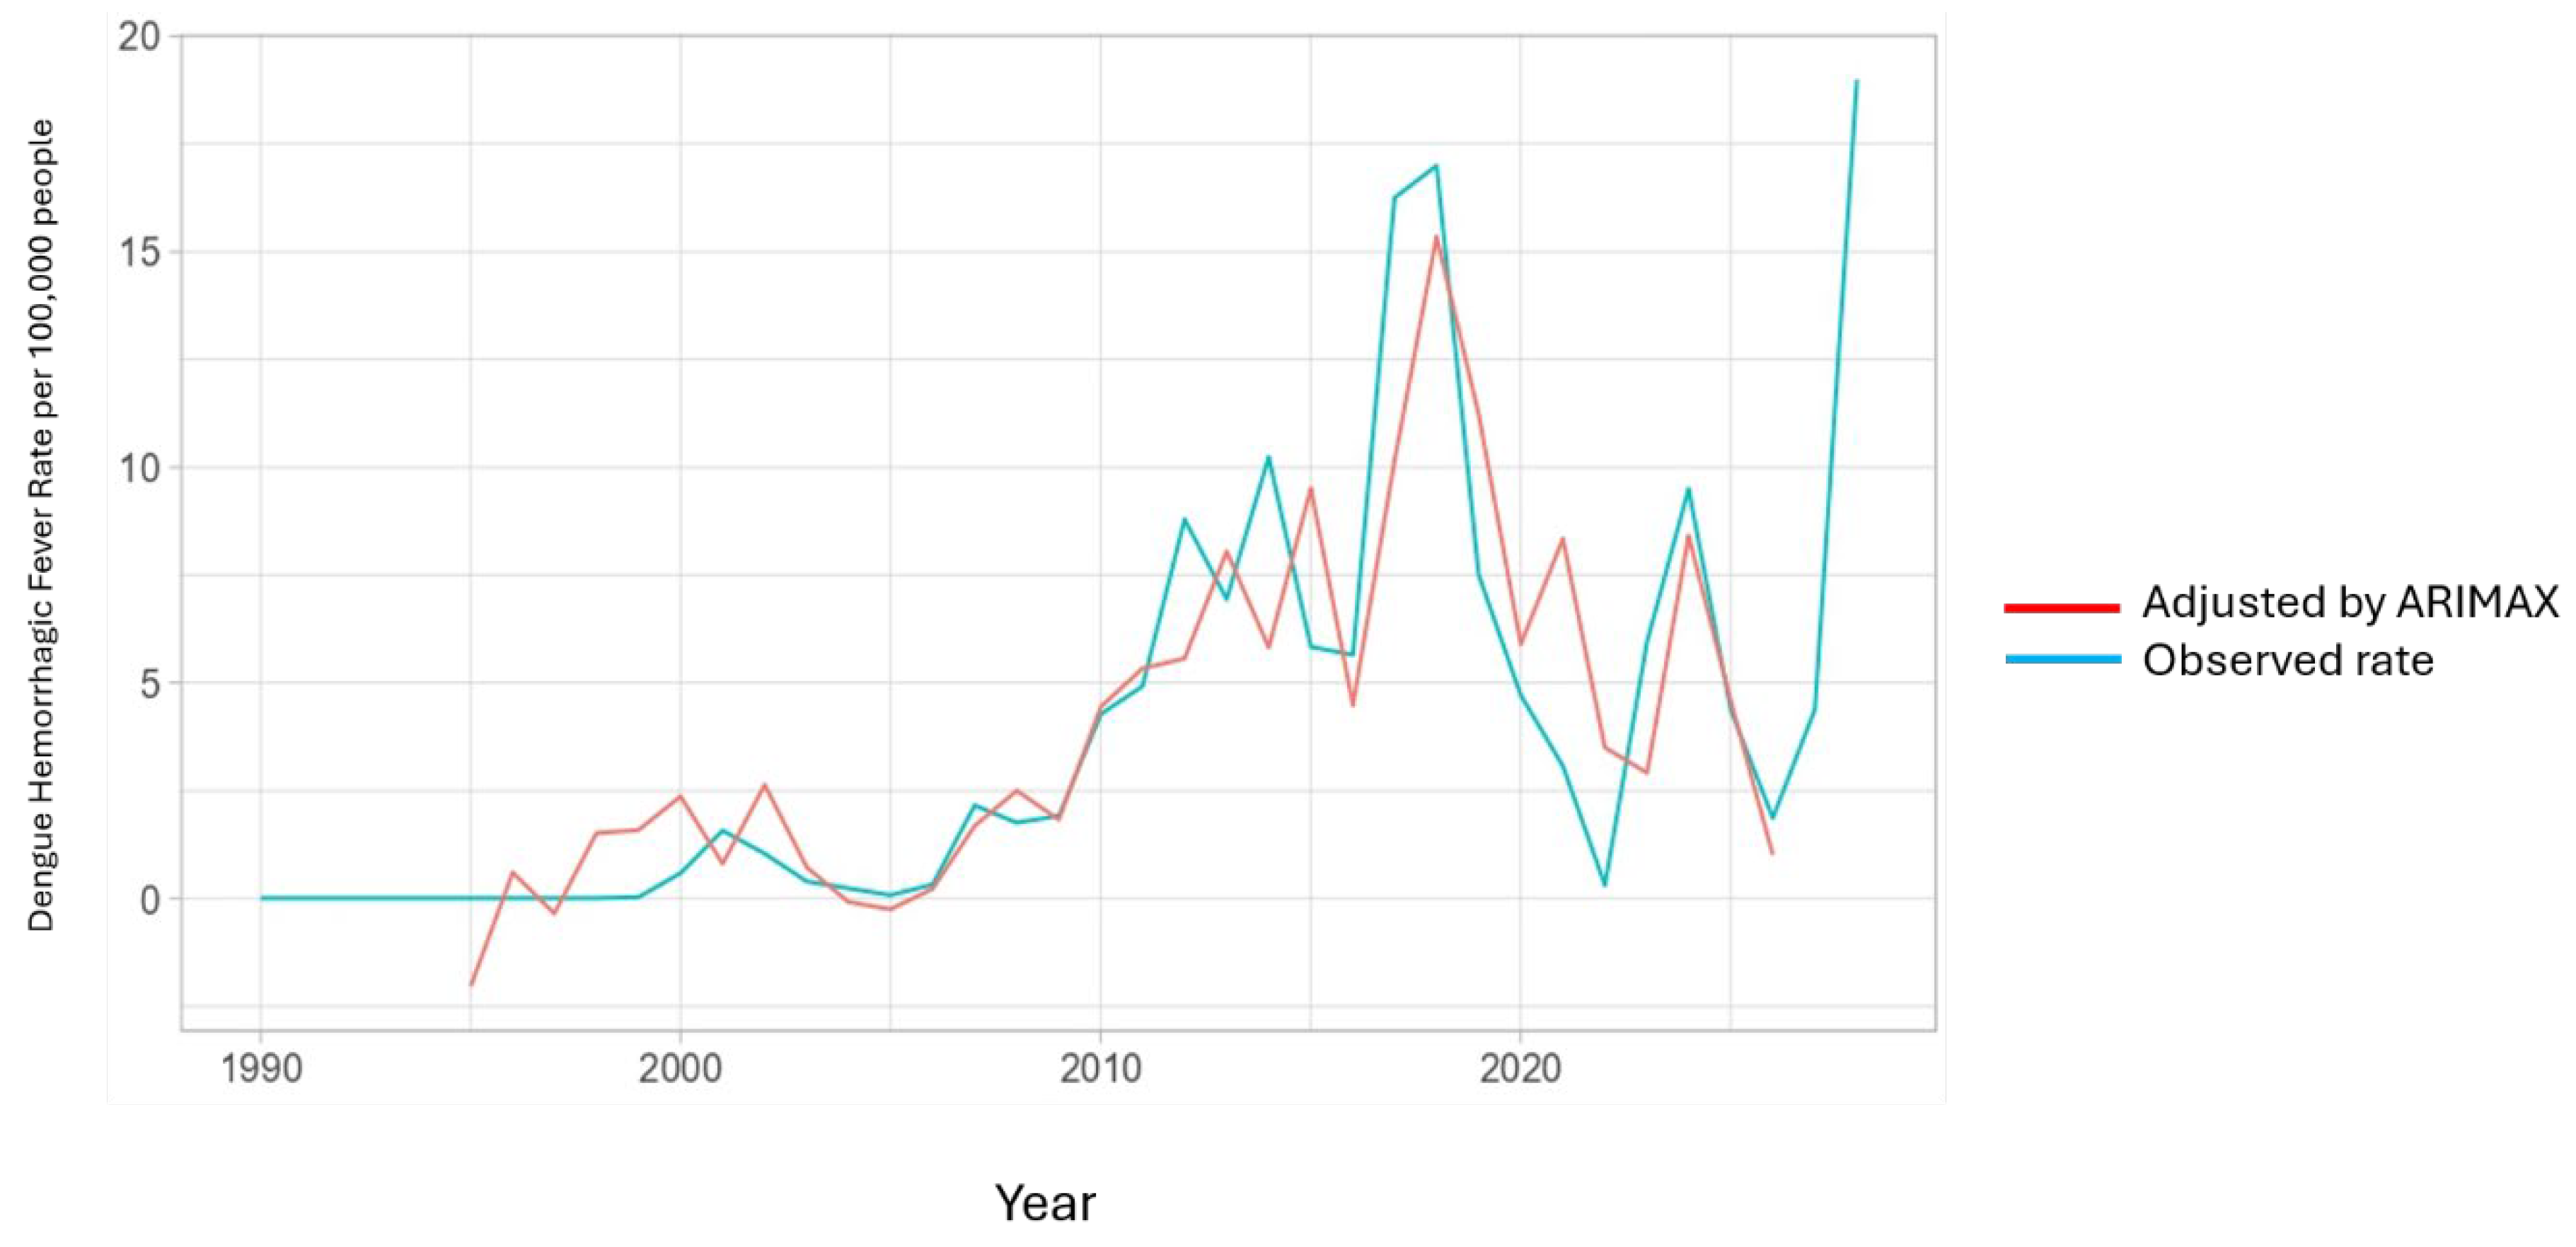

Table 1.
Exploratory simple linear regression analyses of environmental, land-use, urban, demographic, and climatic factors associated with dengue fever and severe dengue incidence in Mexico, 1990–2021.
Table 1.
Exploratory simple linear regression analyses of environmental, land-use, urban, demographic, and climatic factors associated with dengue fever and severe dengue incidence in Mexico, 1990–2021.
| Variables | Dengue Fever β | SE | t | p-value | R2 | Severe Dengue β | SE | t | p-value | R2 |
|---|---|---|---|---|---|---|---|---|---|---|
| Forest area (% of land area) | -15.1 | 6.2 | -2.4 | 0.02 | 0.13 | -3.418 | 0.8 | -3.8 | <0.001 | 0.31 |
| Permanent cropland (% of land area) | 102.7 | 51.4 | 1.9 | 0.05 | 0.08 | 23.738 | 7.4 | 3.1 | 0.003 | 0.22 |
| Population in urban agglomerations of more than 1 million (% of total population) | 10.5 | 5.6 | 1.8 | 0.07 | 0.07 | 2.3 | 0.8 | 2.7 | 0.01 | 0.17 |
| Population growth (annual %) | -23.6 | 15 | -1.5 | 0.12 | 0.04 | -4.897 | 2.3 | -2.1 | 0.042 | 0.1 |
| Urban population (% of total population) | 4.2 | 1.6 | 2.5 | 0.01 | 0.14 | 0.906 | 0.2 | 3.7 | <0.001 | 0.3 |
| Renewable internal freshwater resources per capita (m3) | -0.02 | 0.01 | -2.5 | 0.01 | 0.14 | -0.005 | 0.001 | -4.067 | <0.001 | 0.33 |
| Population density (people per km2 of land area) | 1.6 | 0.6 | 2.5 | 0.01 | 0.14 | 0.368 | 0.1 | 3.9 | <0.001 | 0.31 |
| Average annual temperature (°C) | 21.1 | 7.1 | 2.9 | 0.01 | 0.2 | 3.71 | 1.1 | 3.4 | 0.001 | 0.25 |
Abbreviations: β, regression coefficient; SE, standard error; R2, coefficient of determination. Note: Exploratory simple linear regression models were fitted separately for each independent variable. Statistical significance was established at p < 0.05.
Table 2.
Exploratory multiple linear regression analyses of environmental, land-use, urban, demographic, and climatic factors associated with dengue fever and severe dengue incidence in Mexico, 1990–2021.
Table 2.
Exploratory multiple linear regression analyses of environmental, land-use, urban, demographic, and climatic factors associated with dengue fever and severe dengue incidence in Mexico, 1990–2021.
| Variables | Dengue Fever β | SE | p-value | Severe Dengue β | SE | p-value |
|---|---|---|---|---|---|---|
| Intercept | -9039.99 | 5311.17 | 0.1 | -1937.74 | 689.65 | 0.009 |
| Forest area (% of land area) | 283.24 | 167.59 | 0.103 | 64.29 | 21.76 | 0.006 |
| Renewable internal freshwater resources per capita (m3) | -0.357 | 0.201 | 0.087 | -0.087 | 0.026 | 0.002 |
| Population density (people per km2 of land area) | 4.58 | 8.66 | 0.601 | 0.884 | 1.124 | 0.439 |
| Average annual temperature (°C) | 15.9 | 18.63 | 0.401 | -0.307 | 2.419 | 0.9 |
| Model statistics | ||||||
| Multiple R2 | 0.308 | 0.532 | ||||
| Adjusted R2 | 0.205 | 0.463 | ||||
| Model p-value | 0.036 | <0.001 | ||||
Abbreviations: β, regression coefficient; SE, standard error; R2, coefficient of determination. Note: Exploratory multiple linear regression models were fitted using forest area, renewable internal freshwater resources per capita, population density, and average annual temperature as explanatory variables. Statistical significance was established at p < 0.05.
Table 3.
ARIMAX models evaluating temporal associations between environmental, land-use, urban, demographic, and climatic variables and dengue incidence trends in Mexico, 1990–2021.
Table 3.
ARIMAX models evaluating temporal associations between environmental, land-use, urban, demographic, and climatic variables and dengue incidence trends in Mexico, 1990–2021.
| Parameter | Dengue fever β (SE) | p-value | Severe dengue β (SE) | p-value |
|---|---|---|---|---|
| ARIMA Specification | ARIMA(0,0,0) | ARIMA(0,0,1) | ||
| Intercept | -9039.98 (7709.50) | 0.241 | -1937.73 (1427.12) | 0.175 |
| Forest area (% of land area) | 283.55 (231.98) | 0.222 | 64.36 (43.83) | 0.142 |
| Renewable internal freshwater resources per capita (m3) | -0.359 (0.232) | 0.122 | -0.088 (0.047) | 0.062 |
| Population density (people per km2) | 4.48 (12.54) | 0.721 | 0.83 (2.01) | 0.679 |
| Average annual temperature (°C) | 16.02 (25.71) | 0.533 | -0.20 (2.14) | 0.925 |
| MA(1) | — | — | 0.725 (0.195) | <0.001 |
| AIC | 304.9 | — | 162.6 | — |
| BIC | 313.69 | — | 172.86 | — |
Abbreviations: β, estimated regression coefficient; SE, standard error of the coefficient estimate; MA(1), first-order moving-average parameter; AIC, Akaike Information Criterion; BIC, Bayesian Information Criterion. Note: Models were fitted using annual data from 1990–2021. Coefficients represent temporal associations between environmental, land-use, demographic, and climatic variables and dengue incidence rates after accounting for temporal autocorrelation. Statistical significance was established at p < 0.05.
Disclaimer/Publisher’s Note: The statements, opinions and data contained in all publications are solely those of the individual author(s) and contributor(s) and not of MDPI and/or the editor(s). MDPI and/or the editor(s) disclaim responsibility for any injury to people or property resulting from any ideas, methods, instructions or products referred to in the content. |
© 2026 by the authors. Licensee MDPI, Basel, Switzerland. This article is an open access article distributed under the terms and conditions of the Creative Commons Attribution (CC BY) license.
Copyright: This open access article is published under a Creative Commons CC BY 4.0 license, which permit the free download, distribution, and reuse, provided that the author and preprint are cited in any reuse.


