

Submitted:
22 July 2026
Posted:
22 July 2026
You are already at the latest version
Abstract
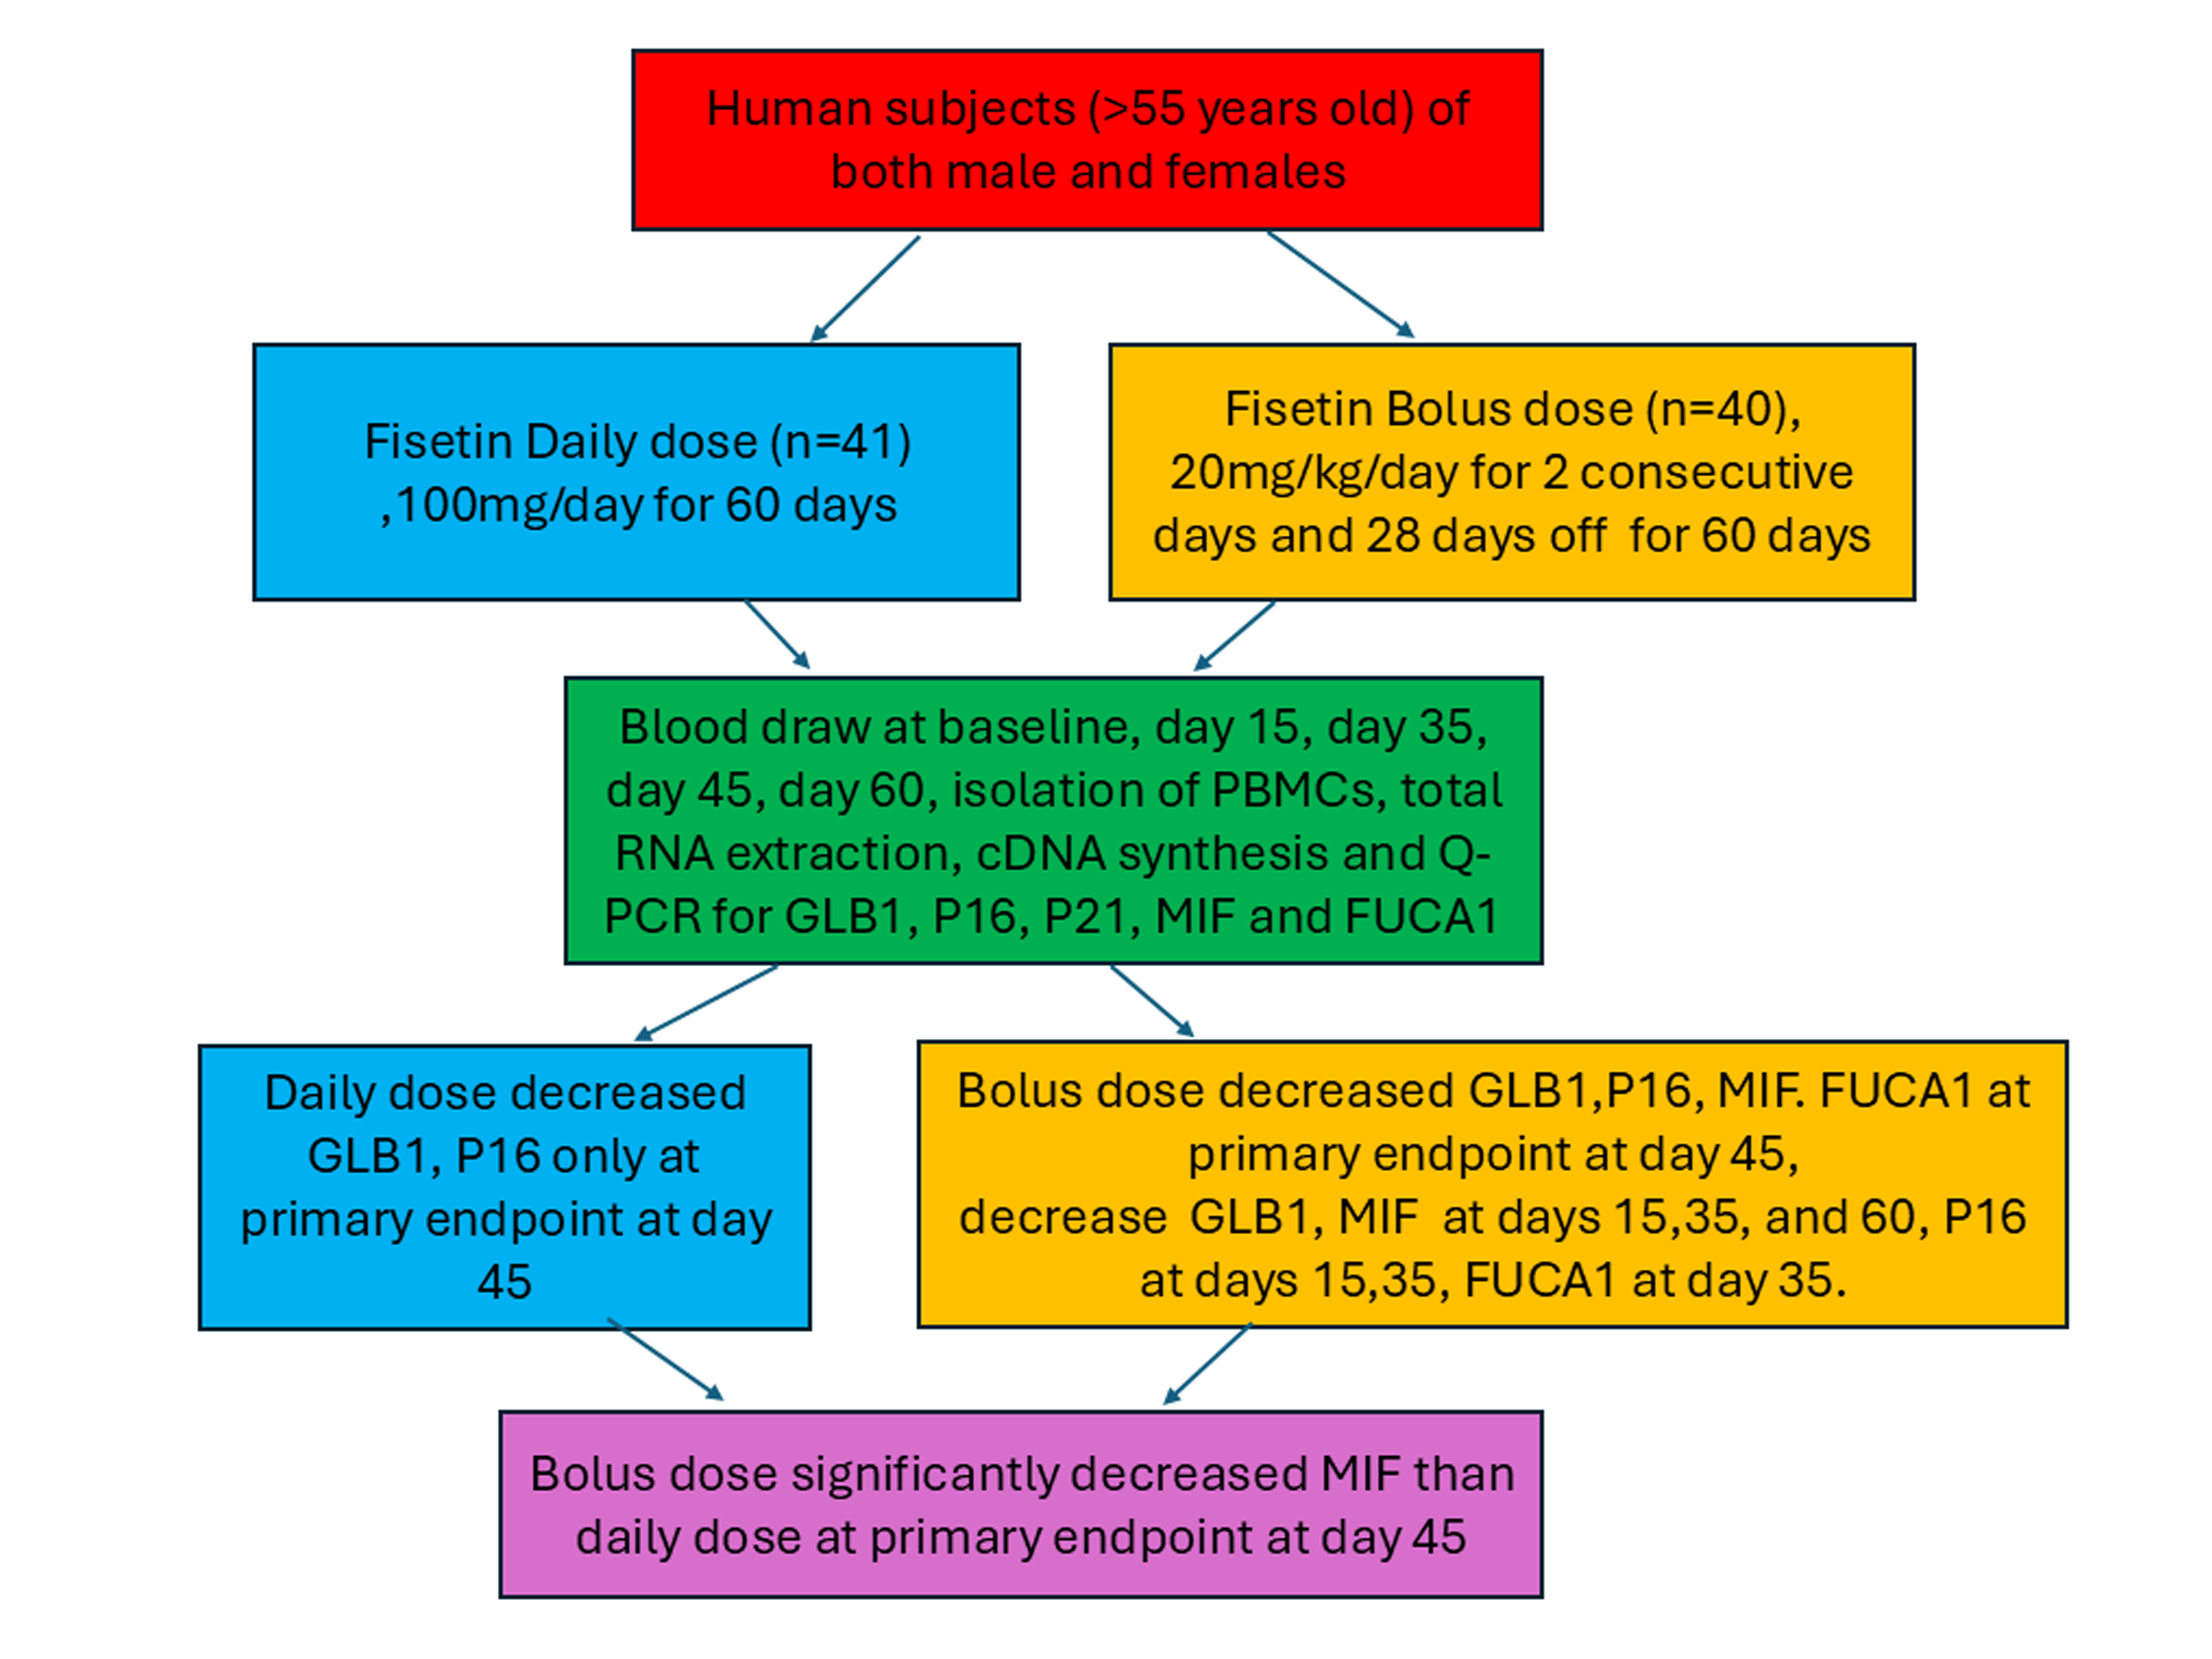
Fisetin is a natural flavonoid that possesses antioxidant, anti-inflammatory, anti-senescence, and neuroprotective effects in preclinical studies. This double-blind randomized clinical trial investigated the effects of two fisetin dosing regimens on senescent gene expression in peripheral blood mononuclear cells (PBMCs) in elderly humans (> 55 years old). Participants were randomized to Daily dose (100mg/day, N = 41) or Bolus dose (20mg/kg for two consecutive days on and 28 days off, N = 40) for 60 days. Blood draw, PBMC isolation, RNA extraction and quantitative polymerase chain reaction (Q-PCR) for 5 target genes were performed at baseline, and days 15, 35, 45 and 60. At the primary endpoint, day 45, both fisetin dosing regimens significantly decreased galactosidase beta 1 (GLB1) and P16 INK4A (P16) gene expression. Bolus dose also significantly reduced macrophage migration inhibition factor (MIF) and alpha-L-fucosidase 1 (FUCA1) compared to baseline and decreased MIF compared to daily dose. Further, Bolus dose significantly decreased GLB1 and MIF at days 15, 35, 60, and P16 at days 15, 35 as well as FUCA1 at day 35 compared to baseline. Hence, Bolus dosing of fisetin is more effective than Daily dosing for reducing cellular senescent genes in PBMCs isolated from elderly human blood.
Keywords:
fisetin
; cellular senescence gene
; human peripheral blood mononuclear cells
; aging
; macrophage migration inhibitory factor
; galactosidase beta 1
1. Introduction
Cellular senescence is a fundamental mechanism of aging. Preclinical studies demonstrated targeting senescent cells in aged mice with senotherapeutics, such as ruxolitinib, dasatinib and quercetin (D+Q), intermittently (once a month) or via a genetic approach to suppress P16, improved multiple physiological functions and extended life span [1,2]. Several senolytic drugs have been discovered, and some are on the path to translate into clinical therapy [3]. The first-in-human, open-label pilot study of D+Q demonstrated improved physical function of patients with idiopathic pulmonary fibrosis (IPF) after 3 weeks of intermittent treatment but no significant changes in senescence-associated secretory phenotype (SASP) [4](NCT02874989). D+Q treatment increased α-Klotho in the urine of IPF patients [5]. A phase 1 clinical trial for Alzheimer’s disease demonstrated that D+Q can penetrate the blood-brain barrier and showed a decreasing trend in SASP chemokines and high Aβ42 levels [6](NCT04063124). Another single-arm clinical trial involving 12 Alzheimer’s disease participants revealed a non-significant increase of mean Montreal Cognitive Assessment (MoCA) scores by 1.0 point following D+Q, but a significant increase by 2.0 points in those with lowest baseline MoCA scores and non-significant decrease in tumor necrosis factor-α (TNF-α) by -3.0% (95% CI: -13.0, 7.1) by D+Q. Most importantly, the changes in TNF-α were significantly and inversely correlated with changes in MoCA scores (r = -0.65, p = 0.02) [7]. Another Phase 2 randomized clinical trial investigated intermittent D+Q for the potential to improve bone metabolism and bone quality in post-menopausal women. The results showed that D+Q treatment did not change bone resorption marker C-terminal telopeptide of type I collagen (CTX-1), but increased bone formation marker N-terminal pro-peptide of type I procollagen (P1NP) at 2 and 4 weeks after treatment compared to control, but not at 20 weeks. Exploratory analysis of the subpopulation with the highest CDKN2A (P16) levels revealed a 34% significant increase in P1NP and 11% decrease in CTX-1, which indicated the effect of D+Q depended on the senescent burden in the patients [8](NCT04313634).
Fisetin, a natural flavonoid, has been shown to reduce senescent cells in a subset of murine and human adipose tissue cells and extend median and maximum lifespan of aged mice [9]. Fisetin administered at 100mg/kg for two consecutive days weekly for 2 months also decreased P16+ and β-galactosidase 1 (GLB1)+ senescent cells in the different regions of brain neurons, astrocytes, and microglial cells in old sheep [10]. Currently, many clinical trials are using Fisetin for the treatment of aged-related conditions using different doses with the majority of the clinical trials using 20mg/kg two days on and 28 days off to target cellular senescence [11]. However, it is not known which dosing regimen is more effective in reduction of cellular senescence gene in humans. Hence, one objective of this randomized trial is to compare two fisetin dosing regimens on their effectiveness in reducing senescent gene expression in elderly human peripheral blood mononuclear cells (PBMCs).
2. Material and Methods
2.1. Ethical Approval
This study was approved by the Institutional Review Board of Steadman Clinic and Vail Health Hospital (IRB#2022-154). This study was conducted according to the protocol under U.S. standards of Good Clinical Practice (GCP) (21 CFR Part 312 Subpart D), applicable Food and Drug Administration (FDA) regulations, and Vail Health Institutional Review Board/Ethics Committee (IRB/EC) policies and procedures.
2.2. Study Design
The goal of this prospective, randomized, double-blind clinical trial was to compare the effects of two different dosing regimens of fisetin in reducing senescent burden in PBMCs and to investigate the safety of fisetin administration and circulating protein biomarkers of senescence. Study hypotheses were an equivalent reduction in cellular senescence markers in the two arms, a lower incidence of adverse events in Daily Dose treatment, and higher fluctuations in cellular senescence biomarkers with time in the Bolus Dose arm. Between May 2023 and Jan 2024, participants were randomized to Daily dose group (N=41), receiving 100mg/day for 60 days, or Bolus dose group (N=40), receiving 20mg/kg/day Fisetin for two consecutive days and 28 days off for a total of 60 days. Fisetin was purchased from Vital Nutrients (Product code: CAP FISETIN 100 mg)
2.3. Inclusion Criteria and Exclusion Criteria
Inclusion criteria were as follows: (1) adults ≥ 55 years of age; (2) capacity to personally give informed consent (consent via legally authorized representative not accepted); and (3) willing to comply with all study procedures and assessments. Exclusion criteria were as follows: (1) within 2 years of signing informed consent, history of: active blood disorders (i.e., DVTS, chronic blood clotting, hemophilia, leukemia, myeloma, etc.), active malignancy or any type or history of a malignancy (with the exception of subjects with a history of treated basal or squamous cell carcinoma); (2) females who were nursing a child, pregnant or planning to become pregnant during fisetin dosing; (3) males who did not wish to abstain from sex with women of childbearing potential without use of contraceptive protection by either party during fisetin dosing; (4) any significant illness within the last 30 days requiring clinical care and/or medications medical conditions, including findings in medical history or in the baseline assessments, that in the opinion of the principal clinical investigator or the screening clinician constituted a risk or contraindication for participation in the study or that could interfere with the study conduct, endpoint evaluation, or prevent the subject from fully participating in all aspects of the study; (5) allergy to any active or inactive ingredient of fisetin, and/or taking medication with known fisetin interaction; (6) taking medications that affect insulin activity, including metformin or acarbose within 1 week of signing informed consent, (7) currently taking warfarin or related anticoagulants; (8) lithium; (9) senolytic agents within the past 3 months and unwilling to discontinue these medications through the duration of the study, including fisetin, quercetin, luteolin, dasatinib, piperlongumine, or navitoclax; (10) taking drugs that induce significant cellular stress and unwilling to discontinue these medications through the duration of the study, including alkylating agents, anthracyclines, platins, other chemotherapy drugs; (11) taking the following drugs: cyclosporin, tacrolimus, repaglinide, and bosentan; (12) taking a glucocorticoid within 1 month of signing informed consent; (13) currently taking phenytoin and nateglinide; (14) a Patient Health Questionnaire-9 (PHQ-9) total score exceeding 9; (15) inability to tolerate oral medication.
2.4. Blood Drawn and Isolation of PBMCs
Participants underwent a 35ml blood draw at baseline (visit 1), day 15 (visit 2), day 35 (visit 3), day 45 (visit 4) and day 60 (visit 5), with a visit window of ±3 days. PBMCs were isolated using Lymphoprep™ Density Gradient Medium (Cat#18061, Serumwerk Bernburg AG, Bernburg, Germany) purchased from Stem Cell Technology and kept frozen at -80 °C freezer in 3 aliquots until testing.
2.5. RNA Extraction, cDNA Synthesis and Q-PCR
These analyses were performed when all participants’ 5-visit samples were collected. RNA extraction was performed using TRIzol reagent (Cat#15596018, Invitrogen, Thermofisher Scientific) following the manufacturer’s protocol. cDNA synthesis was performed using iScript™ Reverse Transcription Supermix, 500 x 20 µl rxns, 2 ml (Cat#1708841BUN, BioRad). Q-PCR was performed using SsoAdvanced Universal SYBR® Green Supermix, 2,500 x 20 µl rxns, 25 ml (5 x 5 ml) using 10µl reaction with 2 replicates. Negative control (H2O) was included in each Q-PCR assay. To ensure comparability between samples and patients, the samples from all of the visits for each participant were run in the same batch, with 20 samples per batch. Senescent-related gene primers were designed using Primer 3 Input [12,13,14], including glyceraldehyde 3-phosphate dehydrogenase (GADPH), galactosidase β 1 (GLB1), p16INK4a (P16), p21CIP1/WAF (P21 or CDKN1A), macrophage migratory inhibitor factor (MIF), and α-L-fucosidase 1 (FUCA1). Primer information is provided Table 1.
The mRNA expression fold changes of each gene were calculated using each participant’s own baseline (visit 1) as reference (Delta Circle of Threshold (CT) =Target gene CT-GAPDH CT, Delta-Delta-CT = Visit 2,3,4,5 Delta-CT-baseline Delta-CT of each respective gene). Fold change of each gene was calculated using 2-Delta-DeltaCTfomula. If a gene expression fold change is more than 1, it indicates the gene expression is increased; if the fold change is less than 1, it indicates the gene expression is decreased compared to baseline. All gene expression specificities were verified by melting curve ( Figure 1).
2.6. Statistical Analysis
We first used two one-sided t-tests (TOST) as specified in the study protocol for testing equivalence between treatment groups. Further, mixed models for repeated measures, with the evaluation of corresponding marginal means and contrasts, were used for analysis of the longitudinal dataset. Mixed models for repeated measures analyses are a preferred method of analysis for datasets with observations missing at random and allow analysis of the entire longitudinal dataset. Visit 4 (day 45) was specified in the study IRB protocol as the primary time point of interest. Two group comparisons of gene expression between groups at visit 4 and within each group at each follow-up visit relative to baseline were carried out using one-sided t-test on complete cases only, without imputation. The fluctuations of gene expression between visits 3-5 (intrabolus for subjects in the Bolus Dose arm) were evaluated using the coefficient of variation (CV) of the logarithm of fold change across the three time points for each subject and compared between 2 treatment groups using Mann-Whitney tests. Model assumptions were checked by analysis and visualization of residuals. Estimates of model parameters and estimates are reported with two-sided 95% confidence intervals (95% CIs). The Benjamini-Yekutieli procedure was used to control false discovery rate across the five gene multiple comparisons [15]. Statistical analyses were performed on log2(fold change) values, which were observed to be approximately normally distributed. Estimates and confidence intervals were calculated for log2(fold change) and then exponentiated with base 2 to generate estimates and confidence intervals for fold change.
All statistical analyses were performed using R4.4.2 [R Core Team (2021). R: A language and environment for statistical computing. R Foundation for Statistical Computing, Vienna, Austria. URL https://www.R-project.org/]. Statistical significance was set at p<0.05 and FDR<0.40.
3. Results
3.1. Participants Demographics
For this Phase1/2 trial, 82 participants were recruited between May 2023 and January 2024. One participant dropped out after visit 1 and was excluded, leaving 81 subjects for analysis, with 40 (49%) randomized to the Bolus Dose group and 41 (51%) to the Daily Dose group. The two groups were similar in terms of sex, age, race, smoking status, and body mass index (BMI) (Table 2). In addition, two participants had only two visits, two had three visits, and three had four visits; all other participants completed all 5 visits. In total, 389 PBMC samples were analyzed (95% completeness).
3.2. Equivalence Test Revealed the Two Groups Are not Equivalent
The two one-sided t-test analysis (TOST) did not allow the rejection of the null equivalence hypothesis between the two treatment groups (Table 3) which indicated the two groups were not equivalent. The results of the mixed model for repeated measures analyses of primary endpoint at day 45 are summarized in Table 4. Here, we focus on the bivariate analyses of gene expression from baseline within treatment groups and comparison between treatment groups separately for each follow-up visit.
3.3. Effects of Two Dosing Regimens on the Senescent Gene Expression at the Primary Endpoint Day 45
To detect if two fisetin dosing regimens decrease senescence-related genes expression in PBMCs in elderly humans, we first analyzed 5 senescence-related gene expression fold changes versus baseline using each participant’s own baseline as reference at day 45 (the primary endpoint). Both treatment regimens significantly decreased GLB1 and P16 expression (fold changes: 0.77, 0.70 for Bolus group and 0.79, 0.76 for Daily group for GLB1 and P16, respectively) at day 45 (all p<0.05 and FDR<0.40) (Figure 2A-B). The Bolus dose also significantly decreased MIF and FUCA1 at day 45 compared to baseline expression (fold changes: 0.69, 0.84, respectively, p<0.05 and FDR<0.40) (Table 5). Both groups did not significantly reduce P21 expression (Figure 2C and Table 5).
The Bolus dose had a significantly larger fold change reduction relative to baseline of MIF than the Daily dose at day 45 (difference in log2 (fold change) =-0.46 ([95% Confidence Interval (CI), -0.83 - -0.09], p=0.0144, false discovery rate (FDR)=0.1642) (Figure 2D).
3.4. Effects of Two Fisetin Dosing Regimen on the Senescent Gene Expression at Other Time Points
We further analyzed all gene expression fold changes versus baseline at day 15, day 35, and day 60 in PBMC after taking fisetin. In the Daily dose group, there were no significant decreases (fold changes) for GLB1, P16, P21, MIF, FUCA1 at any of these time points (Figure2A-E). In the Bolus dose group, we found significant reduction in fold change versus baseline of GLB1 at all these follow-up visits (Figure2A). We found significant decreases in fold changes of P16 versus baseline at day 15 and 35 (Figure.2B). We did not find significant decreases of P21 expression at any follow-up visits (Figure2C). Furthermore, we found significantly decreased gene expression of MIF (fold change) at these three follow-up visits compared to baseline (Figure2D). Finally, Bolus dose significantly decreased the FUCA1 gene expression compared to baseline at day 35 and day 45 (Figure2E). Fold changes and confidence intervals statistical significance are detailed in Table 6 and Table 7.
No differences were found in fold change of gene expression between Bolus dose and Daily dose Fisetin at day 15, 35, or 60 for any of the 5 genes. Bolus dose demonstrated greater fluctuations in fold change of gene expression from baseline across the different timepoints of days 35, 45, and 60 than Daily dose for P21 and FUCA1 (Table 8).
3.5. The Senescent Gene Expression Did not Correlate with Participant’s Age in this Aged Population
We further performed correlation analysis of the 5 senescent gene expression and age using Delta-CT (target gene CT – GAPDH CT) (absolute gene expression). Our results showed no significant correlation between age and GLB1, P16, P21, MIF or FUCA1 in this aged population (Figure 3).
4. Discussion
Fisetin has been studied extensively in preclinical studies, demonstrating strong potential in reducing senescence genes [9,16,17]; however, no human clinical studies have investigated the effects of fisetin for reducing senescence gene expression of PBMCs. In this Phase 1/2 clinical trial, we investigated the effects of two different fisetin dosing regimens in reducing mRNA expression of senescent genes in aged human PBMCs. We found both Bolus and Daily dosing of fisetin significantly reduced GLB1 and P16 at primary end point at day 45 compared to baseline. The Bolus dose also significantly reduced GLB1 and MIF expression in the PBMCs at all time points, and significantly decreased P16 at days 15, 35 and 45 compared to baseline. Bolus dosing also significantly decreased FUCA1 at day 35 and day 45. Notably, Bolus dose significantly decreased the fold change of MIF compared to Daily dose at the primary endpoint of day 45. Overall, the Bolus dosing regimen demonstrated more consistent effects of reduction in the 4 out of 5 senescence-related genes analyzed. These results support the theory that “hit and run” senolytic treatment appears to be more efficient at reducing cellular senescence than the daily dosing senolytic approach [18].
In the past decade, it is increasingly recognized the contribution of cellular senescence in ageing related disease in preclinical studies [19,20,21](39111286,42021544,40806616). Targeting cellular senescence has been proposed as new therapeutic approach for treatment of age-related disease [22] (35912854). However, there is still lacking approach to monitoring human cellular senescence burden in vivo. A previous clinical trial used P16 as a senescence marker and T lymphocytes as the target cell population to evaluate the effect of D+Q on the cellular senescence burden in postmenopausal women and its effects on improving bone quality and metabolism [8]. They found the beneficial effects of D+Q only significant at subpopulations of participants who has higher P16 at baseline [8]. We utilized PBMCs as target cells to detect several senescence-related genes simultaneously. PBMCs contain not only T lymphocytes but also monocytes/macrophages, NK cells and B lymphocytes. Therefore, PBMCs cellular senescence may be more sensitive in reflecting thorough systemic changes compared to T lymphocytes cellular senescence. Aged bone marrow senescent macrophages have been shown to drive systemic aging and age-related dysfunction [23].
In the current study, we investigated the effect of Fisetin on expression of GLB1 gene (which encodes lysosomal b-galactosidase) in PBMCs, and demonstrated similar changes as it for P16, but revealed more consistent reduction than P16. FUCA1 has also been shown to be a marker of cellular senescence [24] and the Bolus dose significantly decreased FUCA1 at day 35 and 45. Our finding that Bolus dose significantly decreased MIF compared to the Daily dose indicates that MIF may be a more sensitive marker for monitoring senescent burden. This is consistent with a previous study which demonstrated that MIF was correlated with age and could be decreased by senolytic cocktail D+Q treatment [25]. Our finding of no significant correlation between these senescent related genes and age was likely due to the fact that the participants were all older adults (over 55 years). The limitation of this clinical trial is that we did not evaluate the effects two fisetin dosing regimens on physical function or any other age-related health measures because this study targeting aged populations not specific diseases.
5. Conclusion
In summary, this clinical trial demonstrated that detection of senescent genes in human PBMCs is feasible and non-invasive and may be used to represent systemic cellular senescence level. Both Daily and Bolus fisetin regimens were effective in reducing senescent genes GLB1 and P16. The Bolus dosing regimen also significantly decreased MIF and FUCA1. Bolus fisetin dosing is more effective in reducing mRNA expression of MIF than daily fisetin dosing, suggesting that Bolus dosing is more effective for reducing senescence genes and SASP expression. This finding provides evidence for future clinical trials using Bolus dosing of fisetin to treat age-related diseases.
Author Contributions
Xueqin Gao: target genes choice, primer design, RNA isolation, cDNA synthesis, Q-PCR, data analysis, interpretation, validation and wrote the original manuscript; Joanna Roder: Statistical analysis, data presentation and validation, manuscript reviewing and editing; Lucas T Minas: PBMCs isolation and preparing and organizing cells and documentation. Jacob Singer, PBMCs isolation, documentation, Chloe Barton: patient enrollment, blood drawn and documentation. Grant J Donan: study design, power analysis; Jonathan E Layne, Jasmine V. Hartman Budnik, Molly Czacho, Greta Gohring: PBMCs isolation and sample documentation. Luz Thede: patient enrollment, follow up and clinical data documentation. Sara Robinson: study data documentation, manuscript editing. Aiping Lu, Ping Guo: technician supervision and administration. Dustin Anderson: patient enrollment and documentation. Scott Tashman: project consultation, manuscript reviewing and editing. James L Kirkland, project consultation, manuscript reviewing and editing. Marc J Philippon: study design, project administration, manuscript reviewing and editing. Johnny Huard: study design, project administration, funding acquisition, manuscript reviewing and editing and final approval of the manuscript. All authors have read and agreed to the published version of the manuscript.
Funding
This research was funded by National Institutes of Health, grant number 1R33AG061456-01.
Institutional Review Board Statement
This study was approved by the Institutional Review Board of Steadman Clinic and Vail Health Hospital (IRB#2022-154). This study was conducted according to the protocol under U.S. standards of Good Clinical Practice (GCP) (21 CFR Part 312 Subpart D), applicable Food and Drug Administration (FDA) regulations, and Vail Health Institutional Review Board/Ethics Committee (IRB/EC) policies and procedures.
Informed Consent Statement
Informed consent was obtained from all subjects involved in the study.
Data Availability Statement
The original contributions presented in this study are included in the article. Further inquiries can be directed to the corresponding author(s).
Use of Artificial Intelligence
No AI was used to assist in scientific writing for this manuscript.
Acknowledgments
This project was funded by a philanthropic gift from the Borgen and Hill family. Participation by JLK was supported by the NIH Translational Geroscience Network (grant R33AG61456).
Conflicts of Interest
The authors declare no conflict of interest.
References
- Xu, M.; Pirtskhalava, T.; Farr, J.N.; Weigand, B.M.; Palmer, A.K.; Weivoda, M.M.; Inman, C.L.; Ogrodnik, M.B.; Hachfeld, C.M.; Fraser, D.G.; et al. Senolytics improve physical function and increase lifespan in old age. Nat. Med. 2018, 24, 1246–1256. [Google Scholar] [CrossRef] [PubMed]
- Farr, J.N.; Xu, M.; Weivoda, M.M.; Monroe, D.G.; Fraser, D.G.; Onken, J.L.; Negley, B.A.; Sfeir, J.G.; Ogrodnik, M.B.; Hachfeld, C.M.; et al. Targeting cellular senescence prevents age-related bone loss in mice. Nat. Med. 2017, 23, 1072–1079. [Google Scholar] [CrossRef] [PubMed]
- Chaib, S.; Tchkonia, T.; Kirkland, J.L. Cellular senescence and senolytics: the path to the clinic. Nat. Med. 2022, 28, 1556–1568. [Google Scholar] [CrossRef] [PubMed]
- Justice, J.N.; Nambiar, A.M.; Tchkonia, T.; LeBrasseur, N.K.; Pascual, R.; Hashmi, S.K.; Prata, L.; Masternak, M.M.; Kritchevsky, S.B.; Musi, N.; et al. Senolytics in idiopathic pulmonary fibrosis: Results from a first-in-human, open-label, pilot study. EBioMedicine 2019, 40, 554–563. [Google Scholar] [CrossRef] [PubMed]
- Zhu, Y.; Prata, L.; Gerdes, E.O.W.; Netto, J.M.E.; Pirtskhalava, T.; Giorgadze, N.; Tripathi, U.; Inman, C.L.; Johnson, K.O.; Xue, A.; et al. Orally-active, clinically-translatable senolytics restore alpha-Klotho in mice and humans. EBioMedicine 2022, 77, 103912. [Google Scholar] [CrossRef] [PubMed]
- Gonzales, M.M.; Garbarino, V.R.; Kautz, T.F.; Palavicini, J.P.; Lopez-Cruzan, M.; Dehkordi, S.K.; Mathews, J.J.; Zare, H.; Xu, P.; Zhang, B.; et al. Senolytic therapy in mild Alzheimer’s disease: a phase 1 feasibility trial. Nat. Med. 2023, 29, 2481–2488. [Google Scholar] [CrossRef] [PubMed]
- Millar, C.L.; Iloputaife, I.; Baldyga, K.; Norling, A.M.; Boulougoura, A.; Vichos, T.; Tchkonia, T.; Deisinger, A.; Pirtskhalava, T.; Kirkland, J.L.; et al. A pilot study of senolytics to improve cognition and mobility in older adults at risk for Alzheimer’s disease. EBioMedicine 2025, 113, 105612. [Google Scholar] [CrossRef] [PubMed]
- Farr, J.N.; Atkinson, E.J.; Achenbach, S.J.; Volkman, T.L.; Tweed, A.J.; Vos, S.J.; Ruan, M.; Sfeir, J.; Drake, M.T.; Saul, D.; et al. Effects of intermittent senolytic therapy on bone metabolism in postmenopausal women: a phase 2 randomized controlled trial. Nat. Med. 2024, 30, 2605–2612. [Google Scholar] [CrossRef] [PubMed]
- Yousefzadeh, M.J.; Zhu, Y.; McGowan, S.J.; Angelini, L.; Fuhrmann-Stroissnigg, H.; Xu, M.; Ling, Y.Y.; Melos, K.I.; Pirtskhalava, T.; Inman, C.L.; et al. Fisetin is a senotherapeutic that extends health and lifespan. EBioMedicine 2018, 36, 18–28. [Google Scholar] [CrossRef] [PubMed]
- Huard, C.A.; Gao, X.; Dey Hazra, M.E.; Dey Hazra, R.O.; Lebsock, K.; Easley, J.T.; Millett, P.J.; Huard, J. Effects of Fisetin Treatment on Cellular Senescence of Various Tissues and Organs of Old Sheep. Antioxidants 2023, 12. [Google Scholar] [CrossRef] [PubMed]
- Tavenier, J.; Nehlin, J.O.; Houlind, M.B.; Rasmussen, L.J.; Tchkonia, T.; Kirkland, J.L.; Andersen, O.; Rasmussen, L.J.H. Fisetin as a senotherapeutic agent: Evidence and perspectives for age-related diseases. Mech. Ageing Dev. 2024, 222, 111995. [Google Scholar] [CrossRef] [PubMed]
- Untergasser, A.; Cutcutache, I.; Koressaar, T.; Ye, J.; Faircloth, B.C.; Remm, M.; Rozen, S.G. Primer3--new capabilities and interfaces. Nucleic Acids Res. 2012, 40, e115. [Google Scholar] [CrossRef] [PubMed]
- Koressaar, T.; Remm, M. Enhancements and modifications of primer design program Primer3. Bioinformatics 2007, 23, 1289–1291. [Google Scholar] [CrossRef] [PubMed]
- Koressaar, T.; Lepamets, M.; Kaplinski, L.; Raime, K.; Andreson, R.; Remm, M. Primer3_masker: integrating masking of template sequence with primer design software. Bioinformatics 2018, 34, 1937–1938. [Google Scholar] [CrossRef] [PubMed]
- Reiner, A.; Yekutieli, D.; Benjamini, Y. Identifying differentially expressed genes using false discovery rate controlling procedures. Bioinformatics 2003, 19, 368–375. [Google Scholar] [CrossRef] [PubMed]
- Murray, K.O.; Mahoney, S.A.; Ludwig, K.R.; Miyamoto-Ditmon, J.H.; VanDongen, N.S.; Banskota, N.; Herman, A.B.; Seals, D.R.; Mankowski, R.T.; Rossman, M.J.; et al. Intermittent Supplementation With Fisetin Improves Physical Function and Decreases Cellular Senescence in Skeletal Muscle With Aging: A Comparison to Genetic Clearance of Senescent Cells and Synthetic Senolytic Approaches. Aging Cell 2025, 24, e70114. [Google Scholar] [CrossRef] [PubMed]
- Fang, Y.; Peck, M.R.; Quinn, K.; Chapman, J.E.; Medina, D.; McFadden, S.A.; Bartke, A.; Hascup, E.R.; Hascup, K.N. Senolytic intervention improves cognition, metabolism, and adiposity in female APP(NL)(-F/NL-F) mice. Geroscience 2025, 47, 1123–1138. [Google Scholar] [CrossRef] [PubMed]
- Hickson, L.J.; Langhi Prata, L.G.P.; Bobart, S.A.; Evans, T.K.; Giorgadze, N.; Hashmi, S.K.; Herrmann, S.M.; Jensen, M.D.; Jia, Q.; Jordan, K.L.; et al. Senolytics decrease senescent cells in humans: Preliminary report from a clinical trial of Dasatinib plus Quercetin in individuals with diabetic kidney disease. EBioMedicine 2019, 47, 446–456. [Google Scholar] [CrossRef] [PubMed]
- Wang, B.; Wang, L.; Gasek, N.S.; Kuo, C.L.; Nie, J.; Kim, T.; Yan, P.; Zhu, J.; Torrance, B.L.; Zhou, Y.; et al. Intermittent clearance of p21-highly-expressing cells extends lifespan and confers sustained benefits to health and physical function. Cell Metab. 2024, 36, 1795–1805 e1796. [Google Scholar] [CrossRef] [PubMed]
- Mahoney, S.A.; Mazan-Mamczarz, K.; Tsitsipatis, D.; VanDongen, N.S.; Henry-Smith, C.; Okereke, A.N.; Munk, R.; Darvish, S.; Murray, K.O.; De, S.; et al. Senolytic Treatment With Fisetin Reverses Age-Related Endothelial Dysfunction Partially Mediated by SASP Factor CXCL12. Aging Cell 2026, 25, e70500. [Google Scholar] [CrossRef] [PubMed]
- Henschke, A.; Grzeskowiak, B.; Ivashchenko, O.; Sanchez-Cervino, M.C.; Coy, E.; Moya, S. Targeting Cellular Senescence with Liposome-Encapsulated Fisetin: Evidence of Senomorphic Effect. Int. J. Mol. Sci. 2025, 26. [Google Scholar] [CrossRef] [PubMed]
- Zhang, L.; Pitcher, L.E.; Yousefzadeh, M.J.; Niedernhofer, L.J.; Robbins, P.D.; Zhu, Y. Cellular senescence: a key therapeutic target in aging and diseases. J. Clin. Invest 2022, 132. [Google Scholar] [CrossRef] [PubMed]
- Hou, J.; Chen, K.X.; He, C.; Li, X.X.; Huang, M.; Jiang, Y.Z.; Jiao, Y.R.; Xiao, Q.N.; He, W.Z.; Liu, L.; et al. Aged bone marrow macrophages drive systemic aging and age-related dysfunction via extracellular vesicle-mediated induction of paracrine senescence. Nat. Aging 2024, 4, 1562–1581. [Google Scholar] [CrossRef] [PubMed]
- Koo, S.; Won, M.; Li, H.; Kim, W.Y.; Li, M.; Yan, C.; Sharma, A.; Guo, Z.; Zhu, W.H.; Sessler, J.L.; et al. Harnessing alpha-l-fucosidase for in vivo cellular senescence imaging. Chem. Sci. 2021, 12, 10054–10062. [Google Scholar] [CrossRef] [PubMed]
- Saul, D.; Kosinsky, R.L.; Atkinson, E.J.; Doolittle, M.L.; Zhang, X.; LeBrasseur, N.K.; Pignolo, R.J.; Robbins, P.D.; Niedernhofer, L.J.; Ikeno, Y.; et al. A new gene set identifies senescent cells and predicts senescence-associated pathways across tissues. Nat. Commun. 2022, 13, 4827. [Google Scholar] [CrossRef] [PubMed]
Figure 1.
Melting curve of each target gene. All melting curves showed sharp peaks which demonstrated specific amplification.
Figure 1.
Melting curve of each target gene. All melting curves showed sharp peaks which demonstrated specific amplification.
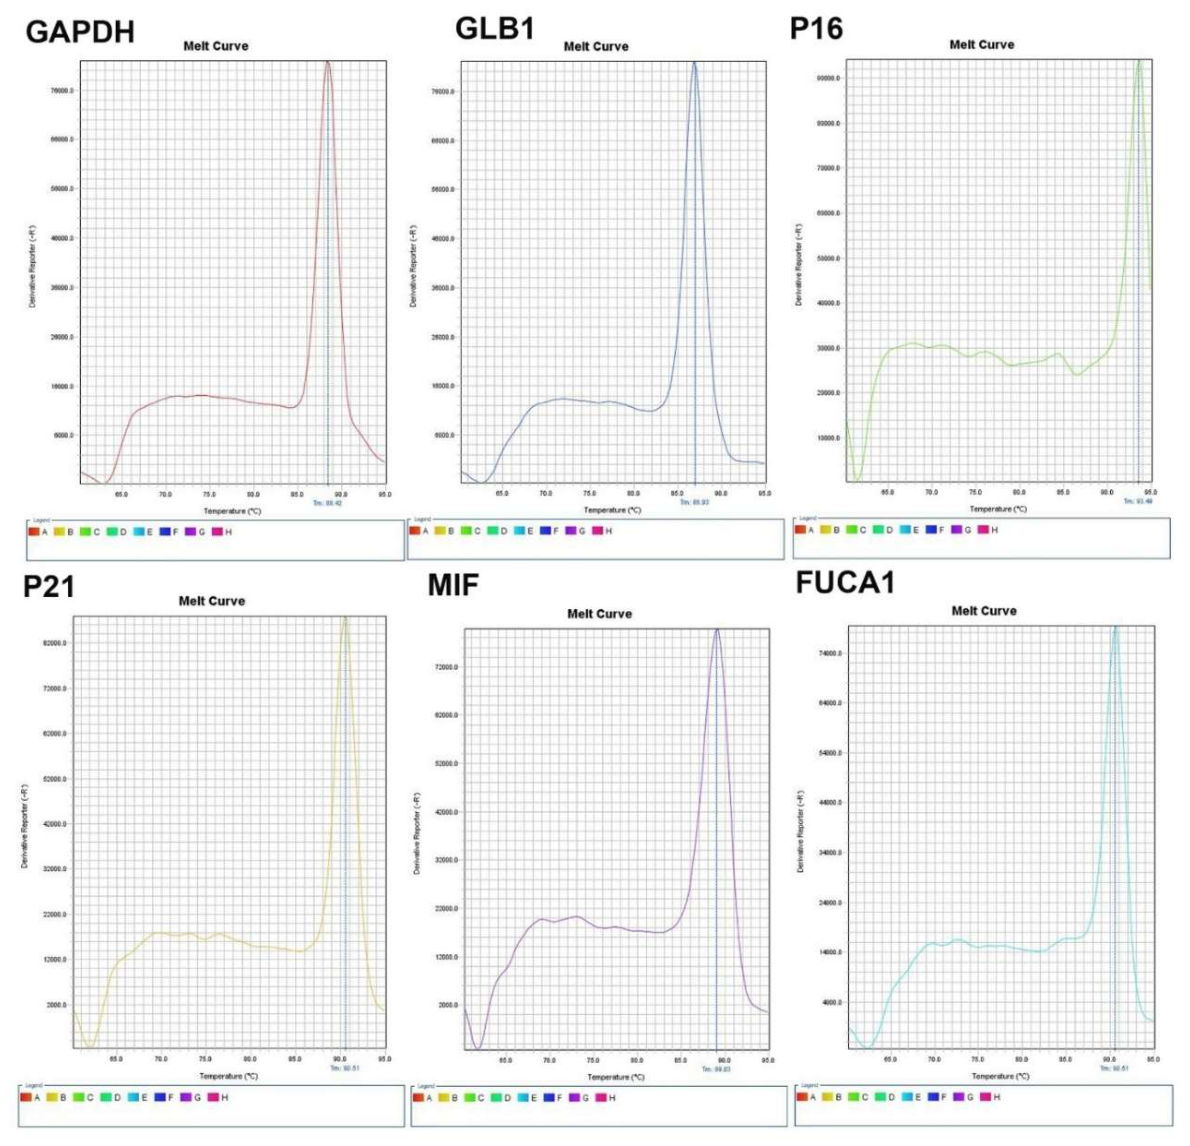
Figure 2.
Fold changes of each gene versus baseline in PBMCs for the Bolus and Daily dose groups at all follow-up visits. A. GLB1 fold changes. B. P16.fold changes. C. P21 fold changes. D. MIF fold changes. E. FUCA1 fold changes. * P<0.05 versus baseline, **P<0.01 versus baseline, ***P<0.001 versus baseline. ## P<0.01 versus Daily dose.
Figure 2.
Fold changes of each gene versus baseline in PBMCs for the Bolus and Daily dose groups at all follow-up visits. A. GLB1 fold changes. B. P16.fold changes. C. P21 fold changes. D. MIF fold changes. E. FUCA1 fold changes. * P<0.05 versus baseline, **P<0.01 versus baseline, ***P<0.001 versus baseline. ## P<0.01 versus Daily dose.
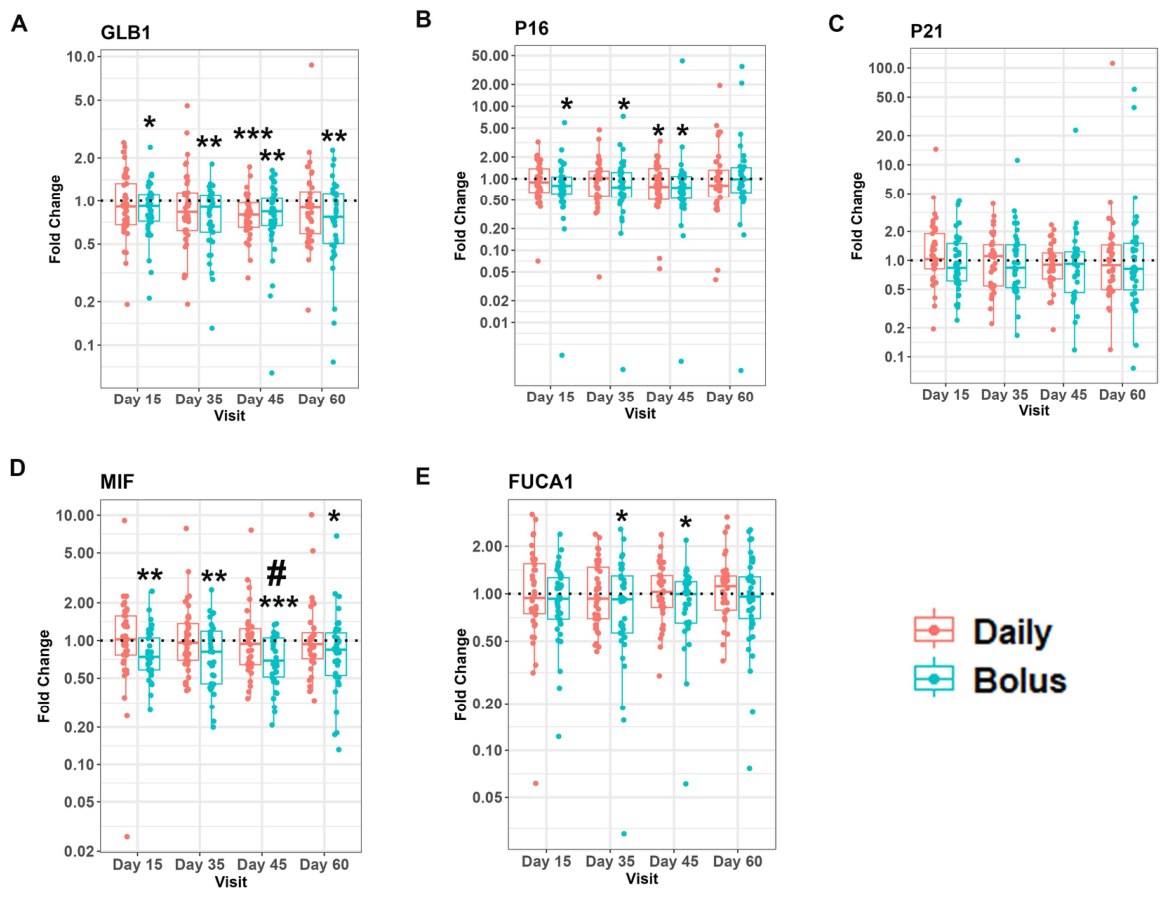
Figure 3.
Correlation of senescent gene with age at baseline. A-E, Correlation chart of GLB1, P16, P21, MIF and FUCA1 with age. No significant correlation was detected between these genes and age.
Figure 3.
Correlation of senescent gene with age at baseline. A-E, Correlation chart of GLB1, P16, P21, MIF and FUCA1 with age. No significant correlation was detected between these genes and age.
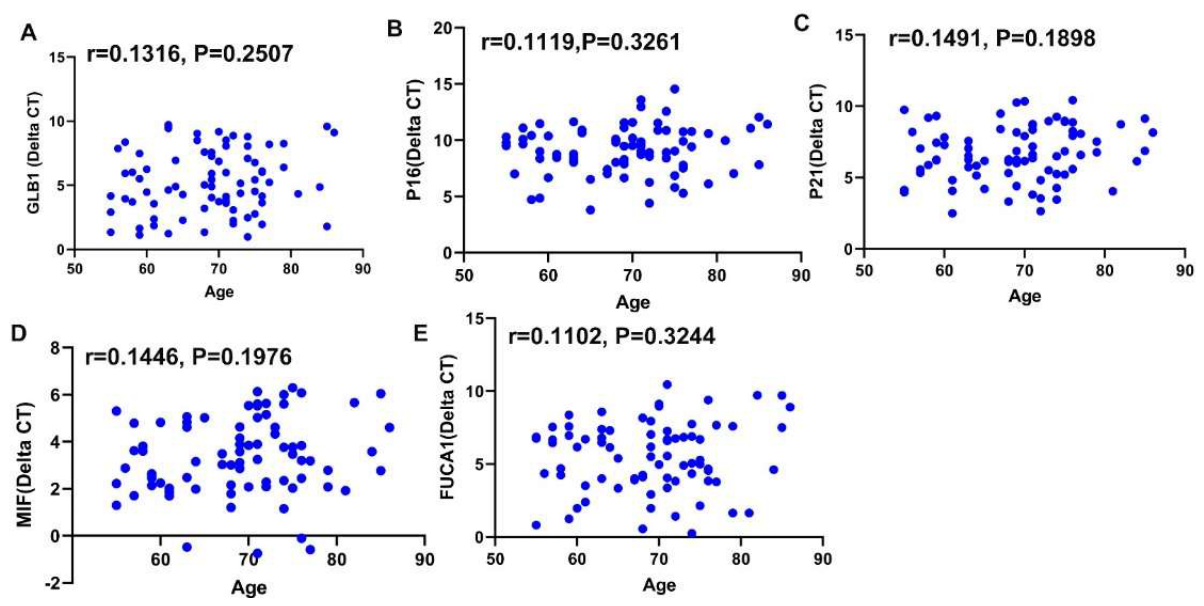

Table 1.
Primer information.
| Gene IDs | Accession number | Forward Primers (5’-3’) | Reverse Primers (5’-3’) | Product size (bp) |
| GAPDH | BC023632 | gccttccgtgtccccactgc | caatgccagccccagcgtca | 211 |
| GLB1 | M34423.1 | ctatagccgggactccttcc | agttccagggcacatacgtc | 158 |
| P16 | L27211 | cttcctggacacgctggt | gaccttccgcggcatctatg | 185 |
| P21 | BC000312.2 | caagctctaccttcccacgg | atctgtcatgctggtctgcc | 226 |
| MIF | EF611126.1 | agaaccgctcctacagcaag | gagttgttccaccccacatt | 121 |
| FUCA1 | BC017338.2 | cttcatgcgcgacaactac | gccagtttgtgaagccttcg | 166 |
Table 2.
Participants’ demographics.
| Characteristics | Total (N=81) | Daily dose (N=41) | Bolus dose (N=40) |
| Sex | |||
| Female | 48 / 81 (59%) | 25 / 41 (61%) | 23 / 40 (58%) |
| Male | 33 / 81 (41%) | 16 / 41 (39%) | 17 / 40 (43%) |
| Age at Enrollment | |||
| Median [Min, Max] | 69 [55,85] | 69 [57,85] | 69 [55,79] |
| (Q1, Q3) | (63, 74) | (62, 72) | (63, 75) |
| Mean ± SD | 68 ± 7 | 68 ± 7 | 68 ± 7 |
| Ethnicity | |||
| Non-Hispanic | 80 / 81 (99%) | 41 / 41 (100%) | 39 / 40 (98%) |
| Unknown or Not Reported | 1 / 81 (1.2%) | 0 / 41 (0%) | 1 / 40 (2.5%) |
| Race | |||
| Asian | 1 / 81 (1.2%) | 1 / 41 (2.4%) | 0 / 40 (0%) |
| Black or African American | 1 / 81 (1.2%) | 1 / 41 (2.4%) | 0 / 40 (0%) |
| White or Caucasian | 79 / 81 (98%) | 39 / 41 (95%) | 40 / 40 (100%) |
| Smoker Status | |||
| Current | 1 / 81 (1.2%) | 0 / 41 (0%) | 1 / 40 (2.5%) |
| Former | 5 / 81 (6.2%) | 1 / 41 (2.4%) | 4 / 40 (10%) |
| Never | 75 / 81 (93%) | 40 / 41 (98%) | 35 / 40 (88%) |
| BMI | |||
| Median [Min, Max] | 23.9 [16.3, 33.5] | 23.9 [16.3, 31.5] | 24.0 [18.0, 33.5] |
| (Q1, Q3) | (20.9, 25.8) | (20.5, 25.8) | (22.1, 26.0) |
| Mean ± SD | 23.9 ± 3.6 | 23.6 ± 3.7 |
|
Table 3.
Results of the two one-sided t-tests (TOST).
| Gene | Equivalence Bounds | Difference in means | 95% Confidence Interval | P value |
| GLB1 | -0.193, +0.193 | 0.039 | -0.237, +0.315 | 0.179 |
| P16 | -0.260, +0.260 | 0.120 | -0.462, +0.701 | 0.345 |
| P21 | -0.124, +0.124 | 0.071 | -0.322, +0.465 | 0.412 |
| MIF | -0.263, +0.263 | 0.461 | +0.155, +0.767 | 0.857 |
| FUCA1 | -0.126, +0.126 | 0.260 | -0.028, +0.549 | 0.780 |
Table 4.
Mixed model for repeated Measures analysis of results at day 45.
| Gene | Estimate | 95% Confidence Interval | P value | FDR |
| GLB1 | -0.040 | -0.363, +0.282 | 0.804 | 1 |
| P16 | -0.129 | -0.797, +0.538 | 0.701 | 1 |
| P21 | -0.072 | -0.533, +0.390 | 0.758 | 1 |
| MIF | -0.474 | -0.828, -0.121 | 0.009 | 0.104 |
| FUCA1 | -0.254 | -0.589, +0.081 | 0.135 | 0.770 |
Table 5.
Mean fold changes versus baseline by group and gene at day 45.
| Group | Gene | Fold Change | 95% CI | P (one-sided) | FDR |
| Daily | GLB1 | 0.79 | 0.70-0.89 | 0.0001 | 0.0014 |
| Daily | P16 | 0.76 | 0.58-1.00 | 0.0239 | 0.1365 |
| Daily | P21 | 0.88 | 0.74-1.06 | 0.0869 | 0.3308 |
| Daily | MIF | 0.96 | 0.78-1.18 | 0.3289 | 0.9388 |
| Daily | FUCA1 | 1.01 | 0.87-1.17 | 0.5305 | 1.0000 |
| Bolus | GLB1 | 0.77 | 0.63-0.93 | 0.0042 | 0.0240 |
| Bolus | P16 | 0.70 | 0.47-1.04 | 0.0372 | 0.1061 |
| Bolus | P21 | 0.84 | 0.64-1.11 | 0.1046 | 0.2389 |
| Bolus | MIF | 0.69 | 0.59-0.81 | <0.0001 | 0.0002 |
| Bolus | FUCA1 | 0.84 | 0.69-1.02 | 0.0351 | 0.1061 |
P <0.05 and FDR <0.4 was considered statistically significant. Bold fonts denote statistical significance.
Table 6.
Fold change versus baseline at different time points by groups.
| Daily Dose | Bolus Dose | |||||||
| Characteristic |
Day 15 N=41 |
Day 35 N=39 |
Day 45 N=36 |
Day 60 N=36 |
Day 15 N=40 |
Day 35 N=37 |
Day 45 N=39 |
Day 60 N=39 |
| GLB1 | ||||||||
| Median (Min, Max) |
0.91 (0.19, 2.55) |
0.84 (0.19, 4.58) |
0.80 (0.29, 1.73) |
0.90 (0.17, 8.74) |
0.92 (0.21, 2.37) |
0.91 (0.13, 1.82) |
0.84 (0.06, 1.64) |
0.77 (0.08, 2.26) |
| Meana (Mean-SE, Mean+SE)b |
0.93 (0.86, 1.01) |
0.87 (0.79, 0.96) |
0.79 (0.74, 0.83) |
0.89 (0.80, 0.98) |
0.87 (0.81, 0.93) |
0.77 (0.70, 0.84) |
0.77 (0.70, 0.84) |
0.71 (0.64, 0.80) |
| P16 | ||||||||
| Median (Min, Max) |
0.89 (0.07, 3.22) |
1.01 (0.04, 4.74) |
0.77 (0.06, 3.31) |
0.80 (0.04, 19.39) |
0.80 (0.00, 5.96) |
0.75 (0.00, 7.28) |
0.75 (0.00, 42.29) |
0.98 (0.00, 35.35) |
| Mean* (Mean-SE, Mean+SE)ǂ |
0.90 (0.82, 1.01) |
0.89 (0.78, 1.00) |
0.76 (0.66, 0.87) |
0.90 (0.74, 1.08) |
0.73 (0.62, 0.86) |
0.70 (0.57, 0.85) |
0.70 (0.57, 0.85) |
0.93 (0.74, 1.16) |
| P21 | ||||||||
| Median (Min, Max) |
1.03 (0.19, 14.49) |
1.11 (0.22, 3.91) |
0.90 (0.19, 2.34) |
0.90 (0.12, 111.71) |
0.84 (0.24, 4.16) |
0.84 (0.17, 11.11) |
0.92 (0.12, 22.75) |
0.82 (0.08, 60.33) |
| Mean* (Mean-SE, Mean+SE)ǂ |
1.18 (1.05, 1.33) |
0.97 (0.87, 1.08) |
0.88 (0.81, 0.97) |
0.98 (0.82, 1.18) |
0.90 (0.81, 1.00) |
0.94 (0.83, 1.07) |
0.84 (0.74, 0.96) |
0.97 (0.80, 1.18) |
| MIF | ||||||||
| Median (Min, Max) |
1.02 (0.03, 9.05) |
0.96 (0.40, 7.84) |
0.94 (0.34, 7.59) |
0.94 (0.33, 10.07) |
0.74 (0.28, 2.47) |
0.81 (0.20, 2.54) |
0.69 (0.21, 1.36) |
0.85 (0.13, 6.83) |
| Mean* (Mean-SE, Mean+SE)ǂ |
0.98 (0.86, 1.12) |
1.03 (0.94, 1.14) |
0.96 (0.86, 1.06) |
1.00 (0.89, 1.12) |
0.78 (0.73, 0.84) |
0.76 (0.69, 0.84) |
0.69 (0.64, 0.75) |
0.79 (0.70, 0.89) |
| Not Available, n | 0 | 0 | 0 | 0 | 1 | 1 | 1 | 1 |
| FUCA1 | ||||||||
| Median (Min, Max) |
0.94 (0.06, 3.18) |
0.93 (0.43, 2.38) |
1.03 (0.30, 2.37) |
1.12 (0.38, 3.06) |
0.93 (0.12 , 2.38) |
0.92 (0.03, 2.56) |
1.00 (0.06, 2.18) |
0.96 (0.08, 2.54) |
| Mean* (Mean-SE, Mean+SE)ǂ |
0.97 (0.87, 1.08) |
0.97 (0.90, 1.05) |
1.01 (0.94, 1.08) |
1.06 (0.99, 1.15) |
0.88 (0.81, 0.96) |
0.78 (0.68, 0.89) |
0.84 (0.76, 0.92) |
0.90 (0.80, 1.00) |
SE=Standard Error; *2^(mean(log2(fold change))); ǂ (2^(mean(log2(fold change))-SE(log2(fold change))), 2^(mean(log2(fold change))+SE(log2(fold change)))).
Table 7.
P values and FDR at different visits for 2 groups.
| Daily Dose | Bolus Dose | |||||||
| Target genes |
Day 15 N=41 |
Day 35 N=39 |
Day 45 N=36 |
Day 60 N=36 |
Day 15 N=40 |
Day 35 N=37 |
Day 45 N=39 |
Day 60 N=39 |
| GLB1 | ||||||||
| P value | 0.2015 | 0.0850 | 0.0001 | 0.1285 | 0.0248 | 0.0023 | 0.0042 | 0.0022 |
| FDR | 1 | 0.9448 | 0.0014 | 1 | 0.1233 | 0.0265 | 0.0240 | 0.0246 |
| P16 | ||||||||
| P value | 0.1607 | 0.1655 | 0.0239 | 0.2857 | 0.0324 | 0.0387 | 0.0372 | 0.3713 |
| FDR | 1 | 0.9448 | 0.1365 | 1 | 0.1233 | 0.1106 | 0.1061 | 1 |
| P21 | ||||||||
| P value | 0.9220 | 0.3933 | 0.0869 | 0.4647 | 0.1632 | 0.3296 | 0.1046 | 0.4427 |
| FDR | 1 | 1 | 0.3308 | 1 | 0.3725 | 0.7526 | 0.2389 | 1 |
| MIF | ||||||||
| P value | 0.4526 | 0.6255 | 0.3289 | 0.4985 | 0.0011 | 0.0048 | <0.0001 | 0.0261 |
| FDR | 1 | 1 | 0.9388 | 1 | 0.0124 | 0.0276 | 0.0002 | 0.1487 |
| FUCA1 | ||||||||
| P value | 0.4008 | 0.3680 | 0.5305 | 0.7932 | 0.0776 | 0.0352 | 0.0351 | 0.1692 |
| FDR | 1 | 1 | 1 | 1 | 0.2216 | 0.1106 | 0.1061 | 0.6439 |
Bold fonts of P values and FDR indicate statistically significant.
Table 8.
Inter-bolus fluctuations between groups.
| Gene | Estimate of difference in CV | Lower Limit 95% CI | P value | FDR |
| GLB1 | -1.79 | -6.41 | 0.755 | 1 |
| P16 | 7.07 | -1.16 | 0.077 | 0.291 |
| P21 | 9.30 | 0.92 | 0.030 | 0.173 |
| MIF | 2.67 | -5.90 | 0.242 | 0.690 |
| FUCA1 | 8.62 | 1.38 | 0.028 | 0.173 |
Disclaimer/Publisher’s Note: The statements, opinions and data contained in all publications are solely those of the individual author(s) and contributor(s) and not of MDPI and/or the editor(s). MDPI and/or the editor(s) disclaim responsibility for any injury to people or property resulting from any ideas, methods, instructions or products referred to in the content. |
© 2026 by the authors. Licensee MDPI, Basel, Switzerland. This article is an open access article distributed under the terms and conditions of the Creative Commons Attribution (CC BY) license (http://creativecommons.org/licenses/by/4.0/).
Copyright: This open access article is published under a Creative Commons CC BY 4.0 license, which permit the free download, distribution, and reuse, provided that the author and preprint are cited in any reuse.


