
Submitted:
22 July 2026
Posted:
22 July 2026
You are already at the latest version
Abstract
Before Cyclone Senyar made landfall on Sumatra in November 2025 it drew moisture from across the South China Sea, Gulf of Thailand and Indian Ocean. The substantial damage its heavy rainfall caused on the NE and W coasts of Sumatra urges us to rethink the relationships between climate, forests, hydrology, land use, human presence, and vulnerability; the simple ‘deforestation causes floods’ narrative is no longer adequate to guide a building-back-better strategy for the areas affected. We reviewed key concepts and framing of the links between ocean temperature, atmospheric moisture transport (‘rivers in the sky’), rainfall extremes, saturation of the existing buffers, river flow and flooding as they account for the space-time pattern of Senyar effects with its multiple landfalls. Atmospheric roughness (slowing down sky rivers and unloading precipitation), surface infiltration and water retention in the soil profile, and mid- and downstream flow delays due to water retention depend on land cover beyond what a simple forest—nonforest terminology can represent. Rather than indiscriminate tree planting efforts, future adaptation and disaster avoidance efforts should balance the reduction of human exposure through effective land use planning and efforts to reduce hazard by restoring and managing vegetation cover and drainage systems.
Keywords:
agroforestry
; atmospheric roughness
; buffering
; cyclone landfall
; deforestation
; exposure
; flow persistence
; hazard
; Indonesia
; total precipitable water
1. Introduction
The 2025 floods in Sumatra were extraordinary not only for the severity of their impacts but for the meteorological conditions that triggered them. Warm surface water on the eastern side of the Indian Ocean coincided with warm La Niña conditions on the western side of the Pacific Ocean and in the Gulf of Thailand. This coincidence led to the interaction of two cyclones: Cyclone Senyar making landfall on the north-eastern coast of Sumatra and Cyclone Ditwa near Sri Lanka, drawing moisture from across the Indian Ocean and producing exceptionally heavy rainfall over the western and northern coast of Sumatra. Impacts were felt in three Indonesian provinces—Aceh, North Sumatra and West Sumatra—where more than 1,200 people died, approximately 80,000 people were displaced and nearly 650 bridges washed out isolating mountain valley villages [1]. Climate Station-level Rainfall maxima were recorded as 311 mm/day in Aceh, 262 mm/day in Medan (N. Sumatra), 230 mm/day in Tapanuli and 154 mm/day in W Sumatra; damage was compounded by landslides [2]. Between the rescue and recovery phases of the disaster response, questions on ‘avoidable harm’ emerged, with multiple answers needing further analysis. “We didn’t deforest and still had landslides and floods to deal with”, a West Sumatra resident commented after the 2025 floods. Is it all due to climate change? Is tree planting still the default solution? [3]. The interactions between forests and floods are complex and involve narratives across different scales and perspectives [4], with a special role, in the public perspective of forests, deforestation and tree planting.
Rather than claiming to have answers, this paper aims at sharpening the questions at the start of dedicated new (participatory) research efforts. Figure 1 connects a biophysical/ecological concept of ‘hazard’ (rising water levels, turbulent flows) to a social-ecological concept of ‘exposure’ (buried by landslides, drowned in turbulent rivers and in floodplains) and a social concept of ‘vulnerability’. The primary relevance of such analysis is to help reduce the probability of repetition of the damage and avoid ‘restoring’ what was apparently a high-risk landscape and ‘building back better’ instead.
Our specific questions for this paper are:
- Q1. (How) Does land cover influence the way hurricane rivers in the sky become rivers on land?
- Q2. How does land cover influence flow buffering and turbulent flows after peak rainfall events?
- Q3. How have demography and land use change affected exposure to flood hazards in various parts of Sumatra affected by the Senyar floods?
- Q4. What lessons can be learned for building back better?
Before exploring these questions, some general background on the Indonesian climate and topography may help readers not familiar with the area.
2. Background on Indonesian topography, climate, and forest concepts
Indonesia, the worlds’ 4th most populous country is a tropical archipelago of some the world’s largest, many smaller and thousands of uninhabited islands, located between Indian and Pacific Ocean. As part of the ‘ring of fire’ volcanically rejuvenated soils are common and have historically allowed high human population densities to emerge, especially in Java and to a lesser extent on Sumatra. The eastern parts are in the rain shadow of the Australian continent, especially in the June to September period when monsoons come from the south and east, while they come from the northwest in December to March period. Prevailing wind patterns interact with local topography to generate significant variations in rainfall throughout the archipelago.
Most of the rivers in Indonesia are relatively short, connecting mountain ranges to the nearest ocean. Relatively long (and large) rivers are found to the East of the Bukit Barisan mountain range of Sumatra, on the island of Borneo and Papua and on the N coast of Java. A combination of high tectonic and volcanic activity and short rivers can explain the exceptionally high sediment load of rivers, with active mangrove formation where sea currents allow. The flood plains formed by these geological processes offer attractive opportunities for agricultural expansion, once seasonal flooding patterns are taken onto account or controlled by specific drainage interventions. The middle and lower reaches of the rivers tend to have ‘energy-limited’ sediment transport, implying that a substantial increase in flow rate and water level can mobilize large volumes already in the river channel, rather than requiring new erosion [4].
2.1. Climate
Rather than by frontal rain patterns derived from the ocean, precipitation in the Indonesian archipelago (sometimes called the Maritime Continent) is primarily driven by a very strong diurnal cycle of local convection that adds ocean-derived to locally recycled atmospheric moisture. However, seasonal and interannual variation in sea surface temperatures matter. Three distinct climatic regions were described for Indonesia [5], with bimodal rainfall patterns in the northern part of Sumatra and Kalimantan and unimodal patterns with a single rainy and dry season in the rest of the country. Analysis of Indonesian rainfall data for the 1985–2010 in relation to Indian Ocean Dipole (IOD) and the El Niño/ La Niña cycle [6] showed that rainfall in northwestern Sumatra was positively correlated with a positive IOD value, while in southern Sumatra and Java it correlated with a negative IOD value; in eastern Indonesia rainfall was positively correlated with La Niña, while in central Indonesia seasonal variations due to monsoons were predominant. The Indian Ocean contribution to rainfall in Sumatra can be linked to convectively coupled Kelvin waves [7] travel from west to east along the equator at around 40 km h-1 (∼12 m s-1) along the equator. A majority of analysed floods in Sumatra could be linked of landfalls of such equatorial Kelvin waves [8]. Hurricanes (also known as typhoons) depend on Coriolis forces and are unknown at the Equator and very rare within a 5o N to 5o S belt around the world.
2.2. Land use patterns
An analysis of historical demographic data for Sumatra starting in the 19th century [9] Figure 2 suggested an interesting reversal from common expectations. Elsewhere in Asia migrations of lowlanders into sparsely settled highlands dominated, but in Sumatra it was the reverse: people moved from their relatively crowded and impoverished high-land valleys into the coastal cities and lowland planes when these became sufficiently safe. The lowland valley and deltas were not in fact hospitable. Floods were a constant problem. Only large-scale irrigation and drainage works could control the large volumes of water in the lowlands. The percentage of the total population of West Sumatra living in coastal lowlands increased from 9 around 1830 to 20 by the 1850’s, 36 in 1920/30 and 49 in 1990. For North Sumatra equivalent estimates are 21% in the 1850’s, 67% in 1920/30 and 77% in the 1990’s.
For Aceh a long history of conflict before and after Indonesian independence coloured the inland-coastal zone relationships. Inland valleys were buffered from outside forces arriving by sea, while State-based security could only be guaranteed in coastal zones. The 2004 Tsunami hit the coastal zones and shifted the balance of power in the province, allowing a political settlement of past conflicts. Lowland populations that recovered from the Tsunami were now badly affected by the Nov 2025 floods, while inland populations were once again cut off from the coast when roads and bridges washed out. The political backgrounds of different types of flood vulnerability need to be appreciated before effective recovery and avoidance measures can be designed.
2.3. Forest concepts
Discussions on the way environmental problem interact with changes in quality and quantity of ‘forest’ in Indonesia (and elsewhere) are hindered by a lack of shared understanding of what non-forest is (Figure 3). As a social-ecological boundary concept the term forest in Indonesia has a strong institutional meaning (the ‘designated forest’ or kawasan hutan typically claimed by the State) and a biophysical one centred on tree cover and quantifiable ecosystem services and hydrological relationships. Functional distinctions in tree-covered lands with various intensities and degrees of agricultural use dominate interactions with the water balance (Figure 3). In our analysis of ‘hazard’ we focus on the relevant functional traits, while for vulnerability and ‘building back better’ discussions the institutional distinctions may matter most.
The current debate interfaces generic theory on how forests are different from all other types of land cover, with the possible idiosyncrasies of a specific cyclone in a given location. While it may be a heresy to challenge the generic validity of forest as a high-level category, without specifying the structure, function and location of what was observed, the low degree of consensus on how much forest is left on the globe and where it is calls for more detailed land cover classification. A recent comparison of ten global maps showed consensus on a forest status for only 26% of the pixels identified as forest in at least one dataset [10]. Similarly, the challenges in making policies operational that are to secure a deforestation-free status of traded commodities [11,12] cast doubt on the continued use of a forest-nonforest dichotomous classification in environmental policies. A recent study in East Java showed a substantial difference in infiltration rates on steep volcanic slopes between remnant natural forest and Pinus merkusii plantations [13]. Differences within the ‘forest’ category are important for functional attributions.
3. (How) Does land cover influence the way hurricane rivers in the sky become rivers on land (Q1)?
A recent review of the published evidence for forest-based reduction of destructive tropical cyclones, hurricanes and typhoons [14] distinguished between potential influences during cyclone formation over (warm) ocean water, rainfall patterns during landfall and subsequent flow dynamics of terrestrial rivers; it used the recent Senyar cyclone as trigger and example. The damage Senyar caused in the Northern parts of Sumatra that lost a considerable part of their natural forest cover in the past decades as exceptional in a near-equatorial area where cyclones don’t normally develop. Senyar caused apparently unprecedented damage to intact forest on the Bukit Barisan mountain range, especially in the Batang Toru landscape (North Sumatra), home to the critically endangered Tapanuli orangutan [15].
In the global assessment of forest-water relations [16] a shift from the generic paradigms (‘all forests are good for all hydrological functions’) to another generic paradigm since the mid 1990’s (‘forests use more water than other vegetation’) was contrasted with a more recent synthesis that emphasizes the importance of location (especially for downwind rainfall effects [17]), functional properties of vegetation and soil. The new synthesis also suggests a quantitative tree cover continuum rather than a dichotomous classification given the broad range of land use systems that include trees [18] at a wide range of landscape positions. The rediscovery of the full hydrological cycle (ocean-land and land-land) brings climatological, hydrological and ecological science of droughts, floods and intermediate ‘normal’ water supply together with a range of social and economic sciences. Droughts and floods are not ‘just’ extremes of a statistical distribution of water availability, but triggers of ecological and human adaptive responses and cascading disasters where past adaptation has been insufficient [19,20]. The increasing popularity of the ‘rivers in the sky’ terminology for flows of atmospheric moisture calls for a comparison with the behaviour of rivers on the earth’s surface.
Quantitative evidence exists for forest and tree role in increased surface roughness during landfall of 19 cyclones that hit Australian coasts during the period 1984-2010; surface roughness and central pressure (~ windspeed at landfall) yielded a combined coefficient of determination of 76% cent during calibration and 59% during validation [21]. Like the buffering effect of coastal tree vegetation on incoming tsunami waves [22], moisture-laden winds lose water after landfall when they are slowed by surface roughness.
3.1. Sky rivers
An atmospheric column can contain up to 70 mm (or kg m-2) of ‘total precipitable water’ (TPW) at any point in time [23,24]. However, atmospheric moisture represents only 0.001% of the amount of water on the planet Earth and 0.04% of global freshwater). Despite this tiny fraction, it acts as a highly renewable and powerful driver of global weather and climate. The mean residence time for atmospheric moisture of 8–10 days while a median of 4–5 days [25,26,27] indicates a long-tailed statistical distribution. Residence times over the ocean are about 2 days less than those over land [28], reflecting TPW values that are closer to their temperature-dependent saturation (TPWmax(temp)) levels. The distance travelled in the atmosphere can be derived as velocity divided by residence time: 9 days at 1 km/h implies a distance of 33 km, at 100 km/h during a storm this will be 33 000 km, or of the order of half a continent. More sophisticated models with two (or more) layers in the atmosphere with different windspeeds and temperatures can refine predictions on the ‘short cycle’ of water over land [29]. As a global average about 60% of rainfall over land originates from terrestrial evapotranspiration [30], varying from nearly 0 at the coast to nearly 100% in the centre of continents [31].
Atmospheric rivers as relatively long, narrow, and lower tropospheric features on the order of 2,000 km in length and 800 km in width that generally form over the oceans and can be part of a cyclone. Latent heat released when atmospheric river water vapor condenses affects atmospheric dynamics and predictability, with a relatively large (22%) root mean square error of the models tested a decade ago attributed primarily to uncertainties in the low-level winds, where vegetation impacts may be strongest [32].
Surface roughness, shaped by terrain and vegetation, reduces wind speed and promotes rainfall. As a result, peak rainfall events (mm h-1) can (manifold) exceed the total precipitable water (mm) in a single column over sea or land, depending on the reduction of windspeed per km of the wind trajectory. Lowland forests, by slowing winds and inducing rainfall, can protect hinterland areas. These ‘rivers in the sky’ follow physical rules that differ from rivers over land (Figure 4).
The flux of atmospheric moisture at any point of its trajectory from the ocean-land transition at the coastline (ignoring stratification for now) equals the velocity (Vatm, ranging from 0 to >100 km h-1) times the total precipitable water content (TPW, ranging from 0 to > 80 kg m-2). Conservation of the mass balance of atmospheric moisture implies that a gradual reduction in Vatm will lead to an equivalent increase in TPW, until a temperature-dependent TPWmax is reached and precipitation P is triggered.
In algebraic form the product rule of calculus (d(Y*Z)/dx = Y (dZ/dx) + Z (dY/dx)) implies that a spatial gradient in the product of Vatm and TPW can be split into two components: the spatial gradient in Vatm multiplied by the average TPW and the spatial gradient in TPW multiplied by the average Vatm.
P − E = Δ(Vatm * TPW) = Vatm * Δ (TPW) + TPW * Δ (Vatm )
And two complementary contributions to the P—E estimate:
and
RelShare_Windspeed_change = Vatm * Δ (TPW) / (Vatm * Δ (TPW) + TPW * Δ (Vatm ))
RelShare_TPW_change = 1—RelShare_Windspeed_change
Popular accounts of ‘orographic rainfall’ emphasize cooling effects of vertical shifts in airflow with consequences for TPWmax and appear to ignore the potentially much stringer ‘windbreak’ effects of mountains, reducing Vatm before the mountains are reached. More sophisticated versions of theory will need to include turbulent flows and multi-layer feedback loops [33].
Concurrent evapotranspiration E will replenish the atmospheric moisture flux. The conventional explanation for ‘orographic’ rainfall emphasizes the reduction in temperature (and hence TPWmax) where higher layers of the atmosphere are reached, but the reduction in windspeed, and hence rainfall, may occur before the actual mountain is reached, similar to other ‘windbreak’ effects. The relative change in Vatm due to ‘congestion’ is manifold larger than the change in TPWmax.
This simple description is focused on atmospheric moisture, but concomitant changes in ‘air pressure’ based mostly on non-water components of the atmosphere interact with the dynamics if windspeed in complex feedback loops. Pressure differences can determine the direction of atmospheric moisture flow, with further ‘congestive’ conditions in the curves of flow-paths.
Where precipitation is in the form of rainfall (rather than snow that waits for conditions facilitating snowmelt) it can be absorbed by aboveground vegetation, stored in the (non-saturated) soil or reach the streams and rivers. The water flux in rivers equals Vriv x W x H, where width (W) and water level (H) are determined by local geomorphology, with potential human modifications. Where W is constrained in a riverbed (or even more so in a canal), an increase in H is the main degree of freedom to increase flux, as Vriv is determined by the gradient of the river, modified by surface roughness (as characterized by Manning factor), modestly increasing when the H and flow volume increase.
Oher than a ‘congestion’ effects in atmospheric flux that leads to P, a reduction of Vriv when the river enters peneplains tends to be compensated by an increase in W, in what are often described as floodplains. In these floodplains Vriv is reduced and river-born sediments can be deposited (first stone fractions and sand, followed by silt and clay). As the sediment carrying capacity of a river involves Vriv to the power 4 (by approximation), relatively small changes in Vriv can induce sedimentation. Sedimentation in riverbeds and floodplains remains vulnerable to a next flood event with higher Vriv levels, unless vegetation with superficial root development stabilizes it.
Considering these essential differences in the determinants, constraints and degrees of freedom of rivers in the sky (generating P) and rivers on land (transporting non-buffered P), the ‘river in the sky’ language may be appreciated for its poetic power but may mask essential differences.
3.2. Senyar landfall
In the specific case of the Senyar cyclone a rare coincidence of a La Nina phase in the Pacific ocean with warm ocean waters to the East of the Indonesian archipelago and a negative Indian Ocean Dipole with warm ocean waters to the West of the Indonesian archipelago led to warm waters in the Gulf of Thailand and a flow of moist air that crossed the Malaysian peninsula at its narrowest point near Songkla in S Thailand (Figure 5). A relatively low surface roughness due to forest conversion may have contributed to this addition of atmospheric moisture feeding the start of the Senyar cyclone around November 24. As a parallel cyclone nucleus developed around Sri Lanka, the Senyar circulation could feed of Indian ocean flows and hit Sumatra’s W Coast, with W Sumatra and Tapanuli hid hardest, on the SW side of the Bukit Barisan range with rivers flowing towards the coast overflowing their banks. Subsequent Senyar landfall was around the border between Aceh and N Sumatra province and the lowlands here, with much of previous mangrove converted to rice paddies flooded and receiving silt and clay deposits that damage crops (in the short run) and flood housing areas (built on floodplains). Strong winds and rainfall hit the NE side of the Bukit Barisan range, with rivers flowing towards the coast overflowing their banks.
For the ocean-to-land moisture transfer associated with cyclone landfalls, the windspeed and TPW (Total Precipitable Water, expressed in mm and generally below 70 mm) determine the potential rainfall. Where windspeed is reduced and TWP would otherwise exceed the maximum values rainfall occurs. Point level rainfall on land can be multiple times the maximum TPWmax and values recorded in Sumatra up to 350 mm in 24 hours are possible. Windspeeds at landfall may still be around 30 km h-1, and where they get reduced to around 5 km h-1, six times TPW is possible as rainfall. Following this simple logic (mass balance for atmospheric moisture) with values for windspeeds and TPW encountered in the Senyar context, we can explore the effects of vegetation roughness on the spatial pattern of rainfall (e.g., by a high and low value).
A more detailed account of the day-to-day dynamic in November 2025 (Figure 6) shows that Senyar, after forming in the Strait of Malacca appeared to be heading for the Malaysian peninsula on November 23 before connecting with cross-Sumatra atmospheric flows and hitting the coast of East Aceh and Norh Sumatra on November 26. The strong winds reaching the W coast of Sumatra from 24-27 November shifting Southwards and were probably stronger than the normal equatorial Kelvin waves. For a transect perpendicular to the coast the dynamic of TPW and VAtm_ (Figure 7) revealed interesting patterns.
In the last 50-100 km before reaching the coastline the windspeed already was reduced by half (Figure 7) with further reductions in the first 50 km of overland travel—essentially before the Bukit Barisan mountain range was reached. Estimates of P-E based on the spatial gradient in the (TPW * Vatm) product suggest heavy rainfall in the coastal zone, on both sides of the ocean-land transition. This pattern is consistent with satellite-derive long-term rainfall data provided by Baranowski et al. [8] (Figure 8).
Within say 100 km from the coast nearly all TPW is expected to become rainfall. In the first zone along the coast, the presence of forest would increase rainfall, but further from the coast rainfall will be higher if coastal zones have lower atmospheric roughness (Figure 9). If this is a dominant pattern, a simple regression of rainfall on local forest cover will probably not show statistically significant relationships, as has been the general conclusions for studies based on station data. It suggests that where lowland areas near the coast became flooded local rainfall was a major contributor, rather than river flow from upper and middle parts of the watershed. Specifically for the N Sumatra area the relationship between rainfall and deforestation was extensively studied in the 1920’s (when large-scale plantations were rapidly expanding)—but data could not reject a ‘no impacts’ null hypothesis [34].
4. How does land cover influence flow buffering and turbulent flows after peak rainfall events (Q2)?
Given a spatial pattern in rainfall, river flow will concentrate rainfall excess in a specific channel that is often a primary attractor of human activity. In a catchment where all soil surfaces are sealed and no water infiltrates the soil, as happened during a certain phase of ‘modernization’ of cities, the drains, streams and rivers must deal with all rainfall instantaneously. Where there is vegetation and a living soil, part of the rainfall is (Figure 10):
- Intercepted by the leaves of plants,
- Captured in a surface litter layer that protects the soil,
- At field-scale some of the overland flow can be trapped due to surface roughness and local ponding,
- The water infiltrated will first replenishing soil moisture absorbed by plant roots after the previous rainfall event,
- The surplus water can normally (with exceptions causing saturation overflow) finds its way through the soil profile to a downhill riparian zone on sloping land and/or vertically replenishing groundwater that can gradually seep into rivers.
The processes can be quantified based on process-based research in various land cover types. The quantities of water involved in each of these processes depend on the timing and intensity of a rainfall event, of features of the terrain, the inherent characteristics of soil, the vegetation and human impacts on the soil-plant-atmosphere system. The amount of rainfall that does not show up in the river within one day of a rainfall event is said to be ‘buffered’. This will be close to zero for the city and may be above 90% for undisturbed natural forests.
A flow persistence (Fp) or buffering indicator links two aspects of water retention: reductions in peak flow after precipitation events and a gradual release of stored water maintaining base flows. Temporal autocorrelation in daily river flow data ((Qt, Qt+1) pairs) can be explored to derive the Fp parameter according to [36]:
where Ptx is the (spatially weighted) precipitation on day t (or preceding precipitation released as snowmelt on day t) in mm day−1; Etx , also in mm day−1, is the preceding evapotranspiration that allowed for infiltration during this rainfall event (i.e., evapotranspiration since the previous soil replenishing rainfall that induced empty pore space in the soil for infiltration and retention). Between the extremes of natural forest and sealed city, a wide range of ‘buffer coefficients’ (between 0 and 1) can be found.
Qt = Fp Qt−1 + (1 − Fp) (Ptx − Etx)
Calculations on river peak flow can also be made using the ‘curve number’ approach that originated in the USA [37]. Where there is a well-established empirical base, the curve numbers can be estimated for all relevant land cover types in combination with soils and terrain. Where such data are scarce, however, a more process-based approach to link ‘structure’ of vegetation and soil to function may be more flexible as it can deal with intermediate land cover types, such as found in ‘agroforests’, a category relevant in Indonesia but not in the USA.
A process-level understanding suggests that the value of Fp will depend on Ptx and that under high rainfall the buffer capacity is saturated once the landscape is water-filled but in the data series analysed so far such saturation was not evident [38] and a (1-Fp) fraction of peak precipitation could still be retained. Yet we must assume that with extreme rainfall events this no longer holds true, while relative differences between land uses in Fp can still be reflected in peak flows (Figure 11C).
Default estimates that are aligned with literature values (‘guesstimates’) are used in the GenRiver model [39]. Setting up values for various land cover types and then combining them to landscape scale scenarios suggests an initial drop in buffering when logging operations start and plantations (timber, oil palm) are developed. Traditional agroforests and upland agriculture are similar in impact to logging, while intensified agriculture (despite the well-buffered rice paddies) represents a substantial drop in buffering and urbanization reduces buffering below 10% of rainfall. For the details of such a calculation further local fine-tuning is needed, but the relative differences appear to be realistic (and aligned with four SE Asian watershed examples in [37]). The buffering indicator for paddy rice terraces is like that measured for multistrata agroforests [40] but based on different term of the equation .
4.2. Specific roles for forests?
Beyond a ‘deforestation’ discourse, we need to understand the buffer factor of the and cover that replaced natural forest, whether this still within the ‘forest’ category of land use plans. Converting natural forests to other tree-based systems alters the hydrological services provided by the cover, include canopy roughness, which may influence atmospheric moisture transport and rainfall patterns, infiltration regulation that influence surface runoff. Therefore, the role of forests in flood hazard management should be considered holistically, considering not only by assessing each vegetation, soil and rainfall individually, but also by the interaction of these three components.
The processes listed in Figure 3 indicated the main aspects of land cover/land use that need to be considered for any land cover type:
- Atmospheric Roughness (heterogeneity of tree heights), typically high for mixed-age and mixed-species stands and boundary plantings, low for even-aged monocultures)
- Rainfall nuclei influencing the critical temperature for raindrop formation,
- Leaf Area Index and its phenology or seasonal pattern
- Surface litter layer due to varied litterfall rates and qualities,
- Woody roots that explore subsoil
- Macroporosity as generated by root turnover and ‘soil engineers’ among the biota supported.
Flood hazard regulation needs to be viewed more broadly, considering not only by assessing each vegetation, soil and rainfall individually, but also by the interaction of these three components. Merten et al. [41] attributed changes in local flooding regimes of the Tembesi river in Jambi (Sumatra, Indonesia) (after accounting for specifics of the rainfall pattern) to an increase in surface runoff due to soil compaction after the conversion of forests and ‘jungle rubber’ to monoculture plantations (rubber, oil palm) and to the increasing encroachment and conversion of naturally vegetated wetlands.
Specifically in forested areas there is a risk for increased flood risks where log-jams or debris dams build up and initially. As deep landslides are part of a natural forest dynamic, the sudden blockage of streams can occur in natural forests, but the probability gets much higher where ongoing logging operations increased the presence of logs in the landscape. The latter especially where the operators are hiding their logs while waiting for an opportunity to escape attention in getting it out of the forest area. A difference between the two causes of debris dams is in the presence of trees with intact root systems, versus cut stems.
5. Exposure to flood hazards in various parts of Sumatra (Q3)?
From the rich sources of data [1] on actual damage across the various parts of Sumatra affected, it is clear exposure has been hard to avoid in several settings:
- Coastal zones along the West coast where floods happened even though W-facing mountain slopes had generally protected forest cover; yet tree fall and landslides caused increased risk along the river channels, some of which are densely populated,
- Inland areas, where bridges washed out and road access was blocked, sometimes for weeks before road access could be re-established;
- Flood plains and large irrigate agriculture schemes along the N and E coast of Sumatra where rainfall intensity substantially exceeded water buffering options, especially where peat and drainage-cased subsidence had already increased groundwater tables. Turbulent flow of rivers had mobilized large volumes of soil particles that sedimented on crop fields and destroyed the existing crops.
(North-)East coast floods occurred due to insufficient water storage capacity, aggravated by peat subsidence; local rainfall already exceeded storage [41], with additional river flow aggravating the damage (and adding siltation problems). While the Senyar Flood is a rare event, it still has the potential to occur due to the confluence of certain atmospheric and biophysical conditions. Therefore, the water storage capacity achieved under “normal” flood conditions may not be applicable during ‘new normal climate’ that lead to a ‘new’ (extreme) flood condition. The government and community may have considered spatial planning for residential and productive areas within “normal” flood-prone areas. However, the government and community still need to develop mitigation scenarios for areas vulnerable to “extreme” flooding when such events occur again in the future.
Some recommended mitigation scenarios for the government and community to implement in facing the “new normal climate” include:
In settlement and industrial areas along roads: The drainage system in densely populated areas is poor in design, construction and maintenance; it needs to combine local surface water storage areas for groundwater recharge and excess water disposal without undue damage downstream. Managed resettlement of flood-prone people must be sensitive to their needs and rights.
In irrigated and drained lowlands: Adjust water management and storage plans to ‘new normal’ climates.
In plantation areas: Instead of further expansion, sustainable intensification (closing yield gaps, currently around 50% in oil palm, for example) can allow for increased production (say from 50 to 80% of potential yields), while existing drainage standards need to be re-assessed for their external environmental impacts as well as production levels. Mixed gardens with perennial crops (‘kebun lindung’) offer lessons in managed trade-offs, with permanent protective soil cover.
In riparian zones: The legal obligations to maintain the protective functionality of riparian zones need to be enforced and monitored. More space for rivers upstream protects downstream areas from flood peaks.
In remote villages with a single road access option: be prepared that transport can be interrupted and store essentials.
In remaining primary and secondary forests on slopes (>15%): understanding where and how landslides can start and be filtered and how debris dams originate needs to inform management.
Land suitability and downstream vulnerabilities need to be explicit part of zoning and (re)new(ed) concession permits.
6. What lessons can be learned for building back better? (Q4)
There is a long tradition in classifying watershed degradation’ based on ‘forest cover’ with limited use of hydrological data (the popular maximum/minimum flow metric is not applicable where streams are intermittent and the minimum is zero). Aligned with the history of land use, the issues that arose and the solutions created, a patchwork of concepts deals with ‘land degradation’/’restoration’, each with its own idea of relevant metrics (what can be measured to establish priorities and monitor progress).
The simplest way to avoid damage may be to ensure that nobody is exposed. If at the time of the Dec 2004 Tsunami all mangrove areas would have been intact and not inhabited, nobody would have drowned there (but where would they have lived? At what risk?). The strongest ‘explanations’ for flood damage is human population density. As this is negatively related to forest cover, it may seem that forest cover actively protects people—maybe it does in a given (or even many) context(s) but for a clean analysis of disasters ‘hazard’ needs to be considered from ‘exposure’, while both combine to ‘explain’ (human) vulnerability (Table 1).
Vulnerability (likelihood of victims) is the result of ‘hazard’ (extreme events to occur) and ‘exposure’ (being at wrong time at wrong place). Exposure is easier to control than hazard, and measures to reduce human vulnerability to floods include:
- o
- Not (re)building houses in the likely course of flash-floods in the local river systems,
- o
- Not (re)building houses at places exposed to landslide risk,
- o
- Not (re)building cities on ‘flood plains’, even though floodplains may have fertile soil and are close to rivers as economic access option,
- o
- If floodplains have still been developed into settlement areas select the highest places, and/or protect selected areas by dykes and drainage canals,
- o
- Ensure that bridge design and construction is accompanied by appropriate risk analysis,
- o
- Create early warning systems that lead to the temporary evacuation of at-risk locations
- o
- Have risk awareness built into all aspects of water management, as all parts are connected.
7. Discussion
In discussing floods with various stakeholders, it may help to clarify a terminology for the various time and spatial scales involved in ‘floods’ (Table 2).
For the specific hurricane-induced floods the spatial distribution of damage appears to be incompletely understood. Recorded windspeeds in space and time after hurricane landfalls have often been described as exponential decay models, with regional variation in decay rates that can be attributed to multiple factors [43]. When hurricane Maria crossed Puerto Rico with wind speeds as high as 250 km h-1 it resulted in widespread damages but also in loss of weather station data. After the event spatial patterns in tree breakage could be used to model the distribution of hurricane wind speed when ground readings were sparse [44]. A case study for the east coast of India found that mangrove tree cover influenced windspeed reduction after cyclone landfall but identified a need for further quantification [45].
Complex causation of rainfall with at least ten (historical) concepts that may coexist in contemporary public discussions [46]. Our shift from ‘vertical’ (temperature-based) to horizontal (inflow exceeds outflow) concepts of ‘orographic’ rainfall is aligned with how windbreaks work (effect before the actual barrier) but deserve further analysis and communication efforts. The hurricane landfall can add arguments to a long-standing debate:
- The ‘Prevailing Winds’ alternative [30] to the Biotic Pump theory accepts wind as part of latitude-dependent atmospheric circulation systems but emphasizes quantification of atmospheric moisture balances.
- The hurricane-landfall literature suggests that tree cover reduces (rather than increases as the biotic pump theory assumes) windspeed. If Land-Ocean interface changes in wind speed can indeed be used to predict ‘flux conserving’ rainfall, it is the reductions in windspeed slowing down winds that affect rainfall (rather than increase in windspeed).
The relationship between deforestation and increased flooding has been much debated. It may help to distinguish between effects on hazard (modified rainfall, modified river flow), on exposure (e.g., previously forested locations become settlements, as happens where urban mangroves are converted) and effects on vulnerability as such. The deforestation → flood discourse may involve the following steps:
Flood hazards appear to increase in frequency/duration/intensity (at least when a recent event sparks interest),
- There are plausible causal links with increased weather variability due to global climate change,
- Forests continue to be converted and/or degraded due to (legalized?) large-scale operations and/or (illegal?) small farmers [48],
- Urban areas keep expanding, reducing flood tolerance unless engineering interventions are effective,
- Unless exposure is managed and reduced, increased hazards contribute to increased vulnerability, especially for those with low tolerance (‘already vulnerable’),
- It matches policy agenda’s if A can be linked to B, to C or both,
- Realistic damage minimization policies embrace point D, E and F.
8. Conclusions
As part of new interdisciplinary efforts by Indonesian scientists to analyse the various backgrounds of the substantial damage in the aftermath of the Senyar hurricane in Sumatra, we hope that there will be space for the diversity of views and perspectives, rather than a rapid choice for a single simplified narrative that dominate recovery.
The substantial increase in remotely sensed data is not yet matched by ‘theories of place’ and ‘theories of change’ that can effectively inform current actions. Desirable future empirical work includes the dissection of the terrain and vegetation interaction in atmospheric roughness effects; further work is also needed on quantification of flow buffering, plantation drainage systems and ‘space for the river’ concepts can reduce exposure of lowland flood-prone areas on former floodplains.
Future adaptation and disaster avoidance efforts should balance the reduction of human exposure through effective land use planning and efforts to reduce hazard by restoring and managing vegetation cover and drainage systems.
Author Contributions
Conceptualization, MvN; methodology, MvN and LT. Both authors have read and agreed to the published version of the manuscript.
Funding
This research received no external funding.
Data Availability Statement
Data derived from public sources will be made available for further processing on request.
Conflicts of Interest
The authors declare no conflicts of interest.
Abbreviations
The following abbreviations are used in this manuscript:
| Acronym | Meaning |
| E | Evapotranspiration (kg m-2 or mm) |
| ENSO | El Niño-Southern Oscillation, also known as the El Niño/ La Niña cycle in the Pacific ocean |
| Fp | Flow persistence index |
| IDG | Inner Development Goals, https://innerdevelopmentgoals.org/ |
| IOD | Indian Ocean Dipole |
| P | Precipitation (kg m-2 or mm) |
| Qt | River debit at time t |
| TPW | Total Precipitable Water (kg m-2 or mm) |
| TPWmax(temp) | Temperature-dependent value of TPW where precipitation is triggered (by ice-nucleation) |
| VAtm | Velocity of atmospheric flows relevant for moisture transport (weighted average for multi-layer models) |
| VRiv | Velocity of river flow |
References
- Kementerian Perencanaan Pembangunan Nasional/Badan Perencanaan Pembangunan Nasional. Rencana induk percepatan rehabilitasi dan rekonstruksi pascabencana di Wilayah Provinsi Aceh, Provinsi Sumatera Utara dan Provinsi Sumatera Barat [“Master plan for the acceleration of post-disaster rehabilitation and reconstruction in the provinces Aceh, North and West Sumatra”]; Government of the Republic Indonesia, 2026. [Google Scholar]
- Wu, H.; Gao, H.; Huang, Y.; Xu, C. Analysis of the Compound Disaster Caused by Extreme Rainfall and Landslides in Sumatra, Indonesia in 2025 and Its Implications for Disaster Prevention and Mitigation. Nat. Hazards Res. 2026, 6(2), 385–392. [Google Scholar] [CrossRef]
- Carrick, J.; Abdul Rahim, M.S.A.B.; Adjei, C.; et al. Is planting trees the solution to reducing flood risks? J. Flood Risk Manag. 2019, 12(S2), e12484. [Google Scholar]
- van Noordwijk, M.; Leimona, B.; Agus, F.; Abdurrahim, A.Y.; Ekadinata, A. Flood risk, landscapes and adaptive capacity. In White Paper; CIFOR-ICRAF, Bogor-Nairobi: Bogor, Indonesia, 2026. [Google Scholar] [CrossRef]
- Aldrian, E.; Dwi Susanto, R. Identification of three dominant rainfall regions within Indonesia and their relationship to sea surface temperature. Int. J. Climatol. 2003, 23(12), 1435–1452. [Google Scholar] [CrossRef]
- Lee, H.S. General rainfall patterns in Indonesia and the potential impacts of local seas on rainfall intensity. Water 2015, 7(4), 1751–1768. [Google Scholar] [CrossRef]
- Lawton, Q.A.; Rios-Berrios, R.; Majumdar, S.J.; Emerton, R.; Magnusson, L. The representation of convectively coupled Kelvin waves in simulations with modified wave amplitudes. J. Adv. Model. Earth Syst. 2024, 16(6), e2023MS004187. Available online: https://agupubs.onlinelibrary.wiley.com/doi/full/10.1029/2023MS004187. [CrossRef]
- Baranowski, D.B.; Flatau, M.K.; Flatau, P.J.; Karnawati, D.; Barabasz, K.; Labuz, M.; Latos, B.; Schmidt, J.M.; Paski, J.A.; Marzuki. Social-media and newspaper reports reveal large-scale meteorological drivers of floods on Sumatra. Nat. Commun. 2020, 11(1), 2503. [Google Scholar] [CrossRef] [PubMed]
- Reid, A. Inside out: the colonial displacement of Sumatra’s population. Pp 61-89. In Paper Landscapes: explorations in the environmental history of Indonesia; Boomgaard, P., Colombijn, F., Henley, D., Eds.; KLTV press: Leiden, 1997. [Google Scholar]
- Castle, S.E.; Newton, P.; Oldekop, J.A.; Baylis, K.; Miller, D.C. Global forest dataset incongruence creates high uncertainties for conservation, climate, and development policy. One Earth 2026, 9(2). [Google Scholar] [CrossRef]
- van Noordwijk, M.; Leimona, B.; Minang, P.A. The European deforestation-free trade regulation: collateral damage to agroforesters? Curr. Opin. Environ. Sustain. 2025, 72, 101505. [Google Scholar] [CrossRef]
- Beyer, J.F.; Köthke, M.; Lippe, M. Assessing the Suitability of Available Global Forest Maps as Reference Tools for EUDR-Compliant Deforestation Monitoring. Remote Sens. 2025, 17(17), 3012. [Google Scholar] [CrossRef]
- Suprayogo, D.; Firmansyah, A.; Al-Faruqi, M.; Ramadhan, D. W.; Nita, I.; Hairiah, K.; van Noordwijk, M. Earthworms, Soil Porosity, and Infiltration Rates in Pine Plantation Forests in Java, Indonesia. Forests 2026 (19994907), 17(5), 565. [Google Scholar] [CrossRef]
- Sheil, D. How forests may reduce the incidence of destructive tropical cyclones, hurricanes and typhoons. Forests 2026, 17, x. [Google Scholar] [CrossRef]
- Meijaard, E.; Wafiy, M.; Ni’Mattulah, S.; Dennis, R.; Hadisiswoyo, P.; Sheil, D.; Descals, A.; Gaveau, D.L.; Unus, N.; Kühl, H.; Otto, F.E. Extreme rainfall further endangers the world’s rarest great ape. Curr. Biol. 2026, 36(12), 3176–3183. [Google Scholar] [CrossRef] [PubMed]
- Creed, I.F.; van Noordwijk, M. Forest and water on a changing planet: vulnerability, adaptation and governance opportunities. A global assessment report; IUFRO: Vienna, 2018. [Google Scholar]
- Creed, I.F.; Jones, J.A.; Archer, E.; Claassen, M.; Ellison, D.; McNulty, S.G.; van Noordwijk, M.; Vira, B.; Wei, X.; Bishop, K.; Blanco, J.A. Managing forests for both downstream and downwind water. Front. For. Glob. Change 2019, 2, 64. [Google Scholar] [CrossRef]
- van Noordwijk, M.; Dewi, S.; Minang, P.A.; Harrison, R.D.; Leimona, B.; Ekadinata, A.; Burgers, P.; Slingerland, M.; Sassen, M.; Watson, C.; Sayer, J. Beyond imperfect maps: Evidence for EUDR-compliant agroforestry. People Nat. 2025, 7(7), 1713–1723. [Google Scholar] [CrossRef]
- Ayenkulu, E.; Sileshi, G.W.; Wamucii, C.N.; Bakarr, M.I.; Apel, U.; Duron, G.; Daniel Tsegai, D.; van Noordwijk, M. Drought: Impacts, Prevention, and Adaptation Options Across Scales. Annu. Rev. Environ. Resour. 2026. [Google Scholar]
- Iiyama, M.; Derero, A.; Kelemu, K.; Muthuri, C.; Kinuthia, R.; Ayenkulu, E.; Sinclair, F. L. Understanding patterns of tree adoption on farms in semi-arid and sub-humid Ethiopia. Agrofor. Syst. 2017, 91(2), 271–293. [Google Scholar]
- Saha, K.K.; Wasimi, S.A. Statistical modelling of tropical cyclones’ longevity after landfall in Australia. Proc. SPIE 8372, Ocean Sensing and Monitoring IV, 2012; p. 837218. [Google Scholar] [CrossRef]
- Bayas, J.C.L.; Marohn, C.; Dercon, G.; et al. Influence of coastal vegetation on the 2004 tsunami wave impact in west Aceh. Proc. Natl. Acad. Sci. 2011, 108(46), 18612–18617. [Google Scholar] [CrossRef]
- Wan, N.; Lin, X.; Pielke, R. A., Sr.; Zeng, X.; Nelson, A. M. Global total precipitable water variations and trends over the period 1958–2021. Hydrol. Earth Syst. Sci. 2024, 28, 2123–2137. [Google Scholar] [CrossRef]
- Liu, B.; Tan, X.; Gan, T.Y.; Chen, X.; Lin, K.; Lu, M.; Liu, Z. Global atmospheric moisture transport associated with precipitation extremes: Mechanisms and climate change impacts. Wiley Interdiscip. Rev. Water 2020, 7(2), e1412. [Google Scholar] [CrossRef]
- Gleick, P. H. Water resources. In Encyclopedia of Climate and Weather; Schneider, S.H., Ed.; Oxford University Press: New York, 1996; vol. 2, pp. 817–823. [Google Scholar]
- Trenberth, K. E. Atmospheric moisture residence times and cycling: Implications for rainfall rates and climate change. Clim. Change 1998, 39(4), 667–694. [Google Scholar] [CrossRef]
- Gimeno, L.; Eiras-Barca, J.; Durán-Quesada, A. M.; Dominguez, F.; van der Ent, R.; Sodemann, H.; Kirchner, J. W. The residence time of water vapour in the atmosphere. Nat. Rev. Earth Environ. 2021, 2(8), 558–569. [Google Scholar] [CrossRef]
- van der Ent, R. J.; Tuinenburg, O. A. The residence time of water in the atmosphere revisited. Hydrol. Earth Syst. Sci. 2017, 21(2), 779–790. [Google Scholar] [CrossRef]
- Wang, Q.; Liu, Y.; Zhu, G.; Lu, S.; Chen, L.; Jiao, Y.; Li, W.; Li, W.; Wang, Y. Regional differences in the effects of atmospheric moisture residence time on precipitation isotopes over Eurasia. Atmos. Res. 2025, 314, 107813. [Google Scholar] [CrossRef]
- Ellison, D.; Morris, C. E.; Locatelli, B.; Sheil, D.; Cohen, J.; Murdiyarso, D.; Gutierrez, V.; et al. Trees, forests and water: Cool insights for a hot world. Glob. Environ. Change 2017, 43, 51–61. [Google Scholar] [CrossRef]
- van der Ent, R. J.; Savenije, H. H.; Schaefli, B.; Steele-Dunne, S. C. Origin and fate of atmospheric moisture over continents. Water Resour. Res. 2010, 46(9). [Google Scholar] [CrossRef]
- Lavers, D. A.; Rodwell, M. J.; Richardson, D. S.; Ralph, F. M.; Doyle, J. D.; Reynolds, C. A.; Tallapragada, V.; Pappenberger, F. The gauging and modeling of rivers in the sky. Geophys. Res. Lett. 2018, 45(15), 7828–7834. [Google Scholar] [CrossRef]
- Houze, R. A., Jr. Orographic effects on precipitating clouds. Rev. Geophys. 2012, 50(1). [Google Scholar] [CrossRef]
- Braak, C. The Climate of the Netherlands Indies. In Koninklijk Magnetisch en Meteorologisch Observatorium te Batavia, Verhandelingen No. 8..; 1929. [Google Scholar]
- Suprayogo, D.; van Noordwijk, M.; Hairiah, K.; Meilasari, N.; Rabbani, A.L.; Ishaq, R.M.; Widianto, W. Infiltration-friendly agroforestry land uses on volcanic slopes in the Rejoso Watershed, East Java, Indonesia. Land 2020, 9(8), 240. [Google Scholar] [CrossRef]
- van Noordwijk, M.; Tanika, L.; Lusiana, B. Flood risk reduction and flow buffering as ecosystem services–Part 1: Theory on flow persistence, flashiness and base flow. Hydrol. Earth Syst. Sci. 2017, 21(5), 2321–2340. [Google Scholar] [CrossRef]
- Savvidou, E.; Efstratiadis, A.; Koussis, A. D.; Koukouvinos, A.; Skarlatos, D. The curve number concept as a driver for delineating hydrological response units. Water 2018, 10(2), 194. [Google Scholar] [CrossRef]
- van Noordwijk, M.; Tanika, L.; Lusiana, B. Flood risk reduction and flow buffering as ecosystem services–Part 2: Land use and rainfall intensity effects in Southeast Asia. Hydrol. Earth Syst. Sci. 2017, 21(5), 2341–2360. [Google Scholar] [CrossRef]
- Tanika, L.; Sari, R.R.; Hakim, A.L.; Van Noordwijk, M.; Peña-Claros, M.; Leimona, B.; Purwanto, E.; Speelman, E.N. The H2Ours game to explore water use, resources and sustainability: connecting issues in two landscapes in Indonesia. Hydrol. Earth Syst. Sci. 2024, 28(16), 3807–3835. [Google Scholar] [CrossRef]
- Agus, F.; Irawan, I.; Suganda, H.; Wahyunto, W.; Setiyanto, A.; Kundarto, M. Environmental multifunctionality of Indonesian agriculture. Paddy Water Environ. 2006, 4(4), 181–188. [Google Scholar] [CrossRef]
- Merten, J.; Stiegler, C.; Hennings, N.; Purnama, E.S.; Röll, A.; Agusta, H.; Dippold, M.A.; Fehrmann, L.; et al. Flooding and land use change in Jambi Province, Sumatra: integrating local knowledge and scientific inquiry. Ecol. Soc. 2020, 25(3), 1–29. [Google Scholar] [CrossRef]
- Lubis, M.I.; Linkie, M.; Lee, J.S.H. Tropical forest cover, oil palm plantations, and precipitation drive flooding events in Aceh, Indonesia, and hit the poorest people hardest. PLoS ONE 2024, 19(10), e0311759. [Google Scholar] [CrossRef] [PubMed]
- Kaplan, J.; DeMaria, M. A simple empirical model for predicting the decay of tropical cyclone winds after landfall. J. Appl. Meteorol. Climatol. 1995, 34(11), 2499–2512. [Google Scholar] [CrossRef]
- Rinaldi, V.; Motoa, G.; Ghandehari, M. Trees as Sensors: Estimating Wind Intensity Distribution During Hurricane Maria. Remote Sens. 2025, 17(20), 3428. [Google Scholar] [CrossRef]
- Tiwari, P.; Rao, A. D.; Pandey, S.; Pant, V. Assessing the influence of land use and land cover data on cyclonic winds and coastal inundation due to tropical cyclones: a case study for the east coast of India. Nat. Hazards 2024, 120(11), 10219–10240. [Google Scholar] [CrossRef]
- Tanika, L.; Wamucii, C.; Best, L.; Lagneaux, E.G.; Githinji, M.; van Noordwijk, M. Who or what makes rainfall? Relational and instrumental paradigms for human impacts on atmospheric water cycling. Curr. Opin. Environ. Sustain. 2023, 63, 101300. [Google Scholar] [CrossRef]
- Makarieva, A. M.; Gorshkov, V. G.; Sheil, D.; Nobre, A. D.; Li, B. L. Where do winds come from? A new theory on how water vapor condensation influences atmospheric pressure and dynamics. Atmos. Chem. Phys. 2013, 13(2), 1039–1056. [Google Scholar] [CrossRef]
- Winkler, K.; Fuchs, R.; Rounsevell, M.D.A.; Herold, M. HILDA+ version 2.0: Global Land Use Change between 1960 and 2020 [dataset]. PANGAEA 2025. [Google Scholar] [CrossRef]
Figure 1.
Hazard x Exposure x Vulnerability analysis of the impacts of the landfall of hurricane Senyar on N and W costs of Sumatra in November 2025 and specific questions for this conceptual review.
Figure 1.
Hazard x Exposure x Vulnerability analysis of the impacts of the landfall of hurricane Senyar on N and W costs of Sumatra in November 2025 and specific questions for this conceptual review.
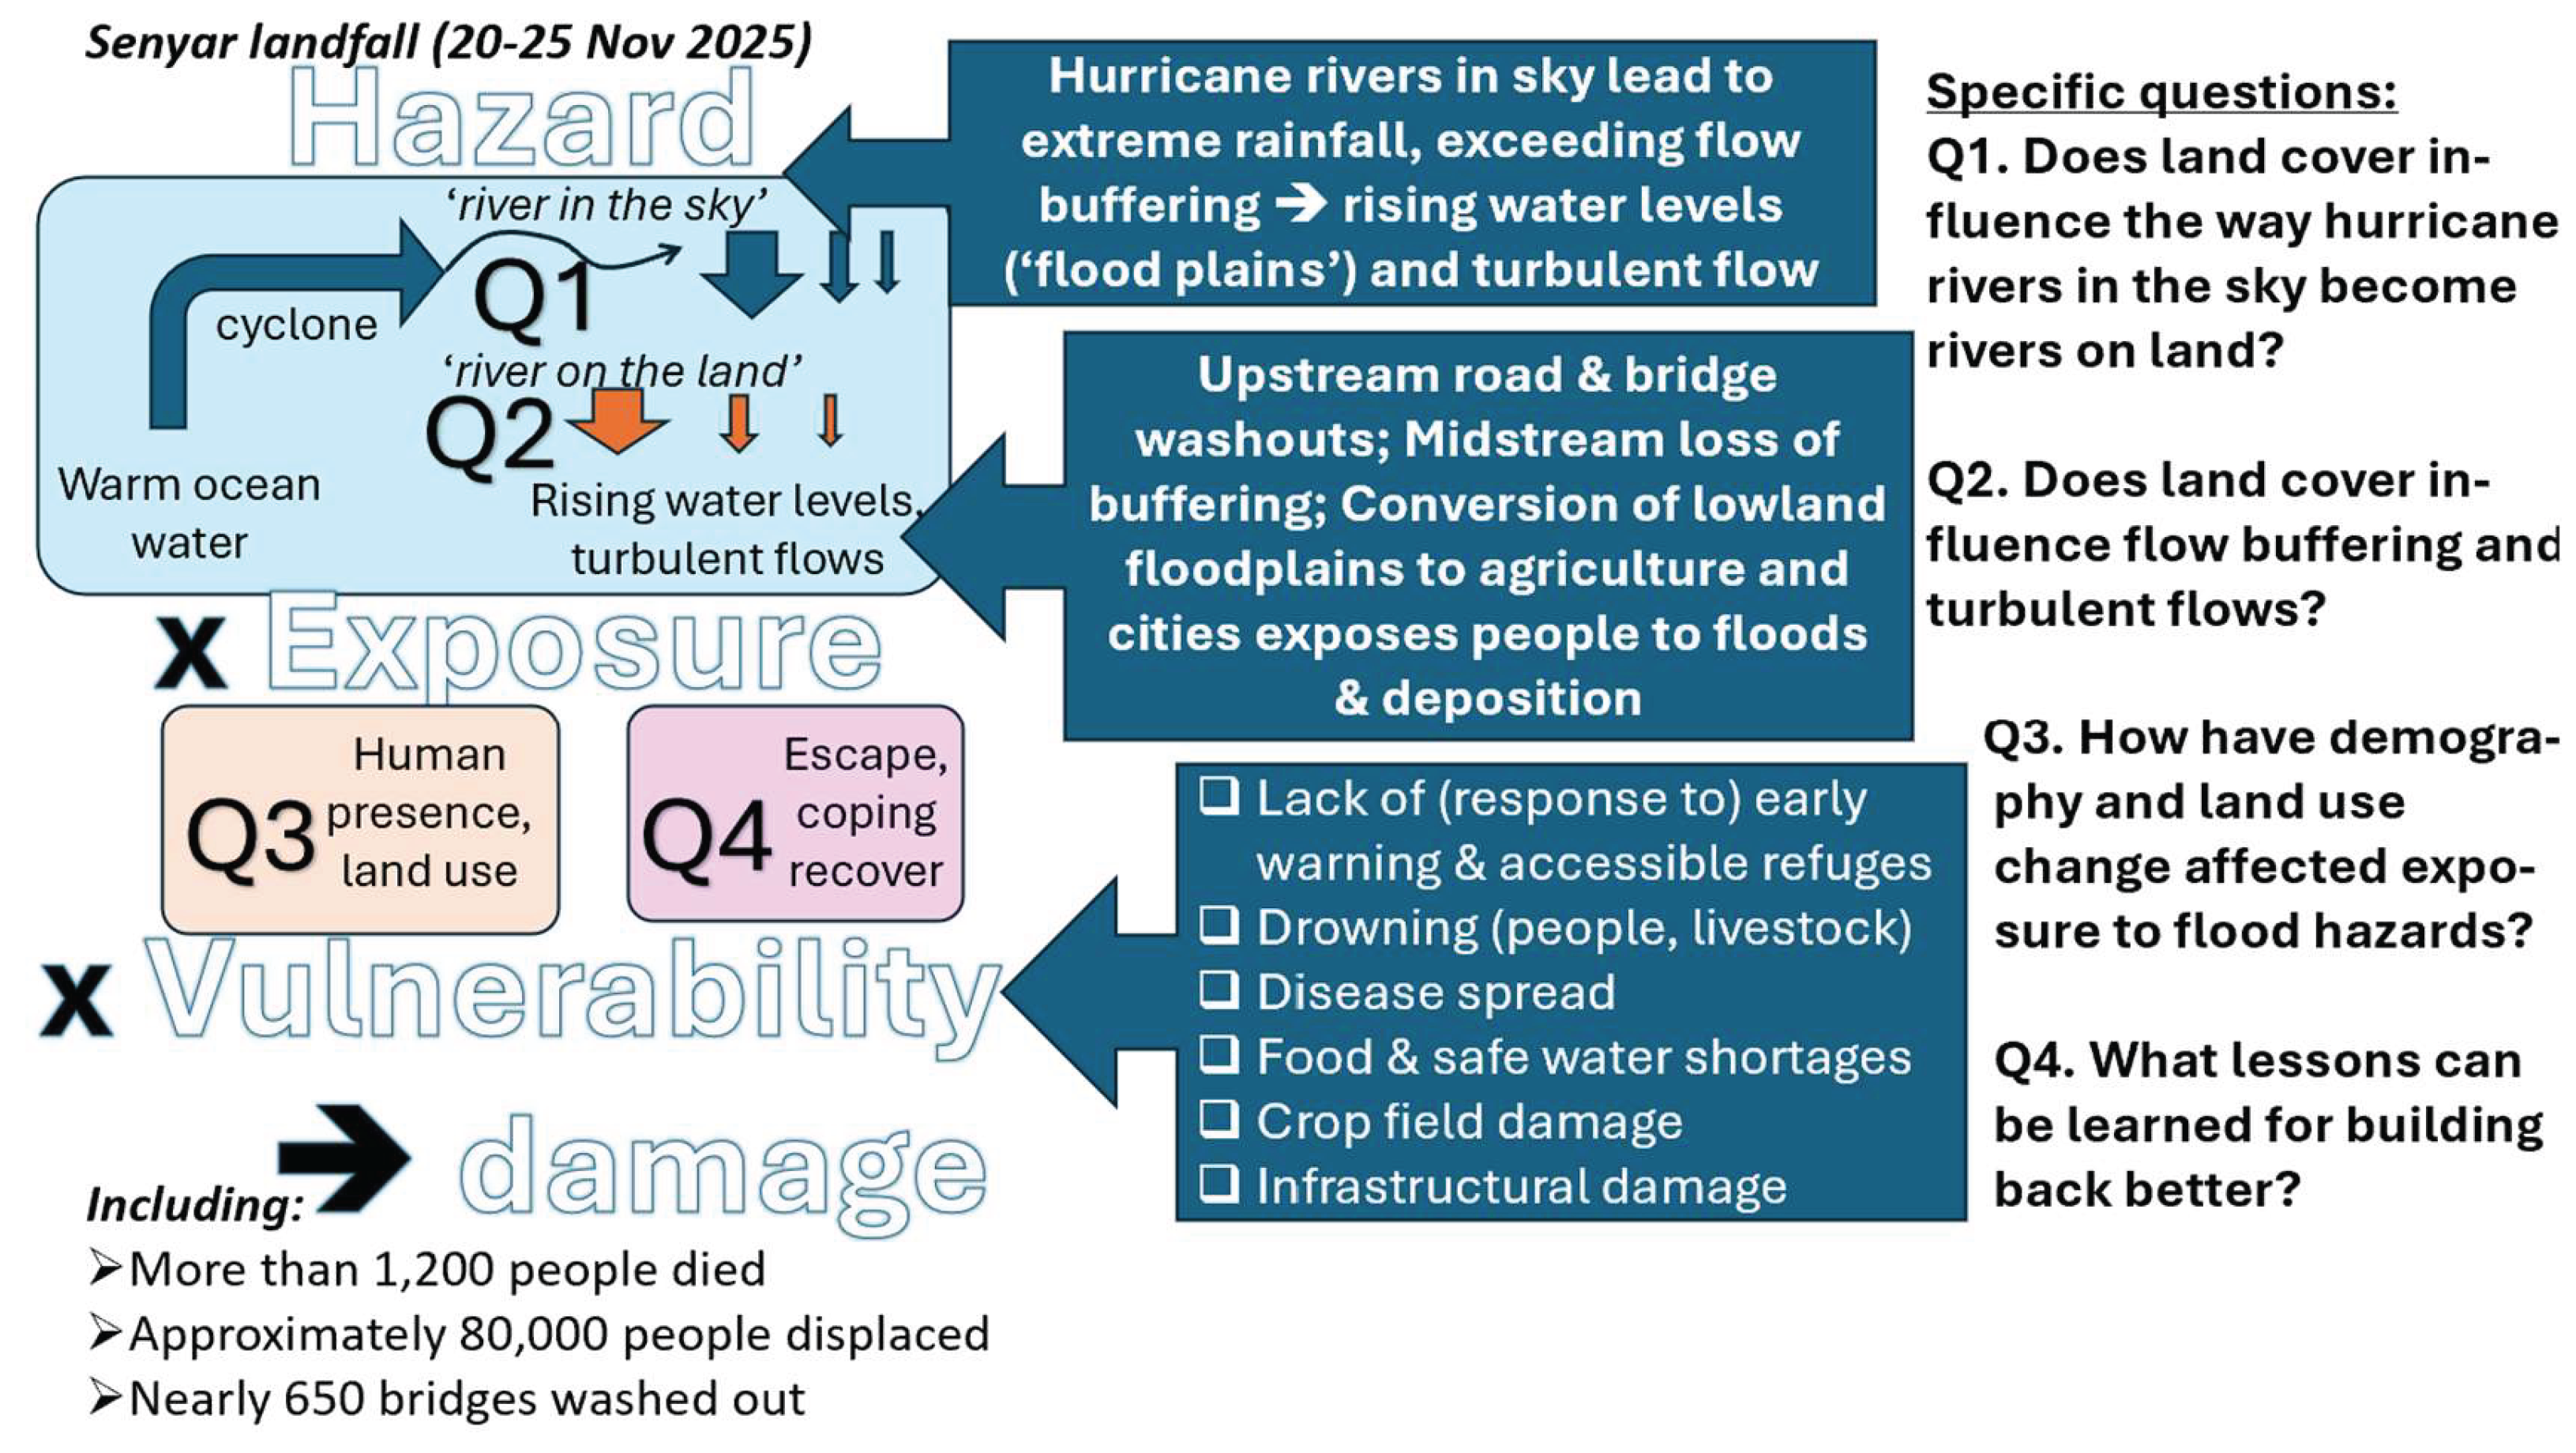
Figure 2.
Historical demographic concentrations in the uplands of Sumatra based on reference [9].
Figure 2.
Historical demographic concentrations in the uplands of Sumatra based on reference [9].
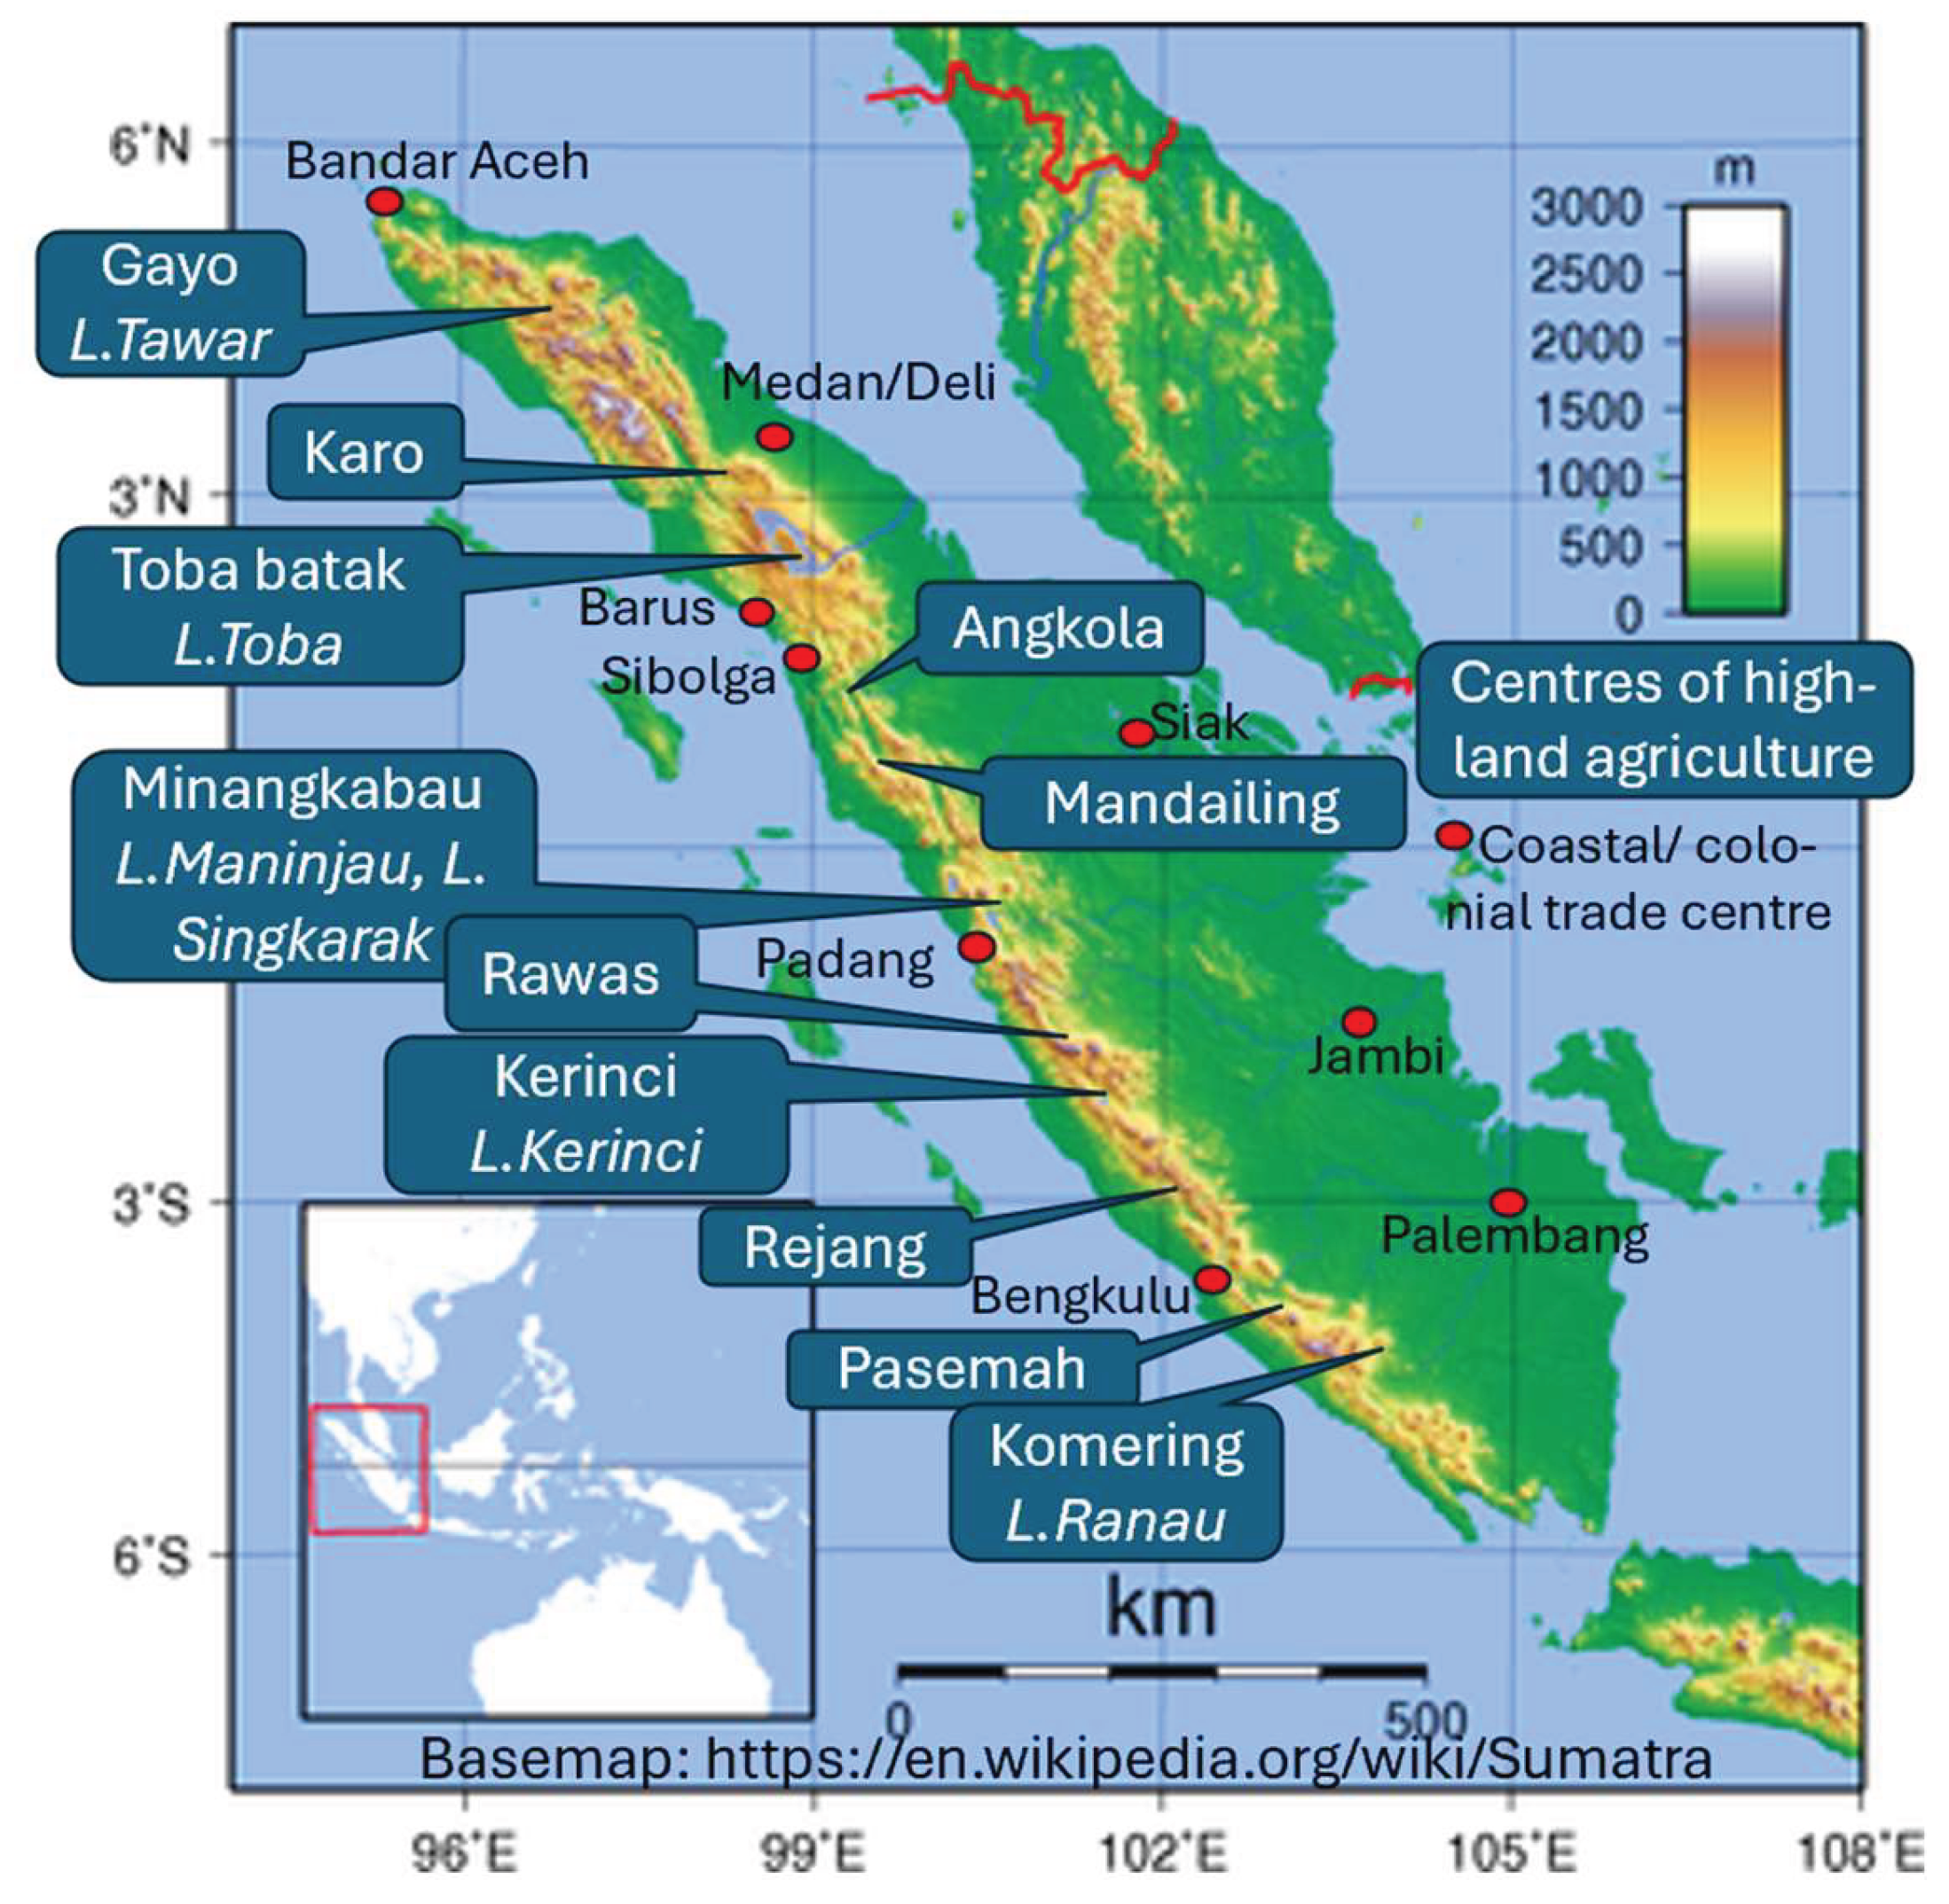
Figure 3.
Biophysical and institutional interpretations of the term ‘forest’ that tend to interact in popular debates over ‘deforestation’ as a specific form of land use and land cover change.
Figure 3.
Biophysical and institutional interpretations of the term ‘forest’ that tend to interact in popular debates over ‘deforestation’ as a specific form of land use and land cover change.
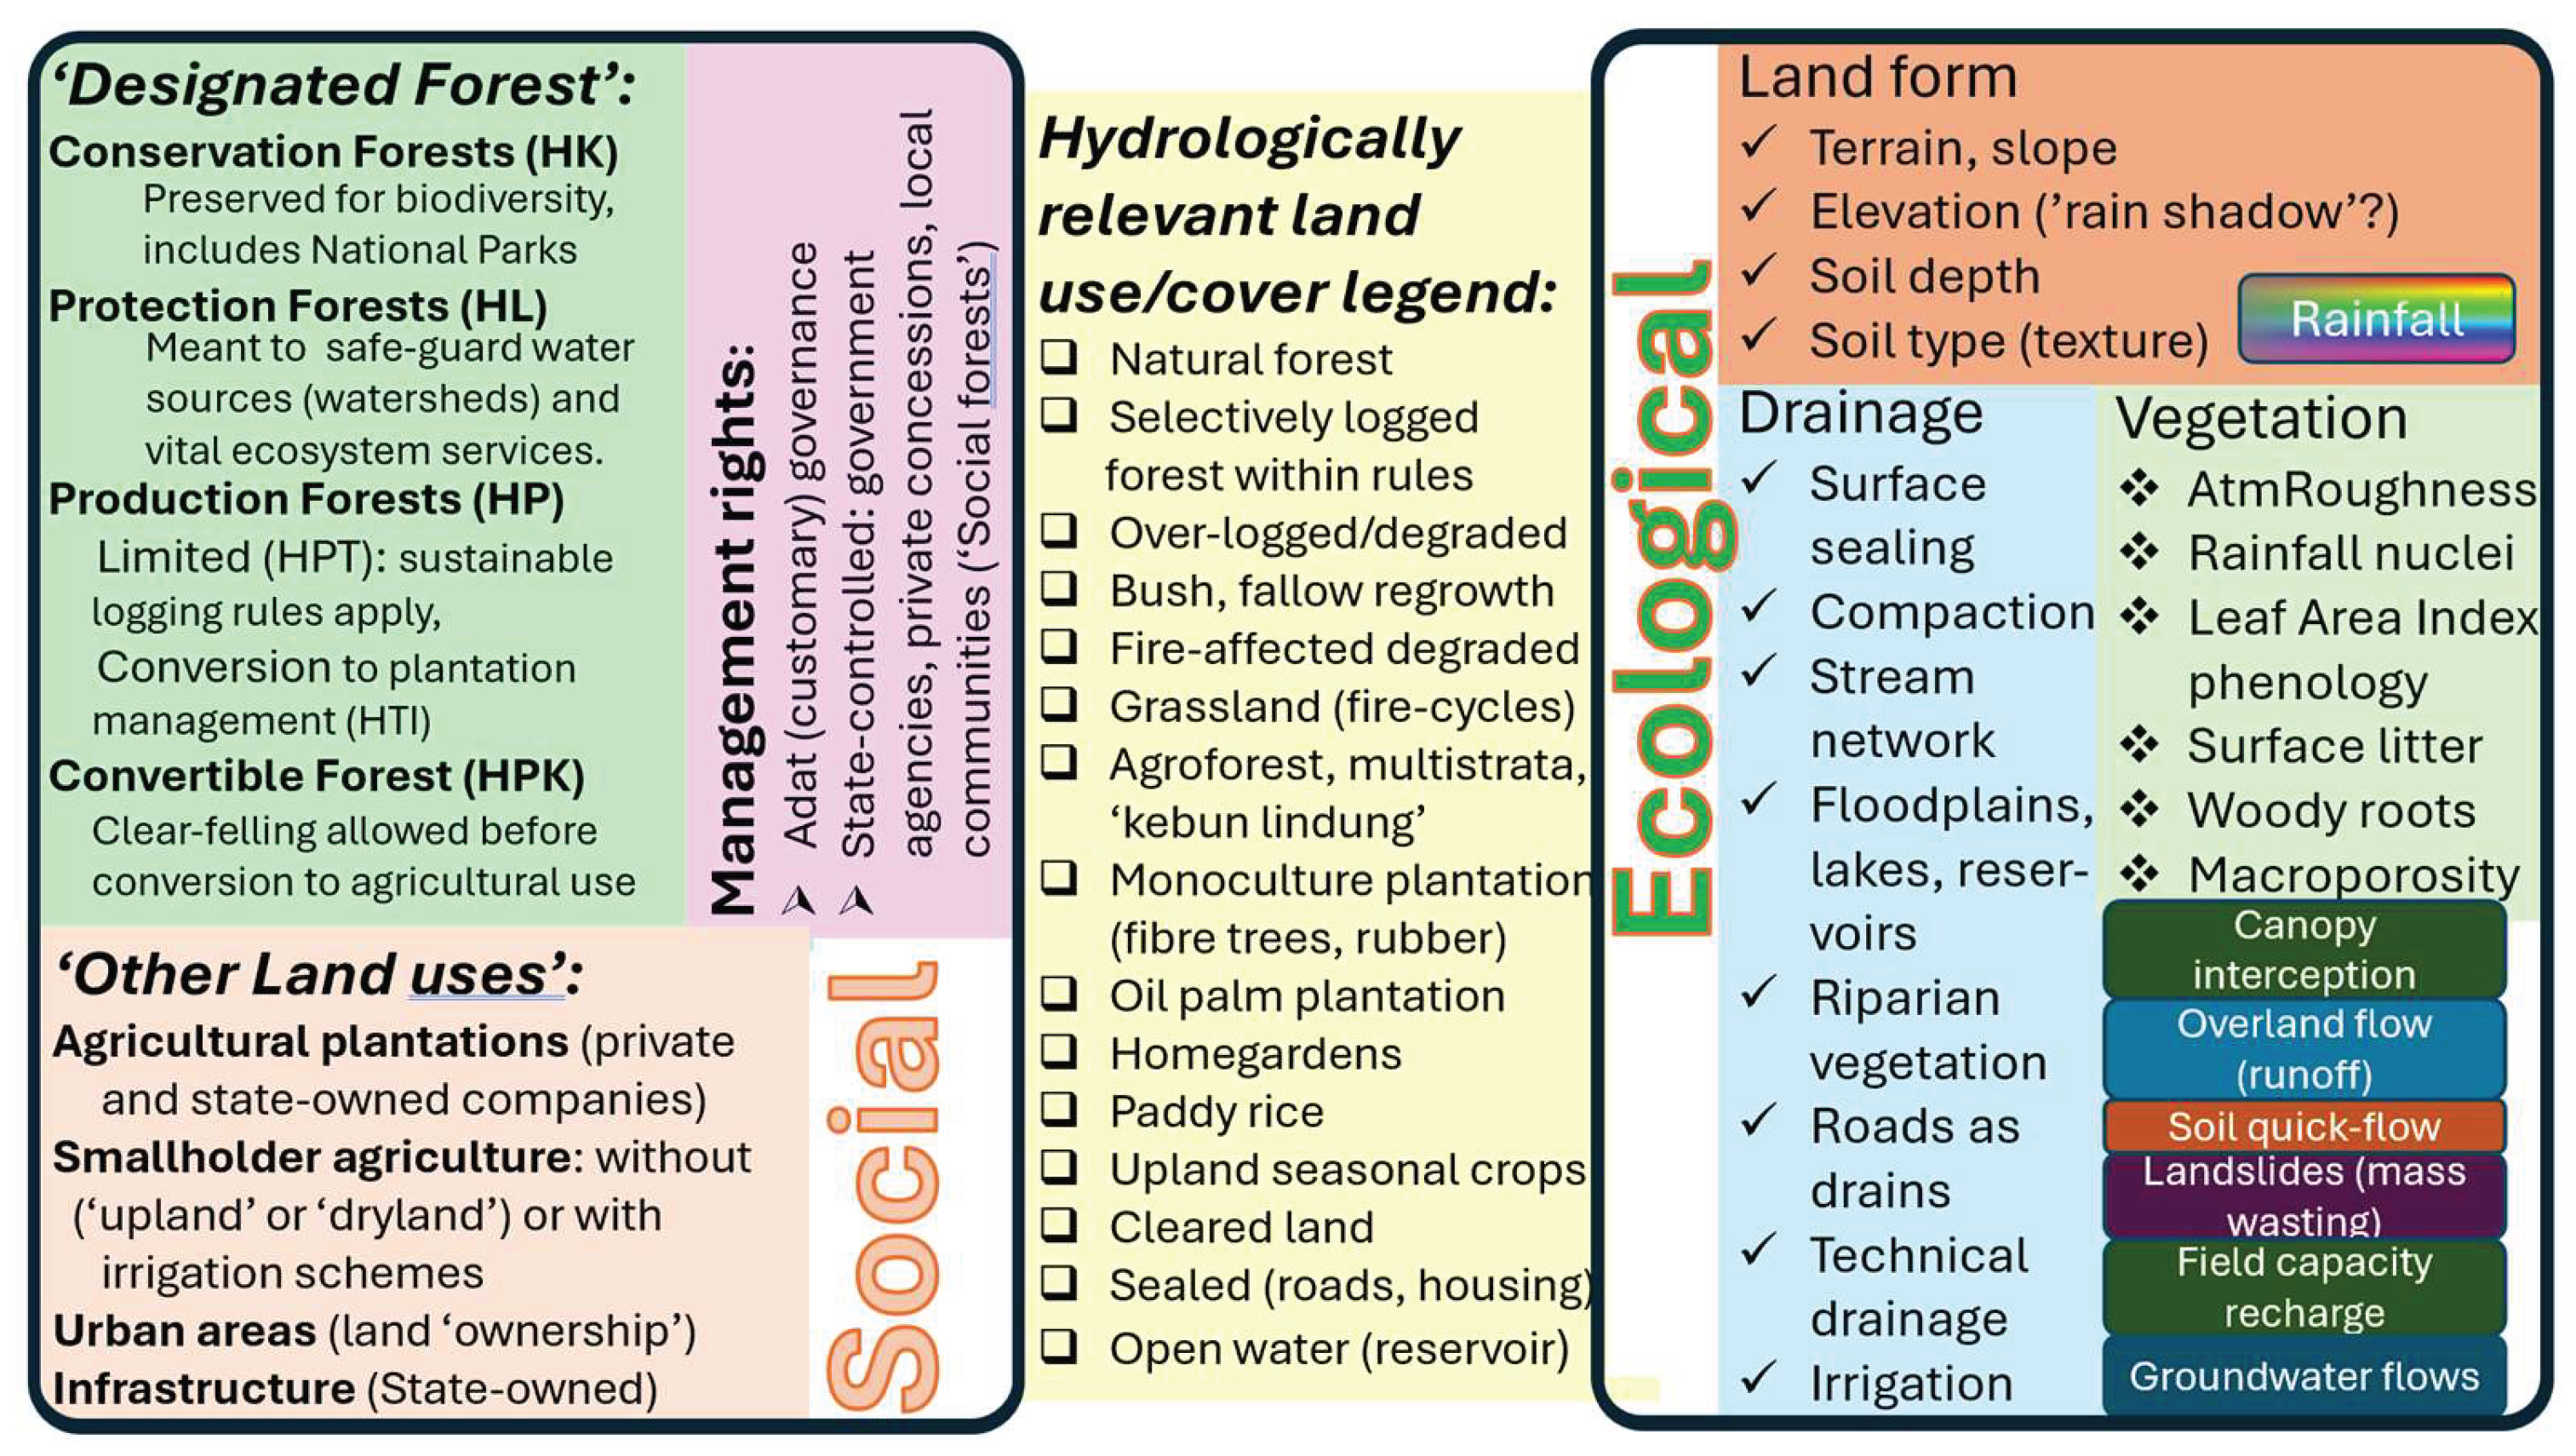
Figure 4.
The atmospheric component of the ocean-land–water cycle transports precipitable water and generates rainfall, but differs from rivers on land in that it is not confined to channels with defined width and height.
Figure 4.
The atmospheric component of the ocean-land–water cycle transports precipitable water and generates rainfall, but differs from rivers on land in that it is not confined to channels with defined width and height.
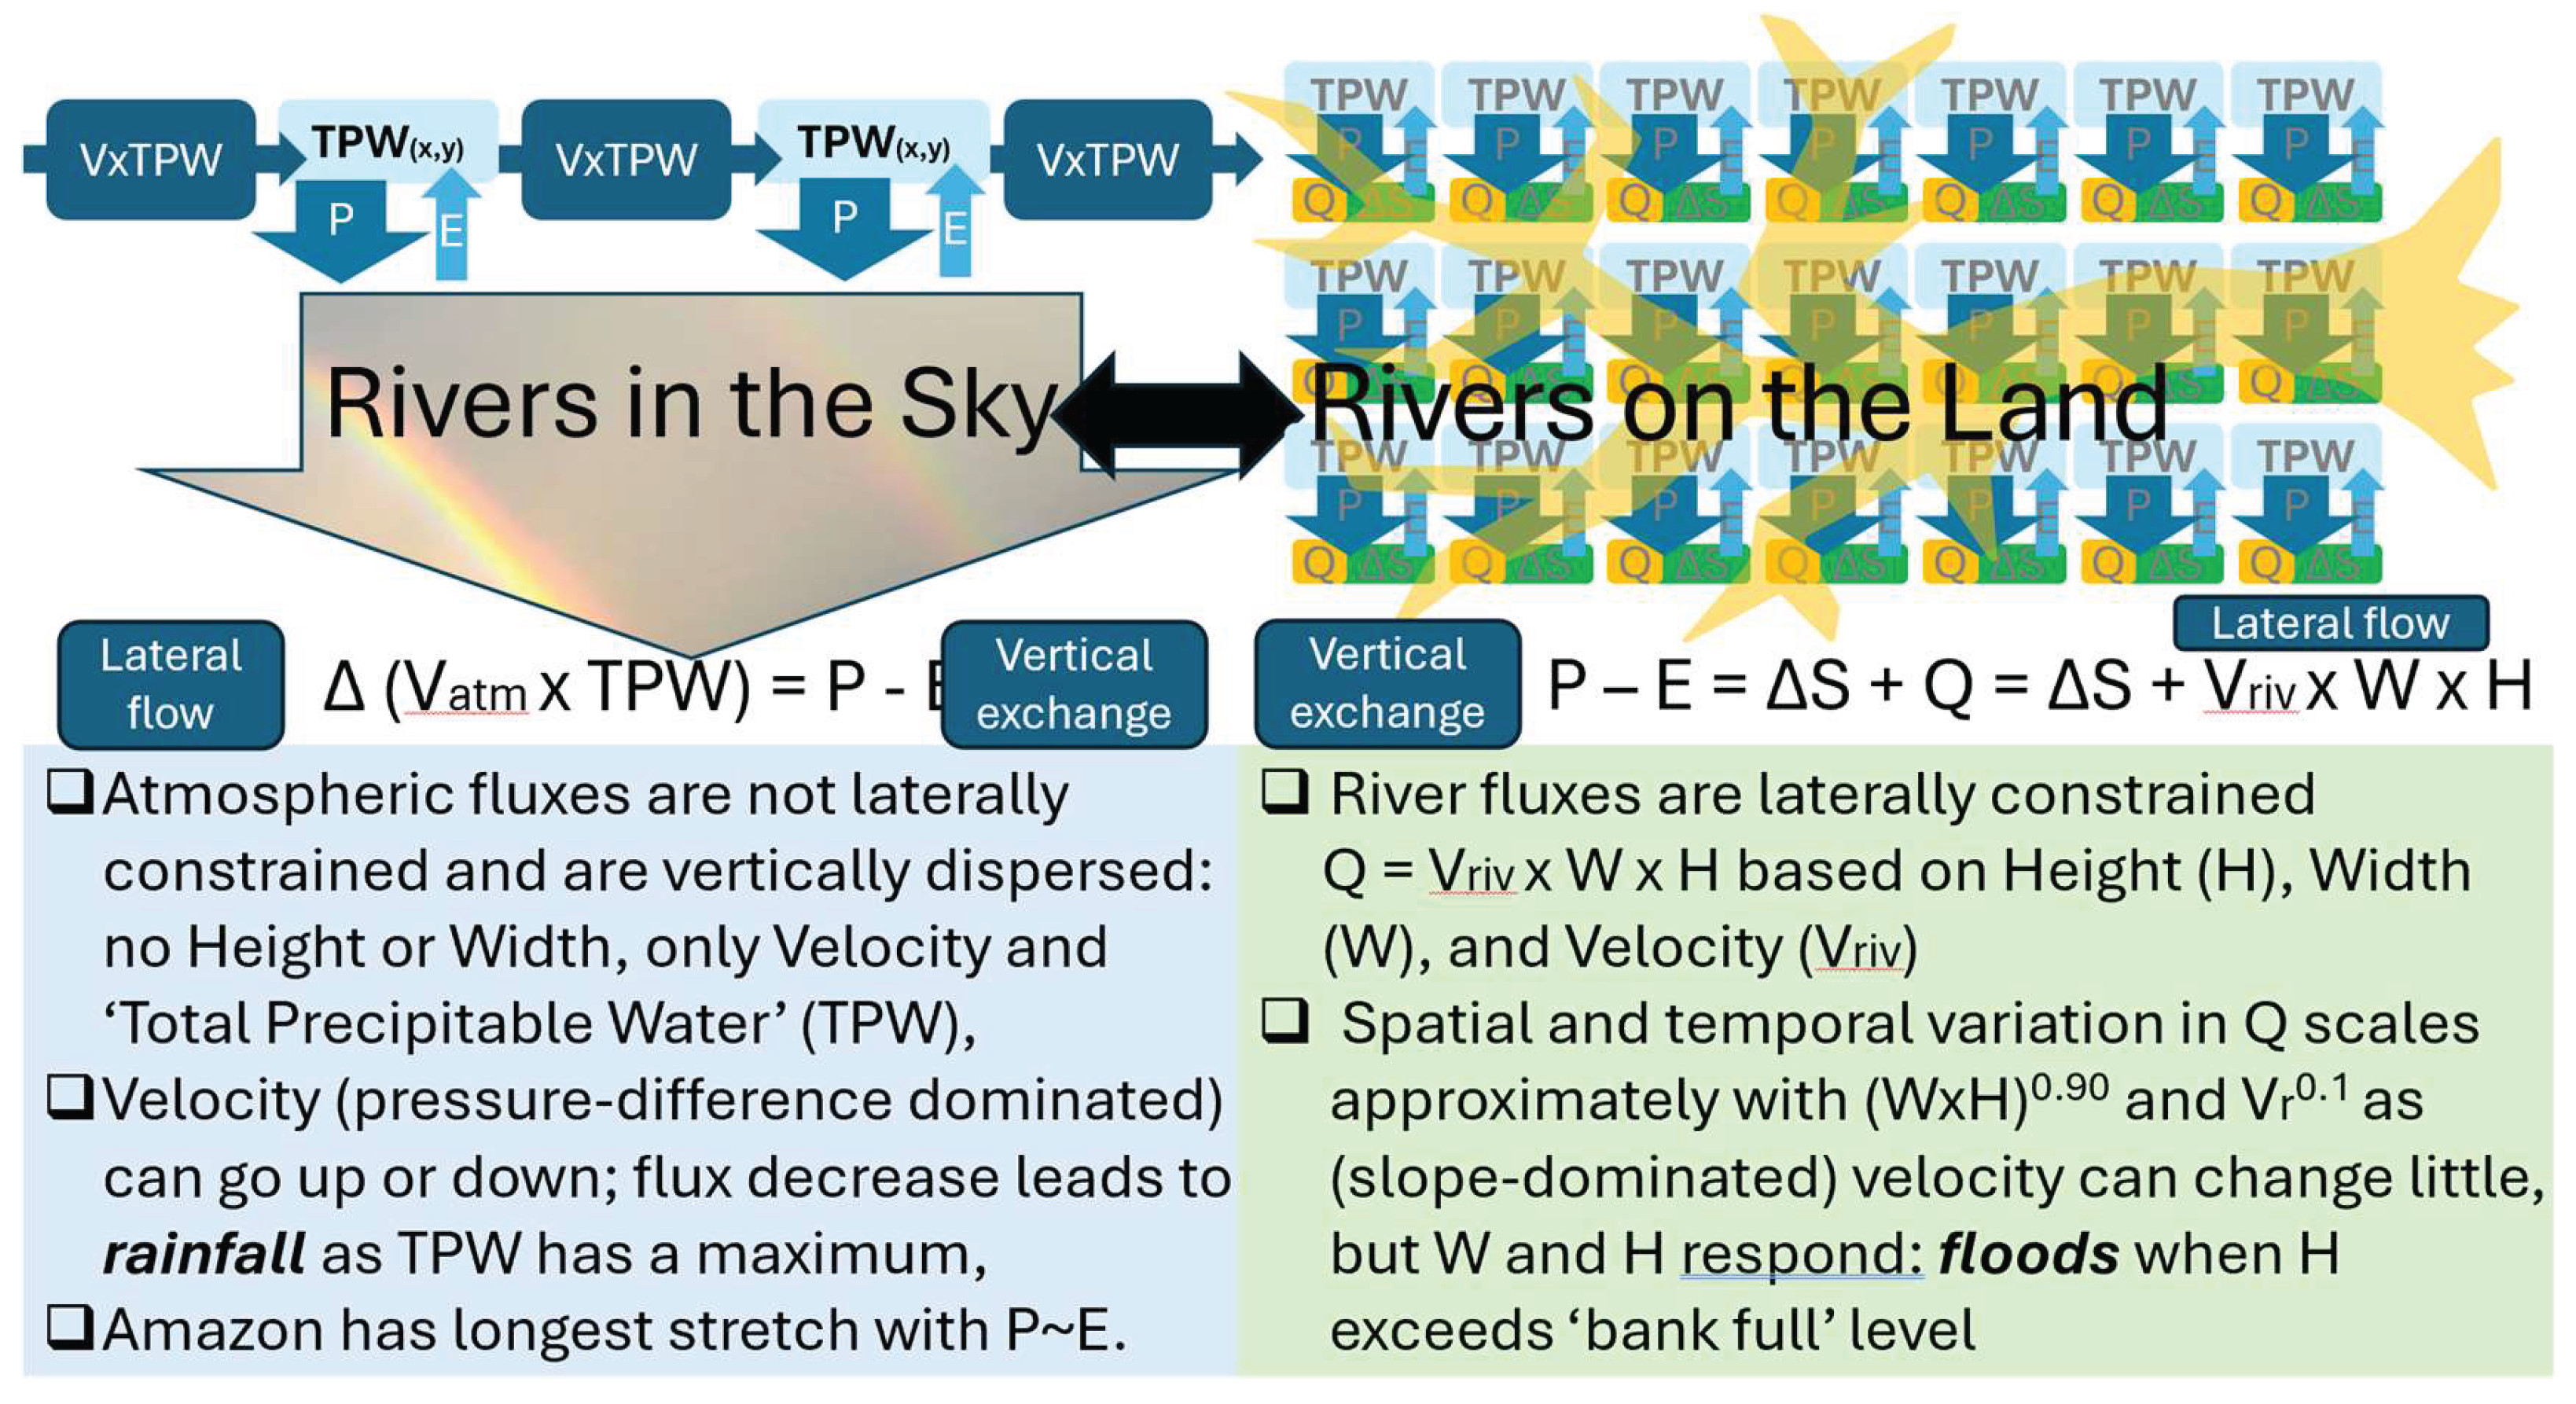
Figure 5.
Atmospheric conditions in November 2025 when the Senyar and Ditwa cyclones interacted (reference cited in the figure).
Figure 5.
Atmospheric conditions in November 2025 when the Senyar and Ditwa cyclones interacted (reference cited in the figure).
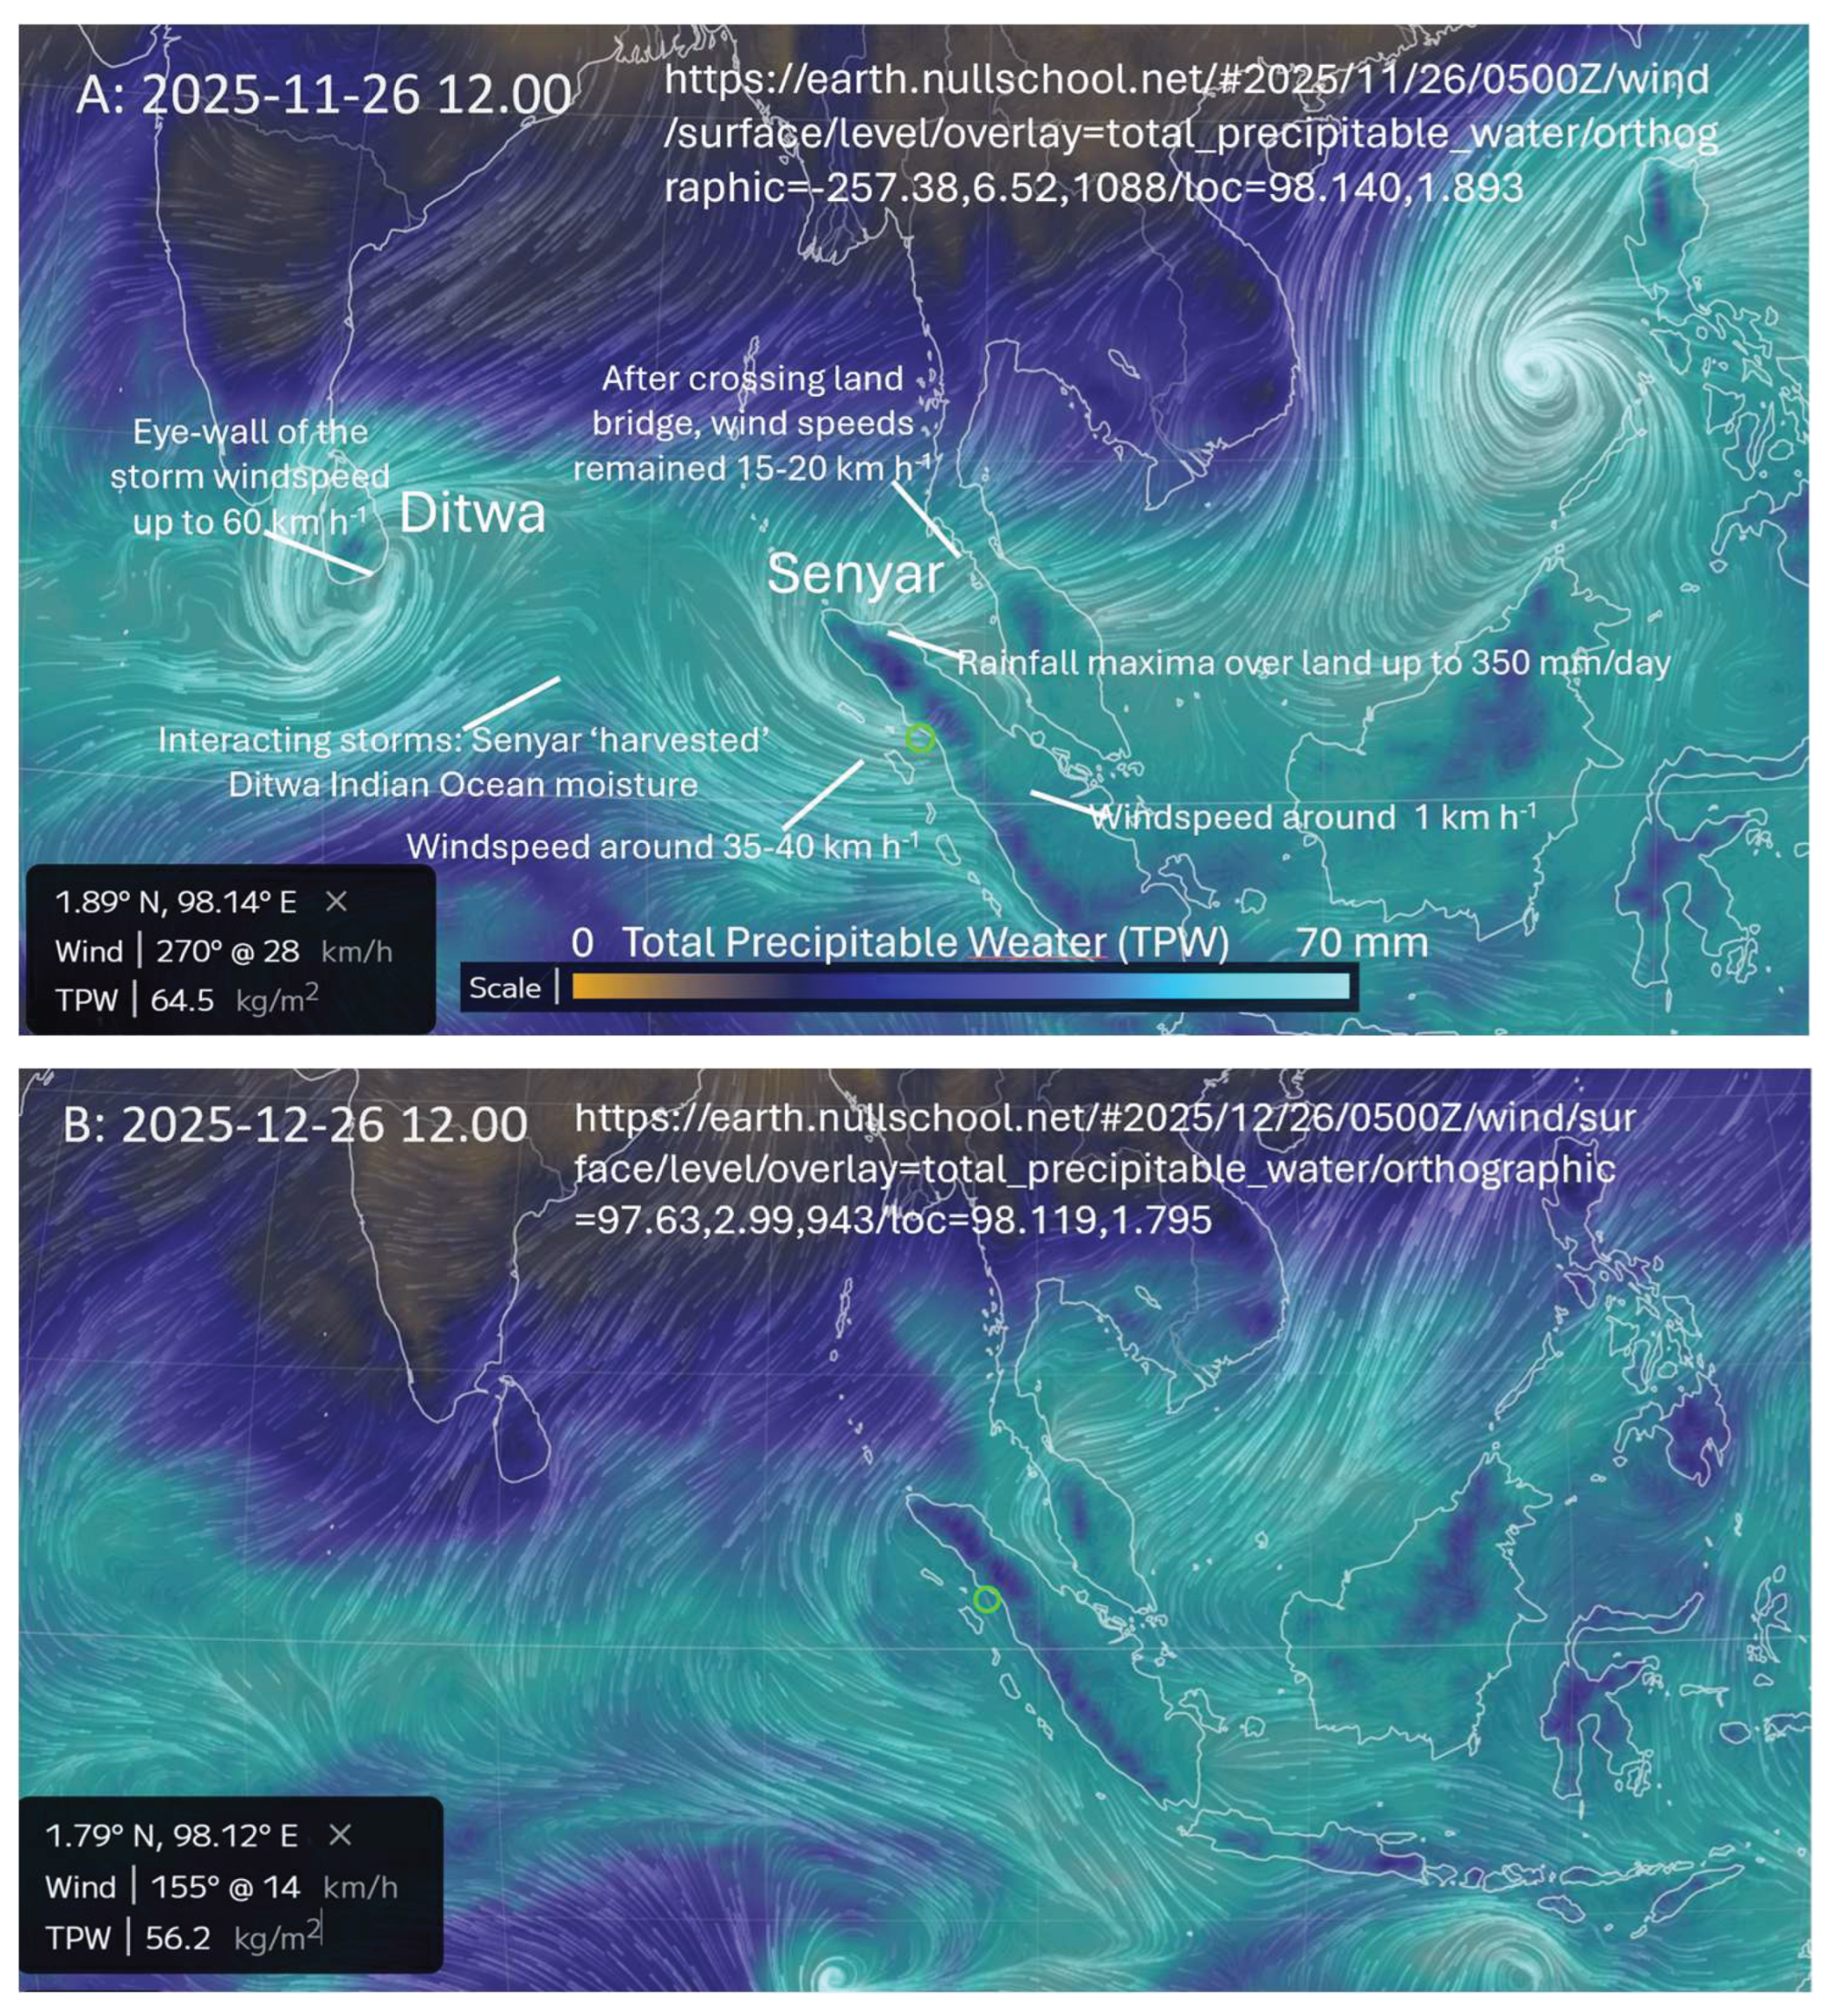
Figure 6.
Day-to-day dynamic of atmospheric conditions over and around Sumatra in November 2025.
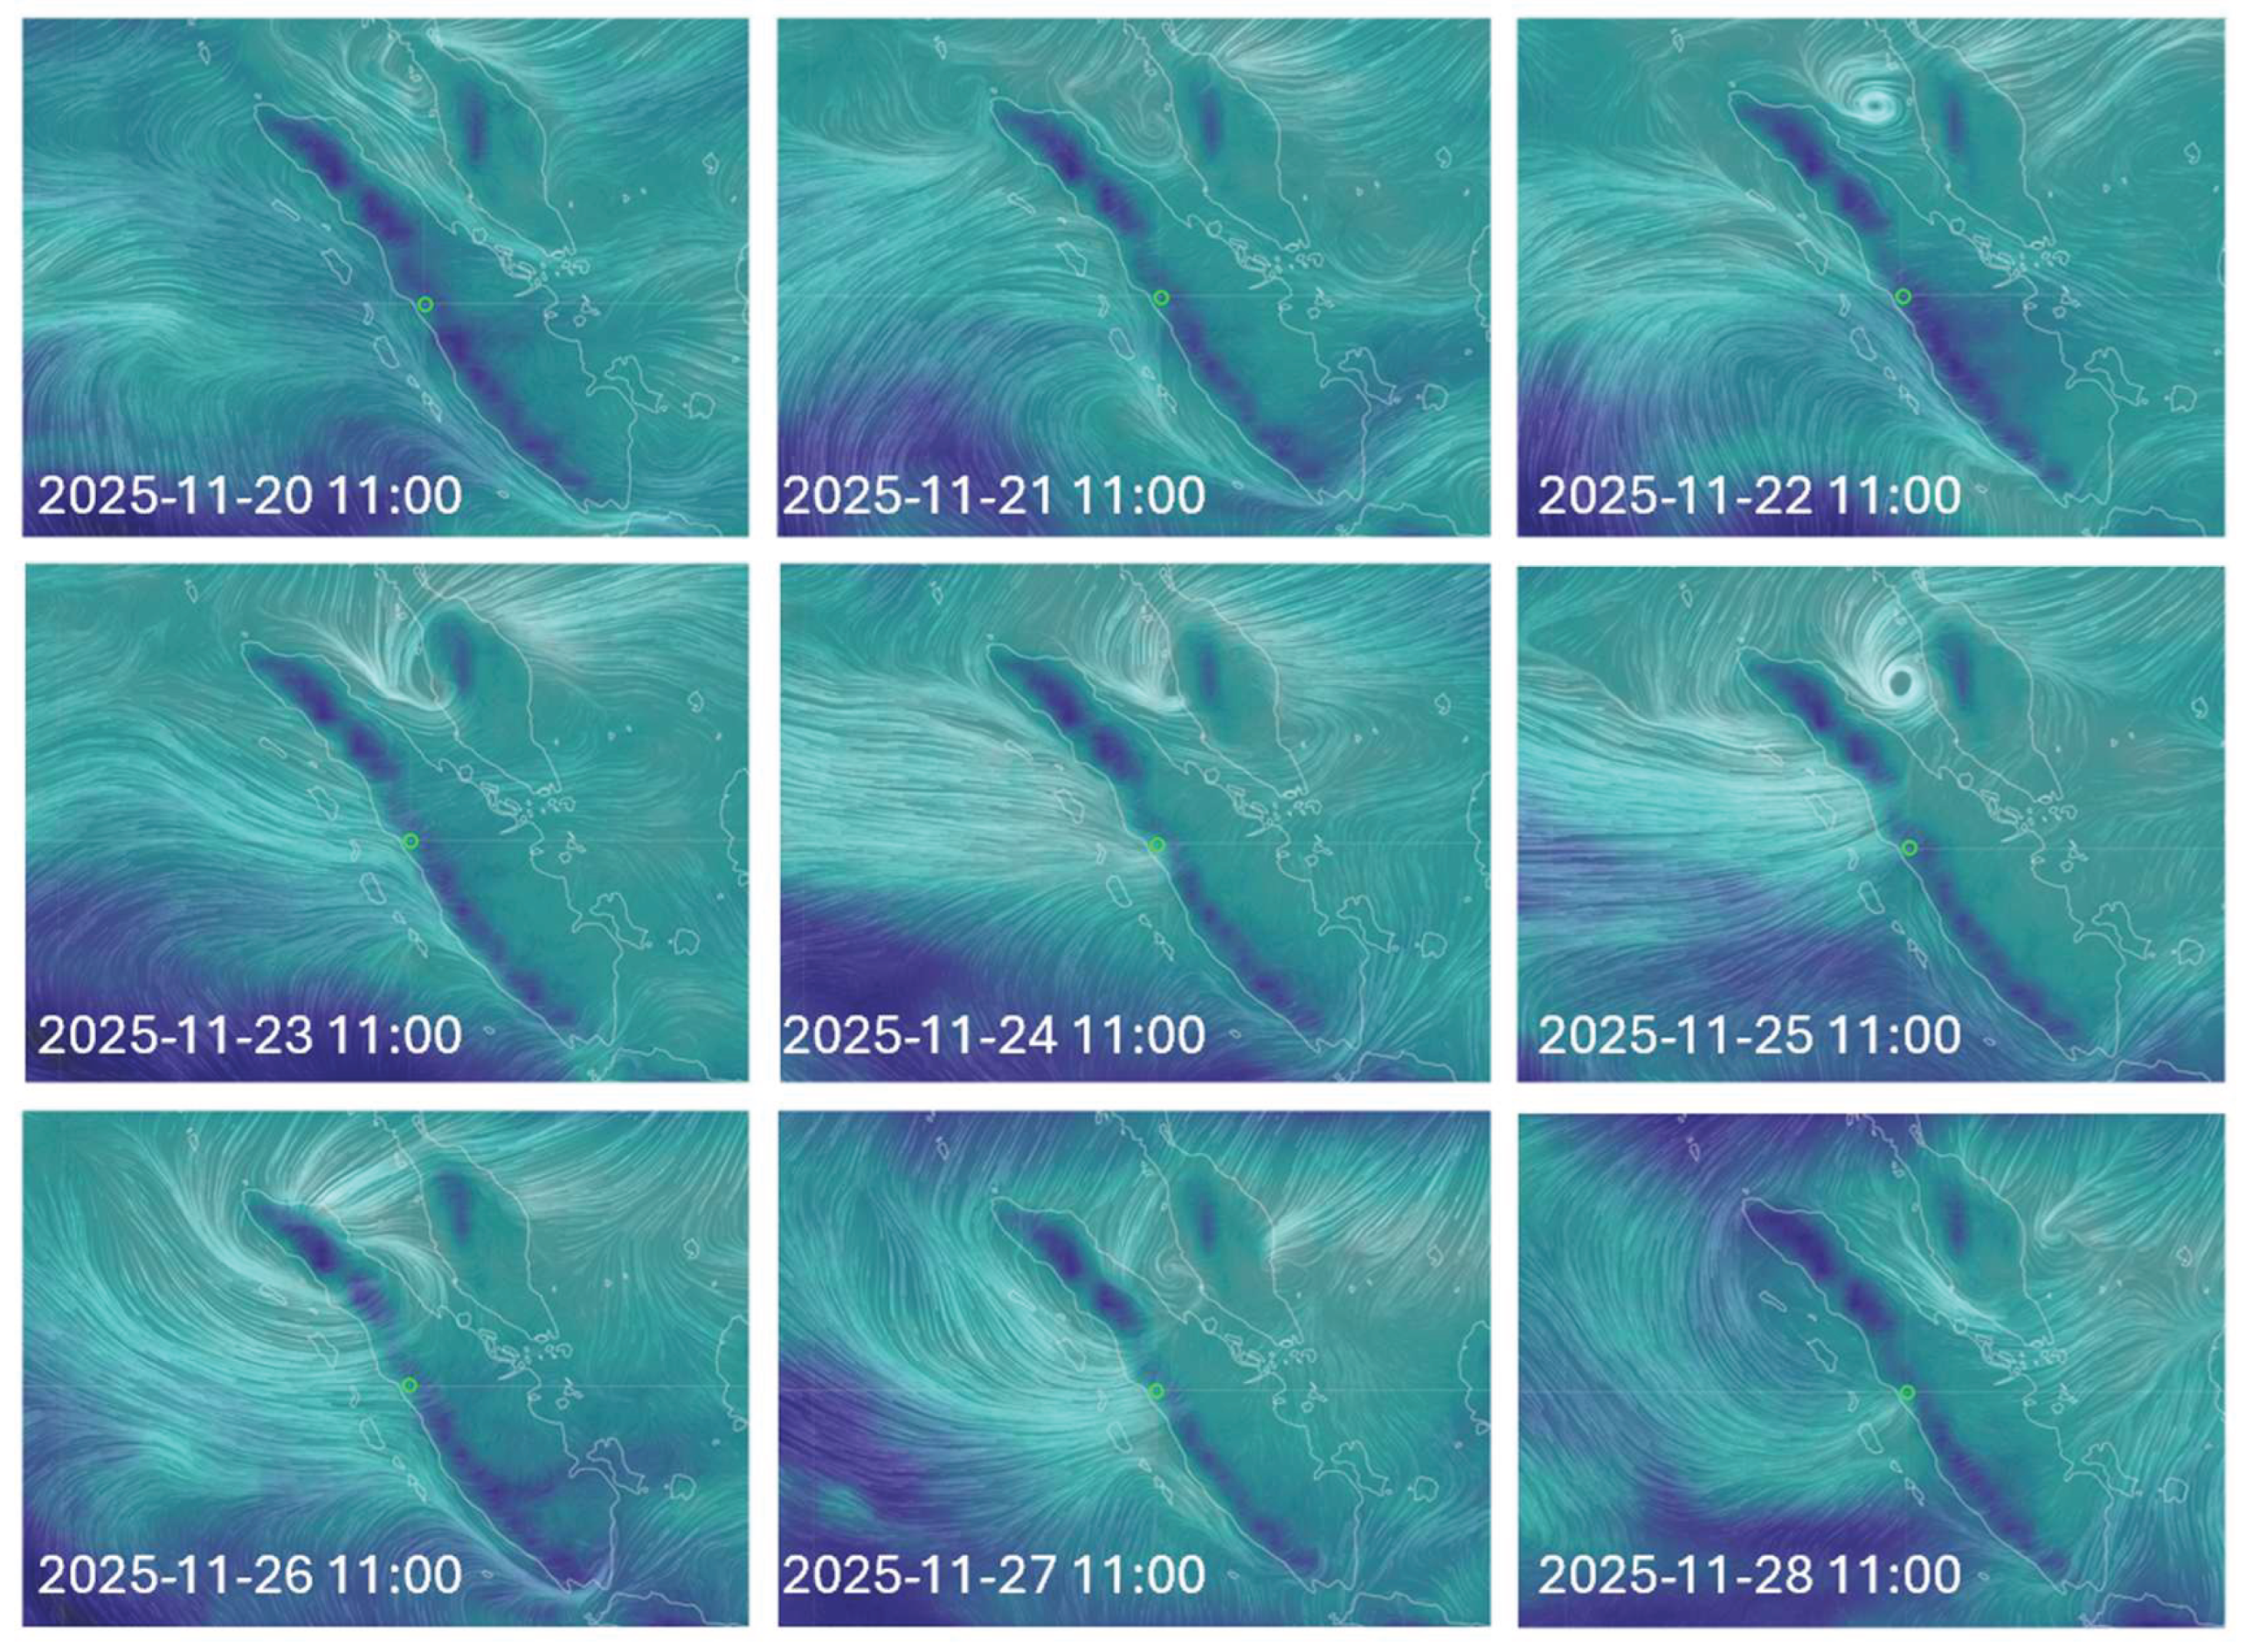
Figure 7.
A. Transect perpendicular to the coast in West Sumatra, approximately aligned with prevailing winds for 8 days in November 2025. B. Surface windspeed and precipitable water (TPW) data; from the spatial gradient in atmospheric moisture transport (TPW * Vatm) an hourly estimate of P—E is derived.
Figure 7.
A. Transect perpendicular to the coast in West Sumatra, approximately aligned with prevailing winds for 8 days in November 2025. B. Surface windspeed and precipitable water (TPW) data; from the spatial gradient in atmospheric moisture transport (TPW * Vatm) an hourly estimate of P—E is derived.
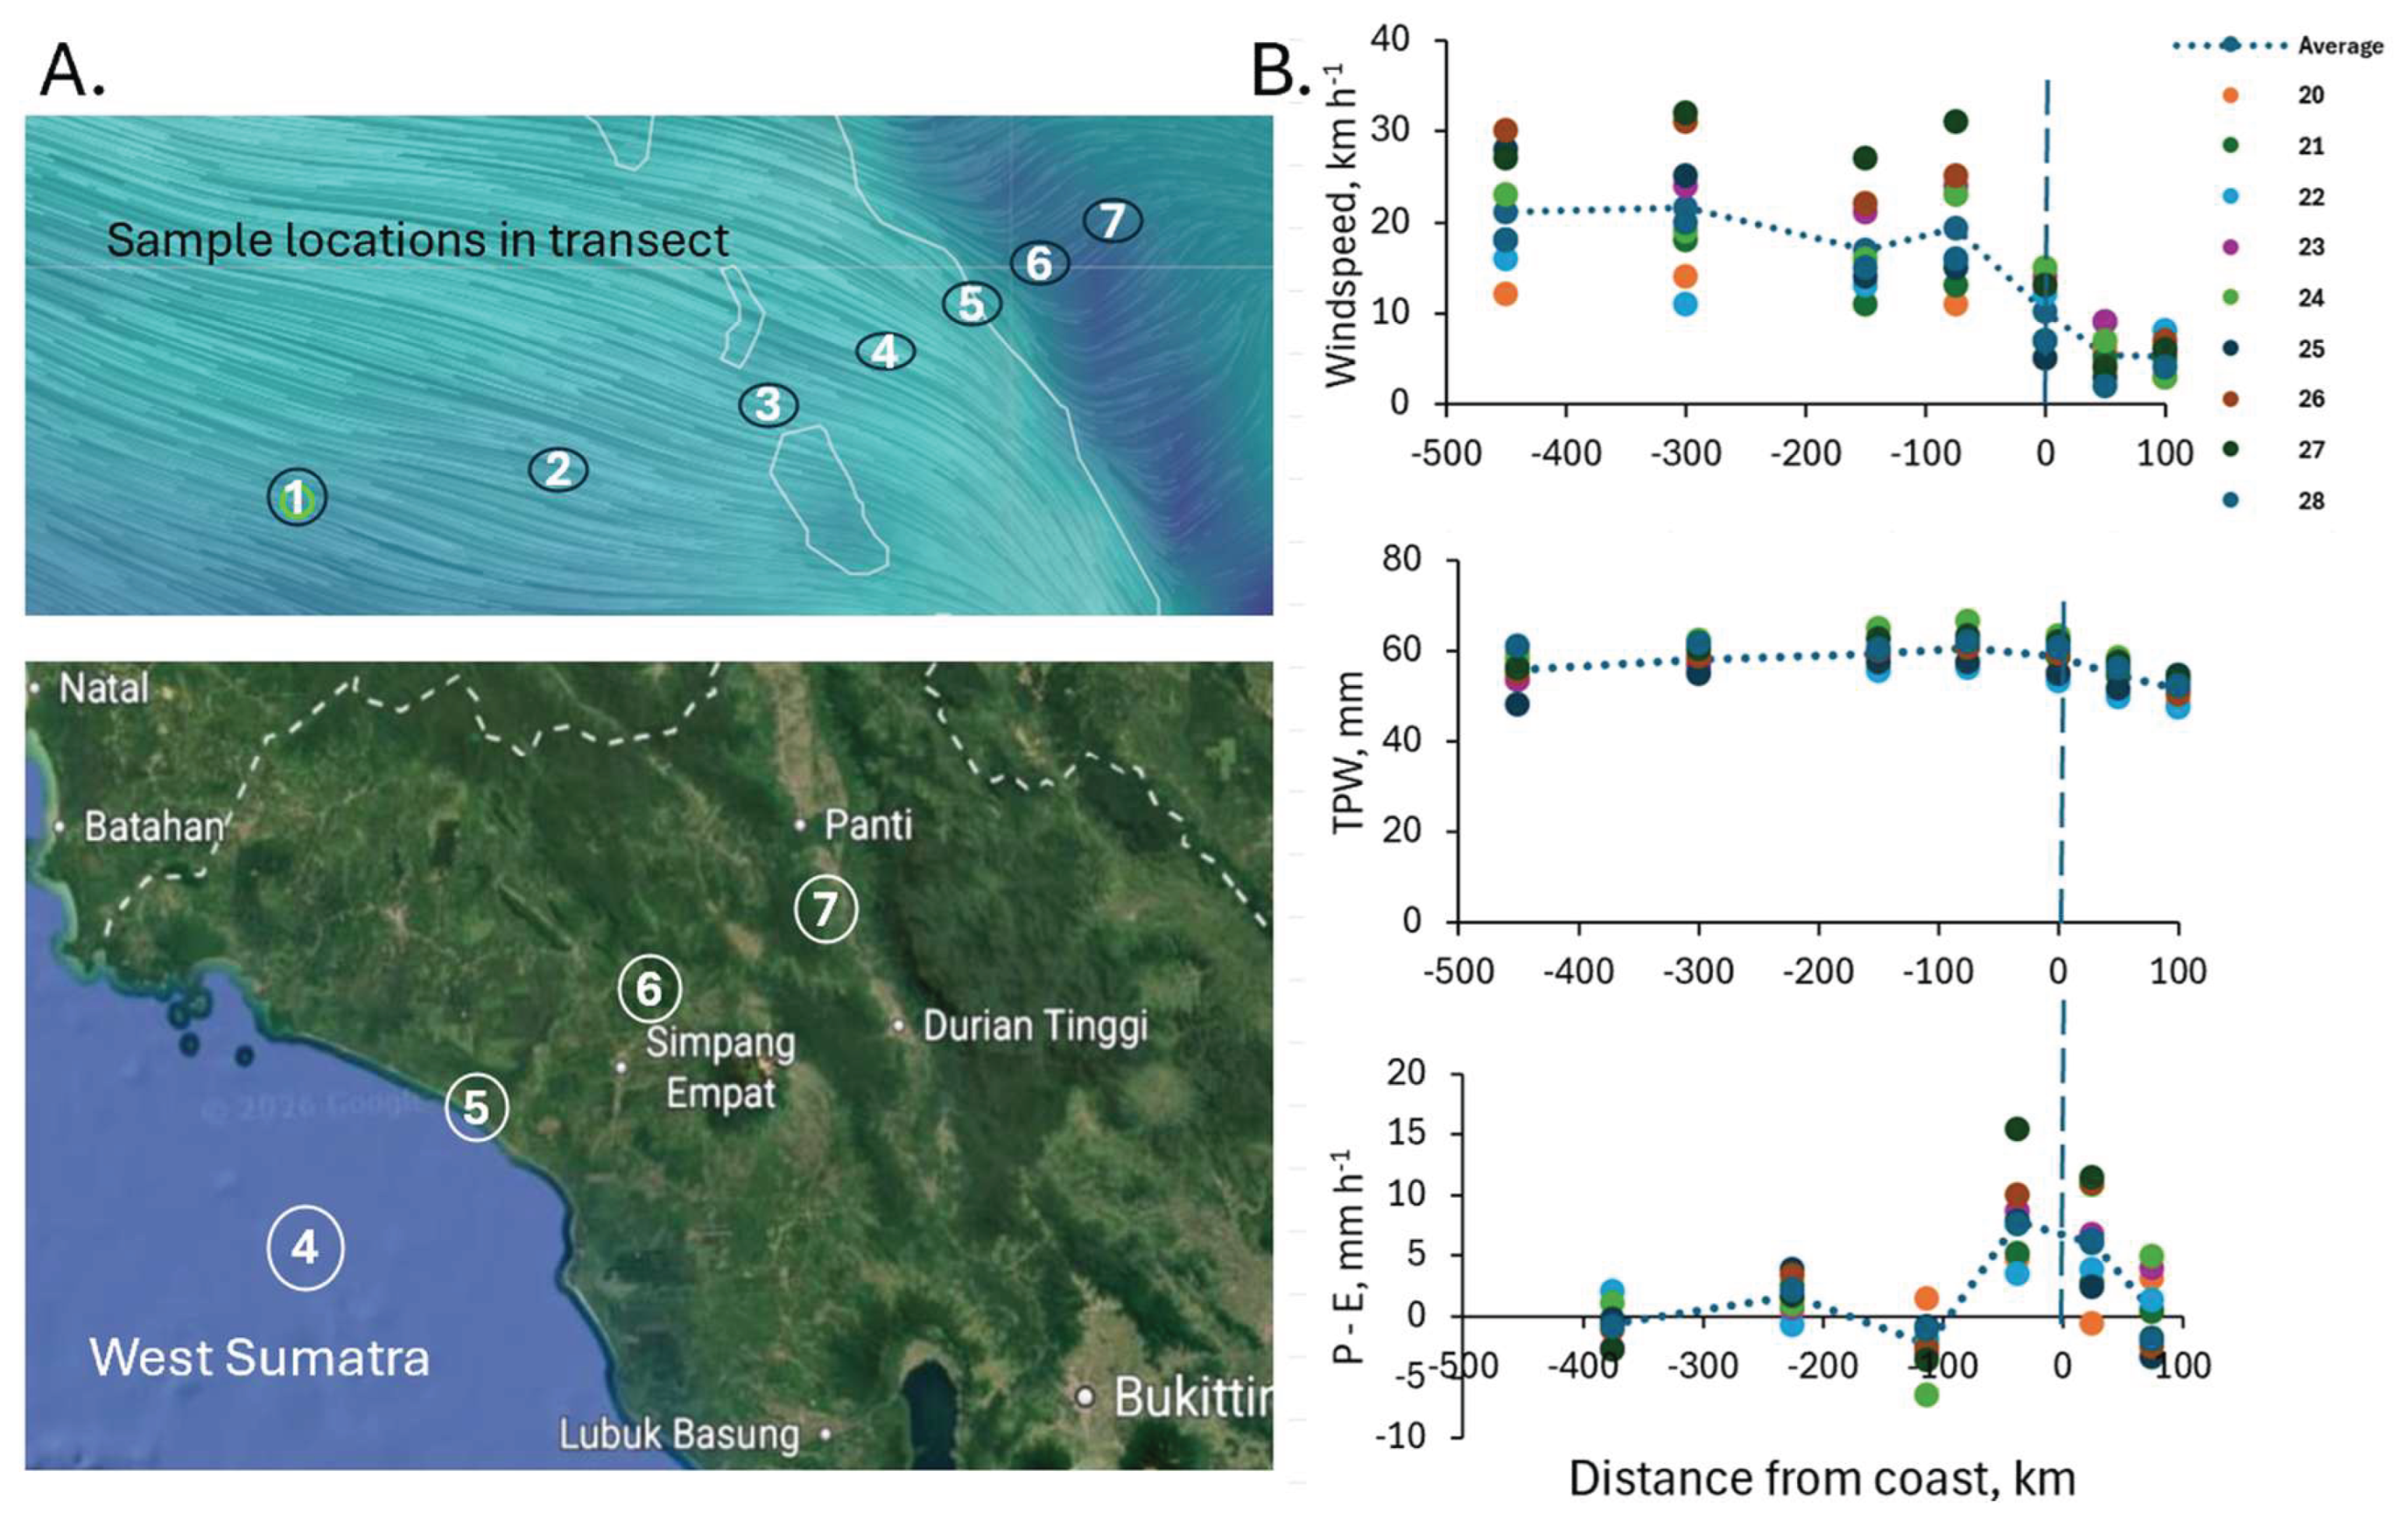
Figure 8.
A. Hourly estimated of P—E for November 2025 in Figure 7; B. Existing maps of average 5-day rainfall accumulation over and around Sumatra in TRMM satellite-derived estimates in reference [8].
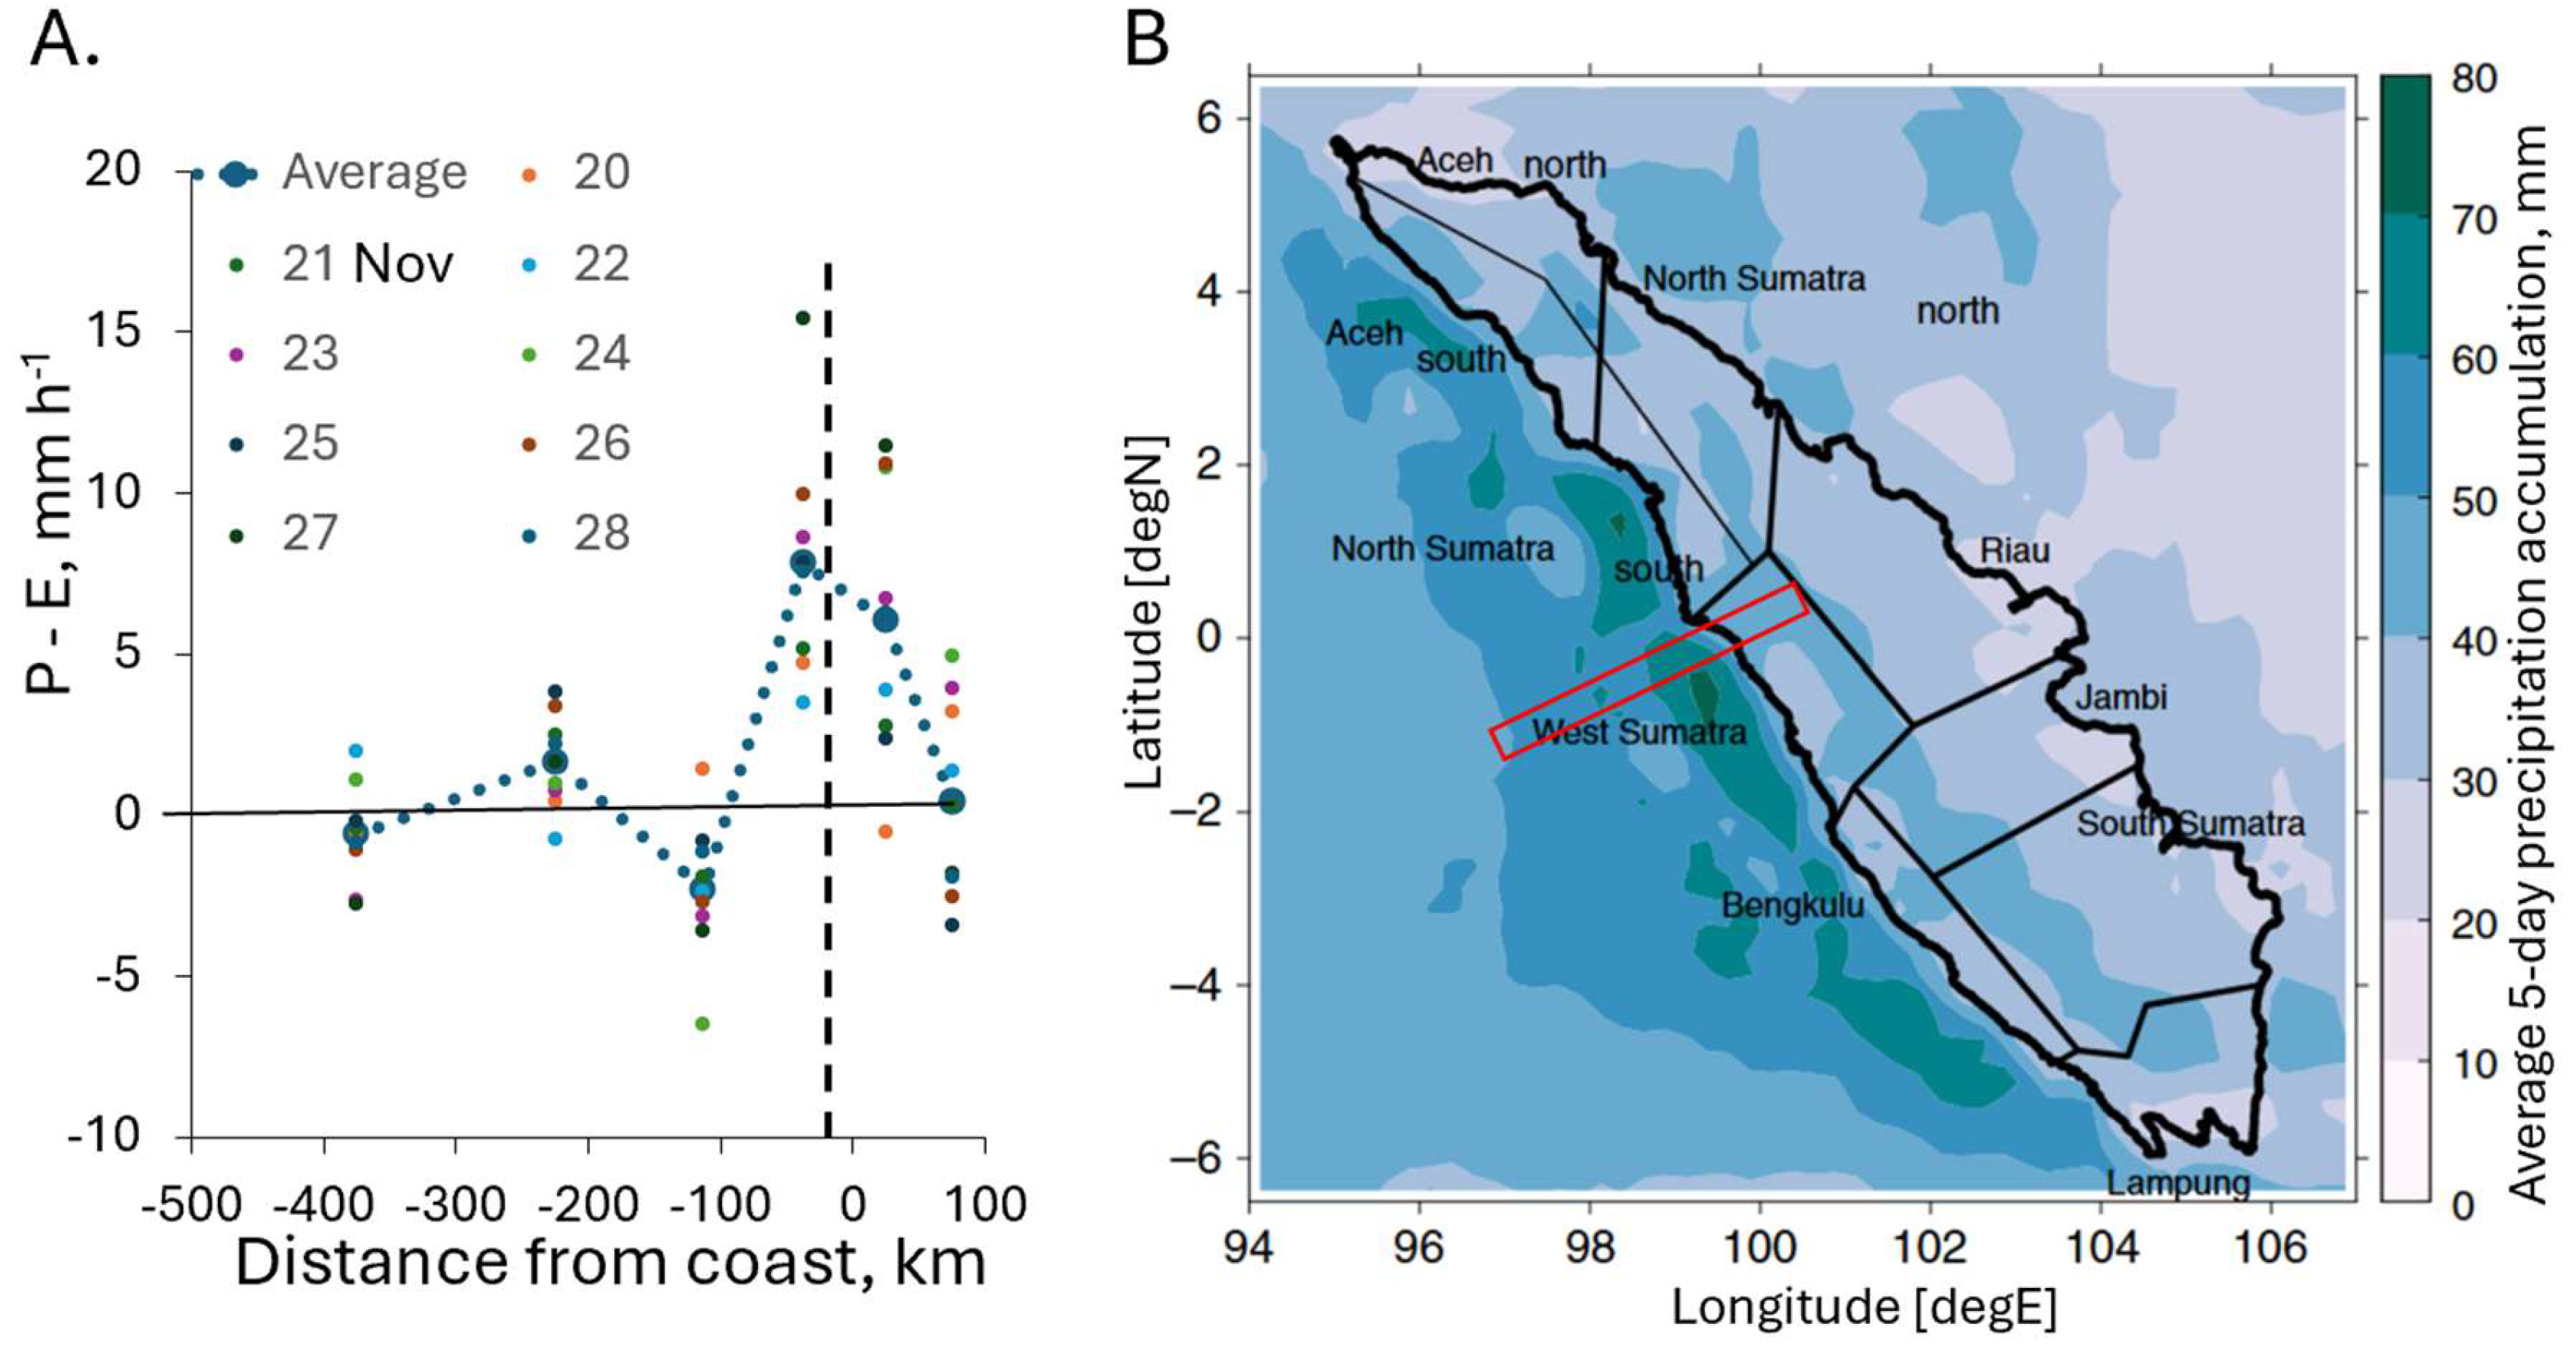
Figure 9.
Results for a simple conceptual model where surface roughness induces a reduction of Vatm for a front travelling over land from the coast, with consequences for windspeed and TPW (left panel) and the spatial distribution of P-E (right panel).
Figure 9.
Results for a simple conceptual model where surface roughness induces a reduction of Vatm for a front travelling over land from the coast, with consequences for windspeed and TPW (left panel) and the spatial distribution of P-E (right panel).
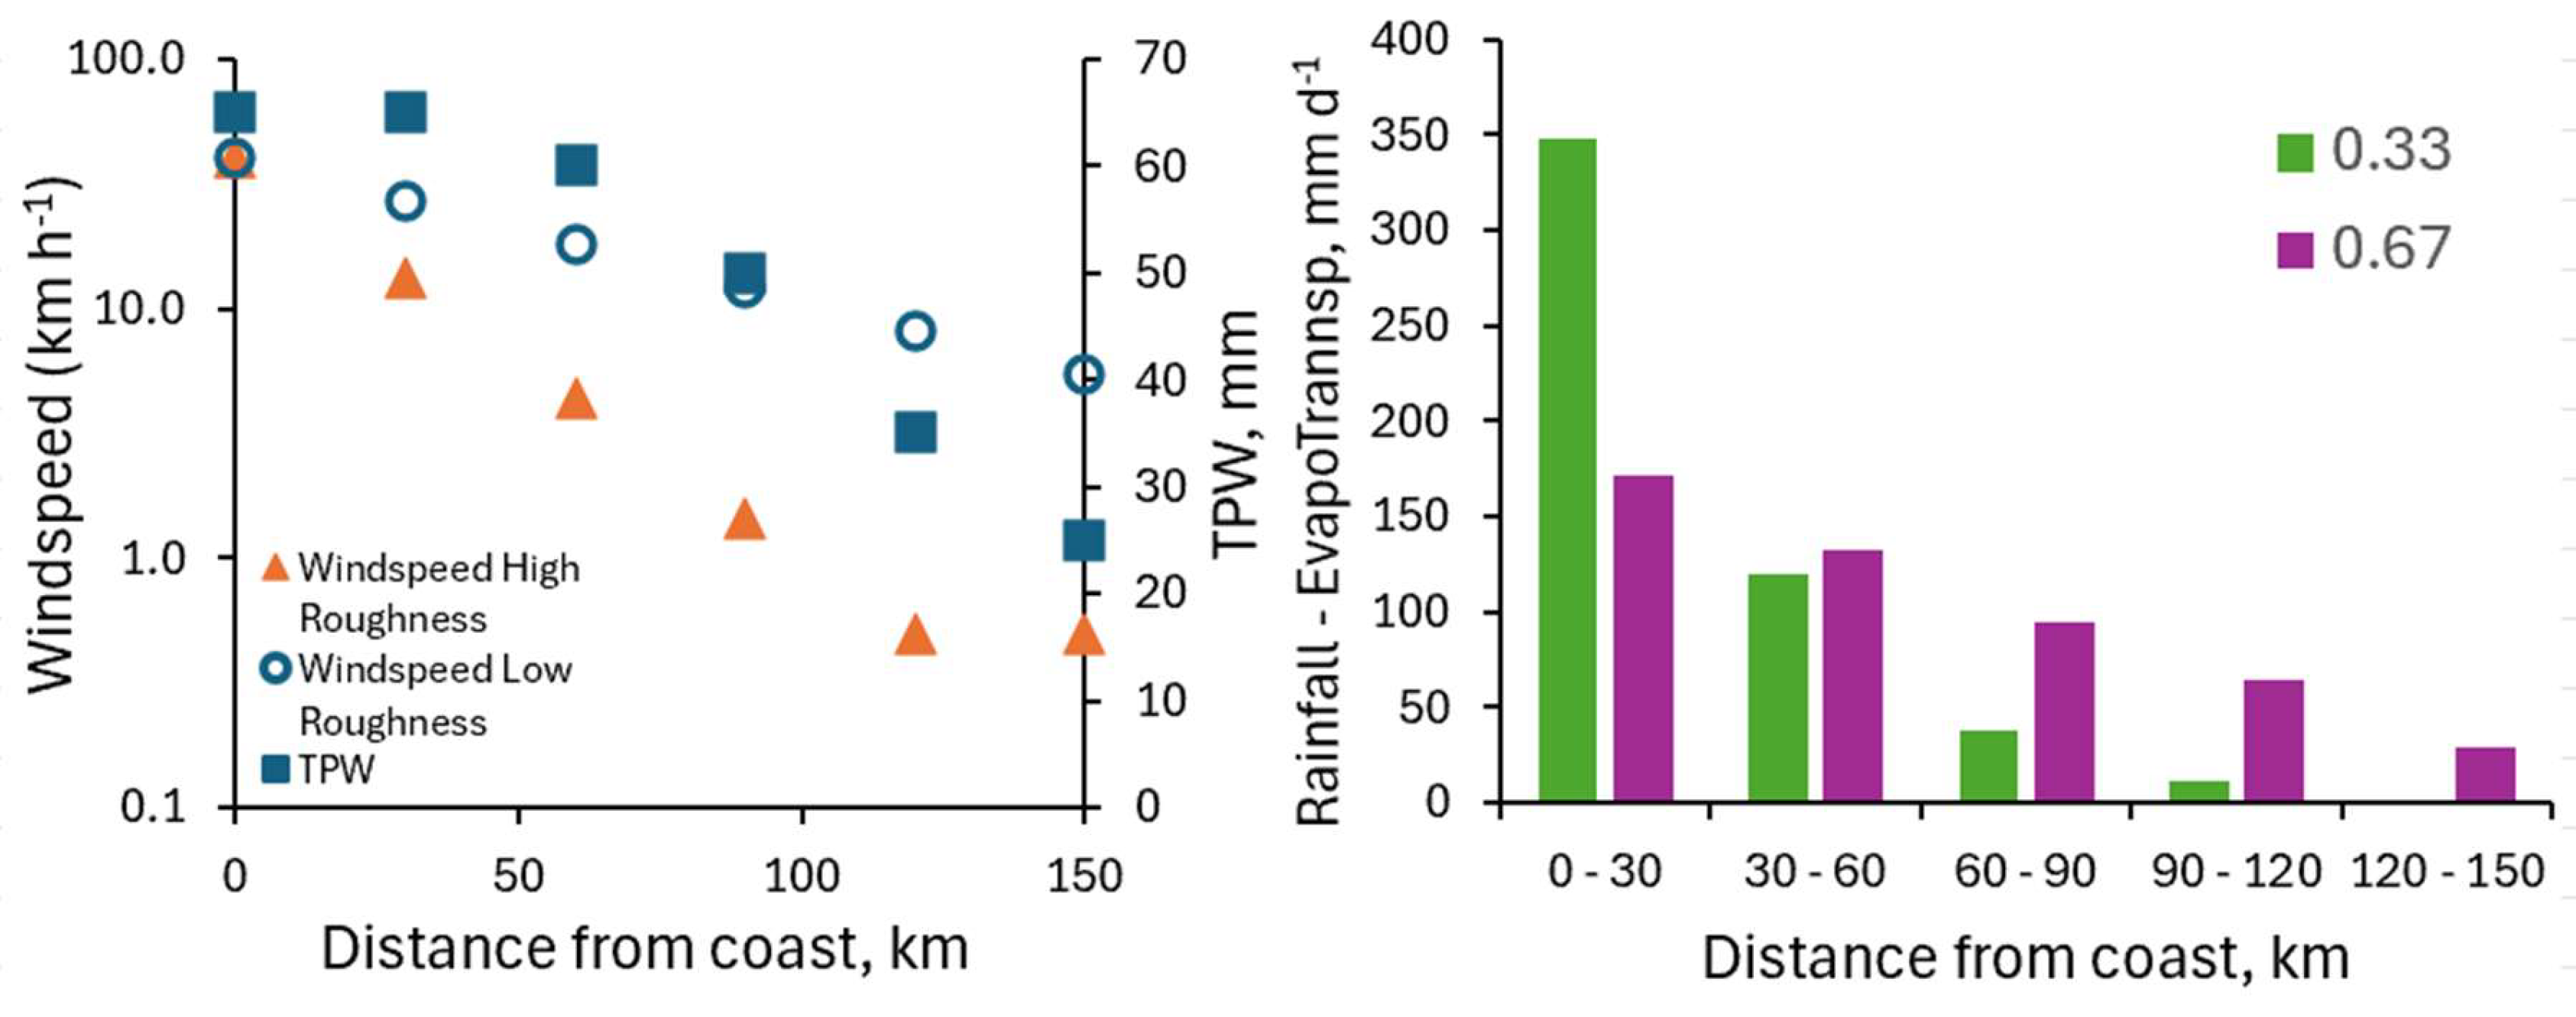
Figure 10.
Schematic partitioning of a peak rainfall event over temporary on-site and in-landscape storage versus flow pathways that reach the streams and rivers within 24 hours with further dynamics dependent on the river network and bank overflow opportunities.
Figure 10.
Schematic partitioning of a peak rainfall event over temporary on-site and in-landscape storage versus flow pathways that reach the streams and rivers within 24 hours with further dynamics dependent on the river network and bank overflow opportunities.
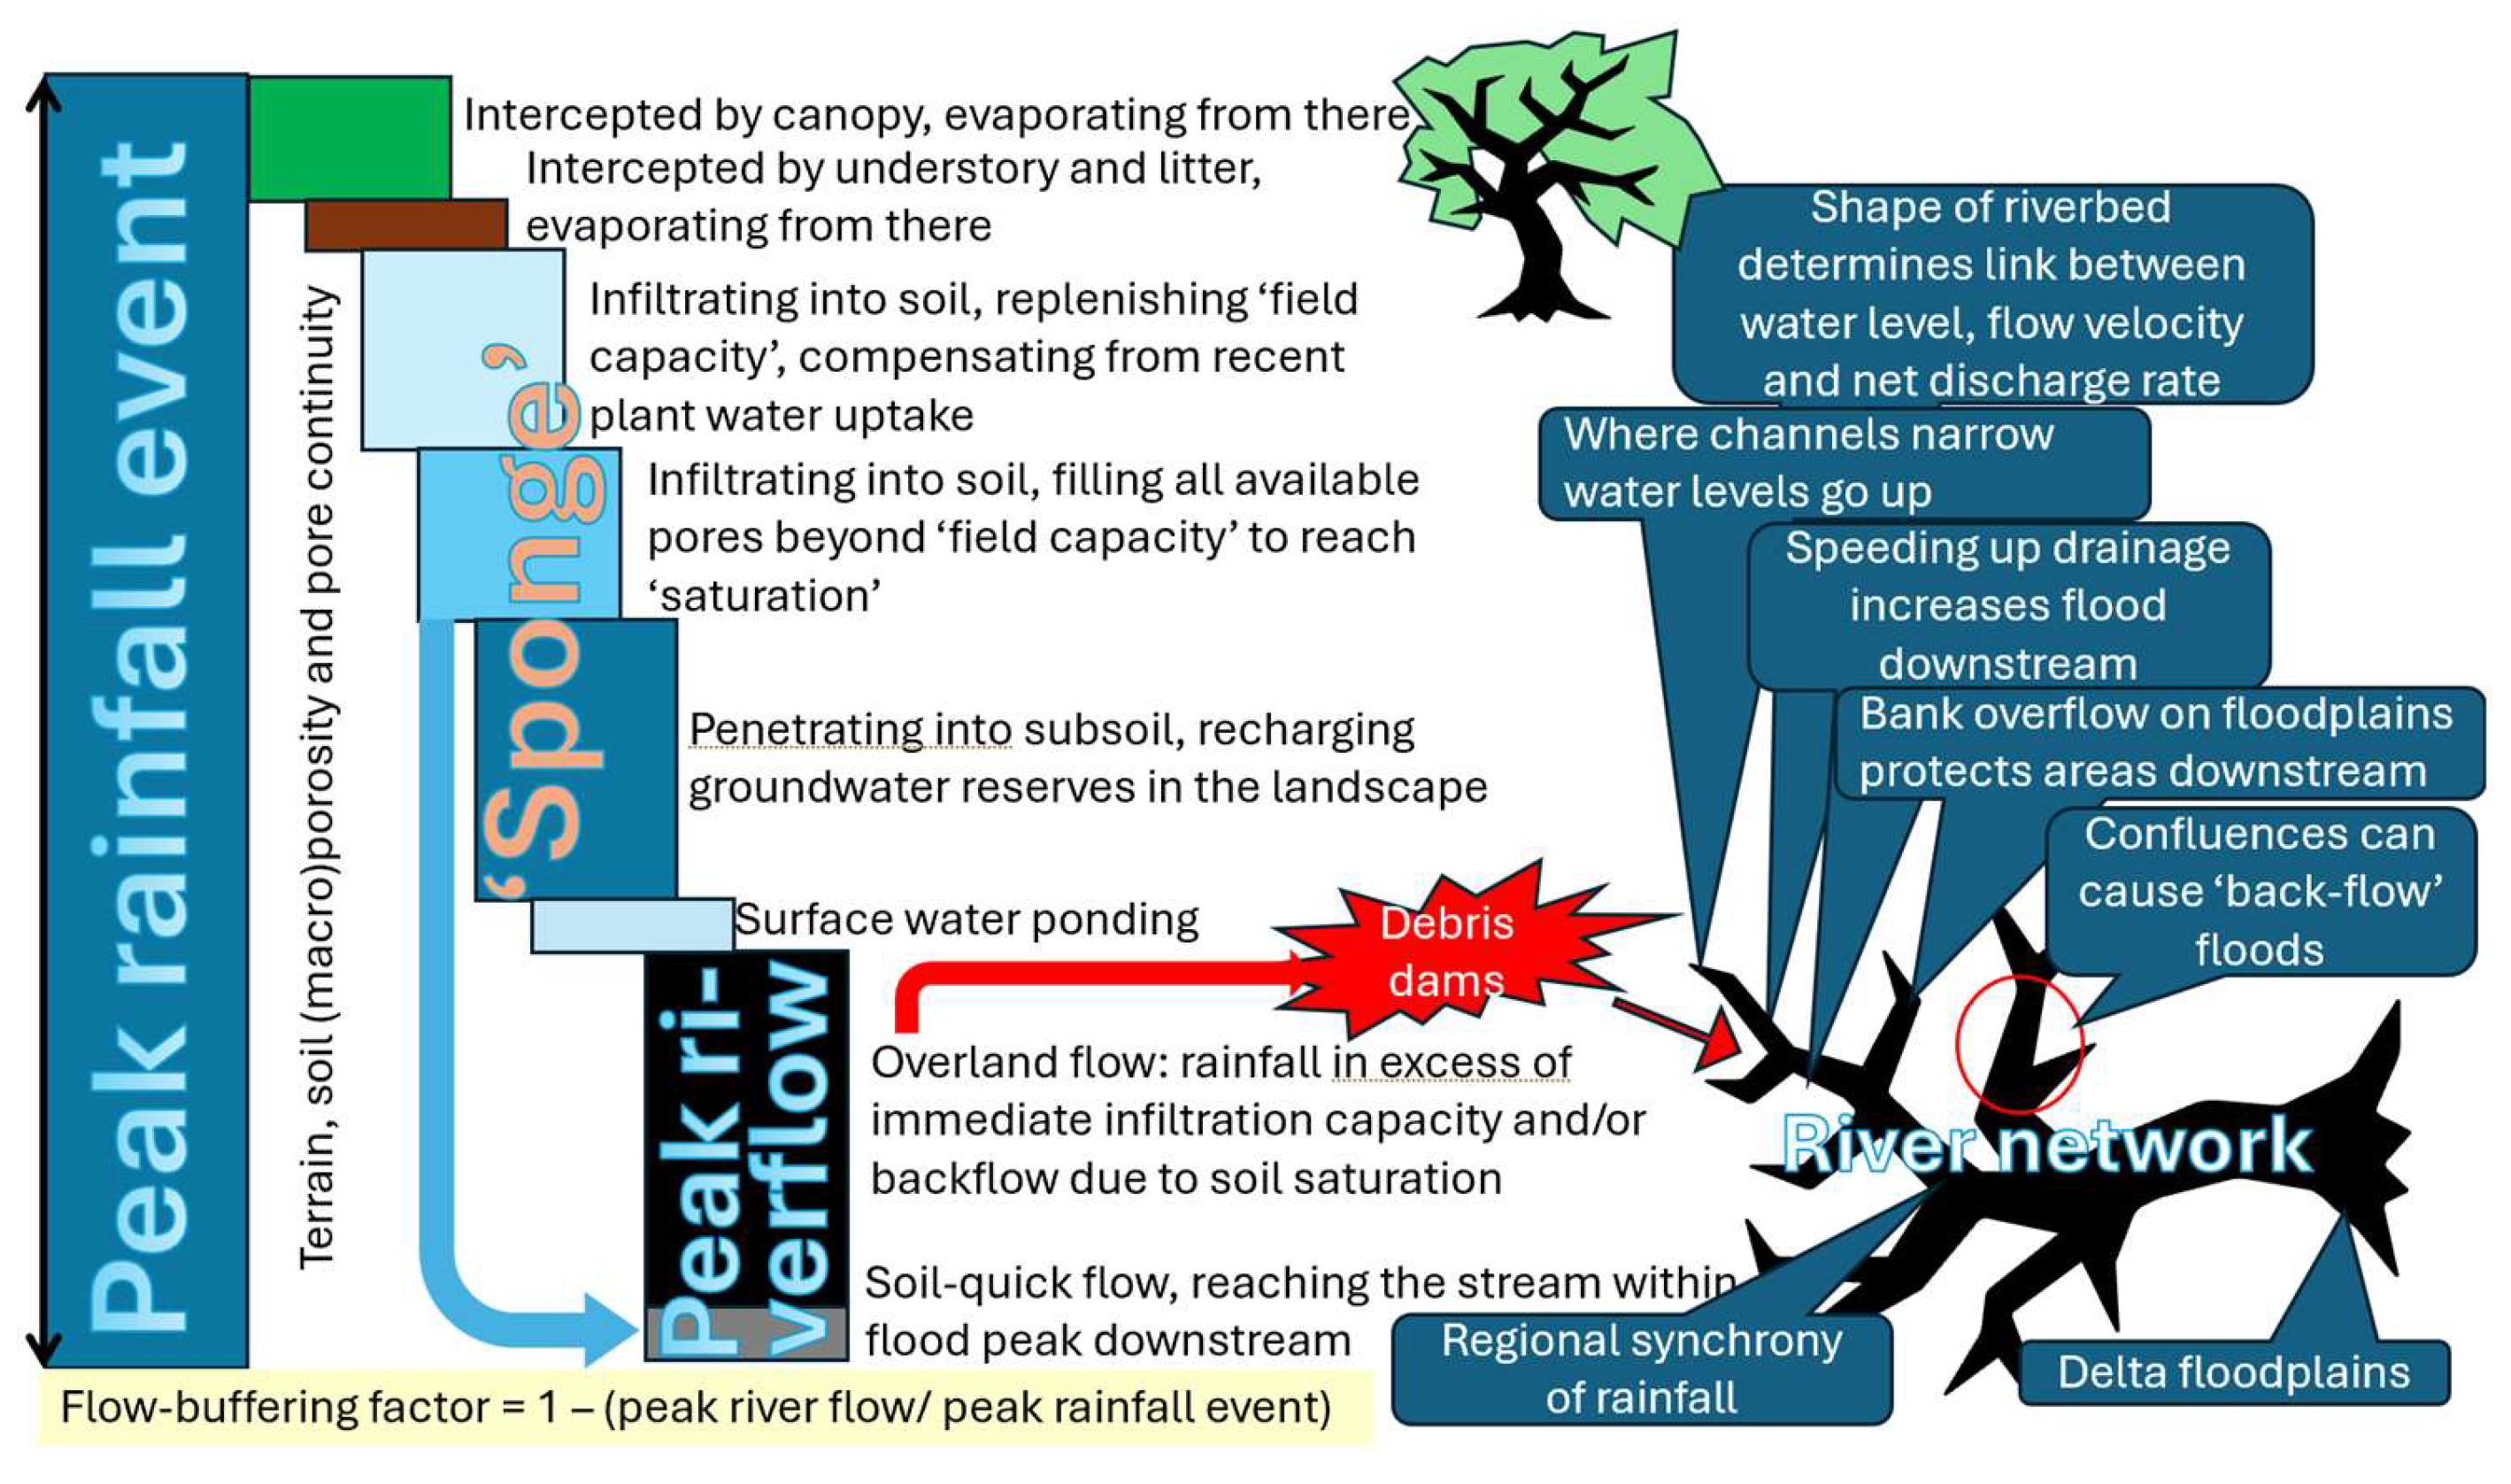
Figure 11.
Estimated of the Fp flow buffer indicator for a range of vegetation+soil systems and land use scenarios (where a landscape is composed of various fractions of the specified vegetation types).
Figure 11.
Estimated of the Fp flow buffer indicator for a range of vegetation+soil systems and land use scenarios (where a landscape is composed of various fractions of the specified vegetation types).
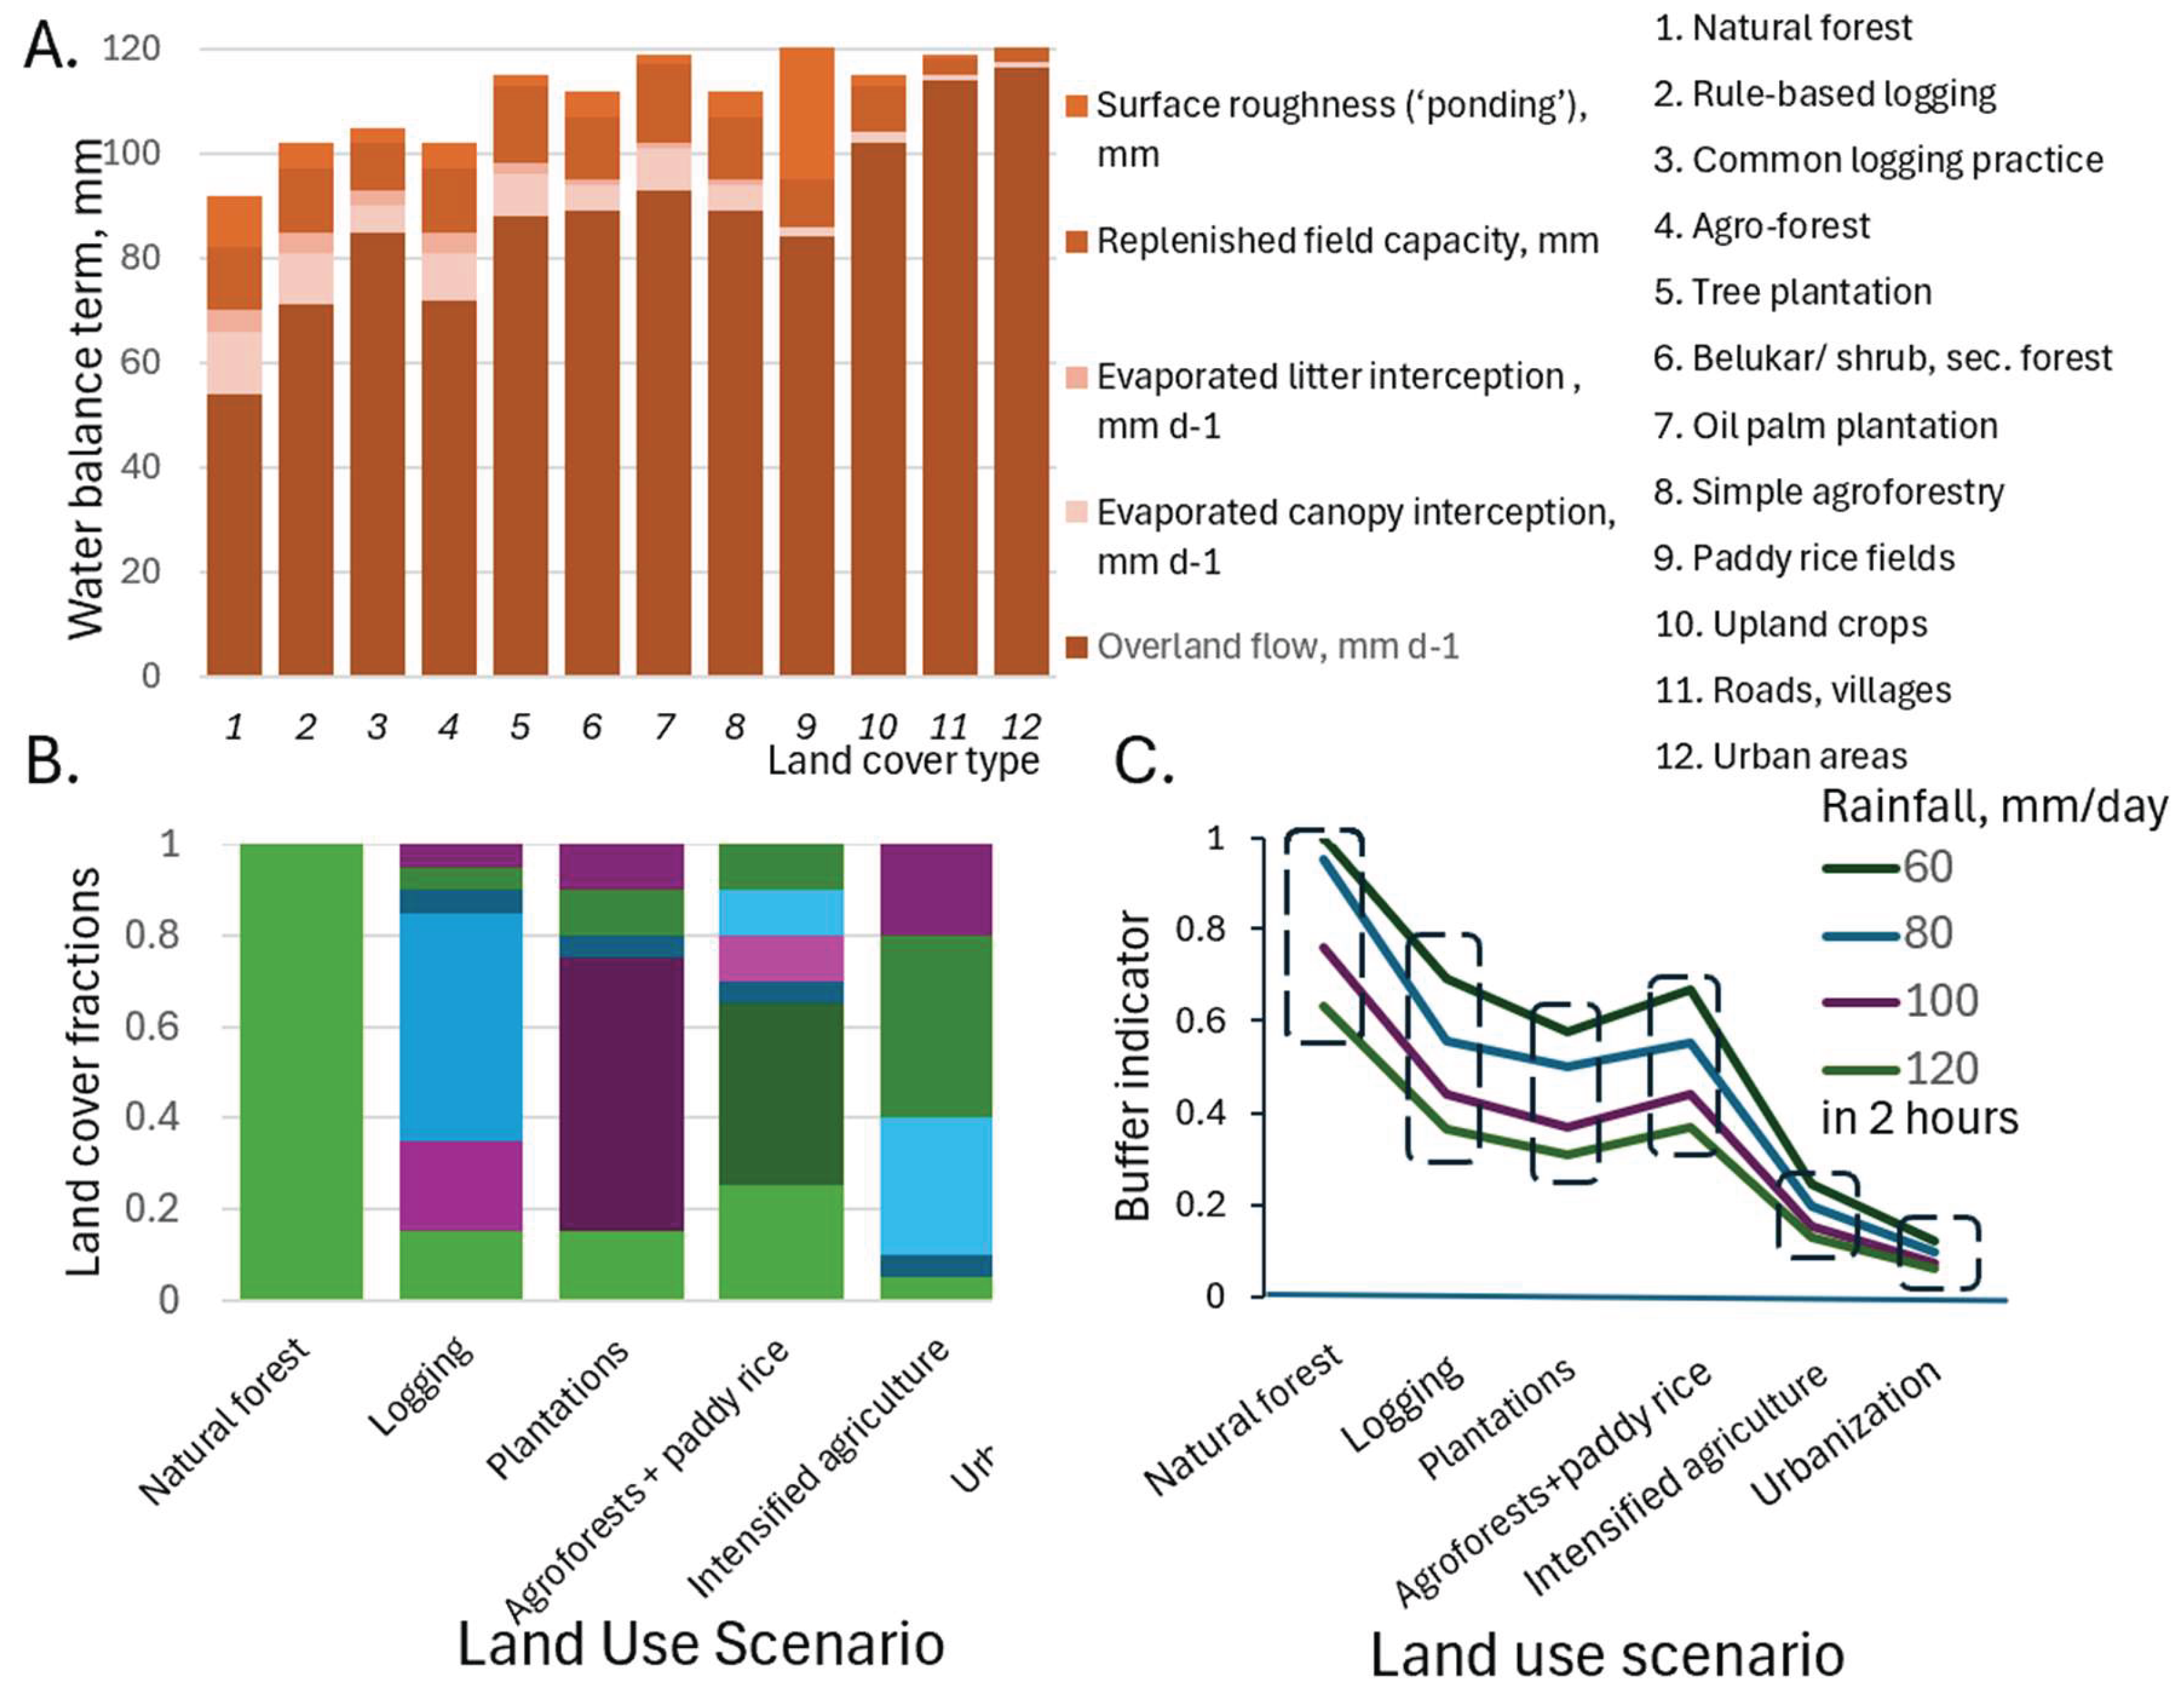

Table 1.
Flood risk problems and solutions across hazard, exposure, and vulnerability (modified from [4]).
Table 1.
Flood risk problems and solutions across hazard, exposure, and vulnerability (modified from [4]).
| Category | Problem | Solution/recommendation |
| Hazard | Increasing occurrence of compound extreme events (e.g., Cyclone Senyar-Dita interaction), amplified by climate anomalies (ENSO, IOD) | Strengthen regional weather monitoring, forecasting and early warning systems. Integrate atmospheric and land-surface hydrology |
| Climate change disrupts historical baselines, making events harder to predict | Shift from reliance on historical statistics to process-based planning under a shifting climate ‘normal’ | |
| Lack of recognition of land-atmosphere feedback (e.g., forests and trees influencing rainfall and cooling) | Explicitly include fforest-water-climate linkages in adaptation policy and financing mechanisms | |
| Exposure | Decline in landscape buffering due to deforestation, soil compaction, conversion to plantations | Promote hydrologically functional landscapes that can include agroforestry, wetlands, terracing and infiltration-friendly land uses |
| Clear-felling and logging debris aggravates downstream impacts through ‘log-jams’ | Enforce environmental safeguards; strengthen monitoring of forest concessions; support evidence-based zoning (e.g., of protection forest categories) | |
| Settlements and infrastructure located in high-risk zones due to poor or non-implemented spatial planning | Improve risk-informed land use planning, enforce zoning and support community-based early response mechanisms | |
| Vulnerability | Reclassification of locally adaptive systems (e.g., protective gardens or kebun lindung) as ‘state forest’ reduced resilience | Recognize and integrate locally managed, multifunctional systems in formal land use and adaptation planning |
| Weak institutional coordination across forest, water (public works, agriculture) and disaster sectors | Develop shared diagnostic and integrative governance frameworks at multiple scales | |
| Public narratives oversimplify causes (e.g., the deforestation → floods slogan) and distract from systemic solutions | Encourage multi-perspective dialogue and Science-Policy communication; counter scape-goating with systemic diagnosis | |
| Climate adaptation policies are often disconnected from flood realities-on-the-ground | Reconcile UNFCCC adaptation frameworks with hazard-exposure-vulnerability logic from the disaster risk reduction traditions | |
| Unequal access to resources and limited adaptive capacity in affected communities | Invest in human and institutional capacity, e.g., guided by the Inner-Development-Goals |
Table 2.
Differentiation of flood phenomena from a user perspective with potential responses and required technical expertise.
Table 2.
Differentiation of flood phenomena from a user perspective with potential responses and required technical expertise.
| Frequency | Context | Adaptive land use | Responses | Technical expertise |
| Twice a day | Tides in coastal zone |
|
|
|
| Once a year | Seasonal floodplains in peneplains and delta’s |
|
|
|
| Once per decade (0.1 year-1) |
Exceeding naturally formed ‘bank-full’ flow beyond seasonal floodplains |
|
|
|
| Once per century (0.01 year-1) |
Maps of the riverine or coastal 100-year floodplain inform building permits, and flood insurance |
|
|
|
| Once in millennium (0.001 year-1) |
Acceptable for all but most sensitive urban uses |
|
|
|
Disclaimer/Publisher’s Note: The statements, opinions and data contained in all publications are solely those of the individual author(s) and contributor(s) and not of MDPI and/or the editor(s). MDPI and/or the editor(s) disclaim responsibility for any injury to people or property resulting from any ideas, methods, instructions or products referred to in the content. |
© 2026 by the authors. Licensee MDPI, Basel, Switzerland. This article is an open access article distributed under the terms and conditions of the Creative Commons Attribution (CC BY) license (http://creativecommons.org/licenses/by/4.0/).
Copyright: This open access article is published under a Creative Commons CC BY 4.0 license, which permit the free download, distribution, and reuse, provided that the author and preprint are cited in any reuse.


