

Submitted:
22 July 2026
Posted:
22 July 2026
You are already at the latest version
Abstract
Organizations increasingly require integrated mechanisms to continuously interpret human, structural, and cultural signals often overlooked by conventional business intelligence and human resource systems. This study presents IntellicaHR, a web-based socio-technical Organizational Intelligence System integrating role-based workflows, normalized performance indicators, Large Language Model–supported semantic analysis and interpretation, gamification, and established management theory. The platform operationalizes the McKinsey 7S Framework for continuous organizational alignment monitoring and uses Deming’s System of Profound Knowledge to structure executive-level explanations and recommendations. Because real workplace data on emotional climate, leadership behavior, skill alignment, and conflict are ethically and practically difficult to obtain, the system is demonstrated using three literature-grounded synthetic organizational scenarios: a Healthy Organization, a Skill-Misaligned Organization, and a Toxic Management Environment. Scenario characteristics are formalized through fuzzy linguistic states and overlapping membership functions to generate synthetic users, reports, assessments, project interactions, and managerial communications over a 45-day simulation. These artifacts are processed through IntellicaHR’s native analytics and interpretation pipeline. The resulting metric profiles matched the intended scenario definitions and were clearly distinguishable. The Healthy Organization exhibited high participation, strong skill adequacy, positive emotional tone, and low conflict; the Skill-Misaligned Organization showed capability and execution deficiencies; and the Toxic Management Environment exhibited elevated conflict, negative emotional patterns, and weaker managerial responsiveness. These findings demonstrate the functional coherence and scenario-sensitive behavior of IntellicaHR as a proof-of-concept artifact but do not establish real-world diagnostic accuracy, predictive validity, or organizational effectiveness, which require future longitudinal evaluation with real users and organizational data.
Keywords:
organizational intelligence
; socio-technical systems
; large language models
; Mckinsey 7S
; Deming’s system of profound knowledge
; fuzzy logic
; synthetic organizational scenarios
; human–AI collaboration
1. Introduction
Organizational performance is increasingly framed as alignment among human, cultural, structural, and strategic elements rather than solely technical efficiency. Research links positive organizational culture to engagement, productivity, and retention, while toxic or ambiguous cultures drive disengagement and attrition [1,2,59]. Leadership critically shapes these dynamics through communication quality, emotional intelligence, and ethical behavior [17,65,79], with engagement and culture forming reinforcing feedback loops that signal systemic misalignment when disrupted [1].
Many organizational dysfunctions nonetheless emerge gradually and remain invisible to formal metrics. Skill gaps, leadership toxicity, emotional exhaustion, and perceptual misalignment often develop beneath the surface of structural indicators [2,40,60]. Traditional performance measures—largely financial and retrospective—fail to capture these human and cultural dynamics, limiting early detection and organizational learning [3,20].
Classical management frameworks provide conceptual grounding but remain weakly operationalized in digital systems. Deming’s System of Profound Knowledge emphasizes feedback-driven learning across systems, variation, psychology, and theory of knowledge [25], while the McKinsey 7S framework offers a holistic view of organizational alignment across strategy, structure, systems, skills, staff, style, and shared values [14]. Empirical evidence consistently shows that “soft” elements—leadership style, shared values, and learning culture—outweigh structural factors in shaping performance [20], yet these frameworks are typically applied as static diagnostics rather than continuous mechanisms.
Business intelligence (BI) and human resource analytics have expanded visibility into workforce trends, skills, and performance. BI systems transform large datasets into insights through analysis and visualization [72], while HR analytics support transparency and workforce planning [52]. However, most BI-driven HR systems remain descriptive, fragmented, and weakly grounded in organizational theory, reporting outcomes without explaining their links to leadership behavior, emotional climate, or cultural misalignment [3,41].
Recent advances in artificial intelligence, particularly Large Language Models (LLMs), extend the capabilities of organizational analytics by enabling the interpretation of unstructured language and contextual narratives. While AI can augment leadership decision-making, its effectiveness depends on maintaining human judgment, ethics, and accountability [5,13]. Scholars caution that automation risks eroding human values unless embedded within socio-technical feedback structures that keep “the organization in the loop” [32,62].
Socio-technical theory conceptualizes organizations as complex systems in which human, technological, and organizational elements co-evolve [24,47]. Organizational intelligence thus emerges through continuous feedback, interpretation, and learning rather than isolated optimization [44,67]. Recent research emphasizes integrated organizational sensory mechanisms that detect signals, interpret meaning, and coordinate responses across levels [19,63,81], aligning with leadership models grounded in psychological safety, emotional intelligence, and systems thinking [39,66,68]. Finally, gamification has been proposed as a complementary socio-technical mechanism for sustaining participation and feedback. When meaningfully designed, gamification enhances intrinsic motivation, engagement, and learning by embedding feedback loops into everyday practices rather than functioning as superficial incentives [42,69].
Despite growing recognition of the importance of culture, leadership, and workforce alignment, organizations lack integrated mechanisms to sense and interpret these dynamics continuously. HRM and BI systems remain primarily administrative or retrospective, and collaboration tools generate data without insight, leaving early signals of misalignment undetected until performance declines. Established frameworks such as Deming’s System of Profound Knowledge and the McKinsey 7S model are applied as static diagnostics, while AI applications—despite advances in Large Language Models—prioritize automation over reflective sensemaking.
Evaluating such systems using real organizational data is ethically and practically constrained, as the required signals—leadership behavior, emotional climate, conflict, and organizational misalignment—are highly sensitive and typically inaccessible due to workplace privacy regulations and legal frameworks such as GDPR [16,22,36,49]. Consequently, evaluation approaches must rely on theory-driven, scenario-based experimentation that preserves organizational realism while avoiding disclosure of real-world data, an approach widely supported in design-science and information systems research [45,54].
To address this gap, this paper presents IntellicaHR, a web-based socio-technical Organizational Intelligence System that integrates organizational sensing, role-based collaboration, business intelligence, gamification, Large Language Models (LLMs), and established management theory within a continuous feedback architecture. IntellicaHR operationalizes the McKinsey 7S Framework for continuous organizational alignment monitoring and employs Deming’s System of Profound Knowledge to structure AI-assisted organizational interpretation and executive decision support. To demonstrate the implemented system, a proof-of-concept evaluation is conducted using three literature-grounded synthetic organizational scenarios generated through fuzzy logic and LLM-conditioned interactions. Rather than validating organizational diagnosis in real-world settings, the study examines whether the platform produces coherent, distinguishable, and theory-grounded outputs under controlled organizational conditions.
2. Theoretical Foundations and Related Work
Understanding the theoretical and technological foundations that underpin IntellicaHR requires an exploration across several interconnected domains. This section demonstrates how IntellicaHR builds upon, synthesizes, and extends its principles into a coherent feedback-driven socio-technical architecture of organizational intelligence.
2.1. Deming’s System of Profound Knowledge and Continuous Improvement
Deming’s System of Profound Knowledge (SoPK) remains foundational for understanding continuous improvement and organizational learning. It emphasizes four interdependent elements—Appreciation for a System, Knowledge of Variation, Theory of Knowledge, and Psychology—that jointly explain how organizations learn and adapt. Shraim and Allan [70] applied these principles to managerial challenges, showing that performance variation often reflects organizational rather than individual failures. Tomov [80] applied the SoPK conceptually to project management, proposing pillars as theoretical conditions for antifragile management, through analytical and epistemological modeling. Owusu et al. [55] confirmed that firms adopting SoPK’s holistic feedback logic achieve greater sustainability. IntellicaHR operationalizes SoPK through LLM-based interpretation of employee data, providing insights into variation, psychological climate, and interdependencies to support continuous organizational learning over automated control.
2.2. McKinsey’s 7S Framework and Organizational Alignment
The McKinsey 7S Framework—comprising Strategy, Structure, Systems, Skills, Style, Staff, and Shared Values—continues to provide a holistic diagnostic model for alignment and transformation. Studies by Hanafizadeh and Zareravasan [33] and Shaqrah [71] established its analytical value, while Chmielewska et al. [20] and Bounjerte et al. [14] demonstrated its applicability to healthcare, revealing that misalignment among staff competencies, cultural values, and organizational structures undermines institutional performance. Jain and Kansal [51] and Abouaomar and Alhaderi [6] extended the model to digital transformation contexts, arguing that successful change requires continuous monitoring of inter-element harmony rather than one-time realignment.
This work transforms the static 7S framework into a dynamic, indicator-based alignment map. Metrics linked to documented 7S barriers (Table 1) are continuously mapped to each dimension, while dashboards and LLM-generated narratives interpret organizational implications (Section 3.6). This extends prior work [14,51,71], making the 7S framework measurable, interpretable, and continuously monitored.
2.3. Socio-Technical and Cybernetic Perspectives
Socio-technical theory views organizations as joint human–technology systems whose effectiveness depends on interaction and sense-making rather than technical optimization alone. Early work by Doherty and King [24] and Maguire [47] showed that neglecting social and organizational dynamics leads to failure despite sound technical design. Botla [15] reframed socio-technical systems (STS) as strategic, organization-wide structures integrating human capability, governance, and learning, arguing that STS enhances competitiveness, innovation, and HR development. Øvrelid [74] empirically demonstrated that organizational architecture succeeds when it transforms business and learning rather than serving as a technical support system, aligning with IntellicaHR’s feedback-driven design. Similarly, Al-Abrrow et al. [7] showed that socio-technical integration mediates sustainable performance, emphasizing that technological value emerges through cultural and human alignment.
Cybernetic theory complements this view by emphasizing feedback, regulation, and viability. Schwaninger [67] advanced model-based management, highlighting the use of reflexive feedback and simulation for organizational foresight. Hasani et al. [34] empirically linked cybernetic management—characterized by participative decision-making and information accuracy—to organizational health, while Cibu et al. [58] traced the evolution of cybernetics toward AI-driven adaptive learning.
2.4. AI-Augmented Decision Making and Leadership
AI-augmented decision-making research distinguishes augmentation from automation, emphasizing human–AI synergy. Authors in [5] demonstrate that explainability and ethical governance play a critical role in leadership adoption, while Sunkar [73] proposed that AI and data analytics enhance strategic decision-making by supporting predictive approaches while reinforcing the continued importance of human judgment. Kromidha and Davison [43] examined generative AI decision processes through phases of problem understanding, option evaluation, and emotional alignment, highlighting a moral-responsibility gap between algorithmic efficiency and human accountability.
We address this gap by preserving leadership oversight and embedding reflective feedback. Authors in [56] described AI-driven decision intelligence as a shift from descriptive to proactive analytics, cautioning that cultural resistance and governance gaps limit success. Complementary studies by Bevilacqua et al. [13] and Peifer et al. [57] show that AI integration reshapes leadership behavior, enhancing emotional awareness and data-driven adaptability. Zhang et al. [64] demonstrate that adaptive leadership behaviors and cross-boundary coordination are critical for successful AI adoption, highlighting the need for systems that actively support reflective leadership.
2.5. Business Intelligence, Enterprise Collaboration, and Organizational Intelligence
BI, HR performance measurement, and ECPs have evolved from reporting-oriented mechanisms into organizational sensing infrastructures that connect measurement, visualization, interpretation, collaboration, and action [78]. Early BI research focused on dashboards and performance monitoring [52], Baral et al. [82] show that AI-supported HR dashboards enable proactive monitoring of workforce skills, and Weng et al. [72] demonstrate that LLM-powered BI transforms dashboards into interactive systems with natural-language querying, automated insights, and explanatory analytics.
ECPs have become essential for interaction and knowledge exchange. Pustylnick [1] described ECPs as social network–like systems shaped by informal ties and group interaction. Schubert and Williams [76] showed how integrated digital workplaces support coordination and sense-making, while Friess et al. [27] emphasized participation, personalization, gamification, and contextual relevance as key socio-technical factors.
An emerging body of work links BI and collaboration systems to Organizational Intelligence (OI). Chomicki [19] defines OI through organizational sensory systems that monitor signals, interpret events, and coordinate responses. Methuku and Kamatala [81] emphasize real-time analytics and human–AI feedback loops, while Kapoor [63] conceptualizes the enterprise as a continuously sensing and adapting digital twin. In HR, Gong et al. [30] identify AI-enhanced collaboration and insights as drivers of better decisions, whereas Shaqrah [71] shows that BI aligned with the McKinsey 7S strengthens strategic, cultural, and workforce alignment. Together, these studies frame OI as the integration of sensing, interpretation, and coordinated action.
Unlike BI or collaboration platforms, IntellicaHR continuously maps organizational signals to the McKinsey 7S framework and Deming’s SoPK. LLMs interpret patterns, detect misalignment, and generate early warnings, addressing calls for semantic BI [35,72] and AI-augmented managerial sense-making [13].
2.6. Gamification and Adaptive Engagement
Gamification has emerged as a powerful approach for enhancing motivation, participation, and learning in organizational contexts. Sharma et al. [69] provided a comprehensive overview of gamification in business, concluding that meaningful design—rooted in intrinsic motivation and linked with analytics—drives innovation and performance. Farhan et al. [28] introduced machine-learning-driven gamification models that adapt rewards and challenges to user behavior, resulting in higher engagement than static systems. These findings suggest that gamification works best when coupled with data intelligence that personalizes experiences and links individual actions to organizational outcomes.
Khodabandelou et al. [42] identify business, educational, and psychological outcomes of organizational gamification, arguing that it functions not merely as a motivational tool but as a structured affordance system supporting feedback, safe learning, progressive challenge, and continuous capability development. IntellicaHR applies these principles through badges and scores that encourage participation, reflection, and continuous improvement, operationalizing both these affordances [42] and the adaptive engagement model of Alibakhshi et al. [8].
2.7. Synthesis and Research Gap
The reviewed literature collectively demonstrates that organizational effectiveness depends on continuous learning, alignment, and feedback across human, structural, and cultural subsystems. Management frameworks such as Deming’s System of Profound Knowledge (SoPK) and the McKinsey 7S model provide strong explanatory foundations for understanding organizational complexity, while Socio-Technical and Cybernetic perspectives emphasize feedback, interpretation, and co-evolution between human and technological elements. In parallel, Business Intelligence, Enterprise Collaboration Platforms, AI-Augmented Decision Support, and Gamification offer useful capabilities for organizational monitoring, communication, and engagement. However, these strands remain insufficiently integrated in practice. Existing systems typically operationalize analytics, communication, engagement, or AI in isolation, apply management theory retrospectively rather than continuously, and emphasize automation or descriptive reporting over interpretive sensemaking.
This gap motivates the need for a Socio-Technical Organizational Intelligence System capable of unifying continuous sensing, theory-grounded structuring, and human-centered interpretation into a single feedback process. To address this need, the following section presents IntellicaHR. As illustrated in Figure 1, IntellicaHR is positioned at the intersection of an Organizational Intelligence System that incorporates elements associated with Human Resource Management, Enterprise Collaboration Platforms, Business Intelligence, Socio-Technical systems, and AI-Augmented Decision Support. Rather than treating employee reports, emotional expressions, skill profiles, and project interactions as isolated data points, IntellicaHR interprets them as organizational signals. Large Language Models are used as Interpretive AI Mechanisms that translate unstructured textual and affective input into human-readable explanations structured through established management theories, thereby positioning Organizational Intelligence as an emergent property of continuous human–AI interaction.
3. Overview of the System Design and Organizational Feedback Architecture
IntellicaHR is a web-based Organizational Intelligence System designed to support continuous organizational learning through structured reporting, reflection, project activity, organizational assessment, Business Intelligence, and Large Language Model–assisted interpretation. The platform is implemented as a Blazor Server (.NET) web application with a relational database for persistent storage. Communication with the LLM is conducted through the OpenAI API using structured JSON requests and responses. Figure 2 presents the technological architecture of IntellicaHR.
The system comprises three role-oriented Layers—the Employee, Manager, and CEO Layers—and three supporting functional Layers: the Business Intelligence and Analytics Layer, the LLM Layer, and the Gamification Layer. An internal Interpretation Layer within the LLM Layer combines quantitative indicators with semantic signals and converts them into role-appropriate explanations and recommendations.
IntellicaHR operates through a continuous organizational feedback cycle. CEOs define strategic objectives and configure organizational assessment and reporting requirements. Managers translate these objectives into departmental projects, responsibilities, deadlines, and operational activities. Employees carry out assigned work, submit project updates and reflections, maintain skill-related information, and participate in organizational assessments. These activities generate structured and textual organizational data.
The Business Intelligence and Analytics Layer calculates and normalizes organizational indicators and maps them to the McKinsey 7S dimensions. In parallel, the LLM Layer extracts semantic signals from reflections, reports, communications, CVs, assessments, and strategic statements. Its internal Interpretation Layer combines both forms of evidence to produce employee-level feedback, departmental explanations, and organization-wide executive interpretations. For executive users, these interpretations are structured according to Deming’s System of Profound Knowledge.
The resulting information supports subsequent human action. Employees may modify their participation or reporting behavior, managers may revise project coordination or communication practices, and CEOs may reconsider organizational objectives or policies. These actions generate new data that re-enter the system, sustaining a recurring cycle of organizational activity, measurement, interpretation, and human response. Figure 3 illustrates this feedback architecture.
IntellicaHR does not treat analytical or LLM-generated outputs as definitive organizational judgments. The platform provides decision support and structured evidence, while employees, managers, and executives remain responsible for interpreting organizational context and determining appropriate actions.
Access to the platform is governed through Role-Based Access Control for Employees, Managers, CEOs, and Administrators. Employee reflections are anonymized before managerial or executive presentation, and only aggregated emotional and organizational patterns are made visible beyond the employee level.
3.1. Employee Layer
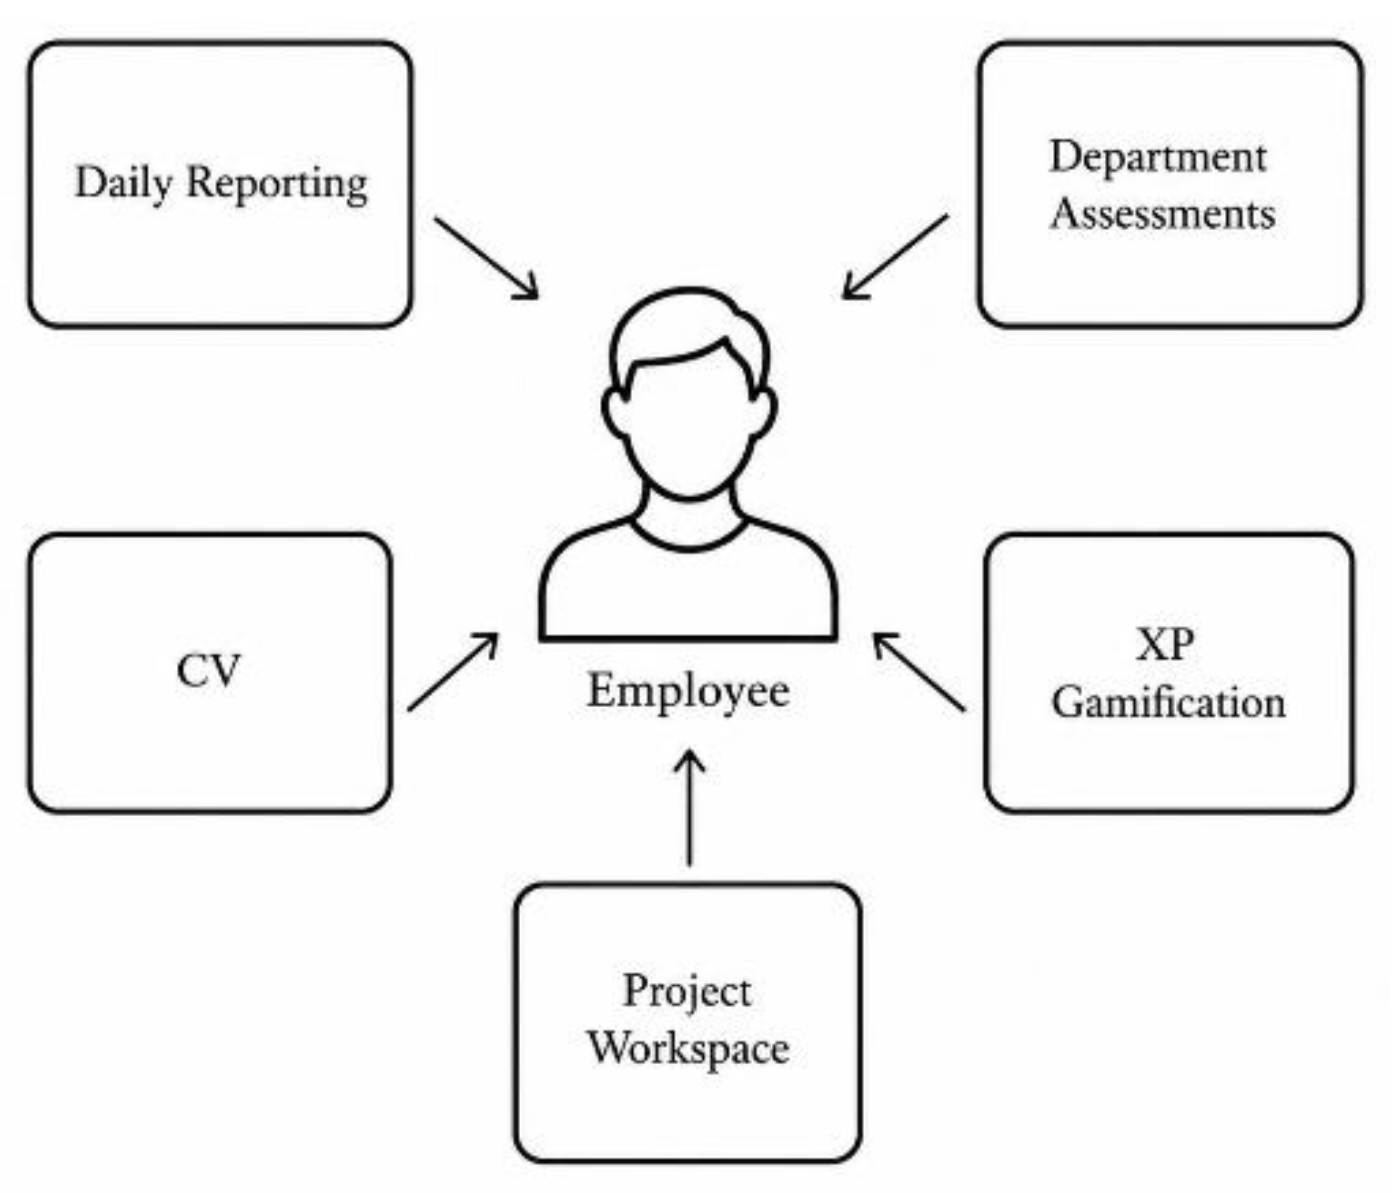
The Employee Layer enables employees to participate in organizational reporting, reflection, project communication, skill profiling, and assessment. It therefore captures employee activity and experience as inputs to the wider organizational feedback process. Employees submit reflections and progress reports according to intervals configured at the executive level. These reports describe workplace experiences, project progress, challenges, and emotional states. The textual content is processed by the LLM Layer, while only anonymized and aggregated patterns are presented to managers and executives.
The Layer also supports CV uploads and LLM-assisted skill extraction. The system identifies competencies and produces initial proficiency estimates using predefined categories. Managers may subsequently validate or revise these estimates. The validated information contributes to the organizational skill analysis described in Section 3.6. Through the project workspace, employees review assigned responsibilities, submit progress updates, report goal completion, and participate in threaded project discussions. These interactions create a persistent record of project activity and communication.
Employees also complete organizational assessments concerning selected dimensions such as communication, leadership, innovation, structure, and shared values. Their responses are aggregated and compared with managerial assessments to identify differences in organizational perception. Gamification elements, including experience points, badges, and progression indicators, are linked to reporting, assessment completion, and project participation. These mechanisms encourage continued engagement without replacing formal organizational evaluation. The Employee Layer consequently serves as the principal source of employee-generated behavioral, textual, project-related, assessment, and skill-related information.
Figure 4.
The Employee Layer of IntellicaHR.
3.2. Manager Layer
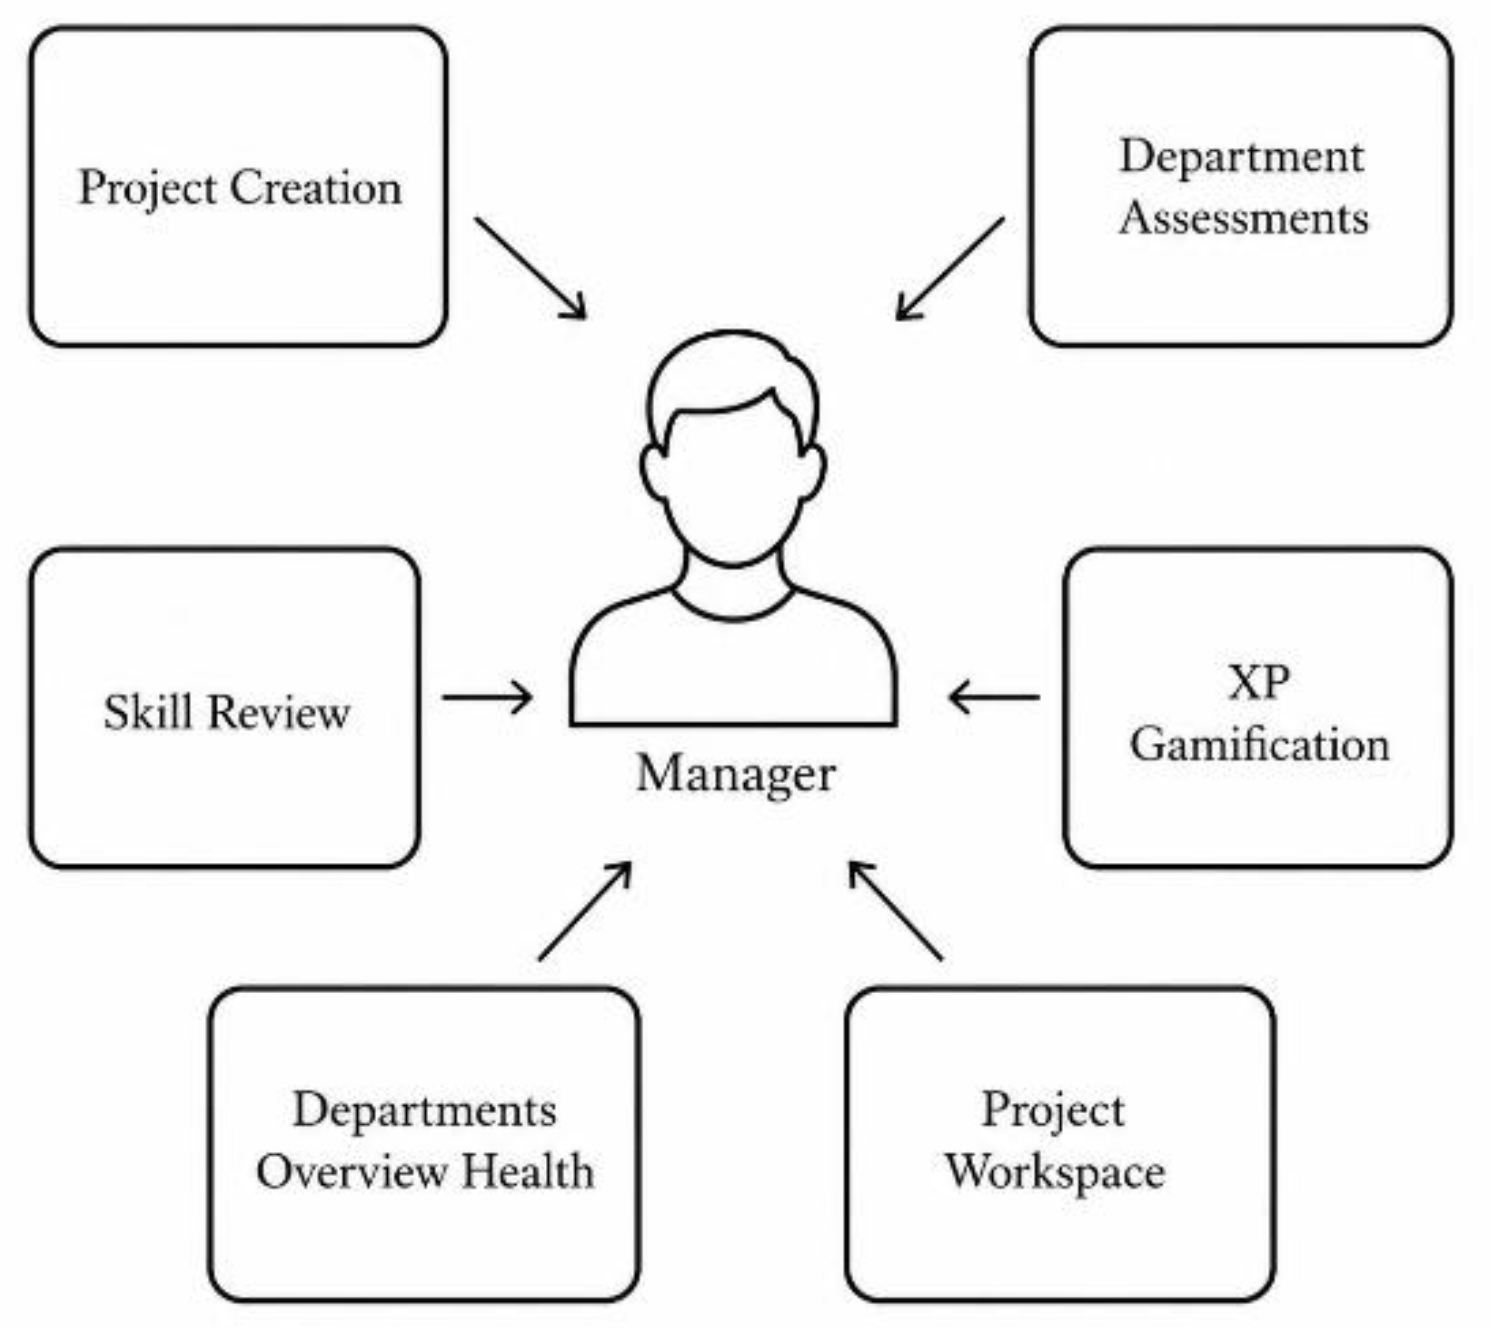
The Manager Layer supports translating executive objectives into departmental projects and operational activities. Managers define project goals, responsibilities, deadlines, employee assignments, reporting expectations, and expected outcomes. Managers review project updates, respond to employee reports, coordinate departmental work, and provide feedback through the project workspace. These actions generate information on project implementation and managerial participation, which is subsequently processed by the Business Intelligence and Analytics Layer.
The Manager Layer also supports skill validation. Managers review the competencies and proficiency levels extracted from employee CVs and confirm or revise the initial estimates. The resulting information contributes to the evaluation of workforce capability and skill alignment described in Section 3.6. Managerial communications, including project instructions, feedback, and responses, are analyzed by the LLM Layer according to predefined communication and leadership categories. These classifications are treated as contextual organizational signals rather than definitive evaluations of individual managers.
Managers additionally complete departmental assessments covering organizational dimensions selected by the CEO. Aggregated managerial responses compared with employee responses to identify perception gaps that require further examination.
Department-level dashboards provide managers with consolidated information derived from the analytical framework presented in Section 3.6. Rather than calculating separate manager-specific metrics, the Manager Layer presents the subset of organizational indicators relevant to departmental coordination, workforce capability, project activity, participation, communication, and organizational conditions.
Through these functions, the Manager Layer acts as the operational bridge between executive direction and employee-level organizational activity.
Figure 5.
The Manager Layer of IntellicaHR.
3.3. CEO Layer
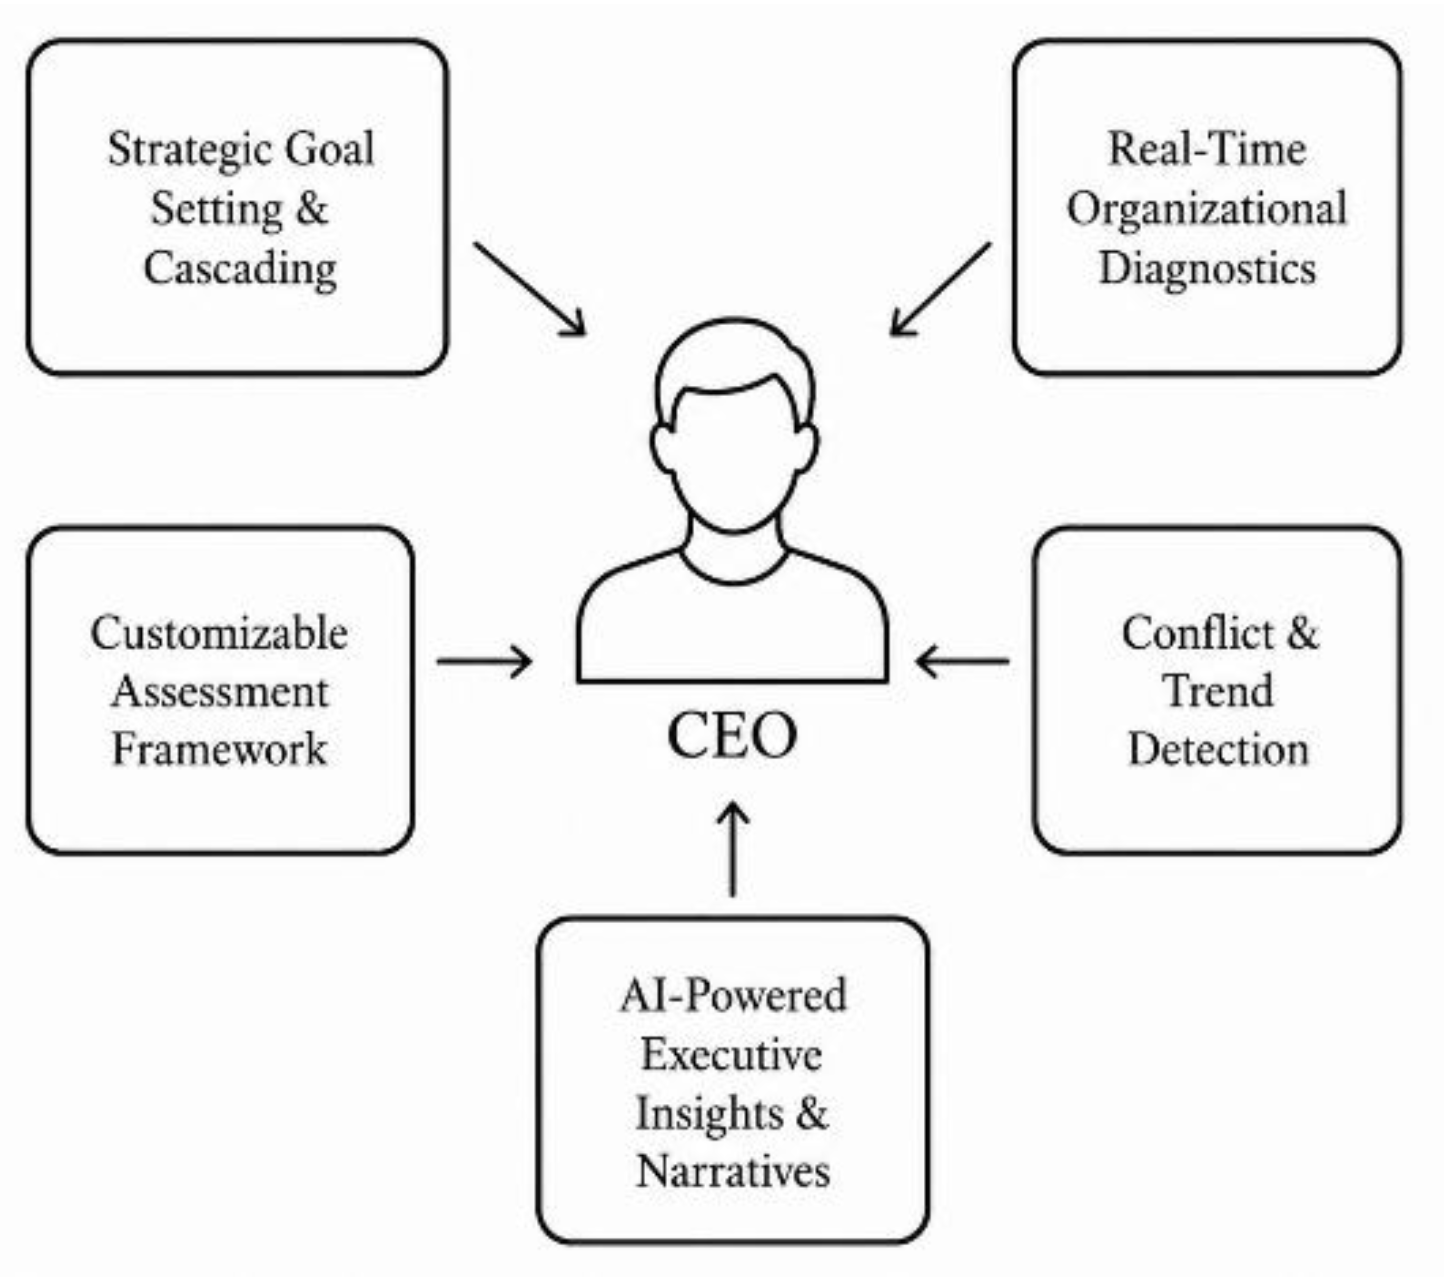
The CEO Layer provides strategic configuration, organization-wide monitoring, and executive decision support. Its primary function is to establish the organizational conditions under which employee and managerial activity is coordinated and evaluated. CEOs define high-level organizational objectives that managers subsequently translate into departmental projects and measurable outcomes. They also configure reflection and assessment processes by selecting the organizational dimensions to be examined and defining reporting and assessment intervals.
The CEO Layer presents aggregated, organization-wide information generated by the Business Intelligence and Analytics Layer. This includes cross-departmental and longitudinal views of the indicators defined in Section 3.6. The CEO Layer does not calculate a separate set of executive metrics; instead, it provides an organization-wide presentation of the common analytical framework. CEOs also review aggregated differences between employee and managerial assessments. These differences are presented as perception gaps that justify further inquiry, rather than as automatic evidence of conflict, leadership failure, or organizational dysfunction.
In addition to quantitative dashboards, the CEO Layer receives contextual explanations from the Interpretation Layer. These explanations combine the indicators defined in Section 3.6 with semantic signals extracted from organizational text. At the executive level, the resulting interpretations are structured according to Deming’s System of Profound Knowledge, addressing organizational interdependencies, variation, the evidential basis of available knowledge, and the psychological dimensions of organizational activity.
The CEO assigns responsibility for organizational objectives, selected McKinsey 7S dimensions, or improvement areas to departments or managers. This supports distributed accountability and subsequent progress monitoring. The CEO Layer therefore functions as an organizational orchestration and decision-support environment. It integrates strategic configuration, organization-wide analytical presentation, responsibility assignment, and theory-grounded interpretation without automating executive decisions.
Figure 6.
The CEO Layer of IntellicaHR.
3.4. LLM Layer
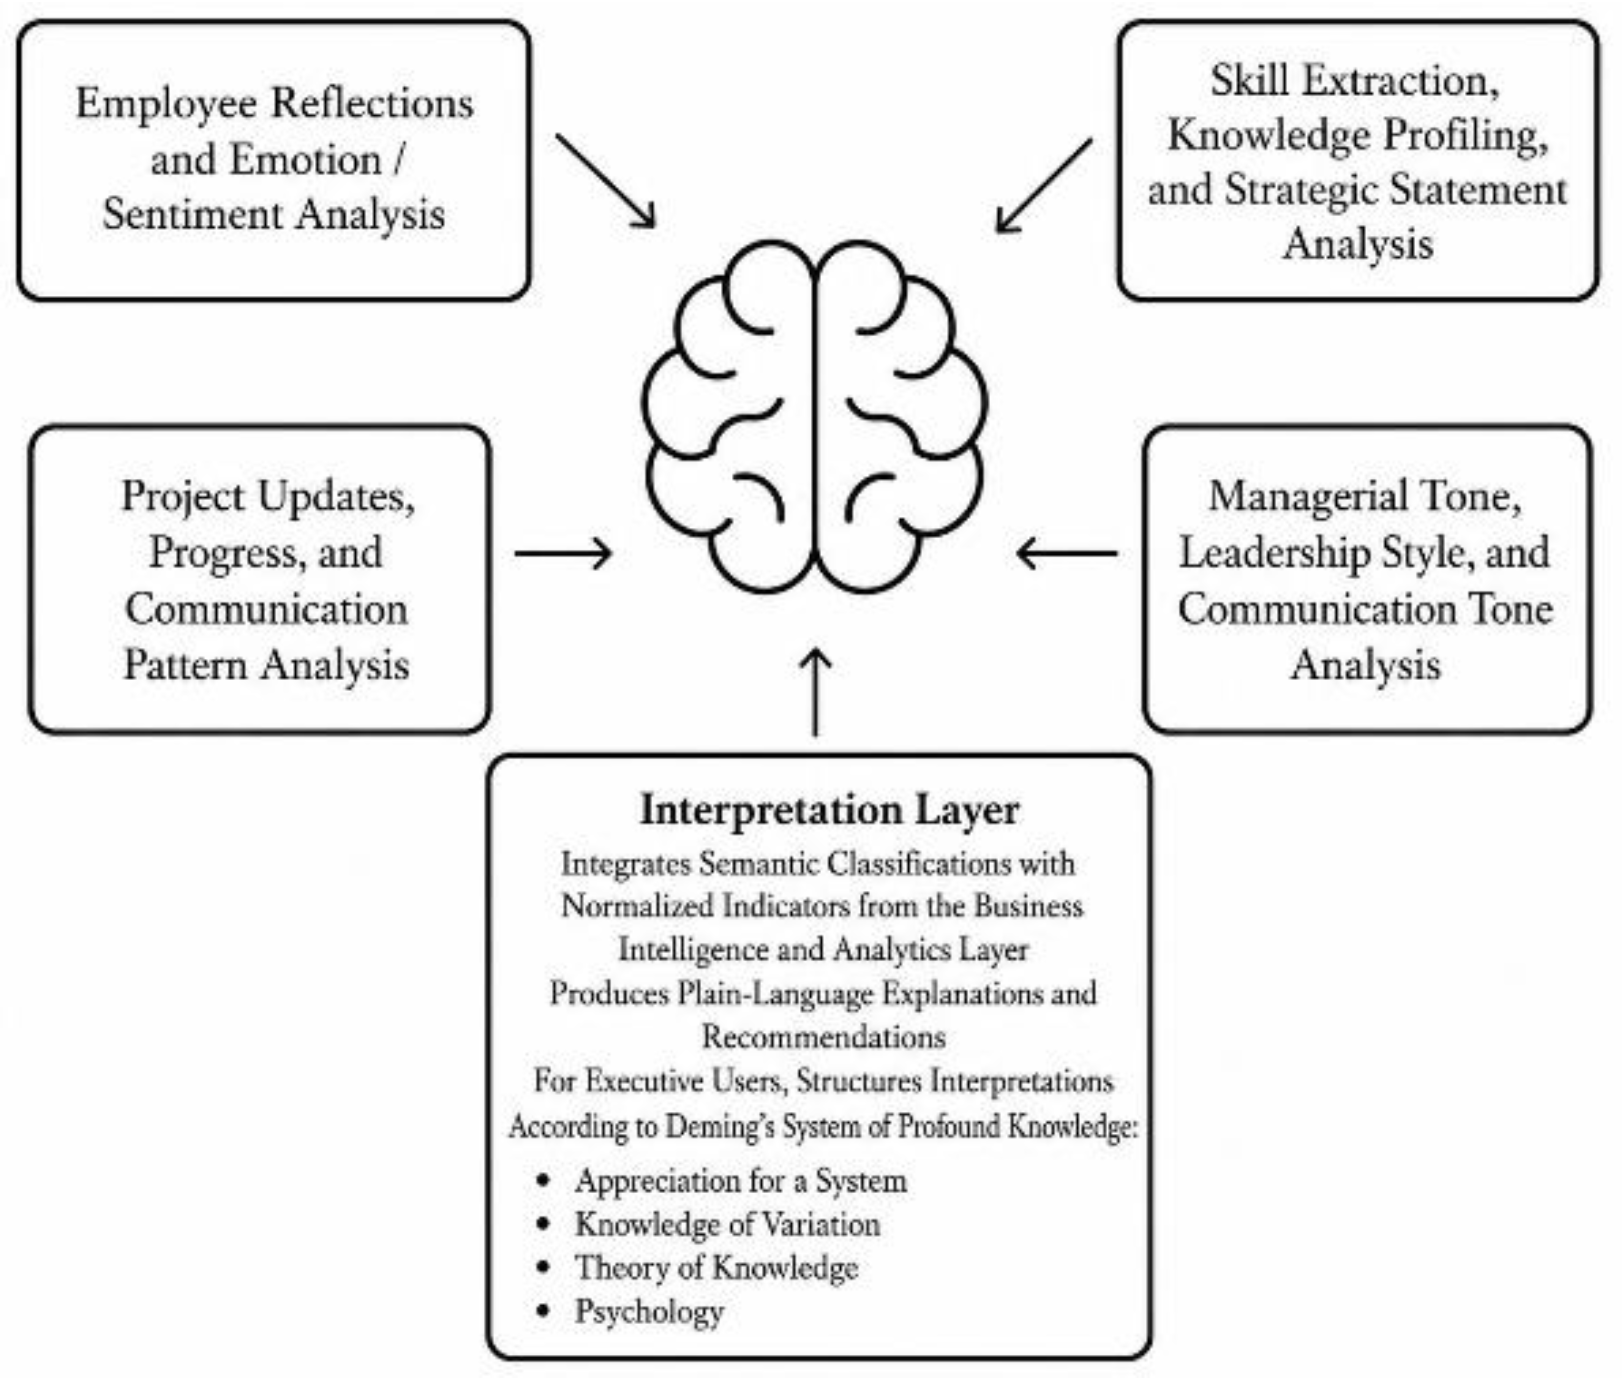
The LLM Layer performs two distinct but interconnected functions: semantic analysis and organizational interpretation.
First, it converts unstructured textual content into structured semantic signals. The processed content includes employee reflections, project reports, managerial responses, assessment narratives, uploaded CVs, and executive statements. Depending on the input, the LLM extracts emotional tone, competencies, communication characteristics, leadership orientation, conflict expression, project context, or strategic orientation. The analysis is conducted through constrained prompts, predefined classification categories, and structured output formats. The LLM is therefore used as a semantic classification mechanism rather than as an autonomous organizational decision-maker.
Second, the internal Interpretation Layer synthesizes semantic signals with the normalized indicators generated by the Business Intelligence and Analytics Layer. This separation distinguishes the extraction of meaning from organizational text from the subsequent interpretation of that meaning within a wider analytical and organizational context.
The Interpretation Layer generates outputs appropriate to the scope of each role. Employees receive individual summaries concerning their own project activity, reporting, or skills. Managers receive department-level explanations. CEOs receive organization-wide interpretations structured according to Deming’s System of Profound Knowledge.
The McKinsey 7S Framework and Deming’s System of Profound Knowledge serve different purposes within this architecture. McKinsey 7S is used by the Business Intelligence and Analytics Layer to organize and map the calculated indicators, whereas Deming’s framework structures the interpretation of organization-wide evidence for executive users.
The LLM and Interpretation Layer do not produce organizational diagnoses, mandatory interventions, or automatic managerial decisions. Its outputs are intended to support human sensemaking by connecting textual organizational context, quantitative evidence, and management theory.
3.5. Gamification Layer
The Gamification Layer encourages participation in organizational reporting, assessment, project, and feedback activities. It connects experience points and recognition mechanisms to activities that contribute data to the organizational feedback cycle. Users receive experience points for completing reflection reports, organizational assessments, project updates, goal reports, and managerial feedback activities. Missed or incomplete required activities affect progression according to the rules configured within the platform.
Accumulated experience points determine progression through recognition tiers such as Bronze, Silver, Sapphire, and Diamond. These tiers provide visible indications of participation and progression, as illustrated in Figure 8. Aggregated participation information is presented to managers and CEOs as part of the analytical framework described in Section 3.6. Gamification indicators are not intended to function as formal measures of employee performance or as substitutes for managerial judgment.
Figure 7.
LLM Layer of IntellicaHR.
By integrating recognition mechanisms into existing organizational workflows, the Gamification Layer seeks to reinforce continued involvement in reporting, reflection, assessment, feedback, and project activities.
Figure 8.
The Gamification Layer of IntellicaHR: Badge Hierarchy for Behavioral Reinforcement.

3.6. Business Intelligence and Analytics Layer: Organizational Performance Metrics
The Business Intelligence and Analytics Layer calculates, normalizes, aggregates, and organizes the indicators generated through employee, managerial, project, assessment, and executive activity. It provides a common analytical framework for the Employee, Manager, and CEO Layers, with each role receiving access to indicators appropriate to its organizational scope.
The calculated indicators are mapped to the seven dimensions of the McKinsey 7S Framework—Strategy, Structure, Systems, Skills, Staff, Style, and Shared Values. This mapping enables heterogeneous organizational signals to be organized into a coherent model of organizational alignment and performance. The selection and interpretation of the indicators are supported by empirical studies concerning digital transformation, organizational alignment, workforce capability, leadership, communication, and performance barriers [6,9,31,33].
Table 1 presents the relationship between the IntellicaHR indicators, the corresponding McKinsey 7S dimensions, and the organizational barriers or conditions that they are intended to represent.
Metrics are derived from employee, manager, and CEO interactions stored in IntellicaHR and are normalized to the 0–1 range to allow comparison across heterogeneous organizational signals. Table 2 summarizes each metric by presenting its description, computation method, interpretation, and scale. Some metrics are computed directly from system events, such as submitted reports, assessments, project deadlines, and manager responses, while others are derived from structured ratings or classified textual inputs. For text-based indicators, such as Daily Emotions, Managerial Style, and CEO Strategic Style, predefined categorical scales are used to convert qualitative communication patterns into interpretable numerical values. These categories do not function as diagnostic labels; rather, they provide operational encodings that allow human-centered organizational data to be analyzed consistently within the IntellicaHR framework.
Leveraging these scales, the platform uses Large Language Models (LLMs) to map free-text inputs into predefined categorical scales through instruction-based prompting. Prompts define category boundaries and constrain outputs, enabling the LLM to function as a semantic classifier rather than a generative system. This approach supports interpretability and reproducibility; prompts are therefore presented illustratively rather than exhaustively. A representative prompt example is:
“Given the following employee reflection, classify the overall emotional valence expressed using one of the following categories only: Very Negative (0), Negative (1), Neutral (2), Positive (3), Very Positive (4). Use the category definitions provided. Return only the numerical value and a brief justification (maximum 20 words).”
Furthermore, these metrics support LLM explainability by being explicitly provided to the model together with their normalized values and semantic definitions, enabling the LLM to generate theory-grounded interpretive insights mapped to Deming’s System of Profound Knowledge. A representative prompt example is:
“You are provided with organizational performance metrics, each normalized to the 0–1 range and accompanied by a brief description of its meaning. Analyze the metric values below and generate concise interpretive insights mapped explicitly to Deming’s System of Profound Knowledge (Appreciation for a System, Knowledge of Variation, Theory of Knowledge, Psychology). For each Deming dimension, provide one short insight (maximum 30 words) grounded strictly in the provided metrics. Avoid speculative or prescriptive language. Metrics:– Skill Gap: 0.10 (lower values, better performance, degree of unmet required skills)– Skill Adequacy: 0.85 (alignment between skills and role requirements)– Manager–Employee Conflict: 0.05 (lower values, better performance, frequency of reported misalignment or tension) …”
Similar prompts are used across all insight-generation tasks, differing only in the metric subsets and the target theoretical framework.
The numerical encodings and cut-off rules in Table 2 are defined in this study as transparent operational choices for converting heterogeneous IntellicaHR data into comparable 0–1 indicators. The need to retain tunable rather than universally fixed parameterizations is also consistent with the broader performance-management tension between standardization and contextual adaptation [75].
For Skill Gap, employee proficiency is encoded through an ordinal scale from very low = 0 to very high = 5, informed by structured expert-rated skill-assessment approaches showing that proficiency can be represented through standardized rating rubrics and observable performance levels [26].
For Daily Emotions, employee reflection text is mapped to a five-level valence scale from very negative = 0 to very positive = 4, informed by research distinguishing negative, neutral, and positive emotional valence in language processing [48].
For Managerial Style, the weights assigned to empowering = 1.00, supportive = 0.85, transactional = 0.65, directive = 0.40, and autocratic = 0.20 reflect an ordered interpretation of leadership behaviors, where more empowering and supportive styles are treated as more development-oriented than directive or autocratic styles, consistent with leadership-style distinctions and their links to satisfaction, teamwork, commitment, innovation, and performance [53].
Similarly, CEO Strategic Style weights, including visionary = 1.00, innovative = 0.95, adaptive = 0.90, people-centric = 0.85, operational = 0.60, and metric-driven = 0.60, are used to encode strategic leadership orientations, informed by leadership research emphasizing vision, adaptation, people orientation, feedback seeking, and corrective-learning behavior as relevant to organizational performance and team potency [17,83,84].
The Reflection Frequency and Assessment Frequency functions also follow this operational logic: shorter CEO-defined intervals receive higher normalized values because they indicate more frequent feedback, reflection, monitoring, and review cycles, whereas longer intervals indicate lower monitoring intensity and greater delegated autonomy. This design is consistent with feedback and reflection research showing that feedback is more useful when structured, task-relevant, and connected to learning [18,38,61], as well as governance and leadership research emphasizing monitoring proximity, adaptability, and autonomy [4,85].
Therefore, the exact values and thresholds are not claimed as universal standards; they are theoretically informed, interpretable, and tunable encodings that support normalization and comparison.
4. Proof-of-Concept Demonstration Using Literature-Grounded Synthetic Organizational Scenarios
Evaluating IntellicaHR with real organizational data is not feasible at this stage because the system processes highly sensitive workplace information, including leadership behavior, emotional climate, conflict indicators, skill alignment, and managerial responsiveness. Such data are difficult to obtain ethically and legally under workplace privacy requirements and GDPR [16,22,36,49]. Therefore, this study adopts a proof-of-concept demonstration strategy, which is appropriate for early-stage socio-technical artifacts where direct field deployment is premature or impractical. As argued by Nunamaker et al. [54], demonstration-based evaluation can provide a rigorous way to examine whether an artifact is capable of addressing its intended problem within a controlled setting.
Accordingly, IntellicaHR is evaluated through synthetic but literature-grounded organizational scenarios. The purpose of this evaluation is not to establish real-world effectiveness, predictive validity, or organizational impact. Instead, the objective is to observe whether the implemented platform can process, structure, visualize, and interpret controlled organizational conditions that reflect patterns documented in prior research. This approach is consistent with Scenario-Based Evaluation, where scenarios are not treated as simple examples but as structured operational contexts for assessing the fitness of a system for its intended purpose [45]. Prior research also supports the use of synthetic, scenario-driven data when real organizational datasets are inaccessible, provided that the scenarios are grounded in established patterns and allow systematic comparison across conditions [37,50]. Recent methodological work further emphasizes that synthetic evaluations should balance fidelity, diversity, and generalizability, which informed the design of the IntellicaHR simulations [77].
The demonstration follows a theory-grounded synthetic simulation strategy. First, organizational archetypes are identified from the literature. Second, the recurring behavioral and organizational patterns associated with these archetypes are translated into pattern constraints. Third, these constraints are formalized through fuzzy IF–THEN rules and normalized membership functions. Fourth, the resulting fuzzy-derived values guide the generation of synthetic users, events, reports, feedback, and LLM-mediated textual interactions. Finally, the generated interactions are inserted into the operational IntellicaHR platform, where the system’s native processing pipeline produces the resulting metrics, dashboards, and interpretive outputs. Figure 9 summarizes this process.
The evaluation therefore observes how IntellicaHR behaves under controlled and theoretically meaningful conditions. It does not claim that the system can diagnose real organizations, replace expert judgment, or predict organizational outcomes in practice. Rather, it examines whether the platform produces coherent and distinguishable outputs when exposed to archetypal organizational conditions.
4.1. Organization Archetypes
Organizational archetypes are commonly used as simplified, theory-informed representations of recurring organizational configurations. Rather than attempting to reproduce every possible organizational variation, archetypes capture recognizable patterns of structure, behavior, values, systems, and interpretive logic, allowing complex organizational conditions to be examined in a controlled and interpretable way [12]. In this proof-of-concept demonstration, three literature-grounded archetypes were selected:
- Healthy Organization
- Skill-Misaligned Organization
- Toxic Management Environment
These archetypes were selected because they represent three analytically distinct organizational states relevant to IntellicaHR: effective organizational functioning, capability-related misalignment, and leadership-driven dysfunction. The Healthy Organization serves as the positive reference condition and is consistent with research on organizational success and self-perpetuation, where long-term viability depends on renewal, integration, systematic problem solving, organizational integrity, and qualified human resources [23]. This is also supported by prior research showing that health-oriented leadership and cohesive organizational practices foster trust, engagement, and emotional stability [17,65], while organizational health climate reinforces these effects at the structural level [79].
The Skill-Misaligned Organization represents a capability-based dysfunction in which employee skills, role requirements, project needs, and organizational objectives are insufficiently aligned. Prior empirical studies describe skill gaps as systemic mismatches that constrain innovation, coordination, and operational performance [60], while perceptual misalignment between managerial expectations and employee capabilities can further amplify inefficiencies [40]. Evidence from Industry 4.0 contexts also links inadequate skill alignment to measurable economic and productivity losses [46].
The Toxic Management Environment represents a leadership- and climate-based dysfunction in which managerial behavior negatively affects employee emotions, trust, communication, and performance. Prior research links toxic leadership to emotional exhaustion, workplace deviance, and burnout-driven performance decline [2]. The toxic-triangle perspective further conceptualizes toxicity as an interaction among destructive leaders, susceptible followers, and enabling organizational contexts, rather than as an isolated managerial trait [29].
4.2. Literature-Grounded Pattern-Constrained Synthetic Generation Using Fuzzy Logic
After defining the archetypes, the next step was to translate their theoretical characteristics into operational generation rules. Fuzzy logic was used because organizational behavior is rarely binary and usually varies gradually rather than existing only as present or absent. Fuzzy logic provides a suitable mechanism for representing such uncertainty through linguistic terms, such as LOW and HIGH, instead of rigid numerical thresholds [10,11]. Each linguistic term is represented by a membership function, which maps a normalized input value to a degree of membership between 0 and 1 [10,11]. In this study, fuzzy logic is not used to diagnose real organizations or infer causal relationships. Instead, fuzzy IF–THEN rules act as generation constraints. Scenario-consistent input values are sampled according to the corresponding membership functions and evaluated through the fuzzy rules. The resulting fuzzy outputs are then defuzzified, converting the aggregated fuzzy output into a single crisp value that serves as the behavioral or semantic generation control for synthetic interaction generation [10,11]. Together, these mechanisms translate literature-grounded organizational patterns into controlled behavioral and semantic tendencies that guide the creation of synthetic organizational interactions. The pattern constraints summarized in Table 3 formalize these relationships. Each constraint connects one or more organizational conditions to expected metric-level behaviors.
4.3. Healthy Organization Scenario
The Healthy Organization scenario represents the baseline condition of the proof-of-concept demonstration. It models an environment characterized by supportive leadership, constructive communication, psychological safety, high participation, and resilient employee well-being.
A virtual IT services organization, named “HeliosTech Solutions,” is used to instantiate this scenario. It consists of 20 synthetic users generated by Algorithm 1 and is structured into two departments: Development, with 10 employees and one manager, and Support, with 8 employees and one manager. Across both departments, the organization demonstrates strong skill adequacy, high compliance, positive employee sentiment, effective collaboration, and minimal interpersonal or interdepartmental conflict.
4.4. Skill-Misaligned Organization Scenario
The Skill-Misaligned Organization scenario represents a structural mismatch between workforce capabilities and organizational needs. Unlike the Toxic Management Environment, the central issue in this scenario is not hostile leadership or severe emotional deterioration, but the incomplete alignment between employee skills, project requirements, managerial expectations, and organizational goals.
A virtual retail company named “AegeanRetail Group,” is used to instantiate this scenario. It consists of 19 synthetic users generated by Algorithm 1 and includes two departments: Sales, with 9 employees and one manager, and Logistics, with 8 employees and one manager. The Logistics department is characterized by limited training in digital tools, recurrent project delays, workflow inefficiencies, and a mismatch between managerial perceptions and employees’ actual competence. This scenario therefore highlights how insufficient technical capability and perceptual discrepancies can affect organizational coordination and delivery.
4.5. Toxic Management Environment Scenario
The Toxic Management Environment scenario represents a leadership- and climate-related dysfunction. In this scenario, synthetic interactions are conditioned toward lower emotional tone, reduced openness, increased frustration, and weaker participation. Managerial communication is more likely to be directive, unsupportive, or conflictual, while employee reflections and assessments are more likely to show disengagement or negative sentiment.
A virtual professional services organization, named “Olympus Consulting,” is used to instantiate this scenario. It consists of 27 synthetic users generated by Algorithm 1 and includes three departments: Strategy, with 8 employees and one manager; Operations, with 9 employees and one manager; and Finance, with 7 employees and one manager. The Operations department exhibits the strongest dysfunction, with persistent manager–employee conflict, reduced compliance, declining trust, and lower cooperation. This deterioration primarily affects the “Human” subsystem that supports collaboration and organizational performance.
4.6. Data Generation Approach
Having defined the three scenarios, the next step was to instantiate them inside IntellicaHR. Rather than creating static datasets externally, this study uses a system-in-the-loop synthetic simulation. This means that synthetic users and interactions are inserted into the operational IntellicaHR platform, and the resulting metrics are produced by the system’s own processing pipeline.
Using Algorithm 1, 20 synthetic users were generated for the Healthy Organization scenario, 19 for the Skill-Misaligned Organization scenario, and 27 for the Toxic Management Environment scenario. Each simulation was executed over a 45-day period, allowing the platform to process repeated organizational interactions such as scheduled reflections, assessment submissions, project updates, manager feedback, and evolving communication patterns. This longitudinal setup enables IntellicaHR to compute time-dependent indicators, including report compliance, response frequency, project timeliness, assessment compliance, emotional climate, and manager–employee perception gaps.
4.6.1. Scenario-Level Target Linguistic States
To ensure scenario-consistent synthetic generation, the pattern constraints defined in Table 3 are translated into target linguistic states for each behavioral and semantic variable. Rather than representing empirical organizational measurements, these linguistic states act as generation constraints that control the expected tendencies of the simulated organization.
Each explicitly constrained variable is assigned either a LOW or HIGH target state according to the intended organizational scenario. Variables marked as Unconstrained remain part of the generated scenario but are not directed toward either fuzzy state. Instead, their values are generated from the role, event, temporal, and interaction context without an explicit scenario-level membership target. This distinction prevents non-defining variables from being artificially forced toward a medium or neutral condition. Intermediate behavior remains possible for explicitly constrained variables because the LOW and HIGH membership functions overlap.
Table 4 summarizes the target linguistic states assigned to the behavioral and semantic variables across the three organizational scenarios. HIGH and LOW indicate the target linguistic state assigned to each variable for scenario-conditioned synthetic generation. Unconstrained indicates that no explicit scenario-level target state was assigned to that variable; it does not imply that the variable was absent from the generated scenario.
4.6.2. Design of Fuzzy Membership Functions
The scenario-level linguistic states are operationalized through overlapping LOW and HIGH fuzzy membership functions defined over the normalized domain [0,1]. Each linguistic state is represented by a membership function that assigns a degree of membership between 0 and 1 to every normalized value.
The overlap between the LOW and HIGH functions allows transitional values to belong partially to both states, avoiding abrupt boundaries while preserving the intended scenario characteristics. Consequently, values located near the intersection remain possible without introducing an additional MEDIUM linguistic state.
Figure 10 illustrates representative LOW and HIGH membership functions used throughout the proof-of-concept. These functions serve exclusively as generation constraints for synthetic organizational interactions and should not be interpreted as empirical organizational measurements.
4.6.3. Interpretation of Normalized Fuzzy Values
The normalized fuzzy values produced by the membership functions were interpreted as generative control values. Each value expresses the degree to which a simulated organizational variable belongs to its target linguistic state.
For behavioral variables, such as daily reports, reflections, assessments, project updates, goal reports, and manager responses, the normalized value was interpreted as a behavioral propensity . In this role, represented the probability or expected frequency of the corresponding event across eligible opportunities in the 45-day simulation. For example, a reflection tendency of corresponds approximately to expected reflection submissions before stochastic variation. Similarly, a manager-response likelihood of indicates that approximately 30% of eligible employee updates are expected to receive a response.
For semantic variables, such as emotional tone, communication tone, conflict expression, managerial support, perceived progress, and skill-alignment confidence, the normalized value was interpreted as a semantic conditioning value . In this role, was not used as a percentage of days or event occurrences. Instead, it was passed to the LLM after an event had already been triggered, guiding the tone, supportiveness, conflict intensity, confidence, and scenario consistency of the generated text.
Behavioral fuzzy values determine whether eligible events occur, while semantic fuzzy values condition how the generated textual artifacts are expressed. Table 5 presents these operational interpretations of normalized fuzzy-derived values.
The direction of depends on the semantic variable being conditioned. For positively oriented variables, such as supportiveness or emotional positivity, higher values produce stronger positive expression; for negatively oriented variables, such as conflict expression, higher values produce stronger tension or disagreement.
4.6.4. Membership-Weighted Sampling of Linguistic States
After selecting the target linguistic state for a variable, a normalized input value is sampled according to the corresponding membership function rather than uniformly over the entire domain. Consequently, values with stronger membership in the selected linguistic state have a higher probability of being sampled, while values located within the overlapping region remain possible. Let and denote the normalized probability densities derived from the LOW and HIGH membership functions, respectively. Sampling is performed as:
The sampled value is evaluated through the applicable fuzzy IF–THEN rules and subsequently defuzzified using the centroid method. The resulting crisp value serves either as a behavioral propensity , determining whether a synthetic organizational event occurs, or as a semantic conditioning value , controlling the tone and intensity of LLM-generated organizational interactions.
This procedure produces stochastic but scenario-consistent synthetic organizational behavior while preserving the gradual uncertainty represented by the fuzzy membership functions.
4.6.5. LLM-Conditioned Interaction Generation
The behavioral and semantic control values generated by the fuzzy inference process guide the creation of synthetic organizational interactions through role-specific LLM prompts. Each prompt receives structured contextual information describing the organizational scenario, user role, temporal context, and the corresponding fuzzy control values. The LLM then generates synthetic organizational artifacts whose behavioral tendencies remain consistent with the selected organizational archetype. Table 6 summarizes the role-specific artifacts generated for CEOs, Managers, and Employees.
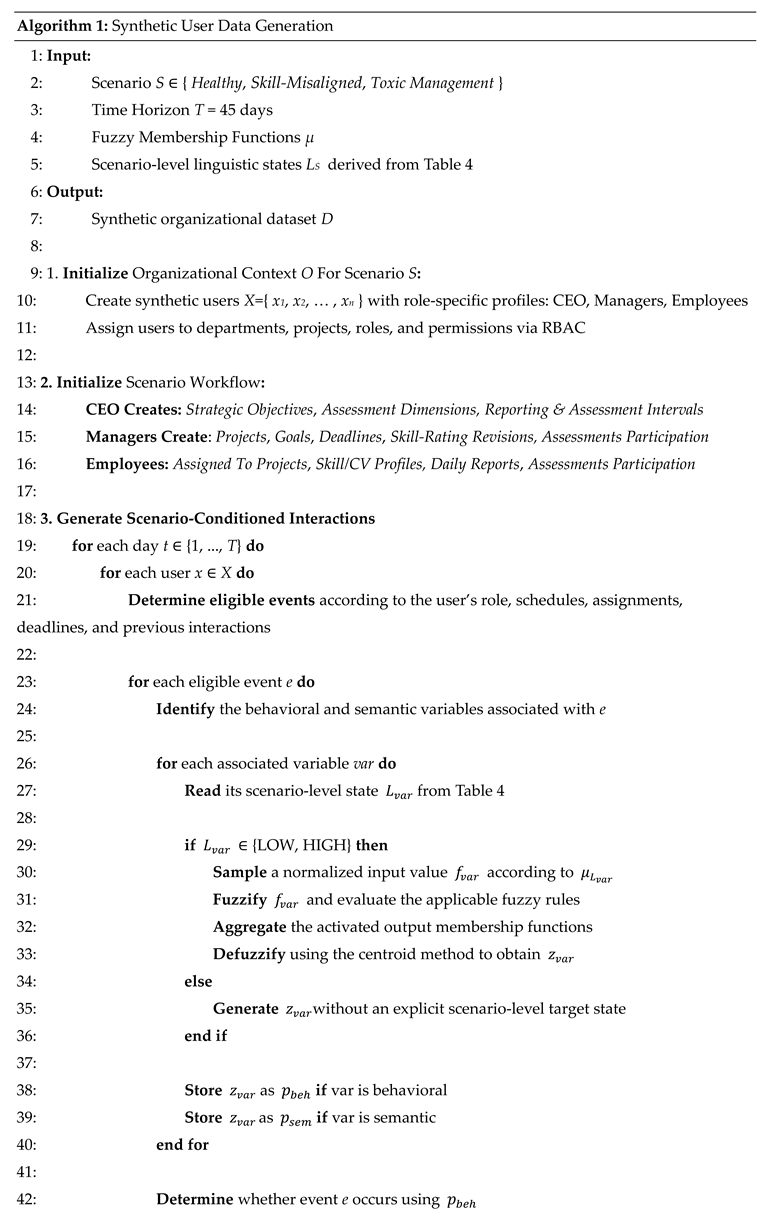
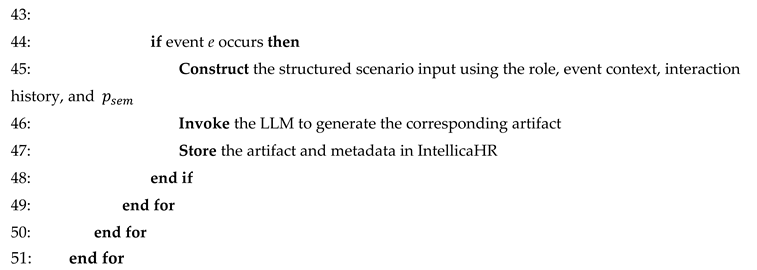
In Algorithm 1, behavioral propensity , controls whether an eligible event occurs, while semantic conditioning value , guides the tone, intensity, and scenario consistency of input passed to the LLM. The structured scenario input includes the organizational scenario, user role, event type, temporal context, project or goal context, previous interaction history, and semantic fuzzy controls. After generation, each artifact is stored in IntellicaHR and processed through the platform’s native metric-computation, dashboard-generation, 7S-mapping, and LLM-Interpretation Layers.
5. Proof-of-Concept Results and System Behavior
This section presents the outputs produced by IntellicaHR after the three literature-grounded synthetic organizational scenarios were executed through the operational system. The results should be interpreted as proof-of-concept evidence of system behavior under controlled scenario conditions, rather than as validation using real organizational data. As described in the previous section, the synthetic users, events, reports, assessments, project updates, managerial feedback, and LLM-conditioned textual interactions were generated through Algorithm 1 and inserted into the IntellicaHR environment. The resulting organizational indicators were then computed by the platform’s native analytic pipeline, rather than through external post-processing.
Accordingly, the results are presented in three stages. First, the aggregated organizational performance metrics extracted by IntellicaHR are reported for each simulated virtual organization. Second, these values are visualized as scenario-level metric profiles to show how the three organizational conditions differ across the same normalized indicators. Third, the observed metric outputs are compared with the expected directions of the fuzzy rules and linguistic states defined during scenario construction. This structure allows the evaluation to show not only what values were produced by IntellicaHR, but also whether these values are coherent with the intended synthetic-generation logic.
5.1. Aggregated IntellicaHR Metrics Across the Three Simulated Virtual Organizations
Table 7 presents the aggregated organizational performance metrics extracted directly by the IntellicaHR analytics system after processing the scenario-specific interactions generated for each simulated virtual organization. The reported indicators correspond to the organizational performance metrics defined in Table 2, including skill-related, emotional, leadership, compliance, feedback, and project-execution measures. Figure 11 visualizes the same normalized metrics to facilitate comparison across the three organizational scenarios. Asterisks denote reverse-oriented metrics, where lower values indicate better organizational performance.
The aggregated metrics reveal three clearly distinguishable organizational profiles that are consistent with the intended scenario characteristics. The Healthy Organization exhibits the strongest overall performance, combining high Skill Adequacy, Assessment Frequency, Reflection Frequency, Organizational Structure Coverage, Project Timeliness, Daily Report Compliance, Goal Reporting, Manager Responses, Assessment Compliance, CEO Strategic Style, and Managerial Style with low values for the reverse-oriented indicators Skill Gap, Misaligned Skills, and Manager–Employee Conflict. Together, these results represent a stable organizational environment characterized by effective leadership, active participation, strong execution, and limited organizational conflict.
The Skill-Misaligned Organization displays a different pattern in which the primary deterioration occurs in capability- and execution-related indicators. Higher Skill Gap and Misaligned Skills, together with lower Skill Adequacy, Project Timeliness, and Goal Reporting, indicate reduced alignment between workforce capabilities and organizational demands. In contrast, socio-emotional and leadership indicators, including Daily Emotions, Manager–Employee Conflict, Manager Responses, and Managerial Style, remain comparatively stable. This demonstrates that IntellicaHR distinguishes capability misalignment from broader organizational dysfunction rather than uniformly degrading all performance dimensions.
The Toxic Management Environment exhibits the strongest deterioration in socio-emotional and leadership-related indicators. The highest Manager–Employee Conflict, together with the lowest Daily Emotions, Reflection Frequency, Manager Responses, Goal Reporting, and Managerial Style, reflects the scenario’s emphasis on destructive leadership, declining emotional climate, and reduced managerial engagement. Although several structural and skill-related indicators remain at moderate levels, the overall profile is dominated by relational and behavioral deterioration rather than capability deficiencies.
Taken together, the numerical values in Table 7 and the comparative visualization in Figure 11 provide descriptive proof-of-concept evidence that IntellicaHR produces different metric profiles across the three controlled scenarios rather than a uniform response across all indicators. Each simulated organization is characterized by a different combination of capability, participation, emotional, leadership, and execution indicators, supporting the proof-of-concept objective that the platform can distinguish different forms of organizational functioning through its integrated analytics pipeline.
5.2. Expected–Observed Alignment with Fuzzy Scenario Logic
Because the scenarios were generated using fuzzy linguistic states and pattern constraints, the extracted metric values were further compared with the expected directional behavior defined during scenario construction. Figure 12 presents this expected–observed alignment for selected representative metrics. The figure does not constitute statistical validation, nor does it demonstrate real-world diagnostic accuracy. Instead, it provides proof of concept that the fuzzy-rule-based generation process and the IntellicaHR analytic pipeline produced outputs that are consistent with the intended scenario logic.
The expected–observed alignment matrix compares the expected linguistic state of each metric with the normalized aggregated values extracted by IntellicaHR. Green cells indicate strong alignment, yellow cells indicate partial alignment, and red cells indicate weak alignment. The expected states are derived from the fuzzy pathway logic used to define the synthetic scenarios, whereas the observed values represent the aggregated outputs produced by IntellicaHR after processing the generated users and interactions. Reverse-oriented metrics, marked with an asterisk, are interpreted inversely, meaning that lower values indicate more favorable organizational conditions.
The Healthy Organization scenario shows strong alignment across all evaluated metrics. Skill Gap, Misaligned Skills, and Manager–Employee Conflict remain low, while Skill Adequacy, Assessment Frequency, Reflection Frequency, Organizational Structure Coverage, Project Timeliness, Daily Emotions, Daily Report Compliance, Goal Reporting, Manager Responses, Assessment Compliance, CEO Strategic Style, and Managerial Style remain high. This indicates that the generated baseline scenario produced a metric profile broadly consistent with the intended Healthy Organization condition when processed through IntellicaHR.
The Skill-Misaligned Organization scenario demonstrates a mixed but interpretable alignment pattern. Skill Gap and Skill Adequacy show partial alignment with the expected capability-misalignment logic, while Misaligned Skills shows weak alignment because the observed value does not reach the expected high state. However, the remaining operational, compliance, leadership, and emotional indicators largely align with their expected moderate or high states. This pattern is consistent with the intended distinction between the Skill-Misaligned Organization and the Toxic Management Environment: the scenario reflects capability-related strain without implying a complete breakdown of leadership behavior, reporting activity, or emotional climate.
The Toxic Management Environment scenario aligns most clearly with the expected deterioration in leadership and emotional conditions. Daily Emotions and Managerial Style strongly match the expected low states, while Manager–Employee Conflict and Manager Responses show partial alignment with the expected high-conflict and low-responsiveness pattern. Reflection Frequency also shows partial alignment, indicating a decline that remains moderate rather than fully collapsed. Other metrics, such as Skill Gap, Skill Adequacy, Misaligned Skills, Organizational Structure Coverage, Daily Report Compliance, Goal Reporting, Assessment Compliance, and CEO Strategic Style, remain within their expected low, medium, or high linguistic ranges. This pattern reflects the intended design of the scenario, where toxicity primarily affects relational, emotional, and managerial interaction signals rather than uniformly degrading all organizational dimensions.
5.3. IntellicaHR Dashboard Behavior Across Scenarios
To complement the metric-level analysis, this subsection presents representative IntellicaHR dashboard outputs, showing how the extracted scenario-specific patterns are visualized and interpreted through the platform’s native analytic environment. The dashboard values presented in this subsection represent specific departments or dashboard-level composite indicators and should not be interpreted as direct equivalents of the organization-level metrics. Table 7 contains aggregated values calculated across each simulated organization, whereas the managerial dashboards present department-specific results. Consequently, differences between departmental dashboard percentages and the corresponding organization-level metric values reflect different levels of aggregation rather than inconsistent computation.
5.3.1. Healthy Organization Dashboard Outputs
5.3.1.1. Manager Department-Health Dashboard - Virtual IT Services
Figure 13 illustrates that the Health Department Dashboard reports a health score of 81.9 (“Good”), with strong skill alignment (4.2/5), high compliance (daily reports at 93%, assessments at 91%), and high emotional well-being. With 70% of projects completed on time, the department qualifies as “Consistent Achiever,” indicating effective leadership and stable operational performance.
5.3.1.2. CEO Organization-Health Dashboard - Virtual IT Services
As illustrated in Figure 14, the CEO Dashboard summarizes organizational health at 87%, with firm structure (92%), shared values (92%), and leadership (90%). High ratings in skills and strategy (89%) confirm workforce readiness. Systems (74%) appear improvable, yet the overall profile reflects a cohesive organization with strategic clarity and healthy alignment.
5.3.1.3. CEO Organizational Insights Dashboard - Virtual IT Services
Deming-based insights in Figure 15 indicate a strong emotional climate, high engagement, and effective managerial systems, while skill refinement and feedback processes represent opportunities for targeted improvement. Recommendations emphasize continuous training, structured reflection, and communication enhancement.
5.3.2. Skill-Misaligned Organization Dashboard Outputs
5.3.2.1. Manager Department-Health Dashboard - Virtual Retail Company
The Health of Department Dashboard for the Logistics Department, shown in Figure 16, indicates, an overall departmental health of moderate (60.5), with strong reporting compliance and favorable emotional climate, but low skill adequacy (2.6/5) and high delay rate (41%). The department ranks as a “Reliable Contributor,” with stable but underdeveloped performance that requires targeted upskilling and support for project execution.
5.3.2.2. CEO Organization-Health Dashboard - Virtual Retail Company
The CEO Dashboard for the Virtual Retail Company shows an overall organizational health score of 76%, as illustrated in Figure 17. Strong shared values (82%), structure (77%), and staff morale (76%) coexist with weaker strategy (68%) and systems (57%). Employee skill alignment (52%) confirms skill-capability gaps. Priority areas include digital competence and operational alignment.
5.3.2.3. CEO Organizational Insights Dashboard - Virtual Retail Company
The system identifies a skill gap, limited cross-functional awareness, inconsistent performance standards, missed learning opportunities, and a passive managerial culture as illustrated in Figure 18. Recommended actions include interdepartmental workshops, standardized skill assessments, structured reflection sessions, and conflict-resolution training. Overall, it highlights key organizational weaknesses and targeted, high-impact interventions to improve the organization.
5.3.3. Toxic Management Scenario: A Virtual Professional Services Organization
5.3.3.1. Manager Department-Health Dashboard - Virtual Professional Services
The Operations Department shows an overall health score of 53.3/100, with low morale, weak skill alignment (3.2/5), and poor compliance (70% reporting, 68% assessments). Project data indicate major workflow issues: 57% delayed, 29% on time, 14% just-in-time, across four active projects and 35 engagement points. The dashboard of Figure 19 highlights low timeliness, limited oversight, and weak engagement, signaling the need for more transparent communication, targeted support, and tighter project monitoring.
5.3.3.2. CEO Organization-Health Dashboard - Virtual Professional Services
As illustrated in Figure 20, the Organization shows an overall score of 64%, with stronger skills and structure (72%) but weaker systems (57%), strategy (60%), and leadership style (51%). Morale (67%) and shared values (68%) are moderate, suggesting room for improvement in engagement and communication. Overall, the data depict a structurally functional but relationally and managerially impaired organization requiring stronger strategic coordination, more consistent leadership, and improved cross-departmental communication.
5.3.3.3. CEO Organizational Insights Dashboard - Virtual Professional Services
The system identifies misalignment, as illustrated in Figure 21, between employee skills and managerial expectations, signaling the need for cross-department meetings and standardized skill assessments. Missed learning opportunities support the implementation of a knowledge-sharing platform, while low managerial effectiveness calls for targeted leadership training. Overall, the findings point to stronger system integration, a more deliberate learning culture, and improved leadership to boost communication and morale.
5.3.3.4. CEO Manager–Employee Perception-Gap Analysis - Virtual Professional Services
The Manager–Employee Conflict Diagram of Figure 22 illustrates consistent perception gaps across Financial Integrity, Process Discipline, and Collaboration Culture, with managers rating all dimensions higher than employees (manager scores ~3.0–3.6 vs. employee scores ~2.0–2.5). Employees report greater issues with transparency, process consistency, and teamwork. The pattern indicates a systematic misalignment in the experience of departmental health. The generated interpretation recommends stronger feedback channels, joint reviews, and communication-focused interventions.
6. Discussion and Contributions
6.1. Discussion
The proof-of-concept demonstration indicates that the implemented IntellicaHR platform can process controlled organizational interactions and transform them into distinguishable, multidimensional organizational profiles under theory-grounded synthetic conditions. Rather than reducing organizational functioning to a single performance score, the platform represents interactions among multiple dimensions, including workforce capability, participation, emotional climate, leadership behavior, managerial responsiveness, organizational structure, and project execution. The differentiated profiles generated across the three simulated organizations suggest that IntellicaHR can represent organizational conditions as configurations of interacting signals rather than as isolated measurements.
An important implication of the results is the distinction between different sources of organizational difficulty. The demonstration illustrates that capability-related problems and leadership-related problems produce different analytical patterns. This distinction is relevant because similar operational symptoms, such as delayed project delivery, reduced reporting activity, or weaker goal progress, may arise from different underlying organizational conditions and may therefore require different forms of managerial examination.
The Skill-Misaligned Organization was characterized primarily by elevated skill gaps, lower skill adequacy, weaker project timeliness, and reduced goal reporting, while its emotional and managerial indicators remained comparatively stable. In contrast, the Toxic Management Environment exhibited stronger deterioration in manager–employee conflict, daily emotions, reflection frequency, managerial responsiveness, and managerial style. These results suggest that the integrated metric framework can differentiate capability-related misalignment from relational and leadership-related dysfunction without uniformly reducing all organizational indicators.
The Healthy Organization exhibited the strongest combination of skill adequacy, participation, project execution, reporting compliance, managerial responsiveness, and positive emotional tone, together with low conflict and limited skill misalignment. However, the fuzzy generation approach did not require every indicator to assume an idealized maximum or minimum value. The overlapping membership functions permitted controlled variation within each organizational archetype, allowing the simulated organizations to exhibit combinations of strengths and weaknesses rather than appearing as purely ideal or uniformly dysfunctional cases.
The results also illustrate the complementary roles of the McKinsey 7S Framework and Deming’s System of Profound Knowledge within IntellicaHR. The McKinsey 7S Framework provides the organizational structure through which heterogeneous indicators are mapped to Strategy, Structure, Systems, Skills, Staff, Style, and Shared Values. Deming’s System of Profound Knowledge provides a higher-level interpretive structure that directs executive attention toward systemic interdependencies, variation, evidential limitations, and psychological conditions. The two frameworks therefore perform distinct but complementary functions: the 7S model organizes what is measured, while Deming’s SoPK structures how organization-wide patterns are interpreted.
The LLM-supported components further demonstrate how semantic organizational information can be connected to quantitative indicators. Employee reflections, managerial communication, project reports, skill descriptions, and strategic statements are not treated solely as unstructured text. Through predefined classifications and constrained prompts, they are converted into semantic signals and subsequently interpreted alongside the normalized indicators. Nevertheless, the resulting outputs should be treated as decision-support material rather than authoritative organizational judgments. Their usefulness remains dependent on data quality, prompt design, contextual interpretation, and human oversight.
Overall, the demonstration should be interpreted as evidence of functional and interpretive coherence rather than real-world diagnostic or predictive validity. The results suggest that IntellicaHR can process literature-grounded, fuzzy-conditioned synthetic interactions, calculate organizational indicators, differentiate controlled scenario profiles, and structure interpretations through established management theories. The proof of concept therefore, supports the feasibility of the proposed architecture, but it does not independently constitute evidence of organizational effectiveness in practice.
6.2. Contributions
This study makes four principal contributions. First, it introduces IntellicaHR, an implemented web-based socio-technical Organizational Intelligence System that integrates employee, managerial, and executive workflows within a continuous organizational feedback architecture. Unlike systems that treat human resource management, collaboration, business intelligence, and AI-assisted decision support as separate functions, IntellicaHR combines these capabilities within a unified environment for organizational sensing, interpretation, and human-directed action.
Second, the study operationalizes the McKinsey 7S Framework as a continuously updated organizational alignment model. Rather than applying the framework as a periodic or retrospective diagnostic instrument, IntellicaHR maps normalized indicators derived from organizational activities to Strategy, Structure, Systems, Skills, Staff, Style, and Shared Values. This enables organizational alignment to be examined as a dynamic and multidimensional process.
Third, the study proposes a theory-grounded interpretation architecture that combines quantitative organizational indicators with semantic signals extracted from employee reflections, managerial communication, project reports, assessments, and strategic statements. Within this architecture, the LLM functions as an interpretive mechanism rather than an autonomous decision-maker. Executive-level explanations are structured according to Deming’s System of Profound Knowledge, connecting organizational measurements with systemic interdependencies, variation, evidential limitations, and psychological factors.
Fourth, the study develops a transparent analytical framework for transforming heterogeneous organizational activities into normalized and interpretable indicators. The framework includes metrics related to skill adequacy, perception misalignment, emotional climate, managerial responsiveness, reporting behavior, project execution, leadership orientation, and organizational structure. These indicators provide a common analytical basis for integrating structured system events and qualitative organizational information.
The literature-grounded synthetic scenarios and fuzzy generation process support the demonstration of these contributions under controlled conditions. They provide preliminary evidence that the implemented architecture can process different organizational conditions and produce distinguishable metric profiles and theory-grounded interpretations. However, the proof-of-concept evaluation should be understood as an initial demonstration of the proposed system rather than as an independent claim of real-world validity or organizational effectiveness.
7. Limitations
This study has several limitations. First, the evaluation was conducted using literature-grounded synthetic organizational scenarios rather than real organizational data due to ethical, privacy, and accessibility constraints associated with workplace information. Consequently, the results demonstrate the functional coherence and scenario-sensitive behavior of IntellicaHR rather than its real-world diagnostic validity. Second, the fuzzy rules, linguistic states, and metric parameterizations were designed to provide a transparent proof-of-concept and may require refinement for different organizational contexts. Finally, although Large Language Models enable contextual interpretation of organizational signals, their outputs remain dependent on prompt design and the underlying model. Future work will focus on evaluating IntellicaHR in real organizational settings and examining the reliability, usability, and practical value of its AI-assisted insights.
8. Conclusion
This study presented IntellicaHR, a web-based socio-technical Organizational Intelligence System designed to support continuous organizational sensing, interpretation, and alignment monitoring. By integrating role-based organizational workflows, normalized analytics, Large Language Models, gamification, and established management theories, IntellicaHR provides a unified environment for transforming heterogeneous organizational activities and textual artifacts into structured indicators and contextual explanations.
The proposed architecture operationalizes the McKinsey 7S Framework as a continuously updated organizational alignment model. Indicators concerning strategy, structure, systems, skills, staff, style, and shared values are calculated from employee, managerial, executive, and system-level activities. Within the LLM Layer, an internal Interpretation Layer combines these normalized indicators with semantic signals extracted from organizational text. For executive users, the resulting explanations are structured according to Deming’s System of Profound Knowledge, connecting organizational measurements with systemic relationships, variation, evidential limitations, and psychological conditions.
The implemented platform was demonstrated through three literature-grounded synthetic organizational scenarios representing a Healthy Organization, a Skill-Misaligned Organization, and a Toxic Management Environment. The generated interactions were processed through the native IntellicaHR pipeline and produced distinguishable patterns across capability, participation, emotional, leadership, responsiveness, and execution indicators. The Healthy Organization exhibited comparatively strong participation, skill adequacy, project execution, managerial responsiveness, and emotional tone. The Skill-Misaligned Organization primarily exhibited capability- and execution-related deficiencies, whereas the Toxic Management Environment displayed stronger relational, emotional, and leadership-related deterioration.
These results provide preliminary evidence that the implemented architecture behaves consistently with its controlled scenario definitions and can represent organizational conditions as multidimensional configurations rather than isolated performance values. Nevertheless, the demonstration does not establish real-world diagnostic accuracy, predictive validity, causal relationships, or organizational effectiveness. Such claims require longitudinal deployment, human-participant evaluation, comparison with alternative systems, and validation using real organizational contexts.
Overall, this work demonstrates how established management theory, business intelligence, fuzzy modeling, gamification, and Large Language Models can be integrated within a single socio-technical Organizational Intelligence framework. Rather than proposing an autonomous AI system for organizational diagnosis, IntellicaHR contributes an architecture for continuous organizational sensing, theory-grounded interpretation, and human-centered sensemaking. The study therefore establishes a foundation for future research on AI-supported organizational intelligence, reflective management, responsible human–AI collaboration, and socio-technical organizational decision support.
Author Contributions
M.T. conceptualized the study, designed and implemented IntellicaHR, conducted the evaluation, and drafted the manuscript. C.K., A.K., and E.A. contributed to theoretical framing, methodological review, manuscript revision, and supervision.
Funding
This work was partly supported by the University of Piraeus Research Center.
Ethical Approval
Not applicable. The study did not involve human or animal experiments requiring formal ethical approval.
Consent to Participate
Not applicable. No personal data or identifying information was collected.
Consent to Publish
Not applicable.
Data Availability Statement
The synthetic organizational data and generated artifacts supporting the proof-of-concept findings of this study are available from the corresponding author upon reasonable request. No real employee, organizational, or personally identifiable data were used.
Competing Interests
The authors declare no competing interests.
References
- Pougajendy, S.; Mathiazhagan, A.; Karunamurthy, A. The role of organizational culture in driving employee engagement: Insights and implications. Quing Int. J. Multidiscip. Sci. Res. Dev. 2024, 3, 26–32. [Google Scholar] [CrossRef]
- Ahmed, A.K.; Atta, M.H.R.; El-Monshed, A.H.; Mohamed, A.I. The effect of toxic leadership on workplace deviance: The mediating effect of emotional exhaustion, and the moderating effect of organizational cynicism. BMC Nurs. 2024, 23, 669. [Google Scholar] [CrossRef] [PubMed]
- Aguilera, R.V.; De Massis, A.; Fini, R.; Vismara, S. Organizational goals, outcomes, and the assessment of performance: Reconceptualizing success in management studies. J. Manag. Stud. 2024, 61, 1–36. [Google Scholar]
- Boot, A.W.A.; Macey, J.R.M. Monitoring corporate performance: The role of objectivity, proximity, and adaptability in corporate governance. Cornell Law. Rev. 2004, 89, 356–404. [Google Scholar]
- Alami, R.; Al-Masaeid, T. The AI-executive partnership: A new paradigm for decision-making and strategic leadership. J. Inf. Knowl. Manag. 2025, 24, 2550065. [Google Scholar] [CrossRef]
- Abouaomar, S.; Alhaderi, K. Overcoming barriers to digital transformation in public organizations using the McKinsey 7S model. Int. J. Res. Econ. Financ. 2024, 1, 14–28. [Google Scholar] [CrossRef]
- Al-Abrrow, H.; Alnoor, A.; Abdullah, H.O. Socio-technical approach, decision-making environment, and sustainable performance: Role of ERP systems. Interdiscip. J. Inf. Knowl. Manag. 2018, 13, 397–415. [Google Scholar] [CrossRef]
- Alibakhshi, S.; Seyyedamiri, N.; Nazarian, A.; Atkinson, P. A win-win situation: Enhancing sharing economy platform brand equity by engaging business owners in CSR using gamification. Int. J. Hosp. Manag. 2024, 117, 103636. [Google Scholar] [CrossRef]
- Aditya, B.R.; Ferdiana, R.; Kusumawardani, S.S. Categories for barriers to digital transformation in higher education: An analysis based on literature. Int. J. Inf. Educ. Technol. 2021, 11, 658–664. [Google Scholar] [CrossRef]
- Zadeh, L.A. The concept of a linguistic variable and its application to approximate reasoning—I. Inf. Sci. 1975, 8, 199–249. [Google Scholar] [CrossRef]
- Zadeh, L.A. Fuzzy sets. Inf. Control 1965, 8, 338–353. [Google Scholar] [CrossRef]
- Brock, D.M. The changing professional organization: A review of competing archetypes. Int. J. Manag. Rev. 2006, 8, 157–174. [Google Scholar] [CrossRef]
- Bevilacqua, S.; Masárová, J.; Perotti, F.A.; Ferraris, A. Enhancing top managers’ leadership with artificial intelligence: Insights from a systematic literature review. Rev. Manag. Sci. 2025, 19, 2899–2935. [Google Scholar] [CrossRef]
- Bounjerte, I.; Khalidy, S.; Mazouzy, I.; El Turk, J.; Haidar, I.; Kettani, A.; Saile, R.; Bennani, H. Evaluating organisational performance in healthcare: A mixed-method study using the McKinsey 7S framework. BMJ Open Qual. 2025, 14, e003317. [Google Scholar] [CrossRef] [PubMed]
- Botla, L.; Kondur, H. Socio technical systems of a company: The dimensionality of socio technical systems. Purushartha J. Manag. Ethics Spiritual. 2018, 11. [Google Scholar] [CrossRef]
- Bodie, M.T.; Cherry, M.A.; McCormick, M.L.; Tang, J. The law and policy of people analytics. Univ. Colo. Law. Rev. 2017, 88, 961–1024. [Google Scholar]
- Chen, F.; Wu, Q.L. Health-oriented leadership communication matters: A trickle-down model to enhance employees’ health and well-being during turbulent times. Corp. Commun. Int. J. 2024, 29, 384–404. [Google Scholar]
- Anseel, F.; Lievens, F.; Schollaert, E. Reflection as a strategy to enhance task performance after feedback. Organ. Behav. Hum. Decis. Process. 2009, 110, 23–35. [Google Scholar] [CrossRef]
- Chomicki, M. Organizational sensory systems of Polish enterprises in the context of cooperative relationships. Management 2019, 23, 50–60. [Google Scholar] [CrossRef]
- Chmielewska, M.; Stokwiszewski, J.; Markowska, J.; Hermanowski, T. Evaluating organizational performance of public hospitals using the McKinsey 7-S framework. BMC Health Serv. Res. 2022, 22, 7. [Google Scholar] [CrossRef] [PubMed]
- Cui, J. The explore of knowledge management dynamic capabilities, AI-driven knowledge sharing, knowledge-based organizational support, and organizational learning on job performance: Evidence from Chinese technological companies. arXiv 2025, arXiv:2501.02468. [Google Scholar]
- Manroop, L.; Malik, A.; Milner, M. The ethical implications of big data in human resource management. Hum. Resour. Manag. Rev. 2024, 34, 101012. [Google Scholar] [CrossRef]
- Fleck, D.L. Archetypes of organizational success and failure. BAR Braz. Adm. Rev. 2009, 6, 78–100. [Google Scholar] [CrossRef]
- Doherty, N.F.; King, M. From technical to socio-technical change: Tackling the human and organizational aspects of systems development projects. Eur. J. Inf. Syst. 2005, 14, 1–5. [Google Scholar] [CrossRef]
- Dudin, M.N.; Frolova, E.E.; Gryzunova, N.V.; Shuvalova, E.B. The Deming cycle (PDCA) concept as an efficient tool for continuous quality improvement in the agribusiness. Asian Soc. Sci. 2015, 11, 239–246. [Google Scholar]
- Datta, V.; Bann, S.; Mandalia, M.; Darzi, A. The surgical efficiency score: A feasible, reliable, and valid method of skills assessment. Am. J. Surg. 2006, 192, 372–378. [Google Scholar] [CrossRef] [PubMed]
- Friess, S.; Stojko, L.; Lin, L.; Mickeler, M.; Soucek, R.; Kretschmer, T.; Koch, M.; Moser, K. Digital enterprise collaboration platforms: An interdisciplinary progress report submitted. SSRN 2025. [Google Scholar] [CrossRef]
- Farhan, K.A.; Asadullah, A.B.M.; Kommineni, H.P.; Gade, P.K.; Naga Venkata, S.S.M.K.G. Machine learning-driven gamification: Boosting user engagement in business. Glob. Discl. Econ. Bus. 2023, 12, 41–52. [Google Scholar] [CrossRef]
- Padilla, A.; Hogan, R.; Kaiser, R.B. The toxic triangle: Destructive leaders, susceptible followers, and conducive environments. Leadersh. Q. 2007, 18, 176–194. [Google Scholar] [CrossRef]
- Gong, Q.; Fan, D.; Bartram, T. Integrating artificial intelligence and human resource management: A review and future research agenda. Int. J. Hum. Resour. Manag. 2025, 36, 103–141. [Google Scholar]
- Gkrimpizi, T.; Peristeras, V.; Magnisalis, I. Classification of barriers to digital transformation in higher education institutions: Systematic literature review. Educ. Sci. 2023, 13, 746. [Google Scholar] [CrossRef]
- Herrmann, T.; Pfeiffer, S. Keeping the organization in the loop: A socio-technical extension of human-centered artificial intelligence. AI Soc. 2023, 38, 1523–1542. [Google Scholar]
- Hanafizadeh, P.; Zare Ravasan, A. A McKinsey 7S model-based framework for ERP readiness assessment. Int. J. Enterp. Inf. Syst. 2011, 7, 23–63. [Google Scholar] [CrossRef]
- Hasani, K.; Sheikhesmaeili, S.; Aeini, T. The survey of cybernetic management and its relation to organizational health. Syst. Pract. Action Res. 2015, 28, 229–254. [Google Scholar]
- Han, X.; Ma, J.; Yu, S.; Liu, Y.; Ma, P.; Wang, C. Architectural framework and standardization of LLM-enhanced intelligent data analysis systems. In Proceedings of the 2024 International Conference on Ubiquitous Computing and Communications, Chengdu, China, 2024; IEEE: Piscataway, NJ, USA; pp. 573–578. [Google Scholar]
- Holt, M.; Lang, B.; Sutton, S.G. Potential employees’ ethical perceptions of active monitoring: The dark side of data analytics. J. Inf. Syst. 2017, 31, 107–124. [Google Scholar] [CrossRef]
- Whiting, M.A.; Haack, J.; Varley, C. Creating realistic, scenario-based synthetic data for test and evaluation of information analytics software. In Proceedings of the Workshop on Beyond Time and Errors: Novel Evaluation Methods for Information Visualization, Florence, Italy, 28 May 2008; ACM: New York, NY, USA, 2008; pp. 1–9. [Google Scholar]
- Conger, J.; Toegel, G. Action learning and multi-rater feedback as leadership development interventions: Popular but poorly deployed. J. Chang. Manag. 2002, 3, 332–348. [Google Scholar] [CrossRef]
- Jansen, P.M.; Chengie, A.; El-Jbouly, R.; Akaro, D.; Johne, F. Agile leadership in times of crisis: A strategic framework for organizational resilience. OTS Can. J. 2025, 4, 14–23. [Google Scholar] [CrossRef]
- Juhász, T.; Horváth-Csikós, G.; Gáspár, T. Gap analysis of future employee and employer on soft skills. Hum. Syst. Manag. 2023, 42, 527–542. [Google Scholar] [CrossRef]
- Kathuria, S.; Duggal, A.S.; Lande, J. Artificial intelligence automation in advent of human resource management. In Proceedings of the 2024 Parul International Conference on Engineering and Technology; IEEE: Piscataway, NJ, USA, 2024; pp. 1–5. [Google Scholar]
- Khodabandelou, R.; Roghanian, P.; Gheysari, H.; Amoozegar, A. A systematic review of gamification in organizational learning. Learn. Organ. 2023, 30, 251–272. [Google Scholar]
- Kromidha, E.; Davison, R.M. Generative AI-augmented decision-making for business information systems. In Human Choice and Computers; Davison, R.M., Kreps, D., Eds.; Springer: Cham, Switzerland, 2024; pp. 79–93. [Google Scholar]
- Li, J.; Qin, R.; Wang, F.-Y. The future of management: DAO to smart organizations and intelligent operations. IEEE Trans. Syst. Man. Cybern. Syst. 2023, 53, 3389–3400. [Google Scholar] [CrossRef]
- Looker, N.; Webster, D.; Russell, D.; Xu, J. Scenario based evaluation. In Proceedings of the IEEE Symposium on Object/Component/Service-Oriented Real-Time Distributed Computing, Orlando, FL, USA, 5–7 May 2008; IEEE: Piscataway, NJ, USA, 2008; pp. 148–154. [Google Scholar]
- Li, G.; Yuan, C.; Kamarthi, S.; Moghaddam, M.; Jin, X. Data science skills and domain knowledge requirements in the manufacturing industry: A gap analysis. J. Manuf. Syst. 2021, 60, 692–706. [Google Scholar] [CrossRef]
- Maguire, M. Socio-technical systems and interaction design—21st century relevance. Appl. Ergon. 2014, 45, 162–170. [Google Scholar] [CrossRef] [PubMed]
- Maratos, E.J.; Allan, K.; Rugg, M.D. Recognition memory for emotionally negative and neutral words: An ERP study. Neuropsychologia 2000, 38, 1452–1465. [Google Scholar] [CrossRef] [PubMed]
- Chatterjee, S.; Chaudhuri, R.; Vrontis, D.; Siachou, E. Examining the dark side of human resource analytics: An empirical investigation using the privacy calculus approach. Int. J. Manpow. 2022, 43, 52–74. [Google Scholar]
- Haynes, S.R.; Purao, S.; Skattebo, A.L. Situating evaluation in scenarios of use. In Proceedings of the 2004 ACM Conference on Computer Supported Cooperative Work, Chicago, IL, USA, 6–10 November 2004; ACM: New York, NY, USA, 2004; pp. 92–101. [Google Scholar]
- Jain, N.; Kansal, J. Application of McKinsey 7S framework as a strategic tool for a knowledge-based organizational development. IEEE Eng. Manag. Rev. 2025, 53, 14–26. [Google Scholar] [CrossRef]
- Maura-Ayquipa, G.; Ramirez-Lázaro, A.; Shiguihara-Juárez, P. Human resources management model based on business intelligence. In Proceedings of the 2018 IEEE XXV International Conference on Electronics, Electrical Engineering and Computing; IEEE: Piscataway, NJ, USA, 2018; pp. 1–4. [Google Scholar]
- Nanjundeswaraswamy, T.S.; Swamy, D.R. Leadership styles. Adv. Manag. 2014, 7, 57–62. [Google Scholar] [CrossRef]
- Nunamaker, J.F., Jr.; Briggs, R.O.; Derrick, D.C.; Schwabe, G. The last research mile: Achieving both rigor and relevance in information systems research. J. Manag. Inf. Syst. 2015, 32, 10–47. [Google Scholar] [CrossRef]
- Owusu, E.E.; Bonsu, C.A.; Owusu, A.; Ofori, D.; Brefo-Manuh, A.B. Assessing the effects of entrepreneurial attributes and business practices on the continuing existence of small and medium enterprises (SMEs) using Deming management model of total quality as a benchmark. Bus. Econ. Res. 2022, 12, 56–83. [Google Scholar] [CrossRef]
- Natta, P. Generative AI in enterprise systems: Moving beyond conversational AI. World J. Adv. Eng. Technol. Sci. 2025, 15, 1695–1701. [Google Scholar] [CrossRef]
- Peifer, Y.; Jeske, T.; Hille, S. Artificial intelligence and its impact on leaders and leadership. Procedia Comput. Sci. 2022, 200, 1024–1030. [Google Scholar] [CrossRef]
- Cibu, B.; Delcea, C.; Domenteanu, A.; Dumitrescu, G. Mapping the evolution of cybernetics: A bibliometric perspective. Computers 2023, 12, 237. [Google Scholar] [CrossRef]
- Ronnie, L. The challenge of toxic leadership in realising sustainable development goals: A scoping review. SA J. Hum. Resour. Manag. 2024, 22, a2754. [Google Scholar] [CrossRef]
- Rikala, P.; Braun, G.; Järvinen, M.; Stahre, J.; Hämäläinen, R. Understanding and measuring skill gaps in Industry 4.0: A review. Technol. Forecast. Soc. Change 2024, 201, 123206. [Google Scholar] [CrossRef]
- Kluger, A.N.; DeNisi, A. The effects of feedback interventions on performance: A historical review, a meta-analysis, and a preliminary feedback intervention theory. Psychol. Bull. 1996, 119, 254–284. [Google Scholar] [CrossRef]
- Rahwan, I. Society-in-the-loop: Programming the algorithmic social contract. Ethics Inf. Technol. 2018, 20, 5–14. [Google Scholar]
- Kapoor, R. The digital twin of the enterprise: Revolutionizing organizational intelligence. J. Comput. Sci. Technol. Stud. 2025, 7, 762–770. [Google Scholar] [CrossRef]
- Zhang, X.; Song, M.; Zhang, H. Leadership in action: How senior management behaviours propel AI adoption and innovation success. J. Exp. Theor. Artif. Intell. 2026, 38, 113–135. [Google Scholar]
- Singh, A.; Jha, S. Relationship between employee well-being and organizational health: Symbiotic or independent? Ind. Commer. Train. 2022, 54, 231–249. [Google Scholar]
- Zada, M.; Khan, S.; Zada, S.; Dhar, B.K. Driving sustainable development through CSR leadership: Insights into organizational learning and technological innovation. Sustain. Dev. 2025, 33, 4060–4074. [Google Scholar] [CrossRef]
- Schwaninger, M. Model-based management: A cybernetic concept. Syst. Res. Behav. Sci. 2015, 32, 564–578. [Google Scholar]
- Sun, N. Investigating the mediating role of team communication in the relationship between leadership style and team performance in AI-based interaction systems development. J. Internet Serv. Inf. Secur. 2024, 14, 144–162. [Google Scholar] [CrossRef]
- Sharma, W.; Lim, W.M.; Kumar, S.; Verma, A.; Kumra, R. Game on! A state-of-the-art overview of doing business with gamification. Technol. Forecast. Soc. Change 2024, 198, 122988. [Google Scholar] [CrossRef]
- Shraim, M.; Allan, K. Using a Deming Lens to Investigate and Solve Managerial Challenges. In Proceedings of the 2021 ASEE Virtual Annual Conference Content Access, 2021. [Google Scholar]
- Shaqrah, A. Analyzing business intelligence systems based on 7S model of McKinsey. Int. J. Bus. Intell. Res. 2018, 9, 53–63. [Google Scholar] [CrossRef]
- Weng, L.; Tang, Y.; Feng, Y.; Chang, Z.; Chen, R.; Feng, H.; Hou, C.; Huang, D.; Li, Y.; Rao, H.; Wang, H.; Wei, C.; Yang, X.; Zhang, Y.; Zheng, Y.; Huang, X.; Zhu, M.; Ma, Y.; Cui, B.; Chen, W. DataLab: A unified platform for LLM-powered business intelligence. In Proceedings of the IEEE International Conference on Data Engineering, 2025; pp. 4346–4359. [Google Scholar]
- Sunkar, G.S. Strategic decision-making in the data analytics era: A multidisciplinary approach to AI-augmented leadership decision making. Sarcouncil J. Eng. Comput. Sci. 2025, 4, 131–139. [Google Scholar]
- Øvrelid, E. Managing the socio-technical interplay of architecture, business, and learning in architectural transformation: The case of finance. In Proceedings of ECIS 2025, 2025; Association for Information Systems: Atlanta, GA, USA. [Google Scholar]
- Aguinis, H.; Burgi-Tian, J. Performance management around the world: Solving the standardization vs adaptation dilemma. IIM Ranchi J. Manag. Stud. 2023, 2, 159–170. [Google Scholar] [CrossRef]
- Schubert, P.; Williams, S.P. Enterprise collaboration platforms: An empirical study of technology support for collaborative work. Procedia Comput. Sci. 2022, 196, 305–313. [Google Scholar] [CrossRef]
- Stenger, M.; Leppich, R.; Foster, I.; et al. Evaluation is key: A survey on evaluation measures for synthetic time series. J. Big Data 2024, 11, 66. [Google Scholar] [CrossRef]
- Garengo, P.; Sardi, A.; Nudurupati, S.S. Human resource management (HRM) in the performance measurement and management (PMM) domain: A bibliometric review. Int. J. Product. Perform. Manag. 2022, 71, 3056–3077. [Google Scholar] [CrossRef]
- Teetzen, F.; Klug, K.; Steinmetz, H.; Gregersen, S. Organizational health climate as a precondition for health-oriented leadership: Expanding the link between leadership and employee well-being. Front. Psychol. 2023, 14, 1181599. [Google Scholar] [CrossRef] [PubMed]
- Tomov, L. Antifragile project management: The Deming paradigm and beyond. Procedia Comput. Sci. 2022, 201, 632–638. [Google Scholar] [CrossRef]
- Methuku, V.; Kamatala, S. Intelligent systems and organizational intelligence: A literature review and conceptual framework. In Proceedings of the 2025 6th International Conference on Data Intelligence and Cognitive Informatics; IEEE: Piscataway, NJ, USA, 2025; pp. 1–8. [Google Scholar]
- Baral, S.K.; Rath, R.C.; Goel, R.; Singh, T. Role of digital technology and artificial intelligence for monitoring talent strategies to bridge the skill gap. In Proceedings of the 2022 International Mobile and Embedded Technology Conference, Noida, India, 10–11 March 2022; IEEE: Piscataway, NJ, USA, 2022; pp. 582–587. [Google Scholar]
- Van Wart, M. A comprehensive model of organizational leadership: The leadership action cycle. Int. J. Organ. Theory Behav. 2004, 7, 173–208. [Google Scholar]
- Ashford, S.J.; Wellman, N.; Sully de Luque, M.; De Stobbeleir, K.E.M.; Wollan, M. Two roads to effectiveness: CEO feedback seeking, vision articulation, and firm performance. J. Organ. Behav. 2018, 39, 82–95. [Google Scholar]
- Mikkelsen, M.F.; Kjer, M.G. Autonomy is taken, not given: The role of public leader networking in shaping perceived managerial autonomy. Public Perform. Manag. Rev. 2025, 48, 1114–1142. [Google Scholar] [CrossRef]
Figure 1.
Conceptual Positioning of IntellicaHR Across Six Intersecting Domains.
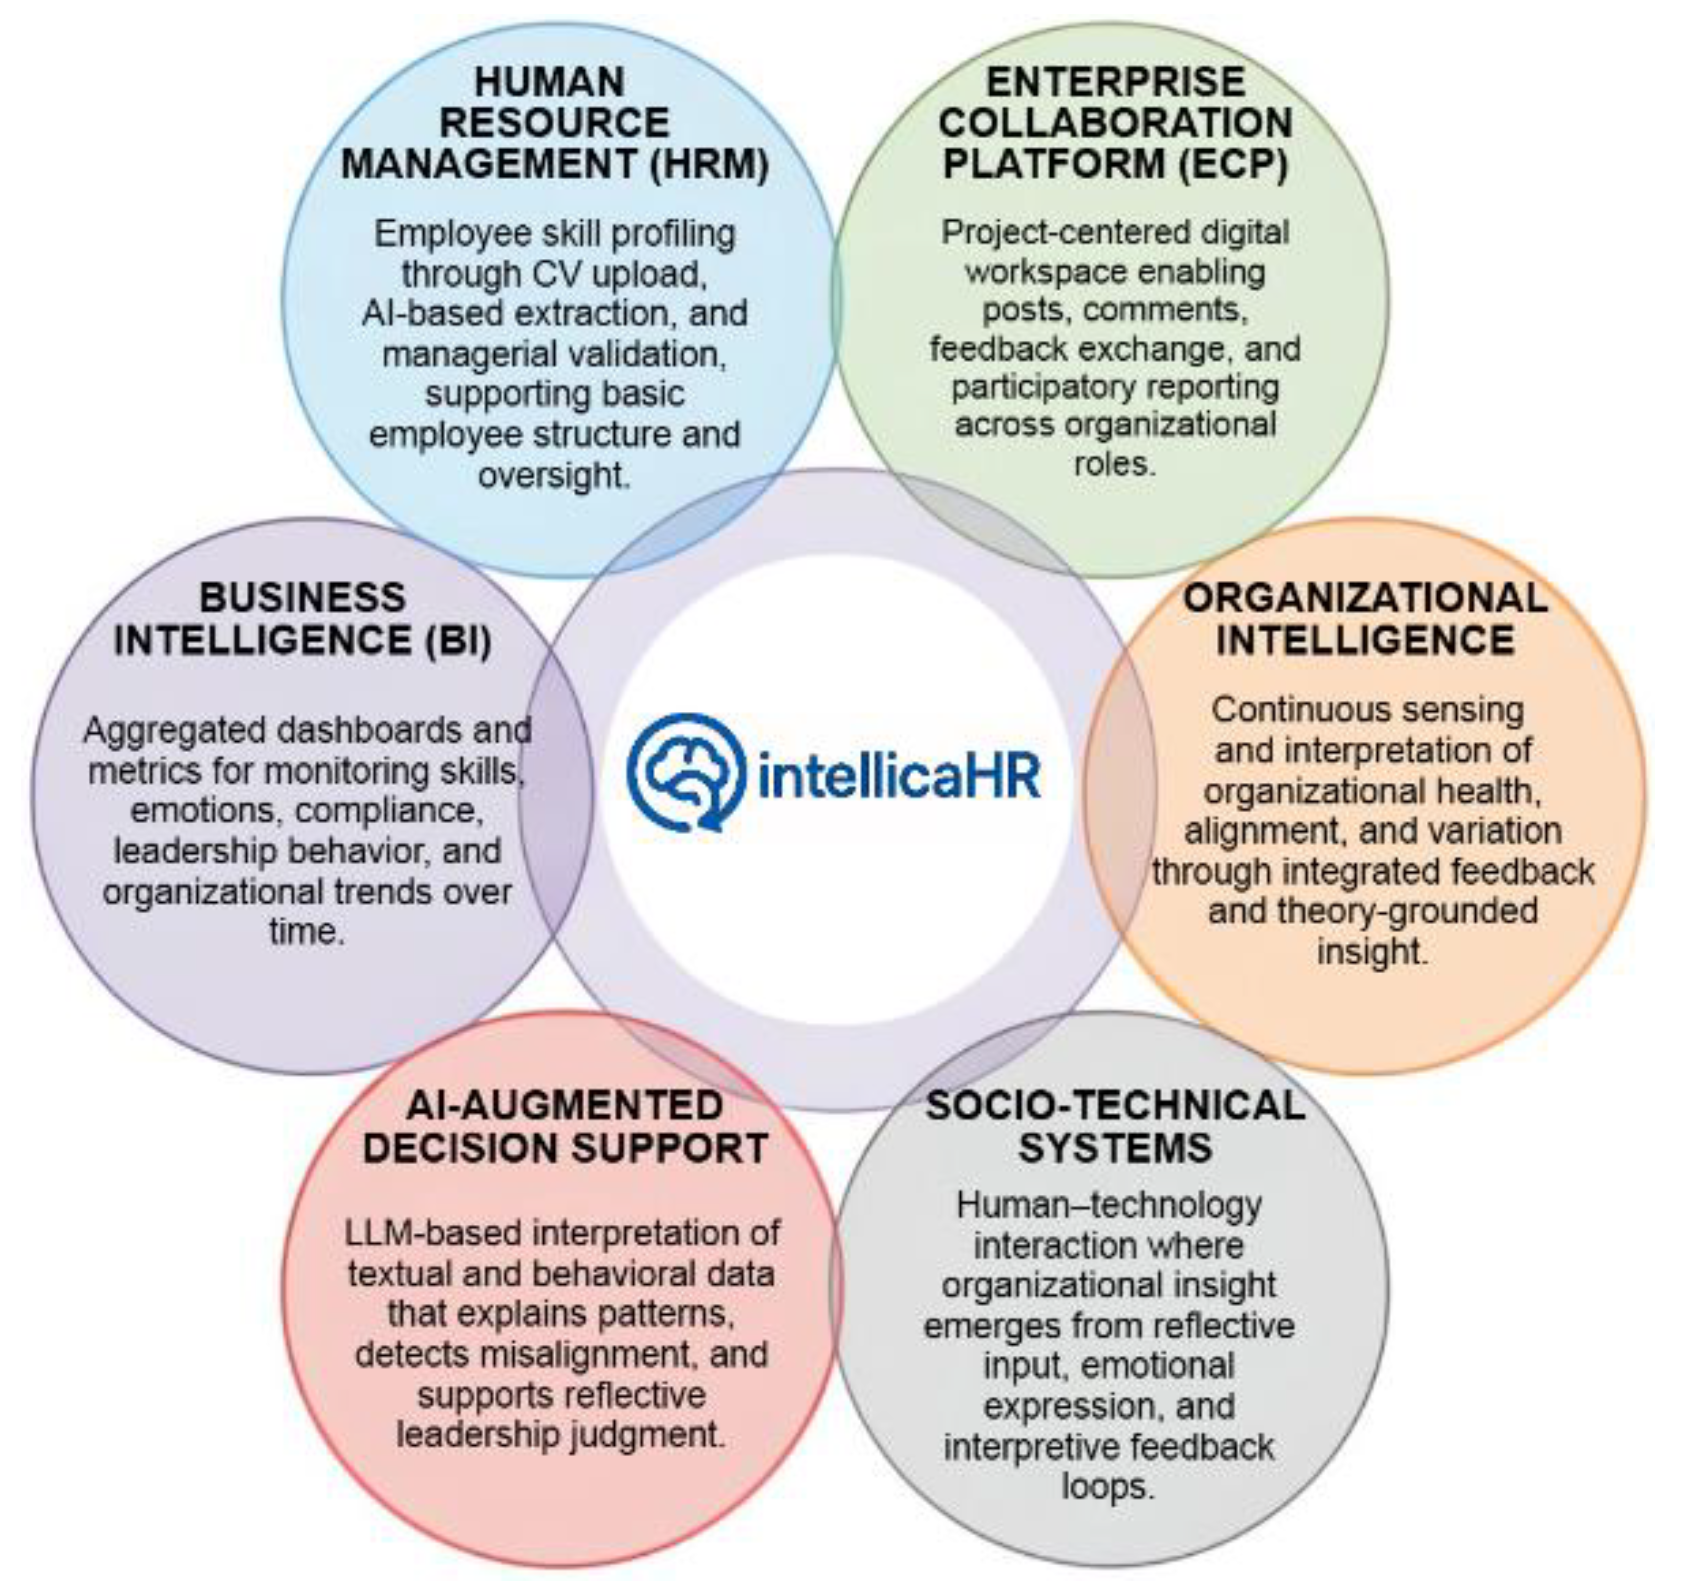
Figure 2.
IntellicaHR System Architecture.
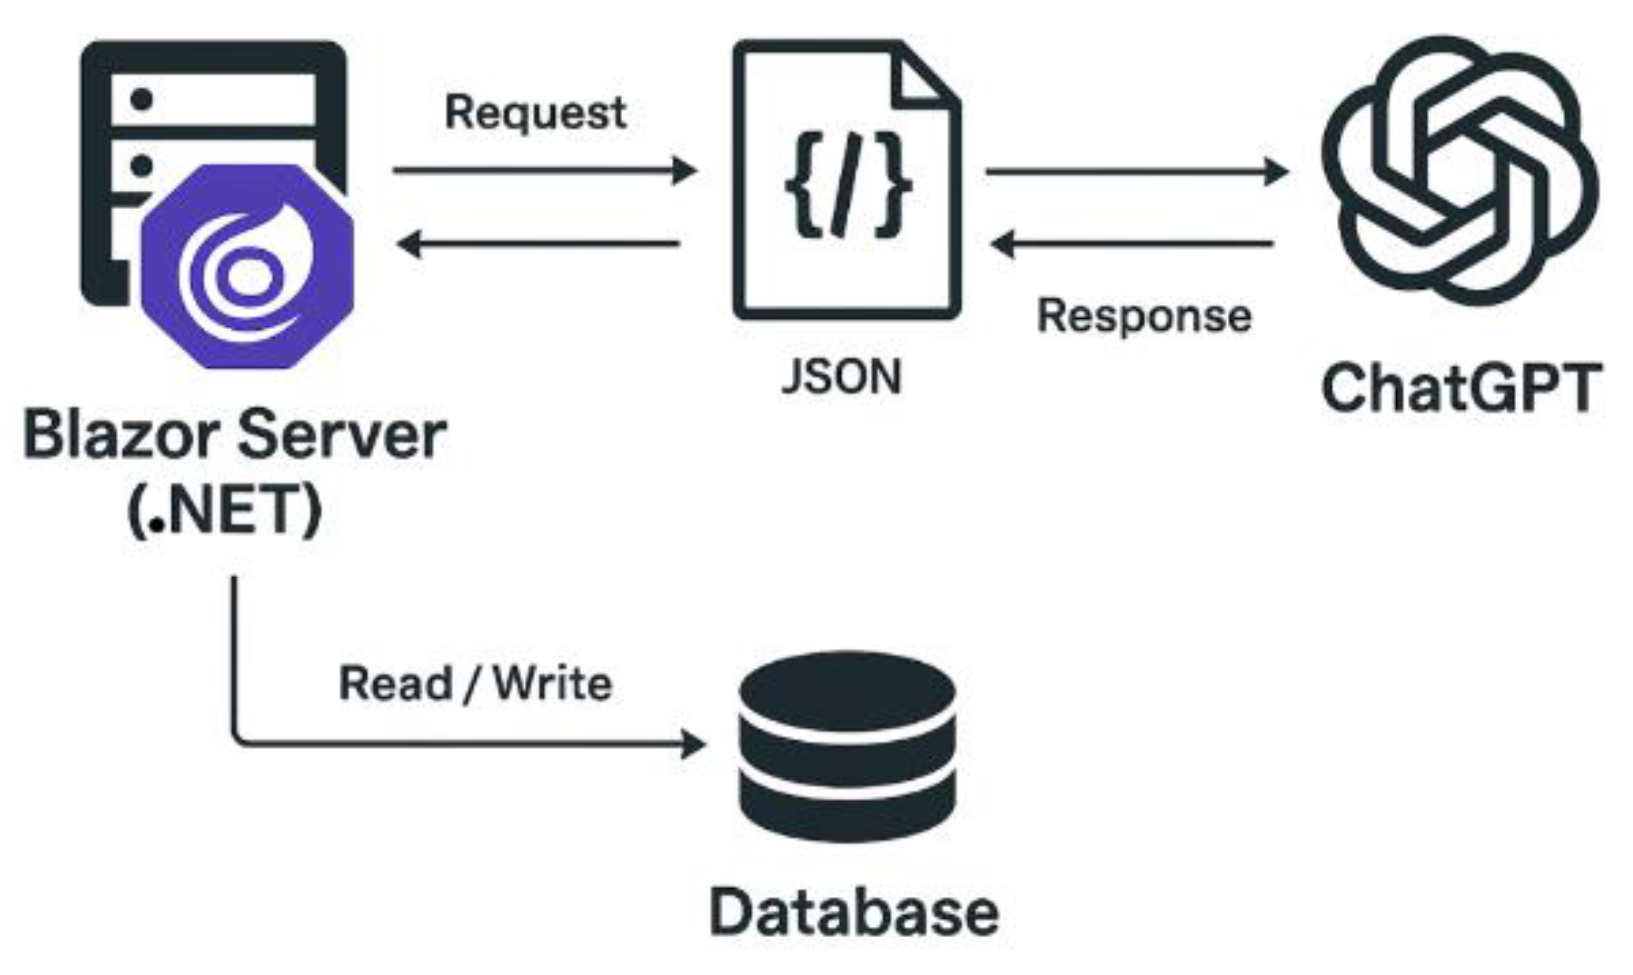
Figure 3.
IntellicaHR Continuous Organizational Feedback Architecture.
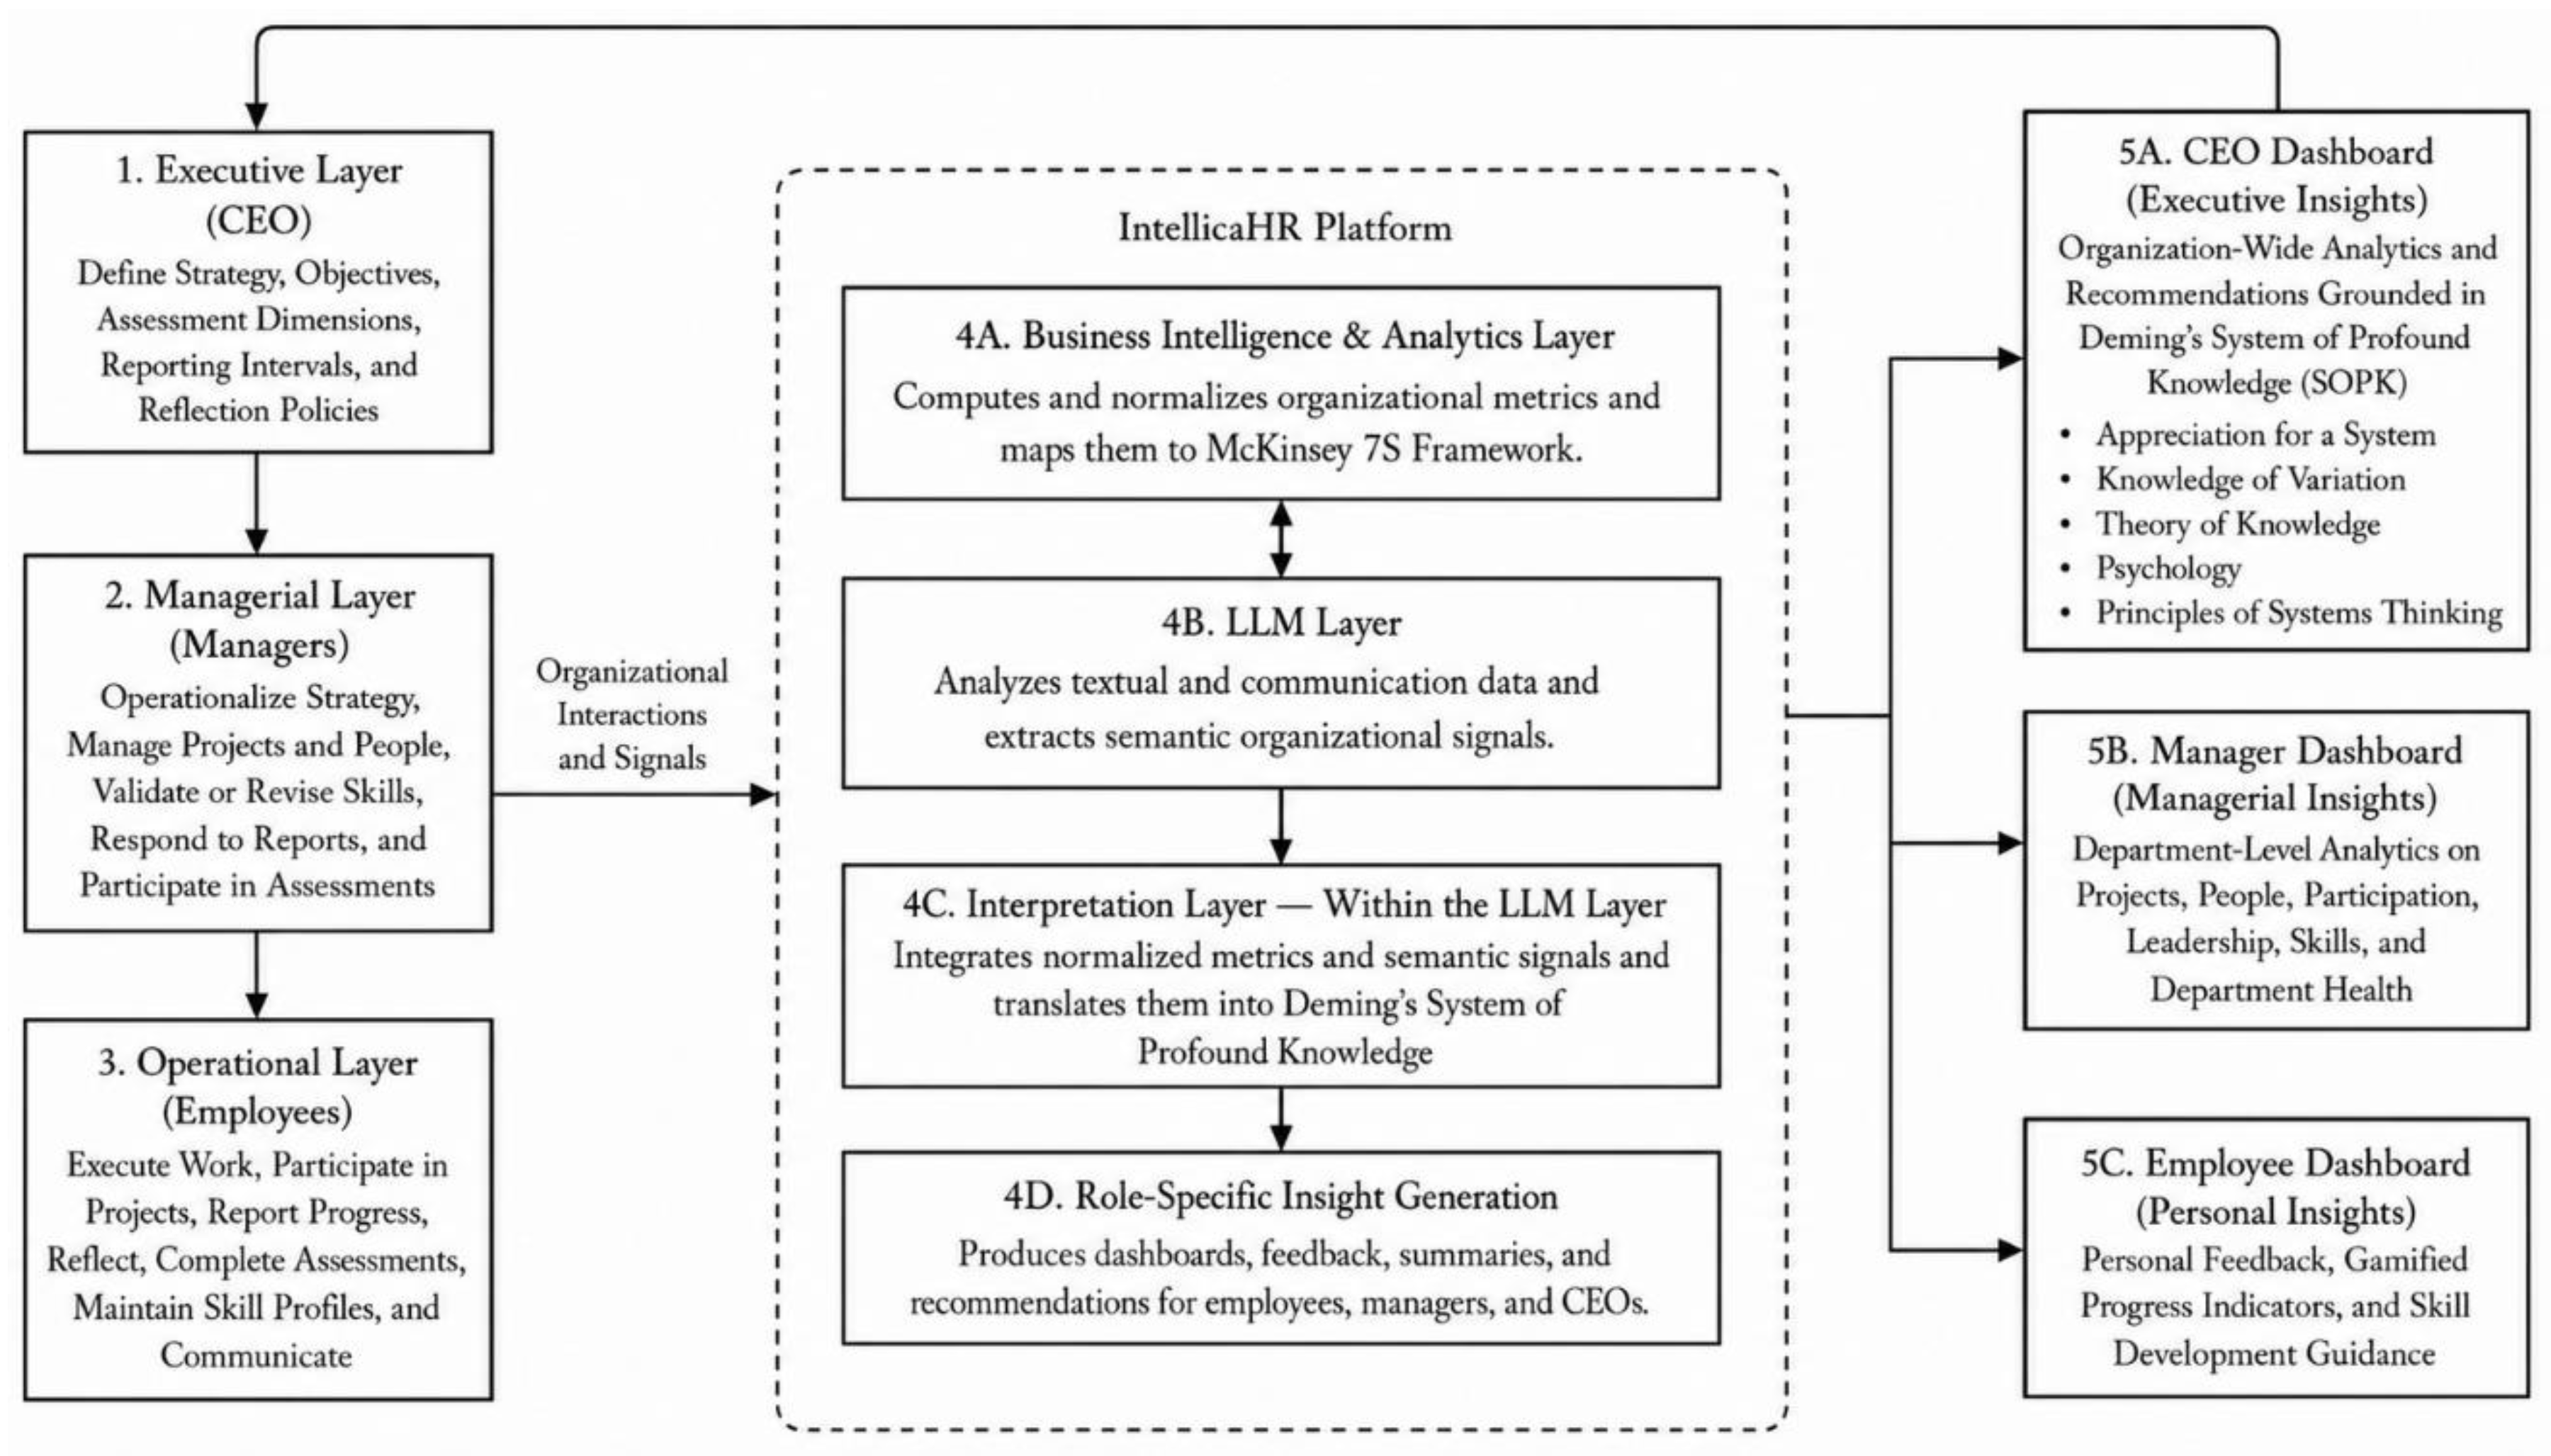
Figure 9.
Theory-Grounded Synthetic Demonstration Pipeline for Observing IntellicaHR Behavior.
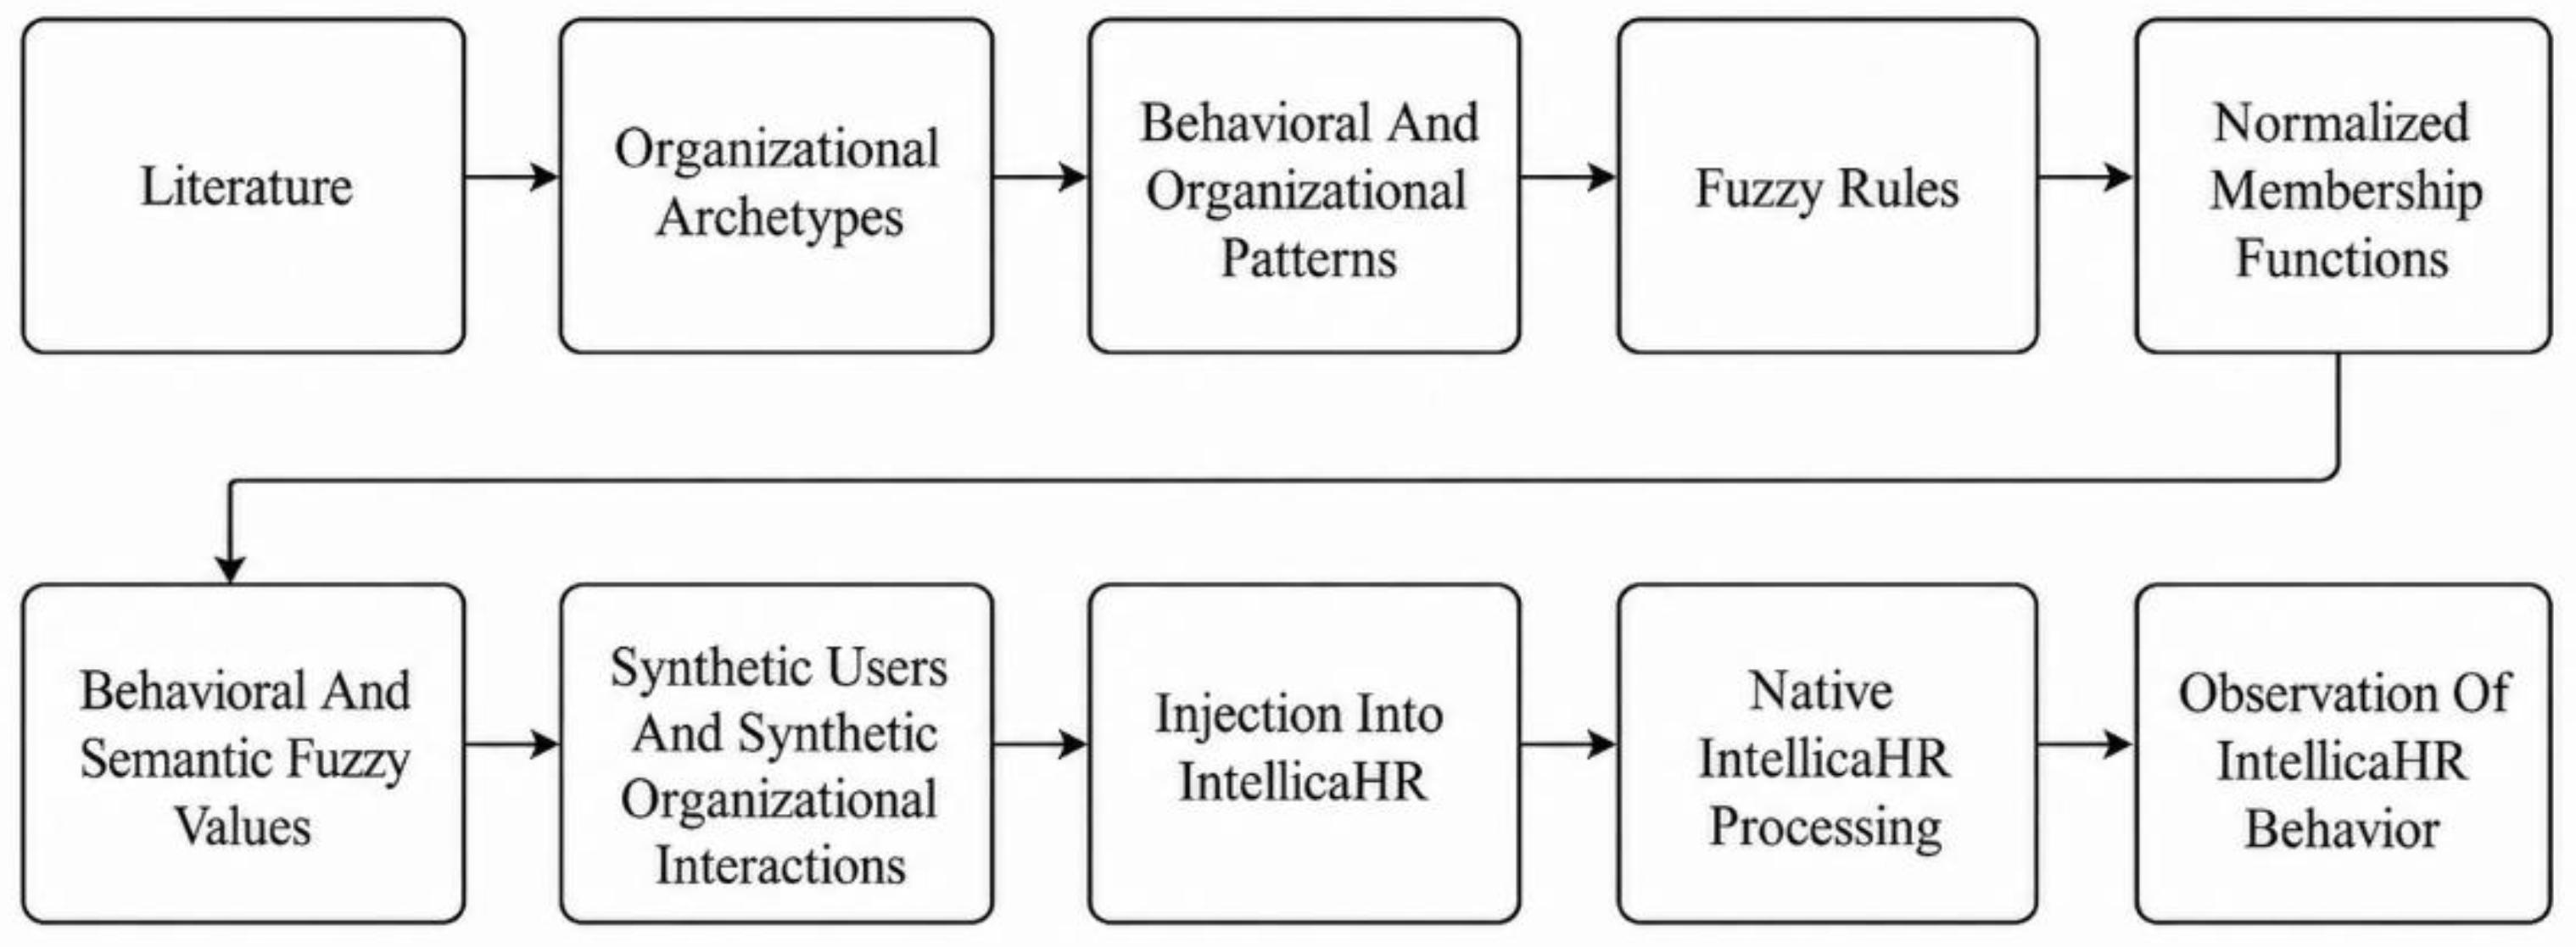
Figure 10.
Fuzzy membership functions for pattern-constrained synthetic interaction generation.
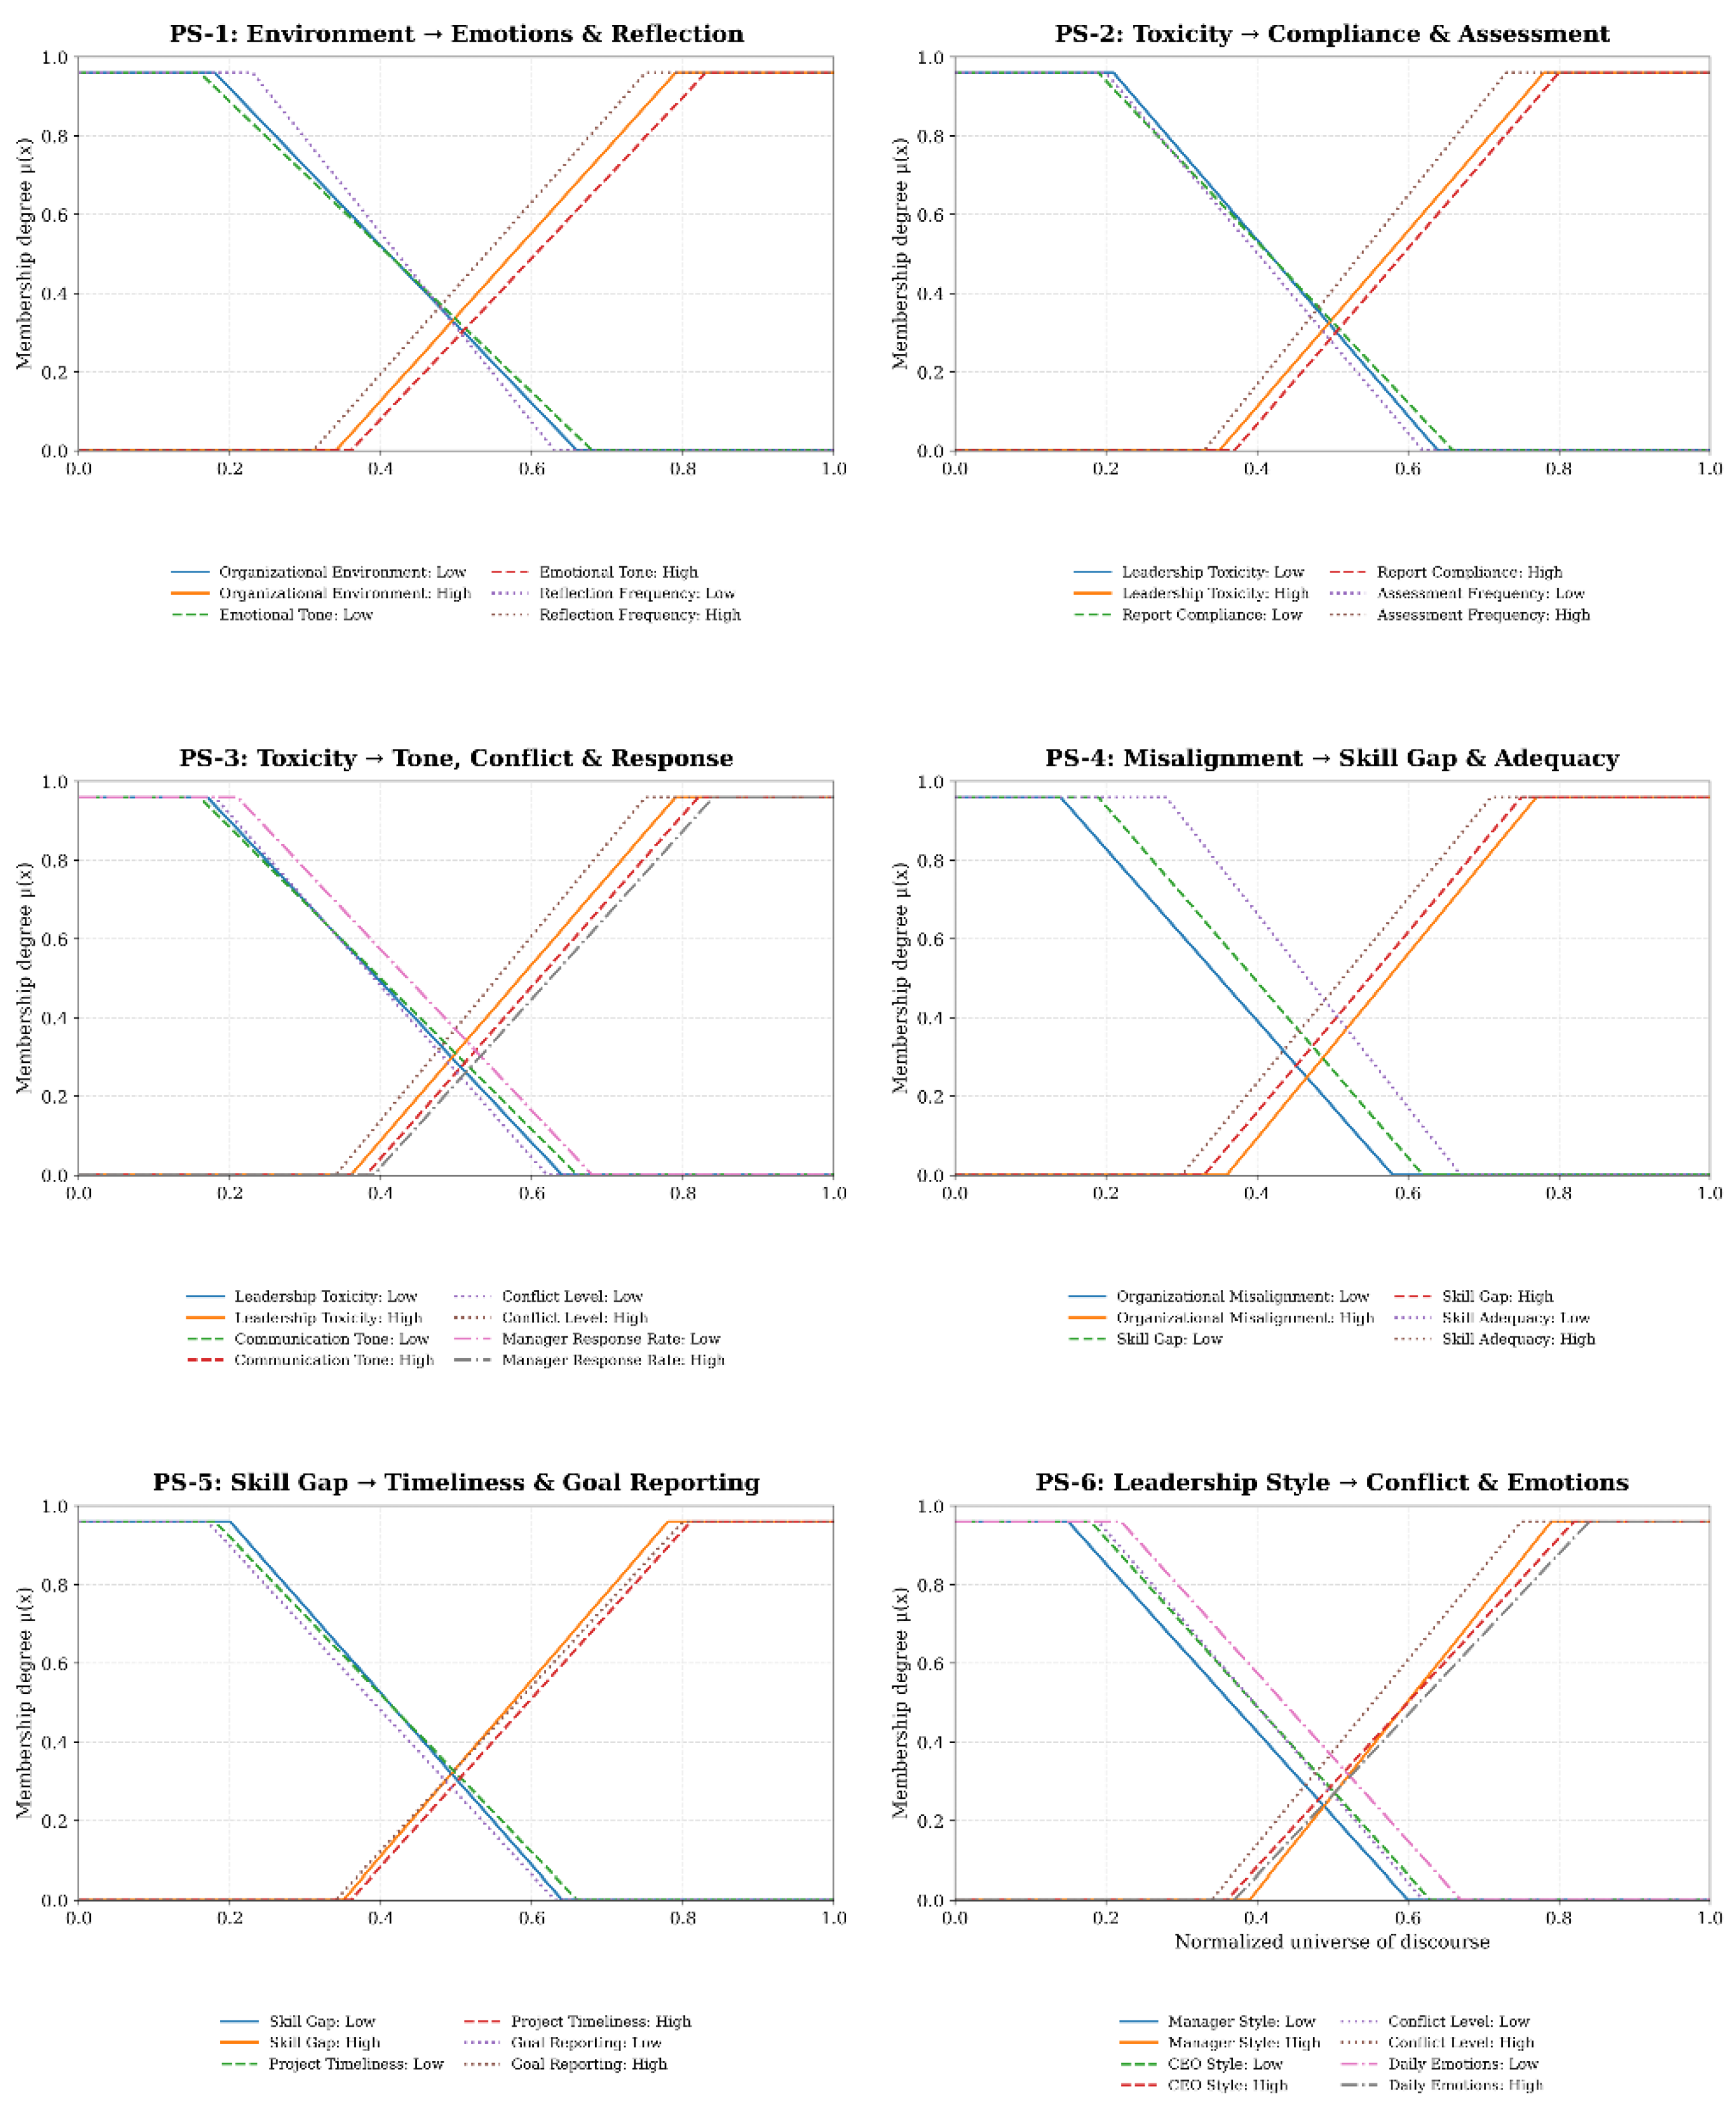
Figure 11.
Scenario Comparison of Normalized IntellicaHR Metrics Across the Three Virtual Organizations.
Figure 11.
Scenario Comparison of Normalized IntellicaHR Metrics Across the Three Virtual Organizations.
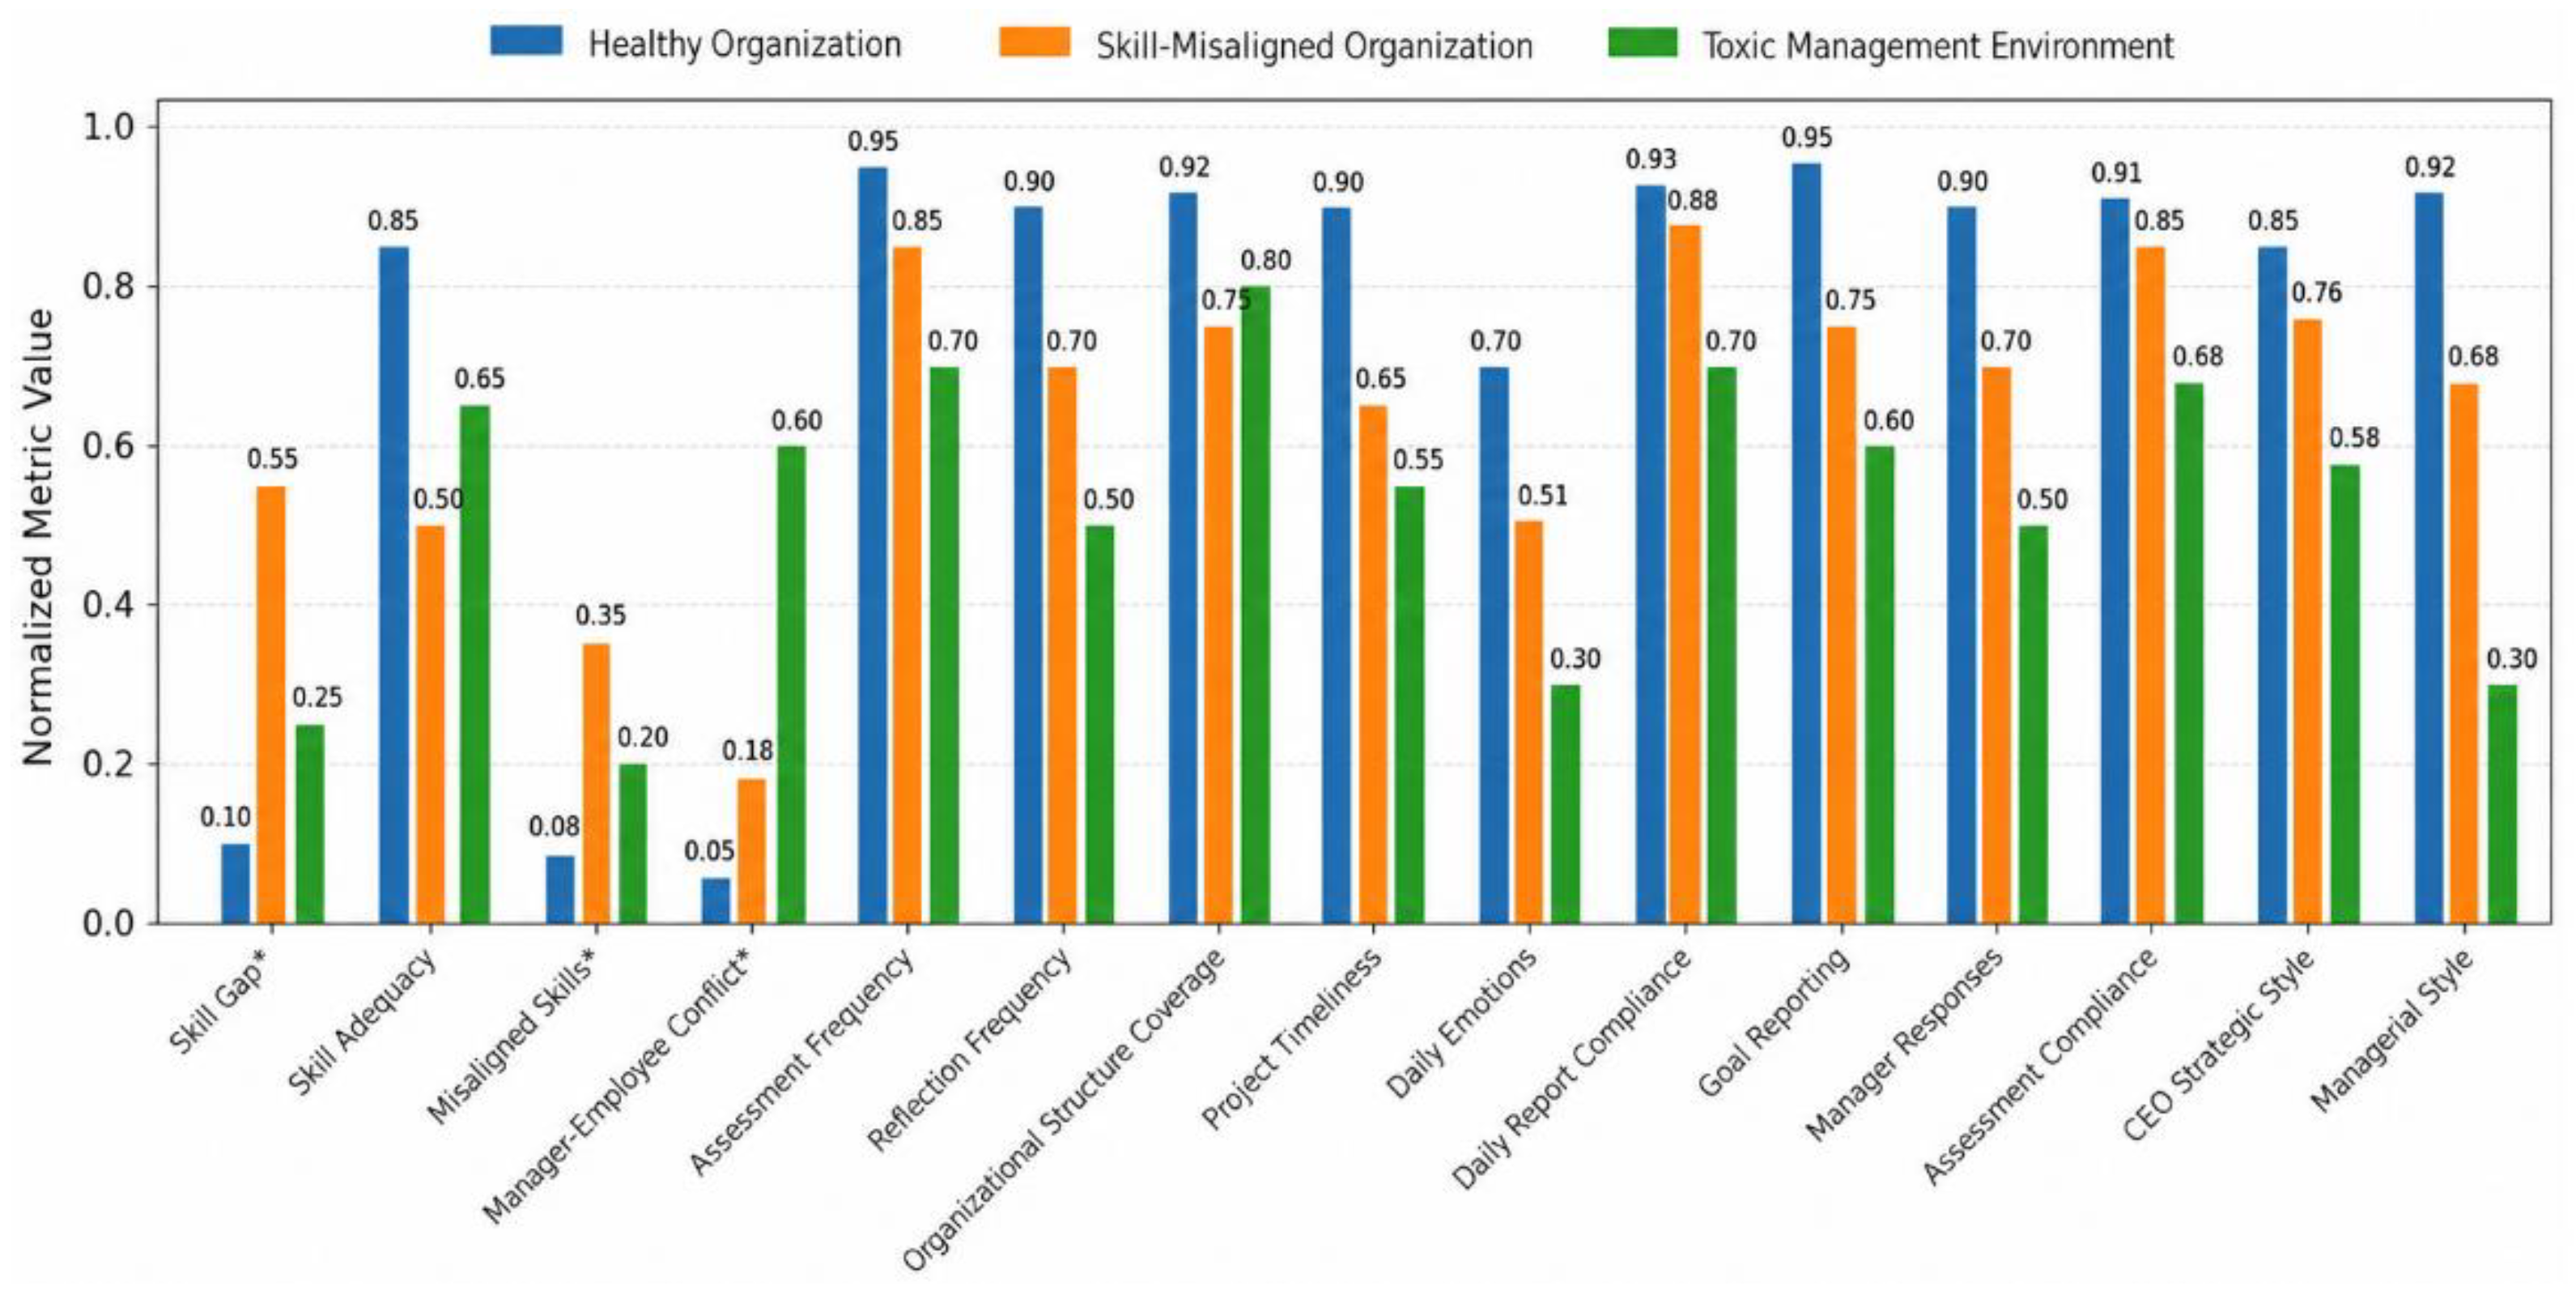
Figure 12.
Expected–Observed Alignment Between Scenario-Level Fuzzy Logic and IntellicaHR Analytic Outputs.
Figure 12.
Expected–Observed Alignment Between Scenario-Level Fuzzy Logic and IntellicaHR Analytic Outputs.
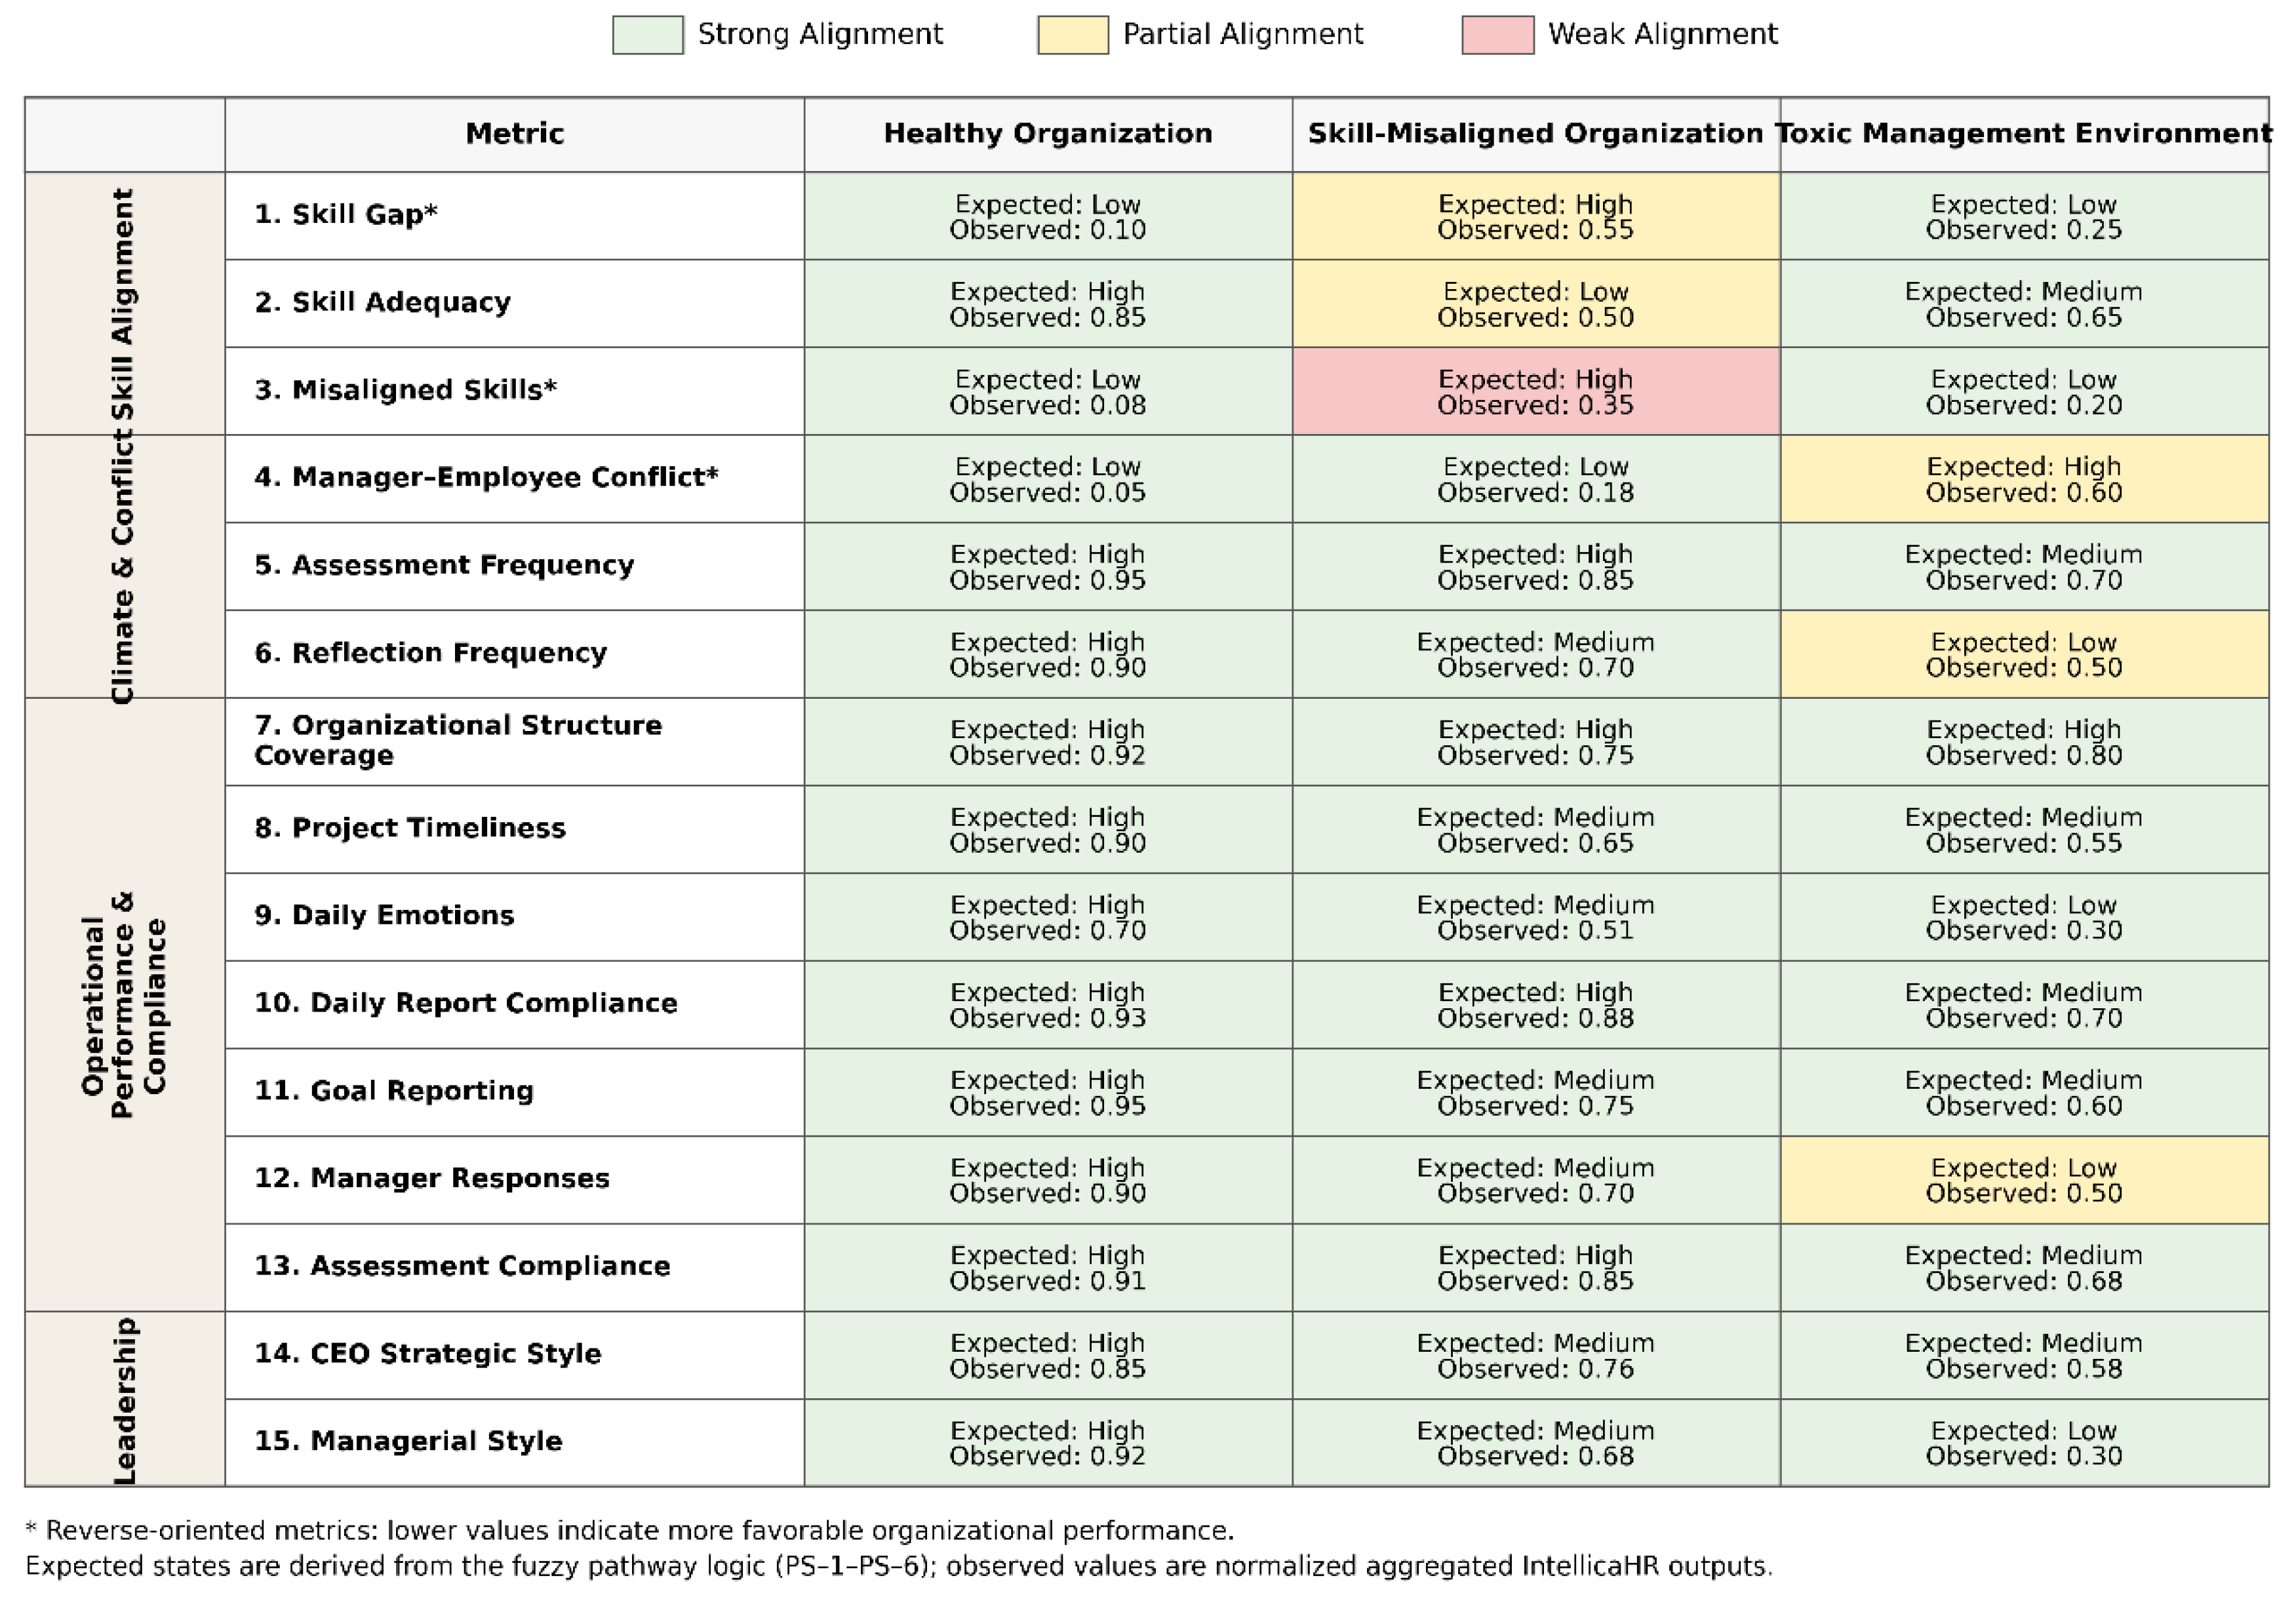
Figure 13.
Manager’s Health of Department Dashboard for Development Department.
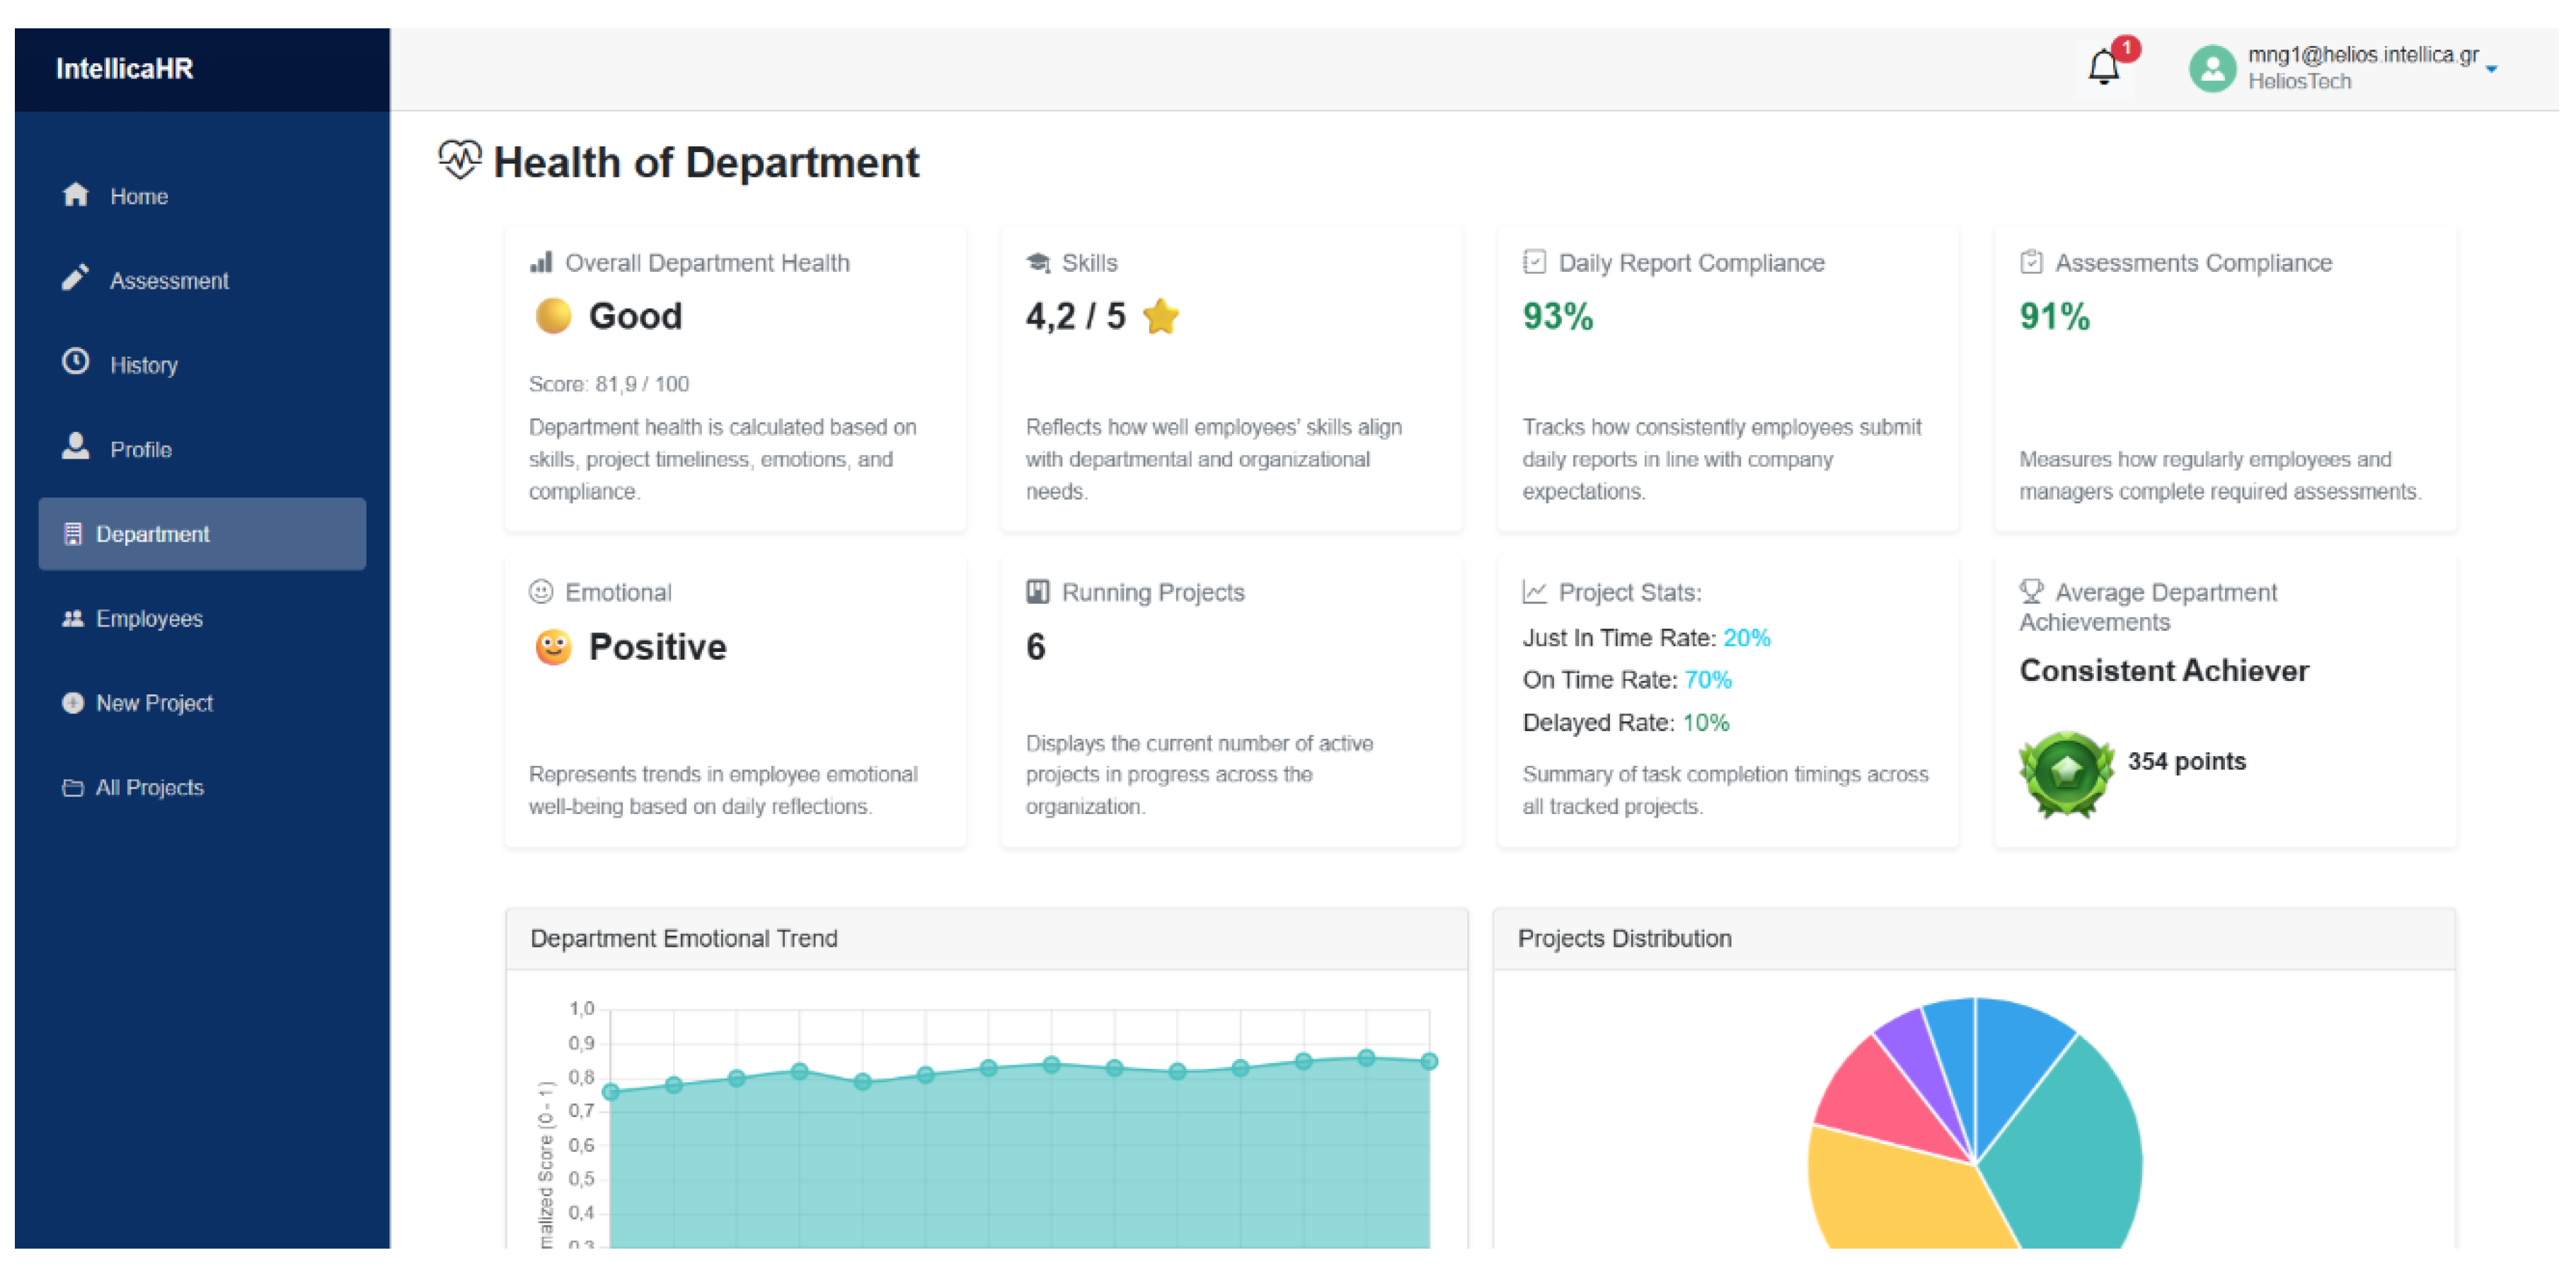
Figure 14.
CEO’s Health of Organization Dashboard.
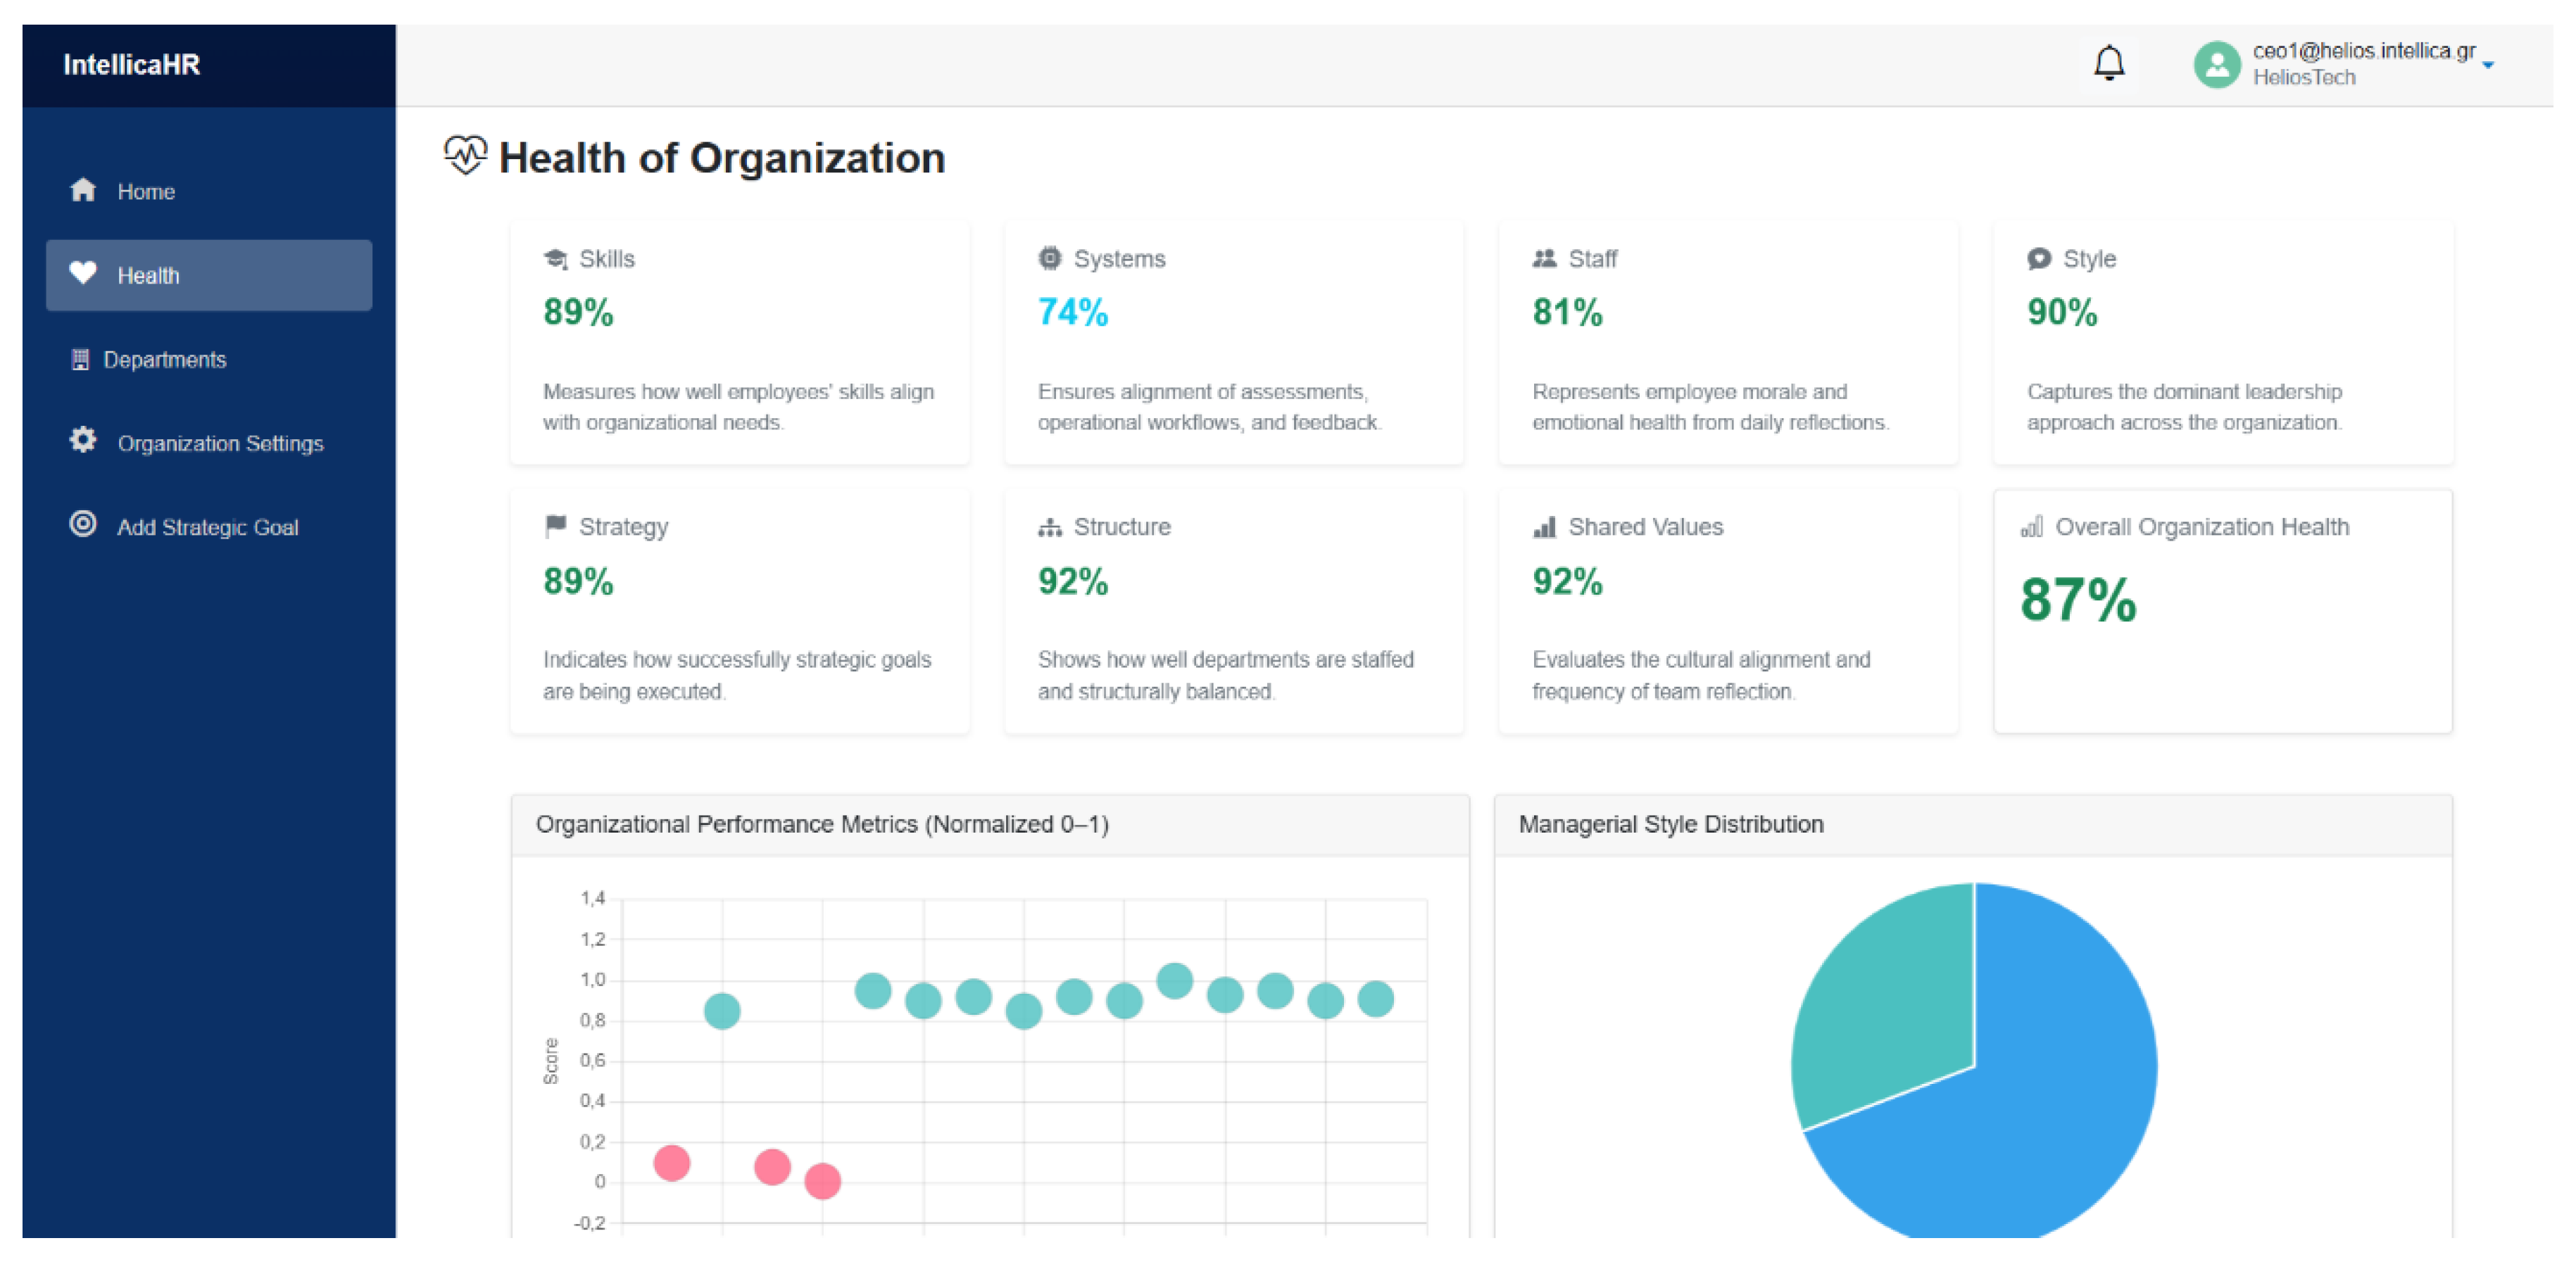
Figure 15.
CEO’s Organizational Insights and Recommendations Dashboard.
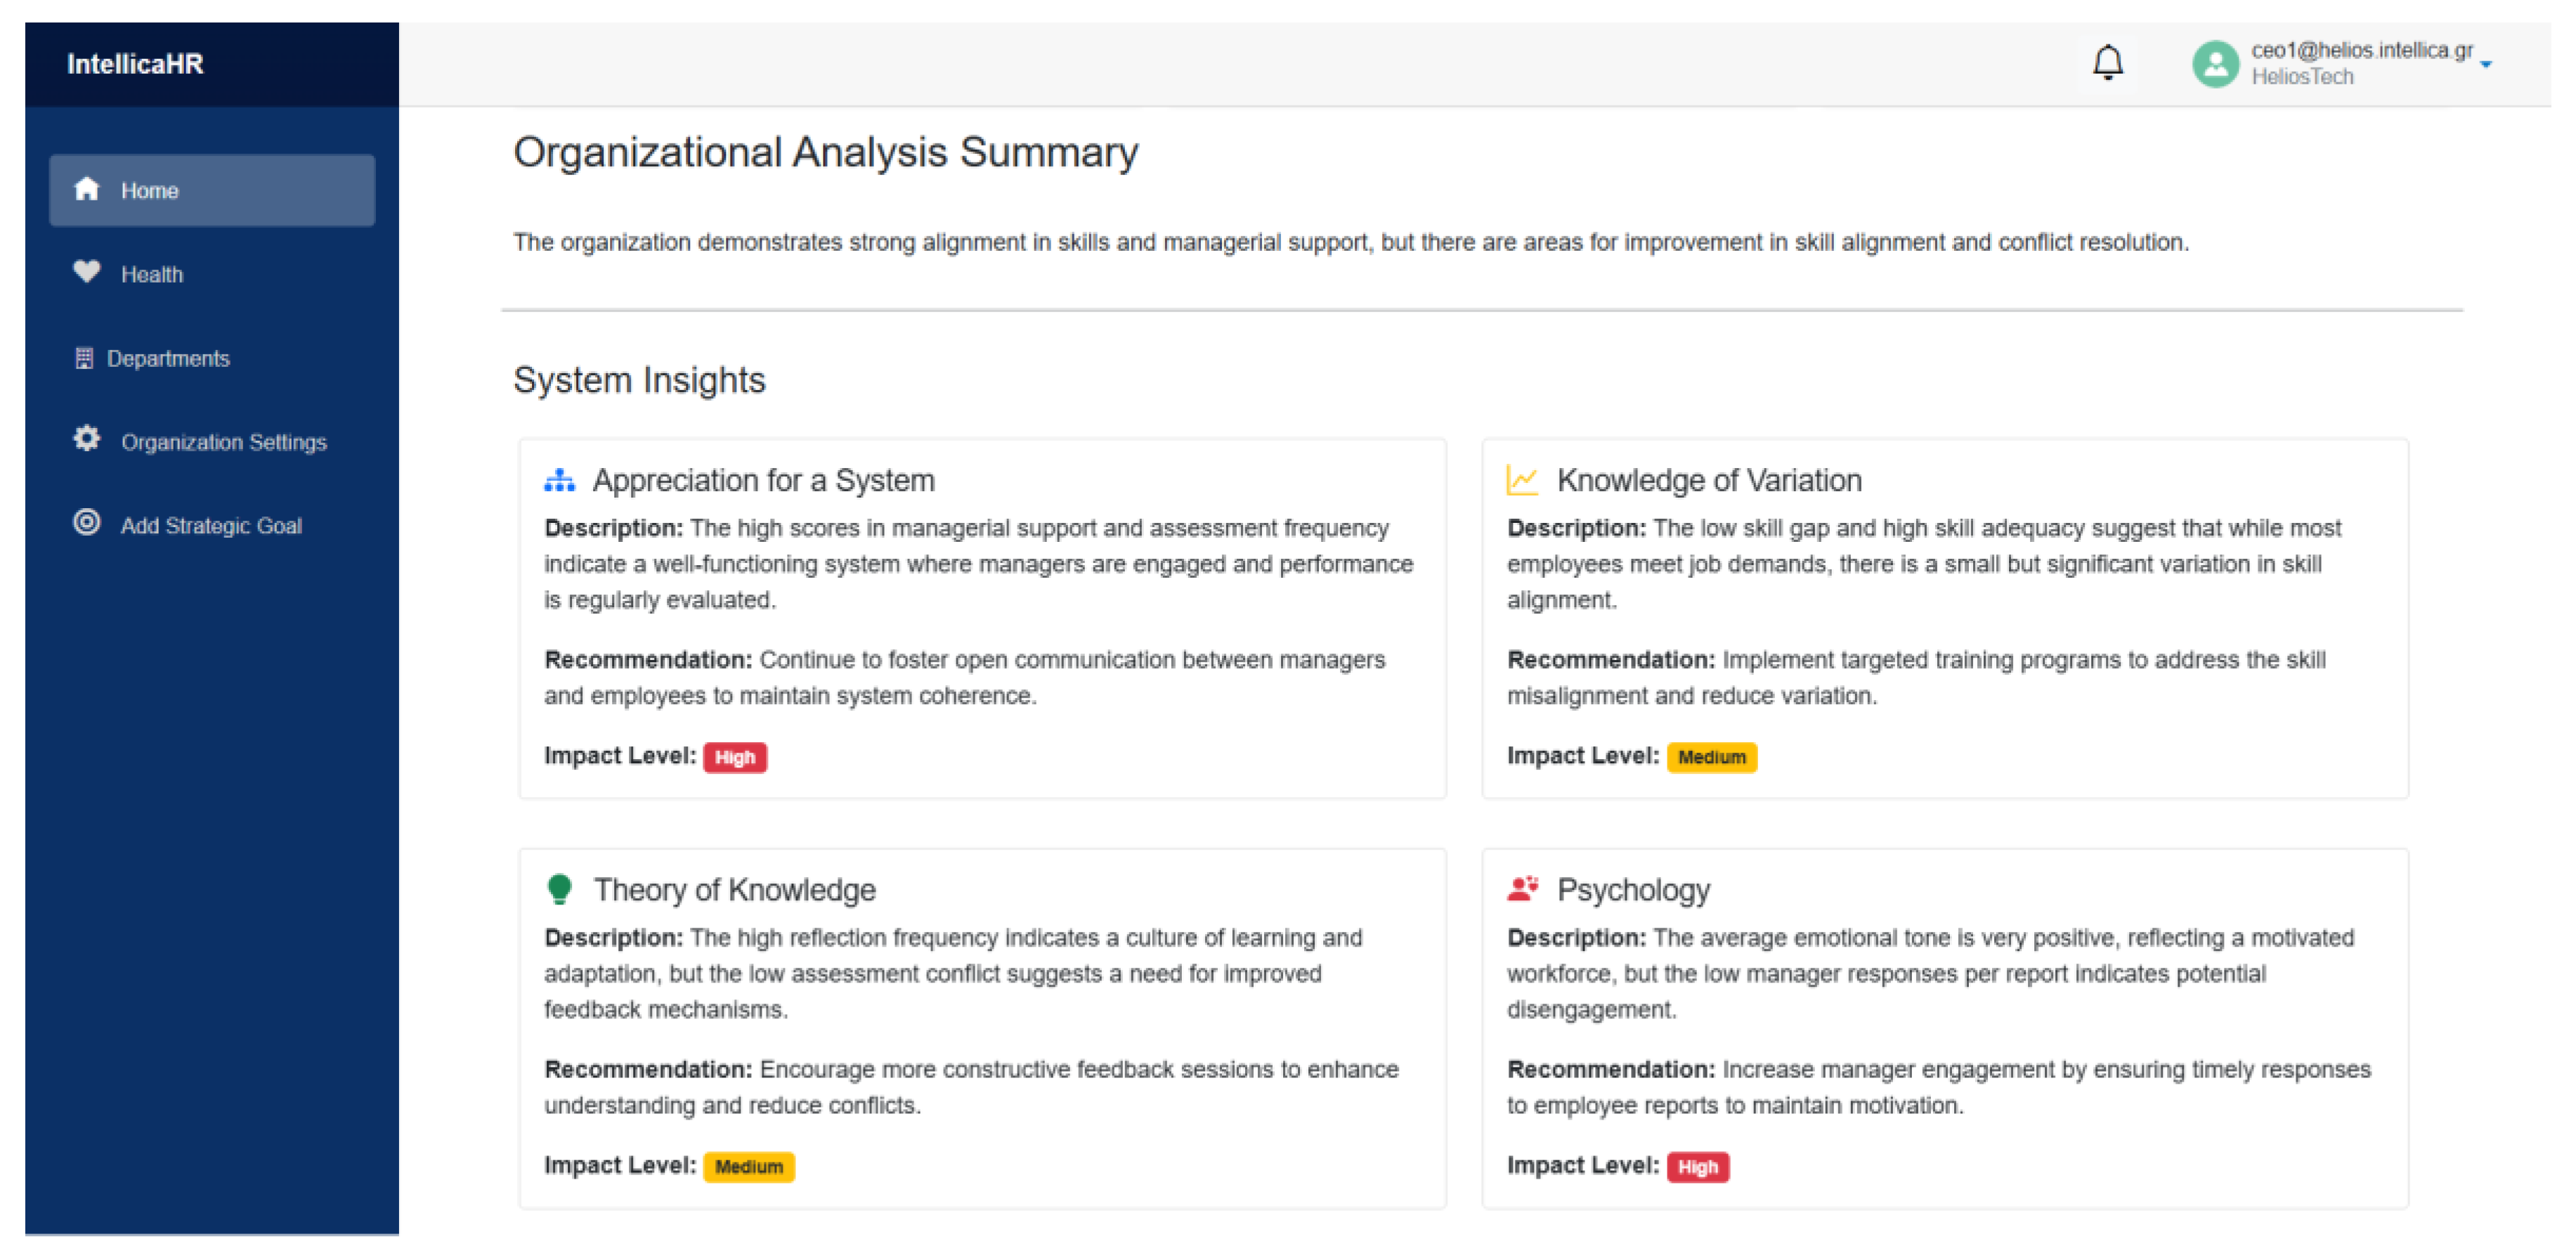
Figure 16.
Manager’s Health of Department Dashboard for the Logistics Department.
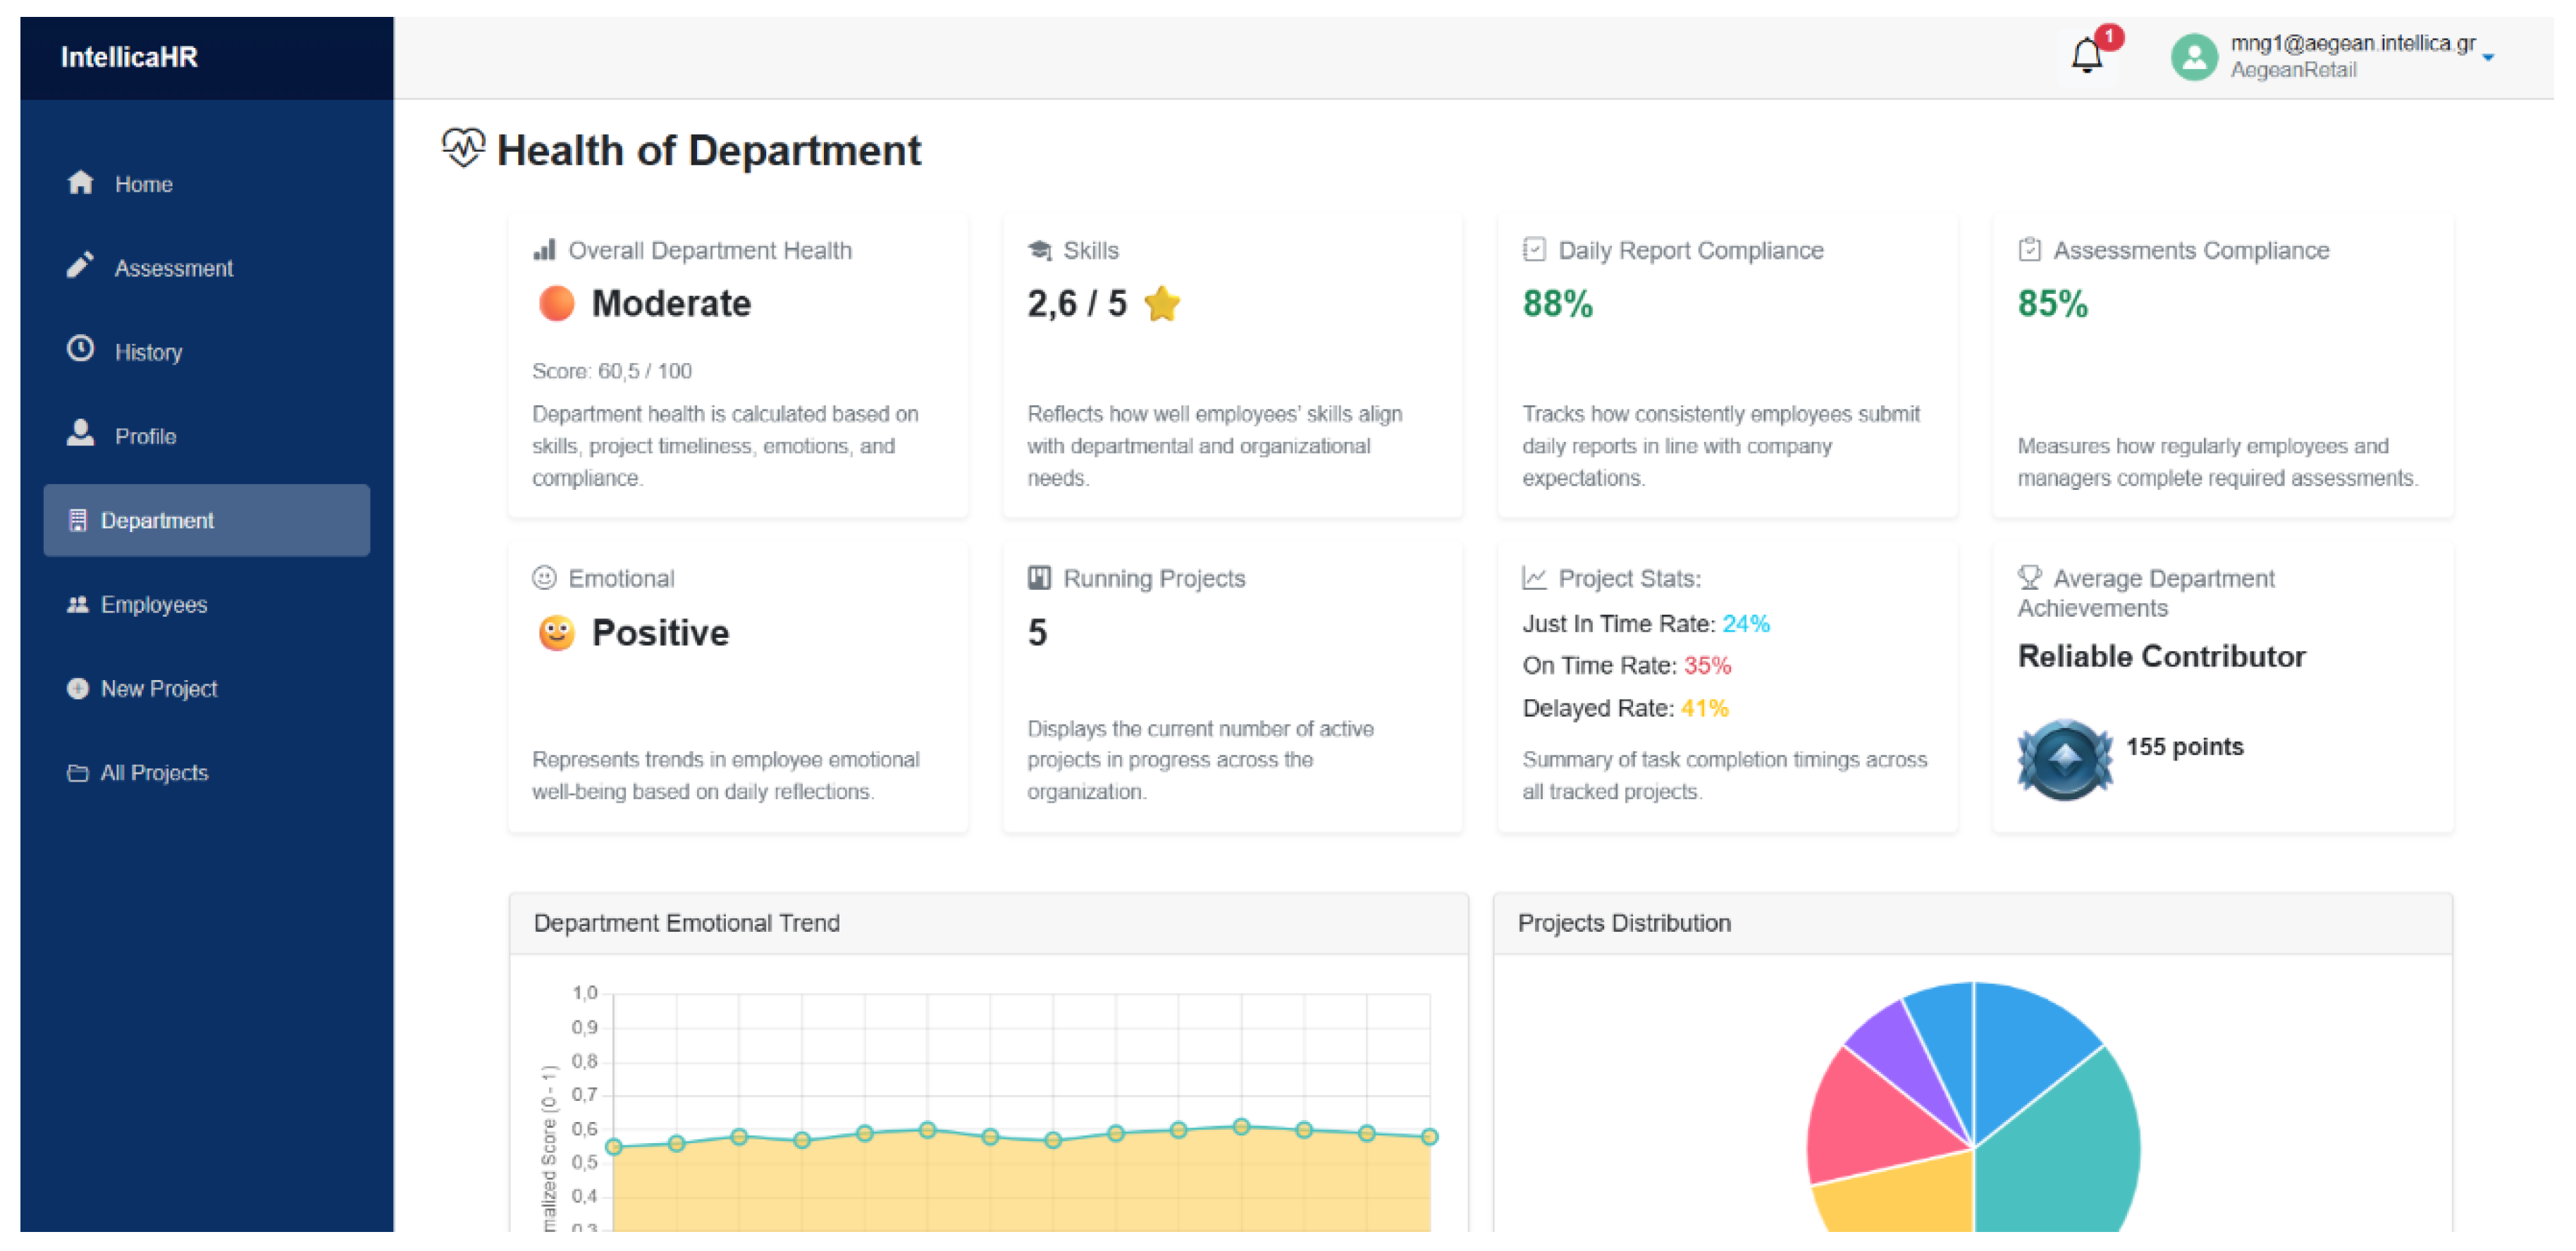
Figure 17.
CEO’s Health of Organization Dashboard.
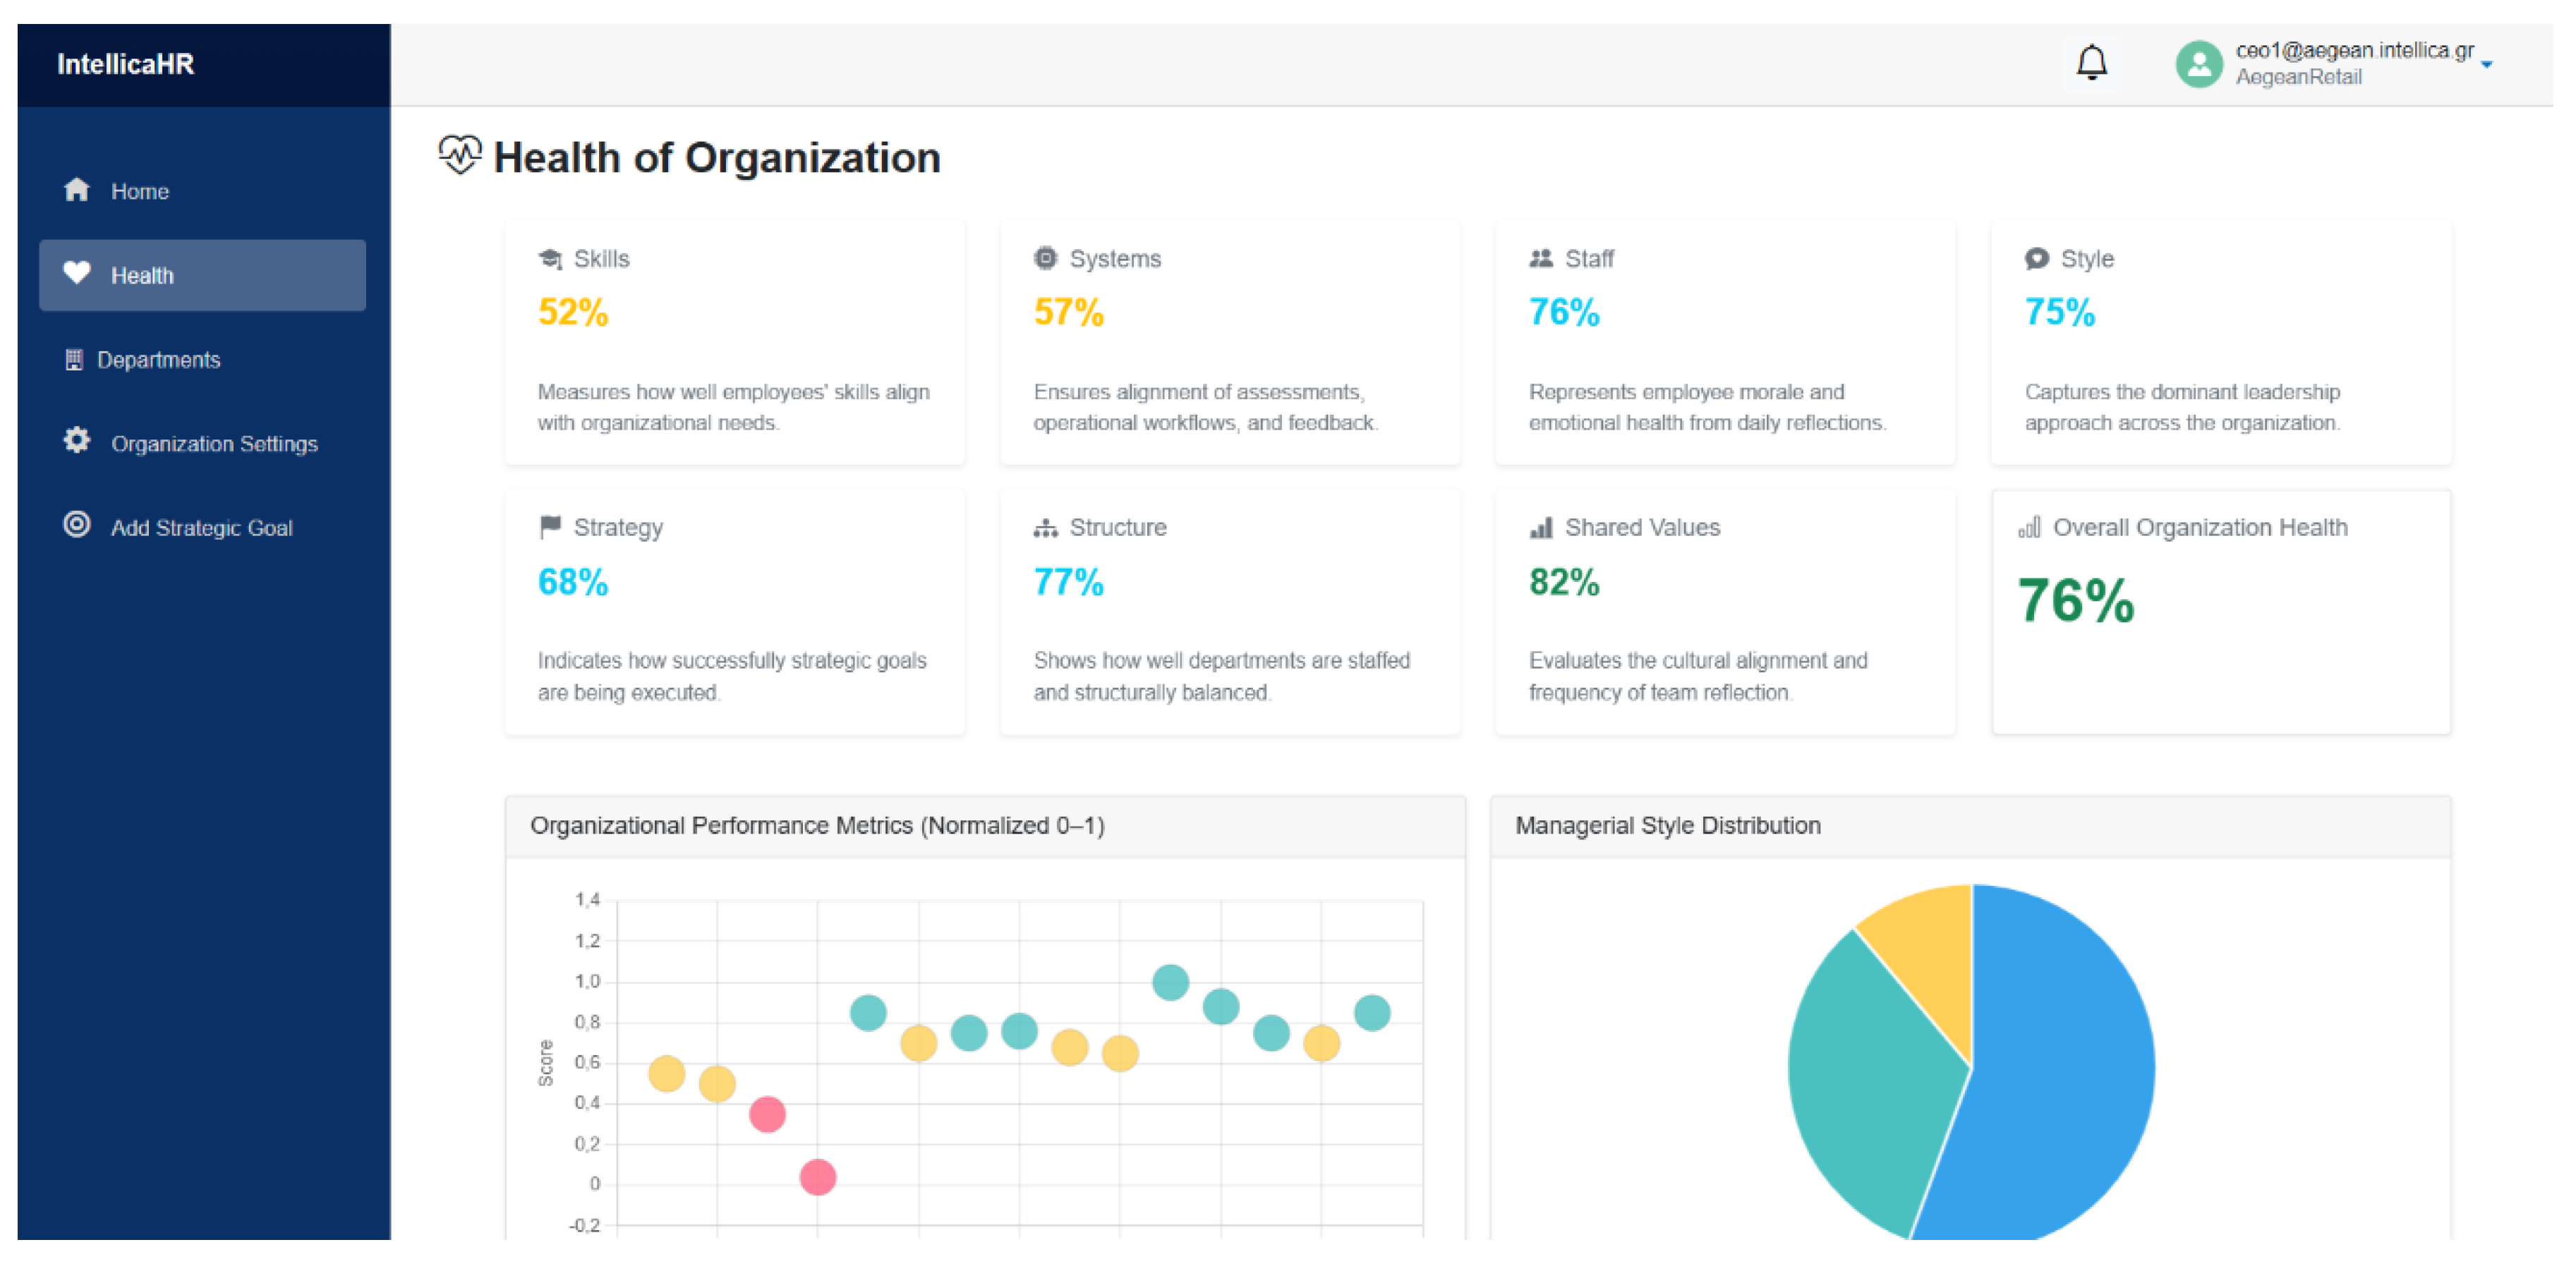
Figure 18.
CEO’s Organizational Insights and Recommendations Dashboard.
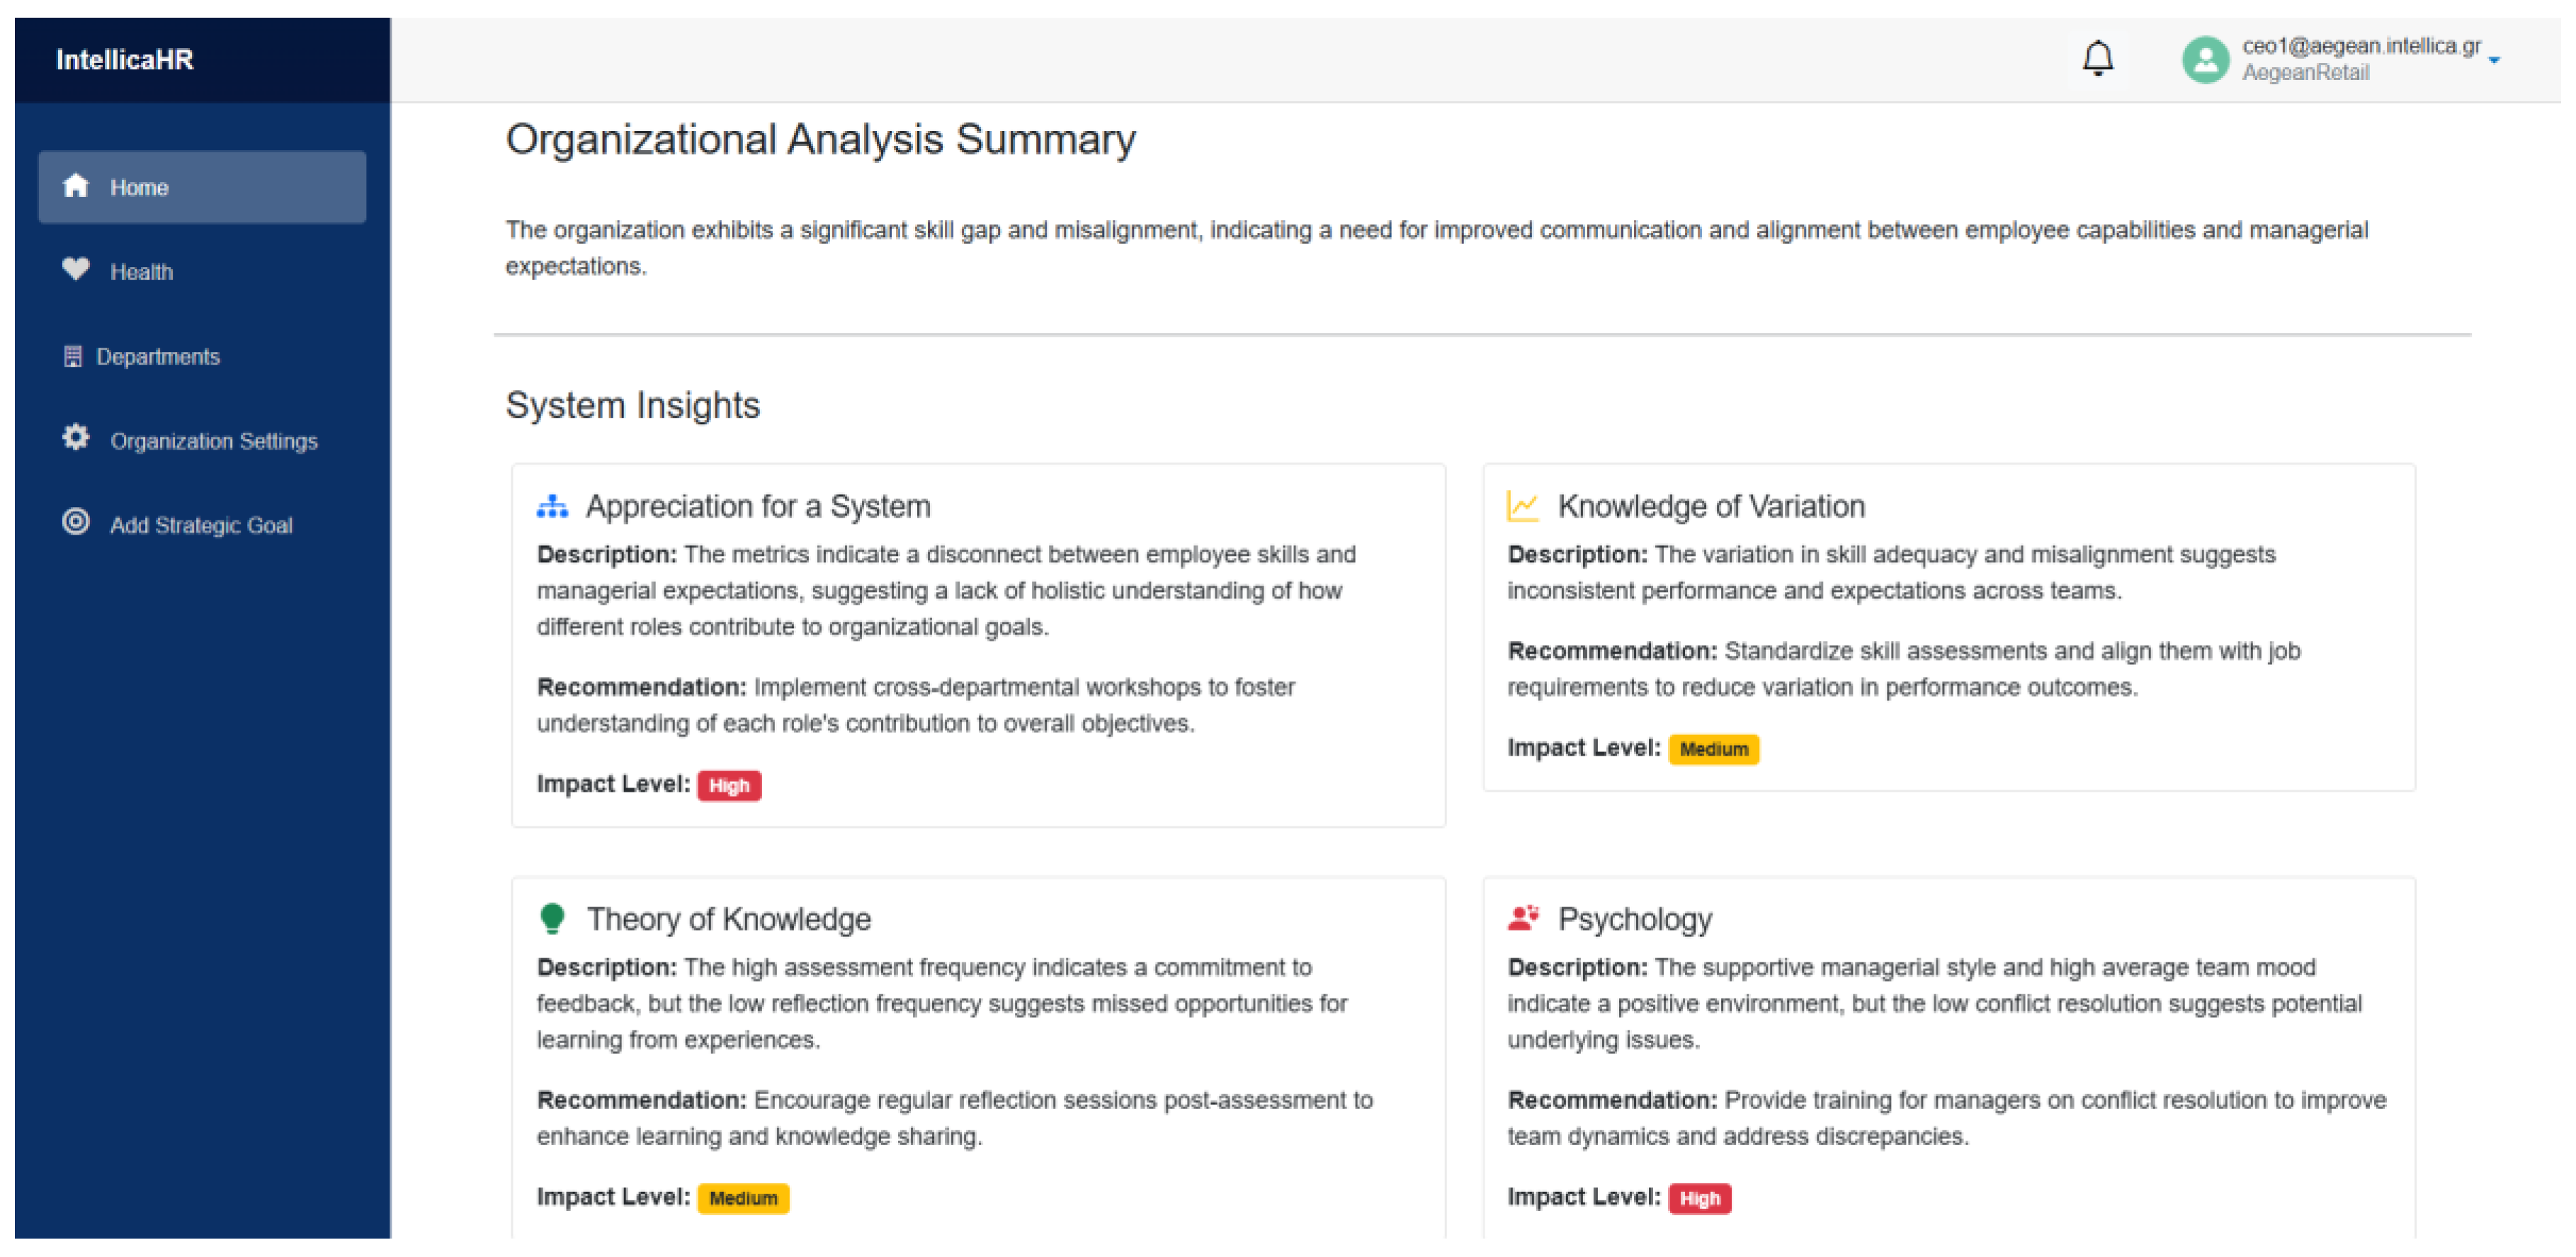
Figure 19.
Manager’s Health of Department Dashboard for the Operations Department.
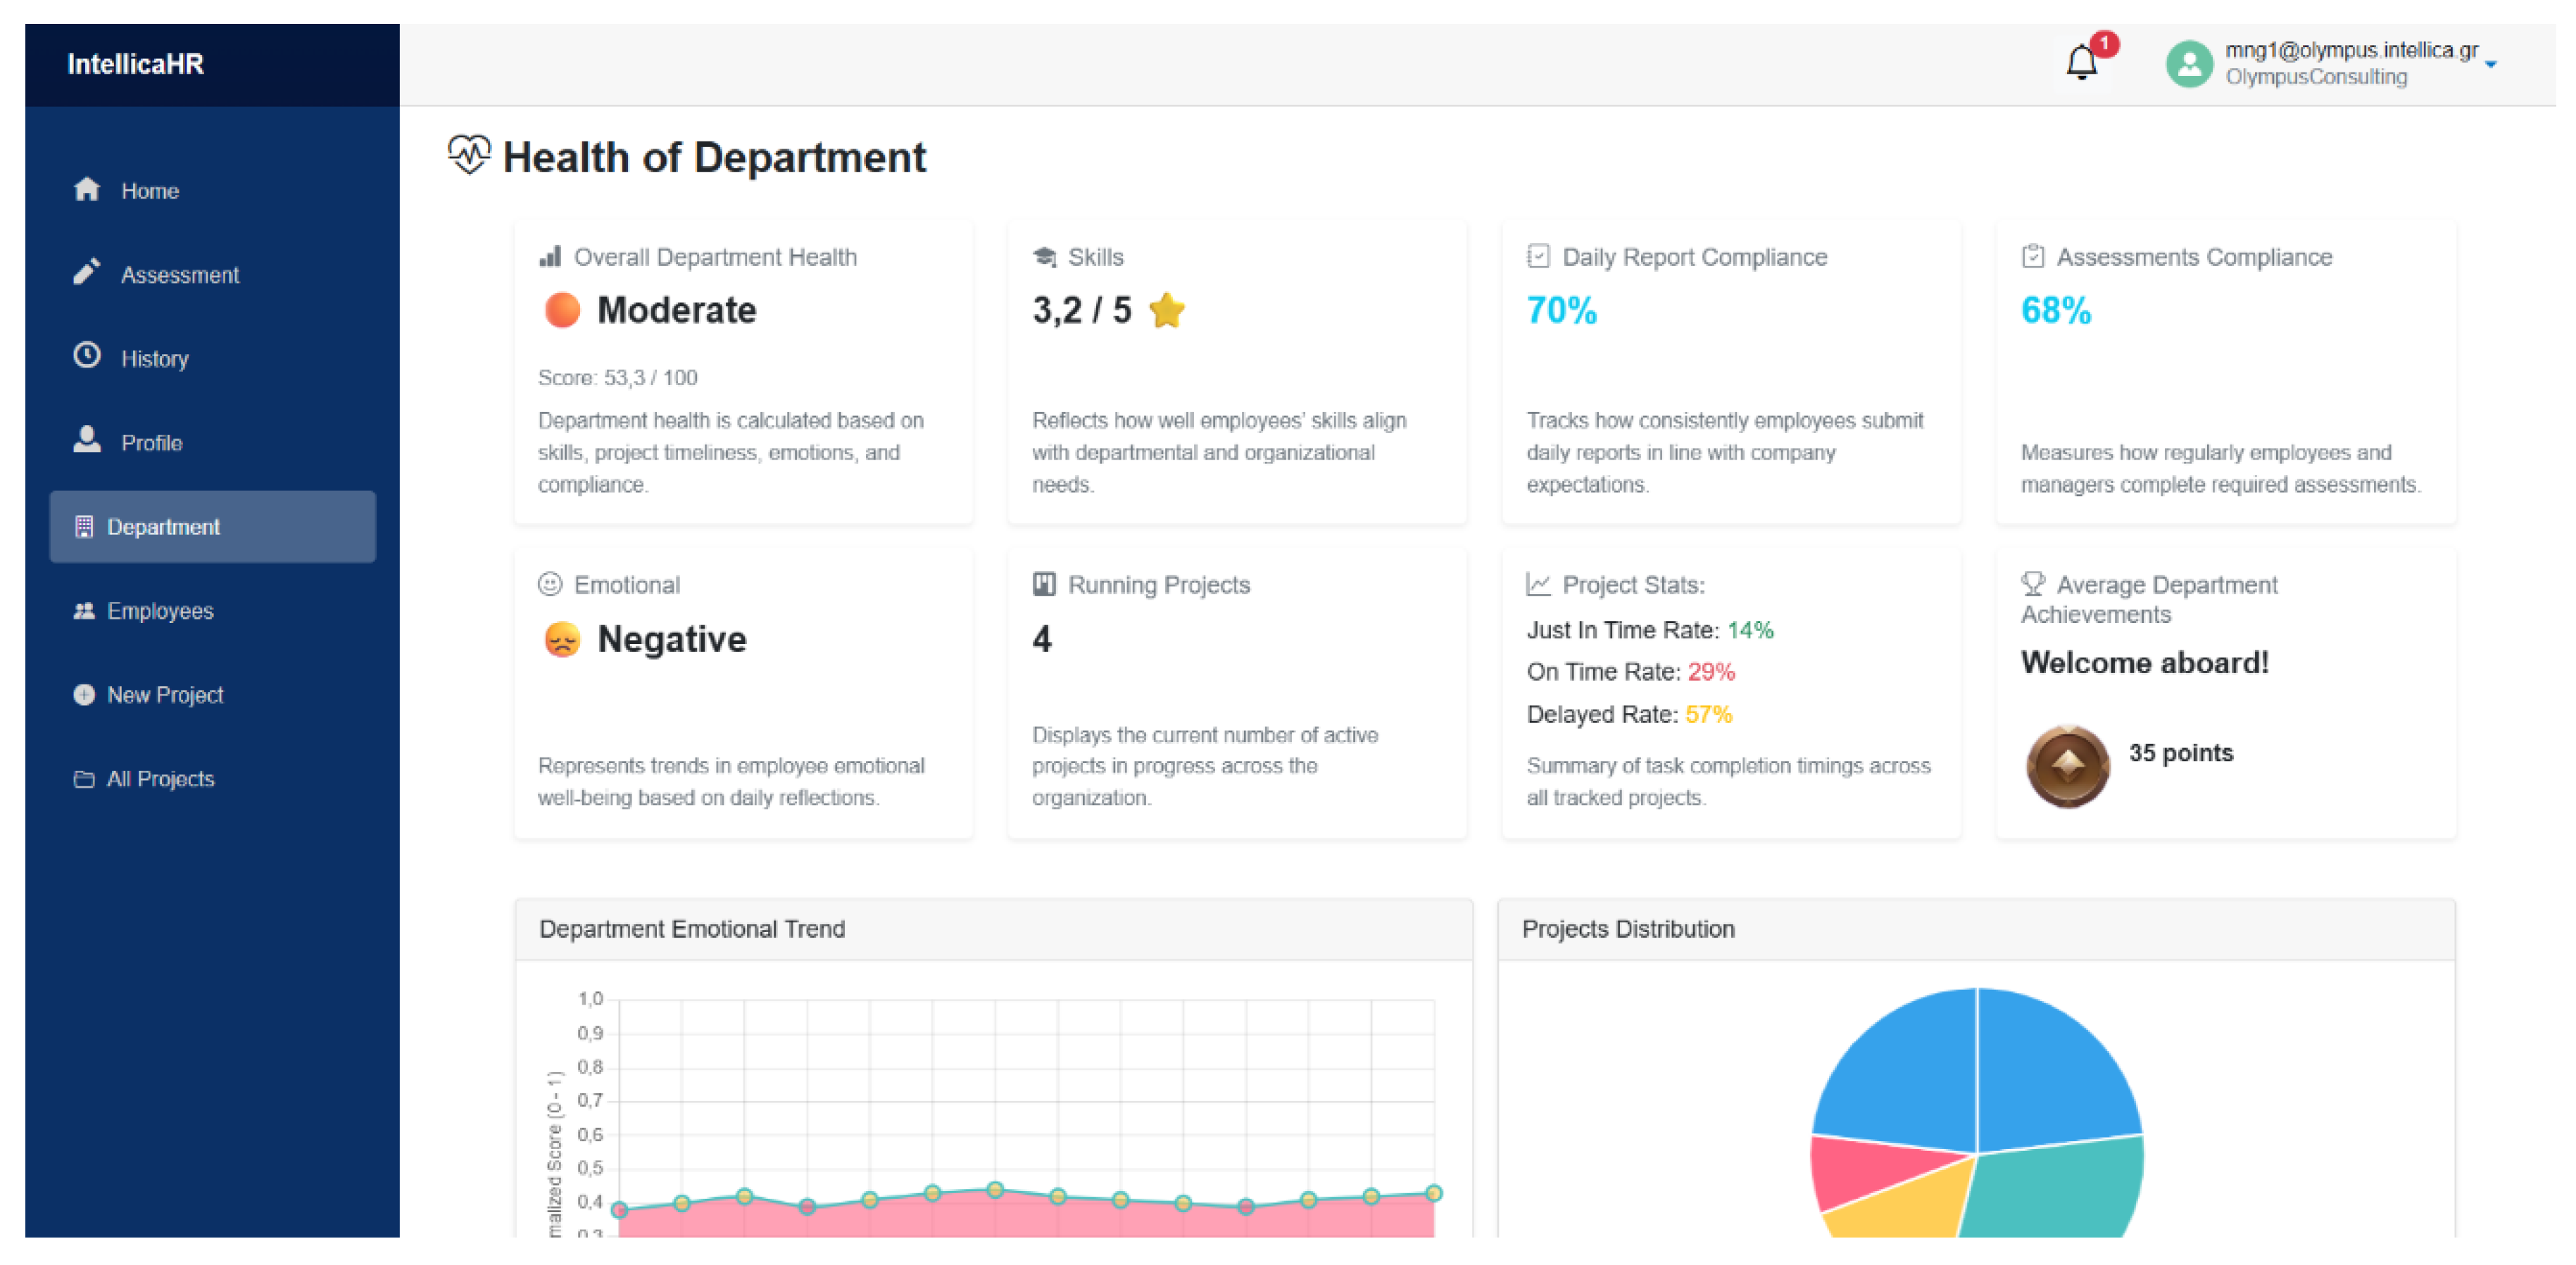
Figure 20.
CEO’s Health of Organization Dashboard.
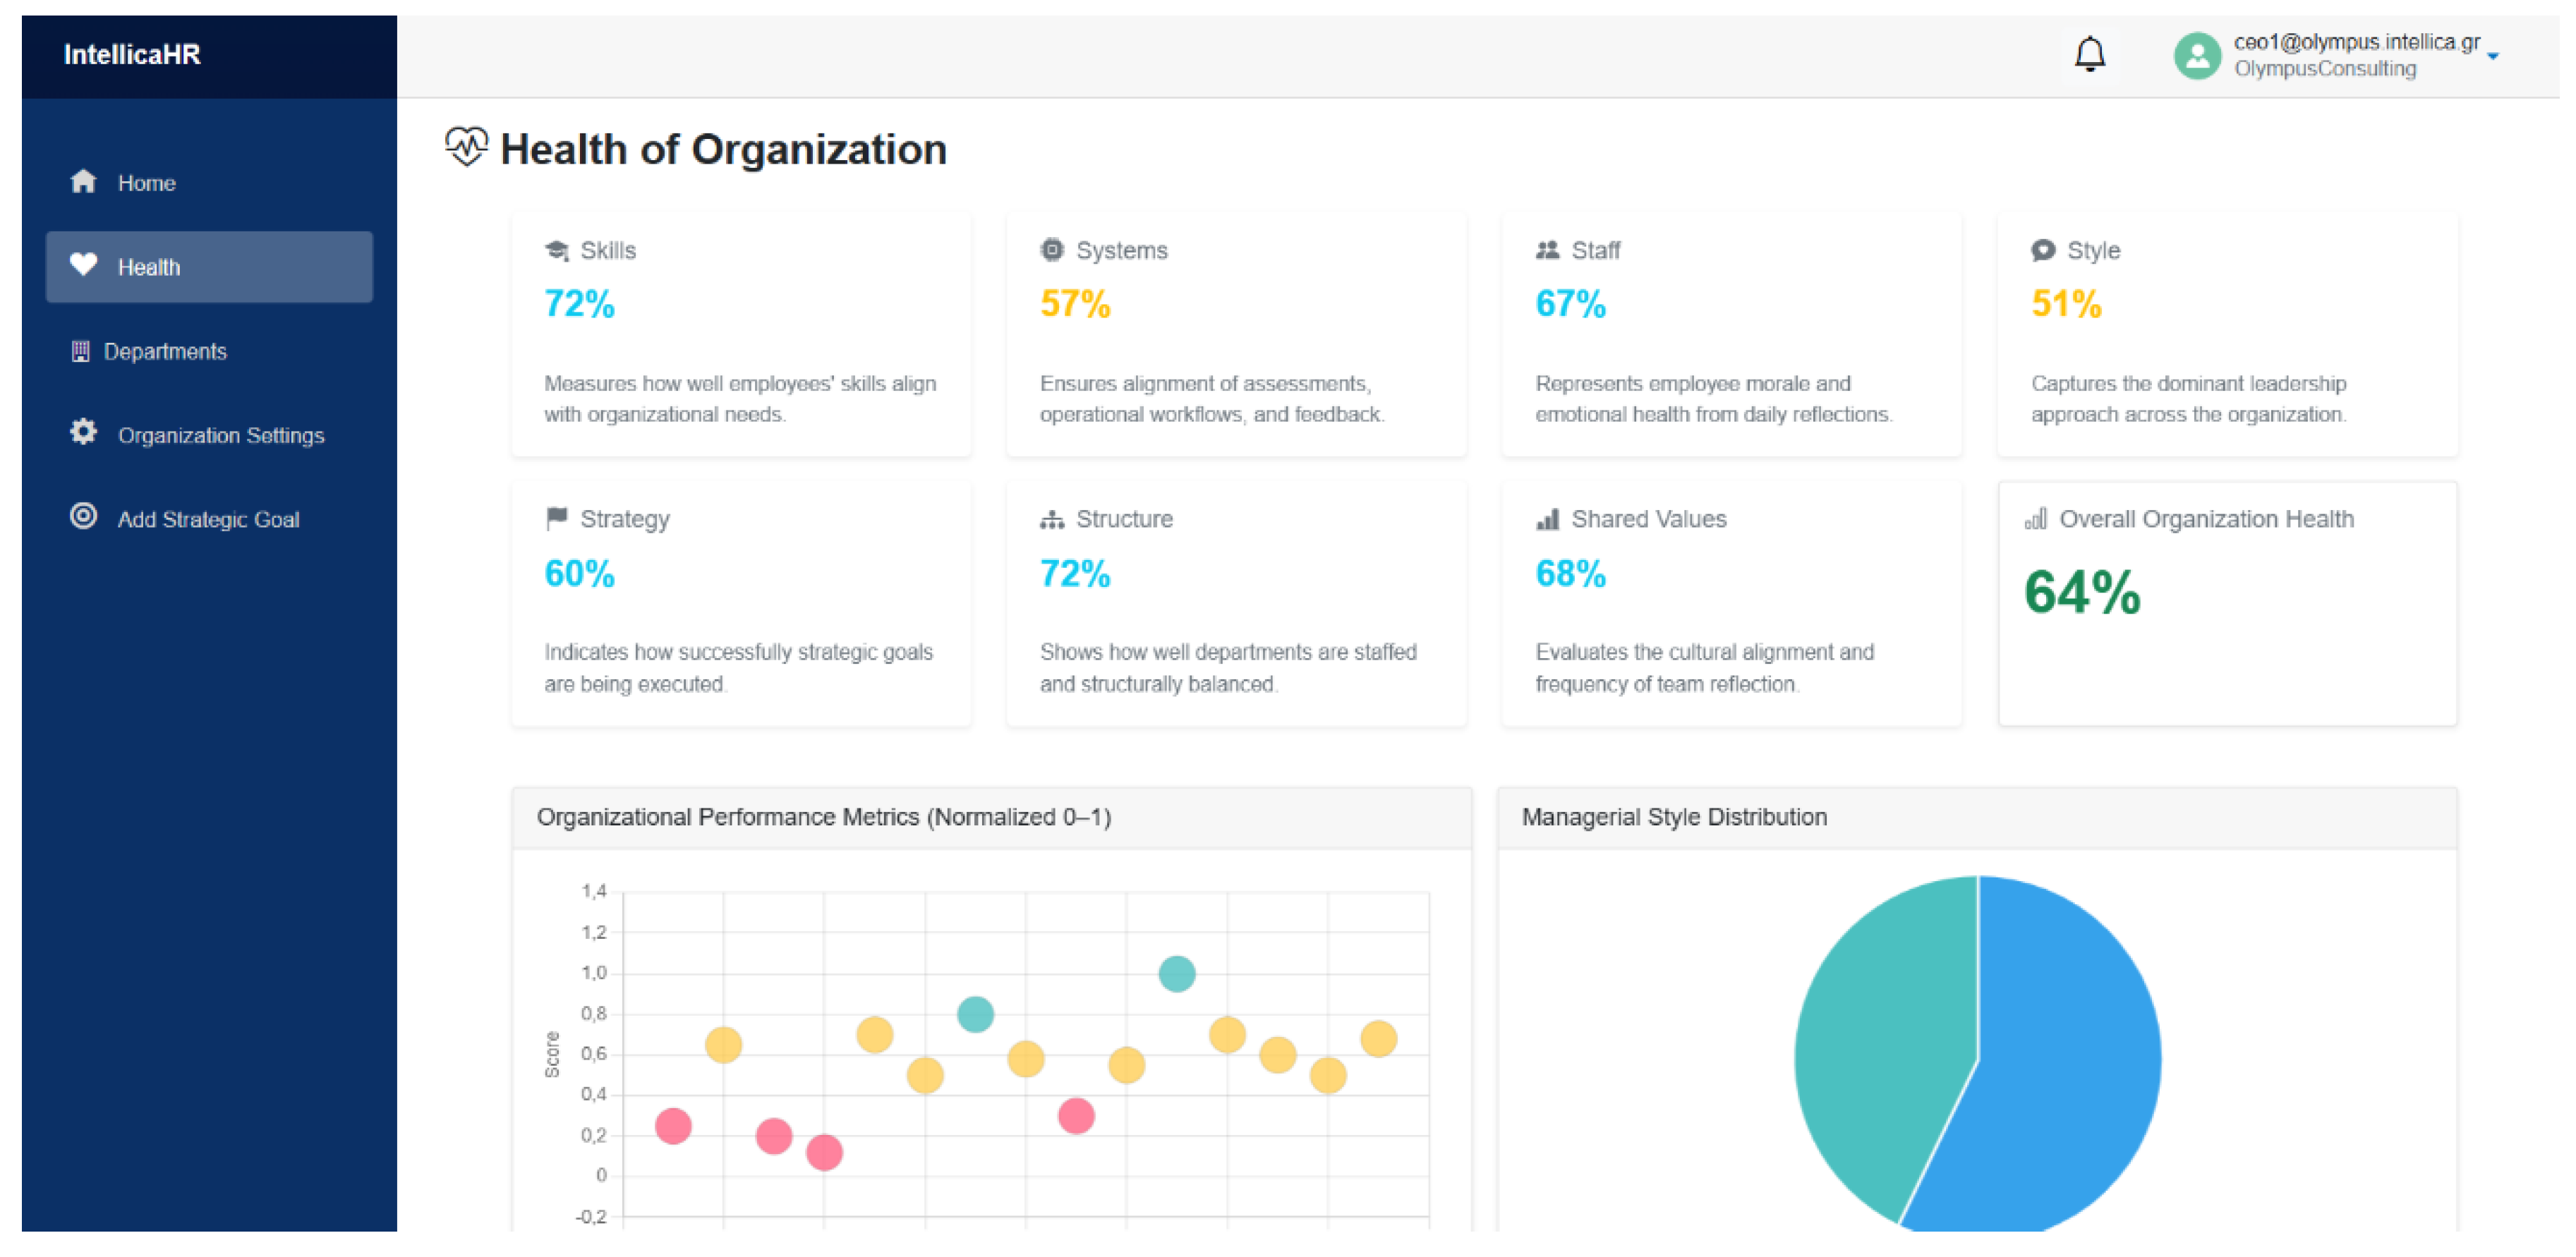
Figure 21.
CEO’s Organizational Insights and Recommendations Dashboard.
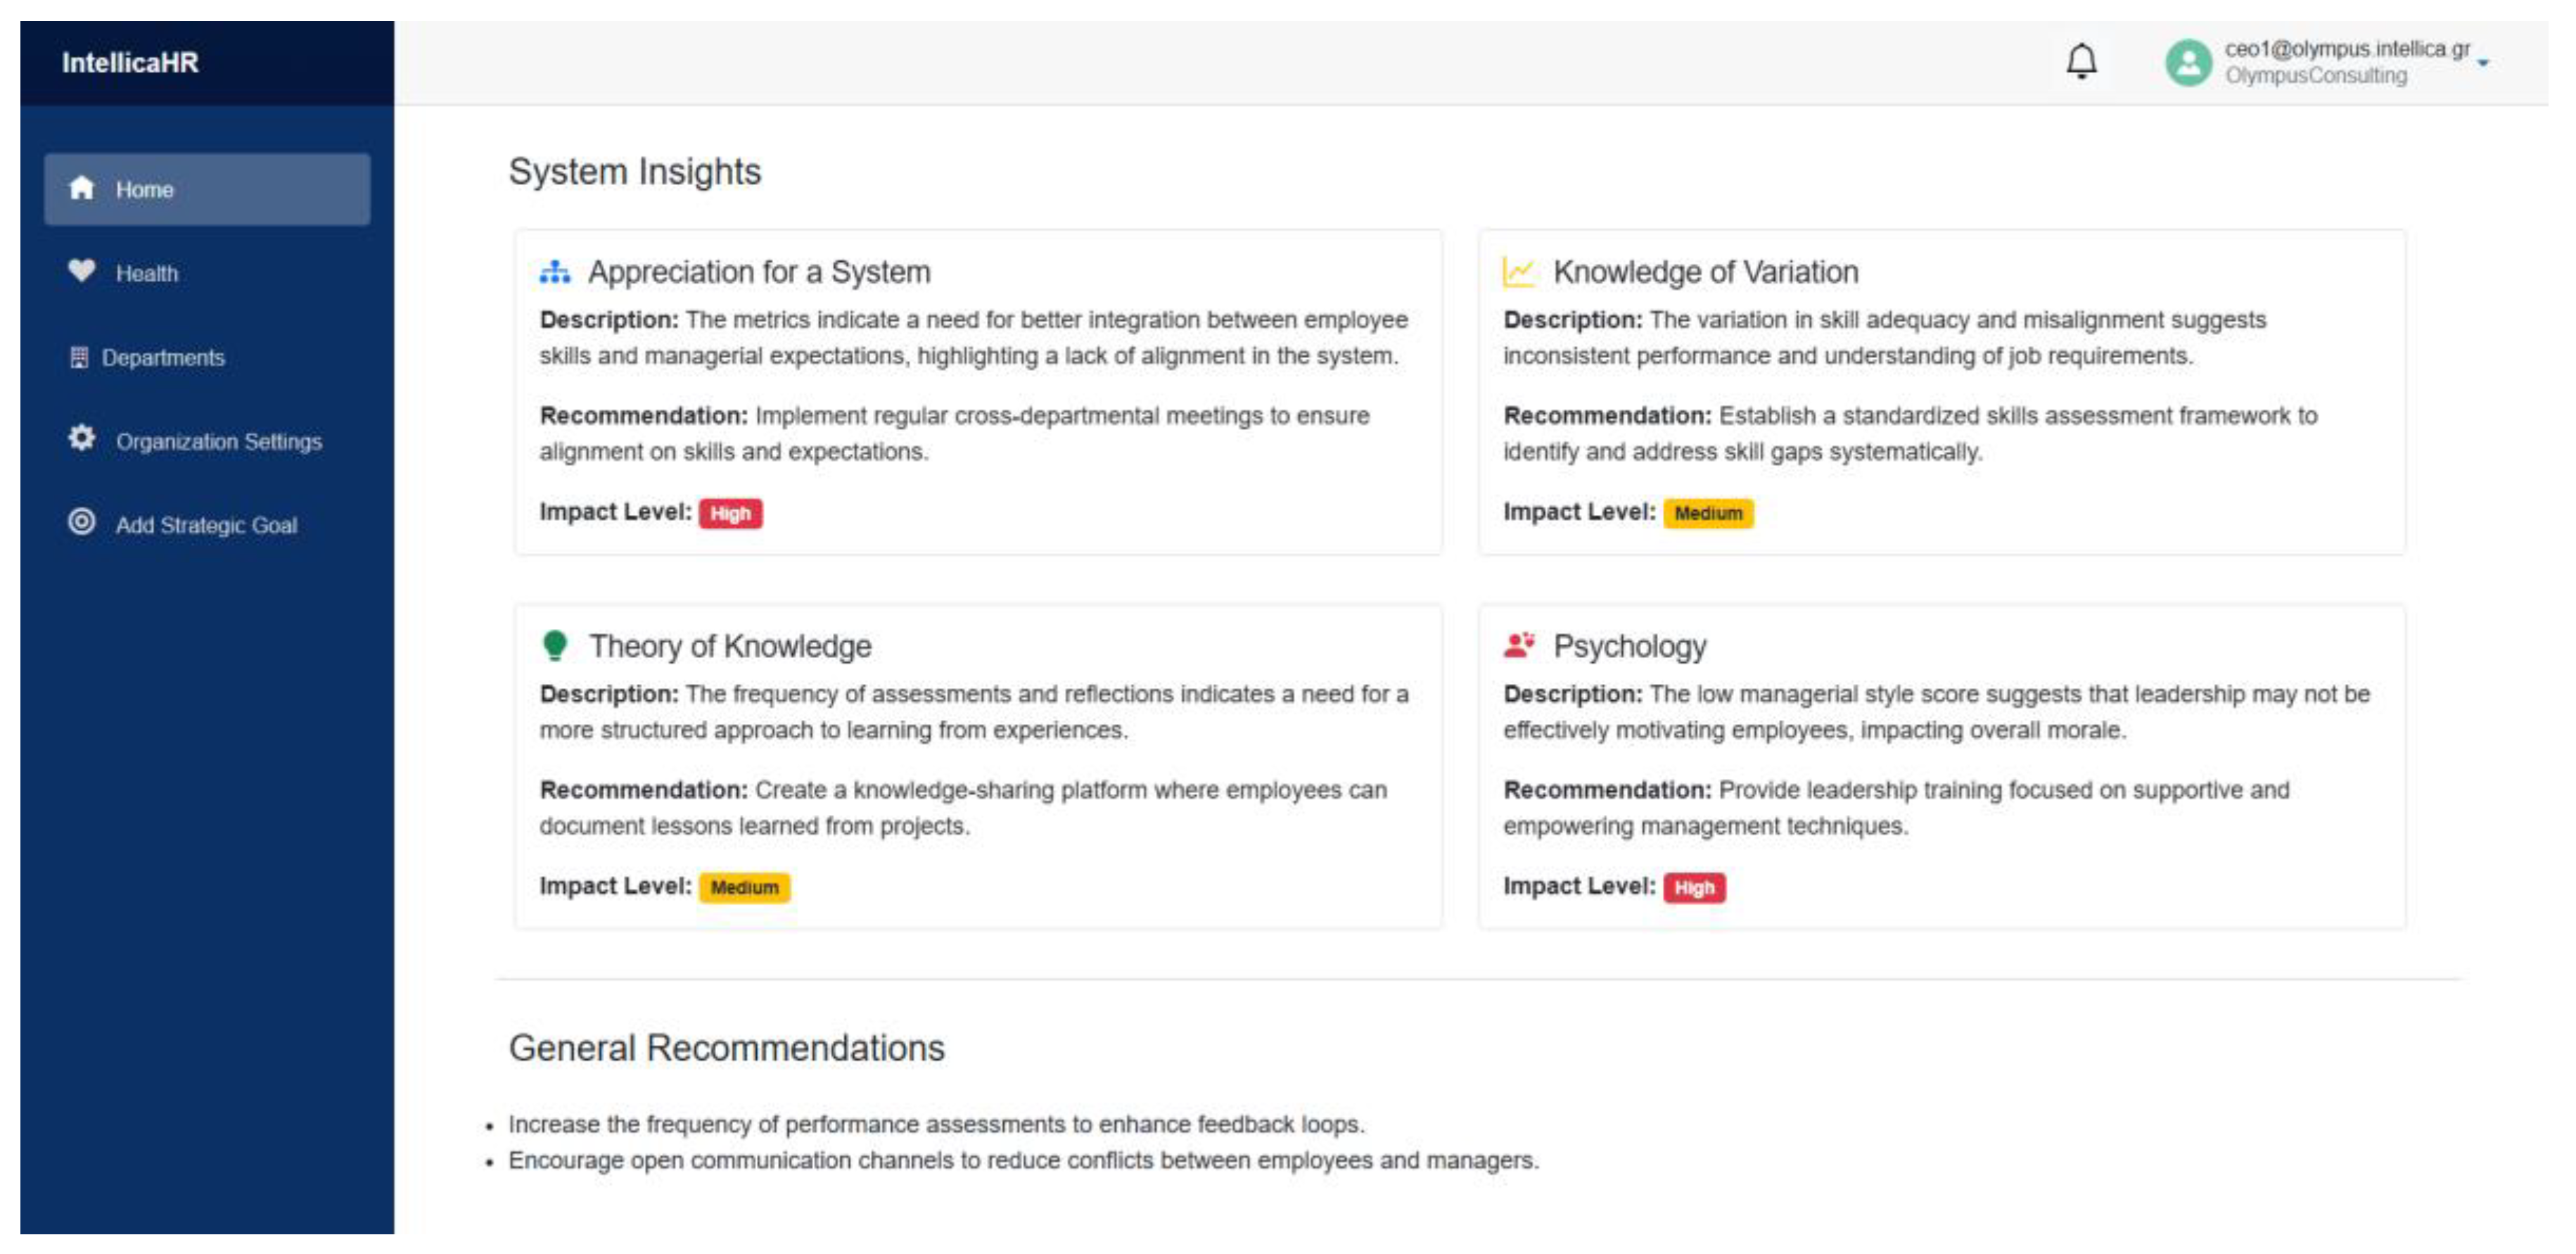
Figure 22.
Manager–Employee Perception Gap Across Key Departmental Dimensions.
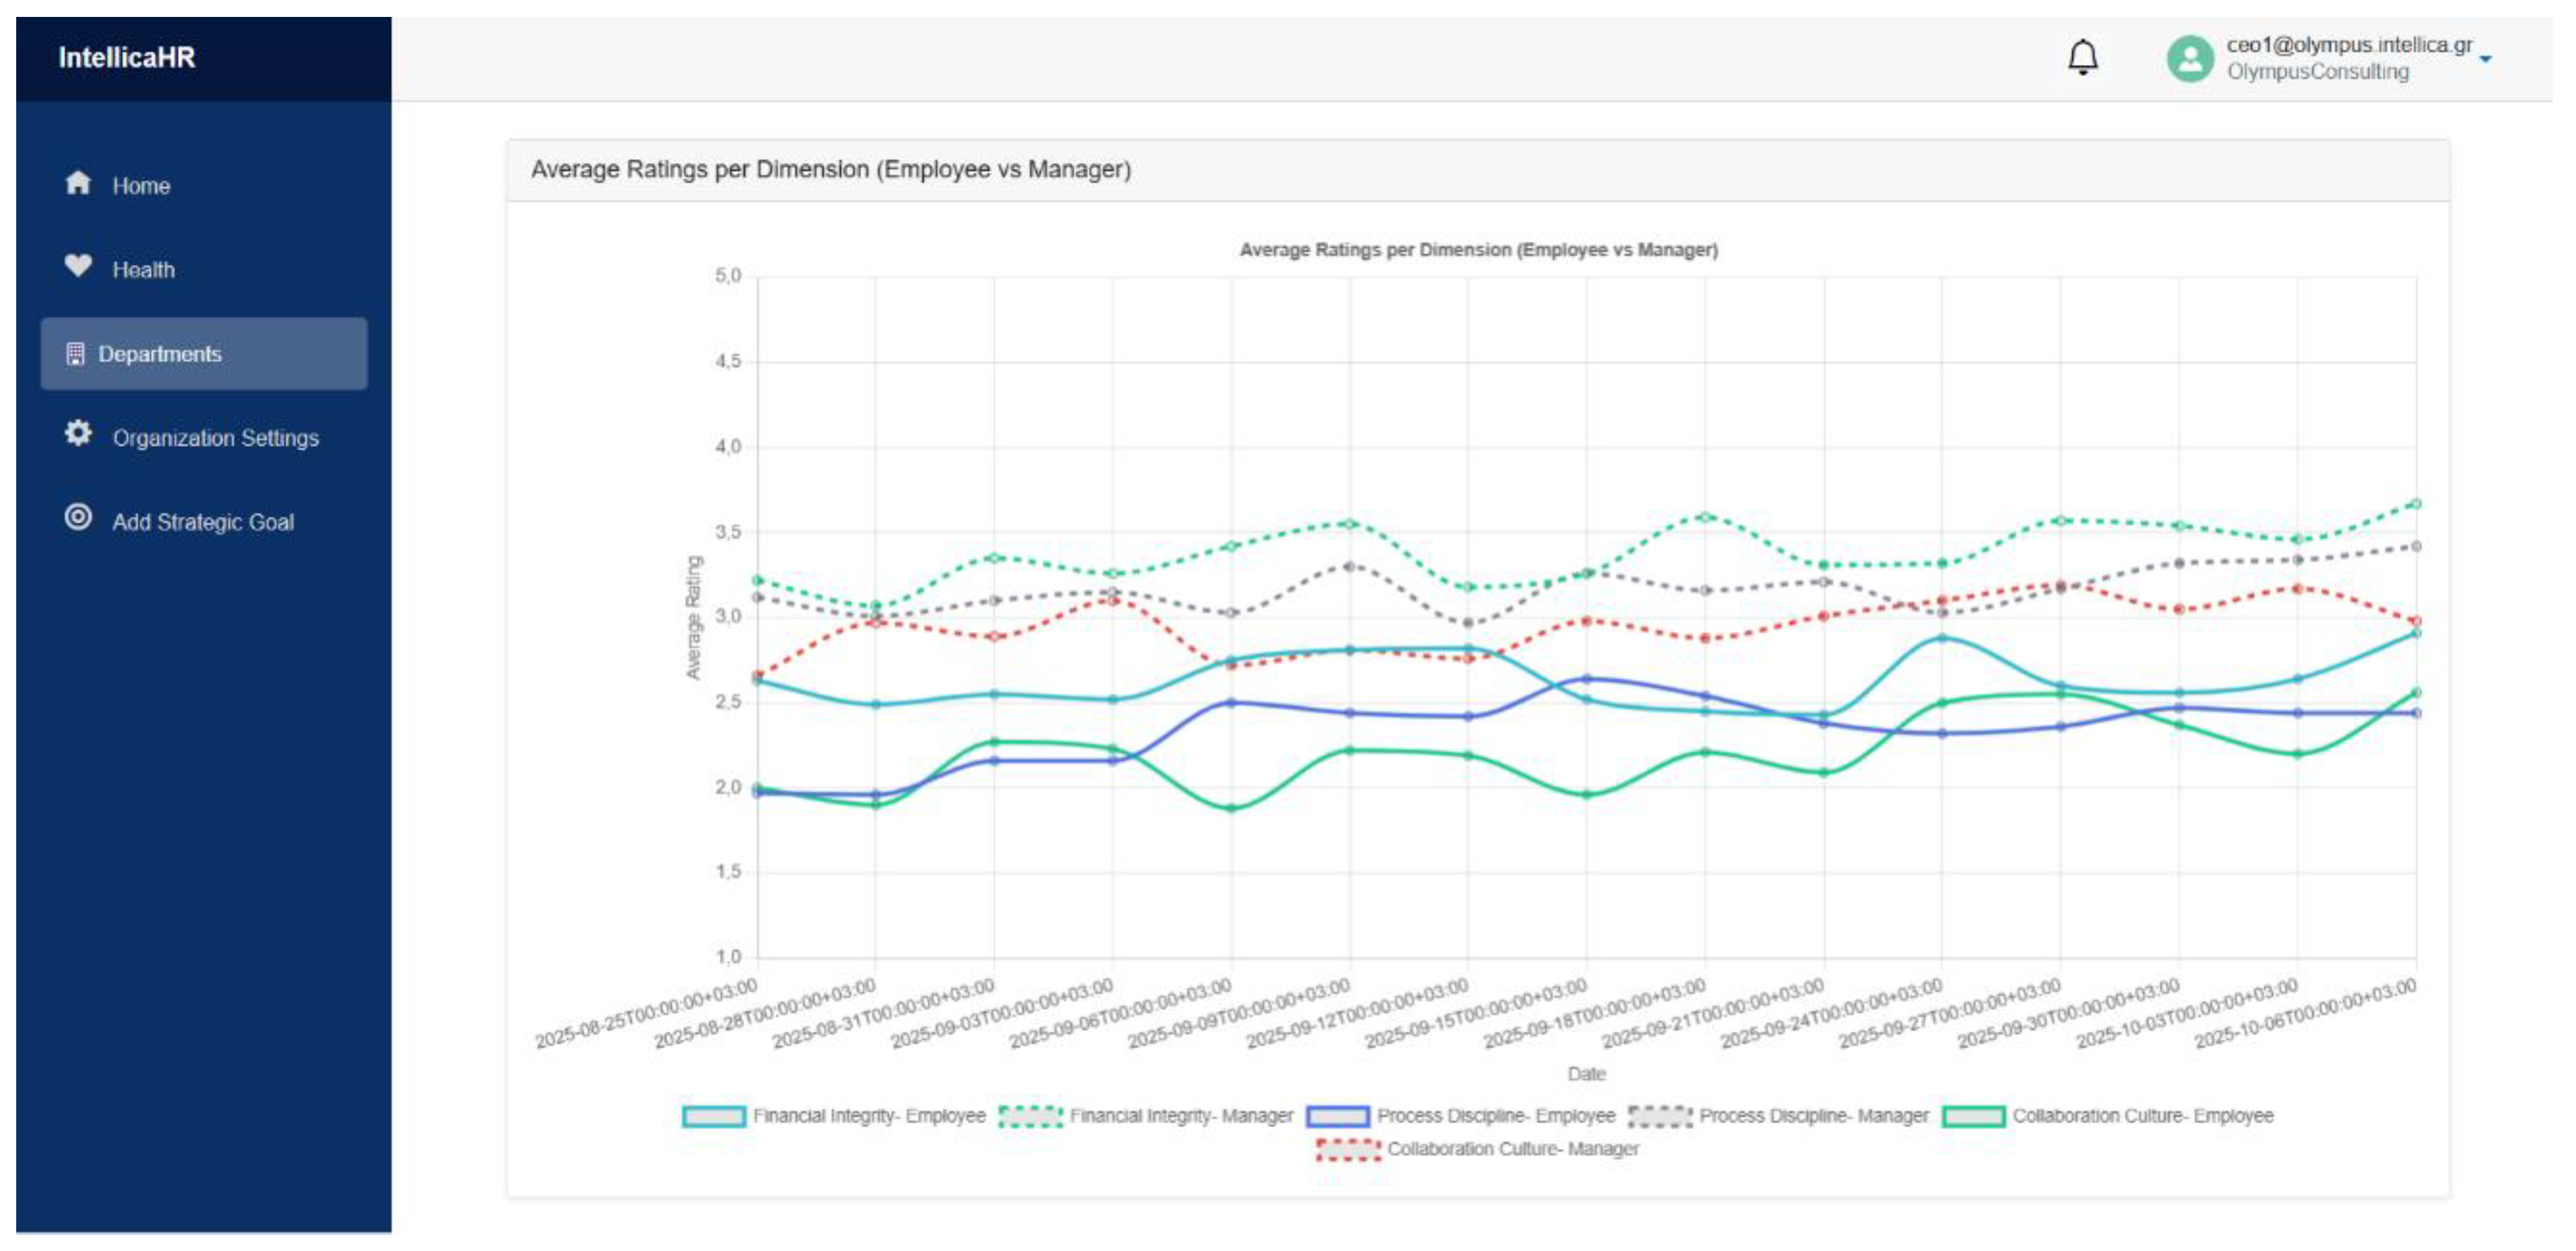

Table 1.
Organizational Performance Metrics Mapped to McKinsey 7S Dimensions.
| Metric | 7S Dimension | Barrier/Challenge Addressed | References |
|---|---|---|---|
| Skill Gap, Skill Adequacy |
Skills | Lack of digital/technical competency; insufficient training |
[6,9,31,33] |
| Misaligned Skills | Shared Values, Style | Organizational misalignment, conflicting evaluations, and poor collaboration | [6,9,31,33] |
| Manager–Employee Conflict | Shared Values, Style | Interpersonal conflict, leadership friction, and low trust | [6,31] |
| Managerial Style, CEO Strategic Style |
Style, Strategy | Ineffective leadership, weak engagement, and unclear strategic vision | [6,31] |
| Assessment Frequency, Assessment Compliance | Systems | Absence of structured evaluation; weak performance monitoring | [33] |
| Reflection Frequency, Daily Emotions | Shared Values, Style | Lack of feedback culture; resistance to change; low psychological safety | [31] |
| Organizational Structure Coverage | Structure | Unclear responsibilities; underdeveloped hierarchy | [6] |
| Project Timeliness, Manager Responses | Strategy, Systems | Poor planning; fragmented execution; low accountability | [6,9] |
| Daily Report Compliance, Goal Reporting | Systems, Style | Inadequate communication; weak responsiveness; limited support | [31] |
Table 2.
Overview of Organizational Performance Metrics Collected in IntellicaHR.
| Metric | Description | Computation Method | Interpretation | Scale |
|---|---|---|---|---|
| Skill Gap | Measures the extent to which employee competencies fall short of the required proficiency levels for their roles. | Where:: Mean employee skill proficiency score, where very low: 0, low: 1, neutral: 2, good: 3, high: 4, very high: 5 | Higher values indicate greater deficiencies between required and current employee skills. | 0–1 |
| Skill Adequacy | Indicates how well current employee skills meet or exceed job expectations and role requirements. | Higher values indicate greater alignment between employee skills and job requirements. | 0–1 | |
| Misaligned Skills | Downward disagreement occurs when managers rate an employee’s skills below the system-estimated proficiency level. |
Where: : Employee rating for skill s by the System: Manager rating for the same skill: Total number of skills assessed |
Higher values indicate stricter evaluations or calibration misalignment. | 0–1 |
| Manager–Employee Conflict | Quantifies disagreement between managerial and employee perceptions across performance, culture, or skill dimensions. |
Where: : Average manager rating on dimension i: Average employee rating on dimension i: Total number of dimensions |
Higher values indicate greater gaps between manager and employee ratings, signaling misalignment in perceptions or expectations. | 0-1 |
| Daily Emotions | Represents the overall emotional tone extracted from employee reflections, ranging from negative to positive sentiment. |
Where: : is the numerical value of the average emotion, where very negative = 0, negative = 1, neutral = 2, positive = 3, very positive = 4 |
Higher values indicate a more positive emotional tone and employee sentiment in (daily) reflection reports. | 0–1 |
| Assessment Frequency | Assesses how the CEO sets intervals for assessment reports, reflecting leadership monitoring style—from frequent oversight to greater autonomy. | Where d: Assessment interval days as determined by the CEO. | Higher values indicate more frequent performance evaluations under stricter, more hands-on leadership oversight. | 0–1 |
| Reflection Frequency | Assesses how the CEO sets an interval for daily Reflection reporting, reflecting leadership emphasis on continuous feedback. |
Where d: Reflection reports interval days as determined by the CEO. |
Higher values indicate a stronger focus on continuous learning, accountability, and engagement. | 0–1 |
| Organizational Structure Coverage | Assesses how many departments have both an active manager and employees, indicating structural completeness. |
Where: : Departments with both managers and employees: Departments with at least one member |
Higher values reflect a more complete, healthy structure with departments properly staffed at both managerial and employee levels. | 0–1 |
| Managerial Style | Represents the weighted distribution of managerial behaviors (empowering, supportive, directive, etc.) inferred from communication patterns. |
Where: : Total number of management styles.: proportion of responses classified under managerial style k: Weight assigned to management style k, where empowering: 1.00, supportive: 0.85, transactional: 0.65, directive: 0.40, autocratic: 0.20 |
Higher values represent a stronger tendency toward empowering, supportive, or autonomy-oriented managerial behavior. | 0–1 |
| CEO Strategic Style | Summarizes the CEO’s dominant leadership orientation (visionary, operational, adaptive, etc.) based on documented decisions and responses to communications. |
Where: : Total number of strategic leadership styles.: Proportion of responses classified under strategic style k: Weight assigned to strategic style k, where visionary: 1.00, innovative: 0.95, adaptive: 0.90, people-centric: 0.85, operational: 0.60, metric-driven: 0.60 |
Higher values reflect leadership that leans toward visionary, adaptive, or innovation-driven decision-making patterns. | 0–1 |
| Project Timeliness | Indicates the proportion of projects completed on schedule, reflecting organizational execution and delivery performance. | Higher values indicate stronger execution capability and better on-time project delivery performance. | 0–1 | |
| Daily Report Compliance | Measures how consistently employees submit required (daily) Reflection reports relative to expectations. |
Where: : Total number of submitted reports by employees: Total number of reports expected to be submitted, as determined by the CEO. |
Higher values represent stronger reporting discipline and employee adherence to daily reporting expectations. | 0–1 |
| Assessment Compliance | Tracks the degree to which required assessments (managerial and employee) are completed within expected timelines, as determined by the CEO. |
Where: : Total number of submitted assessments by both employees and managers.: Total number of assessments expected to be submitted, as determined by the CEO. |
Higher values indicate better adherence to planned assessment cycles and alignment with organizational review protocols. | 0–1 |
| Goal Reporting | Represents the frequency of employee reporting related to assigned project goals, indicating engagement in structured progress tracking. |
Where: : Number of submitted goal-related reports.: Number of project goals being tracked. |
Higher values reflect stronger employee engagement with project goals and structured progress reporting. | 0–1 |
| Manager Responses | Measures how often managers provide feedback on submitted reports, reflecting responsiveness and leadership involvement. |
Where: : Number of manager responses to project goal reports.: Number of submitted goal-related reports by Employees. |
Higher values indicate stronger managerial engagement in reviewing and responding to employee reports, reflecting active leadership involvement. | 0–1 |
Table 3.
Pattern Constraints (PS) Grounded in Observed Metric Patterns and Operationalized as Fuzzy Rules.
Table 3.
Pattern Constraints (PS) Grounded in Observed Metric Patterns and Operationalized as Fuzzy Rules.
| PS | Metric(s) Explained | Literature-Grounded Explanation | Generation-Oriented Fuzzy Rule | References |
|---|---|---|---|---|
| PS-1 | Daily Emotions, Reflection Frequency | Supportive and health-oriented leadership promotes positive emotional states and reflective engagement, whereas toxic environments increase emotional exhaustion and gradually reduce employees’ willingness to reflect. |
IF Organizational Environment is Healthy THEN Emotional Tone is HIGH AND Reflection Frequency is HIGH. IF Organizational Environment is Toxic THEN Emotional Tone is LOW AND Reflection Frequency is LOW. |
[2,17,18,59,61,65,79] |
| PS-2 | Daily Report Compliance, Assessment Compliance | Toxic leadership is associated with withdrawal, workplace deviance, and reduced participation, while supportive leadership encourages more consistent engagement in reporting and assessment activities. |
IF Leadership Toxicity is HIGH THEN Report Compliance is LOW AND Assessment Compliance is LOW. IF Leadership Toxicity is LOW THEN Report Compliance is HIGH AND Assessment Compliance is HIGH. |
[1,2,17,59,79,84] |
| PS-3 | Manager–Employee Conflict, Manager Responses | Repeated toxic leadership and communication behaviors weaken trust, increase manager–employee conflict, and reduce constructive managerial communication and responsiveness. |
IF Leadership Toxicity is HIGH THEN Communication Tone is LOW AND Conflict Level is HIGH AND Manager Response Rate is LOW. IF Leadership Toxicity is LOW THEN Communication Tone is HIGH, AND Conflict Level is LOW AND Manager Response Rate is HIGH. |
[2,17,29,53,59,68,83] |
| PS-4 | Skill Gap, Skill Adequacy | Skill gaps arise when employee competencies do not sufficiently align with role, task, technological, or organizational requirements, resulting in lower skill adequacy. |
IF Organizational Misalignment is HIGH THEN Skill Gap is HIGH AND Skill Adequacy is LOW. IF Organizational Misalignment is LOW THEN Skill Gap is LOW AND Skill Adequacy is HIGH. |
[33,40,46,51,60,82] |
| PS-5 | Project Timeliness, Goal Reporting | Skill gaps can disrupt coordination and task execution, increasing the likelihood of delayed project delivery and less consistent progress and goal reporting. |
IF Skill Gap is HIGH THEN Project Timeliness is LOW AND Goal Reporting is LOW. IF Skill Gap is LOW THEN Project Timeliness is HIGH AND Goal Reporting is HIGH. |
[3,40,46,60,78,82,84] |
| PS-6 | Manager–Employee Conflict, Daily Emotions | Manager–employee conflict and daily emotional states develop through repeated interactions shaped by managerial behavior, executive leadership, and the broader organizational climate. |
IF Manager Style is LOW, AND CEO Style is LOW, THEN Conflict Level is HIGH AND Daily Emotions are LOW. IF Manager Style is HIGH AND CEO Style is HIGH THEN Conflict Level is LOW AND Daily Emotions are HIGH. |
[2,17,29,53,59,68,79,83] |
Table 4.
Scenario-level target linguistic states used to condition synthetic organizational interaction generation.
Table 4.
Scenario-level target linguistic states used to condition synthetic organizational interaction generation.
| Variable | Healthy | Skill-Misaligned | Toxic Management |
|---|---|---|---|
| Emotional Tone | HIGH | Unconstrained | LOW |
| Communication Tone | HIGH | Unconstrained | LOW |
| Conflict Expression | LOW | LOW | HIGH |
| Reflection Frequency | HIGH | Unconstrained | LOW |
| Report Compliance | HIGH | HIGH | LOW |
| Assessment Compliance | HIGH | HIGH | LOW |
| Skill Alignment | HIGH | LOW | Unconstrained |
| Skill Gap | LOW | HIGH | Unconstrained |
| Skill Adequacy | HIGH | LOW | Unconstrained |
| Manager Responses | HIGH | HIGH | LOW |
| Managerial Support | HIGH | HIGH | LOW |
| Project Timeliness | HIGH | LOW | LOW |
| Goal Reporting | HIGH | LOW | LOW |
Table 5.
Operational interpretation of fuzzy-derived values.
| Fuzzy Variable Type | Examples | Value Type | Meaning of Normalized Value (p) | Example Interpretation |
|---|---|---|---|---|
| Daily behavioral events | Daily report, reflection submission | Probability or expected frequency across the 45-day simulation | = 0.80 means about 36 expected submissions | |
| Scheduled events | Assessments | Probability of completion when the assessment is due | = 0.70 means a 70% chance of submitting each scheduled assessment | |
| Response events | Manager responses | Probability of responding to eligible employee updates or reports | = 0.30 means about 30% of eligible updates receive responses | |
| Project events | Project updates, goal reports | Probability or expected frequency of progress-related reporting | Higher produces more frequent updates or goal reports | |
| Semantic tone | Emotional tone, communication tone | LLM-conditioning intensity for emotional or communicative tone | Higher produces more positive or supportive language | |
| Relational climate | Conflict expression, managerial support | LLM-conditioning intensity for tension, disagreement, or supportiveness | Higher conflict produces stronger tension or disagreement | |
| Skill-alignment semantics | Skill confidence, perceived capability, capability concern | LLM-conditioning intensity for capability-related framing | Lower skill-alignment produces stronger capability-gap language |
Table 6.
Role-based LLM-generated artifacts are used during synthetic organizational data generation.
Table 6.
Role-based LLM-generated artifacts are used during synthetic organizational data generation.
| Role | LLM-Generated Synthetic Artifacts |
|---|---|
| CEO | Strategic objectives; executive directives; assessment configuration; assessment dimensions; reflection/reporting configuration; assessment intervals. |
| Manager | Project definitions; project goals; deadlines; manager reports; manager responses to employee reports or updates; assessment responses; skill-rating revisions. |
| Employee | Synthetic CV; daily reflections/reports; project updates; goal reports; assessment responses; responses or clarifications to manager feedback. |
Table 7.
Aggregated IntellicaHR Analytic Metrics Across the Three Simulated Virtual Organizations.
| Metric | Healthy Scenario | Skill-Misaligned Scenario | Toxic Management Scenario |
|---|---|---|---|
| Skill Gap* | 0.10 | 0.55 | 0.25 |
| Skill Adequacy | 0.85 | 0.50 | 0.65 |
| Misaligned Skills* | 0.08 | 0.35 | 0.20 |
| Manager–Employee Conflict* | 0.05 | 0.18 | 0.60 |
| Assessment Frequency | 0.95 | 0.85 | 0.70 |
| Reflection Frequency | 0.90 | 0.70 | 0.50 |
| Organizational Structure Coverage | 0.92 | 0.75 | 0.80 |
| Project Timeliness | 0.90 | 0.65 | 0.55 |
| Daily Emotions | 0.70 | 0.51 | 0.30 |
| Daily Report Compliance | 0.93 | 0.88 | 0.70 |
| Goal Reporting | 0.95 | 0.75 | 0.60 |
| Manager Responses | 0.90 | 0.70 | 0.50 |
| Assessment Compliance | 0.91 | 0.85 | 0.68 |
| CEO Strategic Style | 0.85 | 0.76 | 0.58 |
| Managerial Style | 0.92 | 0.68 | 0.30 |
Disclaimer/Publisher’s Note: The statements, opinions and data contained in all publications are solely those of the individual author(s) and contributor(s) and not of MDPI and/or the editor(s). MDPI and/or the editor(s) disclaim responsibility for any injury to people or property resulting from any ideas, methods, instructions or products referred to in the content. |
© 2026 by the authors. Licensee MDPI, Basel, Switzerland. This article is an open access article distributed under the terms and conditions of the Creative Commons Attribution (CC BY) license (http://creativecommons.org/licenses/by/4.0/).
Copyright: This open access article is published under a Creative Commons CC BY 4.0 license, which permit the free download, distribution, and reuse, provided that the author and preprint are cited in any reuse.