
Submitted:
22 July 2026
Posted:
22 July 2026
You are already at the latest version
Abstract
Two breakwaters were constructed between 1959 and 1961 by the U.S. Army Corps of Engineers to form a harbor within Half Moon Bay on the central California coast. Prior to construction, the bay had a smooth hook-shaped or spiral form with a shoreline in equilibrium with waves refracted around a resistant point. Following breakwater completion, wave energy that had previously been dissipated along the equilibrium shoreline of the bay was concentrated at the downcoast end of the breakwater against the low weak bluffs. The original very low (~8 cm/year) bluff recession rates increased rapidly to as much as 2 m/year which led to the destruction of a county road and wastewater transmission line and began to threaten a state highway and a group of homes. Bluff erosion has progressed as far as 1.4 km downcoast which has led to rock revetment placement to protect the highway and homes. Breakwater planning also underestimated the potential for waves to enter the gap between the two breakwaters, so a dogleg extension had to be constructed. This also failed to reduce wave action, which led to construction of an additional set of breakwaters within the harbor to protect moored boats.
Keywords:
breakwaters
; coastal erosion
; harbors
; California coast
1. Introduction
Pillar Point Harbor lies in San Mateo County along the central California coast about 40 km south of San Francisco’s Golden Gate. It is the only protected small craft harbor between Santa Cruz (~83 km miles to the south) and Bodega Bay (~136 km to the north). Because of its location it provides an important safe refuge for vessels along this exposed and high wave energy section of California coastline and a protected port for a local fishing fleet. The harbor name and location have become more recognized in recent decades due to their location adjacent to Mavericks, a global big wave surfing location.
The 1769 Portolá Expedition were the first Spanish explorers to visit this area, and they initially named the prominent point, Cape Punta de Los Angeles Custodios (Guardian Angel Point). Within a few decades, however, as Spanish settlers and missionaries moved north and missions were established, the name transitioned to El Pilar or Los Pilares for the natural pillars of rock along the rocky headland.
This rugged coastline poses significant navigational hazards and has led to numerous shipwrecks due to fog, strong currents, large waves and a rocky shoreline. The many marine disasters include the grounding of the brig Isabelita Hyne in 1856, the bark Elfina Kniper in 1862, and the British ship Rydal Hall, which was wrecked in October 1876 while carrying coal from Wales to San Francisco. These shipwrecks led to a clearer awareness of the hazards along this stretch of coast and underscored the dangers that led to the construction of the Point Montara lighthouse tower several km north in 1928.
Prior to construction of the harbor breakwaters in 1959-1961, Half Moon Bay was a classic example of a hook-shaped bay (Figure 1; a log-spiral curve) [1], hence its name. These spiral-shaped bays are common along California’s coast (Figure 2) and elsewhere as well. They usually form where relatively weak or erodible materials are exposed adjacent to a more resistant headland or point, and where waves from a dominant direction refract around the resistant headland and erode the weaker rock adjacent to or downcoast from the point over time.
During the first half of the twentieth century this natural embayment was used by fishing boats as a partially protected anchorage, although severe winter storms, particularly from the west or southwest, would periodically threaten or damage boats anchored here.
During the Great Depression, the voters in San Mateo County approved the creation of the San Mateo County Harbor District with the objective of building a harbor, not on the ocean coast side of the county at Pillar Point, but on county shoreline on San Francisco Bay in Redwood City where a commercial port facility was envisioned. The Depression, however, and the economic downturn led to a lack of funding and changes in federal priorities, so this port on the bay didn’t materialize. Not to waste an opportunity, however, commercial fishermen and residents lobbied the Harbor District to move its focus to Pillar Point and Half Moon Bay for a harbor of refuge out of safety concerns for the local fishing fleet. The continuing economic conditions and then the beginning of World War II, however, brought a temporary halt to the proposed harbor of refuge. With the economic boom following the war, the U.S. Army Corps of Engineers initiated the construction of the Pillar Point Harbor.
Between 1959 and 1961, the Corps constructed two rock breakwaters extending across the mouth of the bay to provide protection. The east outer breakwater is 1,352 m in length, and a west outer breakwater is 800 m long (Figure 3). It soon became apparent, however, that these breakwaters didn’t provide protection from southwesterly storm waves that are common during large El Niño events. The western segment was therefore extended in 1967 by 320 m with the goal of blocking these waves. This solution also proved inadequate, so in 1982 an inner breakwater was constructed. The San Mateo County Harbor District completed the enclosure of the protected inner basin to minimize potential exposure to waves and provide slips for 369 boats (Figure 3).
2. Impacts of Breakwater Construction on the Half Moon Bay Shoreline
Historically, the prevailing waves from the northwest refracted or bent around the more resistant Pillar Point headland and gradually eroded the weak downcoast sediments into a nearly perfect, gradually uncoiling curve that distributed wave energy evenly along the shoreline. Through this process of wave refraction, the wave energy was spread out over a larger downcoast area and therefore had minimal impact on the shoreline. In this original configuration, the crests of the breaking waves were nearly parallel to the beach within the bay shoreline (Figure 1).
Through the dissipation of refracted wave energy within Half Moon Bay under pre-existing natural conditions and the littoral transport of sand along the inner bay, sand accumulated to form a narrow but nearly permanent beach that protected the low back shore area from all but the largest storm waves from the west or southwest, which lost little energy through refraction. Under these natural conditions, the shoreline was essentially in equilibrium and the rate of retreat of the low bluffs was very low, several inches per year, even though the bluffs themselves offered little or no resistance to wave attack.
The construction of the breakwaters, however, disrupted the long-term equilibrium wave pattern. Wave energy that was formerly dissipated along approximately three miles of downcoast shoreline in the lee or downcoast of Pillar Point was now focused where the end of the eastern breakwater met the low, erodible bluffs. The historically wide sandy beach and dunes along the shoreline of the bay were quickly eroded followed by wave attack of the bluffs. The disruption of downcoast littoral transport also caused a significant deficit in sand supply downcoast of the breakwater.
Retreat rates of the low bluff south of the breakwater accelerated from a pre-1959 rate of ~8 cm per year to as high as two meters per year in unprotected areas during the initial decades following breakwater construction (Figure 4 and Figure 5). These average annual bluff retreat rates are highest closest to the end of the breakwater, decrease downcoast and are very high rates for California’s coast. Within several years, a county road (Mirada Road) and the underlying sewer line were gradually undermined and destroyed, and State Highway One, a major coastal highway, was soon threatened (Figure 6a,b).
Broken concrete and rock were first dumped at the base of the low bluff at the end of the breakwater in 1959 in an effort to halt the erosion. Wave action, however, overtopped the low rip rap and threatened State Highway One. Additional rock and broken concrete were subsequently added in 1969-70 and again in 1978 as the earlier rock failed to check the ongoing erosion (Figure 7). More substantial rip rap was placed after the heavy El Niño storms of 1983 and provided longer-term protection for Highway One where it passes within 9 m of the present shoreline near the eastern end of the breakwater.
Accelerated bluff erosion now extends1.4 km south of the breakwater to the community of Miramar, where another section of Mirada Road, several homes and businesses, and an apartment building have been threatened leading to additional rip rap being placed (Figure 8). Approximately 490 m of riprap was emplaced between 1979 and 1983 offered only temporary protection for these exposed structures, however. Development of homes continued over time on this low marine terrace.
An apartment building was constructed on the bluff edge in 1972 with a concrete foundation wall extending down to below beach level (Figure 9). Bluff retreat continued, however, and a photo from 1979 shows protective rip rap had been placed on the beach fronting the structure (Figure 10). Erosion of the low bluff has continued up and down coast which led to undermining of the support system for the bridge across Arroyo de En Medio, which was subsequently replaced with a prefabricated steel bridge (Figure 11 and the addition of rip rap both up and downcoast from the apartment building (Figure 12). Erosion of the bluff is continuing downcoast of the rip rap (Figure 13 and Figure 14). The factors affecting bluff recession include high intensity rainfall that can both weaken the bluffs and lead to runoff and erosion, and most importantly, the impact of very large waves and times of high tides, when most bluff erosion typically occurs along the central coast of California.
The coastline here was significantly different prior to construction of the Pillar Point Breakwater. At the approximate location of the apartment building there was a large hotel with a very wide beach backed by vegetated dunes due to a significant supply of littoral sand (Figure 15). The beach was so wide that the area even hosted motorcycle races along the shoreline in the early years of the last century (Figure 16).
3. Discussion
When the Army Corps of Engineers planned and then built the Pillar Point breakwater in 1959-1961, they either didn’t understand, appreciate or they disregarded the evolution and shoreline equilibrium condition of a log spiral or hook-shaped bay (Figure 17). The initial Corps examination of the proposed project would have been the time when this issue should have been raised and evaluated, but this was not the case.
“At the request of local interests, the US Army Corps of Engineers (USACE) conducted a preliminary examination on the feasibility of creating a harbor at the north end of Half Moon Bay. In November 1945, USACE produced a favorable report, and in August 1947 they released a survey report of the area that recommended constructing two breakwaters to create the harbor. Congress authorized the project in 1948. Breakwater construction commenced in April 1959 and ended in June 1961. Subsequent changes to correct induced problems followed over the years”[6].
The erosion downcoast from the end of the east breakwater led the San Mateo County Harbor District in 2008—47 years after harbor construction—to ask the Corps to investigate the erosion immediately south of the harbor to determine if it was appropriate for the Cops to conduct a shoreline-mitigation project. The Harbor District asserted that “the shoreline was virtually stable prior to breakwater construction and that harbor creation, a USACE project, induced (a) significant beach and sea-cliff erosion immediately south of the root (end) of the East Breakwater and (b) deposition of sand immediately north of the root (i.e., inside the harbor). They contend that the East Breakwater stopped the unimpeded flow of sand in the littoral zone thus preventing replacement of beach sand in the eroding coastal stretch” [6].
The 2017 report concluded that “construction of the East Breakwater disrupted the equilibrium wave pattern and focused wave energy at the low cliffs south of the breakwater causing rapid cliff erosion along the shoreline in (the) area of this project. Post-breakwater construction in that area, a county road was destroyed, state Highway 1 threatened, and the rate of sea cliff retreat increased from three inches per year to 80 inches per year. Specifically, by 1985 the sea cliff had eroded far enough into the terrace to destroy Mirada Road, which paralleled the cliff edge (Figure 6a/b). The most likely causes of the increased erosion are shifting the center of the log-spiral to the south and cutting off the sand supply from the north. Shifting the center of the spiral creates a different wave-energy dynamic along the length of Half Moon Bay as the shoreline tries to return to an equilibrium configuration. The greatest change will be where the spiral is the tightest, which is adjacent to the south side of the East Breakwater. The effect will taper off downcoast, and erosion will, consequently, be less”.
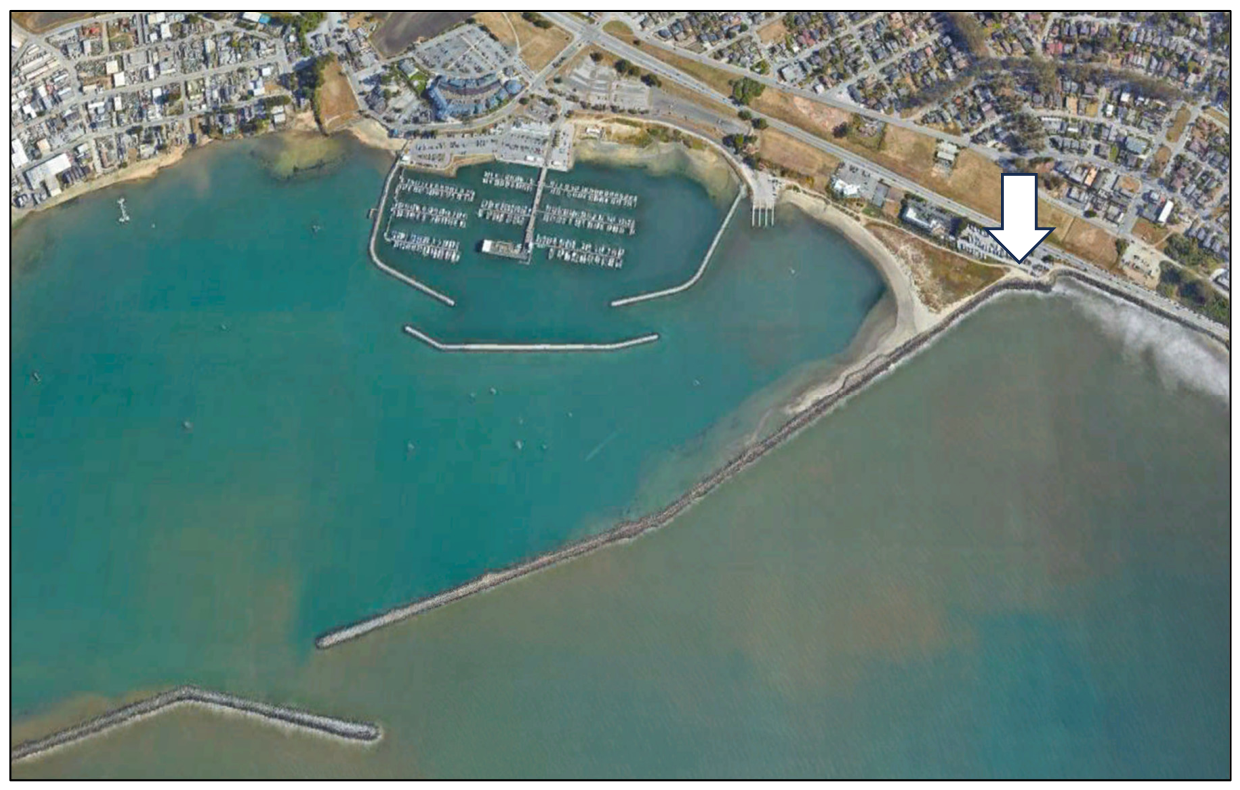
In addition to the beach and bluff erosion that propagated downcoast from the breakwater following construction, the gap initially left between the two breakwaters to provide for boat passage allowed waves approaching from the southwest to enter the new harbor and threaten or damage berthed or anchored boats (Figure 18 and Figure 19). Waves from the southwest are common, however, during the frequent El Niño events which can severely impact the coast of California. “Because of larger-than-expected wave energy entering the harbor during 1966 and 1967, a 1,050-foot-long rubble-mound dogleg extension was added to the seaward end of the West Breakwater “(Figure 3) [6]. This breakwater addition also proved inadequate, however, so in 1982 the San Mateo County Harbor District completed the enclosure of the protected inner basin with a breakwater to minimize the potential exposure to waves and provide slips for 369 boats (Figure 20).
As stated above, the breakwater cut off littoral sand that formerly moved around the interior of the bay and was the primary source of sand for the downcoast beaches. This sand was then trapped by the breakwater and deposited inside the harbor as a wedge of sand adjacent to the end of the east breakwater (Figure 20). The growth of this wedge of sand is gradually infilling this section of the harbor, reducing water depths, and will progressively increase the difficulty of boats anchoring or accessing the inner harbor, and using the boat ramp.
The COE 2017 report also listed the following as additional problems:
- “Ongoing erosion has limited public access, decreased recreational opportunities, and created hazards to the public—including surfers, fishermen, and beach joggers and walkers—to Surfer’s and Miramar Beaches (immediately south of the end of the east breakwater). If no action is taken, the amount of time there is exposed beach will continue to decrease until there the ocean impinges on the revetments during all stages of the tide, effectively ending beach use”.
- “Ongoing erosion has flanked the south end of the Surfer’s Beach revetment, threatening Highway 1 and the Coastal Trail. If no action is taken, the shoulder and south-bound lane of the highway could fail, and trail users forced to walk in the highway or on the riprap”.
- “If no action is taken, sea level rise and more intense storms will further restrict access to the businesses and private homes along Mirada Road”.
The same Corps report also identified the following opportunities for resolving or mitigating the problems:
- “Removing sand from inside the harbor—next to the East Breakwater—will improve maneuverability and anchorage in the harbor”.
- “Placing sand on or behind the beach will help restore a recreational beach and improve surfing”.
- “Placing sand in front of the coastal bluff will help protect Highway 1 and the Coastal Trail”.
- “Placing sand where longshore transport will carry it in front of Mirada Road will prevent or mitigate future damages to the roadway, businesses, and private structures”.
Following the evaluation of seven different alternatives, six were eliminated and the favored alternative, a one-time dredging of about 106,000 to 114,000 m3 of sand that had accumulated along the inside of the east breakwater and placing that sand to form a 40 m wide berm along the 950 m long section of shoreline downcoast from the harbor known as Surfer’s and Vallejo beaches was evaluated. This approach was determined not to have any significant adverse impacts, however, the benefit:cost ratio of 0.25 did not meet the justification for federal action, so the project was not recommended [6].
5. Conclusions
The construction of the Pillar Point Breakwater by the Army Corps of Engineers from 1959-1961 to form a harbor within Half Moon Bay had significant impacts on the hook-shape or log-spiral shoreline that was historically in long-term equilibrium. Wave energy that had been dissipated along three miles of shoreline within the bay was now focused where the end of the eastern breakwater met the low, weak bluffs. The disruption of downcoast littoral transport caused a significant deficit in sand supply downcoast of the breakwater The historically wide sandy beach and dunes along the shoreline south of the breakwater were quickly eroded followed by wave attack and retreat of the low bluffs.
The shoreline here prior to breakwater construction experienced a very low recession rate of ~8 cm per year which increased to as much as 2 m per year in unprotected areas during the initial decades following breakwater construction. The erosion destroyed a county road and threatened State Highway 1, as well as downcoast residential neighborhoods which then led to revetment construction. Looking to the future of this area, at least two recent studies have indicated that waves are getting larger which will only exacerbate the bluff erosion in the unprotected downcoast bluffs (Figure 12, Figure 13 and Figure 14) [7,8]. Sea level is also rising [9] and this rates is accelerating [9] which will, in time, add to the erosion problems created by the change in wave impacts created by breakwater construction.
A gap in the breakwater which allowed boats to enter and leave the harbor also served as an opening for waves from the southwest which led to threats to boats anchored within the new harbor. While a 320 m long dogleg shaped extension of the breakwater was constructed by the Corps, this also did not solve the wave impact problem, leading the harbor district to build additional protective breakwaters within the harbor.
The sand that previously nourished the beaches within Half Moon Bay and protected the low bluffs was trapped behind the breakwater forming a wedge of sand which was gradually filling this section of the harbor, reducing water depths, and progressively increasing the difficulty of boats anchoring or accessing the inner harbor and using the boat ramp.
While the Army Corps of Engineers acknowledged in a post-breakwater construction report that the breakwater construction led to these negative effects and evaluated several approaches that might mitigate the impacts, they concluded that the benefits were not sufficient to justify any further action.
Thus, the Corps of Engineers in their pre-project planning documents failed to understand the significance of the equilibrium shoreline within Half Moon Bay and the impacts that breakwater construction would have on the coast at this location. The breakwater design also did not adequately protect the interior of the Pillar Point Harbor from wave impact which required subsequent modifications. The problems identified by the harbor district and acknowledged by the USACE have not been resolved or mitigated and downcoast erosion continues where armor has not been emplaced as the coast attempts to reach a new equilibrium configuration.
- As the sole author I am responsible for all aspects of this manuscript.
- No individuals or organizations require Acknowledgements
- No conflicts of interest are involved
References
- Yasso, W.E. Plan Geometry of Headland Bay Beaches. Journal of Geology 1965. 73(5): 702-714. [CrossRef]
- Griggs, G., K. Patsch, and L. Savoy (eds.). Living With the Changing California Coast, University of California Press, Berkeley, 2005.540 pp.
- Lajoie, K.R. and Mathieson, S.A. San Francisco to Año Nuevo. In: Griggs, G.B. and Savoy, L.E. Living with the California Coast. Duke University Press, Durham, N.C. 2005. pp.140-177.
- Habel, J.S. and Armstrong, G.A., 1978. Assessment and Atlas of Shoreline Erosion Along the California Coast. Dept. of Navigation and Ocean Development, State of California, 277pp.
- Fry, J. Miramar- Small Town, Big History. 2000. 29pp.
- United States Army Corps of Engineers, San Francisco District, South Pacific Division. Continuing Authorities Program—Detailed Project Report and Draft Environmental Assessment North Half Moon Bay, Pillar Point Harbor, San Mateo County, Ca. 2017. 82pp.
- Bromirski, P.D., 2023. Climate-induced decadal ocean wave height variability from microseisms: 1931–2021. Journal of Geophysical Research: Oceans, 128, e2023JC019722. [CrossRef]
- Reguero, B.G.; Losada, I.J., and Méndez, F.J., 2019. A recent increase in global wave power as a consequence of oceanic warming. Nature Communications, 10, 205. [CrossRef]
- OPC OST. California Sea Level Rise Guidance: 2024 Science and Policy Update; California Sea Level Rise Science Task Force, California Ocean Protection Council, California Ocean Science Trust: Sacramento, CA, USA, 2024; 101p.
Figure 1.
Half Moon Bay in 1956 prior to breakwater construction, showing the smooth log spiral or hook-shaped nature of its shape. Note refracted wave fronts are essentially parallel to the shoreline.
Figure 1.
Half Moon Bay in 1956 prior to breakwater construction, showing the smooth log spiral or hook-shaped nature of its shape. Note refracted wave fronts are essentially parallel to the shoreline.
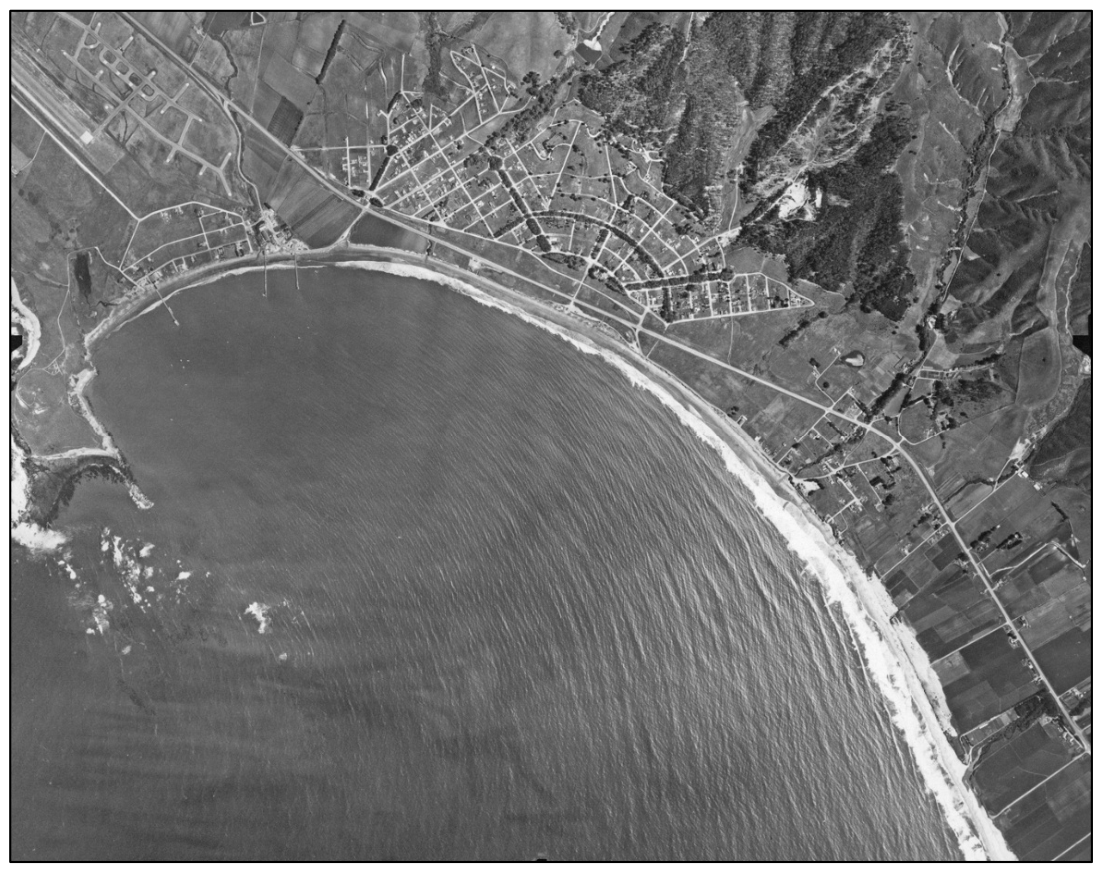
Figure 2.
Examples of partially or fully developed hook-shaped bays along California’s coast. Clockwise from upper left: Stinson Beach; Pt. Reyes and Drakes Beach; Pt Loma and the Silver Strand, San Diego; Bodega Head and Bodega Bay.
Figure 2.
Examples of partially or fully developed hook-shaped bays along California’s coast. Clockwise from upper left: Stinson Beach; Pt. Reyes and Drakes Beach; Pt Loma and the Silver Strand, San Diego; Bodega Head and Bodega Bay.
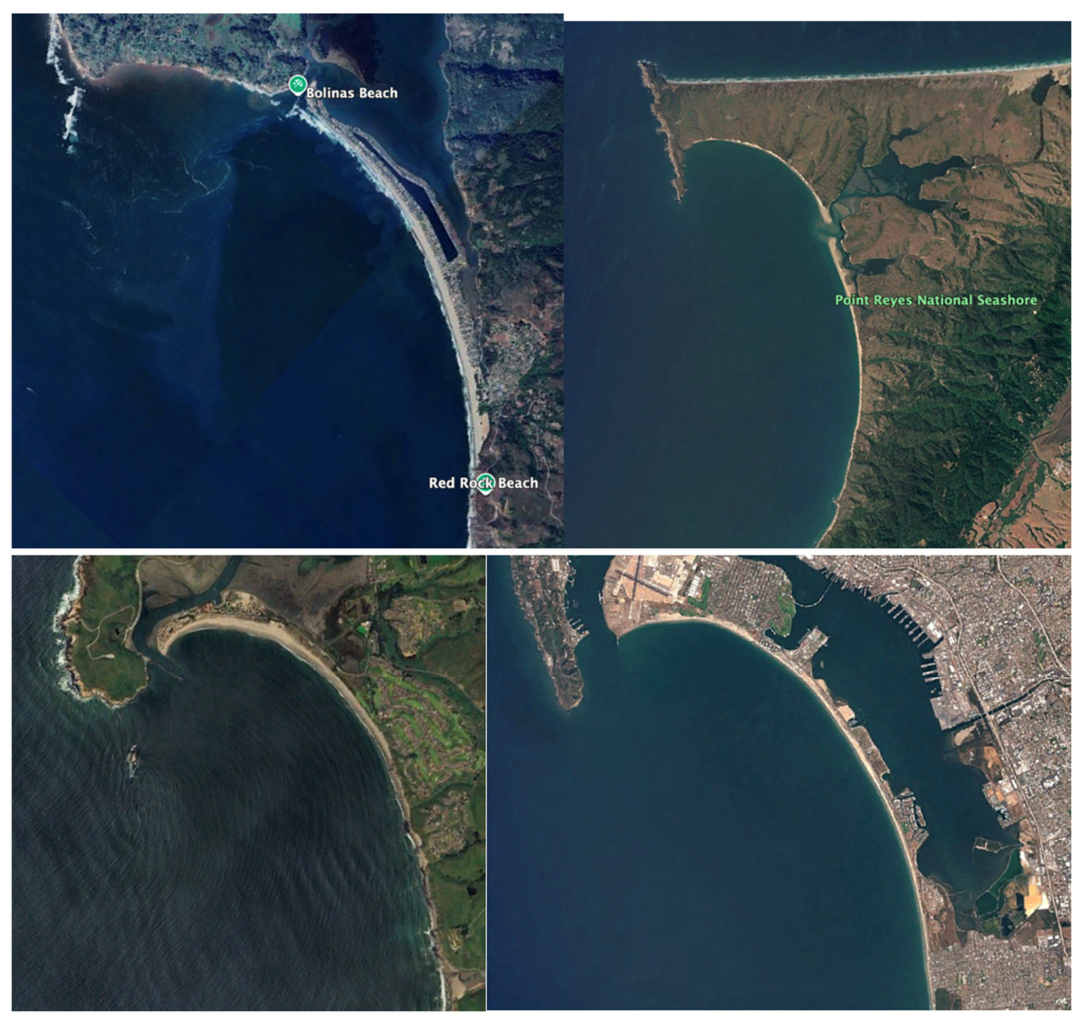
Figure 3.
Pillar Point Harbor and outer and inner breakwaters (2024 Google Earth).
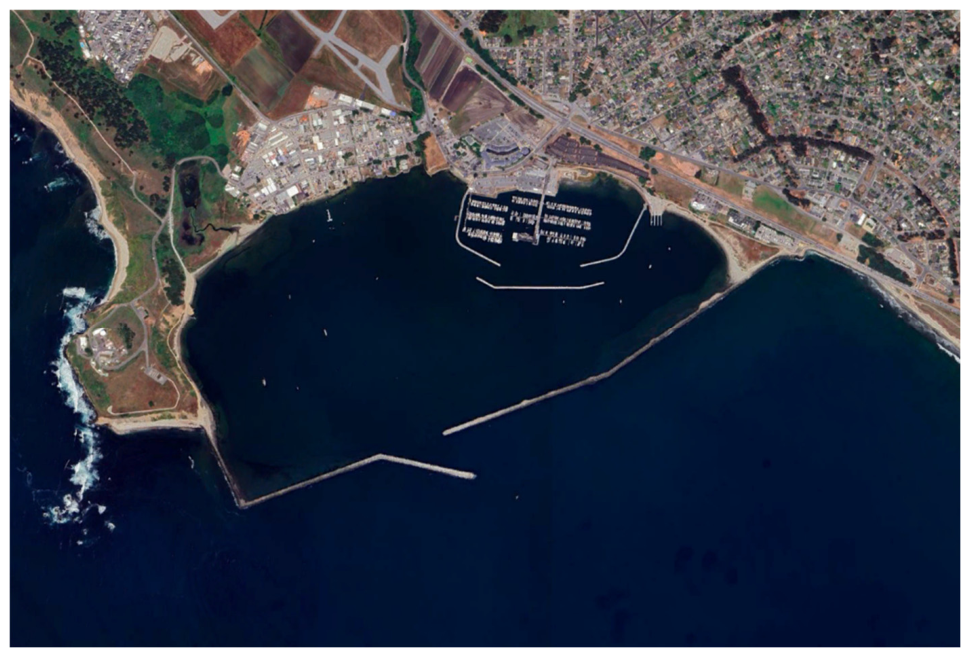
Figure 4.
Map from of Half Moon Bay and Miramar Beach area, with shoreline environment, hazard level, armoring and bluff erosion rates in inches/year [2].
Figure 4.
Map from of Half Moon Bay and Miramar Beach area, with shoreline environment, hazard level, armoring and bluff erosion rates in inches/year [2].
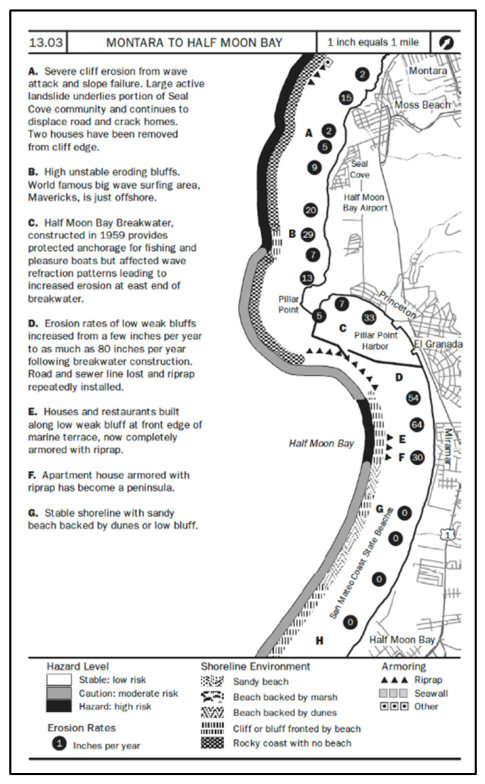
Figure 5.
Bluff erosion rates south of the Pillar Point breakwater [3]. Erosion rates increased markedly following construction of the breakwater between 1956 and 1960.
Figure 5.
Bluff erosion rates south of the Pillar Point breakwater [3]. Erosion rates increased markedly following construction of the breakwater between 1956 and 1960.
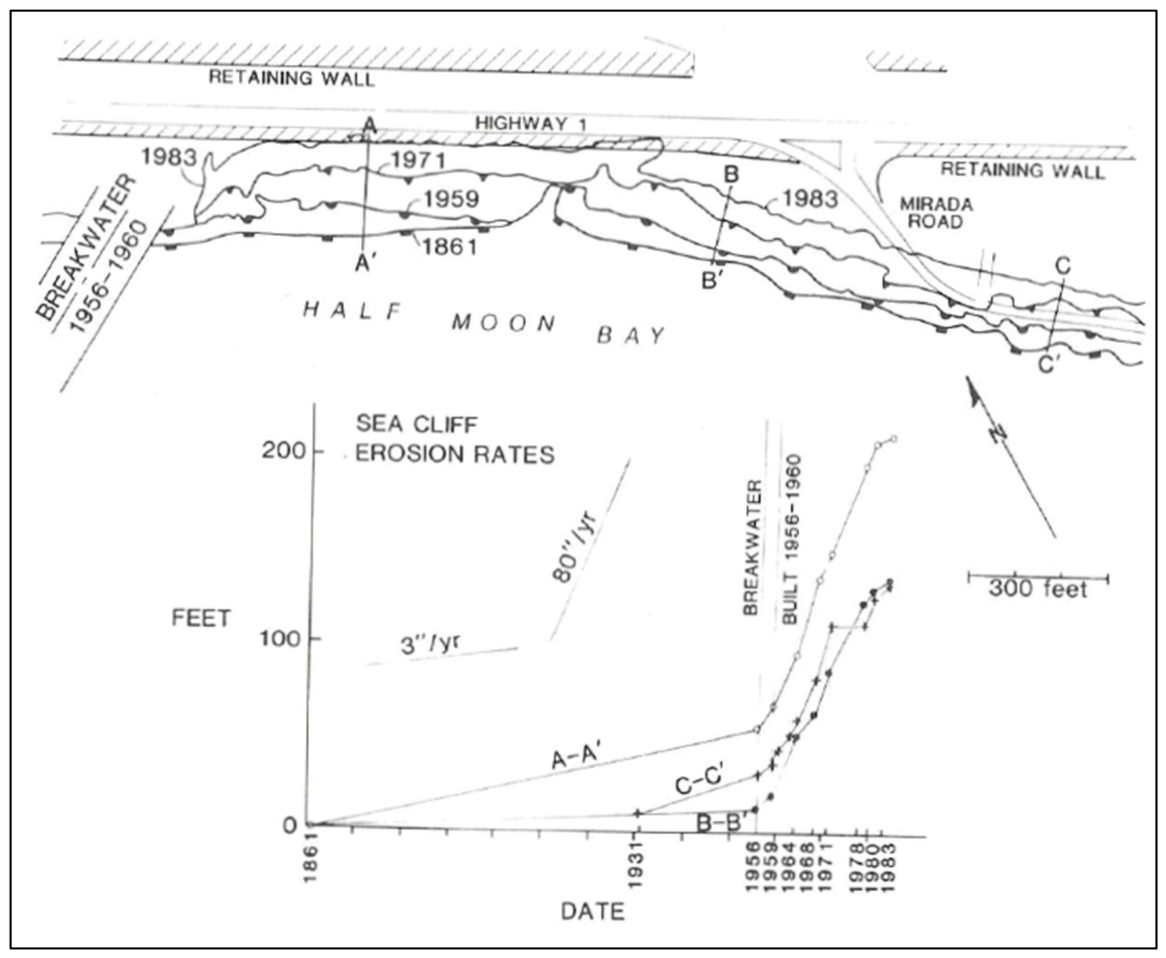
Figure 6.
a and b. Destruction of Mirada Road (left) and sewage transmission line (right) immediately downcoast of the end of the Pillar Point Breakwater (1976) [4].
Figure 6.
a and b. Destruction of Mirada Road (left) and sewage transmission line (right) immediately downcoast of the end of the Pillar Point Breakwater (1976) [4].
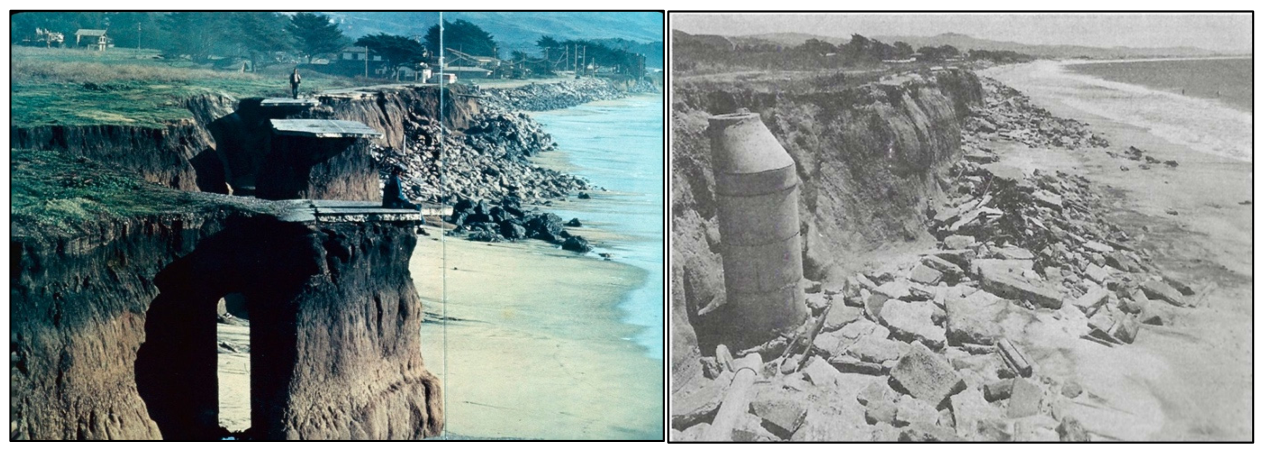
Figure 7.
Waves at high tide eroding the former Mirada Road immediately south of the Pillar Point breakwater in April 2006.
Figure 7.
Waves at high tide eroding the former Mirada Road immediately south of the Pillar Point breakwater in April 2006.
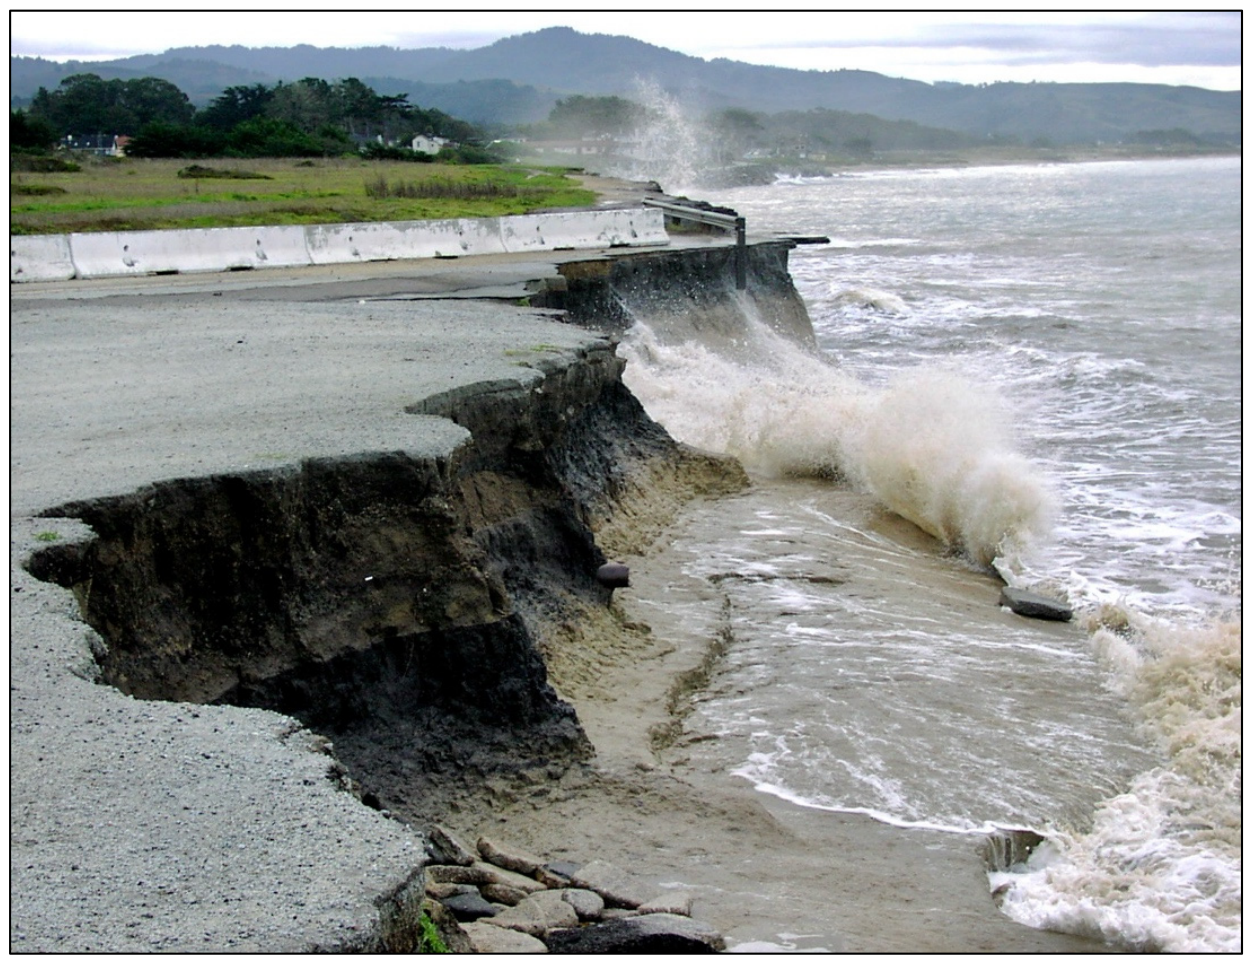
Figure 8.
Mirada Road ~1200 m south of the breakwater in 1972 after a few homes had been built and rip rap had been placed. (Photo: California Coastal Records Project).
Figure 8.
Mirada Road ~1200 m south of the breakwater in 1972 after a few homes had been built and rip rap had been placed. (Photo: California Coastal Records Project).
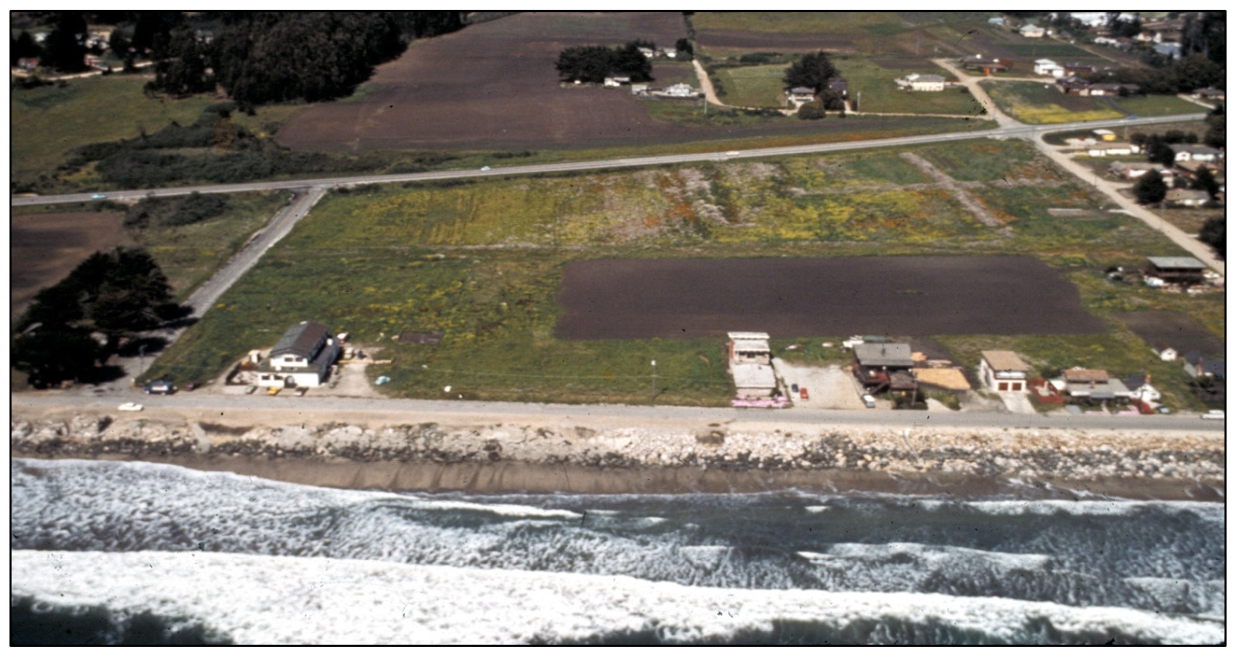
Figure 9.
Mirada Road south of the harbor breakwater in 1972 with apartment building on the bluff edge under construction (California Coastal Records Project).
Figure 9.
Mirada Road south of the harbor breakwater in 1972 with apartment building on the bluff edge under construction (California Coastal Records Project).
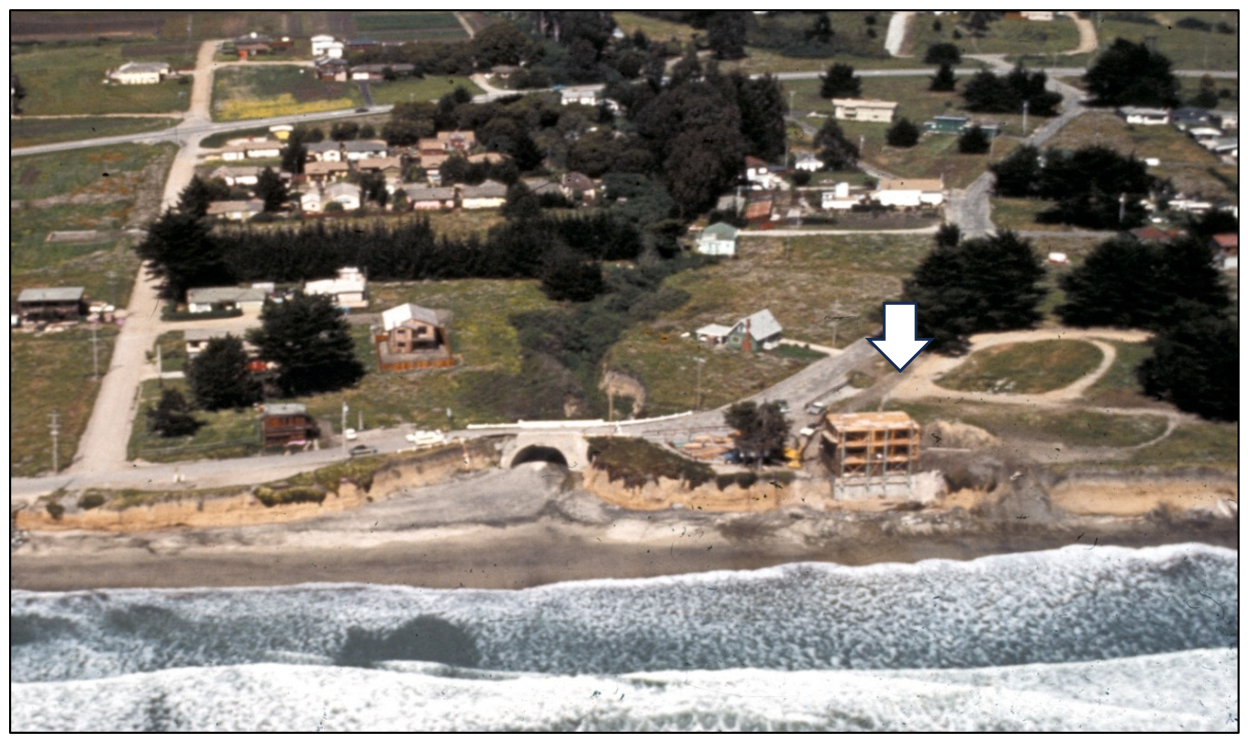
Figure 10.
1979 photo of same area in Figure 9 with rip rap now placed on beach in front of apartments (California Coastal Records Project).
Figure 10.
1979 photo of same area in Figure 9 with rip rap now placed on beach in front of apartments (California Coastal Records Project).
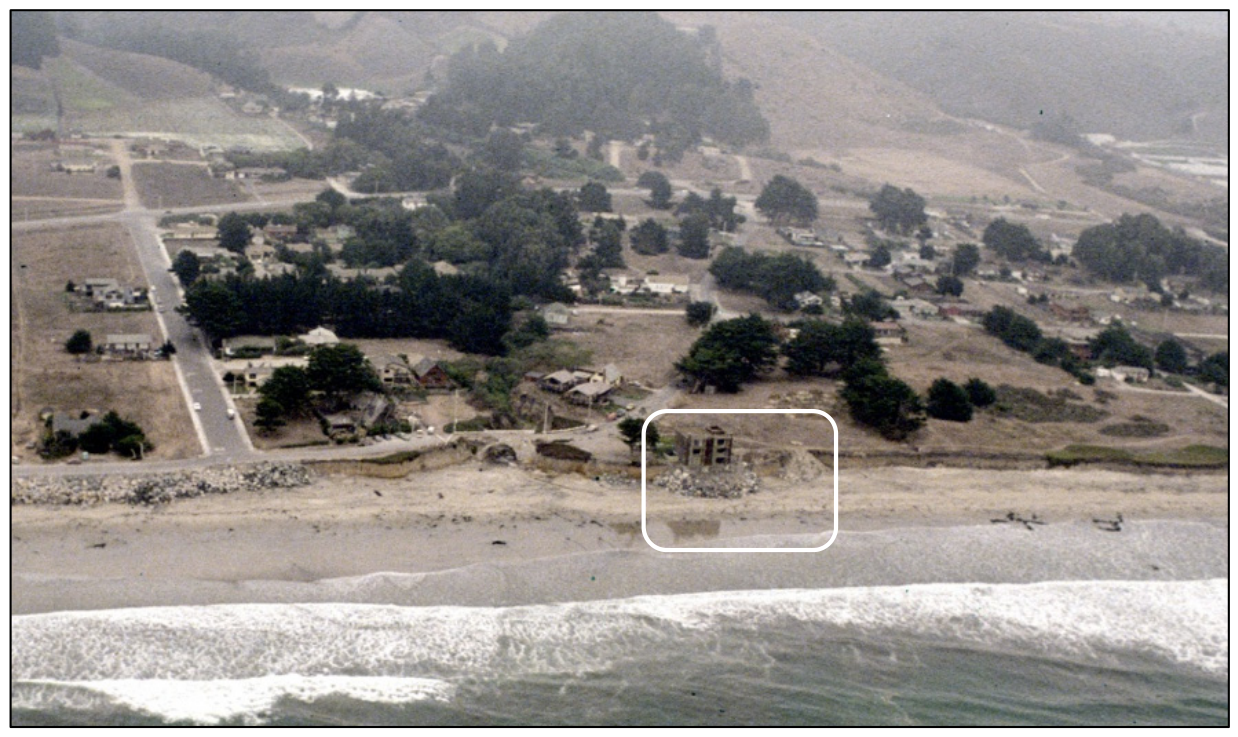
Figure 11.
Mirada Road and a new bridge over Arroyo de En Medio in 2002. Rip rap has also been extended both up- and downcoast from the bluff edge apartment building. This photo is about 1,400 m downcoast of the breakwater. (Photo: California Coastal Records Project).
Figure 11.
Mirada Road and a new bridge over Arroyo de En Medio in 2002. Rip rap has also been extended both up- and downcoast from the bluff edge apartment building. This photo is about 1,400 m downcoast of the breakwater. (Photo: California Coastal Records Project).
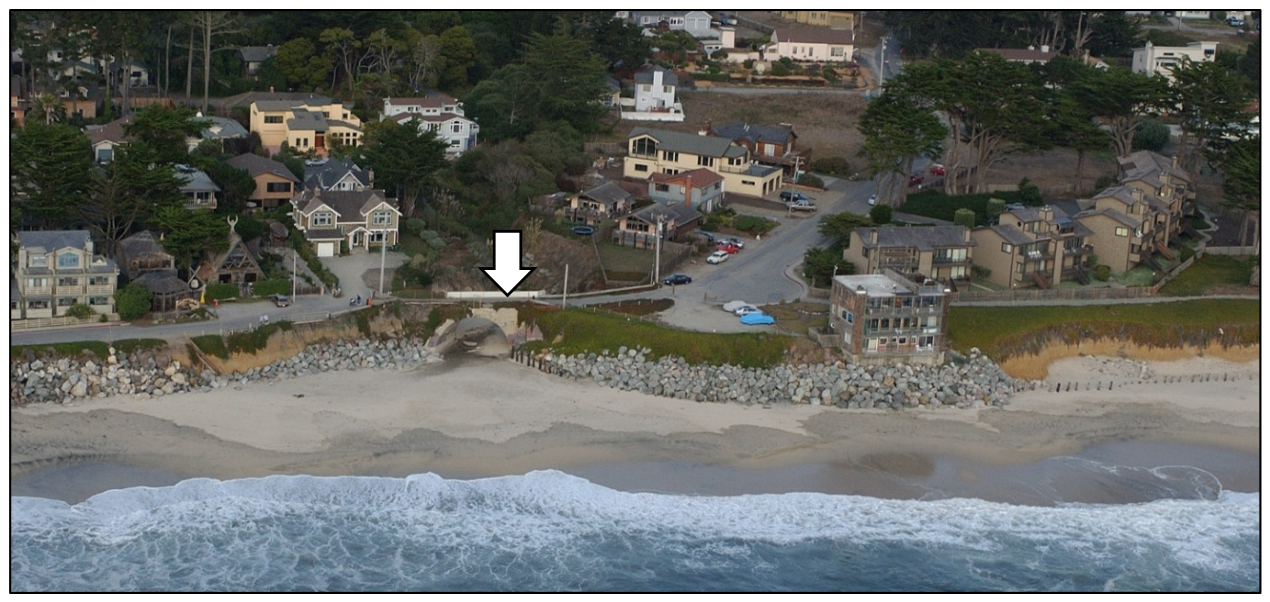
Figure 12.
2024 photo showing the replacement bridge over Arroyo de En Medio (arrow on left) and additional rip rap added down coast of the bluff edge apartment building. Erosion is continuing downcoast where a coastal access path has now been undermined (arrow on right; Photo: California Coastal Records Project).
Figure 12.
2024 photo showing the replacement bridge over Arroyo de En Medio (arrow on left) and additional rip rap added down coast of the bluff edge apartment building. Erosion is continuing downcoast where a coastal access path has now been undermined (arrow on right; Photo: California Coastal Records Project).
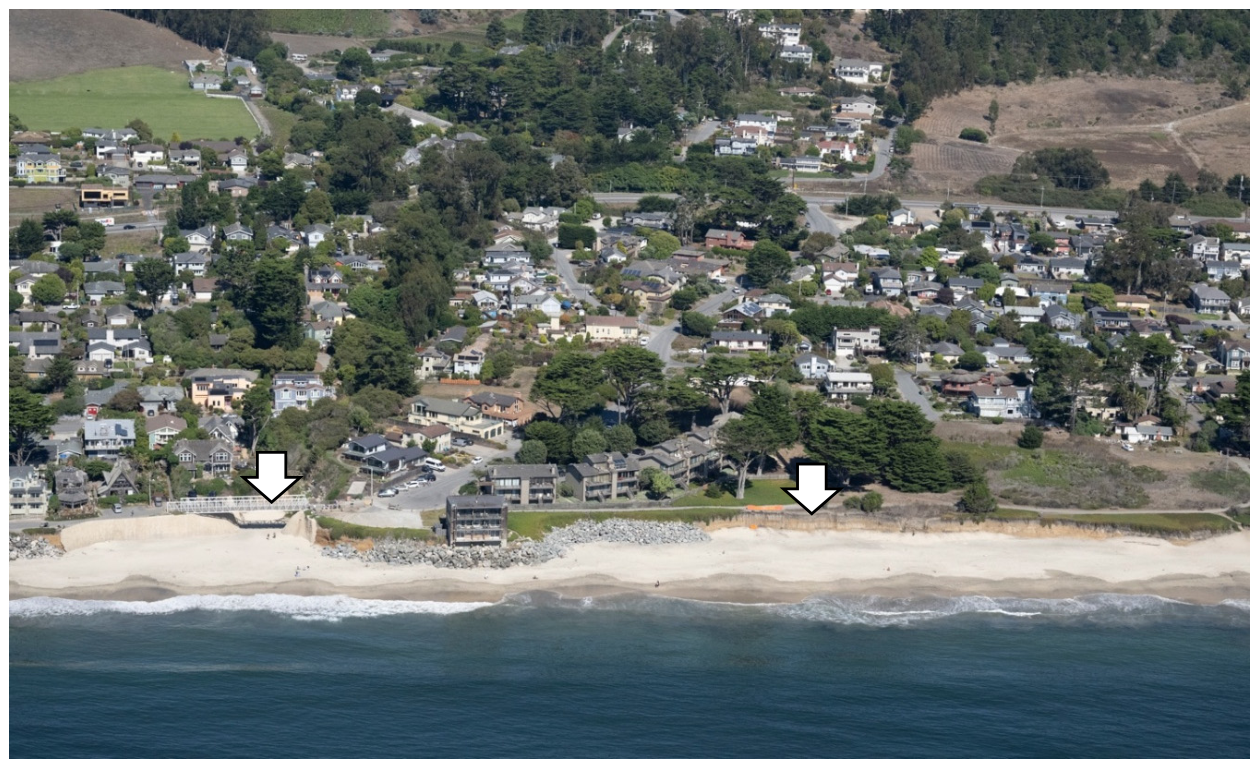
Figure 13.
November 2025 photo of bluff erosion downcoast of bluff edge apartment building and at end of rip rap showing loss of a portion of the coastal walkway.
Figure 13.
November 2025 photo of bluff erosion downcoast of bluff edge apartment building and at end of rip rap showing loss of a portion of the coastal walkway.
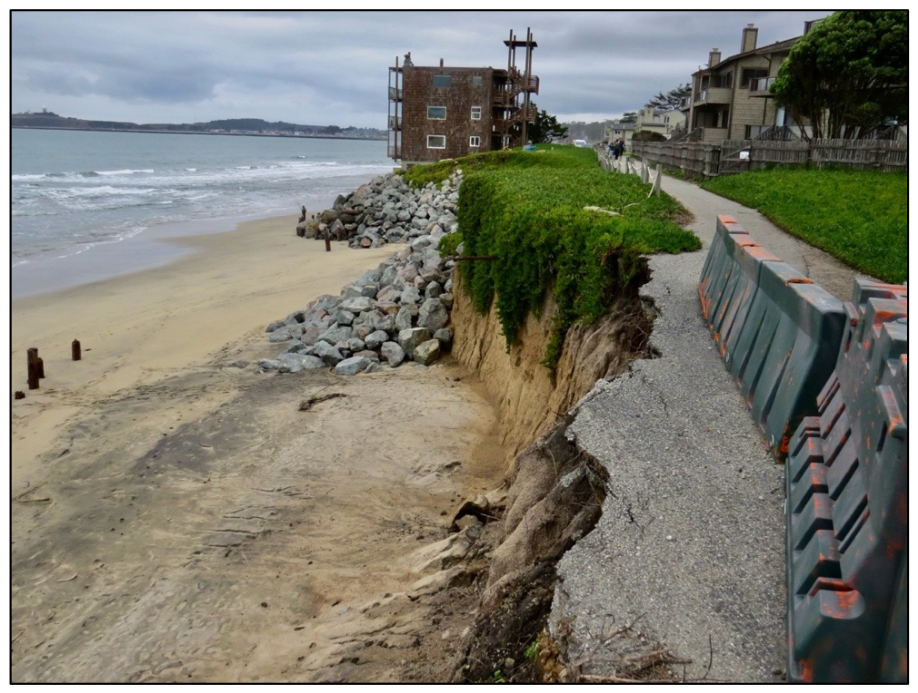
Figure 14.
Failure of a portion of the Coastal Walkway with K-Rails added for safety (November 2025).
Figure 14.
Failure of a portion of the Coastal Walkway with K-Rails added for safety (November 2025).
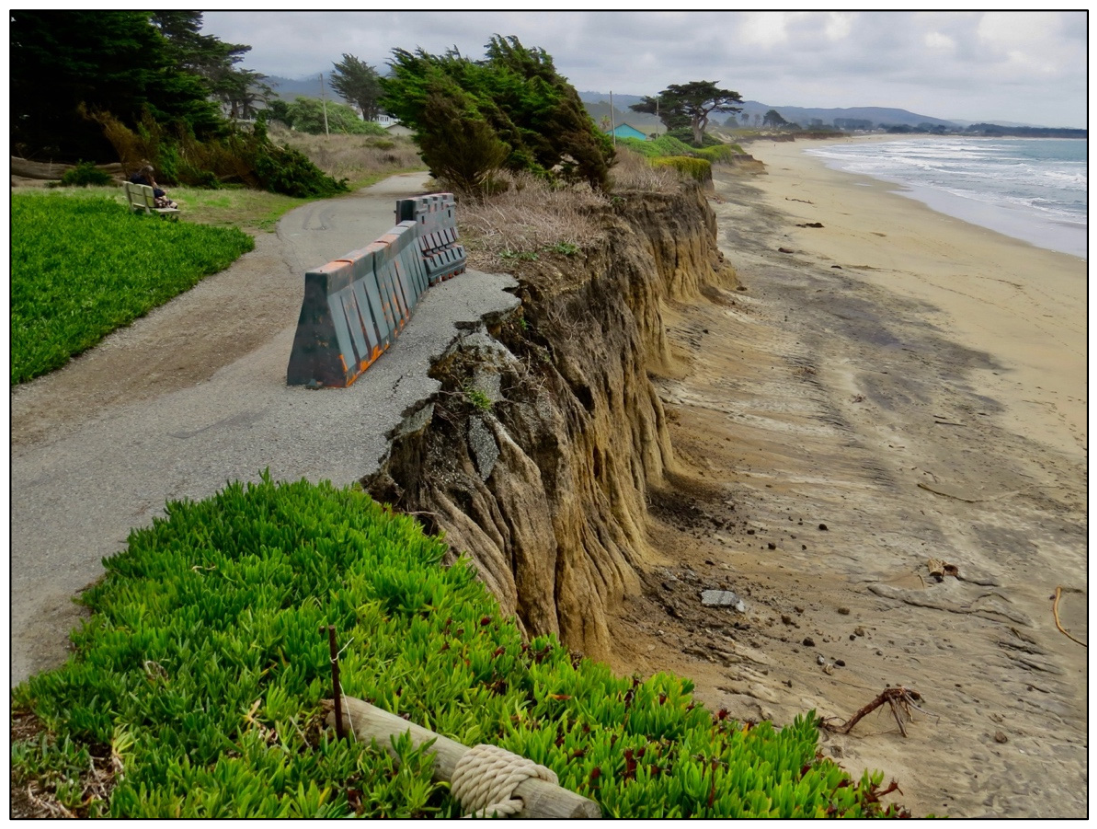
Figure 15.
The Palace Miramar (ca. 1920s.) with a wide sandy beach with back beach dunes [5]. This hotel was at approximate location of apartment building in Figure 12).
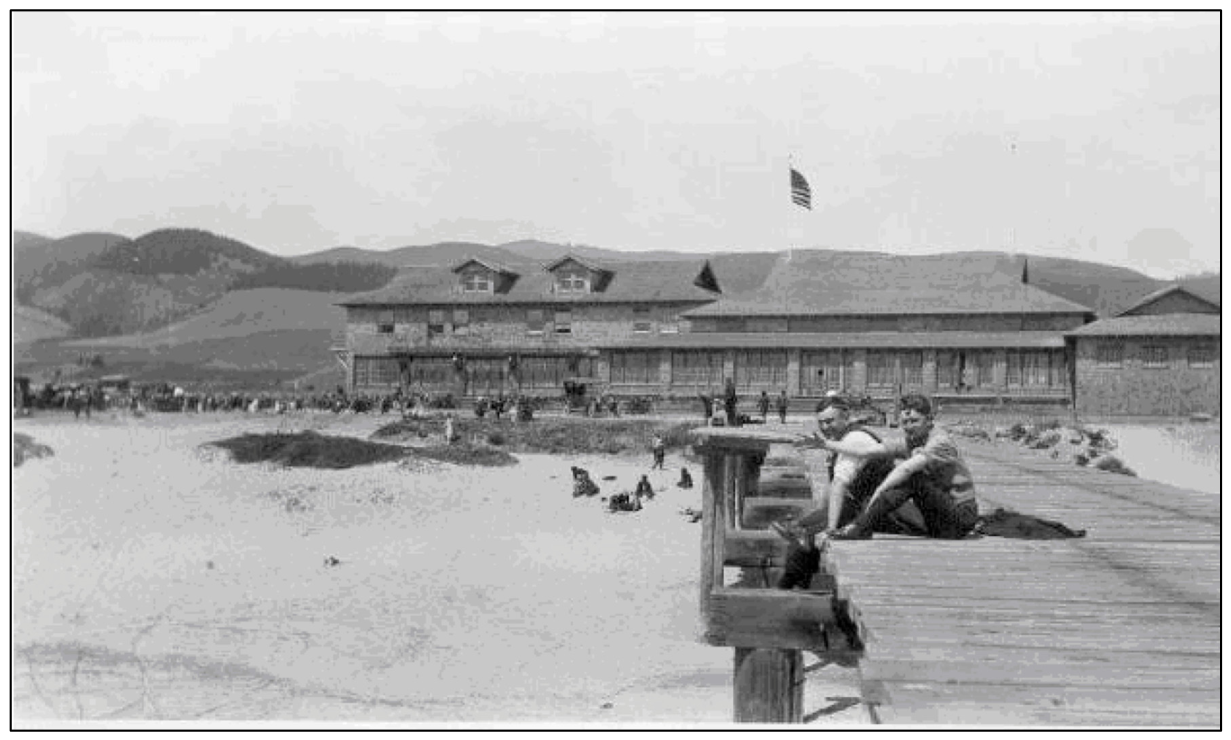
Figure 16.
Motorcycle racing (ca. 1920s) on the wide beach with the Palace Miramar and a former pier in the background [5].
Figure 16.
Motorcycle racing (ca. 1920s) on the wide beach with the Palace Miramar and a former pier in the background [5].
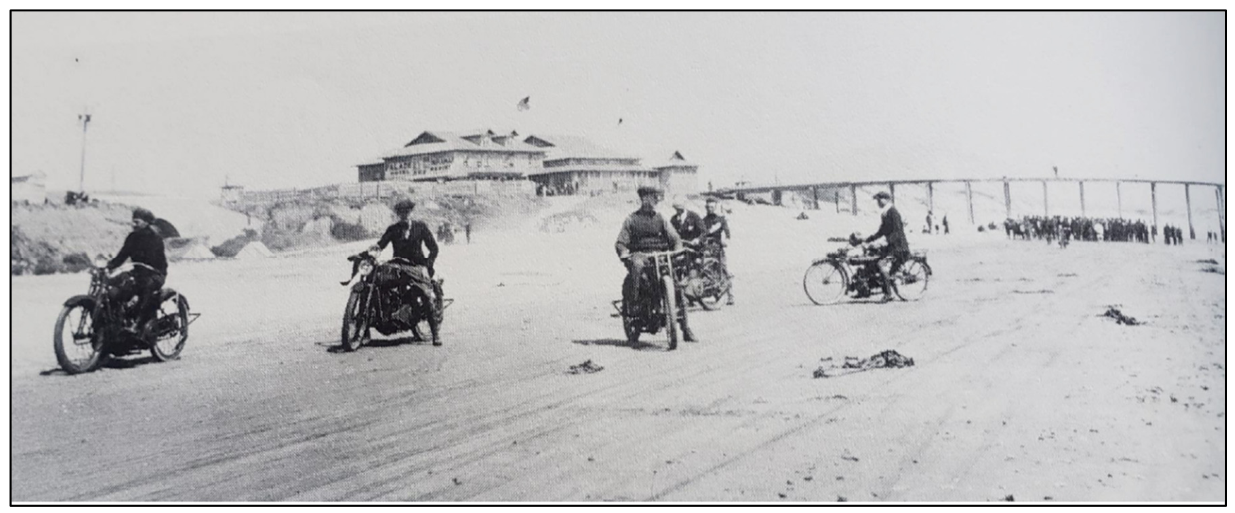
Figure 17.
Half Moon Bay shoreline overlain with a log-spiral curve (dashed line). Inset shows the geometry of a log-spiral curve [6].
Figure 17.
Half Moon Bay shoreline overlain with a log-spiral curve (dashed line). Inset shows the geometry of a log-spiral curve [6].
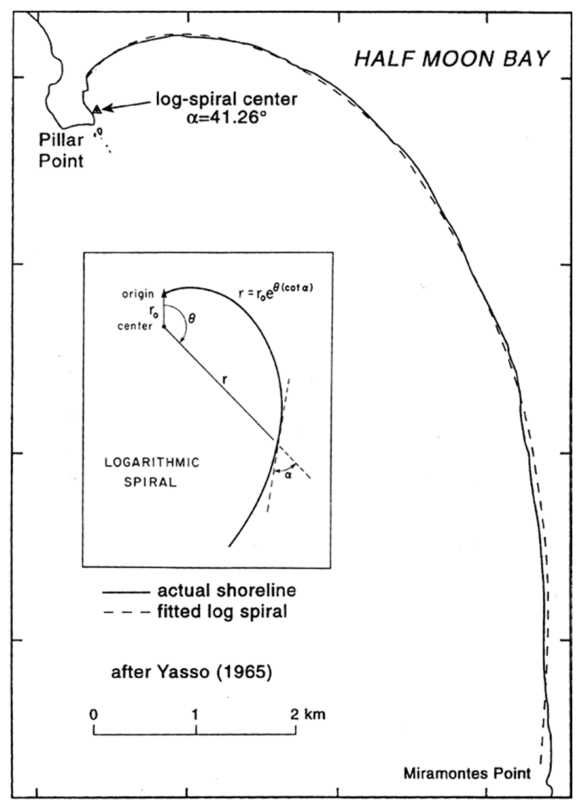
Figure 18.
Pillar Point Breakwater in 1965 prior to construction of dogleg breakwater showing refracted waves impacting the shoreline at the end of the east breakwater (arrow).
Figure 18.
Pillar Point Breakwater in 1965 prior to construction of dogleg breakwater showing refracted waves impacting the shoreline at the end of the east breakwater (arrow).
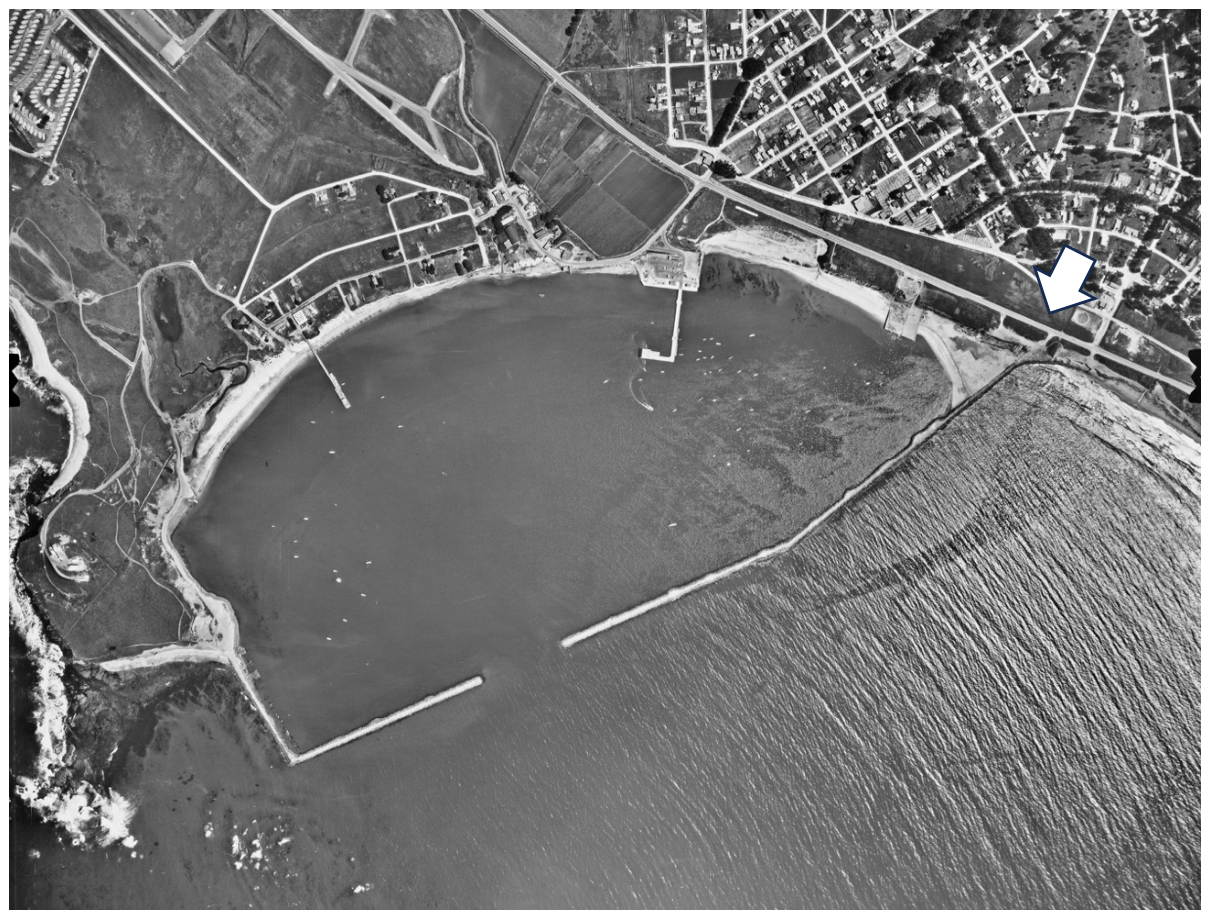
Figure 19.
Diffracted waves entering the harbor through the gap between west and east breakwaters (1965).
Figure 19.
Diffracted waves entering the harbor through the gap between west and east breakwaters (1965).
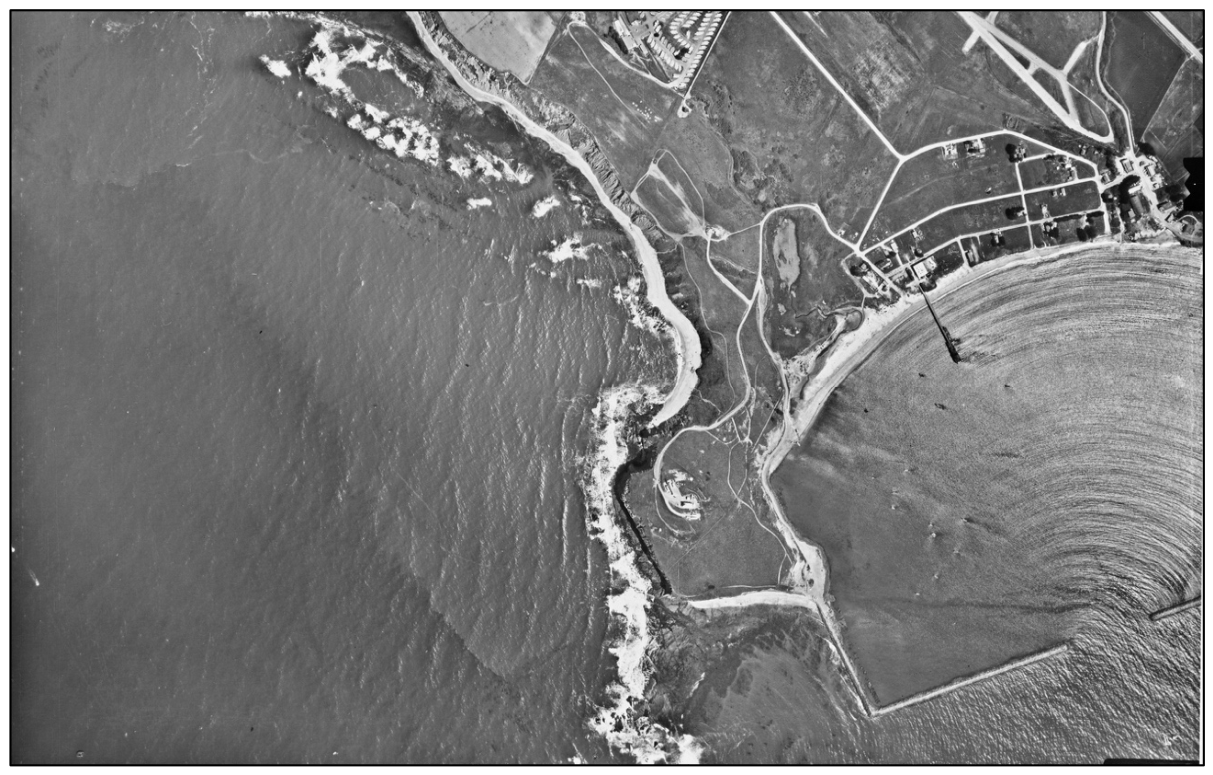
Figure 20.
Pillar Point Harbor in 2022 showing inner breakwaters protecting boat anchorage and the wedge of sand (arrow) that has accumulated within the harbor adjacent to the end of the east breakwater (2022 Google Earth).
Figure 20.
Pillar Point Harbor in 2022 showing inner breakwaters protecting boat anchorage and the wedge of sand (arrow) that has accumulated within the harbor adjacent to the end of the east breakwater (2022 Google Earth).
Disclaimer/Publisher’s Note: The statements, opinions and data contained in all publications are solely those of the individual author(s) and contributor(s) and not of MDPI and/or the editor(s). MDPI and/or the editor(s) disclaim responsibility for any injury to people or property resulting from any ideas, methods, instructions or products referred to in the content. |
© 2026 by the authors. Licensee MDPI, Basel, Switzerland. This article is an open access article distributed under the terms and conditions of the Creative Commons Attribution (CC BY) license (http://creativecommons.org/licenses/by/4.0/).
Copyright: This open access article is published under a Creative Commons CC BY 4.0 license, which permit the free download, distribution, and reuse, provided that the author and preprint are cited in any reuse.


