

Submitted:
20 July 2026
Posted:
22 July 2026
You are already at the latest version
Abstract
Recent drought events in southeastern Brazil have highlighted the vulnerability of large metropolitan areas to hydroclimatic variability. The approach integrates vertical ground displacement derived from continuous GNSS observations and Sentinel-1 InSAR time series with terrestrial water storage anomalies from GRACE/GRACE-FO, groundwater level records, and meteorological drought indicators based on SPI/SPEI. Time series analysis, including trend decomposition, amplitude–phase characterization, and correlation, reveals a strong spatiotemporal coupling between hydrological loading and surface deformation. Periods of negative terrestrial water storage anomalies and groundwater decline are consistently associated with crustal uplift, whereas wet phases correspond to subsidence signals. The results highlight distinct hydrogeological responses between the PCJ and Upper Tietê basins, where variations in lithology, soil, aquifer types, and anthropogenic pressure modulate the magnitude of surface deformation. Empirical Orthogonal Function (EOF) decomposition, demonstrates that InSAR-derived deformation patterns are significantly influenced by hydrogeological controls, enabling the identification of areas more sensitive to groundwater depletion. The integrated dataset captures the main drought episodes between 2020 and 2025. This study demonstrates the capability of combining GNSS, InSAR, and GRACE observations to provide a multi-scale description of drought processes, offering a robust tool for monitoring water storage changes and supporting water resource management in densely populated regions.
Keywords:
GPS
; InSAR
; GRACE
; vertical displacement
; terrestrial water storage
1. Introduction
Droughts have become more frequent and severe in many regions of the world as a consequence of climate change, land-use transformation, and increasing water demand. Southeastern Brazil, and particularly the Metropolitan Region of São Paulo (MRSP), has experienced recurrent water shortages over the past decade, culminating in critical events that severely impacted domestic, industrial, and agricultural water supply. The 2014-2015 drought in southeastern Brazil alone resulted in economic losses exceeding 5 billion dollars [1].
Despite Brazil has 14% of all the world’s freshwater, its spatial distribution is highly heterogeneous. In the Amazon region, for example, the per capita water availability is around 700,000 m³/year, while in the MRSP it is only 280 m³/year [2]. This difference generates even greater impacts on drought scenarios. Several studies indicate that, since 2015, the river basins that supply the MRSP for energy production and human consumption have not recovered, remaining in critical condition [3]. The Cantareira System (CS), which supplies water to nearly nine million people, plays a central role in regional water security and is highly sensitive to prolonged meteorological and hydrological droughts.
Traditional drought monitoring relies on in situ observations such as precipitation, temperature, reservoir levels, and groundwater wells. While these data are essential, they are often spatially sparse and may not fully characterize deficits in complex and/or deep hydrological systems. In recent years, satellite geodetic techniques have emerged as powerful complementary tools for monitoring the Earth’s hydrological cycle [4]. Variations in water mass produce measurable elastic deformations in the crust, detectable by observations from Global Navigation Satellite Systems (GNSS) and Interferometric Synthetic Aperture Radar (InSAR).
InSAR techniques allow the detection of ground deformations by comparing the phase of radar signals acquired at different times. Through multi-temporal approaches, such as the Persistent Scatterer InSAR (PS-InSAR) methodological principle [5] and Small Baseline Subset (SBAS) [6], it is possible to generate displacement time series that allow for the analysis of subsidence evolution associated with aquifer exploitation [7,8]. These methodologies have proven particularly useful in urban environments, where the abundance of stable reflectors improves radar signal coherence [8,9].
GPS (Global Positioning System), as the most widely used constellation within the broader GNSS framework, provides positioning based on continuous monitoring stations and is widely applied in hydrological studies [10]. It offers high temporal resolution (sub-daily), making it particularly sensitive to local fluctuations in hydrological loading. InSAR, on the other hand, provides extremely high spatial resolution, allowing the mapping of ground deformations on the order of millimeters. In addition to monitoring crustal deformations, the GRACE and GRACE-FO (Gravity Recovery and Climate Experiment – Follow-On) missions allow for the monitoring of variations in water storage on a regional scale (~ 300 km) with monthly temporal resolution, ideal for characterizing medium and long-term hydrological events [11].
GRACE data in integrated analysis allows for the direct linking of surface deformation with changes in mass storage [12]. This integration has been particularly relevant in studies of subsidence induced by groundwater extraction and drought. The approach uses InSAR to provide the spatial distribution of relative deformation, GPS to validate and complement absolute measurements, and GRACE to interpret these deformations in terms of variations in water mass [13]. This combination facilitates the development of geodynamic models that relate hydrological loading to the elastic or inelastic response of the Earth’s crust [14].
Recently, joint inversion approaches have been developed that integrate these three data sources (e.g., [15,16]), allowing for a more precise estimation of groundwater loss and its impact on ground deformation. In addition, the integration of these independent datasets offers a unique opportunity to investigate the spatiotemporal relationships and dynamics between drought indicators, water storage changes, and crustal deformation. Previous studies have demonstrated the potential of combining GPS, InSAR, and GRACE to quantify groundwater depletion, aquifer recharge, and hydrological loading effects. However, integrated analyses of these observations associated with local hydrogeological characteristics remain limited in Brazil, particularly in complex socio-hydrological systems such as the Cantareira System.
The main objective of this study is to develop and apply a geodetic-based framework to assess drought intensity and hydrological dynamics in the Cantareira System. By jointly analyzing deformation, water storage anomalies, meteorological drought indices, and reservoir data, we aim to improve the understanding of drought processes and support sustainable water resource management in southeastern Brazil.
2. Study Area
The study area comprises Piracicaba, Capivari and Jundiaí rivers basin (PCJ) as well the Upper Tietê river basin (UT), where the reservoirs of the Cantareira System are located (Figure 1). This region is characterized by complex hydrogeological settings, strong seasonal climate variability, and intense anthropogenic pressures related to urbanization, industry, and agriculture.
The UT and PCJ basins constitute the central framework of the water supply system for the MRSP. The UT basin encompasses most of the MRSP, a highly urbanized and industrialized region, resulting in high-water demand. The PCJ basin, located upstream of the Tietê River, plays a critical role in surface water production and abstraction, supplying approximately 50% of the water consumed in the MRSP [17].
To address the growing water demand in the MRSP, the Cantareira System was implemented starting in the 1970s. It represents one of the largest interbasin water transfer systems worldwide, comprising six reservoirs (Jaguari, Jacareí, Cachoeira, Atibainha, Paiva Castro, and Águas Claras) covering a total area of approximately 2300 km² (Figure 1). The first four reservoirs capture water directly from the PCJ basin, which is subsequently transferred to the UT basin through a network of tunnels, canals, and pumping stations [17].
As a result, the PCJ basins are responsible for supplying water to more than 14 million people, including approximately 6 million within the basin itself and about 9 million in the MRSP. Within the PCJ basin, domestic use accounts for the largest share of water consumption (64%), followed by industrial use (26%) and irrigated agriculture (5%) [18]. In the MRSP, 47% of the total water demand is met by the Cantareira System, increasing to 65% within the city of São Paulo.
From a hydrogeological perspective, the PCJ basin is predominantly underlain by sedimentary units of the Paraná Basin, including sandstones and siltstones, as well as basalts of the Serra Geral Formation [19]. These lithologies are associated with well-developed Oxisols and Ultisols, in addition to Entisols in steeper terrains [20]. Such conditions favor the development of porous aquifer systems with high storage capacity, as well as fractured aquifers within basaltic units. In contrast, the UT basin is located within the Atlantic Orogenic Belt, where Precambrian crystalline rocks (granites, gneisses, and migmatites) predominate. Soils in this region are generally shallower and more heterogeneous, mainly Inceptisols and Ultisols, which restrict deep infiltration and promote fractured aquifers characterized by lower productivity and high spatial variability.
In morphoclimatic terms, both basins exhibit a humid tropical to subtropical highland climate, with mean annual precipitation ranging from 1200 to 1600 mm, concentrated during the austral summer. However, the PCJ basin displays a transitional geomorphological setting, consisting of gently undulating plateaus interspersed with prominent basaltic cuestas, which favor regional groundwater recharge. In contrast, the UT basin is characterized by a more rugged and compartmentalized relief, including the Serra do Mar and the Planalto Paulistano, combined with intense urbanization, high surface impermeability, and rapid hydrological responses. These contrasting features result in significant differences in water availability and groundwater storage dynamics between the two basins.
3. Dataset
3.1. GPS Vertical Displacement
Daily positioning time series from four GPS stations located within the study area (Figure 1) were used for the period 2020–2025. In this study, we employed the daily vertical component solutions provided by the Nevada Geodetic Laboratory (NGL) [21], which have been widely demonstrated to be suitable for detecting geophysical signals, particularly elastic deformation associated with hydrological loading processes. Hereafter, GPS-derived vertical displacement is denoted as GPS-VD.
The GPS solutions were generated using Precise Point Positioning (PPP) with ambiguity resolution and include corrections for solid Earth tides, ocean tidal loading, pole tide, tropospheric and ionospheric effects, as well as antenna phase center variations. The processing was carried out by the NGL using the GipsyX software (version 1.0), and the resulting coordinates are linked to the IGS20 reference frame.
Further details regarding the processing strategy and applied corrections can be found in the official NGL documentation (https://geodesy.unr.edu/gps/ngl.acn.txt).
3.2. InSAR Data and Processing
The area of interest was covered by a total of ~ 200 SAR images, used as input for each processing step in different frames. These C-band images were acquired as a Single Look Complex (SLC) product, containing the interferometric phase, with a frequency of 5.405 GHz corresponding to a wavelength of 5.55 cm. The SAR images were obtained from the Sentinel-1 active radar SAR sensor in a 156° downward relative orbit, measured line of sight (LOS), using the wide interferometric (IW) mode, which is Sentinel-1’s primary ground acquisition mode. The data were acquired using TOPSAR (Terrain Observation by Progressive Scanning SAR) [22], a SAR imaging technique that uses the satellite antenna to generate high-bandwidth images with a 250 km swath and a spatial resolution of 5mx20m during acquisition. However, for processing purposes, a spatial resolution of 90mx90m was used in range and azimuth. Table 1 presents the features of the Sentinel 1 images used.
InSAR processing was carried out using the Parallel Small Baseline Subset (P-SBAS) algorithm, an advanced implementation of the SBAS approach that incorporates parallel computing strategies for the efficient handling of large multitemporal SAR datasets. Images acquired by the Sentinel-1 satellite were used, ensuring adequate temporal coverage and interferometric coherence. The processing workflow included the selection of interferometric pairs with small spatial and temporal baselines, precise co-registration of SAR images, generation of differential interferograms, and removal of the topographic phase using a digital elevation model (DEM). Subsequently, adaptive filtering techniques were applied to reduce noise and enhance coherence, followed by phase unwrapping and the estimation of line-of-sight (LOS) displacements. The P-SBAS approach [23,24] enables a robust and efficient time-series inversion, providing deformation time series and mean velocity maps, while also mitigating atmospheric effects through spatio-temporal filtering. This methodology has demonstrated high accuracy in detecting millimetric deformations associated with subsidence,making it particularly suitable for regional-scale studies and long-term deformation analysis [25,26,27].
3.3. GRACE/GRACE-FO Data
We used the latest GRACE/GRACE-FO mascon (mass concentration) solutions, Release 06 (RL06), developed by the Center for Space Research (CSR) at The University of Texas at Austin. These products represent variations in terrestrial water storage (TWS), expressed as anomalies relative to a mean reference field over the period 2004.000 to 2009.999, commonly referred to as terrestrial water storage anomalies (TWSA). The mascon approach discretizes the Earth’s surface into finite spatial elements within which mass variations are directly estimated. This strategy significantly reduces the effects of spatial filtering, signal attenuation (leakage), and noise amplification that commonly affect spherical harmonic solutions, thereby improving the effective spatial resolution and hydrological interpretability of the data.
The CSR mascon solutions include corrections for solid Earth tides, ocean tides, polar motion tides, non-tidal atmospheric and oceanic mass variations (AOD1B correction), as well as glacial isostatic adjustment (GIA). The resulting fields represent the integrated contribution of the main continental water reservoirs, including soil moisture, surface water, groundwater, snow (when present), and water stored in vegetation. The dataset consists of 72 monthly solutions, provided as regular grids with a spatial resolution of 0.25°x0.25°, covering the period from January 2020 to December 2025, while preserving the nominal spatial resolution of approximately 300 km, consistent with the resolving capability of the GRACE and GRACE-FO missions.
3.4. Groundwater Variations
Piezometric data from four monitoring wells were used to characterize groundwater levels in the study area. All wells are in the PCJ basin (Figure 1), and the data were obtained from the São Paulo State Water Agency (SPWA). Measurements were taken manually (approximately four times a month), and the average was used to generate a monthly time series. These data provide critical insights into the propagation of hydrological droughts and are fundamental for evaluating the resilience and storage dynamics of aquifer systems.
3.5. Ancillary Data
The Brazilian Drought Monitor (https://monitordesecas.ana.gov.br/) provides a standardized and continuously updated assessment of drought conditions throughout the country, including the state of São Paulo. In this study, we employed the S2 index for São Paulo state, which represents the percentage of the area under severe drought, with SPI/SPEI between -1.3 and -1.6 [28,29]. Although the index is available at the state level, its use is justified to represent the PCJ and Alto Tietê basins, since these basins encompass a substantial portion of the hydrologically monitored areas of the state and include the main headwaters that supply the MRSP. The high density of meteorological stations in these basins minimizes spatial variability, making the index at the state level a reliable indicator of local drought dynamics. For the purposes of this study, the index was used only to allow comparison with other datasets.
Ancillary datasets describing the geological, hydrogeological, and pedological context of the study area were also used to support the interpretation of the results. Lithological information was obtained from the Geological Map of Brazil, provided by the Geological Survey of Brazil [19]. Aquifer and outcrop data were derived from [30], and soil classes were obtained from the Soil Map of Brazil [20]. All datasets were organized within a common geospatial framework and used to provide environmental context for the analyses.
A summary of the datasets used in this study, including their spatial and temporal resolution and specific applications, is presented in Table 2.
4. Integrated Hydrological Analysis Based on Geodetic Signals
We estimated long-term linear trends, as well as the annual amplitudes and phases, for the four GPS stations using a least-squares adjustment. Prior to this analysis, outliers in the daily coordinate time series were identified and removed using the robust Median Absolute Deviation (MAD) estimator. To reduce high-frequency noise and adjust the temporal resolution of GRACE’s terrestrial water storage, the daily observations were subsequently averaged to obtain monthly time series. To isolate deviations from normal hydrological conditions, a climatology was calculated for each station using the median, which is less sensitive to extreme values. Residual time series were then derived by subtracting the climatological signal, providing deformation anomalies relative to the expected crustal response under typical hydrological conditions in the study region (Figure 2).
To analyze the hydrological signal present in the vertical deformation time series derived from InSAR for each watershed, a spatial averaging strategy was adopted. A radius of influence centered on the barycenter of each basin was defined, and all InSAR measurement points located within this radius were selected. An average time series was then computed to represent the characteristic vertical deformation behavior of each basin. The radius defined with respect to the barycenter differed between basins according to their geometry and spatial extent. A radius of 33 km was adopted for the PCJ basin, whereas a radius of 22 km was used for the Upper Tietê basin. For the PCJ basin, 81 observations were obtained between January 2020 and January 2025, while for the Upper Tietê basin, 117 observations were available between January 2020 and November 2025. To emphasize the hydrological component of the deformation signal, the long-term linear trend was removed from the InSAR time series, assuming that this component is mainly associated with tectonic processes or long-term subsidence unrelated to seasonal hydrological forcing.
Groundwater dynamics were assessed through observations of water levels in piezometric monitoring wells. Well data were processed to remove outliers and inconsistencies, and monthly anomalies were calculated relative to long-term median levels in each well. These piezometric variations were used as an independent indicator of changes in groundwater storage and were compared with both crustal deformation signals and satellite-derived hydrological variables.
Drought conditions during the study period were characterized using drought monitoring records based on precipitation, soil moisture, temperature, and other hydroclimatic variables. In addition, historical drought reports and regional hydrological bulletins were analyzed to identify major drought events and their temporal evolution. These records allowed the classification of drought phases and facilitated comparison with observed variations in crustal deformation, groundwater levels, and terrestrial water storage.
An integrated analysis was conducted to investigate the relationships between drought indicators, groundwater level variations, water storage anomalies, and crustal deformation. Cross-correlation analysis was applied to quantify the temporal relationships between GPS -VD, InSAR-derived deformation, GRACE-TWSA, drought indices, and groundwater level variations. This approach allowed the identification of potential time delays between meteorological forcing, hydrological responses, and the elastic deformation of the crust.
Additionally, we analysed the possible relationships between InSAR deformation fields and different hydrogeological characteristics (rock type, soil type, and aquifer system) to identify areas particularly sensitive to changes in groundwater storage. Lithology was generalized into three classes (sedimentary, igneous, and metamorphic rocks), while soil types were considered according to the full classification available within the study area. Aquifer systems were grouped into three hydrogeological domains (karstic, fractured, and porous media).
To this analysis, we performed an ANOVA test to evaluate statistically significant differences between the means of the observed deformations in each class of each category. The test was conducted with a significance level of =0.05 (95% confidence). This approach is based on the analysis of the total variability of the data in “between categories” and “within categories” components and is a robust statistical technique for performing multiple comparisons between the means of different populations. The statistic is calculated by [31,32]:
where is the mean square between categories; is the mean square within each category; k is the number of classes in a category; n is the number of observations in each class; and X and represent the observations and their means, respectively. The null hypothesis is equality between the means of each class, and the alternative hypothesis is that at least one mean differs significantly from the others.
Finally, based on the integration of geodetic, hydrological, and meteorological observations, a geodetic-based framework for drought assessment was developed. This framework combines deformation observations from GPS and InSAR, terrestrial water storage anomalies from GRACE, groundwater level variations, reservoir storage data, and meteorological drought indicators to identify drought phases and quantify hydrological deficits. This integrated approach enables the evaluation of drought intensity from both hydrological and geodetic perspectives, providing complementary insights into regional water dynamics and supporting improved monitoring and management of water resources in the Cantareira System.
5. Results
The integrated analysis of GPS, InSAR, GRACE, groundwater, and drought records reveals consistent spatiotemporal patterns of hydrological variability and associated crustal deformation across the Upper Tietê and PCJ basins during the period 2020–2025. The GPS-VD exhibit marked spatial variability in long-term trends (Table 3; Figure 2). The POLI station shows a pronounced uplift (1.0 mm/yr), while EACH and SPC1 display weak positive trends. In contrast, the SPBP station presents a negative trend, indicating subsidence. Despite these differences, the seasonal components are remarkably consistent across all stations, with annual amplitudes ranging between ~6.3 and 7.4 mm and phases clustered within a narrow interval (~53°–63°), indicating a coherent seasonal signal across the study area. The temporal evolution of the residual time series (Figure 2) shows recurrent oscillations with similar timing, suggesting a common regional forcing.
The GRACE/GRACE-FO TWSA time series for both basins exhibit strong interannual variability characterized by quasi-seasonal oscillations (Figure 3). Periods of strong negative anomalies are observed around 2021–2022 and again during 2024–2025, while positive anomalies peak during 2023. Although both basins display a high degree of temporal coherence, the magnitude of anomalies differs, with the PCJ basin showing larger negative excursions, reaching values close to -400 cm, whereas the Upper Tietê basin exhibits comparatively attenuated variations. In terms of long-term behavior, the Upper Tietê basin shows near-stable to slightly positive tendencies, while the PCJ basin presents a persistent negative trend over the analyzed period.
A cross-correlation analysis between GPS-VD and GRACE-derived TWSA reveals a strong temporal coupling in both basins, with a consistent lag of one month. In the Alto Tietê basin, the correlation is very strong (=0.8). In contrast, the PCJ basin exhibits a moderate-to-strong correlation (=0.5), indicating a weaker yet still significant coupling.
The detrended InSAR time series for both basins reveals clear temporal variability that aligns with hydrological conditions (Figure 4). Periods characterized by reduced water storage correspond to positive deformation (uplift), whereas intervals of increased water availability coincide with negative deformation (subsidence). The temporal evolution of deformation follows a similar pattern to TWSA and drought records, with pronounced anomalies during dry periods and reduced variability during wetter phases. The amplitude of deformation varies between basins, with the Upper Tietê basin showing stronger signals compared to the PCJ basin.
Groundwater level anomalies in the PCJ basin exhibit a clear temporal evolution consistent with the other hydrological indicators (Figure 5). Between 2020 and mid-2022, groundwater levels show a progressive decline, reaching minimum values close to -1 m. A rapid increase is observed from late 2022 to 2023, with positive anomalies exceeding 1.5 m. Subsequently, during 2023–2024, groundwater levels fluctuate around near-equilibrium conditions, followed by a renewed decline toward 2025. These variations display temporal correspondence with both TWSA (Figure 3) and InSAR-derived deformation signals (Figure 4).
The EOF/PCA (Empirical Orthogonal Functions/ Principal Component Analysis) decomposition of the InSAR deformation fields reveals a hierarchical structure in both basins (Figure 6 and Figure 7). In the Upper Tietê basin, the first mode explains approximately 58% of the total variance and exhibits a spatially coherent pattern across most of the basin (Figure 6). The associated temporal component shows a smooth long-term evolution with superimposed oscillations. The second and third modes explain smaller fractions of the variance (~7% and ~4%, respectively) and present more heterogeneous spatial patterns, while their temporal components are dominated by oscillatory behavior without clear long-term trends. The fourth mode explains a marginal fraction (~3%) and is characterized by highly localized spatial features and irregular temporal variability.
In the PCJ basin, the first mode explains approximately 45% of the total variance and presents a relatively coherent spatial pattern, although with more pronounced internal contrasts (Figure 7). Its temporal component exhibits a clear long-term trend. The second and third modes (~9% and ~8%) display increasingly fragmented spatial patterns and temporal variability dominated by short-term oscillations. The fourth mode (~4%) accounts for a small portion of the variance and is characterized by localized spatial features and irregular temporal behavior.
We evaluated the potential influence of hydrogeological setting on the spatial variability of InSAR-derived deformations (PC1) using a one-way ANOVA test, performed separately for the two basins: PCJ (n=192.402) and Upper Tietê (n=323.384). The results are presented in Figure 8 as boxplots, which illustrate the distribution of deformation values across the different categories and basins.
The ANOVA test results indicate statistically significant differences in mean deformation rates for all tested categories, with consistently large F-values, exceeding the critical threshold in all cases, confirming strong rejection of the null hypothesis (=0.05). For lithology (F=673.4, Fcritical=2.2), more pronounced deformations associated with igneous terrains was observed, while the PCJ basin exhibits overall positive mean deformation values, in contrast to slightly negative values observed in the Upper Tietê basin. Soil type also showed significant variability (F=666.5, Fcritical=2.2), with finer-textured soils associated with higher-magnitude deformation compared to coarser, well-drained soils. Similarly, aquifer systems revealed significant differences (F=1060.6, Fcritical=2.6), with fractured aquifers exhibiting the largest average deformation rates. The boxplot distributions further confirm a separation between classes and between basins. Collectively, these findings reject the null hypothesis for all tested factors, indicating that InSAR-derived deformation is, at least in part, modulated by lithological, pedological, and hydrogeological controls.
6. Discussion
The results show a strong correlation between hydrological variability and crustal deformation, reflecting the sensitivity of the Cantareira System to both climatic forcing and anthropogenic influences. This coherence, however, manifests itself differently between the two basins analyzed, indicating that the integration of different geodetic observations, associated with hydrogeological features, provides a robust perspective for understanding the dynamics of droughts in the region.
In the PCJ basin, where crystalline rocks and fractured aquifers predominate, the response is mostly elastic and strongly controlled by regional climatic variability. This indicates a high degree of coherence between InSAR and GRACE, with inverse response and near-zero delay, suggesting an efficient coupling between water storage and crustal deformation. The SPBP station, located in this basin, differs from the other GPS stations used in this study by presenting a structural control dominated by a fractured aquifer system, which results in a slightly negative linear trend and the largest phase difference observed between the stations analyzed.
Agricultural activity places a significant demand on the PCJ basin [33]. Water extraction is cyclical and linked to irrigation periods, resulting in an annual response of InSAR deformations through seasonal soil contraction and expansion. Hydrologically, this region exhibits a pronounced interannual behavior of TWSA (strong negative trend, see Figure 3), revealing the effectiveness of GRACE in detecting accumulated water storage deficits caused by multi-year droughts (as in [34] and [35]). This scenario in the PCJ basin may signal the beginning of a state of “water bankruptcy”, where persistent damage to reserves and sustained reduction in river flow prevent the system from returning to its normal storage levels [36].
In the Upper Tietê basin, in turn, the hydrological response is conditioned by intense urbanization and continuous groundwater exploitation. Outside the Northeast region (semi-arid), the state of São Paulo has the highest density of tubular wells for groundwater extraction in Brazil [37], which may intensify these hydrogeodetic responses. Located in the São Paulo Sedimentary Basin (surrounded by crystalline environments such as the Cantareira and Coastal montain ranges), the POLI and EACH stations show greater seasonal amplitudes, consistent with the greater storage capacity of the porous media. However, the positive linear trends of InSAR deformations (PC1, see Figure 6a and and Figure 7a), indicative of water loss in the medium and long term [38], show magnitudes lower than those observed in the PCJ basin (Figure 8), suggesting a partial decoupling between hydrological variations and deformational response in highly urbanized environments.
Soil impermeability, the presence of underground infrastructure, and the artificial management of water flows tend to reduce infiltration and the effective variability of storage, attenuating the expression of the geodetic signal [39]. In this context, although the system is also subject to water deficit, its deformational response is dampened. EOF analysis reinforces that, despite the dominance of a common regional signal, higher-order modes capture the spatial heterogeneity associated with local controls, including geological structure and water use [10]. In fact, the higher spatial resolution of InSAR observations allows for the additional detection of signals that occur at very short spatial wavelengths, such as deformations corresponding to variations in water storage in shallow aquifers [40].
The results of the ANOVA test applied to PC1 of the InSAR deformations confirm that rock, soil, and aquifer types exert a statistically significant influence on the magnitude of these deformations, even when the differences are subtle. These magnitude differences have already been identified in other studies (e.g., [39,41]). This shows that the deformational response results from a system in which hydrogeological and anthropogenic controls act in an integrated manner. Although the differences in deformations are subtle, they are consistent and systematic when analyzed together. In this context, the ANOVA test, applied to a robust sample set, demonstrates high statistical sensitivity, allowing for the discrimination of these variations.
Analyzing the responses of the different datasets to the occurrence of droughts in the Cantareira System, we observed that the record of severe drought (Figure 4) is completely characterized by the sensors used and that the intensity of this drought is reflected in the amplitude of these observations. With the onset of the drought in mid-2020, the following can be consistently observed: decline in well levels, crustal uplift (InSAR and GPS), and negative TWS anomaly. At the beginning of 2022, water storage levels rise, and once again, the geodetic signals are strongly affected by this process, with crustal subsidence and a positive TWS anomaly.
Since the long-term TWS anomaly maintains the accumulated record of intense droughts in the study area and the non-recovery of the system, we highlight the PC3 component of the InSAR deformations as an effective marker of the intensity of the 2021/2022 drought in both basins (Figure 6 and Figure 7). This behavior can also be observed in the integral InSAR signal of the Upper Tietê Basin (Figure 4), but not in the PCJ basin, showing that the decomposition of InSAR deformations contributes significantly to the understanding of drought dynamics.
The drought recorded in the second half of 2024 can also be observed in the geodetic data, although with less intensity and smaller ranges of variation. However, due to the shorter period of occurrence, the response of the observations tends to merge with the response of the drought indicated in 2025, suggesting that both are part of the same event and that the rainy period (water storage recharge) was again insufficient to remove the system from a critical state.
From a methodological perspective, the integration of GPS, GRACE, and InSAR data proves particularly effective for capturing hydrological processes at different spatial and temporal scales. While GRACE provides information on regional variations in total water storage, InSAR allows for the identification of patterns. Detailed spatial data on surface deformation, and GPS offers continuous and independent time series for validation. This integrated approach expands the capacity for drought monitoring and assessment of changes in the hydrological system.
Nevertheless, some limitations must be considered, such as the low spatial resolution of GRACE, the susceptibility of InSAR to atmospheric noise and decorrelation problems, as well as the limited coverage of groundwater data. Despite this, the consistency between the different datasets reinforces the robustness of the interpretations and highlights the potential of integrated geodetic techniques to advance the understanding of complex hydrological systems.
7. Conclusions
By integrating geodetic observations and hydrological data (including GNSS, InSAR, GRACE/GRACE-FO, groundwater level records, and meteorological indicators), this paper examines the dynamics of drought in the Cantareira Water Supply System. The findings illustrate that crustal deformation yields a robust and physically consistent proxy for hydrological variability at several spatial and temporal scales. There is strong coupling between variation in terrestrial water storage and vertical land motion: drought periods are characterized by groundwater depletion, negative TWS anomalies, and crustal uplift, whereas wet conditions are associated with subsidence. This interrelationship demonstrates the sensitivity of geodetic observations to hydrological loading and the utility of these findings for assessing droughts. The PCJ and Upper Tietê basins show that hydrogeological conditions and anthropogenic pressures have a major influence on the deformation signals. The PCJ basin reacts directly and predominantly elastically to regional hydrological forcing and the Upper Tietê basin is muted and partially decoupled, which is presumably associated with intensive urbanization, decreased infiltration, and sustained groundwater extraction.
The PCA/EOF decomposition of InSAR time series is used to separate regional hydrological signals from local processes, thus allowing for identification of drought-related components and to enhance the interpretation of spatial deformation patterns. Furthermore, ANOVA results indicate the influence of lithology, soil type, and aquifer systems on the magnitude of observed deformation. The presented integrated framework effectively captures the temporal evolution and intensity of drought events during the 2020-2025 period, indicating signs of incomplete hydrological recovery and potential long-term water storage deficits.
The findings point to a rising vulnerability of the Cantareira System to persistent drought conditions. On the other hand, for GRACE data there may be spatial resolution drawbacks and InSAR noise, whereas independent observations of groundwater are scarce, however the high consistency of the independent datasets indicates the overall robustness of the results. The framework for multi-sensor technology described here presents a robust approach for drought assessment and water resource monitoring in regions lacking conventional hydrological data. This work emphasizes the potential for remote sensing and geodetic techniques to assist in enhancing the understanding of complex hydrological systems and decision-making of water resources in the face of increasing climatic and anthropogenic pressures.
Author Contributions
Conceptualization, H.M.C., and Y.M.A.; methodology, M.M., P.J.V.D., H.M.C, Y.M.A. and F.O.; data processing, H.M.C., A.C.C., F.O. and Y.M.A.; formal analysis, M.M., P.J.V.D., Y.M.A., H.M.C. and F.O.; writing—original draft preparation, H.M.C. and Y.M.A.; writing—review and editing, M.M., P.J.V.D., H.M.C., Y.M.A., F.O., A.C.C. All authors have read and agreed to the published version of the manuscript.
Acknowledgments
The authors gratefully acknowledge the institutions and agencies that provided the datasets used in this study. GNSS time series were obtained from the Nevada Geodetic Laboratory (NGL), University of Nevada, Reno. Surface deformation fields were derived from Sentinel-1 SAR data provided by the European Space Agency (ESA) through the ESA Network of Resources (NoR) Sponsorship Programme (Project ID: 5c05AP). Terrestrial Water Storage Anomalies were obtained from GRACE and GRACE-FO mascon solutions provided by the Center for Space Research (CSR), The University of Texas at Austin. Groundwater level data were kindly provided by the São Paulo State Water Agency (SPWA), Brazil. Drought indices were obtained from the Agência Nacional de Águas e Saneamento Básico (ANA), Brazil.
Conflicts of Interest
The authors declare no conflict of interest.
References
- World Meteorological Organization. State of the Global Climate 2020; WMO-No. 1264; World Meteorological Organization: Geneva, Switzerland, 2021. [Google Scholar]
- Tundisi, J.G. Recursos hídricos no futuro: Problemas e soluções. Estud. Avançados 2008, 22, 7–16. [Google Scholar] [CrossRef]
- Cuartas, L.A.; Cunha, A.P.M.A.; Alves, J.a.A.; Parra, L.M.P.; Deusdará-Leal, K.; Costa, L.C.O.; Molina, R.D.; Amore, D.; Broedel, E.; Seluchi, M.E.; et al. Recent Hydrological Droughts in Brazil and Their Impact on Hydropower Generation. Water 2022, 14, 601. [Google Scholar] [CrossRef]
- Adams, K.H.; Reager, J.T.; Rosen, P.; Wiese, D.N.; Farr, T.G.; Rao, S.; et al. Remote Sensing of Groundwater: Current Capabilities and Future Directions. Water Resour. Res. 2022, 58, e2022WR032219. [Google Scholar] [CrossRef]
- Ferretti, A.; Prati, C.; Rocca, F. Permanent Scatterers in SAR Interferometry. IEEE Trans. Geosci. Remote Sens. 2001, 39, 8–20. [Google Scholar] [CrossRef]
- Berardino, P.; Fornaro, G.; Lanari, R.; Sansosti, E. A New Algorithm for Surface Deformation Monitoring Based on Small Baseline Differential SAR Interferograms. IEEE Trans. Geosci. Remote Sens. 2002, 40, 2375–2383. [Google Scholar] [CrossRef]
- Orellana, F.; Moreno, M.; Yáñez, G. High-Resolution Deformation Monitoring from DInSAR: Implications for Geohazards and Ground Stability in the Metropolitan Area of Santiago, Chile. Remote Sens. 2022, 14, 6115. [Google Scholar] [CrossRef]
- Orellana, F.; Rivera, D.; Montalva, G.; Arumí, J.L. InSAR-Based Early Warning Monitoring Framework to Assess Aquifer Deterioration. Remote Sens. 2023, 15, 1786. [Google Scholar] [CrossRef]
- Giorgini, E.; Orellana, F.; Arratia, C.; Tavasci, L.; Montalva, G.; Moreno, M.; Gandolfi, S. InSAR Monitoring Using Persistent Scatterer Interferometry (PSI) and Small Baseline Subset (SBAS) Techniques for Ground Deformation Measurement in Metropolitan Area of Concepción, Chile. Remote Sens. 2023, 15, 5700. [Google Scholar] [CrossRef]
- Jiang, Z.; Hsu, Y.J.; Yuan, L.; Tang, M.; Yang, X.; Yang, X. Hydrological Drought Characterization Based on GNSS Imaging of Vertical Crustal Deformation across the Contiguous United States. Sci. Total Environ. 2022, 823, 153663. [Google Scholar] [CrossRef] [PubMed]
- Tapley, B.D.; Watkins, M.M.; Flechtner, F.; Reigber, C.; Bettadpur, S.; Rodell, M.; Sasgen, I.; Famiglietti, J.S.; Landerer, F.W.; Chambers, D.P.; et al. Contributions of GRACE to Understanding Climate Change. Nat. Clim. Change 2019, 9, 358–369. [Google Scholar] [CrossRef] [PubMed]
- Shangguan, M.; Guo, J.; Wu, S.; Zhou, X.; Zou, R.; Zhang, X. Joint Inversion of InSAR and GNSS for Surface Subsidence and Terrestrial Water Storage Anomalies of Small-Area in West-Central Yunnan Province, China. J. Hydrol. Reg. Stud. 2025, 59, 102441. [Google Scholar] [CrossRef]
- Hu, J.; Zhou, Z.; Wang, J.; Qin, F.; Wang, J.; Zhang, R.; Wang, L.; Wu, W.; Huang, L. Enhancing the Groundwater Storage Estimates by Integrating MT-InSAR, GRACE/GRACE-FO, and Hydraulic Head Measurements in Henan Plain (China). Int. J. Appl. Earth Obs. Geoinf. 2024, 131, 103993. [Google Scholar] [CrossRef]
- He, M.; Chen, T.; Pan, Y.; Jiao, J.; Wu, Q.; Lv, Y.; Jiang, W. Spatiotemporal Variability of Terrestrial Water Storage over the Tibetan Plateau from the Joint Inversion of GNSS and GRACE Observations. Sci. Rep. 2025, 15, 27168. [Google Scholar] [CrossRef] [PubMed]
- Carlson, G.; Werth, S.; Shirzaei, M. A Novel Hybrid GNSS, GRACE, and InSAR Joint Inversion Approach to Constrain Water Loss During a Record-Setting Drought in California. Remote Sens. Environ. 2024, 311, 114303. [Google Scholar] [CrossRef]
- Carlson, G.; Werth, S.; Shirzaei, M. Improving Groundwater Loss Estimates Using a Combination of GNSS, GRACE-FO, and InSAR: Case Study of California’s Recent 2020–2021 Drought. In Proceedings of the GSTM2022: GRACE/GRACE-FO Science Team Meeting, 2022; p. No. GSTM2022-2. [Google Scholar]
- Milano, M.; Reynard, E.; Muniz-Miranda, G.; Guerrin, J. Water Supply Basins of São Paulo Metropolitan Region: Hydro-Climatic Characteristics of the 2013–2015 Water Crisis. Water 2018, 10, 1517. [Google Scholar] [CrossRef]
- Agência Nacional de Àguas e Saneamento Básico. Atlas Águas: Segurança Hídrica do Abastecimento Urbano; Technical report; ANA, 2021. [Google Scholar]
- Bizzi, L.A.; Schobbenhaus, C.; Vidotti, R.M.; Gonçalves, J.a.H. Geologia, Tectônica e Recursos Minerais do Brasil: Texto, Mapas e SIG; CPRM: Brasília, DF, 2003. [Google Scholar]
- Instituto Brasileiro de Geografia e Estatística. Embrapa Solos. Mapa de Solos do Brasil, 2001. Escala 1:5.000.000.
- Blewitt, G.; Hammond, W.C.; Kreemer, C. Harnessing the GPS Data Explosion for Interdisciplinary Science. Eos 2018, 99. [Google Scholar] [CrossRef]
- De Zan, F.; Guarnieri, A.M. TOPSAR: Terrain Observation by Progressive Scans. IEEE Trans. Geosci. Remote Sens. 2006, 44, 2352–2360. [Google Scholar] [CrossRef]
- Zinno, I.; Elefante, S.; Mossucca, L.; De Luca, C.; Manunta, M.; Terzo, O.; Casu, F.; Lanari, R. A First Assessment of the P-SBAS DInSAR Algorithm Performances within a Cloud Computing Environment. IEEE J. Sel. Top. Appl. Earth Obs. Remote Sens. 2015, 8, 4675–4686. [Google Scholar] [CrossRef]
- Zinno, I.; Casu, F.; De Luca, C.; Elefante, S.; Lanari, R.; Manunta, M. A Cloud Computing Solution for the Efficient Implementation of the P-SBAS DInSAR Approach. IEEE J. Sel. Top. Appl. Earth Obs. Remote Sens. 2017, 10, 802–817. [Google Scholar] [CrossRef]
- Lanari, R.; Casu, F.; Manzo, M.; Zeni, G.; Berardino, P.; Manunta, M.; Pepe, A. An Overview of the Small Baseline Subset Algorithm: A DInSAR Technique for Surface Deformation Analysis. In Deformation and Gravity Change: Indicators of Isostasy, Tectonics, Volcanism, and Climate Change; Birkhäuser: Basel, 2007; pp. 637–661. [Google Scholar] [CrossRef]
- Casu, F.; Manzo, M.; Lanari, R. A Quantitative Assessment of the SBAS Algorithm Performance for Surface Deformation Retrieval from DInSAR Data. Remote Sens. Environ. 2006, 102, 195–210. [Google Scholar] [CrossRef]
- Manunta, M.; De Luca, C.; Zinno, I.; Casu, F.; Manzo, M.; Bonano, M.; Fusco, A.; Pepe, A.; Onorato, G.; Berardino, P.; et al. The Parallel SBAS Approach for Sentinel-1 Interferometric Wide Swath Deformation Time-Series Generation: Algorithm Description and Products Quality Assessment. IEEE Trans. Geosci. Remote Sens. 2019, 57, 6259–6281. [Google Scholar] [CrossRef]
- McKee, T.B.; Doesken, N.J.; Kleist, J. The Relationship of Drought Frequency and Duration to Time Scales. In Proceedings of the Proceedings of the Eighth Conference on Applied Climatology, Anaheim, CA, 1993; pp. 179–184. [Google Scholar]
- Vicente-Serrano, S.M.; Beguería, S.; López-Moreno, J.I. A Multiscalar Drought Index Sensitive to Global Warming: The Standardized Precipitation Evapotranspiration Index. J. Clim. 2010, 23, 1696–1718. [Google Scholar] [CrossRef]
- Diniz, J.a.A.O.; Bonfim, L.F.C.; Freitas, M.A.d. Mapa Hidrogeológico do Brasil ao Milionésimo: Sistema de Informações Geográficas – SIG. CPRM, Technical report. Recife, 2014. [Google Scholar]
- Montgomery, D.C. Design and Analysis of Experiments, 9 ed.; John Wiley & Sons, 2017. [Google Scholar]
- Kutner, M.H.; Nachtsheim, C.J.; Neter, J.; Li, W. Applied Linear Statistical Models, 5 ed.; McGraw-Hill/Irwin, 2005. [Google Scholar]
- Carvalho, A.P.P.; Lorandi, R.; Collares, E.G.; Di Lollo, J.A.; Moschini, L.E. Potential Water Demand from the Agricultural Sector in Hydrographic Sub-Basins in the Southeast of the State of São Paulo-Brazil. Agric. Ecosyst. Environ. 2021, 319, 107508. [Google Scholar] [CrossRef]
- Famiglietti, J.S.; Lo, M.H.; Ho, S.Y.; Bethune, J.; Anderson, K.J.; Syed, T.H.; Swenson, S.C.; de Linage, C.R.; Rodell, M. Satellites Measure Recent Rates of Groundwater Depletion in California’s Central Valley. Geophys. Res. Lett. 2011, 38, L046442. [Google Scholar] [CrossRef]
- Chandanpurkar, H.A.; Famiglietti, J.S.; Gopalan, K.; Wiese, D.N.; Wada, Y.; Kakinuma, K.; Reager, J.T.; Zhang, F. Unprecedented Continental Drying, Shrinking Freshwater Availability, and Increasing Land Contributions to Sea Level Rise. Sci. Adv. 2025, 11, eadx0298. [Google Scholar] [CrossRef] [PubMed]
- Madani, K. Water Bankruptcy: The Formal Definition. Water Resour. Manag. 2026, 40, 78. [Google Scholar] [CrossRef]
- Uchôa, J.G.S.M.; Oliveira, P.T.S.; Ballarin, A.S.; et al. A Groundwater Well Database for Brazil (GWDBrazil). Sci. Data 2025, 12, 1582. [Google Scholar] [CrossRef] [PubMed]
- Khorrami, M.; Shirzaei, M.; Ghobadi-Far, K.; Werth, S.; Carlson, G.; Zhai, G. Groundwater Volume Loss in Mexico City Constrained by InSAR and GRACE Observations and Mechanical Models. Geophys. Res. Lett. 2023, 50, e2022GL101962. [Google Scholar] [CrossRef]
- Guo, J.; Zhou, L.; Yao, C.; Hu, J. Surface Subsidence Analysis by Multi-Temporal InSAR and GRACE: A Case Study in Beijing. Sensors 2016, 16, 1495. [Google Scholar] [CrossRef] [PubMed]
- Ojha, C.; Shirzaei, M.; Werth, S.; Argus, D.F.; Farr, T.G. Sustained Groundwater Loss in California’s Central Valley Exacerbated by Intense Drought Periods. Water Resour. Res. 2018, 54, 4449–4460. [Google Scholar] [CrossRef] [PubMed]
- Jordan, T.E.; Lohman, R.B.; Tapia, L.; Pfeiffer, M.; Scott, C.P.; Amundson, R.; Godfrey, L.; Riquelme, R. Surface Materials and Landforms as Controls on InSAR Permanent and Transient Responses to Precipitation Events in a Hyperarid Desert, Chile. Remote Sens. Environ. 2020, 237, 111544. [Google Scholar] [CrossRef]
Figure 1.
Study area showing topography, GNSS stations, groundwater monitoring wells, and reservoirs.
Figure 1.
Study area showing topography, GNSS stations, groundwater monitoring wells, and reservoirs.
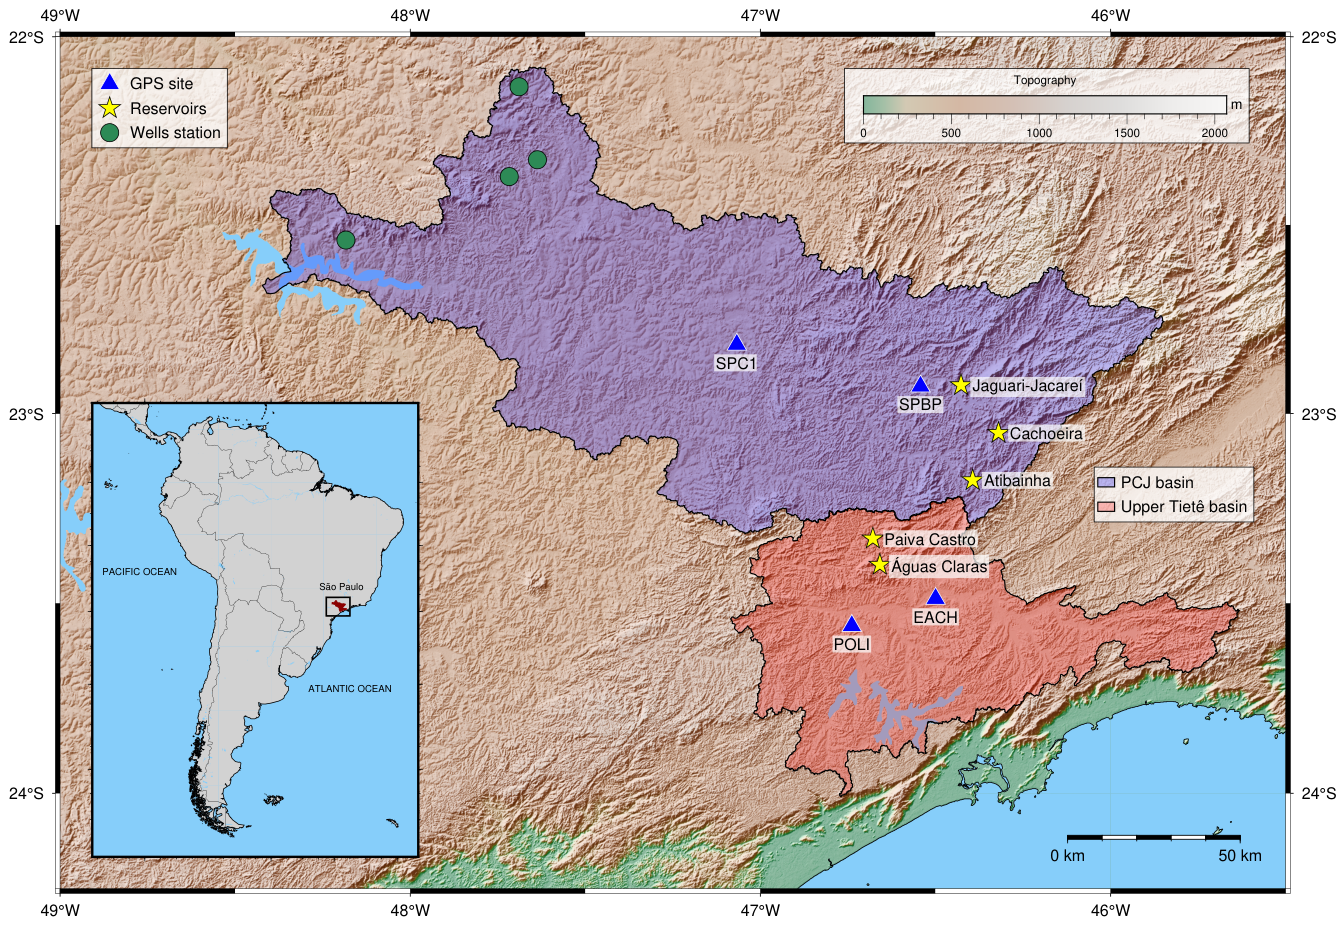
Figure 2.
Monthly residual time series after climatology removal for each respective GPS station.
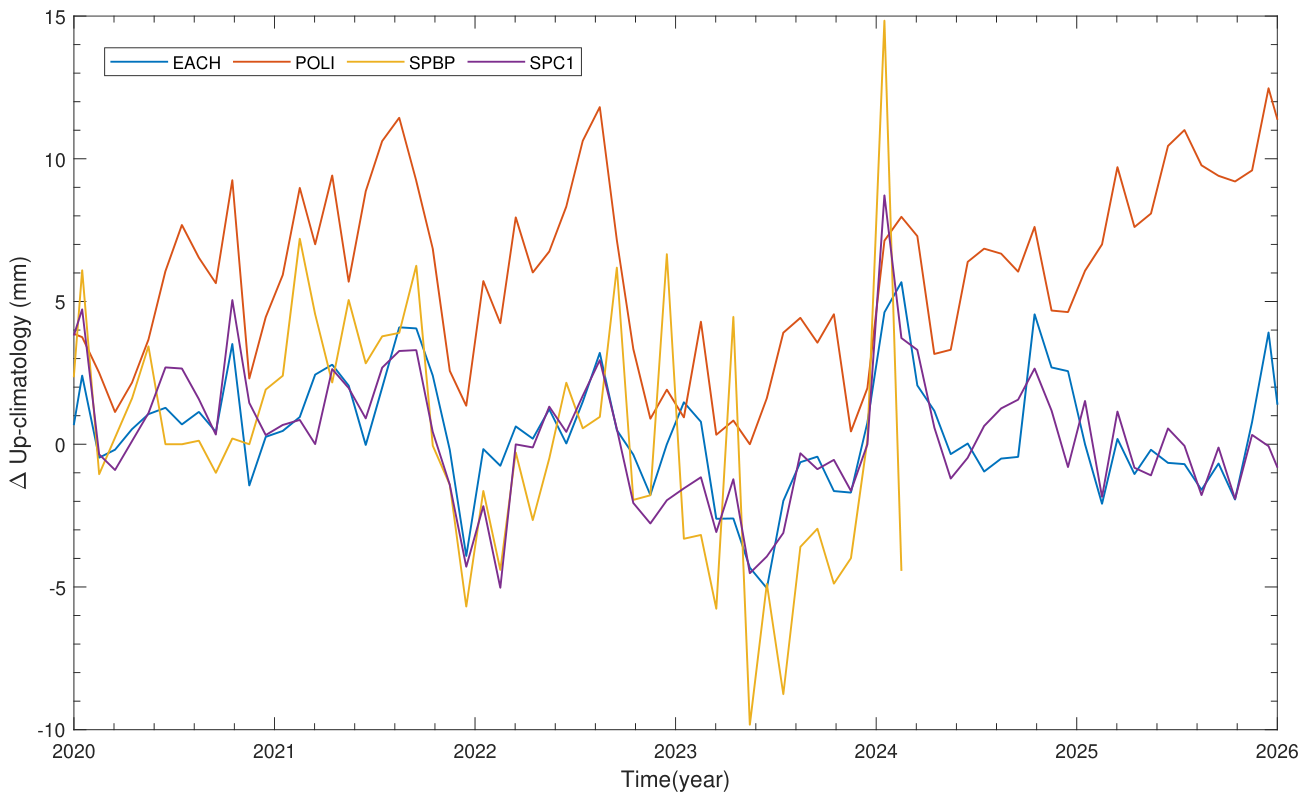
Figure 3.
Time series of terrestrial water storage anomalies and long-term trends for Alto Tiete and PCJ basins.
Figure 3.
Time series of terrestrial water storage anomalies and long-term trends for Alto Tiete and PCJ basins.
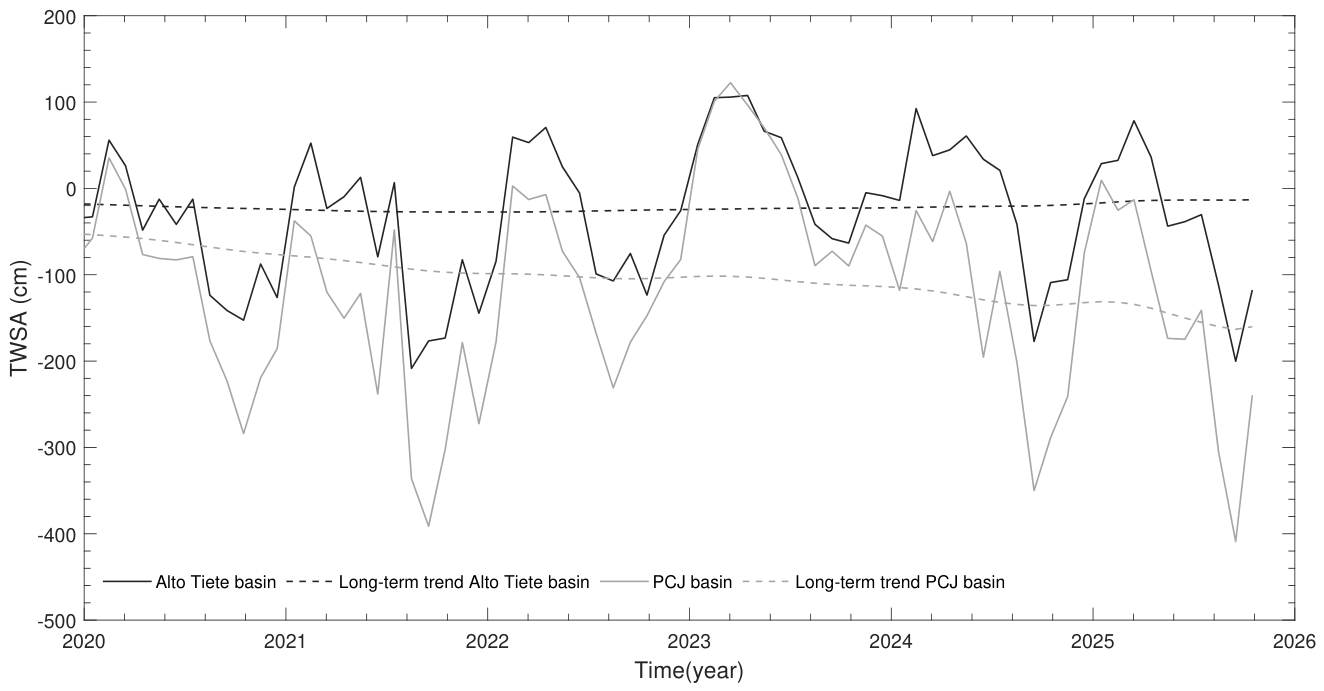
Figure 4.
Detrended time series of vertical deformation derived from InSAR, terrestrial water storage anomalies (TWSA) from GRACE, and drought records for the state of São Paulo, corresponding to the PCJ basin (upper panel) and the Alto Tietê basin (lower panel).
Figure 4.
Detrended time series of vertical deformation derived from InSAR, terrestrial water storage anomalies (TWSA) from GRACE, and drought records for the state of São Paulo, corresponding to the PCJ basin (upper panel) and the Alto Tietê basin (lower panel).
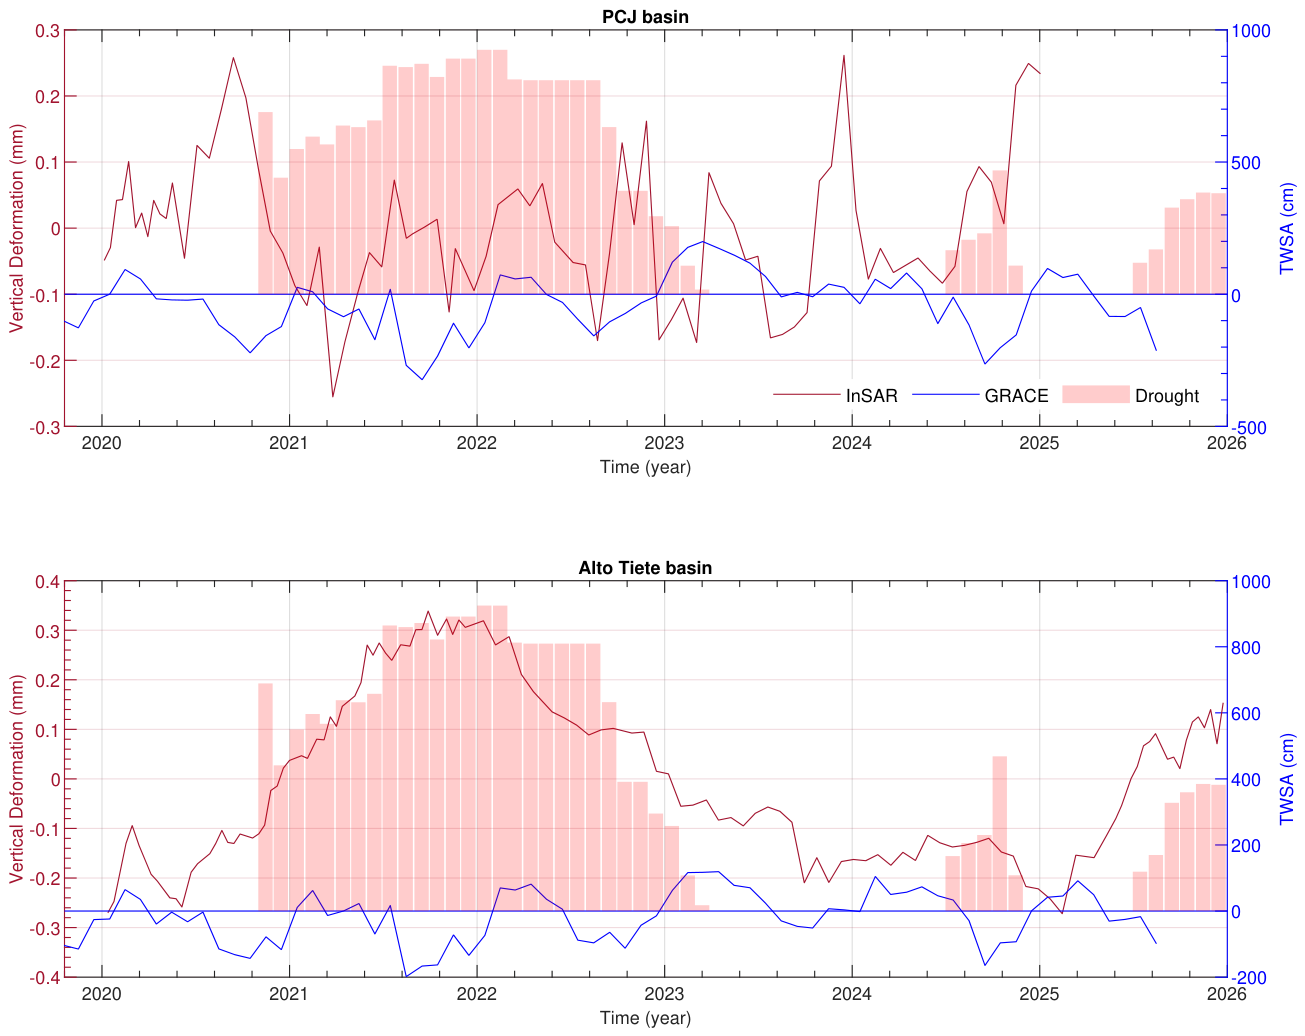
Figure 5.
Average Groundwater level variations for PCJ basin.
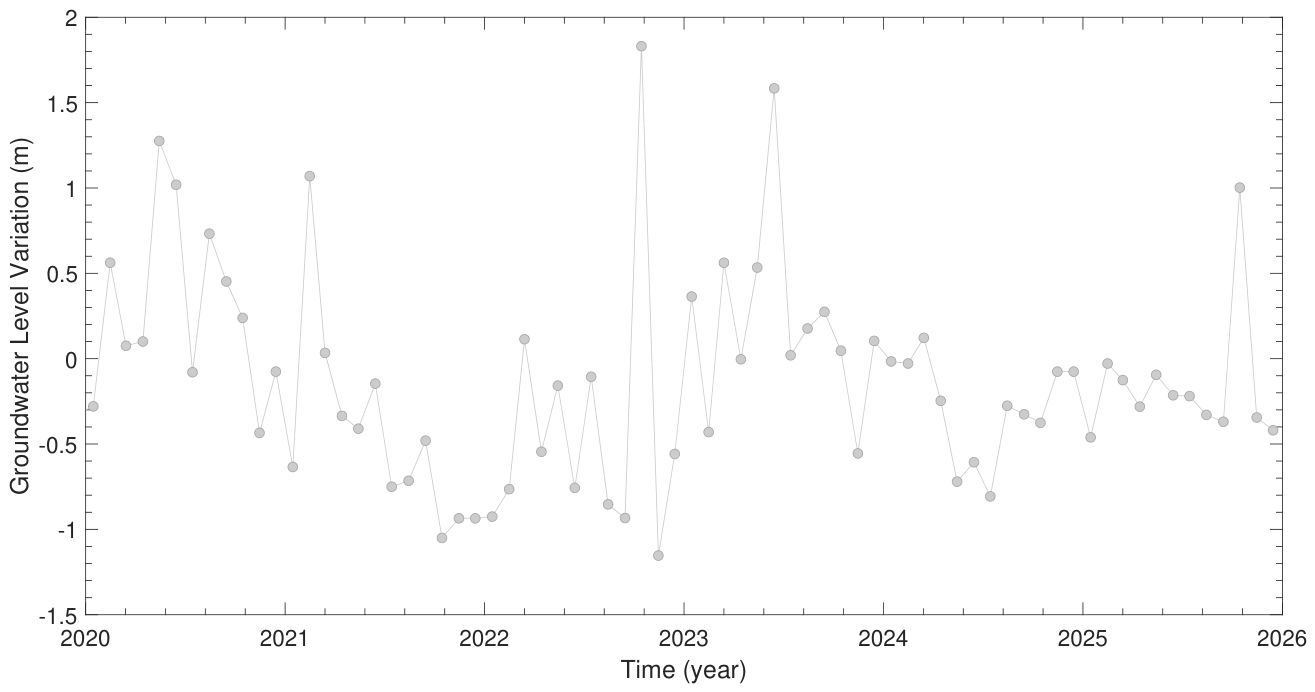
Figure 6.
Spatial patterns (EOF) and corresponding Principal Components (PC) of the InSAR deformations for the Upper Tietê basin.
Figure 6.
Spatial patterns (EOF) and corresponding Principal Components (PC) of the InSAR deformations for the Upper Tietê basin.
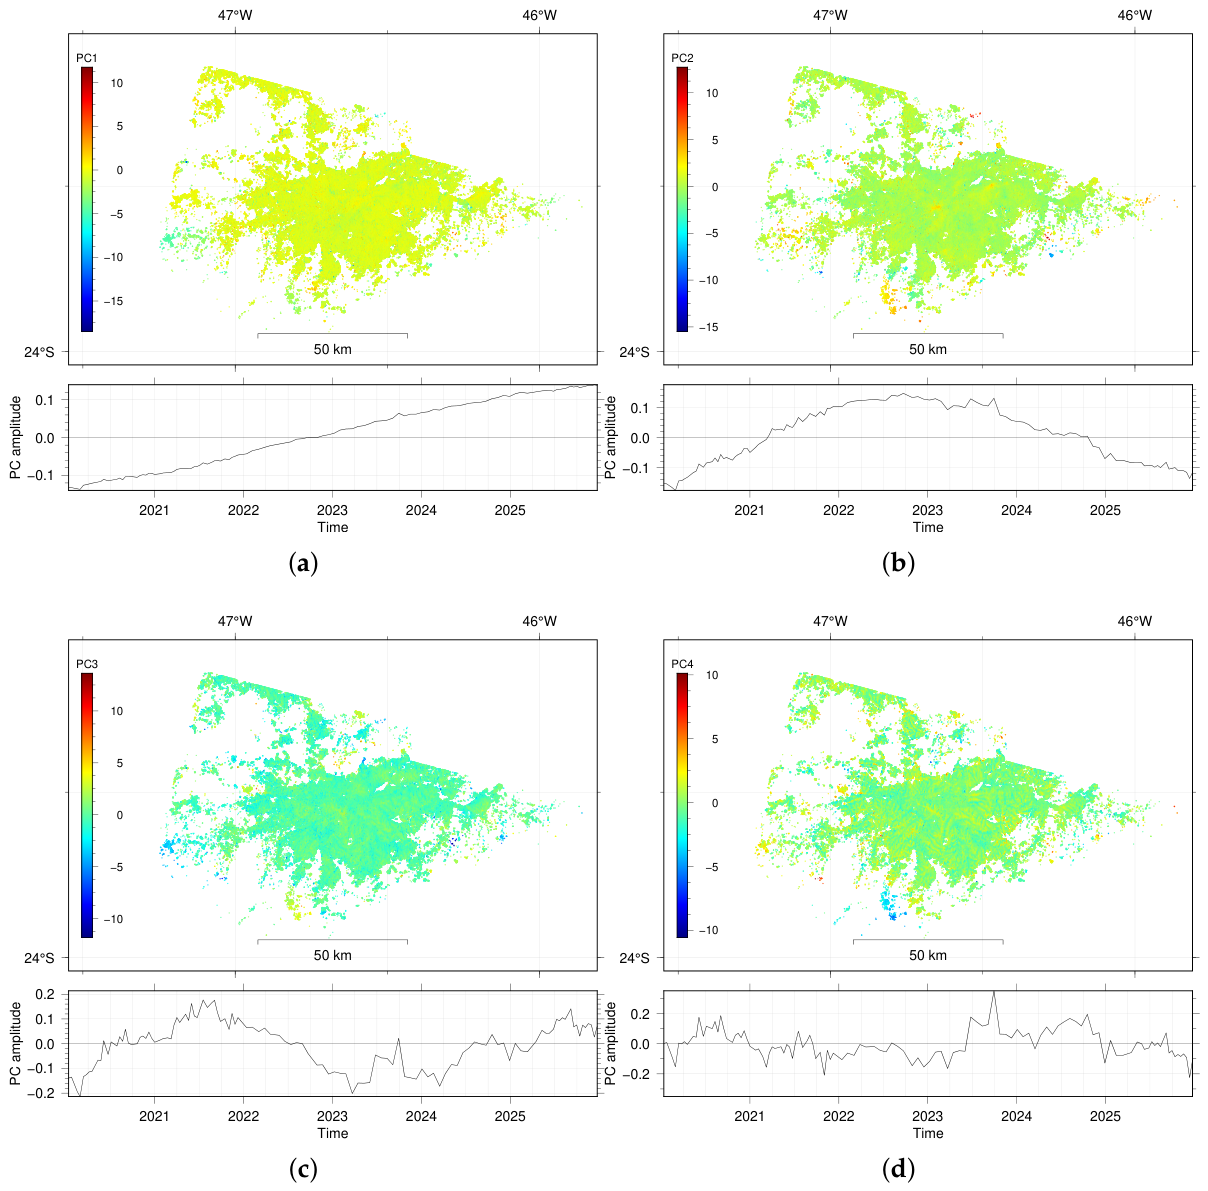
Figure 7.
Spatial patterns (EOF) and corresponding Principal Components (PC) of the InSAR deformations for the PCJ basin.
Figure 7.
Spatial patterns (EOF) and corresponding Principal Components (PC) of the InSAR deformations for the PCJ basin.
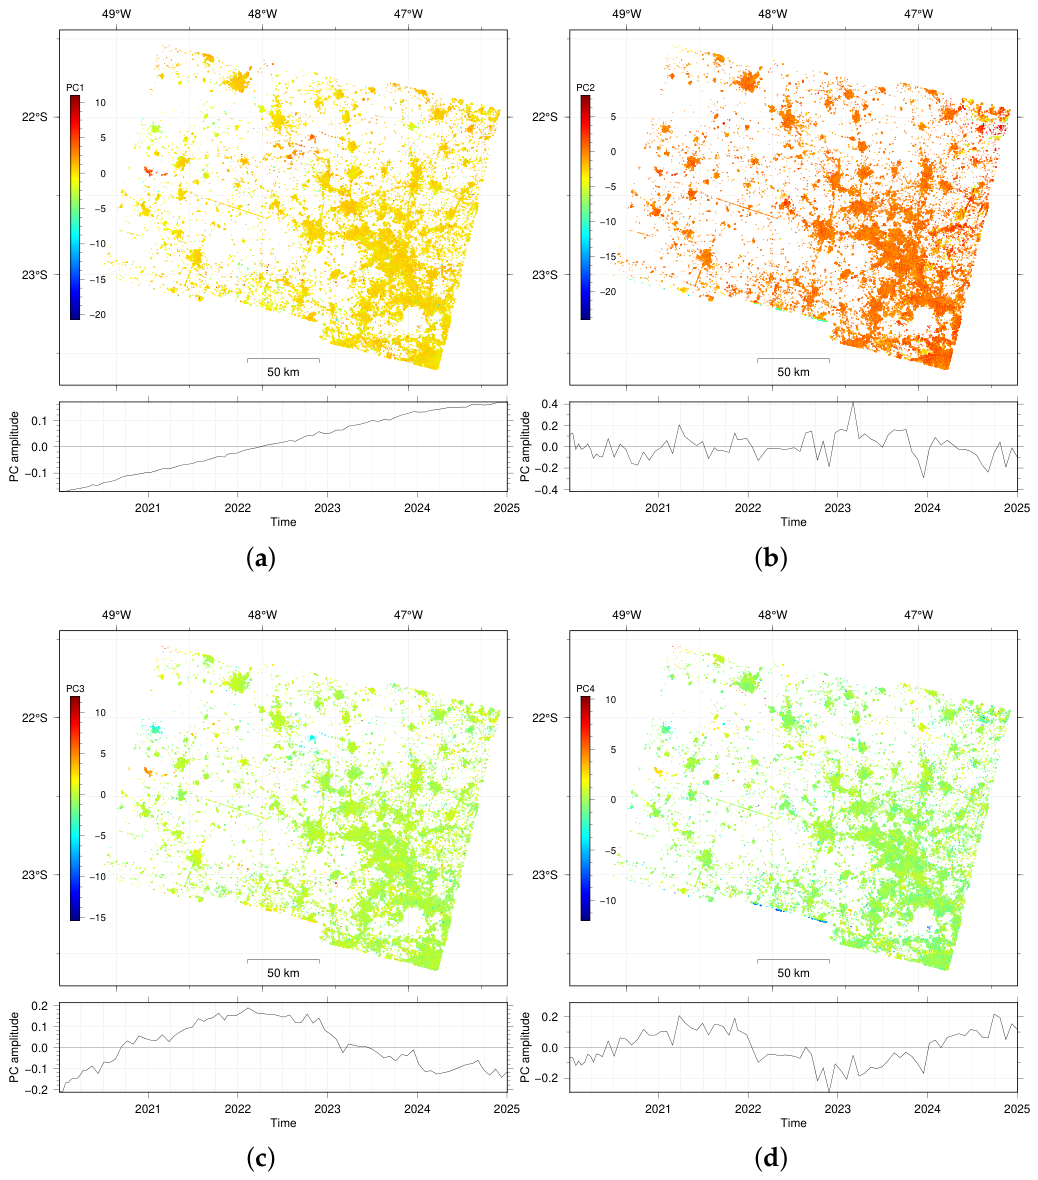
Figure 8.
InSAR-derived vertical deformations and their variability according to hydrogeological features: lithology, soil type, and aquifer type.
Figure 8.
InSAR-derived vertical deformations and their variability according to hydrogeological features: lithology, soil type, and aquifer type.
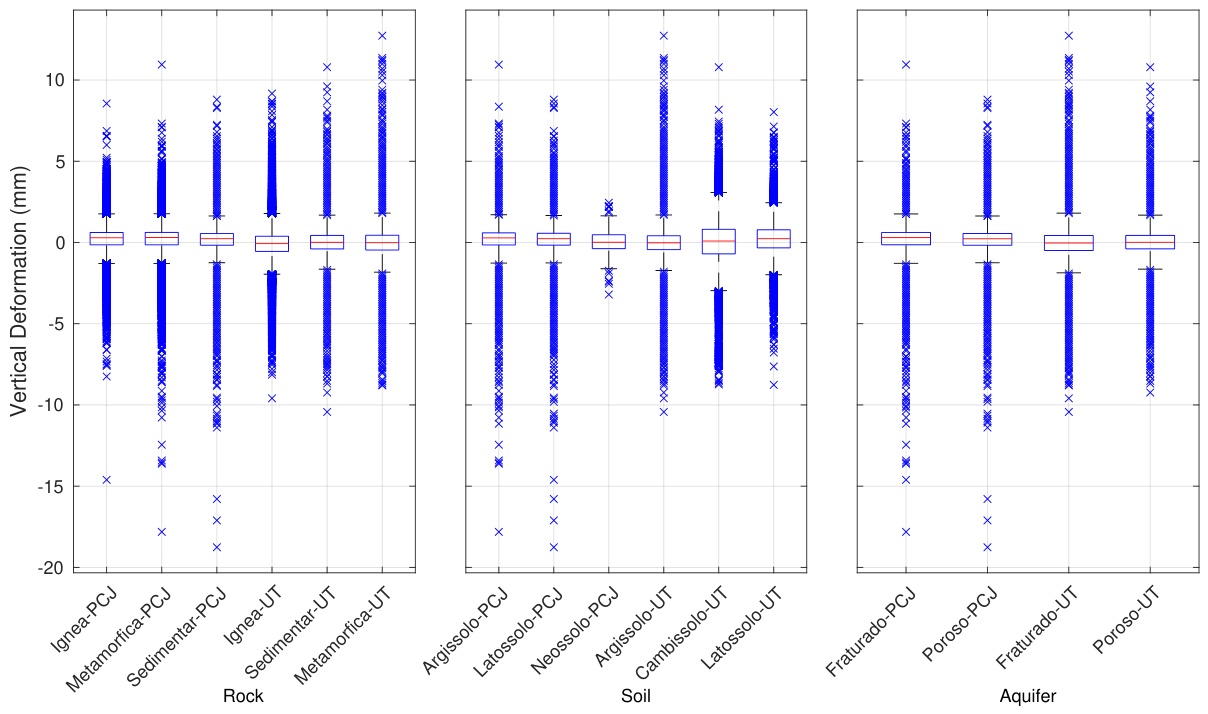

Table 1.
Features of SAR images.
| Sensor | S1 |
|---|---|
| Number of dates | 81 |
| Start date | 2020-01-04 |
| End date | 2025-01-01 |
| Mode | IW |
| Relative orbit | 126 |
| Orbit direction | Descending |
| Wavelenght (m) | 0.055 |
| Number of looks range | 20 |
| Number of looks azimuth | 5 |
| Applied filter | Goldstein 0.50 |
Table 2.
Summary of the data sets used and its application.
| Variable | Spatial res. | Temporal res. | Source |
|---|---|---|---|
| GPS-VD | point | daily | NGL |
| LOS displacements | 90 m | ~15 days | ESA |
| Terrestrial Water Storage | ~300 km | monthly | CSR |
| Groundwater Level | point | monthly | SPWA |
Table 3.
Linear trend, amplitude and annual phase of GPS time series.
| Latitude | Longitude | Trend | Annual amplitude | Annual phase | |
|---|---|---|---|---|---|
| Station | (deg.) | (deg.) | (mm/year) | (mm) | (deg.) |
| EACH | -23.482 | -46.500 | 0.11 ± 0.04 | 7.39 ± 0.12 | 52.811 ± 0.898 |
| POLI | -23.556 | -46.730 | 1.00 ± 0.05 | 6.84 ± 0.19 | 53.506 ± 1.617 |
| SPBP | -22.926 | -46.534 | -0.28 ± 0.07 | 6.69 ± 0.21 | 63.010 ± 1.820 |
| SPC1 | -22.816 | -47.063 | 0.06 ± 0.02 | 6.27 ± 0.09 | 58.986 ± 0.840 |
Disclaimer/Publisher’s Note: The statements, opinions and data contained in all publications are solely those of the individual author(s) and contributor(s) and not of MDPI and/or the editor(s). MDPI and/or the editor(s) disclaim responsibility for any injury to people or property resulting from any ideas, methods, instructions or products referred to in the content. |
© 2026 by the authors. Licensee MDPI, Basel, Switzerland. This article is an open access article distributed under the terms and conditions of the Creative Commons Attribution (CC BY) license (http://creativecommons.org/licenses/by/4.0/).
Copyright: This open access article is published under a Creative Commons CC BY 4.0 license, which permit the free download, distribution, and reuse, provided that the author and preprint are cited in any reuse.