

Submitted:
21 July 2026
Posted:
22 July 2026
You are already at the latest version
Abstract
AI-driven credit scoring is supervised as a high-risk application in banking and insurance, yet unfairness is rarely operationalized as a measurable category of model, conduct, legal, and reputational risk. Using 20,000 anonymized applications from a Southern European digital lender (15.2% twelve-month default rate), we compare a regularized logistic regression with gradient-boosting and neural-network classifiers, estimated under baseline and fairness-aware configurations (reweighing, adversarial debiasing, and reject-option adjustment), evaluating performance (AUC-ROC, Brier score, F1) jointly with group fairness (demographic-parity and equal-opportunity differences, disparate-impact ratio, Theil index). The interpretable benchmark attains an AUC of 0.734 and a Brier score of 0.162 yet already disadvantages the marginalized ethno-socioeconomic subgroup (disparate-impact ratio 0.67; equal-opportunity difference −0.165), despite excluding sensitive attributes. Higher-capacity models raise accuracy while widening disparities: the neural network reaches AUC 0.792 but a ratio of only 0.58. Mitigation reverses this cheaply, lifting the ratio to 0.85 for 1.1 AUC points under reweighing and to 0.84 while retaining an AUC of 0.765 under adversarial debiasing, so the presumed fairness–accuracy trade-off is weaker than assumed. We map these results onto the EU AI Act, GDPR, EBA, Solvency II, EIOPA, and IAIS frameworks and propose fairness-risk controls based on impact assessment, validation, and three-lines-of-defense governance.
Keywords:
algorithmic fairness
; credit scoring
; model risk management
; disparate impact
; EU AI Act
; fair lending
; insurance regulation
; responsible AI
1. Introduction
The rapid integration of artificial intelligence (AI) into financial decision-making has changed the logic, pace, and scale of credit allocation. Nowhere is this more visible than in credit scoring, where algorithmic systems increasingly determine access to loans, mortgages, insurance cover, and other forms of financial capital. Although predictive modeling in consumer credit is not new, the shift from transparent statistical scorecards to complex machine-learning (ML) architectures represents a qualitative leap in both technical capability and in the risks that supervisors and firms must manage (Hurley and Adebayo 2017; Binns 2020).
Credit and insurance scores are foundational to economic participation. They influence not only immediate lending and underwriting decisions but also downstream access to housing, education, entrepreneurship, and health-related products (Barocas et al. 2019). Yet these systems are frequently trained on historical data that reflect entrenched social and economic inequalities. As a result, automated scoring can encode, perpetuate, or amplify disparities across ethnicity, class, gender, and geography (O’Neil 2016; Eubanks 2018). For a regulated institution, those disparities are not only an ethical concern: they are a source of legal, conduct, reputational, and model risk that falls squarely within the remit of enterprise risk management and prudential supervision.
Despite this, the literature has paid far less attention to the distributive consequences of scoring systems than to their accuracy. Mainstream work has emphasized precision and discrimination while downplaying the disparate impacts that emerge across social groups (Mitchell et al. 2021), and the dominant industry mitigation—removing sensitive attributes from the data—is now widely recognized as insufficient, because correlated features act as proxies and reproduce bias through indirect pathways (Kim 2019; Binns 2020). Treating fairness as a first-order risk-management objective, rather than a post hoc compliance formality, remains the exception rather than the rule.
This study addresses that gap. It is positioned at the intersection of computational modeling, financial regulation, and institutional risk governance, and its central premise is that an AI scoring system must be evaluated not only for how well it predicts, but for whom it predicts well, at what social cost, and under which supervisory obligations. The analysis is anchored in credit scoring—the canonical high-risk use case—but is framed throughout for the shared banking-and-insurance perimeter, because the same proxy-discrimination mechanisms, and much of the same regulatory architecture, govern insurance pricing and underwriting.
The remainder of this section reviews the state of the field and the supervisory perimeter, and states the research questions. Section 2 describes the data, variables, modeling pipeline, and the performance and fairness metrics. Section 3 reports the empirical findings. Section 4 discusses the risk-management and governance implications. Section 5 concludes.
1.1. Machine Learning in Credit Scoring and the Model-Risk Problem
The diffusion of AI across financial services is a structural change in the infrastructure of contemporary finance (Arner et al. 2016). From credit-risk modeling to fraud detection and customer segmentation, AI technologies are reshaping banking and insurance at a scale and speed that often outpaces existing regulatory and ethical frameworks (Pasquale 2015; Bussmann et al. 2021). Each efficiency gain, however, introduces or amplifies a risk that must be governed: model risk from opaque estimators; conduct and legal risk from discriminatory outcomes; operational and data risk from alternative data pipelines; and reputational risk from decisions that customers cannot understand or contest.
Historically, credit scoring quantified default likelihood through logistic regression, discriminant analysis, and decision trees; Thomas et al. (2002) established foundational practices balancing predictive accuracy with interpretability—concerns that remain central to today’s AI-governance debates. Hand and Henley (1997) warned early that reliance on complex classifiers risked sacrificing transparency for marginal accuracy gains, a concern intensified by high-dimensional models that are powerful but difficult to audit (Lipton 2018; Rudin 2019). Since the mid-2000s, supervised ML has captured nonlinearities and high-dimensional interactions and has consistently outperformed traditional techniques across credit datasets (Lessmann et al. 2015; Baesens et al. 2003), with gradient boosting performing especially well under class imbalance and noise (Brown and Mues 2012). Behavioral credit scoring further incorporates transaction histories, mobile usage, and digital footprints (Bazarbash 2019; Berg et al. 2020), which advocates argue extends credit to thin-file applicants (Frost et al. 2019).
From a supervisory standpoint, these gains arrive coupled with model risk—the risk of adverse consequences from decisions based on incorrect or misused model output. Model-risk-management frameworks (Board of Governors of the Federal Reserve System 2011; Basel Committee on Banking Supervision 2005) require firms to validate models across their life cycle and to demonstrate conceptual soundness. Where a scoring model produces systematically different outcomes for structurally disadvantaged groups, that disparity is itself a model-risk and conduct-risk finding, not merely an ethical footnote.
1.2. Algorithmic Bias, Proxy Discrimination, and Fairness as a Risk Category
The promise of algorithmic scoring is tempered by the critique that it can mask systemic bias behind a veneer of objectivity. As O’Neil (2016) argues, systems trained on historical records often encode structural discrimination; seemingly neutral features such as ZIP code or education can proxy for ethnicity, gender, or class (Barocas and Selbst 2016; Eubanks 2018). The risks are not merely theoretical: ML systems in credit and insurance have disproportionately penalized minority and low-income applicants even when risk profiles are comparable (Bartlett et al. 2021; Fuster et al. 2022), while opacity complicates redress and makes adverse decisions difficult to contest (Citron and Pasquale 2014).
In this framing, financial inclusion is more than a design objective—it is a question of economic justice, because exclusion from credit constrains housing, entrepreneurship, education, and healthcare (Hurley and Adebayo 2017; Narayan et al. 2018). Discriminatory algorithms can deepen inequality under the guise of computational neutrality (Binns 2018; Gabor and Brooks 2017). The operative consequence for a regulated institution is that fairness must be measured, monitored, and controlled as an explicit risk category, with quantitative metrics, tolerances, and escalation paths—precisely the logic this paper operationalizes.
1.3. Fairness and Discrimination Risk in Insurance
Although the empirical setting is credit, the same mechanisms and much of the same regulatory logic extend to insurance. Insurance pricing and underwriting are, by construction, acts of risk differentiation, which makes the boundary between legitimate actuarial discrimination and unfair discrimination unusually delicate. The Court of Justice of the European Union’s Test-Achats ruling (C-236/09) prohibited the use of gender as a rating factor in EU insurance, establishing that even a statistically predictive attribute can be legally impermissible on equality grounds. As insurers adopt granular behavioral and telematics data and ML pricing, proxy discrimination becomes a first-order concern: a model can reconstruct protected attributes from correlated features and reproduce prohibited distinctions without ever observing them directly.
Supervisors have responded accordingly. The work of the European Insurance and Occupational Pensions Authority (EIOPA) on the governance of AI and on the ethical use of data in insurance emphasizes fairness, non-discrimination, transparency, and human oversight, and recent attention to differential and behavior-based pricing reflects concern that data-driven personalization can produce outcomes that are unfair even when actuarially defensible. The International Association of Insurance Supervisors (2020) has likewise highlighted fairness, accountability, and explainability as supervisory priorities. The fairness metrics, mitigation techniques, and governance controls examined here are therefore directly transferable from credit to insurance underwriting and pricing.
1.4. The Regulatory and Supervisory Landscape
Regulatory frameworks have tightened around automated decision-making. The European Union’s Artificial Intelligence Act classifies creditworthiness assessment and life- and health-insurance risk pricing as high-risk, imposing obligations on data governance, technical documentation, transparency, human oversight, accuracy, and risk management across the model life cycle (European Commission 2021). The General Data Protection Regulation (GDPR) constrains automated decisions with legal or similarly significant effects and underpins expectations of meaningful information about the logic involved (Voigt and Von dem Bussche 2017; Wachter et al. 2017). In the United States, the Equal Credit Opportunity Act (ECOA) and the Consumer Financial Protection Bureau (CFPB) require that algorithmic credit decisions be explainable enough to support specific adverse-action reasons.
Sector supervisors add a prudential layer. The European Banking Authority (2020) guidelines on loan origination and monitoring set expectations for data quality, documentation, and explainability in credit decisions, while model-risk doctrine (Board of Governors of the Federal Reserve System 2011) requires independent validation and effective challenge. On the insurance side, Solvency II governance and risk-management requirements, together with EIOPA and IAIS guidance, extend analogous expectations to underwriting and pricing models. International bodies have issued principles for responsible AI in finance—transparency, robustness, accountability, and human-in-the-loop control (OECD 2019; Financial Stability Board 2017, 2022).
These instruments have fueled interest in explainable AI (XAI). Tools such as SHapley Additive exPlanations (SHAP) (Lundberg and Lee 2017), Local Interpretable Model-agnostic Explanations (LIME) (Ribeiro et al. 2016), and counterfactual explanations (Wachter et al. 2017) help render complex models interpretable. Yet critics caution that explanation methods can oversimplify or misrepresent model logic (Lipton 2018; Rudin 2019) and do not resolve deeper problems when biased data or misaligned objectives drive behavior. Scholars therefore warn of an implementation gap—firms adopting ethical principles rhetorically while optimizing for efficiency, a dynamic labeled ethics-washing (Mittelstadt 2019; Morley et al. 2020).
1.5. Research Questions
This study asks how AI-driven scoring systems in banking and insurance can be developed, validated, and governed so that they support—rather than undermine—financial inclusion, while remaining defensible under the applicable regulatory frameworks. Three interrelated questions follow.
- RQ1. To what extent do AI-based scoring models reproduce or mitigate bias against historically marginalized or underrepresented groups (by ethnicity, gender, socioeconomic status, or geography)? This builds on Fuster et al. (2022) and Bartlett et al. (2021), who show that disparities can persist under ostensibly neutral algorithmic regimes.
- RQ2. What role do fairness-aware ML techniques play in mitigating algorithmic discrimination, and at what measurable cost to performance? While explanation tools provide transparency, Lipton (2018) and Rudin (2019) caution that explanation alone does not ensure regulatory compliance if the underlying data or objectives remain misaligned.
- RQ3. Which governance frameworks and regulatory mechanisms are most effective in ensuring accountability, transparency, and ethical alignment in financial AI across banking and insurance? A persistent implementation gap remains between principles and organizational practice (Mittelstadt 2019; Morley et al. 2020).
The contribution is threefold: it quantifies the fairness cost of model capacity on a single institutional dataset under a harmonized metric set; it prices the accuracy given up by three distinct mitigation families; and it translates both into a control framework aligned with the supervisory expectations that now govern banking and insurance.
2. Materials and Methods
2.1. Data Source and Description
The study uses an institutional dataset of 20,000 anonymized credit applications from a mid-sized digital lending institution operating in Southern Europe. The data combine information collected at the point of application, internal credit-decision variables, and observed repayment outcomes over a 12-month horizon, reflecting the industry-wide shift toward hybrid scoring systems that blend traditional financial attributes with alternative behavioral and psychometric features (Jagtiani and Lemieux 2019; Moro-Visconti et al. 2021). The target variable is a binary indicator, loan default, denoting whether the borrower failed to repay within 12 months of origination.
The raw file contained 20,000 rows (one per applicant) and 55 columns covering input features, metadata, and outcomes, extracted from the institution’s internal decision-support system, which integrates customer self-disclosures, a credit-bureau application programming interface, mobile-application behavior logs, and psychometric-testing modules. Prior to transfer, the institutional partner applied a privacy-preserving transformation. Personally identifiable information (PII)—names, national identification numbers, and full addresses—was permanently removed, and quasi-identifiers such as ZIP code, age, and education were generalized using k-anonymity techniques (Sweeney 2002; El Emam and Dankar 2008): ZIP codes were aggregated into socio-economic clusters and age was binned into five-year intervals before re-normalization.
Exploratory profiling assessed completeness, consistency, and integrity (Dasu and Johnson 2003). Over 96% of records were complete, with missingness concentrated in behavioral features and optional psychometric fields; no duplicates were found. Missing values were imputed with k-nearest neighbors (KNN, k = 5), which preserves local structure and handles mixed-type features (Troyanskaya et al. 2001; Batista and Monard 2002); mode imputation was used for ordinal psychometric scales and predictive mean matching for continuous scores. Imputation followed outlier mitigation but preceded normalization. Figure 1 summarizes the pipeline.
A feature-engineering stage then constructed derived variables for risk modeling and fairness auditing (Kuhn and Johnson 2013; Fuster et al. 2022): debt-to-income ratio, credit utilization, a financial-literacy score, a risk-tolerance index, and an ethno-socioeconomic group proxy combining ZIP-code clusters and a surname-origin classifier. Continuous variables were standardized via z-scores; categorical features were processed with one-hot encoding for unordered attributes and ordinal encoding for education and risk indices (Hastie et al. 2009; Pedregosa et al. 2011). The analytical dataset comprises 38 predictors and one binary target, with every transformation logged in a version-controlled Python pipeline.
The ethno-socioeconomic group proxy warrants explicit caution. Constructing a sensitive-attribute proxy from surname and location is a recognized auditing device where protected characteristics are not recorded (Rambachan et al. 2023), but it is measured with error and can itself embed bias. It is therefore used only for post hoc fairness auditing and mitigation, never as a prediction feature intended for deployment, and all subgroup findings are indicative of proxy-level disparity rather than measurement of any individual’s ethnicity.
2.2. Variables
The dataset spans five domains: financial and credit attributes; behavioral indicators; socio-demographic characteristics; psychometric measures; and operational metadata. Feature inclusion was guided by empirical relevance and the credit-scoring and fairness literature (Thomas et al. 2002; Crook et al. 2007; Hurley and Adebayo 2017). Conventional indicators—credit score, annual income, loan amount, loan term, and delinquencies—are well-established predictors (Hand and Henley 1997; Baesens et al. 2003), while debt-to-income and credit utilization proxy financial strain and repayment capacity consistent with regulatory expectations for explainable modeling (European Banking Authority 2020).
Behavioral variables—transaction frequency, mobile-application logins, and an e-commerce activity index—capture engagement and digital inclusion and can supplement or outperform static attributes for thin-file applicants (Berg et al. 2020; Björkegren and Grissen 2020). Demographic variables are retained for subgroup fairness auditing rather than prediction, consistent with anti-discrimination compliance (Barocas et al. 2019; Kamiran and Calders 2012). Psychometric measures reflect growing interest in integrating cognitive and behavioral signals into scoring (Lusardi and Mitchell 2014; Behr and Güttler 2007). Operational metadata serve as controls and as diagnostics for procedural bias. Table 1 summarizes the key variables.
2.3. Research Design and Model Architecture
The empirical strategy compares three modeling paradigms—an interpretable baseline, high-capacity classifiers, and fairness-aware architectures—evaluated both quantitatively, through predictive and fairness metrics, and qualitatively, through explainability and regulatory compliance. Table 2 summarizes the three phases.
2.3.1. Logistic Regression (Interpretable Benchmark)
The benchmark is a regularized logistic-regression (LR) classifier, chosen for its established role in credit scoring and its interpretability, stability, and regulatory defensibility (Hand and Henley 1997; Thomas et al. 2002). Its coefficient-level output maps features to odds ratios, supporting adverse-action explanations. Let xi denote the predictor vector for applicant i and yi ∈ {0,1} the outcome, with yi = 1 a default event. The model estimates the conditional probability of default as
where β = (β₀, β₁, …, βₚ)ᵀ is the coefficient vector. Equivalently, the model assumes a log-odds transformation that is linear in the predictors,
P(yᵢ = 1 | xᵢ) = 1 / [1 + exp(−xᵢᵀβ)],
log{P(yᵢ = 1 | xᵢ) / [1 − P(yᵢ = 1 | xᵢ)]} = β₀ + Σⱼ βⱼ xᵢⱼ.
Given the dimensionality of the feature space, an L2 (ridge) penalty constrains coefficient magnitudes, so that estimation minimizes
where p̂ᵢ = P(yᵢ = 1 | xᵢ), λ ≥ 0 is the regularization hyperparameter, and n is the number of training observations. The penalty strength C = 1/λ is tuned by grid search under five-fold cross-validation using the Brier score as the objective. Predictors are z-score standardized and multicollinearity is screened with variance inflation factors (VIF), with predictors exceeding a VIF of 10 removed or transformed.
L(β) = −(1/n) Σᵢ [yᵢ log(p̂ᵢ) + (1 − yᵢ) log(1 − p̂ᵢ)] + λ Σⱼ βⱼ²,
Training follows a two-tier validation design: an 80/20 stratified train–test split preserving the outcome distribution, and, within the training set, five-fold cross-validation embedded in the grid search. Beyond serving as a performance benchmark, the LR specification acts as a reference architecture for regulatory audit, with coefficients inspected for indirect discrimination by relating their sign and magnitude to known proxies for sensitive attributes. Figure 2 sets out the workflow.
2.3.2. Machine-Learning Classifiers
The second phase introduces two high-capacity classifiers that capture nonlinear interactions: a gradient-boosting machine (GBM) and a multi-layer perceptron (MLP) neural network, representing boosting ensembles and deep feedforward networks (Fuster et al. 2022; Jagtiani and Lemieux 2019). The GBM is implemented with LightGBM, a histogram-based, memory-efficient variant (Ke et al. 2017). Trees are grown sequentially, each correcting the residuals of its predecessors; grid search optimizes the learning rate, number of estimators, maximum depth, and subsampling ratio, with regularization to control overfitting.
The MLP comprises an input layer, two fully connected hidden layers (64 and 32 units) with rectified linear unit activations, dropout (rate 0.3), and a sigmoid output; it is trained with the Adam optimizer and early stopping on validation loss, with randomized search over learning rate, batch size, and dropout rate. Both models are trained on the same 80% stratified training set and evaluated on the 20% holdout, with variance assessed across five random seeds. Unlike the LR benchmark, these models lack inherent interpretability and therefore require model-agnostic explanation techniques, discussed in Section 4.3. Figure 3 summarizes the architecture.
2.3.3. Fairness-Aware Model Integration
The third phase introduces fairness-aware techniques addressing the distributional concerns raised by ML scoring (Barocas et al. 2019; O’Neil 2016; Fuster et al. 2022). A three-tiered strategy mirrors the ML pipeline—pre-processing, in-processing, and post-processing—so that each intervention targets a distinct source of bias.
Pre-processing reweighing (Kamiran and Calders 2012) adjusts training-sample weights to equalize the outcome distribution across sensitive groups without altering labels or features, applying inverse-probability weights to compensate for imbalances. In-processing adversarial debiasing (Zhang et al. 2018) couples the main predictor with an adversary that attempts to recover group membership from the learned representation; penalizing informative representations encourages group-invariant predictors, with a tunable fairness coefficient selected by grid search. Post-processing reject-option adjustment (Kamiran et al. 2012), related to the equalized-odds framework of Hardt et al. (2016), operates on calibrated probabilities within an uncertainty band around the decision threshold, reassigning marginal cases to reduce disparities while leaving the underlying model unchanged—attractive where retraining a production model is impractical.
2.4. Performance and Fairness Metrics
Performance is assessed with three complementary metrics. The Brier score, the mean squared difference between predicted probabilities and outcomes, is the primary optimization and comparison metric because calibration matters as much as discrimination when scores drive pricing and limit-setting:
Brier = (1/n) Σᵢ (p̂ᵢ − yᵢ)².
The area under the receiver operating characteristic curve (AUC-ROC) measures threshold-independent rank-ordering and is well suited to imbalanced data. The F1 score, the harmonic mean of precision and recall, captures the balance between false positives and false negatives:
F1 = 2 × (Precision × Recall) / (Precision + Recall).
Accuracy is reported as a secondary indicator. To keep the fairness analysis internally consistent, the favorable outcome is defined as loan approval (a predicted non-default), with G = 1 denoting the structurally disadvantaged group and G = 0 the reference group. Under this convention, the demographic-parity difference (DPD) is
where Ŷ = 1 denotes approval; negative values indicate lower approval for the disadvantaged group. The equal-opportunity difference (EOD) compares true-positive (correct-approval) rates for genuinely creditworthy applicants:
DPD = P(Ŷ = 1 | G = 1) − P(Ŷ = 1 | G = 0),
EOD = TPR(G = 1) − TPR(G = 0), with TPR = TP / (TP + FN).
The disparate-impact ratio (DIR) expresses the same comparison multiplicatively,
where values below the 0.80 four-fifths threshold signal potential legal or ethical concern (Feldman et al. 2015). Finally, the Theil index (TI) is a decomposable inequality measure from information theory that captures entropy in outcome allocation and attributes disparity to between- and within-group variation (Speicher et al. 2018):
where bᵢ is the benefit assigned to individual i and μ its mean; higher values indicate greater inequality. Reporting performance and fairness jointly reflects the consensus that optimization cannot be separated from social impact and legitimacy (OECD 2019; European Commission 2021). In a risk-management framing, these metrics function as key risk indicators: measurable quantities with tolerances against which model behavior can be monitored and escalated.
DIR = P(Ŷ = 1 | G = 1) / P(Ŷ = 1 | G = 0),
TI = (1/n) Σᵢ (bᵢ / μ) ln(bᵢ / μ),
2.5. Use of Generative Artificial Intelligence
A generative AI assistant (Claude, Anthropic) was used to support manuscript editing, structuring, and formatting for the target journal. It was not used to generate, simulate, or analyze data, to produce results, or to design the study. All modeling, estimation, and interpretation were performed by the author, who has reviewed and verified all content and takes full responsibility for it.
3. Results
This section reports the empirical findings across three axes: the comparative predictive performance of the baseline and high-capacity classifiers; group-fairness diagnostics across socio-demographic strata; and the effects of fairness-aware interventions. All models are evaluated on the holdout test set from the stratified 80/20 split under identical preprocessing and metrics, as specified in Section 2.
3.1. Predictive Performance Across Model Families
3.1.1. Logistic-Regression Coefficients
The LR model was trained with grid search and five-fold cross-validation; L2 regularization with C = 0.1 minimized the average Brier score. Table 3 reports the estimated coefficients, standard errors, and significance levels for the final specification.
The coefficient signs, magnitudes, and significance levels align with established credit-risk theory. Credit score is among the strongest predictors, with a negative and highly significant coefficient (β = −0.013, p < 0.001): each additional point reduces the log-odds of default by roughly 1.3%, all else equal (Hand and Henley 1997). Annual income (β = −0.034) and, in the opposite direction, the debt-to-income ratio (β = +1.43, p < 0.001) contribute intuitively, the latter signaling a steep rise in default risk as financial burden intensifies (Crook et al. 2007). Credit utilization (β = +0.87) and past delinquencies (β = +0.54) are strongly positive, consistent with overextension and the persistence of late-payment behavior.
Digital-behavior variables carry meaningful signal: higher mobile-application logins (β = −0.029) and e-commerce activity (β = −0.32) are associated with lower default probability, echoing evidence that digitally engaged customers exhibit greater financial monitoring (Berg et al. 2020). Psychometric traits matter as well—higher financial literacy reduces risk (β = −0.011) while higher risk tolerance increases it (β = +0.21). Most consequentially, the ethno-socioeconomic group indicator shows a large, significant positive association with default (β = +0.36, p < 0.001) that is not fully explained by observable financial behavior, motivating the fairness analysis in Section 3.2. Overall fit is sound for a behavioral model (McFadden’s R² = 0.278; likelihood-ratio χ² = 1,576.6, p < 0.001), with the log-likelihood improving from −2,830.6 to −2,042.3.
3.1.2. Test-Set Performance
Table 4 summarizes the holdout performance of the baseline. The Brier score of 0.162 indicates good calibration—important where the predicted probability, not merely the binary decision, drives pricing and limit-setting—with a tight cross-validation band. The AUC-ROC of 0.734 reflects moderate discrimination, above the 0.5 no-skill baseline but below the high-capacity models. The F1 score of 0.691 indicates a reasonable precision–recall balance, and accuracy of 78.5% confirms stable generalization.
3.2. Group Fairness and Distributional Disparities
An exclusive focus on accuracy can obscure how differently social groups are treated. Model behavior is evaluated across strata defined by ethno-socioeconomic group, gender, and ZIP-code cluster, with particular attention to Group A, a proxy for historically marginalized populations (Barocas et al. 2019; Mitchell et al. 2021). Table 5 reports approval rates and fairness metrics under the convention set out in Section 2.4.
The model exhibits material disparities between Group A and other applicants. The DPD of −0.057 means members of Group A are approved 5.7 percentage points less often, while the EOD of −0.165 reveals a substantial gap in correctly approving genuinely creditworthy applicants from this group. The DIR of 0.67 falls below the 0.80 four-fifths threshold, indicating that the model’s output could constitute de facto disparate impact even absent intentional bias, and the Theil index confirms concentrated inequality. Gender disparities are small and within acceptable bounds (DIR = 1.07; EOD = +0.035), while ZIP-cluster B applicants face moderate geographic disadvantage (DIR = 0.77).
Crucially, none of these group features were used as model inputs: the disparities are the product of proxy discrimination, where correlated non-sensitive variables such as income, utilization, and behavioral indices indirectly encode group membership (Kim 2019). This is the empirical refutation of fairness through unawareness and the case for post hoc auditing and correction in high-stakes domains (Friedler et al. 2019; Binns 2020).
3.3. Effects of Fairness-Aware Interventions
Recognizing the disparities documented in Section 3.2, this subsection evaluates whether fairness-aware interventions can mitigate bias without sacrificing predictive validity. Each technique operationalizes a distinct fairness criterion—disparate-impact reduction, equal-opportunity preservation, and error-rate parity (Verma and Rubin 2018; Corbett-Davies and Goel 2018). For each family, fairness-aware variants were trained and tested under identical conditions using the ethno-socioeconomic group as the protected attribute. Table 6 reports both performance and fairness.
All three mitigation strategies reduce demographic and opportunity disparities without prohibitive losses in performance. Reweighed LR improves the DIR from 0.67 to 0.85 and roughly halves DPD and EOD, with AUC declining only marginally from 0.734 to 0.723, making it well suited to compliance-sensitive applications. The adversarially debiased GBM achieves the most favorable trade-off among high-capacity models, preserving strong AUC (0.765) and F1 (0.701) while bringing DPD and EOD into acceptable ranges by preventing the protected attribute from being inferred from the latent representation (Zhang et al. 2018). The reject-option MLP reaches a DIR of 0.81 and cuts EOD by roughly 45% at a modest calibration cost, with the advantage of leaving the production architecture intact.
Taken together, these results qualify the presumed strict fairness–accuracy trade-off. Some pure-classification performance is given up, but the gains in distributional equity and regulatory defensibility are large relative to the efficiency lost—an especially favorable balance in high-stakes domains such as credit and insurance underwriting.
3.4. Summary of Findings
Three findings stand out. First, the interpretable LR benchmark performs robustly (Brier 0.162, AUC 0.734, F1 0.691), with coefficients consistent with domain knowledge and with financial, behavioral, and psychometric features all contributing. Second, fairness diagnostics reveal meaningful disparities: Group A faces markedly lower approval and true-positive rates (DIR = 0.67), and ZIP-based geographic disadvantage is present, whereas gender disparities are negligible—evidence of algorithmic redlining through proxy features rather than overt discrimination. Third, disparities are neither inevitable nor uncorrectable: pre-, in-, and post-processing interventions all materially improve fairness metrics with only modest performance costs. Table 7 consolidates the model-by-model trade-offs.
4. Discussion
The results have a direct translation into supervised risk management. Higher-capacity models buy accuracy at the price of wider group disparities, and those disparities are measurable, monitorable, and controllable. This section positions the findings within the model-risk and regulatory frameworks that govern automated decision-making in banking and insurance, and derives concrete controls.
4.1. Fairness Risk Within the Model-Risk and Three-Lines Framework
Disparate outcomes are best understood not as an ethical externality but as a compound of model, conduct, legal, and reputational risk. In a three-lines-of-defense structure, the first line—model development and business ownership—should embed fairness key risk indicators into model-development standards and pre-deployment testing, using the DIR against the four-fifths threshold and DPD and EOD against internally calibrated tolerances. The second line, independent model validation and compliance, should subject scoring models to fairness validation with the same rigor applied to discrimination and calibration testing, consistent with model-risk doctrine (Board of Governors of the Federal Reserve System 2011). The third line, internal audit, should verify that these controls operate as designed. Because the results show that fairness can be improved at modest performance cost, a firm that declines to test and mitigate is, in effect, accepting an uncompensated and avoidable risk.
4.2. Regulatory Alignment Across Banking and Insurance
The interventions studied here map onto specific obligations. Under the high-risk regime of the EU AI Act, requirements on data governance, technical documentation, transparency, human oversight, and risk management are directly served by pre-deployment fairness testing, an algorithmic impact assessment, and retention of the mitigation evidence documented in Section 3.3. The constraints of the GDPR on automated decisions, and the explainability standards of the ECOA and the CFPB, favor retaining an interpretable challenger model alongside any high-capacity champion, so that adverse-action reasoning remains defensible. The loan-origination and internal-model expectations of the European Banking Authority (2020) reinforce data quality, documentation, and explainability for models used in credit decisions.
In insurance the same logic applies with a sharper equality constraint: the Test-Achats prohibition on gender rating shows that a predictive attribute can be legally impermissible, so proxy-discrimination testing of behavioral and telematics-based pricing is essential. Solvency II governance, EIOPA guidance, and the supervisory priorities of the International Association of Insurance Supervisors (2020) point to the same control set—impact assessment, independent validation, disparate-impact monitoring, and human oversight. The disparate-impact test and the mitigation toolkit examined here are, in this sense, portable across the banking–insurance perimeter.
4.3. Interpretability and Validation of High-Capacity Models
Because the GBM and MLP lack inherent interpretability, their deployment depends on model-agnostic explanation and disciplined validation. Post hoc tools such as SHAP (Lundberg and Lee 2017), LIME (Ribeiro et al. 2016), and counterfactual explanations (Wachter et al. 2017) can support feature-attribution review, adverse-action generation, and the detection of proxy pathways, and should be produced and retained as part of technical documentation. However, explanation is a complement to, not a substitute for, fairness control: as Lipton (2018) and Rudin (2019) caution, an explanation of a biased model does not make it fair. Where interpretability requirements are binding and the accuracy gap is small—as it is here, at roughly six AUC points—an interpretable model or an interpretable challenger remains the prudent default.
4.4. Limitations
Several limitations qualify the findings. First, the data are cross-sectional, limiting inference about temporal dynamics and the downstream effects of credit decisions. Second, the protected-attribute proxies are measured with error and cannot fully capture ethnicity, class, or their intersections; subgroup results should be read as proxy-level disparities. Third, group-fairness metrics such as DIR and EOD, while decision-relevant, do not capture all forms of harm, particularly intersectional or contextual ones, and different metrics can conflict. Fourth, the mitigation strategies were evaluated under controlled conditions and may behave differently inside production workflows with feedback loops and strategic applicant behavior. Finally, the analysis is confined to a single institutional dataset from one market; external validity across markets and regulatory regimes remains to be established.
5. Conclusions
The integration of AI into credit and insurance scoring is a pivotal transformation in the architecture of financial decision-making, and this study has evaluated its performance and fairness through the lens of supervised risk management. The interpretable logistic-regression benchmark delivered reasonably strong, well-calibrated predictions (AUC 0.734, Brier 0.162) with high transparency, yet still produced significant group-level disparities—disadvantaging applicants from marginalized ethno-socioeconomic groups and certain high-risk geographies—arising not from overt discrimination but from proxy pathways and structural inequalities embedded in the data. High-capacity models delivered marginal accuracy gains (AUC above 0.78) while widening those disparities, with the DIR falling as low as 0.58.
Crucially, fairness-aware modeling showed that algorithmic bias is a tractable design and control problem rather than a fixed property: reweighing, adversarial debiasing, and reject-option adjustment improved fairness metrics, raising the DIR to as much as 0.85, while preserving acceptable accuracy and calibration. The deterministic view of a strict fairness–accuracy trade-off is not supported; when fairness is embedded proactively, predictive efficacy and normative responsibility can be reconciled. Fairness, moreover, cannot be secured merely by omitting protected attributes, because proxies carry latent signals of ethnicity, class, and gender, so responsible deployment requires active scrutiny of outcomes rather than passive avoidance of sensitive features.
For regulated institutions, the practical implication is to treat fairness as an explicit risk category with measurable indicators, tolerances, and escalation paths, controlled through algorithmic impact assessment, independent validation, and three-lines-of-defense governance, and aligned with the EU AI Act, GDPR, EBA, and fair-lending expectations in banking and with Solvency II, EIOPA, and IAIS expectations in insurance. While the empirical focus was credit scoring, the performance–fairness co-evaluation and the control framework extend naturally to insurance pricing and underwriting. Future work should incorporate longitudinal data on borrower well-being, develop intersectional fairness metrics, compare fairness operationalization across regulatory regimes, and build participatory mechanisms that give those most affected a voice in the design and audit of scoring systems.
Funding
This research received no external funding.
Institutional Review Board Statement
Ethical review and approval were waived for this study because it relied exclusively on a fully anonymized, k-anonymized secondary dataset that does not constitute personal data as processed by the author; the partner institution’s data-protection office confirmed compliance with the General Data Protection Regulation.
Informed Consent Statement
Not applicable. The author accessed only anonymized, non-identifiable records.
Data Availability Statement
The data analyzed in this study are proprietary to the partner lending institution and are subject to confidentiality and data-protection restrictions; they are not publicly available. The estimation code and derived, non-identifiable summary statistics supporting the reported results are available from the author on reasonable request and subject to the partner institution’s approval.
Acknowledgments
During the preparation of this manuscript, the author used generative-AI assistant to support spell-checking and checking sentence structure in English. The author has reviewed and edited the output and takes full responsibility for the content of this publication.
Conflicts of Interest
The author declares no conflicts of interest.
Abbreviations
The following abbreviations are used in this manuscript:
| Abbreviation | Definition |
| AI | Artificial intelligence |
| AUC-ROC | Area under the receiver operating characteristic curve |
| CFPB | Consumer Financial Protection Bureau |
| DIR | Disparate-impact ratio |
| DPD | Demographic-parity difference |
| EBA | European Banking Authority |
| ECOA | Equal Credit Opportunity Act |
| EIOPA | European Insurance and Occupational Pensions Authority |
| EOD | Equal-opportunity difference |
| GBM | Gradient-boosting machine |
| GDPR | General Data Protection Regulation |
| IAIS | International Association of Insurance Supervisors |
| KNN | k-nearest neighbors |
| LIME | Local interpretable model-agnostic explanations |
| LR | Logistic regression |
| ML | Machine learning |
| MLP | Multi-layer perceptron |
| PII | Personally identifiable information |
| SHAP | SHapley Additive exPlanations |
| TI | Theil index |
| TPR | True-positive rate |
| VIF | Variance inflation factor |
| XAI | Explainable artificial intelligence |
References
- Arner, Douglas W.; Barberis, Janos; Buckley, Ross P. The evolution of Fintech: A new post-crisis paradigm? Georgetown Journal of International Law 2016, 47, 1271–319. [Google Scholar] [CrossRef]
- Baesens, Bart; Van Gestel, Tony; Viaene, Stijn; Stepanova, Maria; Suykens, Johan; Vanthienen, Jan. Benchmarking state-of-the-art classification algorithms for credit scoring. Journal of the Operational Research Society 2003, 54, 627–35. [Google Scholar] [CrossRef]
- Barocas, Solon; Selbst, Andrew D. Big data’s disparate impact. California Law Review 2016, 104, 671–732. [Google Scholar] [CrossRef]
- Barocas, Solon; Hardt, Moritz; Narayanan, Arvind. Fairness and Machine Learning: Limitations and Opportunities. 2019. Available online: https://fairmlbook.org (accessed on 15 June 2026).
- Bartlett, Robert; Morse, Adair; Stanton, Richard; Wallace, Nancy. Consumer-lending discrimination in the FinTech era. Journal of Financial Economics 2021, 141, 118–32. [Google Scholar] [CrossRef] [PubMed]
- Basel Committee on Banking Supervision. Studies on the Validation of Internal Rating Systems; Working Paper No. 14; Bank for International Settlements: Basel, 2005. [Google Scholar]
- Batista, Gustavo E. A. P. A.; Monard, Maria Carolina. A study of k-nearest neighbour as an imputation method. In Hybrid Intelligent Systems; IOS Press: Amsterdam, 2002; pp. 251–60. [Google Scholar]
- Bazarbash, Majid. FinTech in Financial Inclusion: Machine Learning Applications in Assessing Credit Risk; IMF Working Paper No. 19/109; International Monetary Fund: Washington, 2019. [Google Scholar] [CrossRef]
- Behr, Patrick; Güttler, André. Credit risk assessment and relationship lending: An empirical analysis of German small and medium-sized enterprises. Journal of Small Business Management 2007, 45, 194–213. [Google Scholar] [CrossRef]
- Belanche, Daniel; Casaló, Luis V.; Flavián, Carlos. Artificial intelligence in FinTech: Understanding robo-advisors adoption among customers. Industrial Management & Data Systems 2019, 119, 1411–30. [Google Scholar] [CrossRef]
- Berg, Tobias; Burg, Valentin; Gombović, Ana; Puri, Manju. On the rise of FinTechs: Credit scoring using digital footprints. Review of Financial Studies 2020, 33, 2845–97. [Google Scholar] [CrossRef]
- Binns, Reuben. Fairness in machine learning: Lessons from political philosophy. Proceedings of Machine Learning Research 2018, 81, 149–59. [Google Scholar]
- Binns, Reuben. On the apparent conflict between individual and group fairness. In Proceedings of the 2020 Conference on Fairness, Accountability, and Transparency; ACM: New York, 2020; pp. 514–24. [Google Scholar] [CrossRef]
- Björkegren, Daniel; Grissen, Darrell. Behavior revealed in mobile phone usage predicts credit repayment. World Bank Economic Review 2020, 34, 618–34. [Google Scholar] [CrossRef]
- Board of Governors of the Federal Reserve System. Supervisory Guidance on Model Risk Management (SR 11-7); Board of Governors of the Federal Reserve System: Washington, 2011. [Google Scholar]
- Brown, Iain; Mues, Christophe. An experimental comparison of classification algorithms for imbalanced credit scoring data sets. Expert Systems with Applications 2012, 39, 3446–53. [Google Scholar] [CrossRef]
- Bussmann, Niklas; Giudici, Paolo; Marinelli, Dimitri; Papenbrock, Jochen. Explainable machine learning in credit risk management. Computational Economics 2021, 57, 203–16. [Google Scholar] [CrossRef]
- Chawla, Nitesh V.; Bowyer, Kevin W.; Hall, Lawrence O.; Kegelmeyer, W. Philip. SMOTE: Synthetic minority over-sampling technique. Journal of Artificial Intelligence Research 2002, 16, 321–57. [Google Scholar] [CrossRef]
- Citron, Danielle Keats; Pasquale, Frank. The scored society: Due process for automated predictions. Washington Law Review 2014, 89, 1–33. [Google Scholar]
- Corbett-Davies, Sam; Goel, Sharad. The measure and mismeasure of fairness: A critical review of fair machine learning. arXiv 2018, arXiv:1808.00023. [Google Scholar]
- Crook, Jonathan N.; Edelman, David B.; Thomas, Lyn C. Recent developments in consumer credit risk assessment. European Journal of Operational Research 2007, 183, 1447–65. [Google Scholar] [CrossRef]
- Dasu, Tamraparni; Johnson, Theodore. Exploratory Data Mining and Data Cleaning; Hoboken: Wiley, 2003. [Google Scholar] [CrossRef]
- El Emam, Khaled; Dankar, Fida Kamal. Protecting privacy using k-anonymity. Journal of the American Medical Informatics Association 2008, 15, 627–37. [Google Scholar] [CrossRef] [PubMed]
- Eubanks, Virginia. Automating Inequality: How High-Tech Tools Profile, Police, and Punish the Poor; St. Martin’s Press: New York, 2018. [Google Scholar]
- European Banking Authority. Guidelines on Loan Origination and Monitoring (EBA/GL/2020/06); European Banking Authority: Paris, 2020. [Google Scholar]
- European Commission. Proposal for a Regulation Laying Down Harmonised Rules on Artificial Intelligence (Artificial Intelligence Act); COM(2021) 206 Final; European Commission: Brussels, 2021. [Google Scholar]
- Feldman, Michael; Friedler, Sorelle A.; Moeller, John; Scheidegger, Carlos; Venkatasubramanian, Suresh. Certifying and removing disparate impact. In Proceedings of the 21st ACM SIGKDD International Conference on Knowledge Discovery and Data Mining; ACM: New York, 2015; pp. 259–68. [Google Scholar] [CrossRef]
- Financial Stability Board. Artificial Intelligence and Machine Learning in Financial Services; Financial Stability Board: Basel, 2017. [Google Scholar]
- Financial Stability Board. The Use of Artificial Intelligence and Machine Learning by Financial Institutions; Financial Stability Board: Basel, 2022. [Google Scholar]
- Friedler, Sorelle A.; Scheidegger, Carlos; Venkatasubramanian, Suresh; Choudhary, Sonam; Hamilton, Evan P.; Roth, Derek. A comparative study of fairness-enhancing interventions in machine learning. In Proceedings of the 2019 Conference on Fairness, Accountability, and Transparency; ACM: New York, 2019; pp. 329–38. [Google Scholar] [CrossRef]
- Frost, Jon; Gambacorta, Leonardo; Huang, Yi; Shin, Hyun Song; Zbinden, Pablo. BigTech and the Changing Structure of Financial Intermediation; BIS Working Paper No. 779; Bank for International Settlements: Basel, 2019. [Google Scholar]
- Fuster, Andreas; Goldsmith-Pinkham, Paul; Ramadorai, Tarun; Walther, Ansgar. Predictably unequal? The effects of machine learning on credit markets. Journal of Finance 2022, 77, 5–47. [Google Scholar] [CrossRef]
- Gabor, Daniela; Brooks, Sally. The digital revolution in financial inclusion: International development in the FinTech era. New Political Economy 2017, 22, 423–36. [Google Scholar] [CrossRef]
- Hand, David J.; Henley, William E. Statistical classification methods in consumer credit scoring: A review. Journal of the Royal Statistical Society: Series A 1997, 160, 523–41. [Google Scholar] [CrossRef]
- Hardt, Moritz; Price, Eric; Srebro, Nathan. Equality of opportunity in supervised learning. Advances in Neural Information Processing Systems 2016, 29, 3315–23. [Google Scholar]
- Hastie, Trevor; Tibshirani, Robert; Friedman, Jerome. The Elements of Statistical Learning, 2nd ed.; Springer: New York, 2009. [Google Scholar] [CrossRef]
- Hurley, Mikella; Adebayo, Julius. Credit scoring in the era of big data. Yale Journal of Law and Technology 2017, 18, 148–216. [Google Scholar]
- International Association of Insurance Supervisors. Issues Paper on the Use of Big Data Analytics in Insurance; International Association of Insurance Supervisors: Basel, 2020. [Google Scholar]
- Jagtiani, Julapa; Lemieux, Catharine. The roles of alternative data and machine learning in FinTech lending: Evidence from the LendingClub consumer platform. Financial Management 2019, 48, 1009–29. [Google Scholar] [CrossRef]
- Kamiran, Faisal; Calders, Toon. Data preprocessing techniques for classification without discrimination. Knowledge and Information Systems 2012, 33, 1–33. [Google Scholar] [CrossRef]
- Kamiran, Faisal; Karim, Asim; Zhang, Xiangliang. Decision theory for discrimination-aware classification. In Proceedings of the IEEE 12th International Conference on Data Mining; IEEE: Piscataway, 2012; pp. 924–29. [Google Scholar] [CrossRef]
- Ke, Guolin; Meng, Qi; Finley, Thomas; Wang, Taifeng; Chen, Wei; Ma, Weidong; Ye, Qiwei; Liu, Tie-Yan. LightGBM: A highly efficient gradient boosting decision tree. Advances in Neural Information Processing Systems 2017, 30, 3146–54. [Google Scholar]
- Kim, Pauline T. Manipulating opportunity. Virginia Law Review 2019, 105, 867–935. [Google Scholar]
- Kuhn, Max; Johnson, Kjell. Applied Predictive Modeling; Springer: New York, 2013. [Google Scholar] [CrossRef]
- Lessmann, Stefan; Baesens, Bart; Seow, Hsin-Vonn; Thomas, Lyn C. Benchmarking state-of-the-art classification algorithms for credit scoring: An update of research. European Journal of Operational Research 2015, 247, 124–36. [Google Scholar] [CrossRef]
- Lipton, Zachary C. The mythos of model interpretability. Communications of the ACM 2018, 61, 36–43. [Google Scholar] [CrossRef]
- Lundberg, Scott M.; Lee, Su-In. A unified approach to interpreting model predictions. Advances in Neural Information Processing Systems 2017, 30, 4765–74. [Google Scholar]
- Lusardi, Annamaria; Mitchell, Olivia S. The economic importance of financial literacy: Theory and evidence. Journal of Economic Literature 2014, 52, 5–44. [Google Scholar] [CrossRef] [PubMed]
- McFadden, Daniel. Conditional logit analysis of qualitative choice behavior. In Frontiers in Econometrics; Academic Press: New York, 1974; pp. 105–42. [Google Scholar]
- Mitchell, Shira; Potash, Eric; Barocas, Solon; D’Amour, Alexander; Lum, Kristian. Algorithmic fairness: Choices, assumptions, and definitions. Annual Review of Statistics and Its Application 2021, 8, 141–63. [Google Scholar] [CrossRef]
- Mittelstadt, Brent. Principles alone cannot guarantee ethical AI. Nature Machine Intelligence 2019, 1, 501–7. [Google Scholar] [CrossRef]
- Morley, Jessica; Floridi, Luciano; Kinsey, Libby; Elhalal, Anat. From what to how: An initial review of publicly available AI ethics tools, methods and research to translate principles into practices. Science and Engineering Ethics 2020, 26, 2141–68. [Google Scholar] [CrossRef] [PubMed]
- Moro-Visconti, Roberto; Rambaud, Salvador Cruz; Pascual, Joaquín López. Sustainability in FinTechs: An explanation through business model scalability and market valuation. Sustainability 2021, 13, 2221. [Google Scholar] [CrossRef]
- Narayan, Ambar, Roy Van der Weide, Alexandru Cojocaru, Christoph Lakner, Silvia Redaelli, Daniel Gerszon Mahler, Rakesh. [CrossRef]
- OECD. Recommendation of the Council on Artificial Intelligence (OECD/LEGAL/0449); OECD: Paris, 2019. [Google Scholar]
- O’Neil, Cathy. Weapons of Math Destruction: How Big Data Increases Inequality and Threatens Democracy; Crown: New York, 2016. [Google Scholar]
- Pasquale, Frank. The Black Box Society: The Secret Algorithms That Control Money and Information; Harvard University Press: Cambridge, 2015. [Google Scholar] [CrossRef]
- Pedregosa, Fabian; Varoquaux, Gaël; Gramfort, Alexandre; Michel, Vincent; Thirion, Bertrand; Grisel, Olivier; Blondel, Mathieu; Prettenhofer, Peter; Weiss, Ron; Dubourg, Vincent; et al. Scikit-learn: Machine learning in Python. Journal of Machine Learning Research 2011, 12, 2825–30. [Google Scholar]
- Rambachan, Ashesh; Kleinberg, Jon; Ludwig, Jens; Mullainathan, Sendhil. An Economic Approach to Regulating Algorithms; NBER Working Paper No. 27111; National Bureau of Economic Research: Cambridge, 2023. [Google Scholar] [CrossRef]
- Ribeiro, Marco Tulio; Singh, Sameer; Guestrin, Carlos. Why should I trust you? Explaining the predictions of any classifier. In Proceedings of the 22nd ACM SIGKDD International Conference on Knowledge Discovery and Data Mining; ACM: New York, 2016; pp. 1135–44. [Google Scholar] [CrossRef]
- Rudin, Cynthia. Stop explaining black box machine learning models for high stakes decisions and use interpretable models instead. Nature Machine Intelligence 2019, 1, 206–15. [Google Scholar] [CrossRef] [PubMed]
- Speicher, Till; Heidari, Hoda; Grgić-Hlača, Nina; Gummadi, Krishna P.; Singla, Adish; Weller, Adrian; Zafar, Muhammad Bilal. A unified approach to quantifying algorithmic unfairness. In Proceedings of the 24th ACM SIGKDD International Conference on Knowledge Discovery and Data Mining; ACM: New York, 2018; pp. 2239–48. [Google Scholar] [CrossRef]
- Sweeney, Latanya. k-Anonymity: A model for protecting privacy. International Journal of Uncertainty, Fuzziness and Knowledge-Based Systems 2002, 10, 557–70. [Google Scholar] [CrossRef]
- Thomas, Lyn C.; Edelman, David B.; Crook, Jonathan N. Credit Scoring and Its Applications; SIAM: Philadelphia, 2002. [Google Scholar] [CrossRef]
- Troyanskaya, Olga; Cantor, Michael; Sherlock, Gavin; Brown, Pat; Hastie, Trevor; Tibshirani, Robert; Botstein, David; Altman, Russ B. Missing value estimation methods for DNA microarrays. Bioinformatics 2001, 17, 520–25. [Google Scholar] [CrossRef] [PubMed]
- Verma, Sahil; Rubin, Julia. Fairness definitions explained. In Proceedings of the 2018 IEEE/ACM International Workshop on Software Fairness; ACM: New York, 2018; pp. 1–7. [Google Scholar] [CrossRef]
- Voigt, Paul; Von dem Bussche, Axel. The EU General Data Protection Regulation (GDPR): A Practical Guide; Springer: Cham, 2017. [Google Scholar] [CrossRef]
- Wachter, Sandra; Mittelstadt, Brent; Russell, Chris. Counterfactual explanations without opening the black box: Automated decisions and the GDPR. Harvard Journal of Law & Technology 2017, 31, 841–87. [Google Scholar] [CrossRef]
- Wachter, Sandra; Mittelstadt, Brent; Russell, Chris. Why fairness cannot be automated: Bridging the gap between EU non-discrimination law and AI. Computer Law & Security Review 2021, 41, 105567. [Google Scholar] [CrossRef]
- Zavolokina, Liudmila; Dolata, Mateusz; Schwabe, Gerhard. FinTech—What’s in a name? Electronic Markets 2021, 31, 549–64. [Google Scholar] [CrossRef]
- Zhang, Brian Hu; Lemoine, Blake; Mitchell, Margaret. Mitigating unwanted biases with adversarial learning. In Proceedings of the 2018 AAAI/ACM Conference on AI, Ethics, and Society; ACM: New York, 2018; pp. 335–40. [Google Scholar] [CrossRef]
Figure 1.
Data processing and feature-engineering pipeline for AI-based credit scoring.
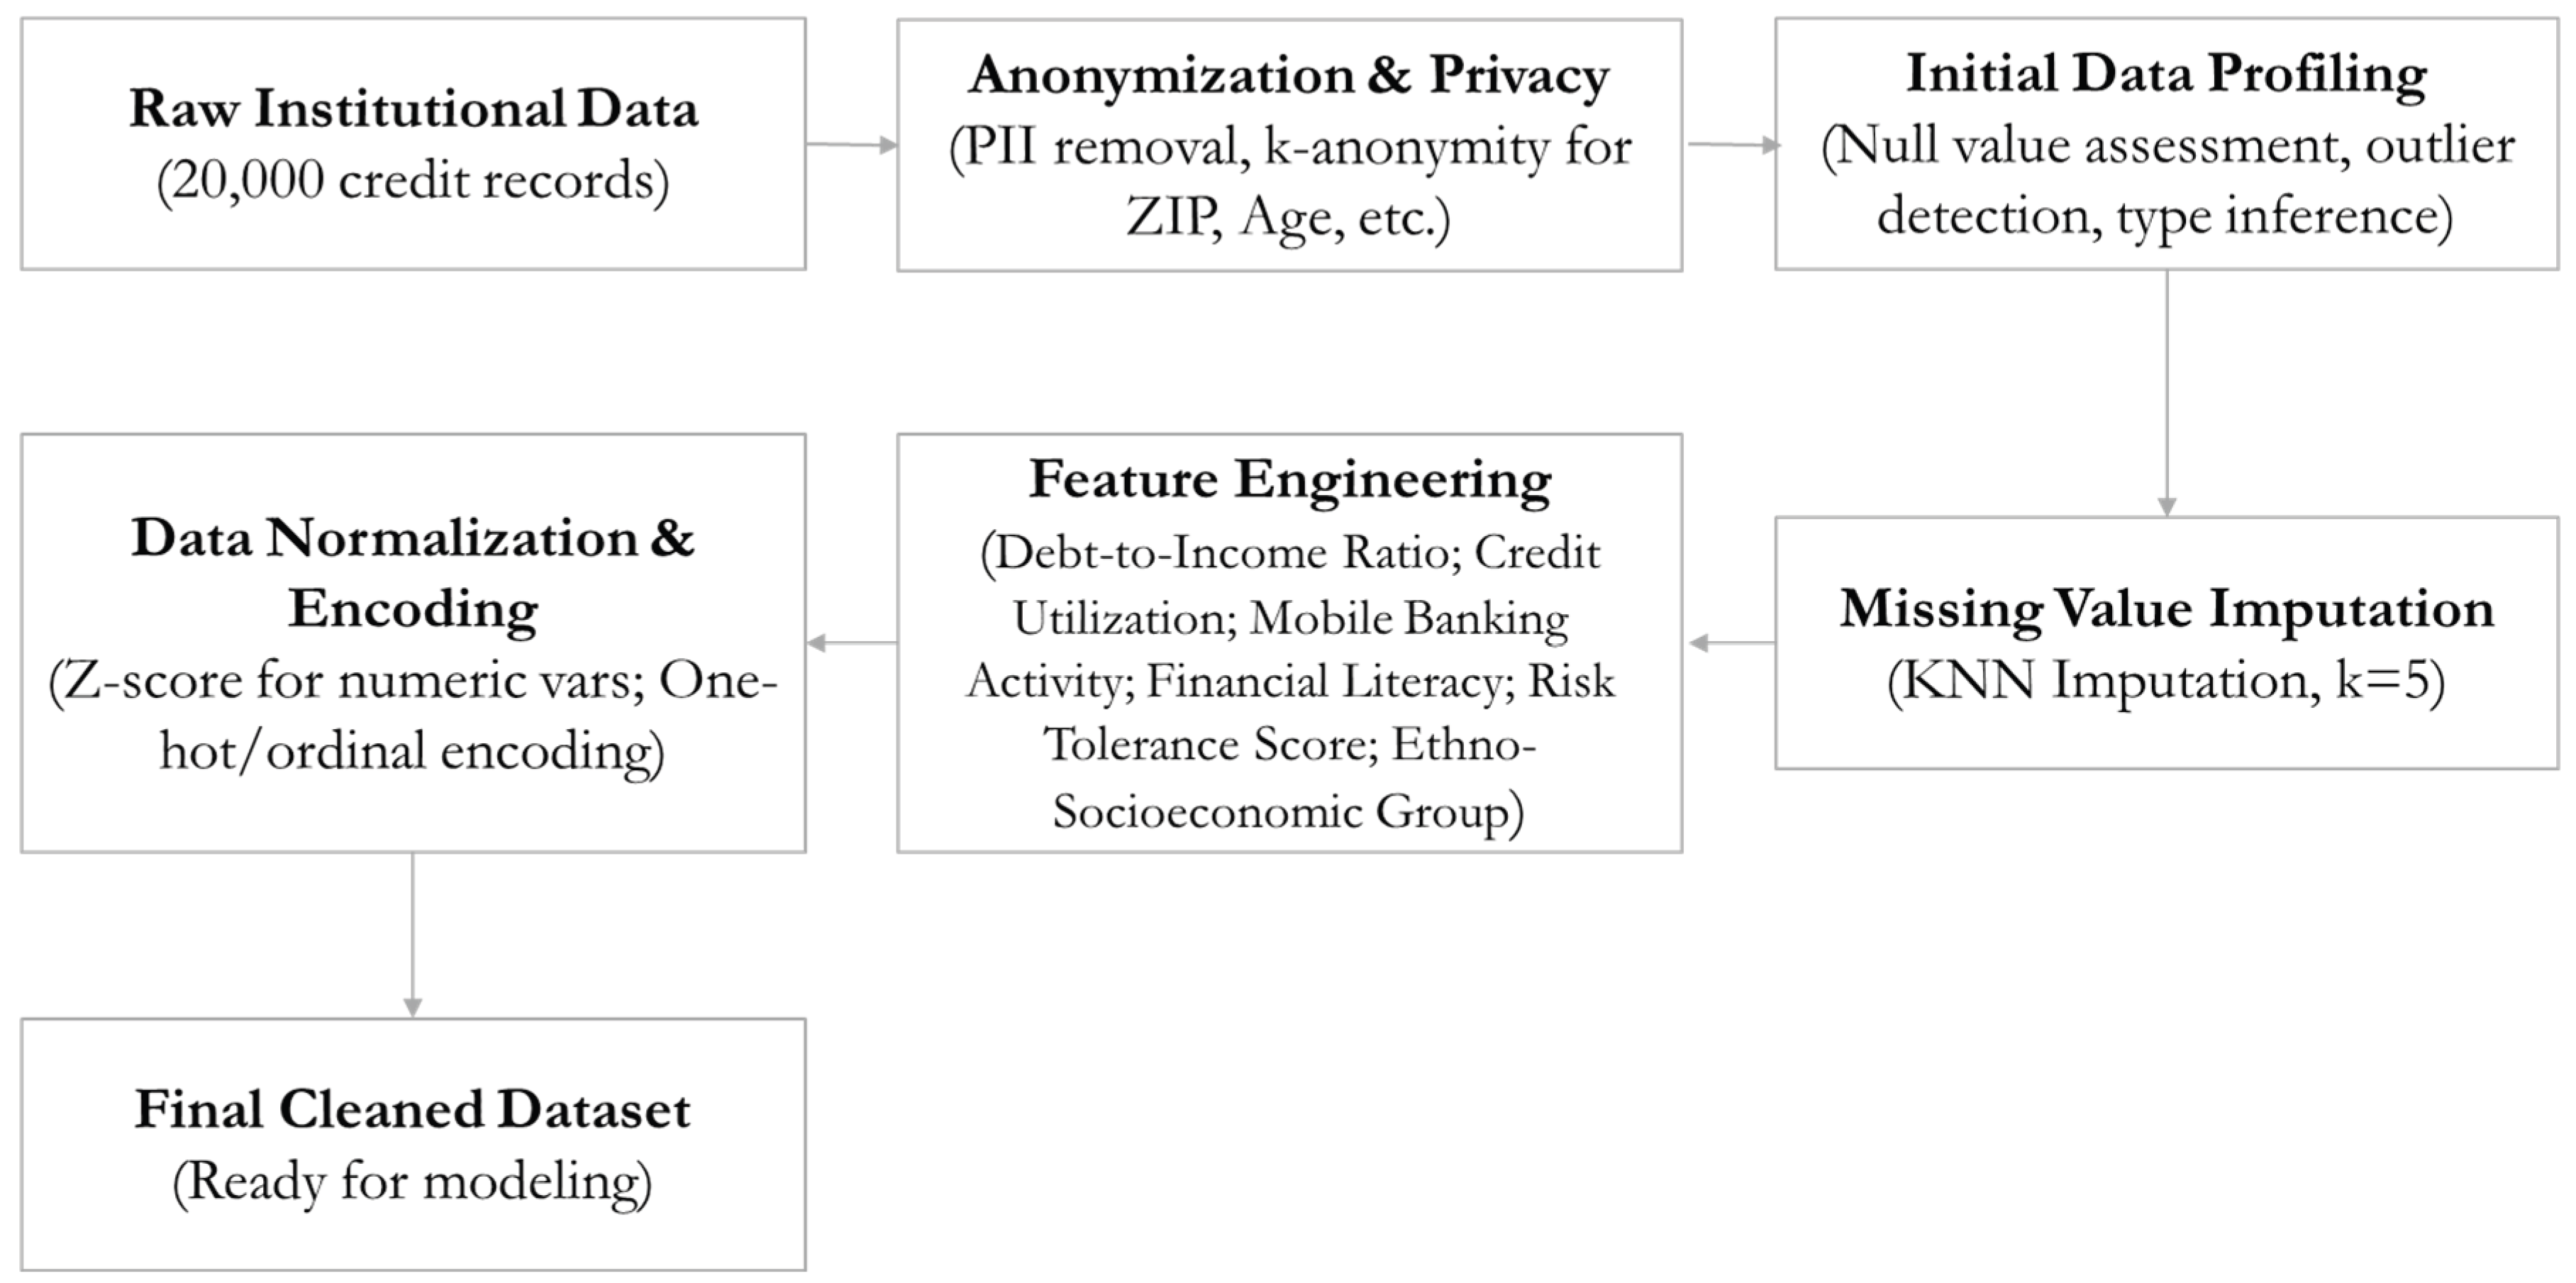
Figure 2.
End-to-end workflow of the logistic-regression baseline for default classification, adapted from modeling practice in Kuhn and Johnson (2013), Hand and Henley (1997), and Thomas et al. (2002).
Figure 2.
End-to-end workflow of the logistic-regression baseline for default classification, adapted from modeling practice in Kuhn and Johnson (2013), Hand and Henley (1997), and Thomas et al. (2002).
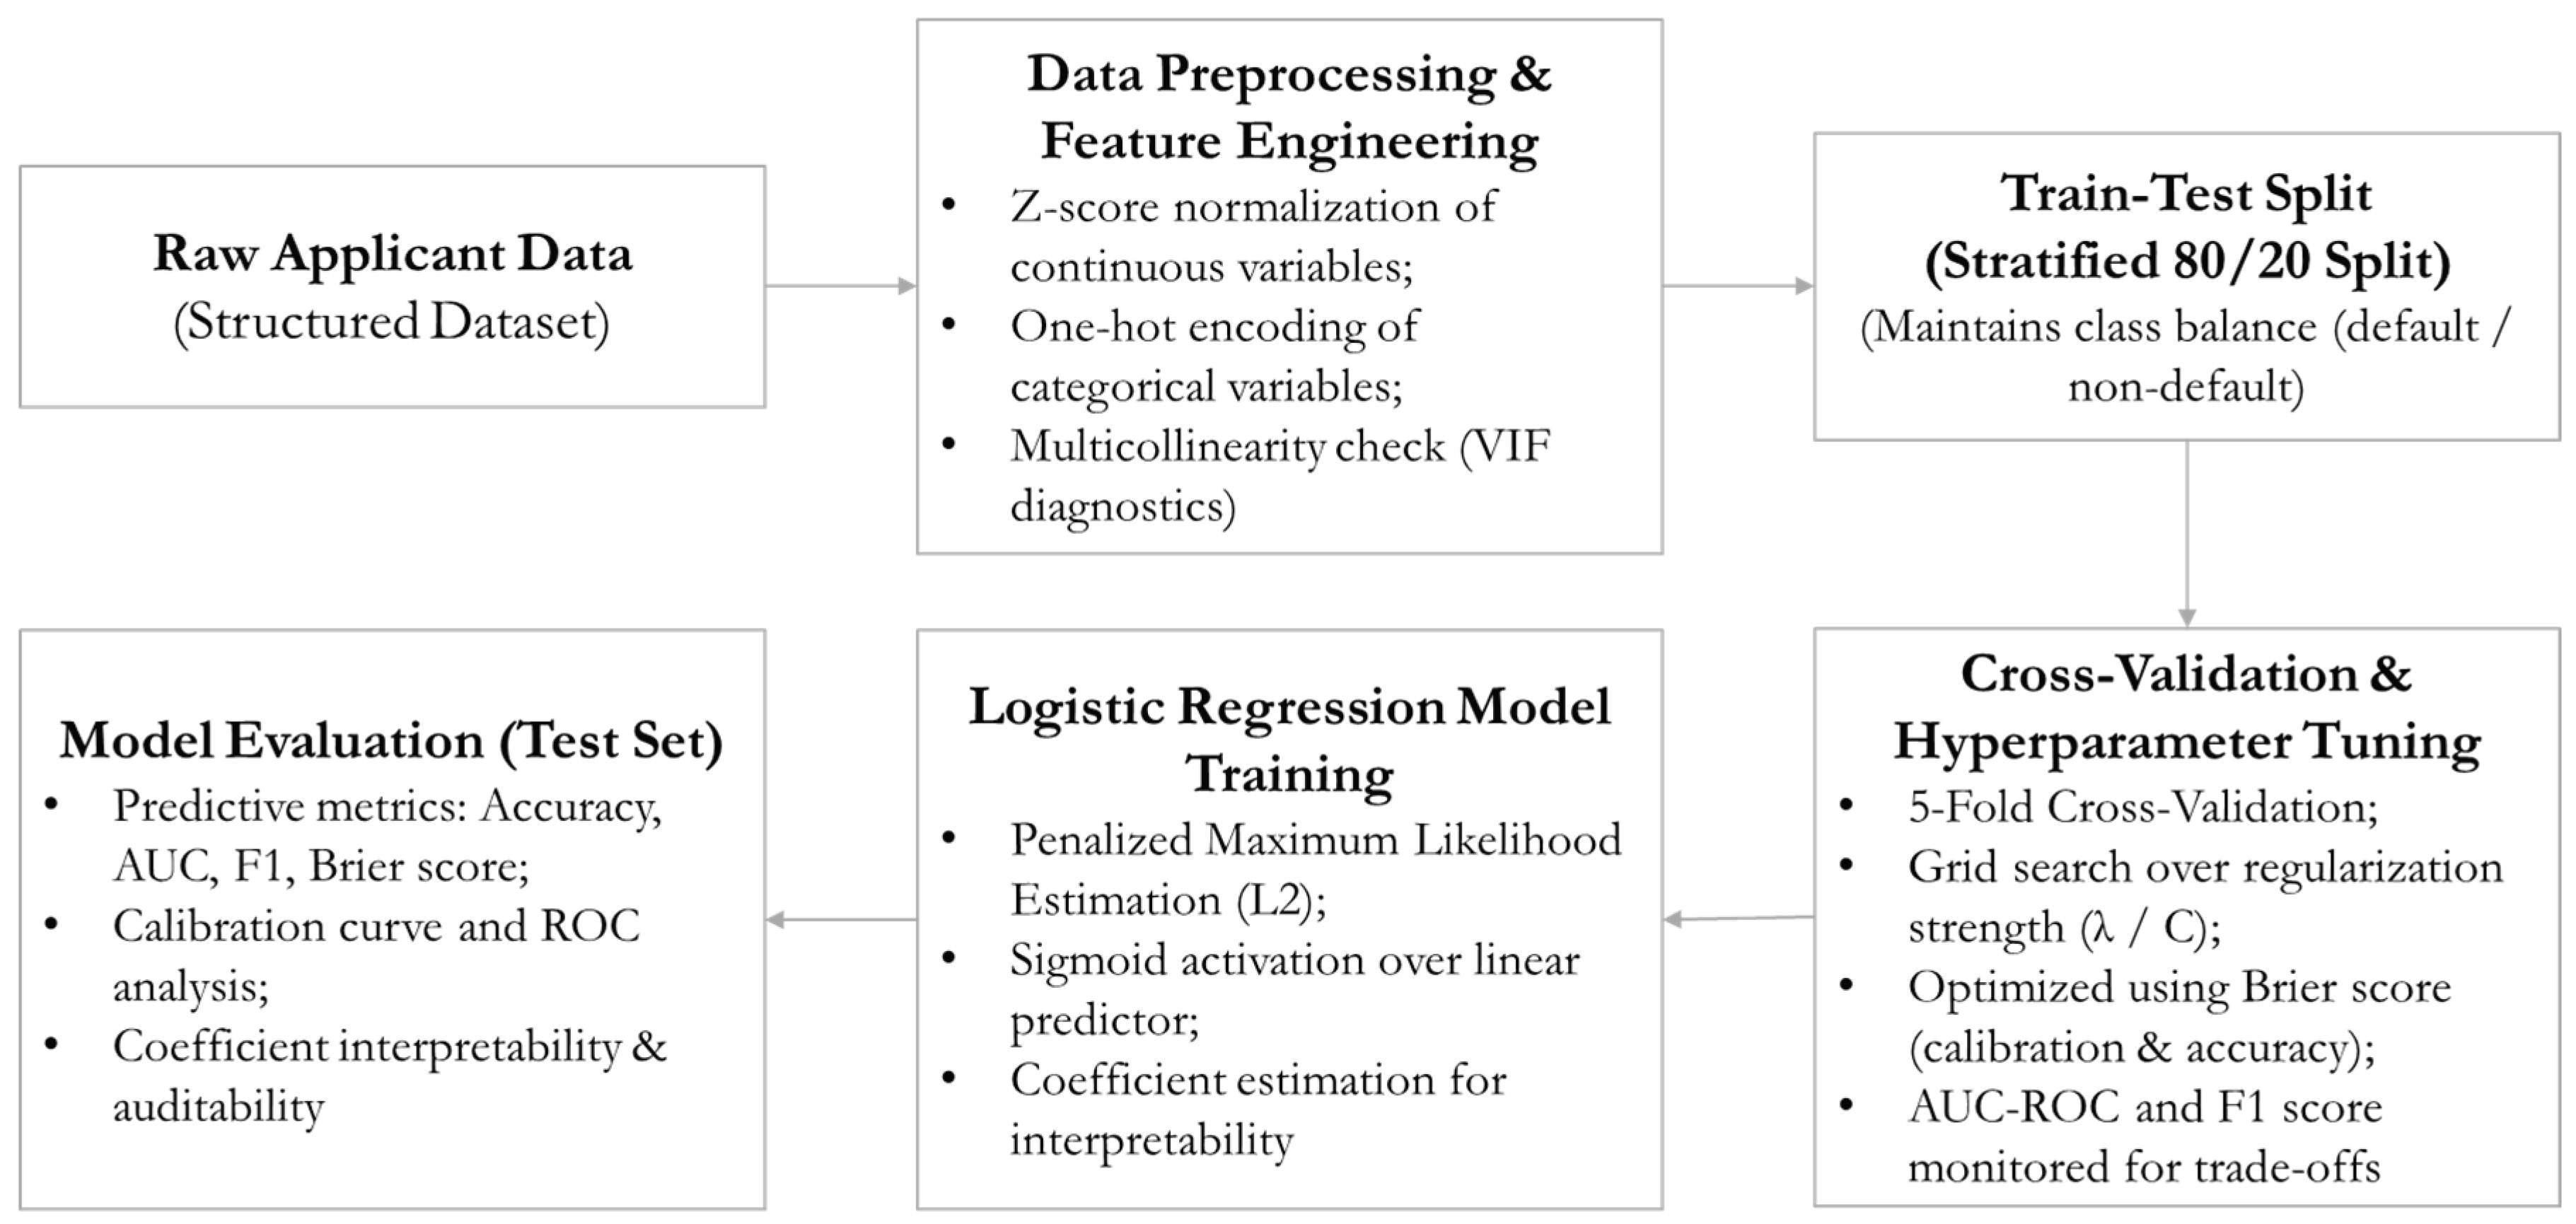
Figure 3.
Architecture of the high-capacity classifiers, adapted from Kuhn and Johnson (2013), Ke et al. (2017), and Hastie et al. (2009).
Figure 3.
Architecture of the high-capacity classifiers, adapted from Kuhn and Johnson (2013), Ke et al. (2017), and Hastie et al. (2009).
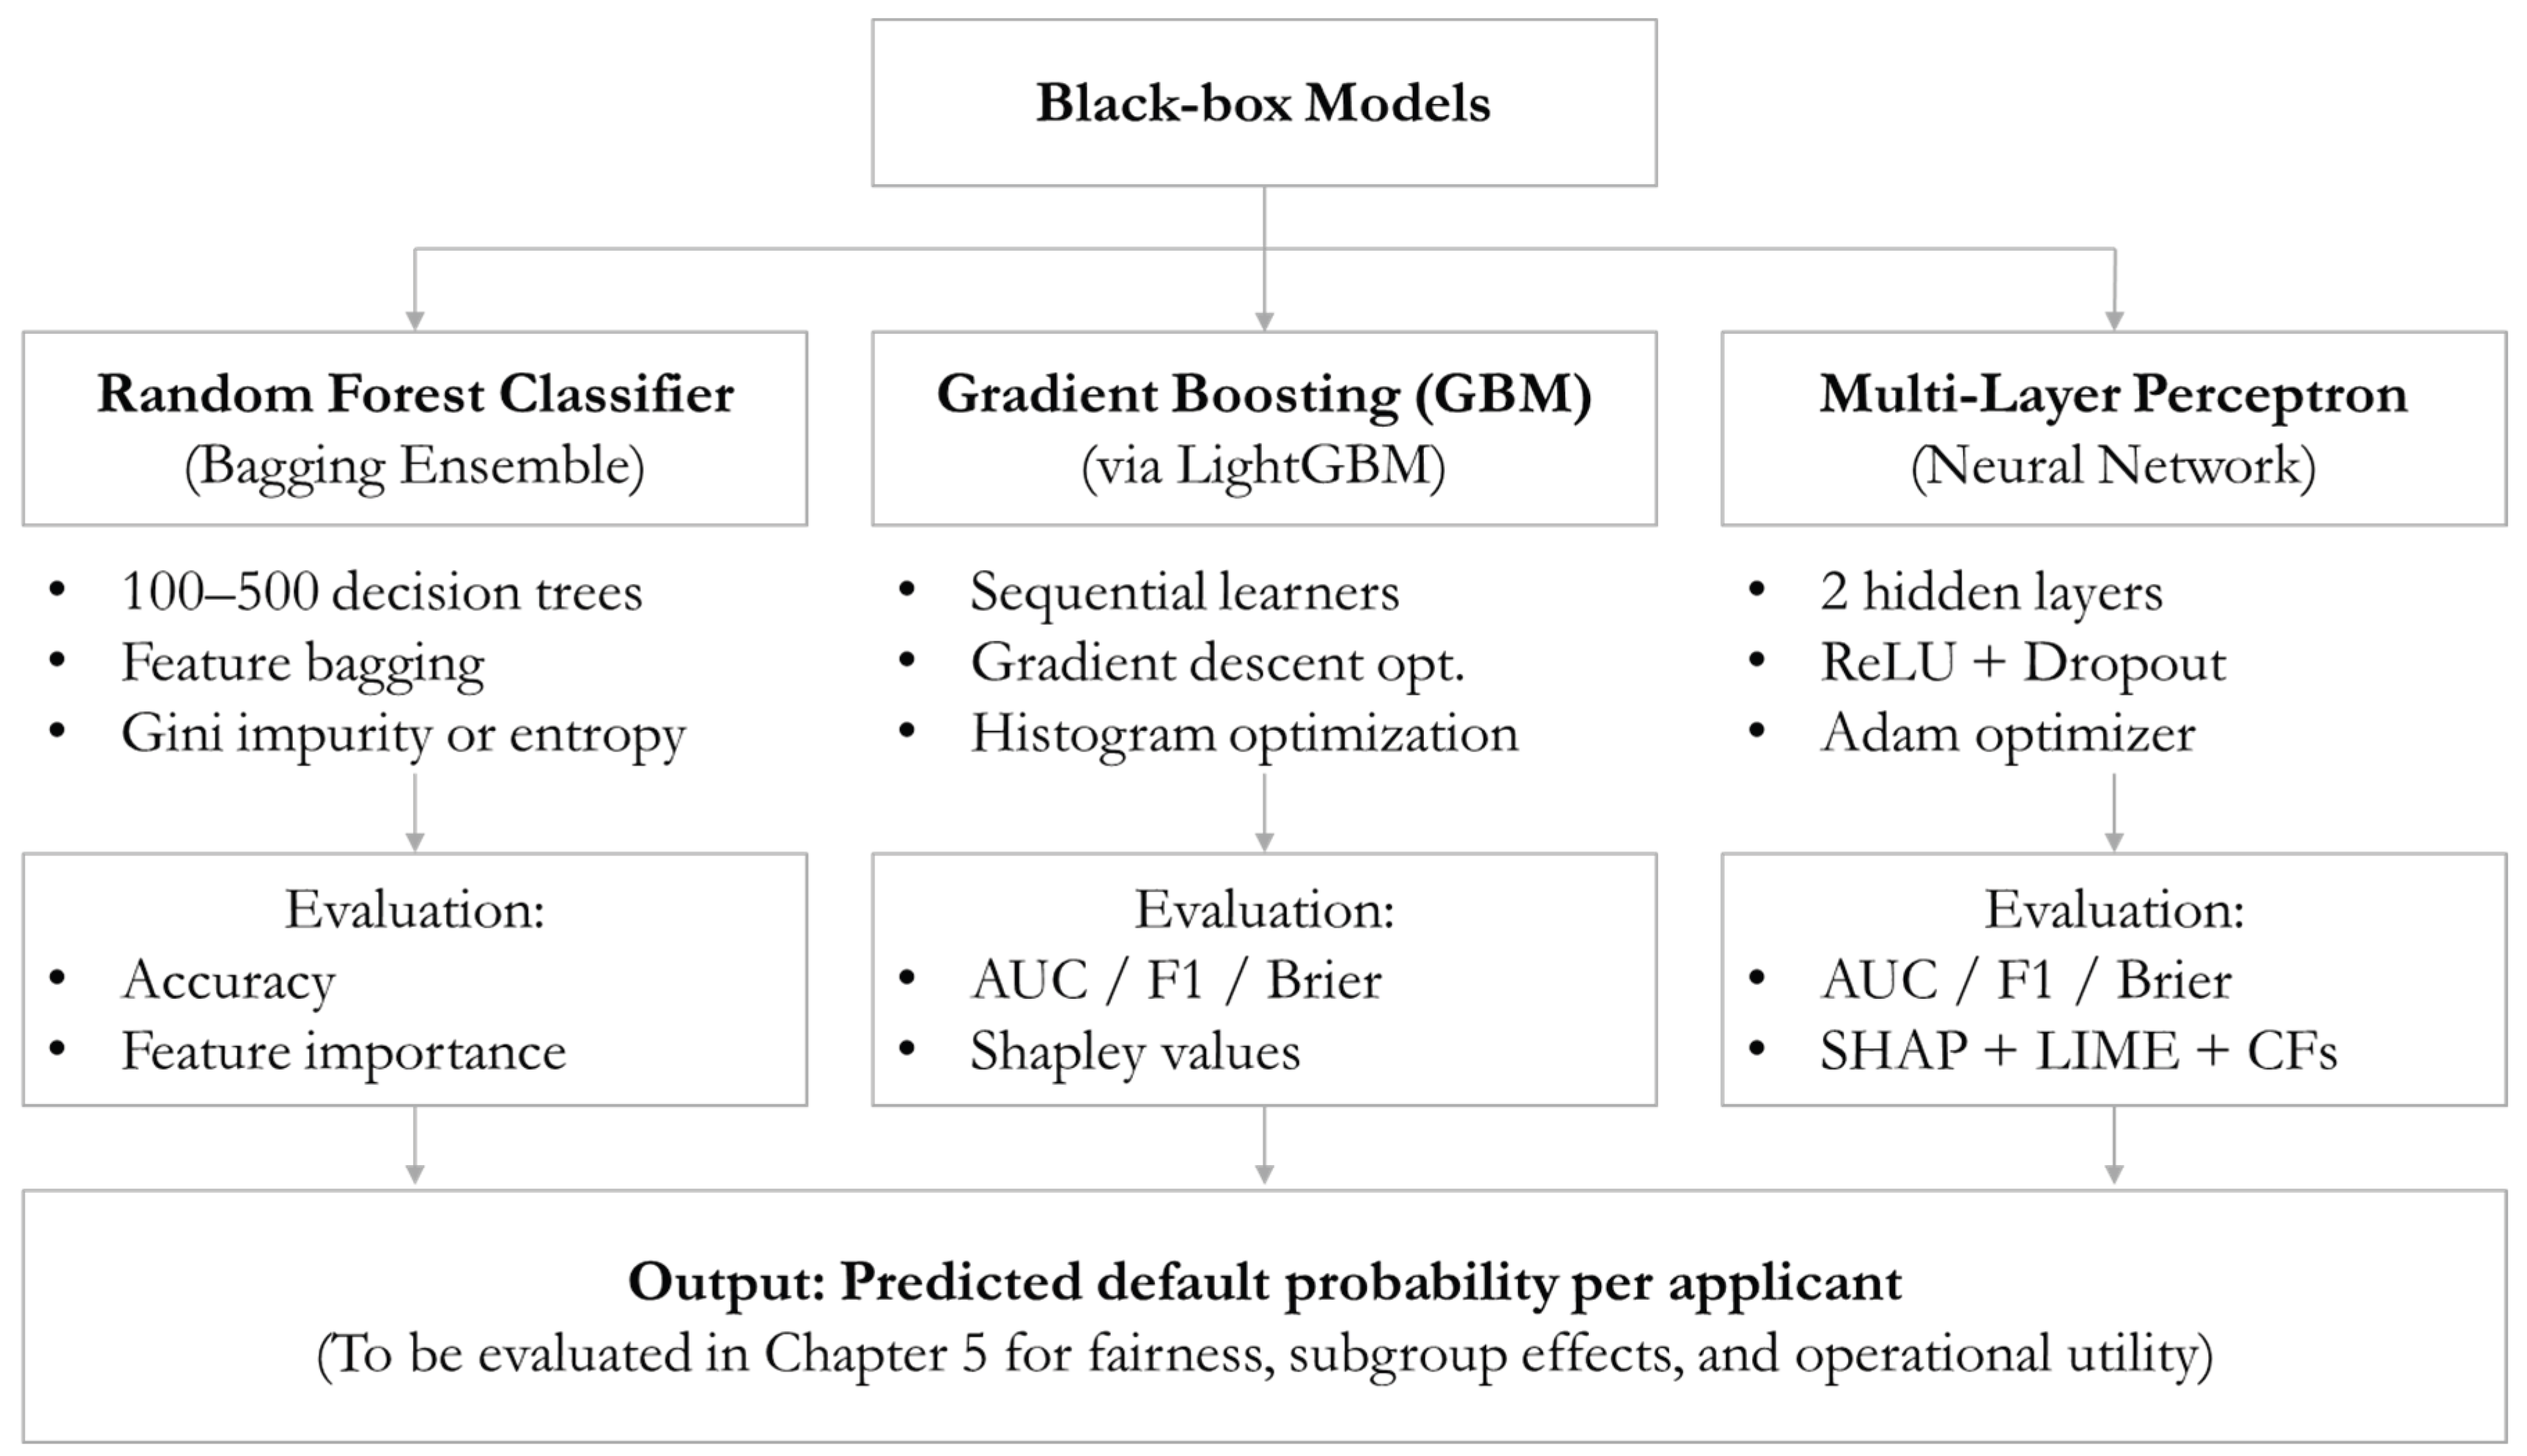

Table 1.
Descriptive statistics of applicant-level features (N = 20,000).
| Variable | Type | Mean/% | SD/Range | Description |
| Socio-demographic | ||||
| Age (years) | Continuous | 38.7 | 11.3 [18–71] | Age at application |
| Gender (female) | Binary | 52.4% | — | Self-declared, 1 = female |
| Education level | Ordinal | Secondary | — | Primary/Secondary/Tertiary |
| Employment status | Categorical | Permanent (62%) | — | Permanent/Temporary/Unemployed |
| Ethno-socioec. group | Derived cat. | Group A (22.8%) | — | ZIP + surname (audit only) |
| ZIP-code cluster | Categorical | Cluster B (27%) | — | Neighborhood SES, 5 levels |
| Financial attributes | ||||
| Credit score | Continuous | 624.3 | 68.5 [300–850] | Internal bureau score |
| Annual income (€) | Continuous | 26,800 | 9,300 [8k–95k] | Verified gross income |
| Loan amount (€) | Continuous | 8,730 | 5,150 [500–30k] | Requested principal |
| Loan term (months) | Continuous | 38.2 | 12.6 [6–72] | Requested duration |
| Debt-to-income ratio | Continuous | 0.41 | 0.19 [0.01–1.49] | Monthly debt/gross income |
| Credit utilization | Continuous | 0.53 | 0.21 [0–1] | Revolving balance/limit |
| No. of delinquencies | Discrete | 0.63 | 1.21 [0–8] | Missed payments, 2 years |
| Default (target) | Binary | 15.2% | — | 1 = default within 12 months |
| Behavioral indicators | ||||
| E-commerce activity | Continuous | 0.44 | 0.23 [0–1] | Normalized transaction score |
| Mobile-app logins/mo. | Continuous | 13.7 | 6.1 [0–45] | Institution app usage |
| Psychometric measures | ||||
| Financial-literacy score | Continuous | 63.4 | 14.7 [0–100] | % correct on quiz |
| Risk-tolerance index | Ordinal | 3.7 | 0.9 [1–5] | Higher = greater risk affinity |
| Operational metadata | ||||
| Application channel | Binary | 82.1% digital | — | 1 = digital submission |
| Response time (hours) | Continuous | 10.6 | 8.9 [1–48] | Submission to decision |
Sensitive-group fields are used for fairness auditing only and are not model inputs.
Table 2.
Summary of modeling phases for credit-risk classification.
| Phase | Approach | Algorithms/techniques | Primary objective | Evaluation focus |
| I | Baseline (interpretable) | LR with L2 penalty | Transparent, regulatory-compliant benchmark | Calibration (Brier), AUC, F1, coefficients |
| II | High capacity | LightGBM (GBM); MLP | Maximize predictive performance | Discrimination (AUC), feature interactions |
| III | Fairness aware | Reweighing; adversarial debiasing; reject option | Mitigate bias across ethno-socioeconomic groups | DPD, EOD, DIR, TI; disparity reduction |
Table 3.
Logistic-regression coefficients and significance levels.
| Variable | β coefficient | Std. error |
| Intercept | −1.72 * | 0.23 |
| Credit score | −0.013 * | 0.002 |
| Annual income (€/1,000) | −0.034 ** | 0.011 |
| Debt-to-income ratio | +1.43 * | 0.28 |
| Credit utilization | +0.87 * | 0.22 |
| Number of delinquencies | +0.54 * | 0.09 |
| Loan amount (€/1,000) | +0.016 ** | 0.005 |
| Loan term (months) | +0.006 * | 0.003 |
| Mobile-app logins (per mo.) | −0.029 * | 0.012 |
| E-commerce activity index | −0.32 * | 0.14 |
| Financial-literacy score | −0.011 ** | 0.004 |
| Risk-tolerance index | +0.21 ** | 0.08 |
| Application channel (digital) | −0.27 * | 0.13 |
| Submission hour (centered) | +0.03 | 0.02 |
| Response time (hours) | +0.015 * | 0.006 |
| Ethno-socioeconomic group (A) | +0.36 * | 0.10 |
| McFadden’s R² | 0.278 | |
| LR test statistic (χ²) | 1,576.6 | |
| p-value (LR test) | < 0.001 |
Robust standard errors. Significance levels: * p < 0.01, p < 0.05, * p < 0.1.
Table 4.
Predictive performance of the logistic-regression model (test set).
| Metric | Value | Std. dev. (CV) |
| Brier score | 0.162 | ±0.004 |
| AUC-ROC | 0.734 | ±0.006 |
| F1 score | 0.691 | ±0.007 |
| Accuracy | 78.5% | ±0.5% |
Table 5.
Group-fairness metrics for the baseline logistic-regression model.
| Group comparison | Approval rate (%) | TPR (%) | DPD | EOD | DIR | TI |
| Group A vs. others | 11.4 vs. 17.1 | 52.8 vs. 69.3 | −0.057 | −0.165 | 0.67 | 0.112 |
| Female vs. male | 16.2 vs. 15.1 | 67.4 vs. 63.9 | +0.011 | +0.035 | 1.07 | 0.029 |
| ZIP cluster B vs. others | 12.8 vs. 16.6 | 61.3 vs. 68.2 | −0.038 | −0.069 | 0.77 | 0.065 |
Approval rate = predicted non-default; TPR = true-positive (correct-approval) rate; thresholds held constant across comparisons.
Table 6.
Predictive and fairness performance across modeling strategies.
| Model | Mitigation | AUC | Brier | F1 | DPD | EOD | DIR |
| LR (baseline) | None | 0.734 | 0.162 | 0.691 | −0.057 | −0.165 | 0.67 |
| LR (pre-process) | Reweighing | 0.723 | 0.165 | 0.684 | −0.021 | −0.086 | 0.85 |
| GBM (baseline) | None | 0.783 | 0.150 | 0.715 | −0.072 | −0.193 | 0.61 |
| GBM (in-process) | Adversarial debiasing | 0.765 | 0.157 | 0.701 | −0.026 | −0.104 | 0.84 |
| MLP (baseline) | None | 0.792 | 0.149 | 0.719 | −0.083 | −0.205 | 0.58 |
| MLP (post-process) | Reject option | 0.774 | 0.153 | 0.707 | −0.031 | −0.112 | 0.81 |
Smaller absolute DPD and EOD and higher DIR indicate improved fairness.
Table 7.
Comparative matrix of model performance and fairness outcomes.
| Model | Mitigation | AUC-ROC | DIR | Fairness–performance trade-off |
| LR | None | 0.734 | 0.67 | High disparity; strong transparency |
| LR | Reweighing | 0.723 | 0.85 | Substantial fairness gain; minimal loss |
| GBM | None | 0.783 | 0.61 | Stronger performance; higher disparity |
| GBM | Adversarial debiasing | 0.765 | 0.84 | Balanced performance and fairness |
| MLP | None | 0.792 | 0.58 | Best AUC; highest disparity |
| MLP | Reject option | 0.774 | 0.81 | Effective fairness retrofit |
Disclaimer/Publisher’s Note: The statements, opinions and data contained in all publications are solely those of the individual author(s) and contributor(s) and not of MDPI and/or the editor(s). MDPI and/or the editor(s) disclaim responsibility for any injury to people or property resulting from any ideas, methods, instructions or products referred to in the content. |
© 2026 by the author. Licensee MDPI, Basel, Switzerland. This article is an open access article distributed under the terms and conditions of the Creative Commons Attribution (CC BY) license.
Copyright: This open access article is published under a Creative Commons CC BY 4.0 license, which permit the free download, distribution, and reuse, provided that the author and preprint are cited in any reuse.


