

Submitted:
20 July 2026
Posted:
22 July 2026
You are already at the latest version
Abstract
Hydrocarbon reservoirs remain a cornerstone of the global energy landscape; precise reservoir characterization is essential to evaluate the viability of crude oil production. Addressing the challenges inherent in low-permeability, low-porosity formations and near-wellbore environments is critical for maintaining sustainable production. Due to the heterogeneity of deep reservoir cores, non-destructive analytical methods are required for sample reuse. Nuclear Magnetic Resonance (NMR) techniques - specifically low-field (LF) NMR and Magnetic Resonance Imaging (MRI) - have emerged as essential tools for the spatial characterization of pore networks. While these methods are well-established for determining porosity and permeability in sandstones, the characterization of carbonates is more complex due to their intricate chemistry, multi-scale geological features, and geo-mechanical properties. This review article synthesizes the theoretical framework and practical applications of NMR for determining the petrophysical properties of sandstone and carbonate rocks, including porosity, permeability, and fluid saturations. We provide a concise historical overview and a technical evaluation of the primary equations used in LF-NMR data inversion. We examine recent advancements in LF-NMR and MRI applications, identify persistent challenges and future perspectives, and summarize key lessons learned from the recent literature. Hence, this review provides a comprehensive roadmap for applying magnetic resonance to rock core analysis.
Keywords:
reservoir characterization
; sandstone
; carbonate
; low-field NMR
; MRI
1. Introduction
Petroleum – derived from the Greek petros (rock) and elaion (oil) [1] - is a naturally occurring, oily, flammable liquid usually obtained from beneath the Earth’s surface by drilling wells. Previously called rock oil, unrefined petroleum is now called crude oil [2]. Crude oil is a complicated blend of alkanes, cycloalkanes, and aromatic hydrocarbons, containing a low fraction of sulfur and trace volumes of nitrogen and oxygen compounds. Beyond its primary role as a global energy source [3], crude oil is an essential feedstock for producing gasoline, diesel, and aviation fuel, as well as for the petrochemical industry [4]. In contemporary exploration, the accurate characterization of reservoir parameters, such as porosity and permeability, is crucial for assessing the commercial viability of new oil fields [5,6] and understanding multi-stage formations [7].
Reservoir lithology is primarily categorized into sandstones and carbonates, which differ fundamentally in two ways: (1) the origin of sediment formation, where sandstones are allochthonous (composed of sediment transported from other locations), and carbonates are autochthonous (formed in situ via biological or chemical processes); and (2) the significantly higher chemical reactivity of carbonate minerals compared to those in sandstone [8]. These geological and mineralogical complexities pose substantial challenges for petrophysical characterization, particularly in formations involving clay minerals, microporosity, or mixed wettability.
While nuclear magnetic resonance (NMR) methods have become industry standard for pore structure and fluid characterization, many classical NMR interpretation models were originally developed for clean sandstones with relatively simple pore geometries and are not always valid in complex lithologies. As a result, extending low-field (LF)-NMR approaches to clay-rich sandstones and heterogeneous carbonates remains an active methodological challenge rather than a solved problem.
This review focuses on the behavior of confined fluids within these complex pore spaces. Gaining insight into the structure-transport correlations that govern the behavior of confined fluids in the porous spaces of carbonates and sandstones is of significant interest to both the petroleum industry and academia [9]. Predicting remaining reserves and recovery potential requires an accurate assessment of the rock matrix and the spatial distribution of fluids within it [10]. Unlike traditional geochemical methods that are often destructive, NMR relaxometry and Magnetic Resonance Imaging (MRI) offer non-destructive, rapid alternatives for laboratory-scale core analysis. Since the inception of NMR use in the petroleum industry, the Schlumberger-Doll Research (SDR) and Timur-Coates equations have served as the pillars of data interpretation [11]. However, applying these foundational models to unconventional fields presents ongoing challenges. Furthermore, despite the rapid growth of NMR literature, the information remains fragmented. As shown in Table 1, existing reviews often focus narrowly on a single lithology or specific fluid type.
The present review fills this gap by providing a comprehensive development history of the SDR and Timur-Coates equations, relating them directly to NMR theory, and evaluating their application in both sandstone and carbonate systems. Specifically, this article addresses three core questions:
1. Why do classical NMR permeability models (Timur-Coates and SDR) perform well in clean sandstones but often fail in heterogeneous carbonate reservoirs?
2. How have recent advances in LF-NMR methodology overcome the limitations of one-dimensional (1D) relaxation analysis for complex sandstone and carbonate reservoirs?
3. What are the remaining challenges and future directions for quantitative NMR-based reservoir characterization across different lithologies?
These questions provide the framework for the review. Section 5, Section 6, Section 7 and Section 8 systematically examine the physical basis, limitations, methodological developments, and lithology-specific applications of NMR-based permeability characterization in sandstone and carbonate reservoirs.
The review is structured as follows: after a comparative description of sandstones and carbonates, we outline the fundamentals of NMR and the principles of LF-NMR. We then detail the historical evolution of the primary interpretive equations, followed by recent case studies. Finally, we conclude with an analysis of current trends, "lessons learned," and future perspectives for improving reservoir characterization using LF-NMR relaxometry.
2. Sandstones Versus Carbonates
Approximately half of all petroleum reservoirs are siliciclastic, primarily composed of sandstone. While sandstone reservoirs are globally ubiquitous, carbonate reservoirs are more geographically concentrated, particularly in the Middle East, yet they hold a significant portion of global hydrocarbon reserves. Reservoir performance in both lithologies is governed by a triad of factors: porosity (storage capacity), permeability (fluid transmissibility), and fluid saturations. However, the extraction efficiency is further modulated by complex pore geometries and the varying wettability of mineral surfaces.
2.1. Sandstone Reservoirs: Siliciclastic Complexity
Sandstones are formed in diverse sedimentary environments—including marine, fluvial, and eolian systems [23] – and are composed of quartz, feldspar, rock fragments, and clay minerals, such as kaolinite [23] and various oxides, such as SiO2, MgO, and CaO [24]. Their chemical and mineralogical composition directly dictates reservoir quality; for instance, a clay fraction exceeding 10–15% can trigger rapid porosity loss due to mechanical compaction [23]. In other words, sandstone reservoir properties depend on their primary composition, which is influenced by the depositional environment's texture and mineralogy (provenance) as well as diagenetic processes occurring near the surface and during burial.
Reservoir quality depends on porosity and permeability [25]. While porosity and permeability typically decrease with burial depth, "deep" sandstone reservoirs (below 13,000 feet) can maintain anomalously high quality due to specific diagenetic pathways [26].
The relationship between porosity and permeability in sandstones is fundamentally linked to the architecture of pore throats. These features—defined by their geometric shape, size distribution, and spatial connectivity—govern subsurface flow [16]. Sandstone pore networks are often characterized by significant tortuosity and a broad range of throat sizes, from the nano- to micro-scale. In "tight" sandstones, these microscopic conduits are the primary determinants of fluid transport, making quantitative evaluation of pore morphology essential for optimizing recovery [15,27,28,29].
2.2. Carbonate Reservoirs: Heterogeneous and Reactive
Carbonates pose a more formidable challenge for characterization due to their high chemical reactivity and biological origins. However, carbonates contain a significant volume of the world’s hydrocarbon reserves [30], implying their importance to the future of the upstream petroleum industry [31,32,33]. Meanwhile, carbonate reservoirs are complex due to various porosity types and heterogeneous pore-size distributions [31], including those of biological origin. A typical carbonate rock consists of grains, matrix, and cement. Carbonate-based reservoirs are defined as double-porosity systems, where fractures govern flow due to their greater ease of fluid flow. At the same time, the pore pattern in the matrix is considered a storage space [34]. The multi-porosity systems and pore-scale topographies of carbonates, such as fissures, fractures, and vugs, pose a wide array of characterization challenges [35,36]. These challenges extend to characterizing carbonate-based reservoirs in terms of their petrophysical properties, including porosity and permeability. Carbonate rock porosity systems are particularly challenging to identify using conventional wireline logs [31,33,37].
The mineralogical simplicity of carbonates—primarily calcite and dolomite [38]—is belied by their extreme structural complexity. Carbonates are found in shallow and deep marine settings, evaporitic basins, windy deserts, and lakes [39]. Although most carbonates formed in the past have shallow roots, the most common carbonates produced today form in deep water. Carbonate rocks are not chemically stable; due to their high chemical reactivity, they undergo post-depositional diagenetic [40] processes, including cementation, dissolution, dolomitization, and evaporite mineralization. The key to understanding carbonate formations is identifying their complex porosity systems. Carbonate porosity is generally classified into:
- Primary Porosity: Originating during sedimentation (e.g., intergranular and intragranular).
- Secondary Porosity: Resulting from diagenetic processes (e.g., fractures and vugs).
Vugs are a defining feature of carbonates; these diagenetically formed cavities can range from millimeters to several centimeters in size. Depending on their spatial distribution, they are categorized as either isolated or interconnected, with the latter significantly influencing permeability anisotropy [31,35].
In carbonate rocks, fundamental petrophysical parameters, such as porosity and permeability, are frequently uncoupled [12] and do not exhibit the direct correlations typically found in sandstones. Assessing these parameters requires a deep understanding of diagenetic features, which are vital for characterizing reservoir behavior. Given the inherent complexity of carbonate hydrocarbon reservoirs, meticulous development and production planning are essential for optimizing crude oil recovery [33].
This complexity typically arises from extensive diagenetic processes that obscure the rock's depositional history. Over geological timescales, diagenesis generally works against the preservation of storage capacity; while modern carbonates can exhibit initial porosities as high as 60%, ancient counterparts may retain only 1% to 2%. In established reservoirs, porosity typically ranges from 5% to 15%. The two most common diagenetic features of carbonates are vugs and fractures, which serve as the primary conduits for oil and gas recovery [41]. Vugs, which are significantly larger than regular matrix pores, can reach several centimeters in size [42,43]. Although their precise definition remains a subject of debate between geologists and reservoir engineers, they are generally classified from an engineering perspective as diagenetically formed cavities larger than the constituent grains and pores [31,35,37,44,45].
In these dual-porosity systems, fractures typically govern permeability, while vugs provide the essential storage porosity [31,33,44,45,46]. Quantifying vuggy porosity is therefore a critical step in accurately estimating reservoir potential. Furthermore, the spatial distribution and degree of connectivity among vugs significantly influence permeability anisotropy, which must be accounted for to ensure optimized hydrocarbon recovery [45].
2.3. Comparative Petrophysics
A critical distinction lies in the correlation between physical properties. In sandstones, porosity and permeability often follow predictable trends. In contrast, carbonate petrophysical parameters are frequently uncoupled; a high-porosity carbonate may exhibit negligible permeability if the pore systems (such as isolated vugs) are not interconnected. There are several efforts to categorize the pore structures in carbonate reservoirs [30,31,33,37,45]. The most successful categorization of carbonates based on the internal rock structure was established by Dunham in 1962 (Figure 1) [47,48]. The techniques for evaluating the pore structures of carbonates could be categorized into seismic, geological, petrophysical, and well-logging techniques. While traditional methods, such as thin-section analysis, Scanning Electron Microscopy (SEM), and Mercury Injection Capillary Pressure (MICP) provide valuable insights, they are often destructive or scale-limited. For instance, while core description and thin-section sampling provide the most reliable means of quantifying vug presence, these methods are usually tedious and prone to human error [33]. Consequently, LF-NMR has emerged as the preferred non-destructive technique for overcoming these limitations, offering a more holistic quantification of complex vuggy and fractured systems.
Table 2 compares sandstones and carbonates with respect to various properties, including primary composition, porosity, and permeability.
2.4. Lithology-Dependent NMR Response
Although the fundamental principles of NMR relaxation are independent of lithology, the interpretation of NMR measurements is strongly influenced by the mineralogical composition, pore structure, and fluid distribution within different reservoir rocks. Consequently, the relationships among relaxation times, pore size, fluid mobility, and permeability can vary significantly among sandstones, carbonates, and unconventional formations. Understanding these lithology-dependent effects is essential for selecting appropriate permeability models and interpretation workflows.
In clean sandstones, pore systems are generally dominated by intergranular porosity with relatively uniform pore geometries and well-connected flow pathways. Under these conditions, classical assumptions such as constant surface relaxivity, isotropic pore networks, and fast diffusion are often approximately valid. As a result, permeability models such as SDR and Timur–Coates typically provide reliable estimates and have been widely adopted in both laboratory and logging applications.
In contrast, carbonate reservoirs exhibit highly heterogeneous pore systems composed of interparticle pores, moldic pores, vugs, fractures, and microporous matrices. These multiple pore domains often possess different flow characteristics and may contribute unequally to porosity and permeability. Consequently, NMR relaxation times do not always correlate directly with hydraulic flow properties. Large vugs, for example, may generate long relaxation times and contribute substantially to porosity while remaining poorly connected to the overall flow network. Such complexities frequently lead to deviations from classical NMR permeability correlations and necessitate lithology-specific calibrations or more advanced interpretation approaches.
Unconventional reservoirs, including tight sandstones and shales, present additional challenges due to the abundance of nanopores, clay-bound water, organic matter, and strong surface interactions. In these systems, diffusion effects, internal magnetic field gradients, and rapidly relaxing proton populations become increasingly important. The resulting NMR response reflects a combination of pore geometry, mineralogy, fluid composition, and restricted molecular motion, making direct pore-size interpretation considerably more difficult than in conventional reservoirs.
These lithology-specific challenges have been a major driving force behind the development of advanced NMR methodologies discussed in the following sections, including modified permeability models, multidimensional relaxation measurements, diffusion-aware frameworks, and integrated workflows that combine NMR with complementary characterization techniques. Such developments aim to overcome the limitations of classical relaxation-based interpretations and improve reservoir characterization across increasingly complex geological environments (see Table 3 for a summary).
3. Nuclear Magnetic Resonance (NMR) Spectroscopy
NMR spectroscopy is a robust analytical technique that provides detailed local and quantitative insights into molecular structures and dynamics. This method measures the interaction between an oscillating radiofrequency (rf) electromagnetic field and nuclei situated within a strong external magnetic field (B0). In this environment, the nuclear spin system can be perturbed from its equilibrium state, and its subsequent relaxation is monitored. To achieve this, a rf wave is applied at the Larmor frequency, interacting with the nuclei in the presence of B0. A particularly critical component of this process is the 90° pulse, which rotates the net magnetization from the longitudinal z-axis to the transverse xy-plane.
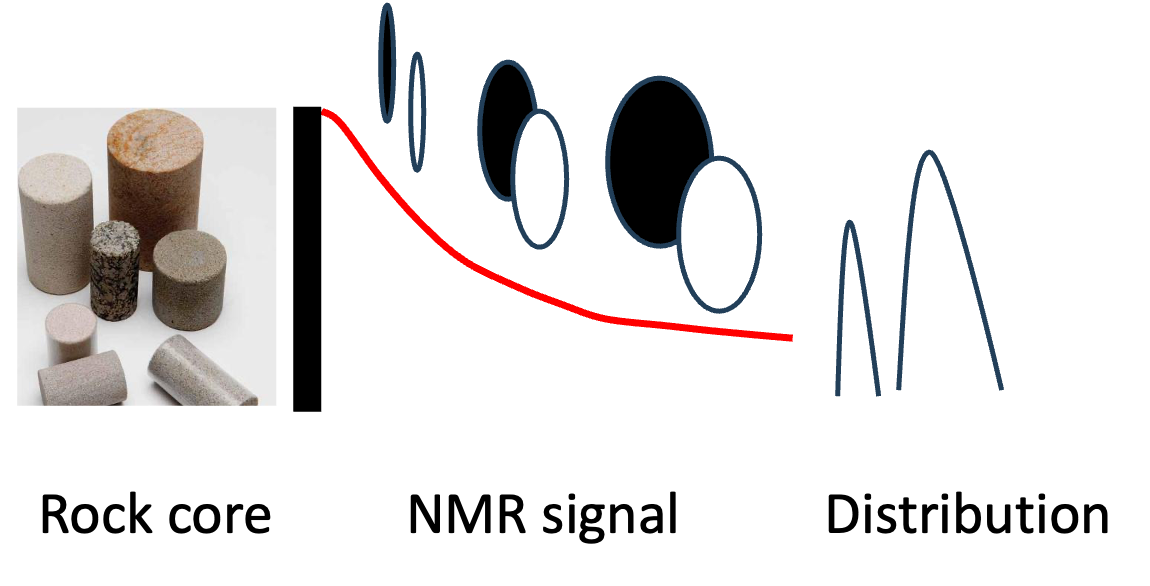
The resulting time-varying electrical response, generated by the rotation of transverse nuclear magnetization, is identified as the Free Induction Decay (FID). This signal is acquired by a sensitive rf detector without an applied external rf field. While traditional spectroscopy applies a Fourier Transform (FT) to obtain frequency-domain information, LF-NMR relaxometry primarily analyzes the time-domain decay [50,51,52]. NMR technology thus provides a powerful alternative for distinguishing between primary and secondary porosities through both high-resolution imaging and sophisticated signal interpretation (Figure 2) [33,37,45,46].
4. Fundamentals of LF-NMR Relaxometry and MRI in Petrophysics
LF-NMR relaxometry is applied in the petroleum industry at both the laboratory scale and in field-scale well-logging. It primarily measures T1 and T2 times [55]. A single NMR relaxometry measurement can provide multiple characteristics of rock core samples, including residual oil saturation, porosity, pore-size distribution, and rock properties such as permeability, wettability, and capillary pressure [17,56,57,58,59,60,61].
Raw NMR relaxation data are mathematically converted into constituent fractions and displayed as relaxation distributions through the Inverse Laplace Transform (ILT) [62]. These distributions are the cornerstone of petrophysical analysis, as they reflect pores of varying dimensions [12,13]. Based on transverse relaxation behavior, pores are typically categorized by size: adsorption pores (< 0.1 μm; T₂ < 2.5 ms), seepage pathways (0.1–10 μm; 2.5 ms < T₂ < 50 ms), and fractures (>10 μm; T₂ > 100 ms) [63,64,65]. Therefore, NMR could yield information on core characteristics and permeability upon potential treatments of the core [66]. In carbonates, this characterization is vital as heterogeneity often spans orders of magnitude, from nanometers to centimeters [67] (see Figure 3 showing the NMR distribution of a representative rock with different porosity). From NMR relaxation distribution curves, both fluid and fundamental rock characteristics, such as porosity (φ), permeability (κ), bulk volume irreducible (BVI) fluid, and bulk volume movable (BVM) fluid, could be determined.
Historically, LF-NMR was optimized for sandstone cores due to their relatively simple granular structures [69,70]. However, sandstones often contain localized mineral deposits, such as clays and metal oxides, which result in a distribution of surface relaxivity (ρ). This parameter quantifies the mineral surface's ability to enhance relaxation [71] in nearby fluid molecules [72], significantly complicating data interpretation. While NMR techniques are well established for characterizing sandstone reservoirs, their application to carbonate reservoirs is more recent and more challenging due to the overlap among different porosity types [31,33,35,37]. Consequently, applying sandstone-calibrated parameters to carbonates can be misleading; proper calibration and empirical parameter determination are required to avoid inaccuracies. Additionally, combining NMR technology with other approaches, such as photographic core analysis and conventional logs, helps validate the interpretation of the relaxation-time signals [33,37].
4.1. Principles of Relaxation and the Role of ρ
In contemporary NMR techniques, rf pulses are used to perturb the nuclear spin system from its equilibrium state, after which the spins return to equilibrium through relaxation mechanisms. These processes are described by two characteristic time constants: T₁, which governs magnetization recovery along the direction of the external magnetic field B₀, and T₂, which characterizes the decay of magnetization components perpendicular to B₀. T1 is an energy-driven process, while T2 is governed by entropy[69,73]
In liquid-dominated geologic systems, T2 relaxation is influenced by three parallel mechanisms: bulk fluid relaxation (T2B), surface relaxation (T2S), and inhomogeneous field dephasing (T2IH) [74]:
To isolate these effects, the Carr-Purcell-Meiboom-Gill (CPMG) pulse sequence is utilized (Figure 4). By applying a train of 180° pulses, this sequence mitigates dephasing and enables measurement of true T2 decay.
Conversely, T1 measurements—which are unaffected by field inhomogeneities—employ Inversion Recovery or Saturation Recovery sequences (Figure 5 and Figure 6). T1 could be described as follows:
where T1B and T1S are the relaxation times of the longitudinal bulk and surface, respectively. The following figure summarizes the inversion and recovery pulse sequences used to measure T1 times.
Under the "fast diffusion" regime, relaxation is dominated by surface effects, expressed as:
where α is a shape factor having the values of 1, 2, and 3 for planar, cylindrical, and spherical pores, respectively, r is the characteristic pore size, and ρ is the bulk relaxation ratio (μm/ms) or surface relaxivity. The Spore is the surface area-to-volume ratio and equals ideal pore shapes. A key benefit of these assumptions is that individual pores independently contribute to the resulting relaxation time [13,30]. Short relaxation times arise from relatively smaller pores, and long relaxation times arise from larger pores (Figure 3).
Accurately determining ρ is essential for converting T2 distributions to pore-size distributions (PSDs) [76,77]. ρ is typically determined by calibrating the PSD derived from the T2 spectrum against the PSD obtained from an independent measurement, such as MICP [71,77]. Furthermore, a significant challenge in core characterization arises from the assumption that ρ remains constant throughout a formation [78] despite potential variations in mineralogy and pore-scale physics; for instance, paramagnetic minerals, such as Fe-bearing illite, accelerate relaxation, thereby shifting the T2 distribution [71,78]. Therefore, Jiang et al. [76] employed the pseudo T2 cutoff (PTC) approach as a more efficient alternative to the time-consuming average pore radius (ARS) method. They established a correlation between PTC and pore radius by performing LF-NMR and high-speed centrifugation measurements on a suite of tight sandstones. The ρ values determined by the PTC method were compared against those obtained using the ARS and the surface-to-volume (SVR) techniques. An exponential correlation was observed between ρ and PTC values, and the ρ values derived from ARS and PTC were comparable and generally higher than those from the SVR method. Furthermore, a linear correlation was established between the illite fraction and ρ. By scaling the T2 distribution with the appropriate ρ, the residual oil distribution was determined. Finally, integrating ρ values from the PTC and SVR methods enabled a comprehensive PSD characterization of mesopores and macropores.
Li et al. [79] utilized both conventional and SVR methods to determine ρ in some unconventional reservoirs. Their findings suggest that the classical SVR technique performs better for pore sizes smaller than 300 nm and for T2 values shorter than 33 ms. Notably, they observed that the ρ values decrease significantly as pore size increases: smaller pores (< 25 nm) averaged 4.72 nm/ms, intermediate pores (25-100 nm) averaged 2.73 nm/ms, and the largest pores (>100 nm) exhibited the lowest relaxivity at 1.25 nm/ms.
These discrepancies in ρ are largely attributed to mineralogical variations across pore scales. While smaller pores are typically associated with high-surface-area clay minerals, larger pores are often dominated by rigid minerals like quartz and generally lack organic matter. Beyond these challenges, ρ heterogeneity can be leveraged to predict permeability from NMR responses. Arns et al. [80] demonstrated that such ρ heterogeneity strongly influences both sandstones and carbonates. As noted by Slijkerman and Hofman [81], a quantitative understanding of ρ is important for converting T2 distributions into capillary pressure - the pressure differential between immiscible fluid phases (usually brine and oil/air) across their interface within the porous medium of the rock [82]. Similarly, Wu et al. [83] developed a precise multi-parameter power-function transformation to predict MICP curves from T2 distributions, using 19 tight sandstone core samples.
Yuan and Rezaee [78] investigated the impact of variations in ρ on NMR-derived PSDs in the Permian Carynginia shale. Rather than adopting a uniform ρ, the authors demonstrated that ρ depends strongly on mineralogical composition, particularly the abundance of Fe-bearing paramagnetic minerals. By integrating log-mean T₂ (T2LM) values with surface-to-volume ratios derived from low-pressure N₂ adsorption, they calibrated ρ and compared the resulting NMR-converted PSDs with MICP measurements. Their results reveal a clear positive correlation between Fe-bearing mineral content and ρ (0.08–0.32 μm s⁻¹), indicating that enhanced paramagnetic effects accelerate T₂ surface relaxation and systematically shift NMR-derived PSDs. These findings highlight the need for accounting for mineral-dependent ρ variability, particularly in heterogeneous shale reservoirs.
The significance of ρ extends to carbonate systems as well. For example, Hosseinzadeh et al. [5] demonstrated how to infer capillary pressure and relative permeability behavior from T₂ relaxation distributions, effectively capturing the interplay between pore geometry and ρ–controlled relaxation mechanisms. By inverting T₂ distributions to generate synthetic capillary pressure and relative permeability (Kr) curves, they have achieved a close match with laboratory-derived MICP and core-flooding measurements.
Integrating these NMR-derived capillary pressure functions with conventional core analysis enabled classification of the carbonate samples into four hydraulic flow units, each defined by characteristic capillary pressure and Kr curves. The approach, applied to Upper Cretaceous Ilam Formation carbonates in the Abadan Plain, shows that ρ–governed NMR relaxation provides a quantitative bridge between pore-scale surface properties and macroscopic capillary flow behavior. When properly calibrated against core data, this methodology significantly improves rock typing and reduces uncertainty in reservoir characterization.
In LF-NMR rock core analysis, the second critical step is the inversion of relaxation decay data into relaxation distributions. As stated above, the T2 distribution of NMR relaxation times reflects the PSDs in a rock core. The T1 distributions reveal the complexity of various fluid-containing matrices and the scattering of pore sizes, for instance, in sedimentary rocks [84]. When a core is water-saturated, surface relaxation effects typically dominate, allowing PSDs to be approximated directly from T₁ data [85]. Concurrently, T2 decay curves correlate with the viscosity of complex crude oil-type blends [84]. Generally, short T2 times are attributed to small pores with high surface-to-volume ratios and low permeability, whereas longer T2 times indicate larger pores and higher permeability (Figure 7) [51,52,84,85].
For over 60 years [17], the petroleum industry has utilized the NMR method to assess rock cores and develop petrophysical relationships between NMR parameters and confined fluids, such as crude oil and water, for petroleum exploration [69,86]. Because NMR measurements average surface interactions with bulk fluid properties, NMR becomes the ‘method of choice’ for determining surface properties, primarily when the surface-to-volume (S/V) ratio is sufficiently high. In this regard, the S/V ratio is a critical parameter for evaluating fluid behavior under confinement.
Because NMR measurements average surface interactions with bulk fluid properties [55]. Interestingly, the T₂ and T₁ values for crude oil in the 4.0 nm silica were lower than those in the 2.5 nm silica. This suggests that the dynamics of confined crude oil are influenced more by the matrix's specific S/V ratio than by the absolute pore diameter. Timur corroborated this by proposing a three-component NMR model in which pore spaces are categorized into three groups based on their S/V ratio distribution [69].
Similar behavior was observed when confining water within the same white, powdered nanoporous silica matrices [87]. The longest T₁ values were observed for water confined in 2.5 nm silica, while the shortest were observed in 4.0 nm silica. This phenomenon - which may seem counterintuitive based on diameter alone - is attributed to the higher S/V ratios present in the 4.0 nm silica material rather than the pore diameter itself.
4.2. Low-Field Magnetic Resonance Imaging (LF-MRI)
In addition to LF-NMR relaxometry, low-field nuclear magnetic resonance imaging (LF-MRI) has emerged as a cornerstone technology in petrophysical research. It provides a non-invasive, real-time method to visualize the spatial distribution and migration of fluids within porous media, such as rock cores. It serves as a vital complement to traditional NMR relaxometry; LF-MRI offers an auxiliary insight into how water and hydrocarbons occupy various pore spaces [88,89,90]. This allows researchers to distinguish between the contributions of adsorption, percolation, and migration pores to the overall flow dynamics [88].
While high-field systems (typically >1 T, corresponding to 1H resonance 42.58 MHz) are the standard in medical diagnostics due to their superior signal-to-noise ratio (SNR), petrophysical research has shifted toward laboratory-scale imaging using low-field permanent magnets, often operating at <100 mT [10]. In natural rocks containing paramagnetic minerals like iron or manganese, high-field systems create "internal gradients" that distort images and render fluid quantification unreliable. LF-MRI mitigates these effects, providing data that is directly comparable to field-scale magnetic resonance well-logging tools [10,91]. This is particularly vital for characterizing complex carbonate reservoirs, such as those in West Kuwait, where the autochthonous origin and high chemical reactivity of the rock render traditional porosity-permeability correlations unreliable. By providing a spatial map of fluid distribution, LF-MRI allows researchers to distinguish between isolated and connected pore networks, which is essential for determining the effective development strategy of a reservoir.
The fundamental principle of LF-MRI involves placing a sample (such as a rock core plug) in a static B0 to align nuclear spins, then applying rf pulses at the Larmor frequency to excite them [89,90,91]. Spatial localization is achieved by applying magnetic field gradients (x, y, z) in 3D space. These gradients cause nuclei in different parts of the sample to experience slightly different resonance frequencies, spin frequencies, and phases [10,90,91]. Thus, it yields intensity distribution maps of signals from different locations and enables the production of a high-resolution NMR image of the internal structure of a porous rock core (Figure 8).
There are two types of LF-MRI experiment systems employed for rock core analysis:
- i
- ex situ / Static Analysis: Observing fluid changes inside the porous rock core before and after experiments employing an independent NMR system.
- ii
- in situ / Dynamic Measurement: Monitoring changes in the rock’s physical properties in real time during active processes, such as core flooding.
The dynamic in situ approach is highly advantageous for Carbon Capture, Utilization, and Storage (CCUS) and Enhanced Oil Recovery (EOR) studies, as it enables continuous monitoring of pore-liquid displacement during the injection of supercritical (sc) CO2, helium, polymers, or brine. A typical setup consists of displacement pumps, core holders, and temperature/pressure control units designed to simulate extreme reservoir conditions (Figure 9) [88,89,91,93]. These setups allow for real-time monitoring of physical parameters and fluid dynamics—such as CO2 displacing brine or helium displacing water—directly within the magnet [88,91].
5. The Evolution of the Foundational NMR Permeability Equations
Building upon the theoretical framework of Korringa et al. [94], who first characterized proton spin relaxation in hydrogen-containing fluids confined within solid pores. In 1966, Seevers proposed a transformative relation between NMR relaxation time and permeability [86]. By applying an NMR well-log approach to sandstones, Seevers demonstrated a correlation between permeability, the free fluid index (FFI) and T1 times.[86] His work successfully validated NMR-derived permeability against traditional flow-based measurements.
This early research led to the formalization of two distinct empirical models in 1969 and 1973 [69,95]. Timur [69] presented a model based on T1 measurements from nearly 200 sandstone samples. According to this simple model, the porous space is categorized into three groups based on S/V ratios, with longer relaxation times corresponding to lower S/V ratios and, hence, larger pores. Timur established correlations between NMR relaxation times and movable fluid volume by defining FFI, a function of the critical relaxation time, Tc, below which fluids are non-producible (irreducible). While Seevers [86] had previously focused only on the longest relaxation components of the larger pores and ignored the rest of the porous space, Timur’s approach assumed that the entire pore network contributes to flow in proportion to its relative S/V distributions. This enabled a more holistic determination of permeability from the full NMR signal.
Concurrently, in 1973, Coates and Dumanoir [95] introduced a novel approach to improve permeability estimations from well logs by integrating resistivity and porosity data. Their method suggested that a common component, "w," could represent both the saturation exponent, "n," and the cementation exponent, "m." By evaluating the relationship between "w", porosity, and formation resistivity at irreducible water saturation, the authors provided a framework for adjusting permeability estimates even in non-irreducible conditions. In this model, variations in "w" reflect the specific characteristics of the formation matrix.
When applied with the w exponent, this method yielded permeability estimates that were in strong agreement with core and production data across both sandstone and carbonate formations. These seminal contributions established the theoretical and empirical bedrock for what is now widely known as the Timur-Coates equation, providing the industry with a standardized method for estimating petrophysical properties in complex reservoir rocks.
5.1. The Kenyon Model and the Emergence of the SDR Equation
In 1988, Kenyon et al [96] presented a comprehensive investigation into the T1 properties of water-saturated sandstones, providing a systematic framework for understanding fluid behavior in porous media. A key contribution of this work was the introduction of the stretched-exponential representation: This model proved as robust as the classical multi-exponential approach while offering the practical advantage of requiring fewer parameters. By analyzing 60 sandstone samples, Kenyon et al. concluded that permeability (ke) is more accurately determined by the expression rather than the expression relationship previously cited in the literature. Notably, while various exponential representations performed equally well in laboratory settings, the stretched-exponential model yielded more reliable permeability estimates at the higher noise levels characteristic of borehole data.
5.2. Foundational Permeability Equations
Building on these pioneering works, the following equations were developed and are now widely used in rock core analysis.
The Timur-Coates family of equations [61,69] typically relates permeability to porosity and the ratio of movable to irreducible fluids:
where κ is permeability [m2], T1 is longitudinal relaxation time, φ is fractional porosity [m3 m−3], C [m2 s−2] is an empirical coefficient. FFI represents the free fluid index, and BVI is bulk volume irreducible. The exponents m and n refer to the cementation factor and saturation exponent, respectively.
The SDR model [11,12,96,97], widely used in well-logging, utilizes the geometric mean of the transverse relaxation time (T2LM):
where T2LM is the geometric mean of the T2 distribution [s], and A [m2 s−4] is a formation-dependent variable [98]. The exponents m and n refer to the cementation factor and saturation exponent, respectively.
5.3. Limitations in Carbonate Systems
While Equations 5 and 6 are robust for sandstone characterization, they often prove inadequate for carbonate reservoirs. In these systems, permeability values derived from conventional NMR models frequently deviate from actual flow measurements. This discrepancy arises from the high fracture density and the inherent mineralogical complexity of carbonates.
For instance, Chang et al. [99] demonstrated that in carbonates, T2 values above 750 ms often arise from dissolved vugs, which contribute significantly to porosity but may not contribute proportionally to permeability if isolated. Consequently, traditional approaches tend to overestimate or underestimate flow potential in such heterogeneous media. To address these inaccuracies, recent research[100] has focused on tailoring the Timur-Coates and SDR models by modifying the empirical coefficients and exponents for carbonate lithologies, thereby ensuring a more precise characterization of these complex reservoirs.
5.4. Transition from T1 to T2 Dominance
It is worth noting that Timur’s original permeability equation was developed using T1 distributions. During the late 1960s, T1 was the preferred parameter because the hardware requirements for stable T2 acquisition via the CPMG [101,102] pulse sequence had not yet been widely standardized for field applications. T1 measurements were considered more straightforward to acquire with the instrumentation of that era.
Following the foundational work of Timur [69], T2 became a dominant metric due to its significantly faster acquisition, higher signal-to-noise ratio, and better correlation with PSDs in fluid-saturated media [103]. Modern NMR wireline logs and benchtop systems now almost exclusively emphasize T2, employing the CPMG sequence to improve efficiency and resolution. Consequently, contemporary applications of the Timur-Coates model utilize T2-based FFI and BVI, though the underlying physical concept remains rooted in the original T1 theory.
5.5. Comparative Strengths of SDR and Timur-Coates Models
The SDR equation relates the geometric mean of T2 and fractional porosity to permeability [104]. By using a logarithmic mean, the model effectively averages the contributions of various pore sizes, thereby mitigating the disproportionate influence of a few large macropores on the total permeability estimate [105]. In contrast, the Timur-Coates model relies primarily on the ratio of movable to bound fluids, assuming that permeability is dictated by well-connected macropores and explicitly accounting for the influence of "movable" porosity. Both models offer several distinct advantages:
- (i)
- Efficiency: They require input from only a single NMR measurement.
- (ii)
- Integration: They combine volumetric porosity with pore structure information.
- (iii)
- Versatility: They provide a rapid, dependable, and easy-to-apply framework for permeability assessment across diverse geological studies [12].
The following schematic (Figure 10) summarizes the major milestones in the development of these two foundational equations:
5.6. Physical Assumptions and Limitations
Despite their historical importance and proven utility, these classical equations rest upon a set of simplifying physical assumptions:
- Fast-Diffusion Regime: The assumption that spins sample the entire pore volume before relaxing.
- Constant ρ: The premise that ρ is independent of lithology and mineralogy.
- Idealized Pore Geometry: A simplified model that directly links T2 to pore size and connectivity.
While these assumptions are generally valid for clean sandstones, they are frequently violated in carbonate rocks. Carbonates are characterized by extreme pore heterogeneity, significant microporosity, surface roughness, and the presence of paramagnetic minerals. Under such conditions, T2 reflects a competition between multiple mechanisms rather than pore geometry alone. This limits the universality of classical permeability correlations and necessitates a more careful interpretation when analyzing complex lithologies.
To facilitate comparison between the various NMR-based permeability models discussed in this review, Table 4 summarizes their underlying physical principles, key assumptions, advantages, limitations, and recommended reservoir applications. Although the Timur-Coates and SDR equations remain the most widely used approaches in both laboratory and logging environments, their applicability depends strongly on lithology and pore-system complexity. Classical models generally perform well in relatively homogeneous sandstones, where the assumptions about pore geometry and surface relaxivity are approximately satisfied. However, their predictive capability decreases in heterogeneous carbonate reservoirs characterized by vugs, fractures, microporosity, and variable mineralogy. More recent approaches, including diffusion-aware and pore-network-based models, have been developed to address these limitations by incorporating pore connectivity, restricted diffusion, and complex pore architectures. The comparison highlights that no single model is universally applicable, and model selection should be guided by reservoir characteristics, data availability, and the underlying physical assumptions of each approach.
Overall, the evolution from classical relaxation-based correlations toward diffusion-aware and pore-network-informed approaches reflects the increasing need to characterize complex reservoir systems that deviate from the assumptions underlying traditional NMR permeability equations. Such developments are particularly important for carbonates, tight sandstones, and unconventional reservoirs, where pore connectivity and multiscale heterogeneity exert a stronger influence on permeability than pore size alone.
6. From Classical Relaxation Models to Modern LF-NMR Practice: The Shift Toward Multidimensional Analysis
Over the past 15 years, low-field NMR core analysis has evolved into a multi-faceted methodological approach. This evolution is characterized by several key advancements: the refinement of T2-based interpretation schemes, the widespread adoption of multidimensional correlation experiments such as T1–T2 and D–T2 mapping, the increased use of frequency- and echo-time-dependent measurements, and the systematic integration of LF-NMR with complementary petrophysical and geochemical methods [106,107,108]. Collectively, these developments have substantially expanded the utility of LF-NMR, particularly in characterizing unconventional reservoirs and mineralogically complex formations where traditional 1D methods often fail.
6.1. The Persistence of Classical Frameworks
Despite these methodological advancements, the interpretative framework adopted in many applied LF-NMR studies [109,110,111] remains implicitly rooted in classical relaxation models originally developed for clean sandstones with relatively simple, granular pore geometries. While the limitations of these models are well recognized at the methodological level, they are not always explicitly accounted for when interpreting data from clay-rich or tight sandstones and heterogeneous carbonates.
In these complex systems, transverse relaxation is seldom governed by a single mechanism. Instead, it is the product of multiple competing factors, including:
- Enhanced surface relaxation on clay minerals.
- Diffusion-induced dephasing within high internal magnetic field gradients.
- The presence of paramagnetic impurities (e.g., iron-bearing minerals).
- Signal contributions from structural hydroxyl groups and solid-like organic matter.
Consequently, the traditional direct association between T2 distributions and pore size or hydraulic properties becomes increasingly ambiguous, often requiring a more nuanced physical interpretation.
6.2. Diffusion-Aware Relaxation Frameworks
In modern diffusion–relaxation experiments, the diffusion coefficient (D) has evolved from an auxiliary contrast parameter into a direct probe of molecular mobility and pore-scale restrictions. In heterogeneous micro- and nanoporous systems, fluid diffusion becomes inherently time- and scale-dependent, and its contribution to T2 can no longer be neglected. Under such conditions, the classical fast-diffusion assumption, in which the sole dominance of surface relaxation often breaks down, leads to systematic ambiguities in T₂-based interpretations unless diffusion effects are explicitly accounted for. Recognizing that diffusion-induced relaxation can no longer be treated as negligible, the field has moved toward diffusion-aware relaxation frameworks [19]. These modern models explicitly decouple the effects of ρ from diffusion-driven dephasing, allowing for a more accurate assessment of pore-scale architecture and fluid saturation in unconventional and heterogeneous media.
6.3. The Effective Diffusion Cubic (EDC) Model and Pore-Scale Physics
A prominent advancement in this area is the EDC approach. In this framework, transverse relaxation is treated as a coupled process governed by pore-size-dependent diffusion, surface interactions, and internal magnetic field gradients rather than by surface relaxation alone. Unlike conventional models that assume constant diffusion and surface-dominated relaxation, EDC explicitly accounts for restricted molecular motion in micro- and nanoporous systems.
As demonstrated in recent studies, the EDC approach yields pore-size distributions (PSDs) that are more consistent with independent reference methods, such as MICP and low-temperature nitrogen adsorption (LTNA). This is particularly evident in heterogeneous carbonate rocks, where susceptibility-induced gradients and diffusion constraints are first-order controls on the signal [112]. Importantly, such diffusion-aware frameworks do not replace classical relaxation models; instead delineate their domain of applicability, identifying precisely when diffusion effects must be explicitly modeled to avoid systematic bias in pore-size interpretation.
Importantly, the relative contribution of diffusion to the observed transverse relaxation is not fixed but depends on the experimental conditions under which the measurement is performed. Echo spacing, diffusion time, internal magnetic field gradients arising from magnetic susceptibility contrasts, and the characteristic dimensions of the pore network jointly determine whether relaxation remains predominantly surface-controlled or becomes increasingly diffusion-sensitive. Consequently, identical lithologies measured under different acquisition protocols may exhibit different apparent T2 distributions, whereas similar T2 values obtained from different rocks do not necessarily imply similar pore sizes or pore geometries.
These considerations illustrate that modern LF-NMR interpretation depends not only on the physical relaxation mechanisms but also on the experimental protocol used to sample them, motivating continued development of acquisition strategies capable of recovering increasingly fast-relaxing signal components.
Accordingly, discrepancies between measured and predicted pore-size distributions may originate from fundamentally different sources, including physically meaningful diffusion effects, protocol-dependent systematic bias (e.g., echo spacing and dead time), inversion artifacts associated with ILT regularization, and measurement noise. Distinguishing among these contributions is therefore essential for reliable interpretation of LF-NMR data.
6.4. Multidimensional NMR: T1–T2 and D–T2 Mapping
Multidimensional NMR measurements [113] were introduced primarily to mitigate intrinsic signal overlap observed in 1D T1 or T2 distributions, where different proton populations–such as clay-bound water vs light oil–may exhibit similar relaxation responses.
Although diffusion-weighted imaging (DWI) and diffusion tensor imaging (DTI) have become powerful tools for characterizing anisotropic transport in biological tissues and other porous materials, their application to laboratory low-field NMR core analysis remains comparatively limited. Accordingly, the present review focuses primarily on D–T2 methodologies, multidimensional relaxometry, and hybrid pulse sequences that currently constitute the principal experimental approaches for routine rock core characterization.
In laboratory practice, T1–T2 maps are commonly acquired using inversion-recovery CPMG (IR-CPMG) or saturation-recovery CPMG (SR-CPMG) sequences [114]. Meanwhile, diffusion-relaxation correlations utilize D–T2 experiments to encode translational motion alongside T2 decay. By incorporating diffusion- or longitudinal-relaxation contrast dimensions, these approaches significantly improve the discrimination between:
- Bulk vs mineral-bound water.
- Hydrocarbon vs aqueous phases.
- Fluid-filled porosity vs solid-like organic matter or structural hydroxyl groups [18].
6.5. Challenges in Quantitative Inversion: The Ill-Posed Nature of ILT
The interpretation of multidimensional datasets relies almost exclusively on the ILT to recover joint relaxation or diffusion-relaxation distributions from experimentally measured signal decays. However, the ILT remains fundamentally ill-posed. In two dimensions, the resulting maps are highly sensitive to
- 1)
- SNR: Lower SNR can lead to ghost peaks or smoothed distributions.
- 2)
- Acquisition parameters: Echo spacing and recovery times directly influence the map’s resolution.
- 3)
- Regularization strategy [115]: The choice of smoothing parameters can artificially merge or split distinct fluid populations.
In D-T2 experiments, further uncertainty arises from internal magnetic field gradients and pore-scale restrictions, which can complicate the decoupling of true diffusion from relaxation-induced attenuation. Multidimensional LF-NMR experiments were conducted on carbonates [116], high-porosity-and-permeability sandstone reservoirs [117], and tight sandstone [118,119]. Consequently, while T1–T2 and D–T2 maps provide excellent qualitative contrast for fluid typing, their quantitative interpretation in clay-rich sandstones and heterogeneous carbonates remains non-unique and heavily dependent on the processing protocol. This non-uniqueness is an inherent limitation of the experimentally accessible signal and the mathematical inversion process itself. Table 5 summarizes applications of multidimensional LF-NMR on sandstones and carbonates.
While multidimensional methods were initially developed to address ambiguities in sandstone reservoirs, recent studies demonstrate even greater benefits in carbonate systems, where pore-size heterogeneity, vuggy porosity, and fracture networks violate many assumptions of classical relaxation models.
6.6. Short-TE Strategies and the Fast-Relaxation Challenge
A substantial fraction of proton populations in clay-rich sandstones and heterogeneous carbonates exhibits very fast transverse relaxation. These relaxation times are often comparable to, or even shorter than, the instrumental dead time in conventional CPMG measurements. While minimizing echo spacing (TE) can partially mitigate diffusion-induced attenuation in the presence of internal magnetic field gradients, the primary motivation for short-TE strategies is to preserve signal from fast-relaxing components, including clay-bound water, hydroxyl groups, and solid-like organic matter. These include:
- Clay-bound water and structural hydroxyl groups.
- Solid-like organic matter (kerogen and bitumen).
- Protons confined within nano- and intra-crystalline pores.
Once the echo spacing exceeds the relaxation time of these components, the signal is irreversibly lost, rendering even the most sophisticated inversion algorithms incapable of recovering the missing data [120].
6.7. Hybrid Acquisition: Integrating FID with CPMG
To overcome the "blind spot" of CPMG, recent research has pivoted toward hybrid acquisition strategies that combine FID measurements with the standard CPMG pulse sequence. While CPMG is essential for characterizing longer-lived, liquid-like populations, the FID captures the initial, high-frequency components of the signal that decay before the first echo. Fleury et al. [106] employed IR–CPMG sequences to construct T1–T2 maps of clay-bearing systems, while using separate FID measurements to constrain the total signal amplitude of these fast-relaxing components. Building on this, Yang et al. [121] demonstrated a "signal splicing" technique for shale samples. By merging FID and CPMG data [122] and applying a combined Gaussian-exponential inversion, they successfully differentiated between fluid and solid phases. Notably, their results showed that the Gaussian component of the T2 distribution remained stable despite changes in moisture content, confirming its assignment to solid-phase organic matter rather than pore fluids.
6.8. Non-Exponential Inversion and Calibration Risks
Recent advancements have further extended these approaches by applying non-exponential inversion strategies directly to full FID signals. For example, Guo et al. [123] introduced a T1–T2 framework in which transverse relaxation is derived entirely from the FID rather than from CPMG, enabling fast-relaxing solid-like components to be explicitly resolved.
However, the calibration of these models often relies on controlled drying and desiccation procedures to monitor water adsorption and desorption. While such protocols enable component assignment, they may also alter the original fluid-solid equilibrium by removing light hydrocarbons or loosely bound fractions, thereby compromising the reliability of calibrations when the objective is to quantify extractable organic matter under reservoir-relevant conditions. This highlights the need for "non-destructive" calibration standards that better preserve the rock core's native state.
6.9. Hybrid Sequences and Signal Partitioning
Liu et al. [124] advanced the field by introducing a protocol based on Solid-Echo (SE)–CPMG measurements. This approach utilizes separate Gaussian and exponential inversions, followed by signal splicing to distinguish liquid-like and solid-like proton populations. By subjecting samples to controlled drying and subsequent re-saturation with different fluids, the authors demonstrated that NMR is highly sensitive to pore-fluid type and distribution.
Importantly, this work also illustrated that the signal partitioning is heavily dependent on the sample’s preparation history. The importance of well-documented sample preparation and of consistent acquisition and inversion protocols for achieving comparable, reproducible NMR core measurements has been emphasized in a recent methodological report [22].
6.10. Beyond CPMG: The Pulse Sequence Diversification
To overcome the inherent limitations of conventional CPMG-based acquisition, a wider range of pulse sequences has been explored in recent years. In addition to the already mentioned FID and SE [125], these include:
Collectively, these approaches aim to improve sensitivity to fast-relaxing components and to extend multidimensional T1–T2 and D-T2 analyses beyond the constraints imposed by echo-based measurements. However, despite their demonstrated methodological advantages, industrial adoption remains limited. This is largely due to increased experimental complexity, extreme sensitivity to acquisition parameters, and the lack of standardization in interpretation frameworks.
6.11. The Shift to Higher Resonance Frequencies: The SNR vs. Gradient Trade-off
In parallel with the diversification of pulse sequences, a major methodological shift over the past decade has been toward laboratory NMR measurements at higher resonance frequencies. Historically, laboratory-based NMR core analysis has been dominated by instruments operating at approximately 2 MHz [130], primarily to maintain consistency with NMR well-logging tools and to minimize the impact of internal magnetic field gradients arising from magnetic susceptibility contrasts between minerals and fluids [131].
While this choice of a 2 MHz magnet is well justified for conventional sandstones, it limits the SNR and detectability of fast-relaxing proton populations. The introduction of laboratory NMR analyzers operating at 12–23 MHz has substantially improved SNR and reduced instrumental dead time compared to conventional 2 MHz systems. Comparative studies across this frequency range, including systematic T2 measurements by Anger et al. [132] and Min et al. [133] as well as sequence-based comparisons by Siletta et al. [134] using SR–FID–CPMG and SR–FID–ECHO-CPMG protocols, consistently demonstrated that T2 relaxation times remain broadly field-independent while the detectability of fast-relaxing and solid-associated proton populations is significantly enhanced at higher frequencies. These gains arise primarily from:
- Improved SNR: Higher frequencies provide a stronger initial magnetization.
- Reduced Dead Time: Faster electronics in these systems allow for earlier signal capture.
At the same time, operation at 20–23 MHz introduces a significant challenge: increased sensitivity to internal magnetic field gradients (Gint). This creates a fundamental trade-off: while higher frequencies provide better access to short-T2 components, they also exacerbate diffusion- and gradient-related relaxation and susceptibility-induced artifacts. These factors have direct implications for the definition and transferability of T2 cutoffs, as a cutoff established at 2 MHz may not be directly applicable to data acquired at 20 MHz.
6.12. The T2 cutoff: A Conditional Partitioning Parameter
The T2 cutoff is a fundamental parameter used to partition NMR relaxation spectra into bound and free fluid components. Traditionally, the industry has relied on default values of approximately 33 ms for sandstones and 90–100 ms for carbonates [135]. Physically, the cutoff represents a threshold: transverse relaxation times below this value are attributed to fluids restricted by intense surface interactions (BVI), while signals above it are assumed to originate from more freely mobile pore fluids (FFI).
However, determining a physically meaningful T2 cutoff is rarely straightforward. In practice, measured relaxation rates are a convolution of ρ, complex pore geometry, and fluid-solid interactions. Furthermore, the result is highly sensitive to experimental factors [136,137] such as:
- TE: Influences the capture of fast-relaxing components.
- SNR and Inversion Regularization: Affects the sharpness and position of peaks in the distribution.
- Operator Subjectivity: Choice of processing protocols can shift the interpreted cutoff.
6.13. Deviations in Complex Lithologies
The limitations of ‘default’ cutoff values become particularly evident in rocks with complex pore systems, such as tight sandstones, clay-rich formations, and heterogeneous carbonates. In these systems, several factors drive reservoir-to-reservoir variability:
- Clay Fabric and Mineralogy: Variations in clay type affect wettability and the specific volume of adsorbed water.
- Paramagnetic Impurities: Elements like Fe3+, often associated with pyrite or dispersed within organic matter, create localized magnetic field gradients. These modify relaxation pathways without necessarily reflecting a change in physical pore size [19].
6.14. Modern Extensions: Beyond the Single Cutoff
To address this ambiguity of a single threshold, several advanced interpretation schemes have emerged:
- 3.
- 4.
- Data-driven Approaches: Utilizing multi-TE experiments and statistical or multifractal analysis of T2 distributions to identify natural break points in the data.
- 5.
While these methods can improve internal consistency and correlation with laboratory reference data, they ultimately reinforce a critical conclusion: T2 cutoff values are not universal constants. Instead, they are conditional parameters whose validity depends critically on the lithology, saturation state, and measurement protocol employed.
6.15. Pulse Sequences for LF-MRI
To capture the complex internal structures and rapid relaxation times inherent in geological media, specialized NMR pulse sequences are employed:
- Spin-echo (SpE): A foundational sequence primarily used for basic visualization of fluid distribution.
- Zero Echo Time (ZTE): This sequence is essential for "tight" geological samples with extremely short relaxation times. By employing a very small flip angle and ramping gradients, ZTE encodes spatial data with nearly zero delay, capturing signals that decay before traditional echoes can form [92].
- Rapid Acquisition with Relaxation Enhancement (RARE): A fast-imaging method used for pseudo-3D qualitative mapping. It is particularly effective at identifying millimeter-scale heterogeneities, such as fossils, fracture networks, or vugs [10].
6.16. Visualizing Multiphase Displacement and CCUS
LF-MRI is exceptionally effective for the real-time visual analysis of multiphase displacement processes. This includes injecting sc fluids into saline aquifers for CCUS or oil recovery via water flooding [10,89,91]. It allows researchers to track migration fronts in real-time, identifying whether they advance in a stable "piston-like" manner or exhibit "fingering" behavior due to rock heterogeneity. For instance, in CCUS studies, LF-MRI illustrates how scCO2 gradually occupies macropores, displacing water and altering signal intensity in real time (Figure 11).
These MRI images show how scCO2 displaces deionized water in packed glass beads [142]. These images reveal dominant channels through which CO2 initially displaces the edge water of the rock sample and, with increasing CO2 content, preferentially passes through the center of the rock sample, providing a clear visualization of the fingering phenomenon.
6.17. Applications in EOR
LF-MRI is equally vital for studying EOR and other fluid transport mechanisms. Advanced post-processing visualization techniques, including signal subtraction and false-color mapping (where blue indicates low water content and red indicates high saturation), enable the precise identification of areas in the core that are difficult to reach during flooding, as shown in Figure 12 [88,89,93]. Furthermore, specialized techniques like signal subtraction—highlighted in Figure 12 [93]— allow precise mapping of "produced oil" by subtracting images taken at different stages of the displacement process, revealing exactly where oil remains trapped in "dead zones".
Another example, as shown in Figure 13 [89], MRI images can clearly distinguish between regions of high water saturation (warm colors) and areas where scCO2 has successfully occupied macropores (dark regions) [89]. These capabilities enable researchers to evaluate the efficacy of EOR agents, such as polymers and surfactants, by observing their impact on the swept volume of the reservoir [10,93], and carbon storage efficiency and security, as they reveal how effectively they are trapped within the pore network [89].
6.18. Multimodal Integration: Reducing Interpretative Ambiguity
Given the non-uniqueness of T2-based interpretations, particularly in tight sandstones and complex heterogeneous carbonates, researchers are increasingly integrating LF-NMR with complementary pore-structure and mineralogical characterization techniques. This multimodal approach acts as a series of independent constraints that reduce interpretative ambiguity. Key complementary techniques include:
- MICP: Primarily used to constrain pore-throat size distributions and connectivity. While NMR measures the pore body, MICP provides the critical link to the hydraulic pathways (throats) that govern permeability.
MICP and LTNA provide independent estimates of specific surface area and PSDs in the sub-50 nm range, which directly overlap with pore scales at which transverse relaxation is strongly affected by surface interactions, restricted diffusion, and deviations from the fast-diffusion regime.
6.19. Synthesis and Cross-Validation
Although these techniques probe different aspects of the rock system and operate over partially overlapping spatial scales, their combined use has proven valuable for constraining NMR interpretations, assessing the physical meaning of T2 cutoff values, and identifying regimes where classical relaxation assumptions break down, thereby serving as independent constraints that reduce interpretative ambiguity.
Table 6 summarizes the complementary role of MICP, LTNA, XRD, and micro-CT in constraining LF-NMR interpretation and highlights that none of these techniques provides a direct one-to-one mapping to relaxation times. Therefore, by combining these independent reference methods, petrophysicists can more accurately assess the physical validity of T2 cutoff values and identify the regimes in which classical assumptions are reliable. Ultimately, this integrated framework transforms NMR from a purely empirical tool into a robust, physically constrained method for characterizing complex reservoir rocks.
Taken together, these developments indicate that progress in LF-NMR core analysis over the past decade has been driven primarily by improved access to fast-relaxing signal components, more explicit treatment of diffusion-related effects, and tighter integration with complementary characterization methods. For complex lithologies, the reliability of NMR-derived petrophysical parameters therefore depends less on any single experimental advance than on transparent protocols, critical assessment of model assumptions, and cross-constrained interpretation.
7. Case Studies on Sandstone
This section examines specific laboratory applications where advanced NMR techniques have resolved complex challenges in sandstone characterization, ranging from internal heterogeneity to anomalous mineral effects and fluid mobility.
7.1. Resolving Heterogeneity via T1 "Double-Shot" Sequences
Mitchell [70] investigated sandstone heterogeneity by prioritizing T1 relaxation measurements over the more common T2 approach. To overcome the traditional disadvantage of long acquisition times associated with longitudinal relaxation, the study developed and validated a modified “double-shot” pulse sequence for T1 measurements. This technique provides a magnetically independent method for measuring surface relaxation, eliminating the associated downside of long acquisition times and significantly expanding the range of magnetic field strengths applicable to core analysis.
As illustrated in Figure 14, T1 distributions were utilized to quantify heterogeneity at both microscopic and macroscopic scales across three sandstone varieties (Bentheimer, Berea, and Birchover). By developing an inverse correlation between T1 and the apparent solid/liquid magnetic susceptibility contrast, Mitchell [70] successfully distinguished local compositional variations. Furthermore, log-mean T1 profiles were generated to map macroscopic heterogeneity, proving that the T1 response is a robust indicator of rock fabric when acquisition speed is optimized.
7.2. Mineral Coatings and Anomalous Porosity
Jácomo et al. [152] employed NMR techniques to investigate sandstones exhibiting unusual porosity and to clarify inconsistencies between pore-size estimates from NMR and those from traditional petrophysical methods. To provide a comprehensive mineralogical context, the study integrated NMR with X-ray microcomputed tomography, thin section analysis, SEM, magnetic susceptibility measurements, hysteresis testing, and isothermal remanent magnetization (the magnetization remaining in a material after removal of an external magnetic field). Note that isothermal remanent magnetization is the magnetization acquired by a material when exposed to a magnetic field at a constant temperature, and it is often used in geophysics and rock magnetism to study mineral properties [153]. Their study focused on four abnormally porous sandstones with distinct mineral coatings: Água Grande, Fontainebleau, Uerê, and the Juruá Formation. The results revealed that mineral coatings significantly shift T2 signals towards shorter relaxation times, an effect highly correlated with anomalous porosity. Crucially, the study demonstrated that each mineral coating, such as iron oxides or clays, operates through a distinct mechanism to accelerate relaxation, highlighting the necessity of mineralogical correlation for T2-based pore-size estimation.
7.3. Fluid Seepage in Tight Sandstone Reservoirs
Yang et al. [154] combined MICP and NMR techniques to characterize the fluid seepage mechanism in tight sandstone reservoirs from the Central Sichuan Basin (Xujiahe formation). By combining core-flooding experiments with T2 distribution analysis, the researchers determined the critical displacement pressures required to mobilize fluid saturations. A significant amount of variance in movable fluid saturation was observed among the core samples, ranging from 23% to 89%. Notably, T2 cutoff values exhibited high variability and showed no clear correlation with either porosity or permeability, reinforcing the view that cutoffs are formation-specific. By converting NMR distributions to pore-throat-size equivalents, the study concluded that pores larger than 0.1 μm are the primary contributors to movable-fluid saturation in these tight systems. This finding provides a quantitative basis for identifying "effective" versus "bypass" porosity in low-permeability reservoirs.
7.4. Re-evaluating the T2 Cutoff in Tight Formations
As highlighted by the work of Yang et al. [154], the interpretation of the T2 cutoff requires critical scrutiny. The T2 cutoff value serves as the primary boundary for partitioning movable and irreducible fluid saturations, which is essential for assessing permeability and reservoir quality [154,155]. Conventionally, values above the cutoff threshold indicate large micropores capable of production, whereas values below it indicate small micropores where fluids are immobilized by capillary forces not capable of production. Therefore, the T2 cutoff value is a parameter for distinguishing irreducible and movable fluids in porous rock and a crucial factor in predicting permeability from T2 distribution [139]. While standard industry values - 33 ms for high- and medium-permeability sandstone reservoirs [156] and 90-92 ms for carbonate reservoirs [157]- remain widely used [135], they have increasingly proven unsuitable for complex reservoirs. The T2 cutoff value varies across areas or samples [60,158]. In tight sandstones, the T2 cutoff is often widely distributed and varies significantly among samples, leading to a weak correlation among porosity, permeability, and movable fluid saturation. Relying on fixed "default" cutoffs in these systems can lead to significant errors [159] in formation evaluation, underscoring that the T2 cutoff is a conditional parameter rather than a reservoir constant. In other words, there is no direct correlation between the quality of reservoir physical properties and T2 cutoff value [154].
7.5. Multimodal Pore Characterization in the Ordos Basin
Li et al. [160] conducted an extensive study on tight sandstones from the Yanchang Formation (Ordos Basin) to develop accurate permeability models. Nine samples were collected from the Yanchang Formation, Upper Triassic, Ordos Basin, China. By integrating NMR T2 distributions with casting, thin-sectioning, laser-scanning confocal microscopy, SEM, and pressure-controlled porosimetry (PCP), the authors identified three distinct T2 intervals:
- 6.
- Micropores: Fast relaxation associated with clay-bound and capillary-bound water.
- 7.
- Mesopores: Intermediate relaxation representing the primary storage matrix.
- 8.
- Macropores/Fractures: Longer relaxation times associated with high-transmissibility pathways.
The authors concluded that NMR-derived pore radius distributions aligned well with PCP data. Utilizing this high-resolution data, the authors developed a specialized permeability model for tight sandstones that significantly outperforms traditional models calibrated for conventional sandstones.
7.6. Sandstone vs. Carbonate: The Challenge of Pore Coupling
Wang et al. [161] provided a comparative petrographical and petrophysical description of both Weber sandstone and Madison limestone obtained from the Rock Spring Uplift, Southwestern Wyoming, to evaluate the area's viability for carbon dioxide sequestration. The study revealed fundamental differences in how these two lithologies respond to NMR:
- Weber Sandstone: Exhibited a clear bimodal T2 distribution that directly corresponded to the physical pore-size distribution, allowing for straightforward characterization.
- Madison Limestone: Produced highly complex T2 distributions that did not map directly to pore size. This discrepancy was attributed to diffusive pore coupling, in which molecules move between pores of different sizes during the measurement, blurring the relaxation boundaries.
This comparison highlighted the difficulty of determining ρ in carbonates compared to sandstones. Furthermore, the researchers observed that ρ varied among all samples, indicating spatial heterogeneity. These complexities made permeability estimation via the SDR model far more challenging for the Madison Limestone, reinforcing the need for lithology-specific calibrations in carbon storage and recovery projects. The studies summarized in Table 7 demonstrate the evolution of LF-NMR from conventional relaxation analysis toward integrated petrophysical characterization of sandstone reservoirs. Rather than focusing solely on permeability estimation, recent work has addressed heterogeneity, mineralogical effects, pore connectivity, quantification of movable fluid, and lithology-specific calibration, highlighting the need for reservoir-dependent interpretation strategies.
8. Case Studies on Carbonates
Carbonate reservoirs present unique challenges due to their extreme multiscale heterogeneity. These case studies highlight how researchers use peak analysis, machine learning, and geometric modeling to decode complex pore architectures.
8.1. Peak Distribution and Reservoir Quality
A foundational study by Ge et al. [30] analyzed over 135 carbonate rock core samples, categorizing T2 distributions into four distinct types based on peak frequency. By integrating NMR T2 distributions with core photography, thin sections analysis, and SEM, the study demonstrated a direct link between the number of T2 peaks and the reservoir’s liquid production capacity (Figure 15):
- Unimodal (Single Peak): Primarily reflects isolated micro-fractures or dense matrix systems with minimal production potential.
- Bimodal (Double Peak): Typically exhibits a peak between 2 and 60 ms, indicating weak production capacity due to limited porosity and permeability.
- Trimodal (Triple Peak): The main peak falls between 2 and 300 ms, representing a combination of matrix pores and dissolution vugs. This type generally offers medium production capacity.
- Quadrimodal (Four Peaks): Arises from a complex network of matrix pores, dissolution vugs, and micro-fractures. These reservoirs possess high porosity and permeability, yielding the highest production potential.
This classification system underscores that the complexity of the NMR signal directly reflects the diverse pore spaces within carbonate reservoirs.
8.2. Machine Learning for Permeability Categorization
Da Silva et al. [162] addressed the limitations of classical models by using 1H LF-NMR data to categorize carbonate permeability into a relative index rather than a continuous value. Analyzing 78 rock samples from six carbonate reservoirs, the authors classified permeability into four tiers: low (lower than 1 mD), fair (1-10 mD), good (10-100 mD), and outstanding (higher than 100 mD).
By employing machine learning algorithms—specifically Random Forest and Sequential Minimal Optimization (SMO)–the study achieved accuracy rates significantly higher than traditional models. Specifically, the machine learning approach [162] outperformed the Timur-Coates model by 28% and the SDR model by 24%. The authors argued that classical models fail because they condense complex distributions into a single variable T2lm or FFI/BVI), effectively ignoring the critical correlation between specific T2 bins and the pore throats that control fluid flow.
8.3. The Sphere-Cylinder Model for Pore Connectivity
While NMR T2 distributions provide insights into pore geometry, they are inherently insensitive to pore connectivity. To bridge this gap, Wang et al. [163] presented a hybrid pore model that combines spherical and cylindrical pores, based on the pore network and Sphere-Cylinder models (Figure 16). In this framework, the T2 distribution is partitioned based on the following physical assumptions:
- Spherical Pores: Represent the primary storage volume (porosity) but contribute little to flow.
- Cylindrical Pores: Represent the "throats" or conduits that govern the connectivity and permeability of the reservoir.
The study suggests that a higher fraction of cylinder pores is associated with superior connectivity and permeability. While qualitative results from eight core samples demonstrated the viability of this approach, the authors noted that further research is required to transform this geometric interpretation into a fully quantitative permeability model.
The assumptions of spherical pore geometry, isotropy, and homogeneous magnetic susceptibility distribution represent significant simplifications of natural reservoir rocks. Pore systems consist of a complex mixture of intergranular pores, slit-shaped clay pores, organic-matter-hosted nanopores, vugs, and fractures, all exhibiting highly irregular geometries and anisotropic connectivity. Mineralogical heterogeneity and the presence of paramagnetic phases can further influence NMR relaxation behavior. Nevertheless, simplified models such as the Sphere–Cylinder model remain valuable because they capture the essential functions of pore systems, where spherical pores primarily contribute to fluid storage and cylindrical pores represent flow pathways and connectivity. Although these idealized geometries do not fully reflect the complexity of real rocks, they provide a practical and interpretable framework for linking NMR relaxation data to petrophysical properties such as porosity and permeability, while reducing the complexity of the underlying inverse problem. Consequently, the model should be regarded as an effective representation of pore structure rather than an exact description of geological pore architecture.
8.4. Field-Specific Calibration of Empirical Models
Aghda et al. [57] conducted a comprehensive case study using 26 carbonate rock samples from a reservoir in southern Iran to improve the accuracy of NMR-derived petrophysical estimations, such as porosity and permeability. The research focused on recalibrating the fundamental constants C and A in the Timur-Coates and SDR equations, respectively. By rewriting the Timur-Coates equation as:
κ1/4 × C = φ × (FFI/BVI)1/2, the researchers plotted the movable-fluid term against the fourth root of permeability. The resulting linear fit (R2 = 0.93) yielded a calibrated C value of 0.281. Similarly, the SDR equation is linearized by plotting log(κ) versus log(T42ML×φ2). This approach yielded a calibrated A value of 0.0939 (R2 = 0.96). These results demonstrate that although the functional forms of the Timur-Coates and SDR models are robust, the empirical coefficients must be tailored to the reservoir's specific lithology to ensure predictive accuracy.
8.5. Multidimensional Analysis and Fluid Typing in West Kuwait
In a recent report, Ok et al. [11] employed LF-NMR techniques to characterize petrophysical properties and fluid content in carbonate rock core samples from West Kuwait, integrating T1 and T2 relaxation measurements to resolve fluid content and wettability. The study identified a high-permeability zone (4925 mD) at a depth of 11,775.2 feet, corresponding to sample-specific cementation (m) and saturation (n) exponents of 4.16 and 2.01, respectively.
A critical finding of this research was the utility of the T1/T2 ratio as a diagnostic tool for fluid typing and wettability:
- Hydrocarbon zones: Exhibited higher T1/T2 ratios, averaging 4.5.
- Bound water: Exhibited lower ratios, averaging 3.0.
These distinct ratios facilitated the precise identification of target pay intervals and the oil-water contact. Furthermore, the study reinforced the observation that porosity and permeability are often uncoupled in carbonates. Several samples exhibited exceptional permeability despite moderate porosity, a phenomenon the authors attributed to superior pore-throat connectivity and specific pore morphology. By integrating relaxation behavior with tailored equations, this work provides a framework for interpreting LF-NMR data in tight, heterogeneous carbonate formations where standard models often underestimate potential.
Table 8 summarizes recent developments addressing the unique complexity of carbonate reservoirs. Unlike sandstones, carbonate pore systems exhibit multiscale heterogeneity, vugs, fractures, and complex pore connectivity that frequently violate the assumptions of classical permeability models. Recent studies therefore emphasize machine learning, pore-network models, multidimensional NMR, and reservoir-specific calibration.
9. Challenges and Perspectives
The evolution of LF-NMR reservoir characterization has reached a critical juncture, with the focus shifting from 1D measurements to multidimensional integration and multiscale modeling [103,164,165]. Addressing current research gaps requires a transition from laboratory-scale observations to field-scale simulations and upscaling for energy production.
9.1. Advanced Signal Processing and Modeling
A primary challenge remains the accurate extraction of physically meaningful parameters from experimental signals. While multi-exponential fitting of CPMG data provides essential insights into producible crude oil—a vital metric for production decision-making [11]—conventional analysis is increasingly moving toward sophisticated ILT procedures. Standard methods such as CONTIN and Tikhonov regularization are routinely employed to recover relaxation time distributions. However, the reliability of these spectra is highly sensitive to the regularization parameters chosen. Future perspectives include developing more robust, automated inversion algorithms that minimize "ghost" peaks and better resolve overlapping signal components characteristic of unconventional reservoirs [166].
9.2. The Complexity of Surface Relaxivity (ρ)
The parameter ρ, which links T2 distributions to the PSD [167], remains a significant source of uncertainty. Currently, no single experimental approach can capture the entire porous matrix; for instance, gas adsorption and MICP probe different size ranges, leading to discrepancies in ρ calculation.
Furthermore, assuming a constant ρ is often misleading in heterogeneous rocks. Factors such as wide PSDs and the presence of paramagnetic minerals (e.g., iron-bearing clays or pyrite) necessitate a shift toward:
- Facies-specific ρ values: Assigning different relaxivity constants based on lithological classifications.
- Variable ρ modeling: Utilizing multiple regression or machine learning to derive spatially varying relaxivity.
Future research must focus on the spatial distribution of paramagnetic minerals in shale and coal to decouple mineralogical effects from physical pore-size signals.
9.3. The Necessity of Multidimensional (T1–T2) Mapping
As LF-NMR hardware advances, T1-T2 mapping is becoming a routine necessity rather than a specialized experiment. In unconventional reservoirs, 1D relaxation measurements are often ambiguous because a significant portion of the signal originates from organic solids (kerogen/bitumen) or structural hydroxyl groups (–OH) rather than confined pore fluids [168].
The primary advantage of T1–T2 mapping lies in the distinct signatures of solids and liquids:
- Liquids: T1 and T2 values are typically of the same order of magnitude.
- Organic Solids: T1 values are remarkably longer than their corresponding T2 values [169].
This contrast enables precise differentiation between bound and free fluids and quantification of pore-scale saturation. For example, using T1-T2 mapping, Liu et al. [170] identified four distinct proton populations in Bakken shale samples, effectively separating kerogen signals from those of mobile hydrocarbons.
9.4. Comprehensive Phase Classification: A Case Study from the Bohai Gulf
Integrating multiple experimental states is essential for validating these multidimensional maps. Yan et al. [171] demonstrated this by analyzing 35 core samples from the Cangdong depression of Bohai Gulf in China across five distinct states: water-saturated, post-centrifugation, oil-saturated, "fresh," and oven-dried.
By comparing 1D T2 distributions with two-dimensional (2D) T1–T2 maps across these states (Figure 17), the researchers established a robust classification framework for hydrogen-bearing phases. This systematic approach—matching specific NMR signatures to known saturation states—is a prerequisite for improving the accuracy of NMR logging data and enhancing our ability to evaluate "target pay" zones in complex, multi-phase unconventional systems.
9.5. Centroid-Based Analysis and Fluid Migration
Multidimensional mapping serves as a sophisticated diagnostic tool for assessing fluid distribution and migration. Li et al. [172] developed a centroid-based approach to evaluate T1–T2 maps across sandstone, shale, and coal. By identifying the geometric centroid of the NMR signal, researchers can correlate the signal position with the average pore size participating in the imbibition process.
Shifts in the centroid's location on the 2D map enable real-time monitoring of fluid transitions during imbibition between different pore types. Moreover, fluctuations in the T1/T2 ratios derived from 2D T1-T2 maps provide a sensitive metric for tracking state changes in confined water, offering insights into how wetting phases redistribute within the complex architecture of unconventional rocks.
9.6. Quantitative Viscosity Evaluation
In high-porosity, high-permeability reservoirs—such as the loose sandstones of the Huabei oilfield—2D NMR has proven essential for quantitatively evaluating crude oil viscosity. Zhang et al. [117] demonstrated this using 2D T₁–T₂ low-field NMR logging to quantitatively evaluate crude oil viscosity under these conditions. Both natural, loose sandstone cores with high permeability and porosity, and artificial rocks were fully saturated with crude oils of varying viscosities and saturation levels to systematically investigate fluid behavior under controlled conditions. The 2D T₁–T₂ spectra clearly revealed viscosity-dependent distributions of crude oil signals, enabling the separation and characterization of fluids with different rheological properties.
Because T₁ and T₂ peak positions of the oil components are intrinsically linked to molecular mobility, the authors developed an empirical viscosity model that successfully predicts fluid behavior under reservoir conditions. This relationship was further developed into a practical application for determining viscosity from 2D NMR data. Field validation in the BQ formation well group of the Huabei oilfield showed an average relative error of only 15% compared to laboratory measurements. This demonstrates that 2D T₁–T₂ NMR logging can act as a reliable, non-invasive alternative to traditional sampling for evaluating oil mobility in the field.
9.7. Wettability and Surface Affinity
The T1/T2 ratio is a critical indicator of the affinity between the mineral surfaces and the wetting pore fluid [173]. Generally, as T2 values shorten due to surface interactions, the T1/T2 ratio increases. This relationship has revealed complex wetting behaviors:
- Chalk: Exhibits a strong, uniform tendency toward water-wetting.
- Chlorite-rich Greensand: Displays pore-size-dependent wettability. In smaller pores, the T1/T2 ratio increases significantly at oil saturation (3.8 vs. 2.0 for water), suggesting a preferential interaction between hydrocarbons and chlorite-coated surfaces. In larger pores, however, the affinity remains strongly water-wet (T1/T2 ≈ 2.2).
Korb et al. [174] further demonstrated, using fast-field cyclotron NMR, that T₁–T₂ correlation maps can disentangle fluid populations and surface interactions in porous rocks and petroleum fluids. The 2D maps separate bulk water and crude oil signals without overlap, revealing distinct relaxation trends associated with surface-dominated versus bulk-like dynamics. In particular, the alignment of relaxation components with characteristic T₁–T₂ ratios enables identification of surface-controlled motion, confirming intermittent interactions among oil molecules, asphaltene nanoaggregates, and pore surfaces. The absence of exchange cross-peaks further indicates that oil and water reside in independent proton pools, allowing quantitative fluid discrimination. Overall, T₁–T₂ maps go beyond 1D relaxation analysis by simultaneously capturing wettability, confinement effects, and fluid identity, making them especially valuable for noninvasive characterization of complex rock–fluid systems.
9.8. Methodological Integration: Bridging the Gap
A significant modern challenge is integrating NMR data with independent characterization techniques to resolve inherent ambiguities [148,175,176].
9.8.1. Integrating MICP and NMR
While NMR measures pore bodies, MICP measures pore throats [176]. Combining these methods allows researchers to investigate "fractional misalignment" in PSDs. In systems where large pores are connected by narrow throats (the "ink-bottle" effect), MICP often overestimates the size of smaller pores. Integrating these datasets has improved the accuracy of permeability models, raising R2 values from 0.46 to 0.93 in certain sandstone studies.
9.8.2. Integrating SEM and Stress Analysis
Combining SEM with LF-NMR enables monitoring of rock damage under mechanical stress [175]. Research shows that as stress approaches 0.8 times the Uniaxial Compressive Strength (UCS), the rock microstructure transitions from isolated microcracks (< 5 μm) to interconnected crack clusters. NMR provides a non-destructive way to visualize this transition from disconnected "points" to fully linked pore networks.
It should also be recognized that discrepancies between LF-NMR-derived pore size distributions and MICP do not necessarily indicate deficiencies of NMR-based interpretation. In ultra-tight pore systems, MICP itself may underestimate inaccessible nanoporosity owing to pore-throat shielding, limited connectivity, and the extremely high intrusion pressures required for mercury penetration. Consequently, differences between the two methods reflect the limitations of both techniques rather than inaccuracies of either method alone.
9.8.3. Pc–T2 Correlation Spectroscopy
A significant advancement in characterizing the complex pore architecture of the Caspian Basin (Kazakhstan) was demonstrated by Zhao et al. [177]. The study established a mathematical link between the NMR T2 distribution and capillary pressure (Pc) curves using a piecewise power-function method. This approach integrated laboratory LF-NMR, MICP, and field-scale NMR logging data to bridge the gap between core analysis and wellbore evaluation. The T2 distributions in this carbonate reservoir typically exhibit a distinct bimodal character:
- Micropores (T2: 0.1–6 ms): These correspond to estimated pore-throat radii of 0.04–0.1 μm.
- Macropores (T2: 100–6000 ms): These correspond to significantly larger throat radii of 0.1–10 μm.
By mathematically transforming the T2 distribution into a pseudo-capillary pressure curve, the researchers enabled continuous, quantitative characterization of reservoir pore-structure parameters along the vertical well path. This transformation is particularly valuable for identifying hydraulic flow units and predicting water-saturation profiles in heterogeneous carbonate intervals where traditional discrete core sampling is insufficient.
9.9. Pc–T2 Correlation Spectroscopy and Multi-Method Integration
Song et al. [178] pioneered a correlation spectroscopy that bridges two distinct physical processes: NMR spin dynamics and capillary drainage. By generating a joint function of capillary pressure (Pc) and T2 relaxation, this correlation map reveals the physical connectivity between pore bodies (probed by NMR) and pore throats (probed by Pc), providing a high-resolution "plumbing map" of the porous system that was previously unattainable. Beyond these advanced correlations, the systematic integration of LF-NMR with established imaging and mineralogical techniques offers a more robust framework for reservoir evaluation:
- NMR + SEM imaging: Helps validate the physical significance of T2 cutoff values in T2 distribution curves [135], by providing direct visual evidence of the pore-scale features associated with specific relaxation peaks.
- NMR + MICP + XRD: Combining volumetric data with pore-throat distributions and quantitative mineralogy allows for a comprehensive assessment of porosity, pore-size distribution, and the impact of clay minerals on fluid mobility [179].
Based on these integrated methodologies, LF-NMR has proven to be a highly reliable and versatile tool. As a non-destructive technique, it offers the unique advantage of enabling subsequent tests on the same core samples, ensuring it will remain at the forefront of investigating reservoir quality across diverse sandstone and carbonate formations.
9.10. Structural Characterization via LF-MRI
While LF-NMR provides volumetric and kinetic data, LF-MRI offers essential spatial and structural context for rock core evaluation. Integrating LF-MRI with standard relaxometry enables a multidimensional assessment of reservoir quality that goes beyond simple numerical averages [180].
Beyond real-time fluid tracking, LF-MRI offers critical insights into the internal structural integrity and the distribution of various porosity types in complex reservoirs. It is particularly effective at:
- Distinguishing Porosity Generations: Adequately separating primary (depositional) from secondary (diagenetic) porosities, such as dissolution vugs or micro-fractures.
- Connectivity Mapping: Identifying the spatial arrangement of isolated versus connected pore networks, which is vital for predicting effective permeability.
- Visualizing Heterogeneity: Resolving subsurface features invisible to the naked eye, such as thin shale laminations, tight bands, or internal flow barriers that significantly impact sweep efficiency and displacement behavior (Figure 18).
By mapping these features in 2D or three-dimensional (3D), LF-MRI transforms the "black box" of the core sample into a transparent structural model, enabling more precise placement of perforation zones and better calibration of reservoir simulation models.
9.11. Enhancing Spatial Resolution: ZTE, Compressed Sensing, and Cluster Analysis
As shown in Figure 18 [10], LF-MRI is instrumental in identifying low-saturation zones and structural discontinuities that often lead to inaccuracies in traditional gravimetric measurements. In tight reservoirs or challenging geological formations, specialized pulse sequences such as ZTE MRI enable simultaneous resolution of pore systems and fractures, providing a more comprehensive understanding of transport mechanisms [92]. This dual-resolution capability provides a more comprehensive understanding of the transport mechanisms governing fluid flow in low-permeability media.
Beyond simple visualization, LF-MRI detects critical subsurface structural variations and internal barriers—such as shale bands or poorly saturated zones—that often go undetected in standard gravimetric measurements but significantly affect a sample's representativeness for field-scale modeling [10,181].
Advanced Data Acquisition and Analytics
Recent methodological advancements have significantly expanded the utility of LF-MRI:
- Compressed Sensing (CS): This technique enables the reconstruction of high-fidelity images from undersampled data. By significantly reducing acquisition times, CS facilitates the study of rapid dynamic processes, such as transient fluid migration or chemical reactions within the core [10].
As demonstrated in Figure 19, correlating morphological components with specific relaxation thresholds, LF-MRI provides a comprehensive, multidimensional understanding of how internal structural integrity impacts fluid transport in complex geological formations [10,92]. By analyzing the relationship between porosity and the number of connected clusters, petrophysicists can determine the rock’s percolation threshold. This integrated approach ensures that laboratory observations are rooted in the physical reality of the rock fabric, leading to more robust and predictive field-scale models.
10. Conclusions: Lessons Learned
The evolution of LF-NMR relaxometry has solidified its position as a cornerstone of laboratory-scale reservoir characterization. By providing non-destructive, high-resolution insights into the fluid-rock interface, LF-NMR bridges the gap between fundamental pore-scale physics and field-scale production strategy.
10.1. Hardware and Methodological Evolution
Recent advancements in NMR-compatible hardware—specifically, the development of high-temperature and high-pressure (HTHP) components—have expanded LF-NMR's capability to simulate in situ reservoir conditions. This, coupled with increasingly accessible environments for pulse-sequence development, has made NMR indispensable for determining [182,183]:
- Dynamic Properties: Relative permeability and capillary pressure.
- Surface Interactions: NMR-based wettability and surface relaxivity (ρ).
- Fluid Distribution: Precise mapping of oil, water, and gas phases within the pore architecture.
While traditional models like the Timur-Coates and SDR equations remain foundational, this review underscores that they are not "universal constants." Their application requires rigorous, formation-specific calibration to account for lithological heterogeneity and mineralogical interference.
10.2. The Challenge of Tight Sandstone Reservoirs
Characterizing tight sandstones remains a significant technical hurdle due to their complex, heterogeneous permeability structures and intricate fracture networks [184]. In these systems, structural anisotropy [185] complicates fluid-flow mechanisms, rendering standard 1D T2 distributions only indirect measures of the pore-size distribution (PSD) [186].
To address these limitations, several integrated strategies have proven essential:
- Pore-Type Classification: Essential for selecting optimal recovery methods and refining permeability models.
- Cross-Method Calibration: Correlating NMR results with MICP enables fine-tuning of T2 cutoff values and the creation of predictive models, significantly reducing the operational workload of traditional pressure-based experiments.
- Non-Linear Conversion: Applying non-linear scaling to convert T2 data into pore-throat size distributions allows researchers to identify the minimum throat radius required for crude oil mobility under varying pressure differentials.
Unlike conventional counterparts, NMR data from tight sandstones serve only as indirect measures of pore-size distribution. Hence, they must be coupled with other modeling or experimental approaches [76]. For example, correlating conventional MICP data with NMR results might serve this purpose, in which coefficients such as T2 cutoff values are fine-tuned to MICP data, establishing predictive models that reduce the time and workload required for MICP experiments [76,187]. The unpredictability of tight sandstone petrophysical properties necessitates the development of stochastic approaches. NMR data fitted to probabilistic distributions, such as Weibull and Gaussian, may provide a baseline for identifying tight-sandstone petrophysical properties [184]. The transverse magnetization relaxation time (T2) NMR relaxation distribution can also be converted into pore-throat size distributions using a nonlinear conversion approach, combined with high-pressure mercury intrusion, to determine the lower limit of the pore-throat size of movable crude oil under various pressure differences [188].
10.3. Carbonate Heterogeneity and ρ
In addition to various issues related to tight-sandstone characterization, there are other aspects of carbonate characterization using LF-NMR relaxometry. Determination of T2 cutoff, dividing the pore space into fully movable, partially movable, and strongly bound fractions [136,138], and whose values are not universal constants but conditional parameters, is crucial [12,157]. Therefore, the critical dependence of T2 cutoff values for carbonates on lithology, saturation state, and measurement protocol must be assessed carefully. Unlike sandstone, the ρ in carbonates can vary significantly with mineralogy (e.g., limestone vs. dolomite) and temperature, introducing substantial uncertainty when interpreting T2 distribution. To overcome such issues, rather than relying on the standard T2 cutoff, custom rock typing based on pore type is required for accurate bound/free fluid measurements. Moreover, merging ρ into NMR models might improve the accuracy of permeability approximations [189]. To achieve this goal, LF-NMR could be integrated with other methods, such as MICP and Brunauer-Emmett-Teller (BET) surface area analysis [81,83,189,190]. Our other suggestion is to use T1-T2 maps, which also yield the T1/T2 ratio and provide information not accessible from 1D NMR relaxation measurements, such as fluid affinity for a solid surface in confined geometry and the ability to differentiate the NMR relaxation behavior of different fluids (water vs. crude oil) [129,134,172,173,174]. The communities researching sandstone and carbonate should communicate more effectively to share their findings and overcome challenges together.
To summarize, while sandstones present structural challenges, carbonate characterization via LF-NMR must account for extreme chemical and mineralogical variability. A critical hurdle is determining the T2 cutoff, which partitions the pore space into fully movable, partially movable, and strongly bound fractions. Because these values are conditional parameters—not universal constants—they must be rigorously assessed, considering lithology, saturation state, and measurement protocols.
Unlike siliciclastic systems, ρ in carbonates varies significantly between mineralogies (e.g., limestone vs. dolomite) and is sensitive to temperature fluctuations. This variability introduces substantial uncertainty into the interpretation of T2 distributions. To mitigate this, we propose:
- Custom Rock Typing: Moving away from standard cutoffs toward pore-type classification for more accurate bound/free fluid quantification.
- Integrated Relaxivity Modeling: Merging ρ values derived from MICP and BET surface-area analyses into NMR models to enhance the accuracy of permeability approximations.
- Multidimensional T1–T2 Mapping: Utilizing T1/T2 ratios to differentiate fluid types (oil vs. water) and evaluate surface affinity in confined geometries, providing data inaccessible to 1D measurements.
10.4. Overcoming Instrumental and Interpretative Limits
Despite methodological advances, LF-NMR remains constrained by signal loss in ultrafast-relaxing components, low SNR, and overlapping relaxation responses. Overcoming these barriers requires a "synergy of expertise" between petroleum engineers and NMR specialists.
Despite significant progress, low-field NMR methods for rock characterization remain limited by signal loss, low signal-to-noise ratios, and overlapping relaxation responses, which complicate interpretation and restrict accurate pore and fluid analysis. Addressing these challenges requires stronger communication and collaboration between domain experts—particularly petroleum engineers and NMR specialists—to improve experimental design and data interpretation strategies. Future advances will rely on integrating multiple NMR approaches (e.g., low-field, high-field, solid-state, and imaging techniques), enabling more comprehensive, multiscale characterization of complex porous systems such as carbonates and shales [19].
The integration of imaging with other petrophysical tests enables multidimensional characterization of the rock-fluid system. For example, spatially resolved mapping provides data analogous to a well-log profile, showing fluid saturation and pore-size variations as a function of core height [10]. When combined with centrifugal experiments, LF-MRI facilitates the rapid determination of capillary pressure curves by observing fluid drainage from pores of different sizes along the core axis [10]. As technology evolves, advanced methods such as compressed sensing are being employed to accelerate image acquisition times, enabling the study of dynamic systems with higher temporal and spatial resolution [10]. By quantifying residual gas trapping and capillary trapping through -weighted imaging, LF MRI ensures that sequestered in deep saline aquifers remains safely stored within the pore network. For complex reservoirs, the synergy among laboratory-scale imaging, field-scale logging, and artificial intelligence models will be essential to accurately predict reservoir parameters and optimize the recovery of next-generation energy sources. As technology evolves, these non-invasive techniques will remain vital for optimizing the recovery of next-generation energy sources.
The future of the field lies in multi-scale NMR integration, combining:
- 9.
- Low-Field (LF): For bulk reservoir properties and fluid distribution.
- 10.
- High-Field & Solid-State: To resolve kerogen structures and mineral-fluid interfaces at the molecular level.
- 11.
- Imaging (MRI): To provide the spatial context needed to understand heterogeneity in carbonates and shales.
10.5. The Synergy of Imaging and Analytics
The integration of LF-MRI with conventional petrophysical tests enables a multidimensional view of the rock-fluid system. Spatially resolved mapping now provides data analogous to a well-log profile, capturing saturation and pore-size variations as a function of core height.
When paired with centrifugal experiments, LF-MRI facilitates the rapid determination of capillary pressure curves by observing fluid drainage along the core axis. Furthermore, advanced techniques, such as CS are accelerating acquisition times, enabling high-resolution studies of dynamic systems. For CCUS, T2-weighted imaging ensures that CO2 sequestered in deep saline aquifers remains effectively trapped within the pore network.
10.6. Future Directions: Stochastic Modeling and Artificial Intelligence (AI)
Given the inherent unpredictability of tight reservoir properties, there is a clear shift toward stochastic and probabilistic approaches. Fitting NMR relaxation data to distributions such as Weibull or Gaussian provides a more robust baseline for identifying petrophysical trends in high-variance formations.
Furthermore, the integration of AI and machine learning [191] offers a promising frontier for analyzing the massive datasets generated by multi-dimensional NMR and field logging. By correlating laboratory results with NMR well-logging tools through AI-driven inversion, the industry can move toward a more automated, high-fidelity interpretation of reservoir quality [188].
10.7. Outlook: The Next Decade of NMR
As we look toward the next decade, the transition to next-generation energy sources will require a deeper, more integrated understanding of rock core physics. The industry is moving toward a future where:
- NMR Logging is seamlessly integrated with reservoir-scale simulation data.
- In-situ wettability is characterized in real time using sophisticated fluid-typing algorithms.
- Artificial Intelligence acts as the primary tool for reconciling laboratory-scale imaging with field-scale logging.
For further exploration of these evolving topics, we recommend consulting the foundational reviews by Branco et al. [14] (on carbonate wettability), Elsayed et al. [20] (on oil and gas applications), Bravo and Zhang [21] (on surface relaxation behavior), and Guo et al. [19] (on the broader evolution of NMR core analysis). These non-invasive, non-destructive techniques will remain vital for optimizing hydrocarbon recovery and ensuring the security of global carbon storage initiatives.
Author Contributions
Conceptualization, S.O., H.AM., M.F., and T.K.M.; investigation, S.O., H.AM., M.F., and T.K.M.; resources, S.O., H.AM., M.F., and T.K.M.; data curation, S.O., H.AM., M.F., and T.K.M.; writing—original draft preparation, S.O., H.AM., M.F., and T.K.M.; writing—review and editing, S.O., H.AM., M.F., and T.K.M.; supervision, S.O.; project administration, S.O.; funding acquisition, S.O. All authors have read and agreed to the published version of the manuscript.
Funding
This research was funded by the Kuwait Institute for Scientific Research (KISR), grant number PP066K.
Acknowledgments
During the preparation of this manuscript/study, the author(s) used Grammarly for the purpose of English editing. The authors have reviewed and edited the output and take full responsibility for the content of this publication.
Conflicts of Interest
The authors declare no conflicts of interest.
Abbreviations
The following abbreviations are used in this manuscript:
| NMR | Nuclear Magnetic Resonance |
| MRI | Magnetic Resonance Imaging |
| LF | Low-field |
| SDR | Schlumberger-Doll Research |
| T1 | Longitudinal magnetization relaxation time |
| T2 | Transverse magnetization relaxation time |
| D | Diffusion |
| SEM | Scanning Electron Microscopy |
| MICP | Mercury Injection Capillary Pressure |
| FID | Free Induction Decay |
| FT | Fourier Transform |
| ILT | Inverse Laplace Transform |
| BVI | Bulk Volume Irreducible |
| BVM | Bulk Move Movable |
| rf | radiofrequency |
| B0 | external magnetic field |
| CPMG | Carr-Purcell-Meiboom-Gill |
| PSD | Pore Size Distribution |
| LF-MRI | Low-field Magnetic Resonance Imaging |
| sc | supercritical |
| φ | porosity |
| κ | permeability |
| ρ | Surface relaxivity |
| T2B | bulk fluid relaxation |
| T2S | surface relaxation |
| T2IH | inhomogeneous field dephasing |
| Spore | surface area-to-volume ratio |
| PTC | pseudo T2 cutoff |
| ARS | Average pore radius |
| SVR | surface-to-volume techniques |
| T2LM | log-mean T₂ |
| Kr | relative permeability |
| S/V | surface-to-volume (S/V) ratio |
| SNR | Signal-to-noise ratio |
| CCUS | Carbon Capture, Utilization, and Storage |
| EOR | Enhanced Oil Recovery |
| FFI | Free fluid index |
| EDC | EDC |
| LTNA | low-temperature nitrogen adsorption |
| DWI | diffusion-weighted imaging |
| DTI | diffusion tensor imaging |
| IR-CPMG | inversion-recovery CPMG |
| SR-CPMG | saturation-recovery CPMG |
| TE | Echo spacing |
| SE | Solid-Echo |
| MSE | Magic Echo |
| PIR | Phase-encoded Inversion Recovery |
| BSSFP | Balanced Steady-State Free Precession |
| Gint | internal magnetic field gradients |
| SpE | Spin-echo |
| SPI | Single-Point Imaging |
| SPRITE | single-point ramped imaging with T1-enhancement |
| ZTE | Zero Echo Time |
| XRD | X-ray diffraction |
| micro-CT | X-Ray Micro-Computed Tomography |
| PCP | Pressure-controlled Porosimetry |
| SMO | Sequential Minimal Optimization |
| 1D | One-dimensional |
| 2D | Two-dimensional |
| 3D | Three-dimensional |
| UCS | Uniaxial Compressive Strength |
| Pc | capillary pressure |
| CS | Compressed Sensing |
| PCA | Pore Cluster Analysis |
| HTHP | high-temperature and high-pressure |
| BET | Brunauer-Emmett-Teller |
| AI | Artificial Intelligence |
References
- Wang, Z.; Fingas, M.; Yang, C.; Christensen, J.H. Crude Oil and Refined Product Fingerprinting: Principles. In Environ. Forensics; Elsevier, 1964; pp. 339–407. [Google Scholar] [CrossRef]
- Wexler, P.; Anderson, B.D. (Eds.) Encyclopedia of Toxicology, Third edition; Elsevier/AP, Academic Press is an imprint of Elsevier: Amsterdam ; Boston, 2014. [Google Scholar]
- Zhang, J.; Zhang, S.; Feng, Y.; Liu, J.; Bai, H.; Li, Z.; et al. Mechanistic Evaluation of Surfactant-Enhanced Oil Mobility in Tight Conglomerate Reservoirs: A Case Study of Mahu Oilfield, NW China. Fuels 2025, 6, 93. [Google Scholar] [CrossRef]
- Kulkarni, A.D.; Khurpade, P.D.; Nandi, S. Estimation of SARA composition of crudes purely from density and viscosity using machine learning based models. Petroleum 2024, 10, 620–30. [Google Scholar] [CrossRef]
- Hosseinzadeh, S.; Kadkhodaie, A.; Yarmohammadi, S. NMR Derived Capillary Pressure and Relative Permeability Curves As an Aid in Rock Typing of Carbonate Reservoirs. J. Pet. Sci. Eng. 2020, 184, 106593. [Google Scholar] [CrossRef]
- Zargar, G.; Tanha, A.A.; Parizad, A.; Amouri, M.; Bagheri, H. Reservoir rock properties estimation based on conventional and NMR log data using ANN-Cuckoo: A case study in one of super fields in Iran southwest. Petroleum 2020, 6, 304–10. [Google Scholar] [CrossRef]
- Gonçalves, E.C.; Da Silva, P.N.; Silveira, C.S.; Carneiro, G.; Domingues, A.B.; Moss, A.; et al. Prediction of Carbonate Rock Type from NMR Responses Using Data Mining Techniques. J. Appl. Geophys 2017, 140, 93–101. [Google Scholar] [CrossRef]
- Ehrenberg, S.N.; Nadeau, P.H. Sandstone vs. Carbonate Petroleum Reservoirs: A Global Perspective on Porosity-depth and Porosity-permeability Relationships. AAPG Bull. 2005, 89, 435–45. [Google Scholar] [CrossRef]
- Dullien, F.A.L. Porous Media: Fluid Transport and Pore Structure; Academic Press: New York, 1979. [Google Scholar]
- Mitchell, J.; Chandrasekera, T.C.; Holland, D.J.; Gladden, L.F.; Fordham, E.J. Magnetic Resonance Imaging in Laboratory Petrophysical Core Analysis. Phys. Rep. 2013, 526, 165–225. [Google Scholar] [CrossRef]
- Ok, S.; Al-Bazzaz, W.; Bahzad, D. Investigations on Unconventional Tight Carbonate Rock Cores by Low-Field Nuclear Magnetic Resonance Relaxometry. Pet. Chem. 2025, 65, 57–71. [Google Scholar] [CrossRef]
- Westphal, H.; Surholt, I.; Kiesl, C.; Thern, H.F.; Kruspe, T. NMR Measurements in Carbonate Rocks: Problems and an Approach to a Solution. Pure Appl. Geophys 2005, 162, 549–70. [Google Scholar] [CrossRef]
- Behroozmand, A.A.; Keating, K.; Auken, E. A Review of the Principles and Applications of the NMR Technique for Near-Surface Characterization. Surv. Geophys 2015, 36, 27–85. [Google Scholar] [CrossRef]
- Branco, F.R.; Gil, N.A. NMR Study of Carbonates Wettability. J. Pet. Sci. Eng. 2017, 157, 288–94. [Google Scholar] [CrossRef]
- Lai, J.; Wang, G.; Wang, Z.; Chen, J.; Pang, X.; Wang, S.; et al. A Review on Pore Structure Characterization in Tight Sandstones. Earth-Sci. Rev. 2018, 177, 436–57. [Google Scholar] [CrossRef]
- Zhang, P.; Lu, S.; Li, J.; Chen, C.; Xue, H.; Zhang, J. Petrophysical Characterization of Oil-bearing Shales by Low-field Nuclear Magnetic Resonance (NMR). Mar. Pet. Geol. 2018, 89, 775–85. [Google Scholar] [CrossRef]
- Schlumberger, S.D.C.R.; Valori, A.; Nicot, B.; TOTAL, C.S.T.J.F. A Review of 60 Years of NMR Wettability. Petrophysics – SPWLA J. Form. Eval. Reserv Descr. 2019, 60, 255–63. [Google Scholar] [CrossRef]
- Khatibi, S.; Ostadhassan, M.; Xie, Z.H.; Gentzis, T.; Bubach, B.; Gan, Z.; et al. NMR Relaxometry a New Approach to Detect Geochemical Properties of Organic Matter in Tight Shales. Fuel 2019, 235, 167–77. [Google Scholar] [CrossRef]
- Guo, J.-C.; Zhou, H.-Y.; Zeng, J.; Wang, K.-J.; Lai, J.; Liu, Y.-X. Advances in Low-field Nuclear Magnetic Resonance (NMR) Technologies Applied for Characterization of Pore Space Inside Rocks: A Critical Review. Pet. Sci. 2020, 17, 1281–97. [Google Scholar] [CrossRef]
- Elsayed, M.; Isah, A.; Hiba, M.; Hassan, A.; Al-Garadi, K.; Mahmoud, M.; et al. A Review on the Applications of Nuclear Magnetic Resonance (NMR) in the Oil and Gas Industry: Laboratory and Field-scale Measurements. J. Pet. Explor Prod. Technol. 2022, 12, 2747–84. [Google Scholar] [CrossRef]
- Soto Bravo, F.; Zhang, C. A Critical Mini-review on the Low-field Nuclear Magnetic Resonance Investigation of Pore Coupling Effects in Near-surface Environments. Front Water 2023, 5, 1059128. [Google Scholar] [CrossRef]
- Zhang, Y.; Song, Y.; Luo, S.; Lin, T.; Liu, H. Core Analysis Using Nuclear Magnetic Resonance. Petrophysics – SPWLA J. Form. Eval. Reserv Descr. 2024, 65, 173–93. [Google Scholar] [CrossRef]
- Bjørlykke, K.; Jahren, J. Sandstones and Sandstone Reservoirs. In Pet. Geosci.; Springer Berlin Heidelberg: Berlin, Heidelberg, 2010; pp. 113–40. [Google Scholar] [CrossRef]
- Middleton, G.V. Chemical Composition of Sandstones. Geol. Soc. Am. Bull. 1960, 71, 1011. [Google Scholar] [CrossRef]
- Ajdukiewicz, J.M.; Lander, R.H. Sandstone Reservoir Quality Prediction: The State of the Art. AAPG Bull. 2010, 94, 1083–91. [Google Scholar] [CrossRef]
- Bloch, S.; Lander, R.H.; Bonnell, L. Anomalously High Porosity and Permeability in Deeply Buried Sandstone Reservoirs: Origin and Predictability. AAPG Bull. 2002, 86. [Google Scholar] [CrossRef]
- Payton, R.L.; Chiarella, D.; Kingdon, A. The Influence of Grain Shape and Size on the Relationship between Porosity and Permeability in Sandstone: A Digital Approach. Sci. Rep. 2022, 12, 7531. [Google Scholar] [CrossRef] [PubMed]
- Fu, H.; Wang, X.; Zhang, L.; Gao, R.; Li, Z.; Xu, T.; et al. Investigation of the Factors that Control the Development of Pore Structure in Lacustrine Shale: A Case Study of Block X in the Ordos Basin, China. J. Nat. Gas. Sci. Eng. 2015, 26, 1422–32. [Google Scholar] [CrossRef]
- Anovitz, L.M.; Cole, D.R. Characterization and Analysis of Porosity and Pore Structures. Rev. Mineral. Geochem 2015, 80, 61–164. [Google Scholar] [CrossRef]
- Ge, X.; Fan, Y.; Cao, Y.; Xu, Y.; Liu, X.; Chen, Y. Reservoir Pore Structure Classification Technology of Carbonate Rock Based on NMR T2 Spectrum Decomposition. Appl. Magn. Reson 2014, 45, 155–67. [Google Scholar] [CrossRef]
- Hidajat, I.; Mohanty, K.K.; Flaum, M.; Hirasaki, G. Study of Vuggy Carbonates Using NMR and X-Ray CT Scanning. SPE Reserv Eval. Eng. 2004, 7, 365–77. [Google Scholar] [CrossRef]
- Li, B.; Tan, X.; Wang, F.; Lian, P.; Gao, W.; Li, Y. Fracture and Vug Characterization and Carbonate Rock Type Automatic Classification Using X-ray CT Images. J. Pet. Sci. Eng. 2017, 153, 88–96. [Google Scholar] [CrossRef]
- Xu, R.; Deng, T.; Jiang, J.; Jobe, D.; Xu, C. Integration of NMR and Conventional Logs for Vuggy Facies Classification in the Arbuckle Formation: A Machine Learning Approach. SPE Reserv Eval. Eng. 2020, 23, 917–29. [Google Scholar] [CrossRef]
- Dos Santos, Y.R.P.; Gomes, I.F.; Lima, A.; Felipe Rodrigues, M.A.; Dias Da Silva Filho, E.; Barbosa, J.A.; et al. Acid-rock Interaction Investigation and the Influence of Fractures during Matrix Acidizing in Carbonate Rocks. Petroleum 2025, 11, 475–95. [Google Scholar] [CrossRef]
- Mai, A.; Kantzas, A. Porosity Distributions in Carbonate Reservoirs Using Low-Field NMR. J. Can. Pet. Technol. 2007, 46. [Google Scholar] [CrossRef]
- Sadeghnejad, S.; Gostick, J. Multiscale Reconstruction of Vuggy Carbonates by Pore-Network Modeling and Image-Based Technique. SPE J. 2020, 25, 253–67. [Google Scholar] [CrossRef]
- Ausbrooks, R.; Hurley, N.F.; May, A.; Neese, D.G. Pore-Size Distributions in Vuggy Carbonates From Core Images, NMR, and Capillary Pressure. In SPE Annu. Tech. Conf. Exhib.; SPE: Houston, Texas, 1999; p. SPE-56506-MS. [Google Scholar] [CrossRef]
- Akbar, M.; Petricola, M.; Watfa, M.; Badri, M.; Charara, M.; Boyd, A.; et al. Classic Interpretation Problems: Evaluating Carbonates. Oilfield Rev. 1995, 7, 38–57. [Google Scholar]
- Tucker, M.E.; Wright, V.P. Carbonate Sedimentology, 1st ed.; Wiley, 1990. [Google Scholar] [CrossRef]
- Carbonate Reservoir Characterization; Springer Berlin Heidelberg: Berlin, Heidelberg, 2007. [CrossRef]
- Iwere, F.O.; Moreno, J.E.; Apaydin, O.G.; Ventura, R.L.; Garcia, J.L. Vug Characterization and Pore Volume Compressibility for Numerical Simulation of Vuggy and Fractured Carbonate Reservoirs. In SPE Int. Pet. Conf. Exhib. Mex.; SPE: Villahermosa, Mexico, 2002; p. SPE-74341-MS. [Google Scholar] [CrossRef]
- Zhang, L.; Nair, N.; Jennings, J.W.; Bryant, S.L. Models and Methods for Determining Transport Properties of Touching-Vug Carbonates. In SPE Annu. Tech. Conf. Exhib.; SPE: Dallas, Texas, 2005; p. SPE-96027-MS. [Google Scholar] [CrossRef]
- Wu, Y.; Cheng, L.; Huang, S.; Fang, S.; Jia, P.; Wang, S. A Semianalytical Model for Simulating Fluid Flow in Naturally Fractured Reservoirs With Nonhomogeneous Vugs and Fractures. SPE J. 2019, 24, 334–48. [Google Scholar] [CrossRef]
- Nair, N.; Bryant, S.L.; Jennings, J.W. Finding the Continuum Scale in Highly Heterogeneous Rocks: Example of a Large Touching Vug Carbonate. In SPE Annu. Tech. Conf. Exhib.; SPE: Denver, Colorado, USA, 2008; p. SPE-115347-MS. [Google Scholar] [CrossRef]
- Vik, B.; Sylta, K.E.; Skauge, A. Connectivity in Vuggy Carbonates, New Experimental Methods and Applications. Transp. Porous Media 2012, 93, 561–75. [Google Scholar] [CrossRef]
- Bona, N.; Radaelli, F.; Ortenzi, A.; De Poli, A.; Peduzzi, C.; Giorgioni, M. Integrated Core Analysis for Fractured Reservoirs: Quantification of the Storage and Flow Capacity of Matrix, Vugs, and Fractures. SPE Reserv Eval. Eng. 2003, 6, 226–33. [Google Scholar] [CrossRef]
- Al Omari, M.M.H.; Rashid, I.S.; Qinna, N.A.; Jaber, A.M.; Badwan, A.A. Calcium Carbonate. Profiles Drug Subst. Excip. Relat. Methodol.; Elsevier, 2016; vol. 41, pp. 31–132. [Google Scholar] [CrossRef] [PubMed]
- Dunham, R.J. Classification of Carbonate Rocks According to Depositional Texture. Classif. Carbonate Rocks; AAPG Memoir No. 1: Tulsa, OK, 1962. [Google Scholar]
- Cicha-Szot, R.; Labus, K.; Leśniak, G. Pore-Scale Evolution of Carbonate and Sandstone Reservoirs Under CO2–Brine Interaction: Implications for Sustainable Carbon Storage. Sustainability 2025, 17, 9102. [Google Scholar] [CrossRef]
- Cole, D.R.; Ok, S.; Striolo, A.; Phan, A. Hydrocarbon Behavior at Nanoscale Interfaces. Rev. Mineral. Geochem 2013, 75, 495–545. [Google Scholar] [CrossRef]
- Gautam, S.S.; Ok, S.; Cole, D.R. Structure and Dynamics of Confined C-O-H Fluids Relevant to the Subsurface: Application of Magnetic Resonance, Neutron Scattering, and Molecular Dynamics Simulations. Front Earth Sci. 2017, 5, 43. [Google Scholar] [CrossRef]
- Ok, S.; Mal, T.K. NMR Spectroscopy Analysis of Asphaltenes. Energy Fuels 2019, 33, 10391–414. [Google Scholar] [CrossRef]
- Choquette, Philip W.; Lloyd, C. P. Geologic Nomenclature and Classification of Porosity in Sedimentary Carbonates. AAPG Bull. 1970, 54. [Google Scholar] [CrossRef]
- Melim, L.A.; Anselmetti, F.S.; Eberli, G.P. The Importance of Pore Type on Permeability of Neogene Carbonates, Great Bahama Bank. Subsurf. Geol. Prograding Carbonate Platf. Margin Gt. Bahama Bank Results Bahamas Drill. Proj. 2001. [Google Scholar] [CrossRef]
- Ok, S. Low-field NMR Investigations on Dynamics of Crude Oil Confined into Nanoporous Silica Rods and White Powder. Front Chem. 2023, 11, 1087474. [Google Scholar] [CrossRef] [PubMed]
- Liang, C.; Jia, Z.; Xiao, L.; Guo, A. Application Limits and Influencing Factors in Characterization of Rock Cores Using the Phase-Encoded T2 -y Method in Low-Field NMR. Energy Fuels 2024, 38, 12612–24. [Google Scholar] [CrossRef]
- Aghda, S.M.F.; Taslimi, M.; Fahimifar, A. Adjusting Porosity and Permeability Estimation by Nuclear Magnetic Resonance: A Case Study from a Carbonate Reservoir of South of Iran. J. Pet. Explor Prod. Technol. 2018, 8, 1113–27. [Google Scholar] [CrossRef]
- Darmawan, C.; Rosid, M.S.; Rulliyansyah, R. Characterization of Carbonate Reservoir by Using Nuclear Magnetic Resonance (NMR) Logging Analysis at Hydrocarbon Field C South Sumatera; Bali, Indonesia, 2018; p. 020261. [Google Scholar] [CrossRef]
- Song, Y.-Q.; Kausik, R. NMR Application in Unconventional Shale Reservoirs – A New Porous Media Research Frontier. Prog. Nucl. Magn. Reson Spectrosc. 2019, 112–113, 17–33. [Google Scholar] [CrossRef] [PubMed]
- Mai, A.; Kantzas, A. An Evaluation of the Application of Low Field NMR in the Characterization of Carbonate Reservoirs. In SPE Annu. Tech. Conf. Exhib.; SPE: San Antonio, Texas, 2002; p. SPE-77401-MS. [Google Scholar] [CrossRef]
- Straley, C.; Rossini, D.; Vinegar, H.; Tutunjian, P.; Morriss, C. Core Analysis by Low Field NMR. SCA 1994, 9404, 43–56. [Google Scholar]
- Markovic, S.; Mukhametdinova, A.; Cheremisin, A.; Kantzas, A.; Rezaee, R. Matrix Decomposition Methods for Accurate Water Saturation Prediction in Canadian Oil-sands by LF-NMR T2 Measurements. Geoenergy Sci. Eng. 2024, 233, 212438. [Google Scholar] [CrossRef]
- Liu, Y.; Zhang, T.; Ma, Y.; Yang, K.; Tang, M. Dynamic Response and Fractal Characteristics of a Pore-Fracture System in Ultralow Permeability Sandstone Based on Low-Field NMR. Energy Fuels 2021, 35, 397–407. [Google Scholar] [CrossRef]
- Zhou, S.; Liu, D.; Cai, Y.; Yao, Y. Fractal Characterization of Pore–fracture in Low-rank Coals Using a Low-field NMR Relaxation Method. Fuel 2016, 181, 218–26. [Google Scholar] [CrossRef]
- Al-Azani, K.; Abu-Khamsin, S.; Elsayed, M.; Patil, S.; Shakil Hussain, S.M.; Al Shalabi, E.; et al. Chemical Enhanced Oil Recovery under Harsh Conditions: Investigation of Rock Permeability and Insights from NMR Measurements. Geoenergy Sci. Eng. 2024, 236, 212764. [Google Scholar] [CrossRef]
- Ren, J.; Liu, Z.; Deng, Y.; Guo, J.; Lai, J.; Wang, J.; et al. The Quantitative Study of Residual Acid Damage of Low Permeability Carbonate Rock Based on NMR Test. Geoenergy Sci. Eng. 2024, 241, 213109. [Google Scholar] [CrossRef]
- Pomerantz, A.E.; Song, Y.-Q. Quantifying Spatial Heterogeneity from Images. New J. Phys. 2008, 10, 125012. [Google Scholar] [CrossRef]
- Mohnke, O.; Yaramanci, U. Pore Size Distributions and Hydraulic Conductivities of Rocks Derived from Magnetic Resonance Sounding Relaxation Data Using Multi-exponential Decay Time Inversion. J. Appl. Geophys 2008, 66, 73–81. [Google Scholar] [CrossRef]
- Timur, A. Pulsed Nuclear Magnetic Resonance Studies of Porosity, Movable Fluid, and Permeability of Sandstones. J. Pet. Technol. 1969, 21, 775–86. [Google Scholar] [CrossRef]
- Mitchell, J. Rapid Measurements of Heterogeneity in Sandstones Using Low-field Nuclear Magnetic Resonance. J. Magn. Reson 2014, 240, 52–60. [Google Scholar] [CrossRef] [PubMed]
- Kleinberg, R.L. Utility of NMR T2 Distributions, Connection with Capillary Pressure, Clay Effect, and Determination of the Surface Relaxivity Parameter ρ2. Magn. Reson Imaging 1996, 14, 761–7. [Google Scholar] [CrossRef] [PubMed]
- Quintero, L.; Boyd, A.; Gyllensten, A.; El-Wazeer, F. Comparison of Permeability from NMR and Production Analysis in Carbonate Reservoirs. In SPE Annu. Tech. Conf. Exhib.; SPE: Houston, Texas, 1999; p. SPE-56798-MS. [Google Scholar] [CrossRef]
- Vogel, M. NMR Studies on Simple Liquids in Confinement. Eur. Phys. J. Spec. Top. 2010, 189, 47–64. [Google Scholar] [CrossRef]
- Grunewald, E.; Knight, R. The Effect of Pore Size and Magnetic Susceptibility on the Surface NMR Relaxation Parameter. Surf. Geophys 2011, 9, 169–78. [Google Scholar] [CrossRef]
- Majumdar, R.D. A nuclear Magnetic Resonance Spectroscopic Investigation of the molecular Structure and Aggregation Behavior of Asphaltenes. Ph.D. Thesis, University of Lethbridge, 2015. [Google Scholar]
- Jiang, Y.; Xu, G.; Bi, H.; Shi, Y.; Gao, Y.; Han, X.; et al. A New Method to Determine Surface Relaxivity of Tight Sandstone Cores Based on LF-NMR and High-speed Centrifugation Measurements. J. Pet. Sci. Eng. 2021, 196, 108096. [Google Scholar] [CrossRef]
- Luo, Z.-X.; Paulsen, J.; Song, Y.-Q. Robust Determination of Surface Relaxivity from Nuclear Magnetic Resonance DT2 Measurements. J. Magn. Reson 2015, 259, 146–52. [Google Scholar] [CrossRef] [PubMed]
- Yuan, Y.; Rezaee, R. Impact of Paramagnetic Minerals on NMR-Converted Pore Size Distributions in Permian Carynginia Shales. Energy Fuels 2019, 33, 2880–7. [Google Scholar] [CrossRef]
- Li, J.; Wang, M.; Jia, W. A Modified Surface to Volume (SVR) Method to Calculate Nuclear Magnetic Resonance (NMR) Surface Relaxivity: Theory and a Case Study in Shale Reservoirs. Mar. Pet. Geol. 2024, 170, 107159. [Google Scholar] [CrossRef]
- Arns, C.H.; Sheppard, A.P.; Saadatfar, M.; Knackstedt, M.A. Prediction of Permeability from NMR Response: Surface Relaxivity Heterogeneity; Veracruz, Mexico, 2006. [Google Scholar]
- Slijkerman, W.F.J.; Hofman, J.P. Determination of Surface Relaxivity from NMR Diffusion Measurements. Magn. Reson Imaging 1998, 16, 541–4. [Google Scholar] [CrossRef] [PubMed]
- Chen, Q.; Balcom, B.J. Measurement of Rock-core Capillary Pressure Curves Using a Single-speed Centrifuge and One-dimensional Magnetic-resonance Imaging. J. Chem. Phys. 2005, 122, 214720. [Google Scholar] [CrossRef] [PubMed]
- Wu, B.; Xie, R.; Jin, G.; Liu, J.; Wang, S.; Fan, W. Investigation on the Pore Structure and Multifractal Characteristics of Tight Sandstone Using Nitrogen Gas Adsorption and Mercury Injection Capillary Pressure Experiments. Energy Fuels 2022, 36, 262–74. [Google Scholar] [CrossRef]
- Freedman, R.; Heaton, N. Fluid Characterization Using Nuclear Magnetic Resonance Logging. SPWLA J. Form. Eval. Reserv Descr. 2004, 45, 241–50. [Google Scholar]
- Allen, D.; Crary, S.; Freedman, B.; Andreani, M.; Klopf, W.; Badry, R.; et al. How to Use Borehole Nuclear Magnetic Resonance. Oilfield Rev. 1997, 9, 34–57. [Google Scholar]
- Seevers, D.O. A Nuclear Magnetic Method for Determining the Permeability of Sandstones. SPWLA 7th Annu Logging Symp. 1966; p. SPWLA-1966-L. [Google Scholar]
- Ok, S.; Hwang, B.; Liu, T.; Welch, S.; Sheets, J.M.; Cole, D.R.; et al. Fluid Behavior in Nanoporous Silica. Front Chem. 2020, 8, 734. [Google Scholar] [CrossRef] [PubMed]
- Xue, D.J.; Liu, Y.T.; Zhou, J.; Sun, X.T. Visualization of Helium-water Flow in Tight Coal by the Low-field NMR Imaging: An Experimental Observation. J. Pet. Sci. Eng. 2020, 188, 106862. [Google Scholar] [CrossRef]
- Yang, L.; Ji, M.; Zhao, Y.; Li, S.; Geng, Z.; Dong, R.; et al. Study on Two-phase Displacement Behavior and Carbon Storage in Low-permeability Sandstone Based on NMR and MRI. Geoenergy Sci. Eng. 2026, 256, 214165. [Google Scholar] [CrossRef]
- Vinegar, H.J. X-Ray CT and NMR Imaging of Rocks. J. Pet. Technol. 1986, 38, 257–9. [Google Scholar] [CrossRef]
- Xu, L.; Li, Q.; Myers, M.; Chen, Q.; Li, X. Application of Nuclear Magnetic Resonance Technology to Carbon Capture, Utilization and Storage: A Review. J. Rock. Mech. Geotech. Eng. 2019, 11, 892–908. [Google Scholar] [CrossRef]
- Covington, K.L.; Goroncy, A.K.; Lehmann, T.E.; Kou, Z.; Wang, H.; Alvarado, V. Analysis of ZTE MRI Application to Sandstone and Carbonate. AIChE J. 2021, 67, e17074. [Google Scholar] [CrossRef]
- Wang, X.; Lei, Q.; Luo, J.; Ye, Y.; Wu, X.; Xiao, P.; et al. Visualization Study of Produced Oil Based on Magnetic Resonance Imaging Technology. ACS Omega 2021, 6, 3244–51. [Google Scholar] [CrossRef] [PubMed]
- Korringa, J.; Seevers, D.O.; Torrey, H.C. Theory of Spin Pumping and Relaxation in Systems with a Low Concentration of Electron Spin Resonance Centers. Phys. Rev. 1962, 127, 1143–50. [Google Scholar] [CrossRef]
- Coates, G.R.; Dumanoir, J.L. A New Approach to Improved Log-Derived Permeability. SPWLA 1973, 1973–A. [Google Scholar]
- Kenyon, W.E.; Day, P.I.; Straley, C.; Willemsen, J.F. A Three-Part Study of NMR Longitudinal Relaxation Properties of Water-Saturated Sandstones. SPE Form. Eval. 1988, 3, 622–36. [Google Scholar] [CrossRef]
- Weller, A.; Zhang, Z. A Comparative Study of Permeability Prediction for Eocene sandstones — Part 2: Application and Modification of the Schlumberger-Doll Research Equation. GEOPHYSICS 2022, 87, M179–88. [Google Scholar] [CrossRef]
- Rezaee, R. Nuclear Magnetic Resonance (NMR) Outputs Generation for Clastic Rocks Using Multi Regression Analysis, Examples from Offshore Western Australia. Fuels 2022, 3, 316–25. [Google Scholar] [CrossRef]
- Chang, D.; Vinegar, H.J.; Morriss, C.; Straley, C. Effective Porosity, Producible Fluid and Permeability in Carbonates from NMR Logging. SPWLA 1994, 1994–A. [Google Scholar]
- Sun, T.; Yan, W.; Wang, H.; Golsanami, N.; Zhang, L. Developing a New NMR-based Permeability Model for Fractured Carbonate Gas Reservoirs. J. Nat. Gas. Sci. Eng. 2016, 35, 906–19. [Google Scholar] [CrossRef]
- Carr, H.Y.; Purcell, E.M. Effects of Diffusion on Free Precession in Nuclear Magnetic Resonance Experiments. Phys. Rev. 1954, 94, 630–8. [Google Scholar] [CrossRef]
- Meiboom, S.; Gill, D. Modified Spin-Echo Method for Measuring Nuclear Relaxation Times. Rev. Sci. Instrum. 1958, 29, 688–91. [Google Scholar] [CrossRef]
- Birdwell, J.E.; Washburn, K.E. Multivariate Analysis Relating Oil Shale Geochemical Properties to NMR Relaxometry. Energy Fuels 2015, 29, 2234–43. [Google Scholar] [CrossRef]
- Shabani, M.; Ghaffary, S.; Yarmohammadi, S. Evaluation of Rock Properties Determined from Core and NMR Data; A Case Study on Asmari Carbonate Reservoir. J. Pet. Sci. Technol. 2021. [Google Scholar] [CrossRef]
- Wang, S.; Chang, Y.; Wang, Z.; Sun, X. Evaluation of Grain Size Effects on Porosity, Permeability, and Pore Size Distribution of Carbonate Rocks Using Nuclear Magnetic Resonance Technology. Energies 2024, 17, 1370. [Google Scholar] [CrossRef]
- Fleury, M.; Kohler, E.; Norrant, F.; Gautier, S.; M’Hamdi, J.; Barré, L. Characterization and Quantification of Water in Smectites with Low-Field NMR. J. Phys. Chem. C 2013, 117, 4551–60. [Google Scholar] [CrossRef]
- Korb, J.-P. Multiscale Nuclear Magnetic Relaxation Dispersion of Complex Liquids in Bulk and Confinement. Prog. Nucl. Magn. Reson Spectrosc. 2018, 104, 12–55. [Google Scholar] [CrossRef] [PubMed]
- Nikolaev, M.Y.; Kazak, A.V. Liquid Saturation Evaluation in Organic-rich Unconventional Reservoirs: A Comprehensive Review. Earth-Sci. Rev. 2019, 194, 327–49. [Google Scholar] [CrossRef]
- Müller-Huber, E.; Schön, J.; Börner, F. Pore Space Characterization in Carbonate Rocks — Approach to Combine Nuclear Magnetic Resonance and Elastic Wave Velocity Measurements. J. Appl. Geophys 2016, 127, 68–81. [Google Scholar] [CrossRef]
- Xiao, D.; Lu, S.; Yang, J.; Zhang, L.; Li, B. Classifying Multiscale Pores and Investigating Their Relationship with Porosity and Permeability in Tight Sandstone Gas Reservoirs. Energy Fuels 2017, 31, 9188–200. [Google Scholar] [CrossRef]
- Zhang, W.; Huang, Z.; Li, X.; Chen, J.; Guo, X.; Pan, Y.; et al. Estimation of Organic and Inorganic Porosity in Shale by NMR Method, Insights from Marine Shales with Different Maturities. J. Nat. Gas. Sci. Eng. 2020, 78, 103290. [Google Scholar] [CrossRef]
- Fajt, M.; Machowski, G.; Puzio, B.; Krzyżak, A.T. Modelling Effective Diffusion for Accurate NMR Pore Size Analysis in Nano- and Microporous Rocks. Sci. Rep. 2025, 15, 36688. [Google Scholar] [CrossRef] [PubMed]
- Song, Y.-Q.; Venkataramanan, L.; Hürlimann, M.D.; Flaum, M.; Frulla, P.; Straley, C. T1–T2 Correlation Spectra Obtained Using a Fast Two-Dimensional Laplace Inversion. J. Magn. Reson 2002, 154, 261–8. [Google Scholar] [CrossRef] [PubMed]
- Fleury, M.; Romero-Sarmiento, M. Characterization of Shales Using T1–T2 NMR Maps. J. Pet. Sci. Eng. 2016, 137, 55–62. [Google Scholar] [CrossRef]
- Rondeau-Mouro, C.; Kovrlija, R.; Van Steenberge, E.; Moussaoui, S. Two Dimensional IR-FID-CPMG Acquisition and Adaptation of a Maximum Entropy Reconstruction. J. Magn. Reson 2016, 265, 16–24. [Google Scholar] [CrossRef] [PubMed]
- Veselinovic, D.; Dick, M.J.; Kenney, T.; Green, D. Multi Field Evaluation of T2 Distributions and T1-T2 2D Maps. In Proc. 10th Unconv. Resour. Technol. Conf.; American Association of Petroleum Geologists: Houston, Texas, USA, 2022. [Google Scholar] [CrossRef]
- Zhang, W.; Li, S.; Wang, S.; Sun, J.; Cai, W.; Yu, W.; et al. Application of Two-Dimensional NMR for Quantitative Analysis of Viscosity in Medium–High-Porosity-and-Permeability Sandstones in North China Oilfields. Energies 2024, 17, 5257. [Google Scholar] [CrossRef]
- Meng, X.; Xie, R.; Jia, H.; Li, H. Identification of Light Oil in 2D NMR Spectra of Tight Sandstone Reservoirs by Using L1/L2 Two-Parameter Regularization. Energy Fuels 2019, 33, 10537–46. [Google Scholar] [CrossRef]
- Guo, J.; Xie, R. Numerical Investigations of NMR T1–T2 Map in Two-Phase Fluid-Bearing Tight Sandstone. Appl. Magn. Reson 2019, 50, 479–95. [Google Scholar] [CrossRef]
- Fazlyyyakhmatov, M.; Sakharov, B.; Khasanova, N.; Varfolomeev, M. A Low-field NMR Relaxometry-based Technology for Organic Matter and Bitumen Characterization in Unconventional Reservoir Rocks. Fuel 2026, 404, 136207. [Google Scholar] [CrossRef]
- Yang, K.; Connolly, P.R.J.; Li, M.; Seltzer, S.J.; McCarty, D.K.; Mahmoud, M.; et al. Shale Rock Core Analysis Using NMR: Effect of Bitumen and Water Content. J. Pet. Sci. Eng. 2020, 195, 107847. [Google Scholar] [CrossRef]
- Washburn, K.E.; Anderssen, E.; Vogt, S.J.; Seymour, J.D.; Birdwell, J.E.; Kirkland, C.M.; et al. Simultaneous Gaussian and Exponential Inversion for Improved Analysis of Shales by NMR Relaxometry. J. Magn. Reson 2015, 250, 7–16. [Google Scholar] [CrossRef] [PubMed]
- Guo, J.; MacMillan, B.; Zamiri, M.S.; Balcom, B.J. Magnetic Resonance T1–T2* and T1ρ–T2* Relaxation Correlation Measurements in Solid-like Materials with Non-exponential Decays. J. Magn. Reson 2021, 328, 107005. [Google Scholar] [CrossRef] [PubMed]
- Liu, Y.; Wang, X.; Hirasaki, G.J.; Vinegar, E.G.; Vinegar, H.J.; Singer, P.M. Separation of Solid and Liquid Components in Organic-rich Chalks Using NMR Relaxation. Fuel 2023, 333, 126223. [Google Scholar] [CrossRef]
- Washburn, K.E.; Birdwell, J.E. Updated Methodology for Nuclear Magnetic Resonance Characterization of Shales. J. Magn. Reson 2013, 233, 17–28. [Google Scholar] [CrossRef] [PubMed]
- Jia, Z.; Xiao, L.; Wang, Z.; Liao, G.; Zhang, Y.; Liang, C.; et al. Magic Echo for Nuclear Magnetic Resonance Characterization of Shales. Energy Fuels 2017, 31, 7824–30. [Google Scholar] [CrossRef]
- Panattoni, F.; Colbourne, A.A.; Fordham, E.J.; Mitchell, J.; Grey, C.P.; Magusin, P.C.M.M. Improved Description of Organic Matter in Shales by Enhanced Solid Fraction Detection with Low-Field1 H NMR Relaxometry. Energy Fuels 2021, 35, 18194–209. [Google Scholar] [CrossRef]
- Du, Q.; Xiao, L.; Zhang, Y.; Liao, G.; Liu, H.; Guo, J. A Novel Two-dimensional NMR Relaxometry Pulse Sequence for Petrophysical Characterization of Shale at Low Field. J. Magn. Reson 2020, 310, 106643. [Google Scholar] [CrossRef] [PubMed]
- Zuo, F.; Ge, X.; Xing, L.; Wu, B.; Fan, Y.; Junior, J.J.; et al. An Improved Method to Accelerate the Acquisition Efficiency of the T1-T2 Spectrum Based on the IR-BSSFP-CPMG Pulse Sequence∗. Comput Geosci. 2025, 196, 105792. [Google Scholar] [CrossRef]
- Hürlimann, M.D. Well Logging. In Encycl. Magn. Reson.; Harris, R.K., Ed.; John Wiley & Sons, Ltd: Chichester, UK, 2012; p. emrstm0593.pub2. [Google Scholar] [CrossRef]
- Connolly, P.R.J.; Yan, W.; Zhang, D.; Mahmoud, M.; Verrall, M.; Lebedev, M.; et al. Simulation and Experimental Measurements of Internal Magnetic Field Gradients and NMR Transverse Relaxation Times (T2) in Sandstone Rocks. J. Pet. Sci. Eng. 2019, 175, 985–97. [Google Scholar] [CrossRef]
- Anger, B.C.; Rydzy, M.; Ramskill, N.P.; Hertel, S.; Sederman, A.J.; Mantle, M.D.; et al. Multi-Frequency NMR and TGA Characterization of TOC in Shales, 2016. [CrossRef] [PubMed]
- Min, B.; Sondergeld, C.H.; Rai, C.S. Investigation of High Frequency 1D NMR to Characterize Reservoir Rocks. J. Pet. Sci. Eng. 2019, 176, 653–60. [Google Scholar] [CrossRef]
- Silletta, E.V.; Vila, G.S.; Domené, E.A.; Velasco, M.I.; Bedini, P.C.; Garro-Linck, Y.; et al. Organic Matter Detection in Shale Reservoirs Using a Novel Pulse Sequence for T1-T2 Relaxation Maps at 2 MHz. Fuel 2022, 312, 122863. [Google Scholar] [CrossRef]
- Wang, M.; Xie, J.; Guo, F.; Zhou, Y.; Yang, X.; Meng, Z. Determination of NMR T2 Cutoff and CT Scanning for Pore Structure Evaluation in Mixed Siliciclastic–Carbonate Rocks before and after Acidification. Energies 2020, 13, 1338. [Google Scholar] [CrossRef]
- Fan, Y.; Liu, J.; Ge, X.; Deng, S.; Liu, H.; Gu, D. Permeability Evaluation of Tight Sandstone Based on Dual T2 Cutoff Values Measured by NMR. Chin. J. Geophys 2018, 61, 1628–38. [Google Scholar] [CrossRef]
- Hu, Y.; Guo, Y.; Zhang, J.; Shangguan, J.; Li, M.; Quan, F.; et al. A Method to Determine Nuclear Magnetic Resonance T2 Cutoff Value of Tight Sandstone Reservoir Based on Multifractal Analysis. Energy Sci. Eng. 2020, 8, 1135–48. [Google Scholar] [CrossRef]
- Zhang, Z.; Cui, C.; Wu, Z.; Wang, Y.; Gao, X. Shale Pore Structure Based on Nuclear Magnetic Resonance Dual T 2 Cutoff Values: Insights from Monofractal and Multifractal Characteristics. SPE J. 2025, 30, 2550–69. [Google Scholar] [CrossRef]
- Ge, X.; Fan, Y.; Zhu, X.; Chen, Y.; Li, R. Determination of Nuclear Magnetic Resonance T2 Cutoff Value Based on Multifractal Theory — An Application in Sandstone with Complex Pore Structure. Geophysics 2015, 80, D11–21. [Google Scholar] [CrossRef]
- Ge, X.; Fan, Y.; Liu, J.; Xing, D.; Xu, H.; Hu, F. An Empirical Method to Correct Nuclear Magnetic Resonance Porosity of Tight Sandstone Using Low-field Nuclear Magnetic Resonance Data. AAPG Bull. 2023, 107, 539–51. [Google Scholar] [CrossRef]
- Sun, Y.; Zhai, C.; Zhao, Y.; Xu, J.; Cong, Y.; Zheng, Y.; et al. Multifractal Analysis and Neural Network Prediction of Pore Structures in Coal Reservoirs Based on NMR T2 Spectra. Energy Fuels 2021, 35, 11306–18. [Google Scholar] [CrossRef]
- Jiang, L.; Yu, M.; Liu, Y.; Yang, M.; Zhang, Y.; Xue, Z.; et al. Behavior of CO2/Water Flow in Porous Media for CO2 Geological Storage. Magn. Reson Imaging 2017, 37, 100–6. [Google Scholar] [CrossRef] [PubMed]
- Yao, Y.; Liu, D. Comparison of Low-field NMR and Mercury Intrusion Porosimetry in Characterizing Pore Size Distributions of Coals. Fuel 2012, 95, 152–8. [Google Scholar] [CrossRef]
- Gao, F.; Song, Y.; Li, Z.; Xiong, F.; Chen, L.; Zhang, X.; et al. Quantitative Characterization of Pore Connectivity Using NMR and MIP: A Case Study of the Wangyinpu and Guanyintang Shales in the Xiuwu basin, Southern China. Int. J. Coal Geol. 2018, 197, 53–65. [Google Scholar] [CrossRef]
- Zhou, Y.; You, L.; Zi, H.; Lan, Y.; Cui, Y.; Xu, J.; et al. Determination of Pore Size Distribution in Tight Gas Sandstones Based on Bayesian Regularization Neural Network with MICP, NMR and Petrophysical Logs. J. Nat. Gas. Sci. Eng. 2022, 100, 104468. [Google Scholar] [CrossRef]
- Mondal, I.; Singh, K.H. Petrophysical Insights into Pore Structure in Complex Carbonate Reservoirs Using NMR Data. Pet. Res. 2024, 9, 439–50. [Google Scholar] [CrossRef]
- Zhao, Y.; Zhu, G.; Dong, Y.; Danesh, N.N.; Chen, Z.; Zhang, T. Comparison of Low-field NMR and Microfocus X-ray Computed Tomography in Fractal Characterization of Pores in Artificial Cores. Fuel 2017, 210, 217–26. [Google Scholar] [CrossRef]
- Zhang, P.; Lu, S.; Li, J.; Zhang, J.; Xue, H.; Chen, C. Comparisons of SEM, Low-Field NMR, and Mercury Intrusion Capillary Pressure in Characterization of the Pore Size Distribution of Lacustrine Shale: A Case Study on the Dongying Depression, Bohai Bay Basin, China. Energy Fuels 2017, 31, 9232–9. [Google Scholar] [CrossRef]
- Bageri, B.S.; Adebayo, A.R.; Al Jaberi, J.; Patil, S.; Salin, R.B. Evaluating Drilling Fluid Infiltration in Porous Media – Comparing NMR, Gravimetric, and X-ray CT Scan Methods. J. Pet. Sci. Eng. 2021, 198, 108242. [Google Scholar] [CrossRef]
- Yuan, Y.; Rezaee, R.; Verrall, M.; Hu, S.-Y.; Zou, J.; Testmanti, N. Pore Characterization and Clay Bound Water Assessment in Shale with a Combination of NMR and Low-pressure Nitrogen Gas Adsorption. Int. J. Coal Geol. 2018, 194, 11–21. [Google Scholar] [CrossRef]
- Wang, J.-J.; Zhang, P.-F.; Lu, S.-F.; Gao, W.-Z.; Zhou, N.-W.; Li, W.-B.; et al. Insight into Porosity of Shale Oil Reservoirs: Comparison of Helium, Low-temperature Nitrogen Adsorption−desorption, and Nuclear Magnetic Resonance Methods. Pet. Sci. 2026, 23, 17–32. [Google Scholar] [CrossRef]
- Jácomo, M.; Da Trindade, R.; Lucas-Oliveira, E.; Bonagamba, T. Explaining Nuclear Magnetic Resonance T2 Shifts in Sandstones with Anomalous Porosity. In Proc. 16th Int. Congr. Braz. Geophys. Soc.; Brazilian Geophysical Society, 2019; pp. 1–4. [Google Scholar] [CrossRef]
- Brown, L.; McEnroe, S. Remanent Magnetism. In Encycl. Solid Earth Geophys.; Gupta, H.K., Ed.; Springer Netherlands: Dordrecht, 2011; pp. 1024–30. [Google Scholar] [CrossRef]
- Yang, C.; Xie, Z.; Li, J.; Zheng, Y.; Wang, X.; Guo, J.; et al. Distribution Characteristics of Movable Fluid in Tight Sandstone Based on Nuclear Magnetic Resonance. IOP Conf. Ser. Earth Env. Sci. 2021, 769, 032052. [Google Scholar] [CrossRef]
- Chen, X.-J.; Zhang, R.-X.; Zhao, X.-B.; Yang, J.-W.; Lan, Z.-J.; Luo, C.-F.; et al. Multifractal Estimation of NMR T2 Cut-off Value in Low-permeability Rocks Considering Spectrum Kurtosis: SMOTE-based Oversampling Integrated with Machine Learning. Pet. Sci. 2023, 20, 3411–27. [Google Scholar] [CrossRef]
- Morriss, C.; Rossini, D.; Straley, C.; Tutunjian, P.; Vinegar, H. Core Analysis by Low-field NMR. Log. Anal. 1997, 38, SPWLA-1997-v38n2a3. [Google Scholar]
- Vincent, B.; Fleury, M.; Santerre, Y.; Brigaud, B. NMR Relaxation of Neritic Carbonates: An Integrated Petrophysical and Petrographical Approach. J. Appl. Geophys 2011, 74, 38–58. [Google Scholar] [CrossRef]
- Jiang, T.; Rylander, E.; Singer, P.M.; Lewis, R.E.; Sinclair, S.M. Integrated Petrophysical Interpretation of Eagle Ford Shale with 1-D and 2-D Nuclear Magnetic Resonance (NMR); New Orleans, Louisiana, 2013; p. SPWLA-2013-LL. [Google Scholar]
- Chen, J.; Hirasaki, G.J.; Flaum, M. Effects of OBM Invasion on Irreducible Water Saturation: Mechanisms and Modifications of NMR Interpretation. In SPE Annu. Tech. Conf. Exhib.; SPE: Houston, Texas, 2004; p. SPE-90141-MS. [Google Scholar] [CrossRef]
- Li, H.; Zhang, Z.; Shi, Y. New Characterization on the Petrophysical Characteristics of Tight Sandstone Reservoirs in Yanchang Formation Ordos Basin China. Energy Explor Exploit 2016, 34, 844–64. [Google Scholar] [CrossRef]
- Wang, H.; Alvarado, V.; McLaughlin, J.F.; Bagdonas, D.A.; Kaszuba, J.P.; Campbell, E.; et al. Low-Field Nuclear Magnetic Resonance Characterization of Carbonate and Sandstone Reservoirs From Rock Spring Uplift of Wyoming. J. Geophys Res. Solid Earth 2018, 123, 7444–60. [Google Scholar] [CrossRef]
- Da Silva, P.N.; Gonçalves, E.C.; Rios, E.H.; Muhammad, A.; Moss, A.; Pritchard, T.; et al. Automatic Classification of Carbonate Rocks Permeability from 1H NMR Relaxation Data. Expert Syst. Appl. 2015, 42, 4299–309. [Google Scholar] [CrossRef]
- Wang, F.-F.; Tang, T.-Z.; Liu, T.-Y.; Zhang, H.-N. Evaluation of the Pore Structure of Reservoirs Based on NMR T 2 Spectrum Decomposition. Appl. Magn. Reson 2016, 47, 361–73. [Google Scholar] [CrossRef]
- Odusina, E.; Sondergeld, C.; Rai, C. An NMR Study on Shale Wettability. In Can. Unconv. Resour. Conf.; SPE: Calgary, Alberta, Canada, 2011; p. SPE-147371-MS. [Google Scholar] [CrossRef]
- Yang, D.; Kausik, R. 23 Na and1 H NMR Relaxometry of Shale at High Magnetic Field. Energy Fuels 2016, 30, 4509–19. [Google Scholar] [CrossRef]
- Ok, S.; Fazlyyyakhmatov, M. Crude Oil Analysis by Low-Field NMR Relaxometry. Magn. Reson Chem. 2026, 64, 568–83. [Google Scholar] [CrossRef] [PubMed]
- Ge, X.; Myers, M.T.; Liu, J.; Fan, Y.; Zahid, M.A.; Zhao, J.; et al. Determining the Transverse Surface Relaxivity of Reservoir Rocks: A Critical Review and Perspective. Mar. Pet. Geol. 2021, 126, 104934. [Google Scholar] [CrossRef]
- Birdwell, J.E.; Washburn, K.E. Rapid Analysis of Kerogen Hydrogen-to-Carbon Ratios in Shale and Mudrocks by Laser-Induced Breakdown Spectroscopy. Energy Fuels 2015, 29, 6999–7004. [Google Scholar] [CrossRef]
- Dai, X.; Wei, J.; Yang, Y.; Wang, A.; Zhang, D.; Shen, A.; et al. Nuclear Magnetic Resonance Investigation of Imbibition and CO2 Huff-and-Puff Enhanced Oil Recovery in Shale Porous Media. Energy Fuels 2025, 39, 19274–85. [Google Scholar] [CrossRef]
- Liu, K.; Gentzis, T.; Carvajal-Ortiz, H.; Xie, Z.H.; Ostadhassan, M. Experimental Investigation of Solid Organic Matter with a 2D NMR T1 – T2 Map. Energy Fuels 2021, 35, 15709–20. [Google Scholar] [CrossRef]
- Yan, W.; Sun, J.; Cheng, Z.; Li, J.; Sun, Y.; Shao, W.; et al. Petrophysical Characterization of Tight Oil Formations Using 1D and 2D NMR. Fuel 2017, 206, 89–98. [Google Scholar] [CrossRef]
- Li, Z.; Yao, Y.; Zhu, X. Revealing Fluid Dynamics in Unconventional Reservoir Rocks: A Novel Approach of T1-T2 Analysis. Geosci. Front 2026, 17, 102186. [Google Scholar] [CrossRef]
- Katika, K.; Saidian, M.; Prasad, M.; Fabricius, I.L. Low-Field NMR Spectrometry of Chalk and Argillaceous Sandstones: Rock-Fluid Affinity Assessed from T1/T2 Ratio. Petrophysics – SPWLA J. Form. Eval. Reserv Descr. 2017, 58, 126–40. [Google Scholar]
- Korb, J.-P.; Ferrante, G.; Bubici, S.; Mallett, M. New Instrumental Platform for the Exploitation of the Field-dependence of T1 in Rock Core Analysis and Petroleum Fluids: Application to T1-T2 Correlation Maps. Diffus Fundam. 2014, 22. [Google Scholar] [CrossRef]
- Tian, B.; Deng, X.; Pan, C.; Meng, X. An Investigation on the Pore Structure Characterization of Sandstone Using a Scanning Electron Microscope and an Online Nuclear Magnetic Resonance System. Appl. Sci. 2024, 14, 7063. [Google Scholar] [CrossRef]
- Gu, Z.; Wang, S.; Guo, P.; Zhao, W. Utilizing Differences in Mercury Injection Capillary Pressure and Nuclear Magnetic Resonance Pore Size Distributions for Enhanced Rock Quality Evaluation: A Winland-Style Approach with Physical Meaning. Appl. Sci. 2024, 14, 1881. [Google Scholar] [CrossRef]
- Zhao, L.; Wang, S.; Wang, J.; Hou, J.; Zeng, X.; Zheng, T. Study on Quantitative Characterization Method of Micro-Pore Structure of Carbonate Reservoir Based on Nuclear Magnetic Resonance Logging. Processes 2025, 13, 729. [Google Scholar] [CrossRef]
- Song, Y.-Q.; Souza, A.; Vembusubramanian, M.; Tang, Y.; Fellah, K.; Feng, L.; et al. Multiphysics NMR Correlation Spectroscopy. J. Magn. Reson 2021, 322, 106887. [Google Scholar] [CrossRef] [PubMed]
- Fajt, M.; Fheed, A.; Machowski, G.; Sowiżdżał, A.; Krzyżak, A.T. Modified Low-Field NMR Method for Improved Pore Space Analysis in Tight Fe-Bearing Siliciclastic and Extrusive Rocks. Lithosphere 2024, 2024, lithosphere_2024_157. [Google Scholar] [CrossRef]
- Osment, P.A.; Packer, K.J.; Taylor, M.J.; Attard, J.J.; Carpenter, T.A.; Hall, L.D.; et al. NMR Imaging of Fluids in Porous Solids. Philos. Trans. R Soc. Lond. Ser. Phys. Eng. Sci. 1990, 333, 441–52. [Google Scholar] [CrossRef]
- Baldwin, B.A.; Yamanashi, W.S. NMR Imaging of Fluid Saturation Distributions in Cores. Log. Anal. 1991, 32, 536–49. [Google Scholar]
- Dick, M.J.; Veselinovic, D.; Green, D. Review of Recent Developments in NMR Core Analysis. Petrophysics – SPWLA J. Form. Eval. Reserv Descr. 2022, 63, 454–84. [Google Scholar] [CrossRef]
- Wang, C.; Zhang, X.; Yang, T.; Zhou, Z.; Luo, X.; Fan, J.; et al. Stress Sensitivity Mechanism of Pores in Unconsolidated Sandstone Reservoir Using NMR Technology. Geoenergy Sci. Eng. 2024, 240, 212999. [Google Scholar] [CrossRef]
- Liu, M.; Xie, R.; Li, J.; Li, H.; Hu, S.; Zou, Y. A New NMR-data-based Method for Predicting Petrophysical Properties of Tight Sandstone Reservoirs. Energy Geosci. 2023, 4, 100083. [Google Scholar] [CrossRef]
- Tang, M.; Zhang, T.; Ma, Y.; Hao, D.; Yang, X.; Li, Y. Experimental Study on Fracture Effect on the Multiphase Flow in Ultra-low Permeability Sandstone Based on LF-NMR. Geoenergy Sci. Eng. 2023, 222, 211399. [Google Scholar] [CrossRef]
- Yan, W.; Sun, J.; Dong, H.; Cui, L. Investigating NMR-based Absolute and Relative Permeability Models of Sandstone Using Digital Rock Techniques. J. Pet. Sci. Eng. 2021, 207, 109105. [Google Scholar] [CrossRef]
- Teng, Y.; Er, C.; Zhao, J.; Guo, Q.; Shen, C.; Tan, S. Pore Structure Characterization Based on NMR Experiment: A Case from the Shanxi Formation Tight Sandstones in the Daning-Jixian Area, Eastern Ordos Basin. Energy Geosci. 2023, 4, 100192. [Google Scholar] [CrossRef]
- Yu, H.; Cheng, H.; Wang, F.; Zhou, D.; Lian, L.; Yan, G. Experimental Study and Mathematical Model of Residual Oil Distribution during Gas Flooding in Unconventional Oil Reservoirs with Low-Field NMR. Energy Fuels 2021, 35, 7799–807. [Google Scholar] [CrossRef]
- Jácomo, M.H.; Hartmann, G.A.; Lucas-Oliveira, E.; Rojas, D.; Leite, E.P. Estimating Nuclear Magnetic Resonance Transverse Surface Relaxivity in pre-salt Carbonates of the Santos Basin, Brazil. J. Appl. Geophys 2025, 242, 105913. [Google Scholar] [CrossRef]
- Elsayed, M.; El-Husseiny, A.; Hussaini, S.R.; Mahmoud, M. Experimental and Simulation Study on the Estimation of Surface Relaxivity of Clay Minerals. Geoenergy Sci. Eng. 2023, 230, 212260. [Google Scholar] [CrossRef]
- Kellal, S.; Nandito, D.; El-Husseiny, A.; Hassan, A.; Hanafy, S.M. Machine learning-driven permeability prediction in carbonates and sandstones using NMR relaxation data. Artif. Intell. Geosci. 2026, 7, 100193. [Google Scholar] [CrossRef]
Figure 1.
Dunham's classification of carbonate rocks. [47] Copyright 2016 Elsevier.
Figure 1.
Dunham's classification of carbonate rocks. [47] Copyright 2016 Elsevier.
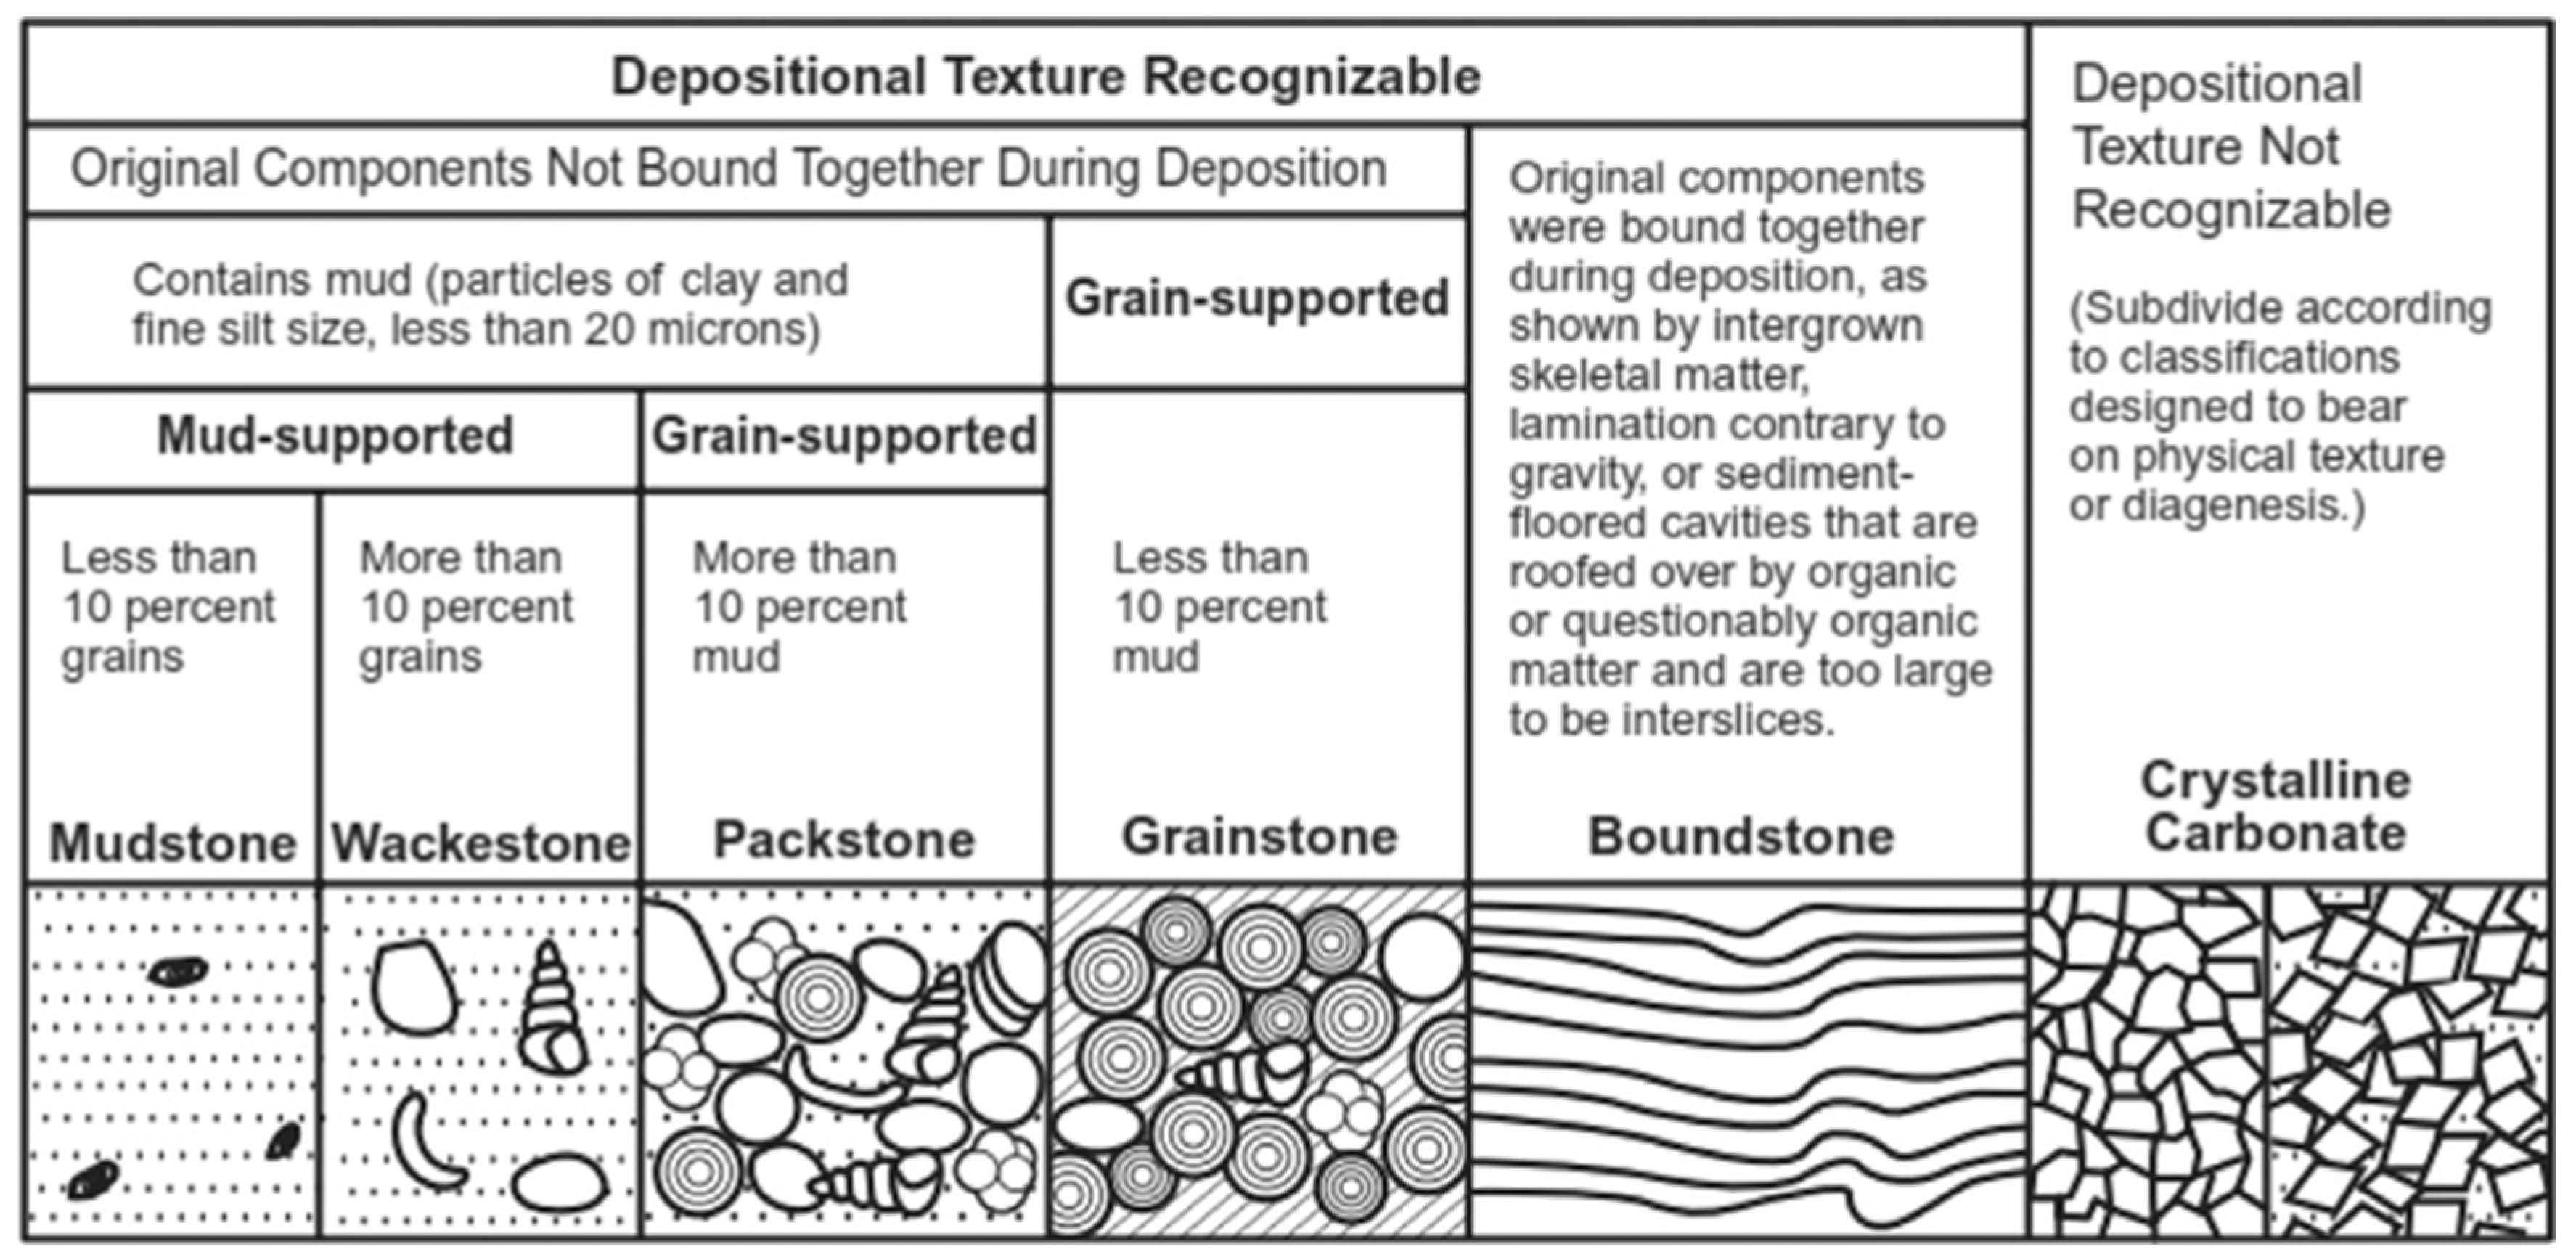
Figure 2.
This Diagram of a pore grouping after [53,54]. (A) Primary pores, (B) secondary or diagenetic pores, with isolated and joined varieties [12]. Copyright 2005 Springer Nature.
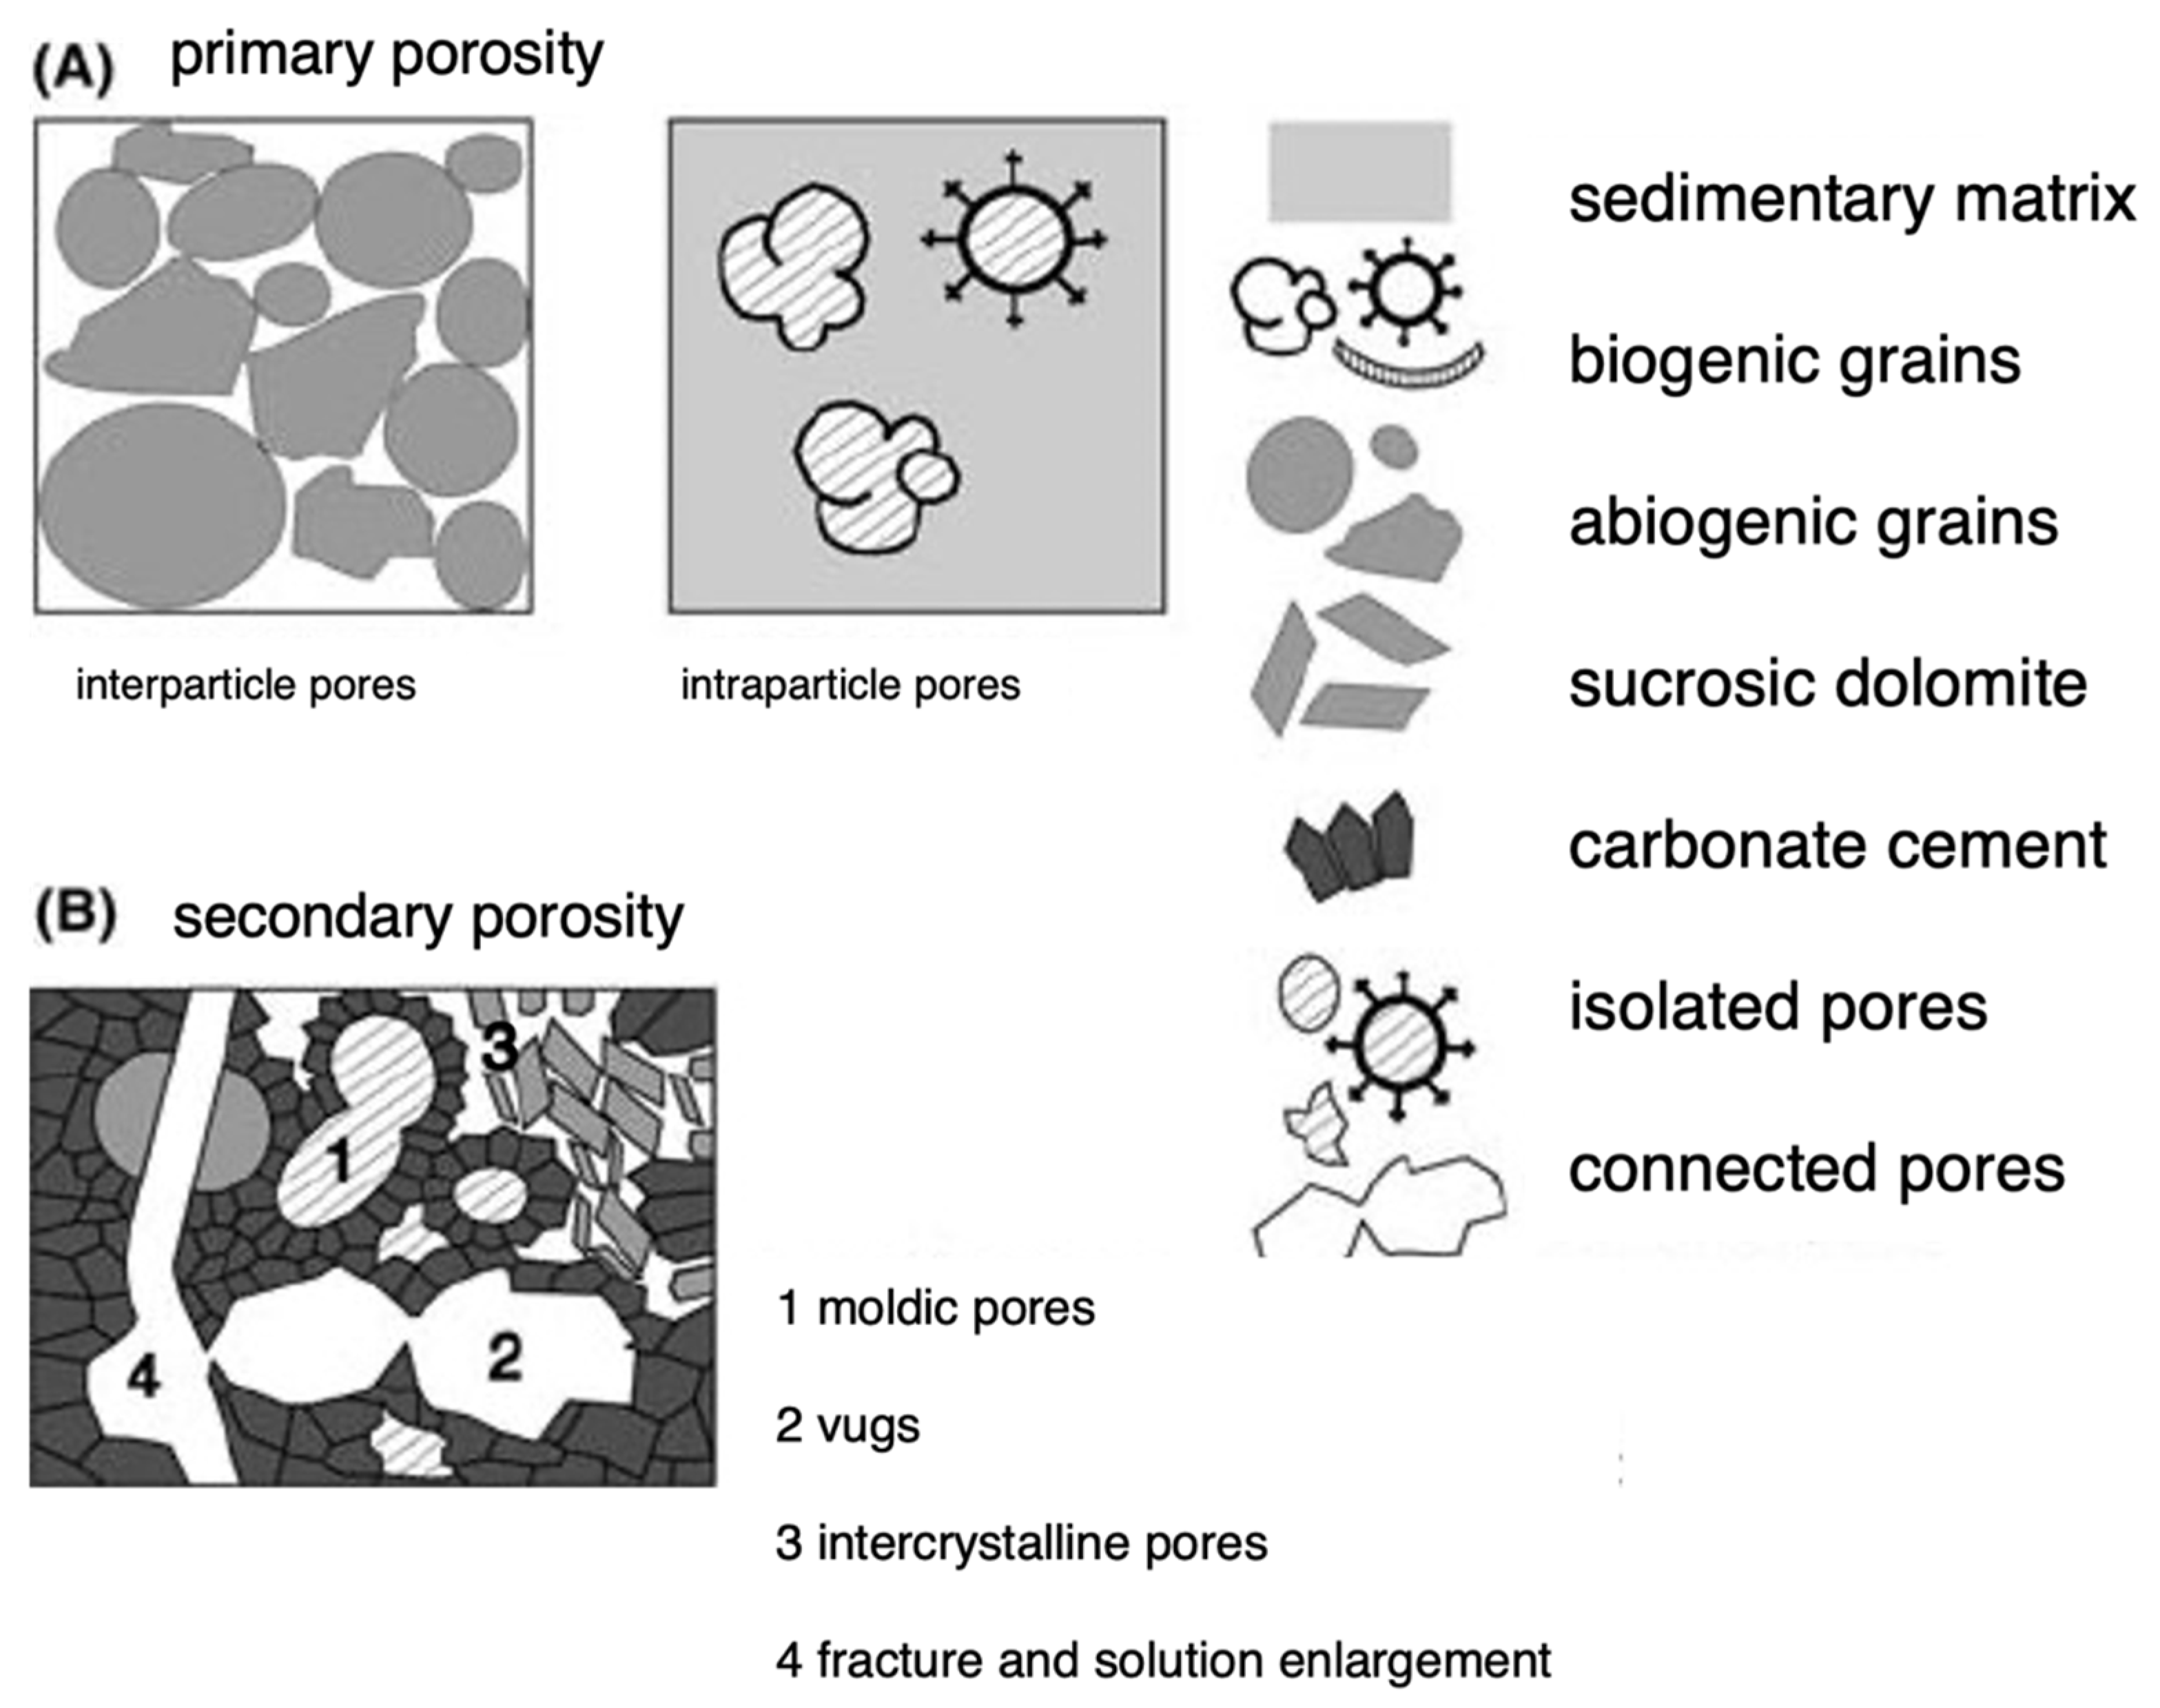
Figure 3.
Predicted NMR relaxation behavior for pores of different sizes [68]. For the square panels, the pores are shown in black, while the solid matrix is in white [13]. Copyright 2014 Springer Nature.
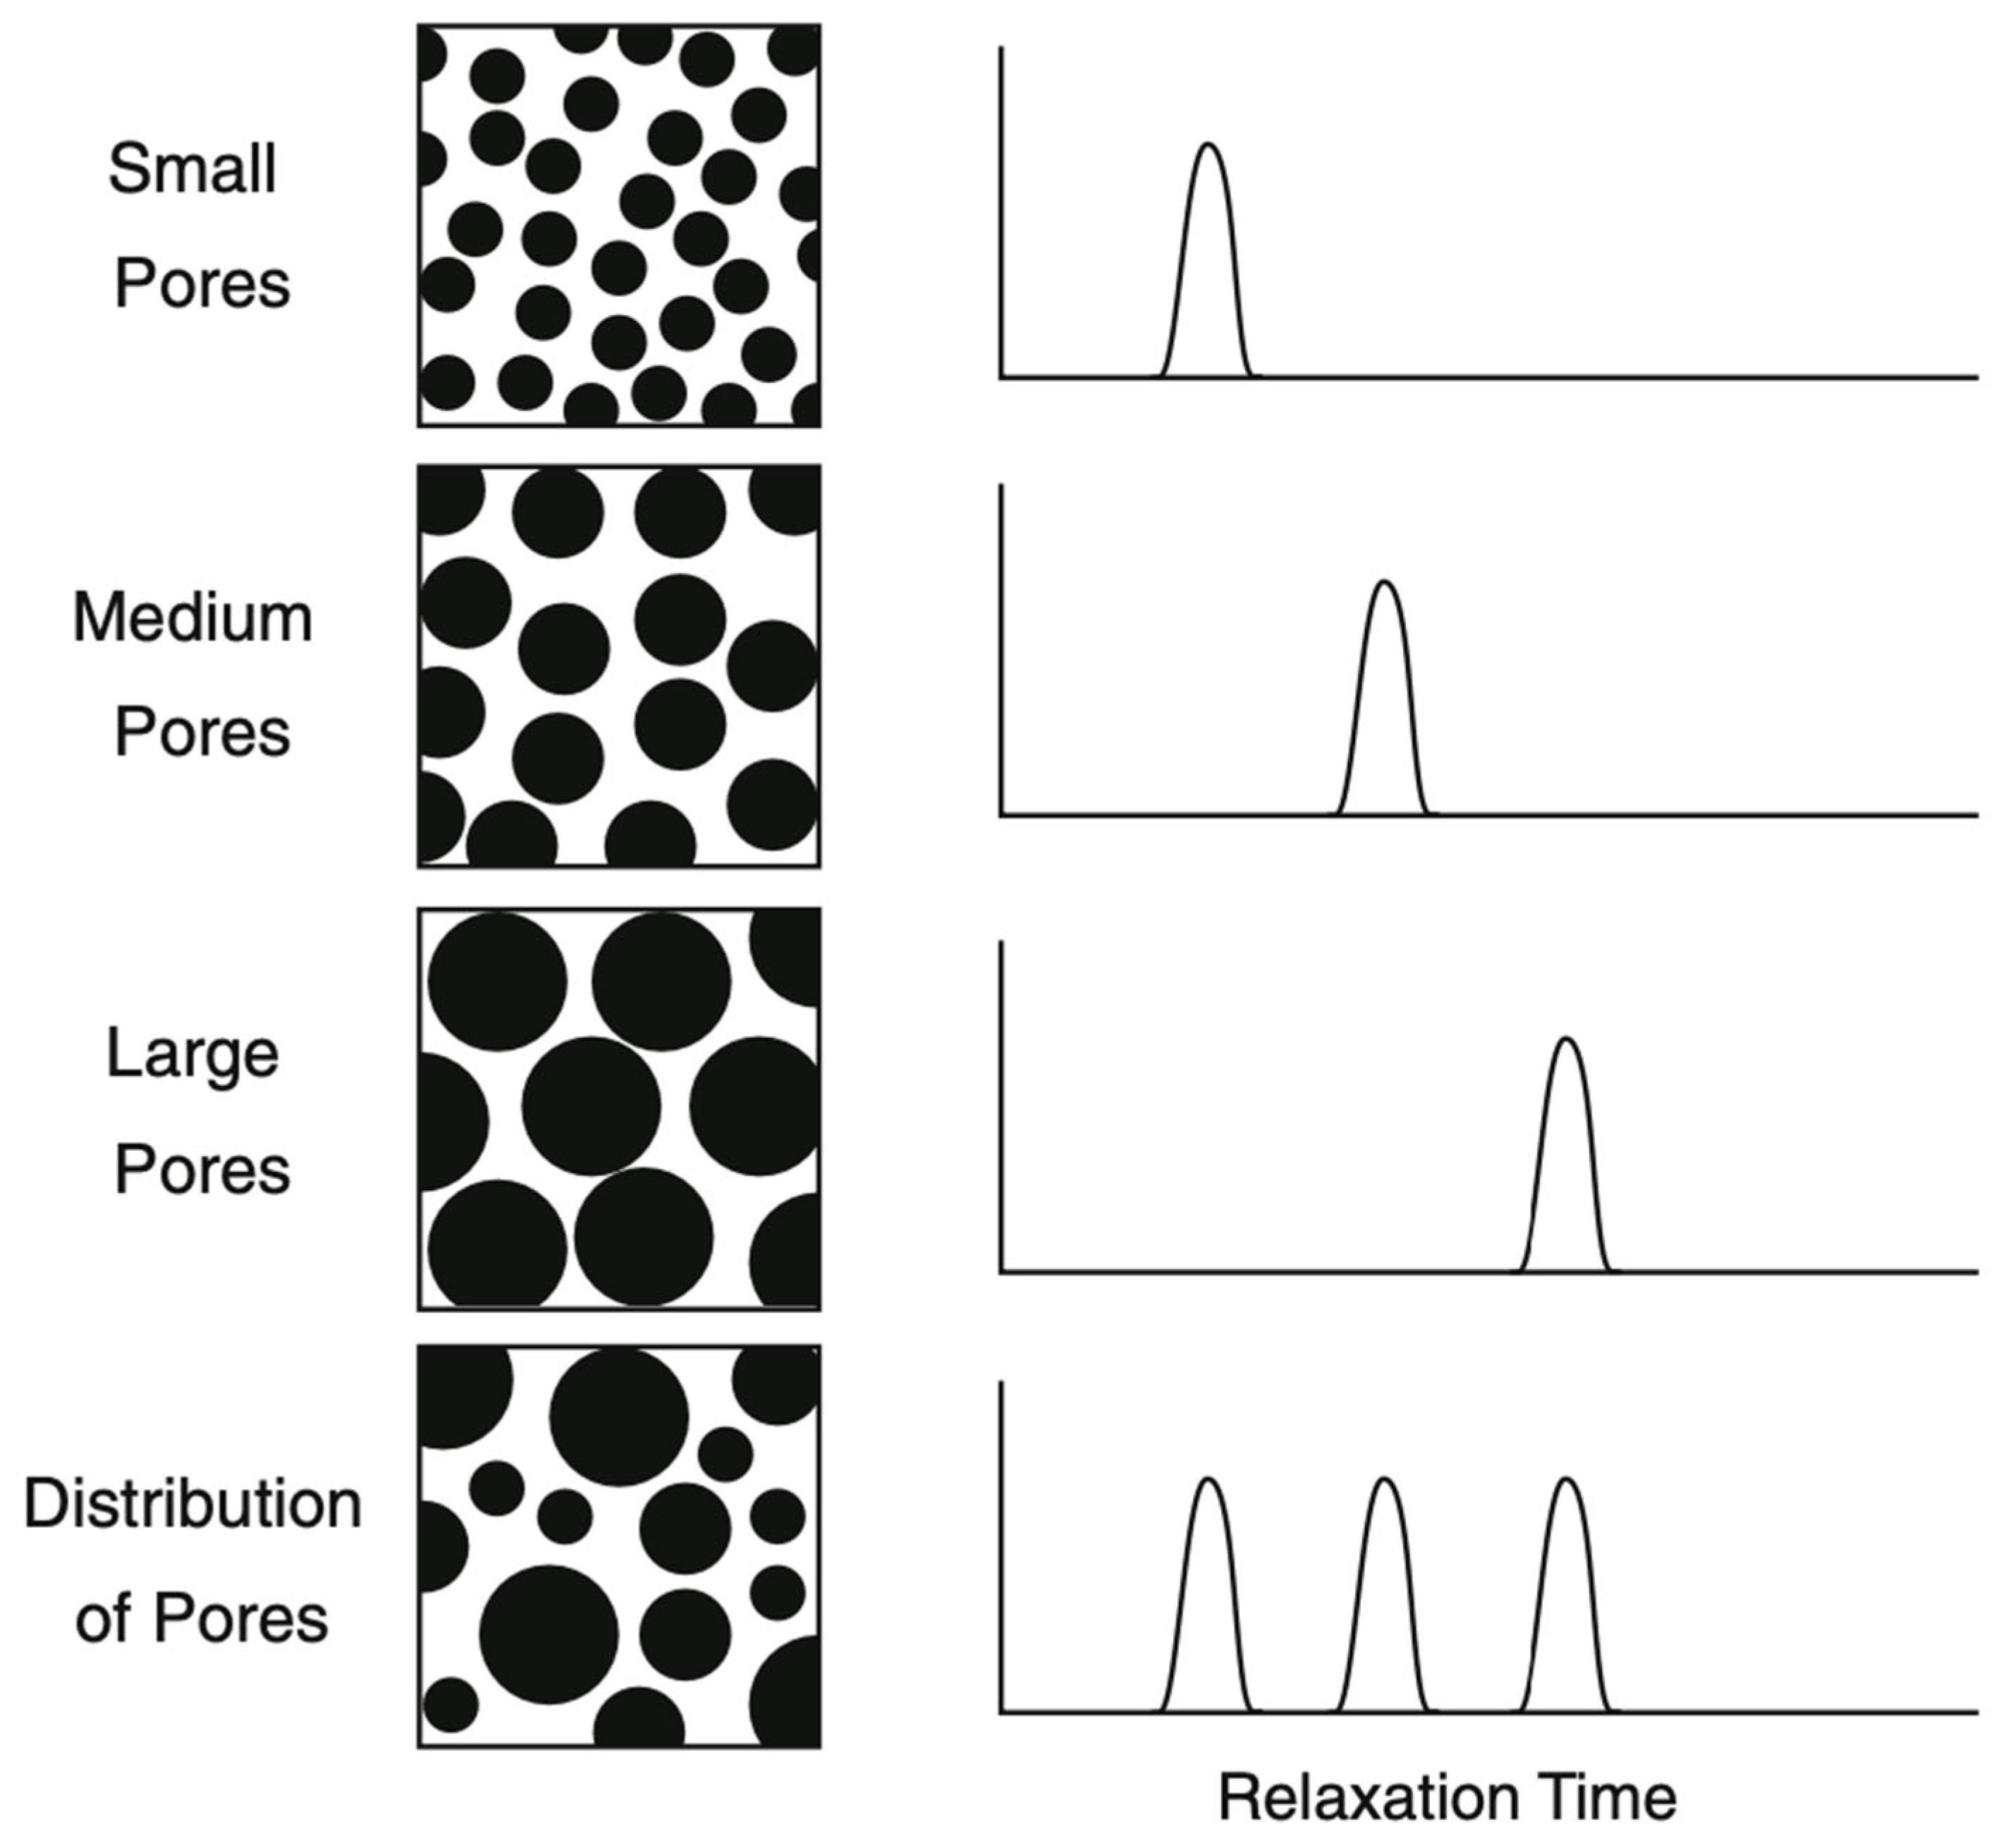
Figure 4.
The CPMG pulse sequence employed for obtaining T2 values, with the echo train repeated an even number of cycles, denoted by n. Adapted from Ph.D. Thesis [75].
Figure 4.
The CPMG pulse sequence employed for obtaining T2 values, with the echo train repeated an even number of cycles, denoted by n. Adapted from Ph.D. Thesis [75].
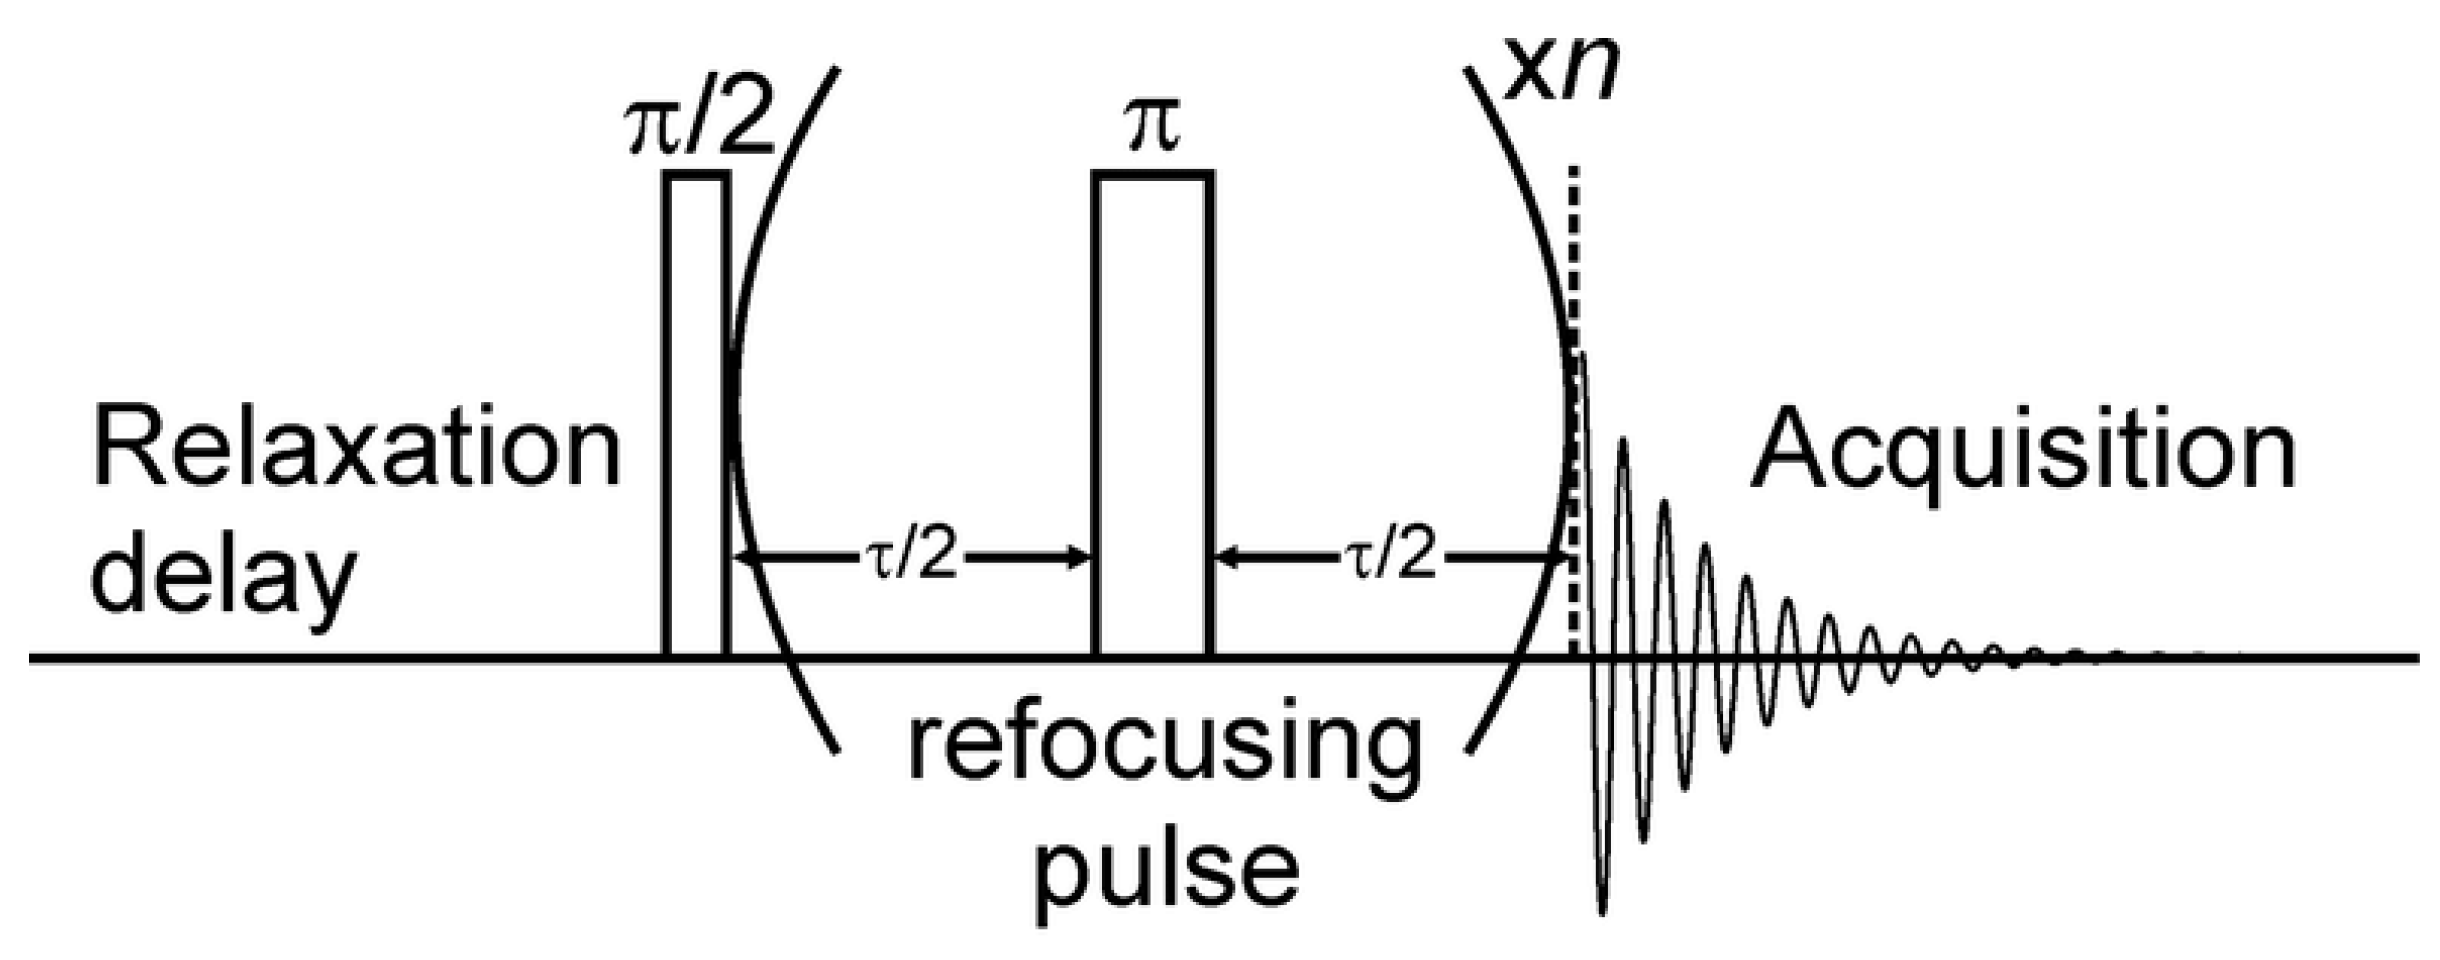
Figure 5.
Inversion recovery pulse sequence applied for measuring T1 relaxation times. Adapted from Ph.D. Thesis [75].
Figure 5.
Inversion recovery pulse sequence applied for measuring T1 relaxation times. Adapted from Ph.D. Thesis [75].
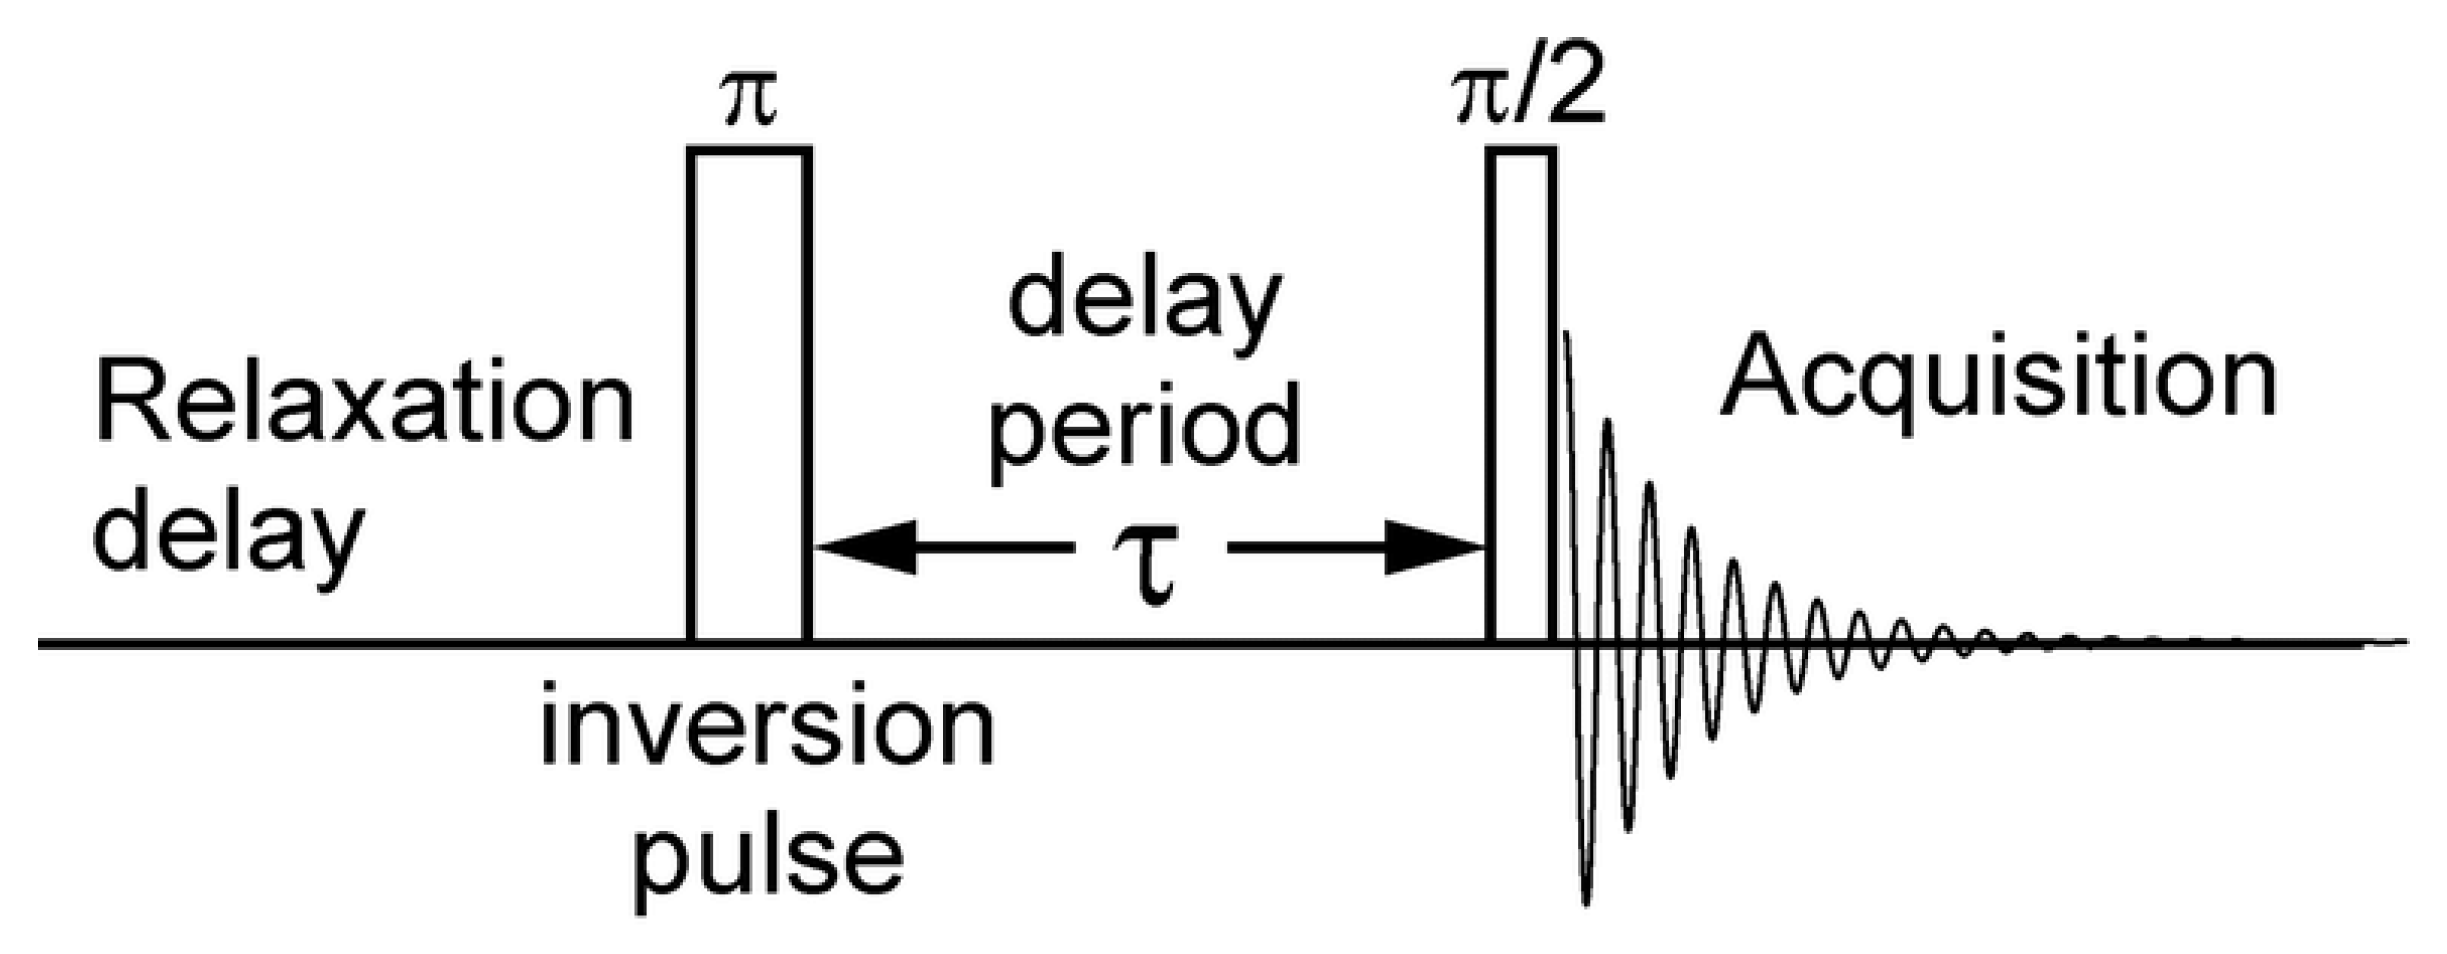
Figure 6.
Saturation recovery pulse sequence applied for measuring T1 relaxation times.
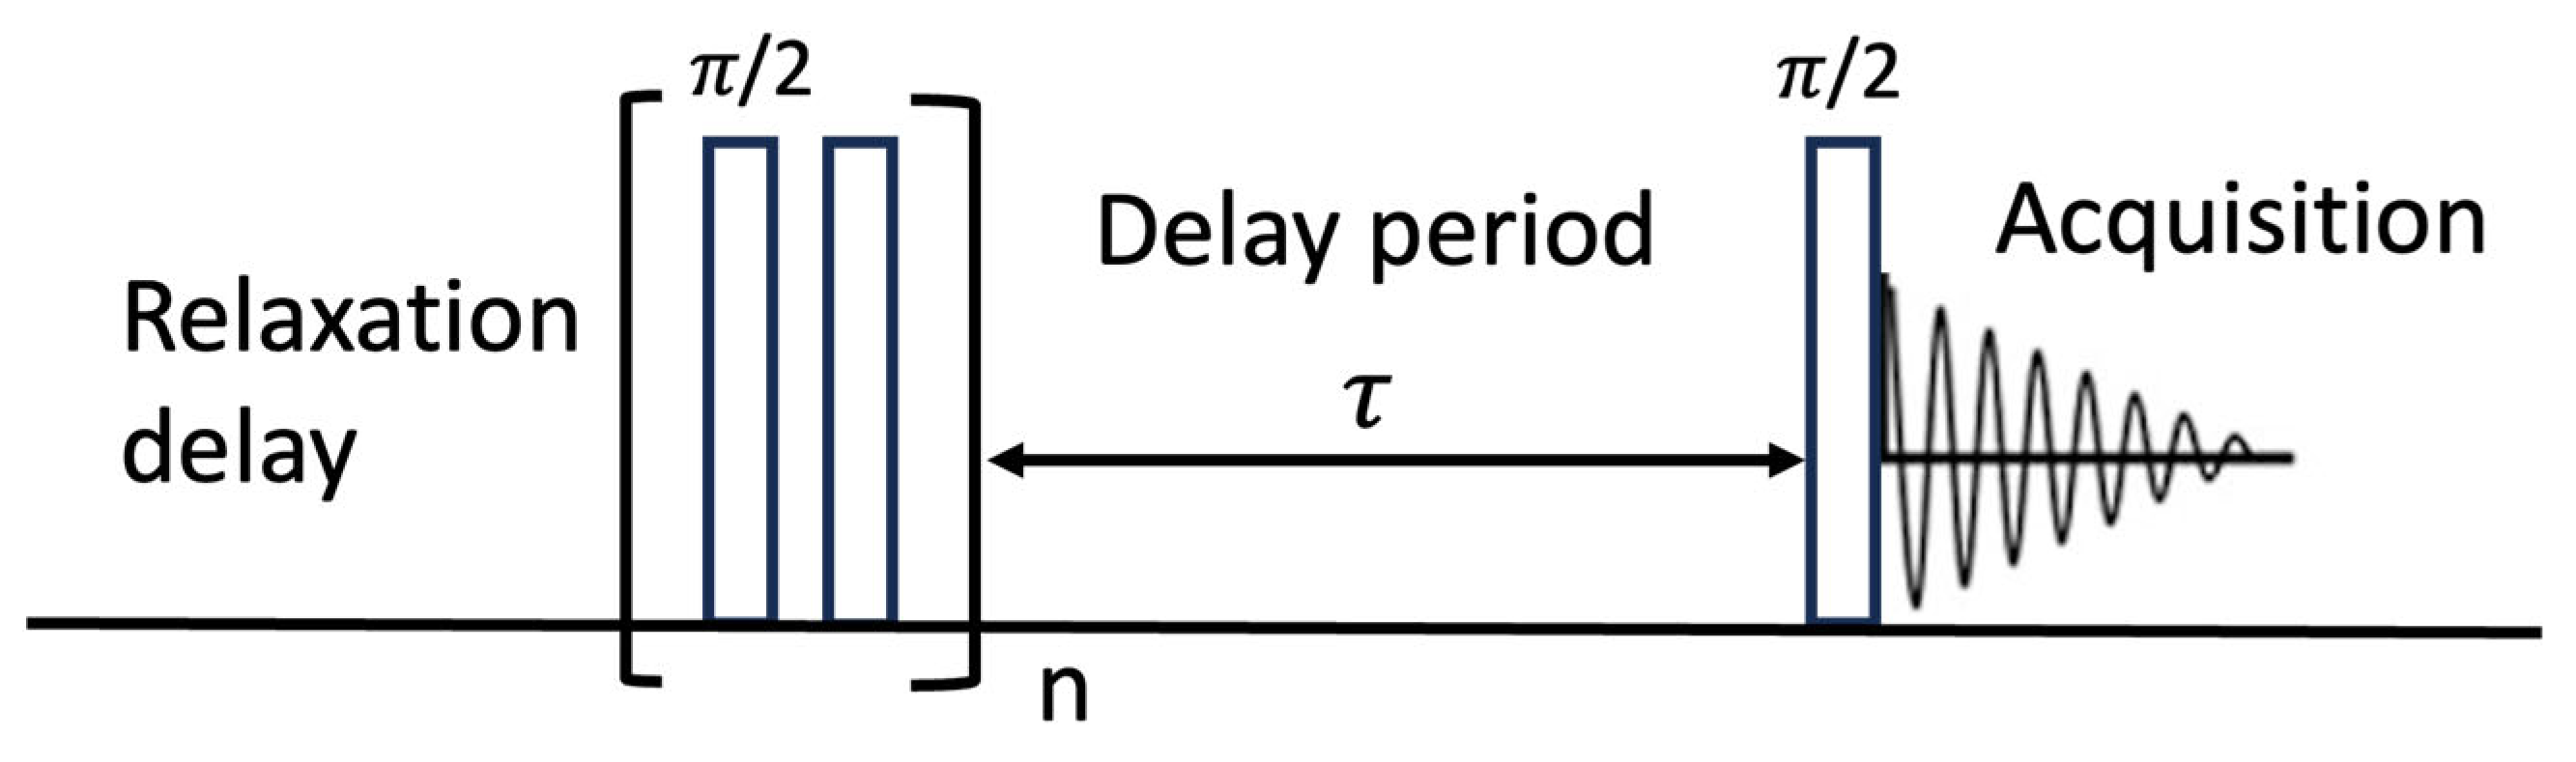
Figure 7.
Schematic of a T2 decay (a), transformation into a T2 distribution (b), and interpretation of the T2 distribution (c) [12]. Copyright 2005 Springer Nature.
Figure 7.
Schematic of a T2 decay (a), transformation into a T2 distribution (b), and interpretation of the T2 distribution (c) [12]. Copyright 2005 Springer Nature.
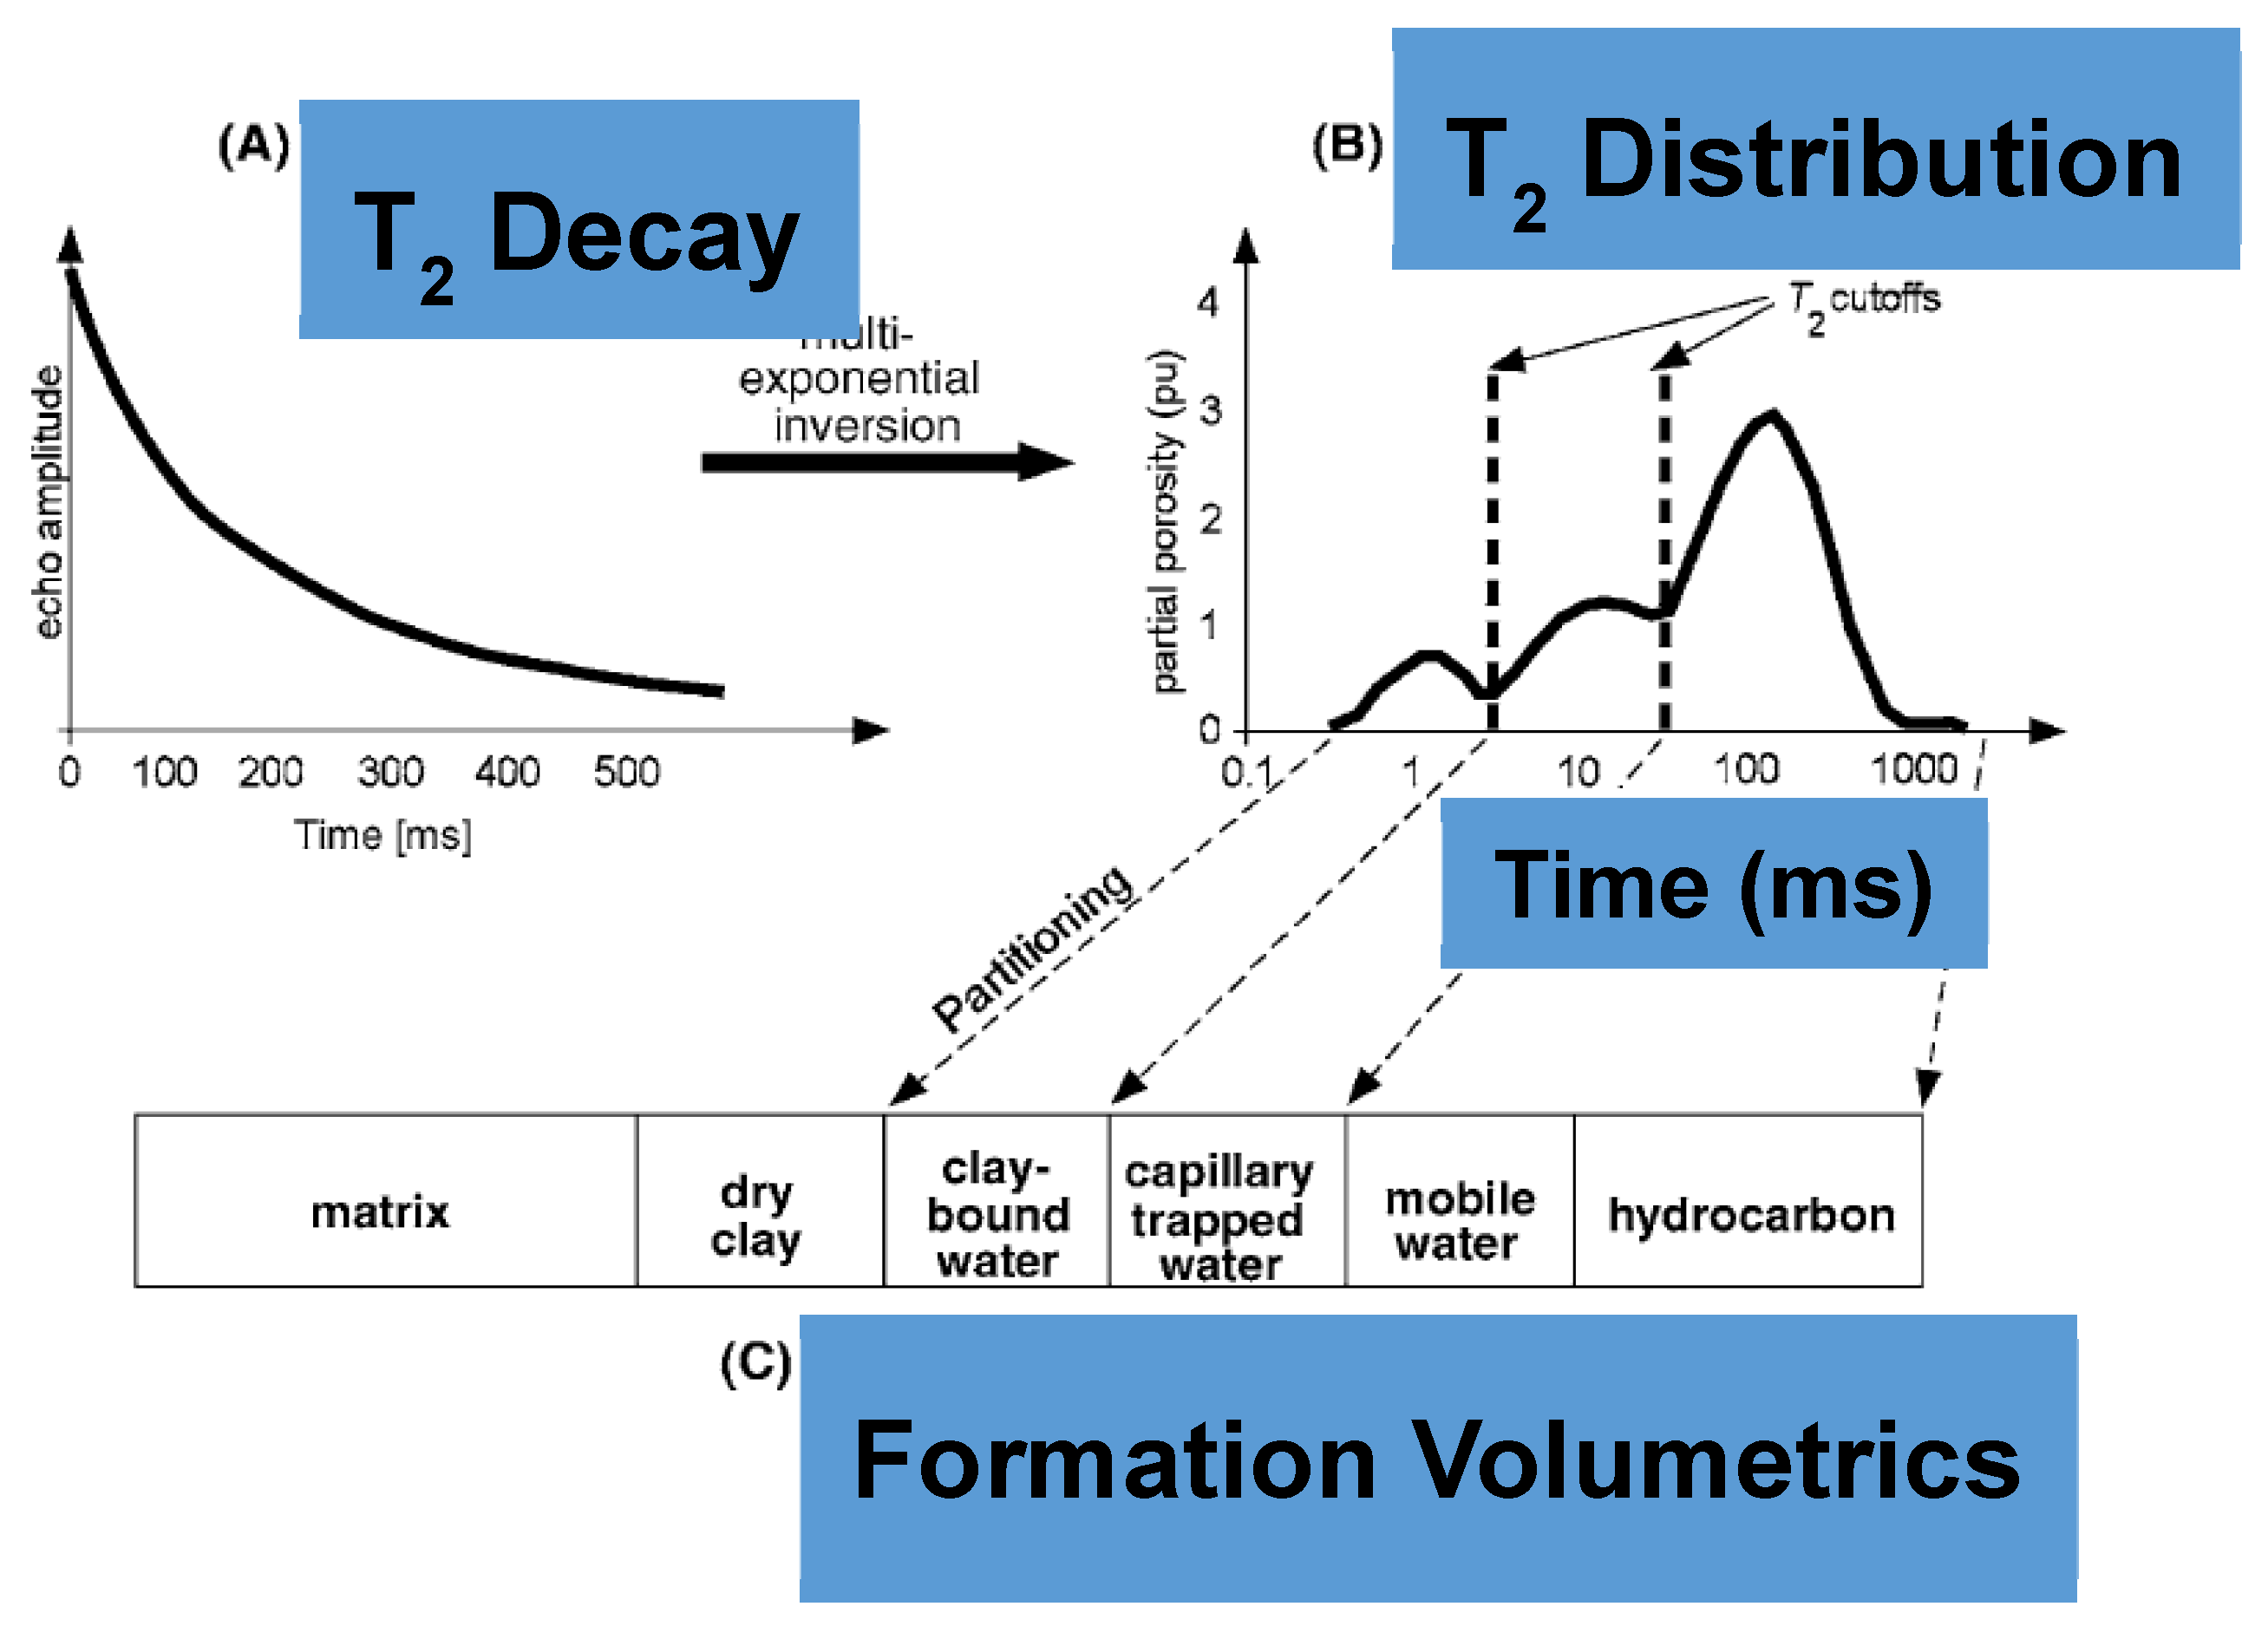
Figure 8.
MRI images (side and front views) of Berea Sandstone, Indiana Limestone, and Madison Limestone. The yellow hue indicated the presence of water in the pore spaces. The Berea Sandstone appears more homogeneous, while Indiana Limestone shows higher water saturation at the top and bottom of the core, and Madison Limestone has larger, more disconnected pores. Copyright 2020 Wiley [92].
Figure 8.
MRI images (side and front views) of Berea Sandstone, Indiana Limestone, and Madison Limestone. The yellow hue indicated the presence of water in the pore spaces. The Berea Sandstone appears more homogeneous, while Indiana Limestone shows higher water saturation at the top and bottom of the core, and Madison Limestone has larger, more disconnected pores. Copyright 2020 Wiley [92].
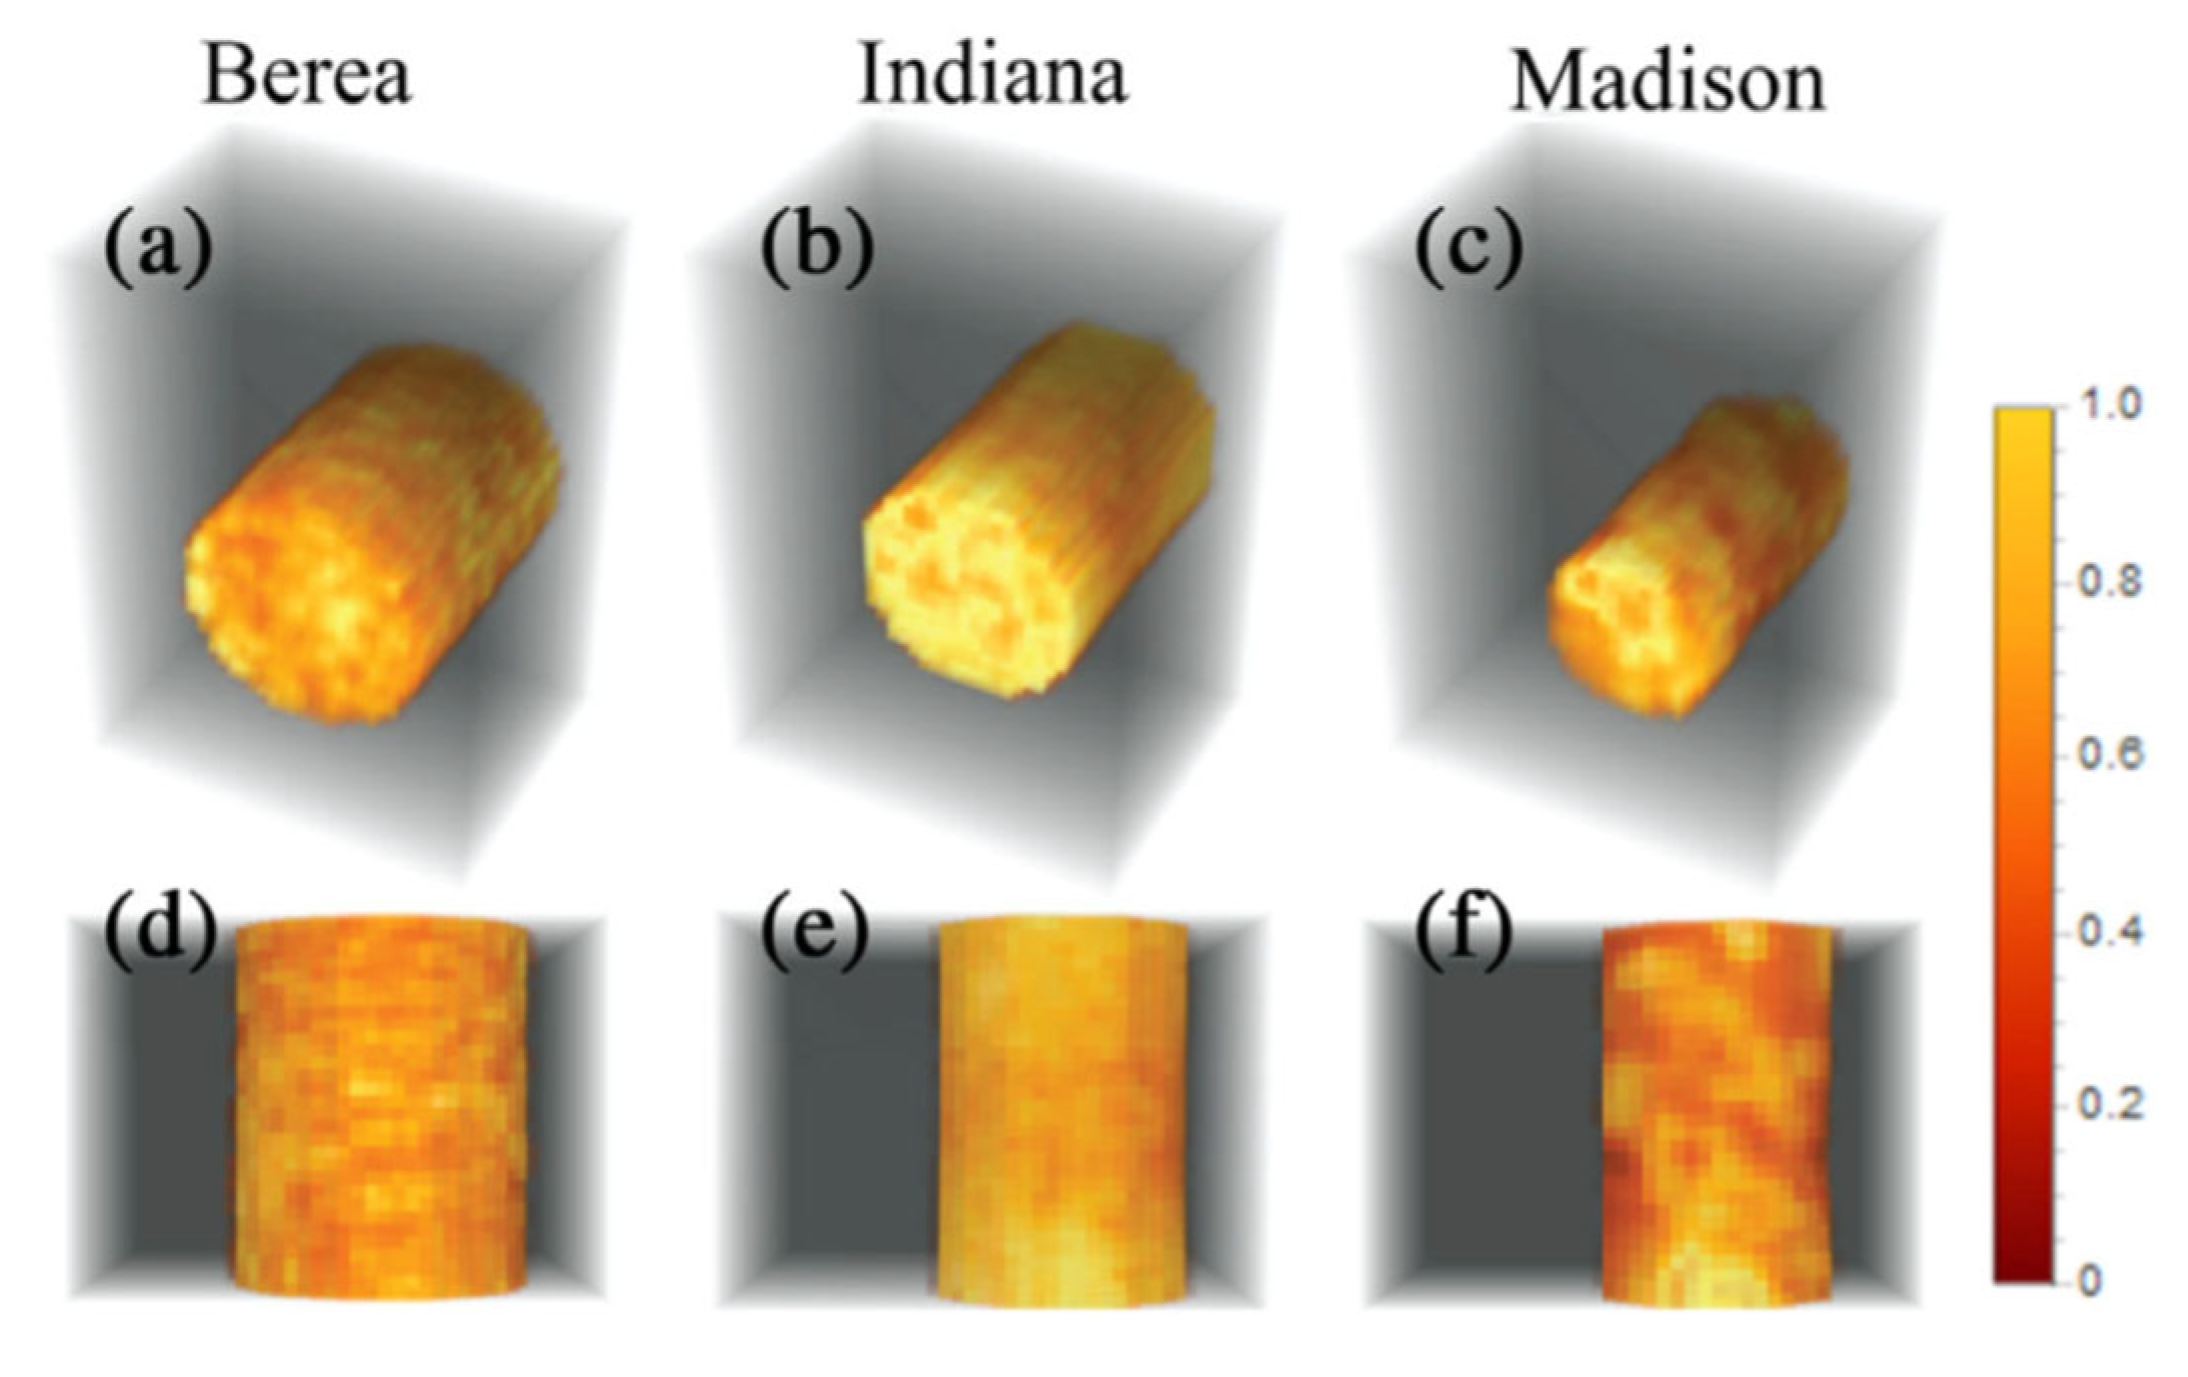
Figure 9.
Schematic diagrams of the high-pressure NMR rock core flooding experimental system setup at the Institute of Rock and Soil Mechanics (IRSM) of the Chinese Academy of Sciences (CAS): a) The NMR rock core experimental setup consists of a fluid injection module, an NMR module, and a fluid production module; b) the schematic diagram of the rock core holder. Copyright 2019 of Journal of Rock Mechanics and Geotechnical Engineering (JRMGE) [91].
Figure 9.
Schematic diagrams of the high-pressure NMR rock core flooding experimental system setup at the Institute of Rock and Soil Mechanics (IRSM) of the Chinese Academy of Sciences (CAS): a) The NMR rock core experimental setup consists of a fluid injection module, an NMR module, and a fluid production module; b) the schematic diagram of the rock core holder. Copyright 2019 of Journal of Rock Mechanics and Geotechnical Engineering (JRMGE) [91].
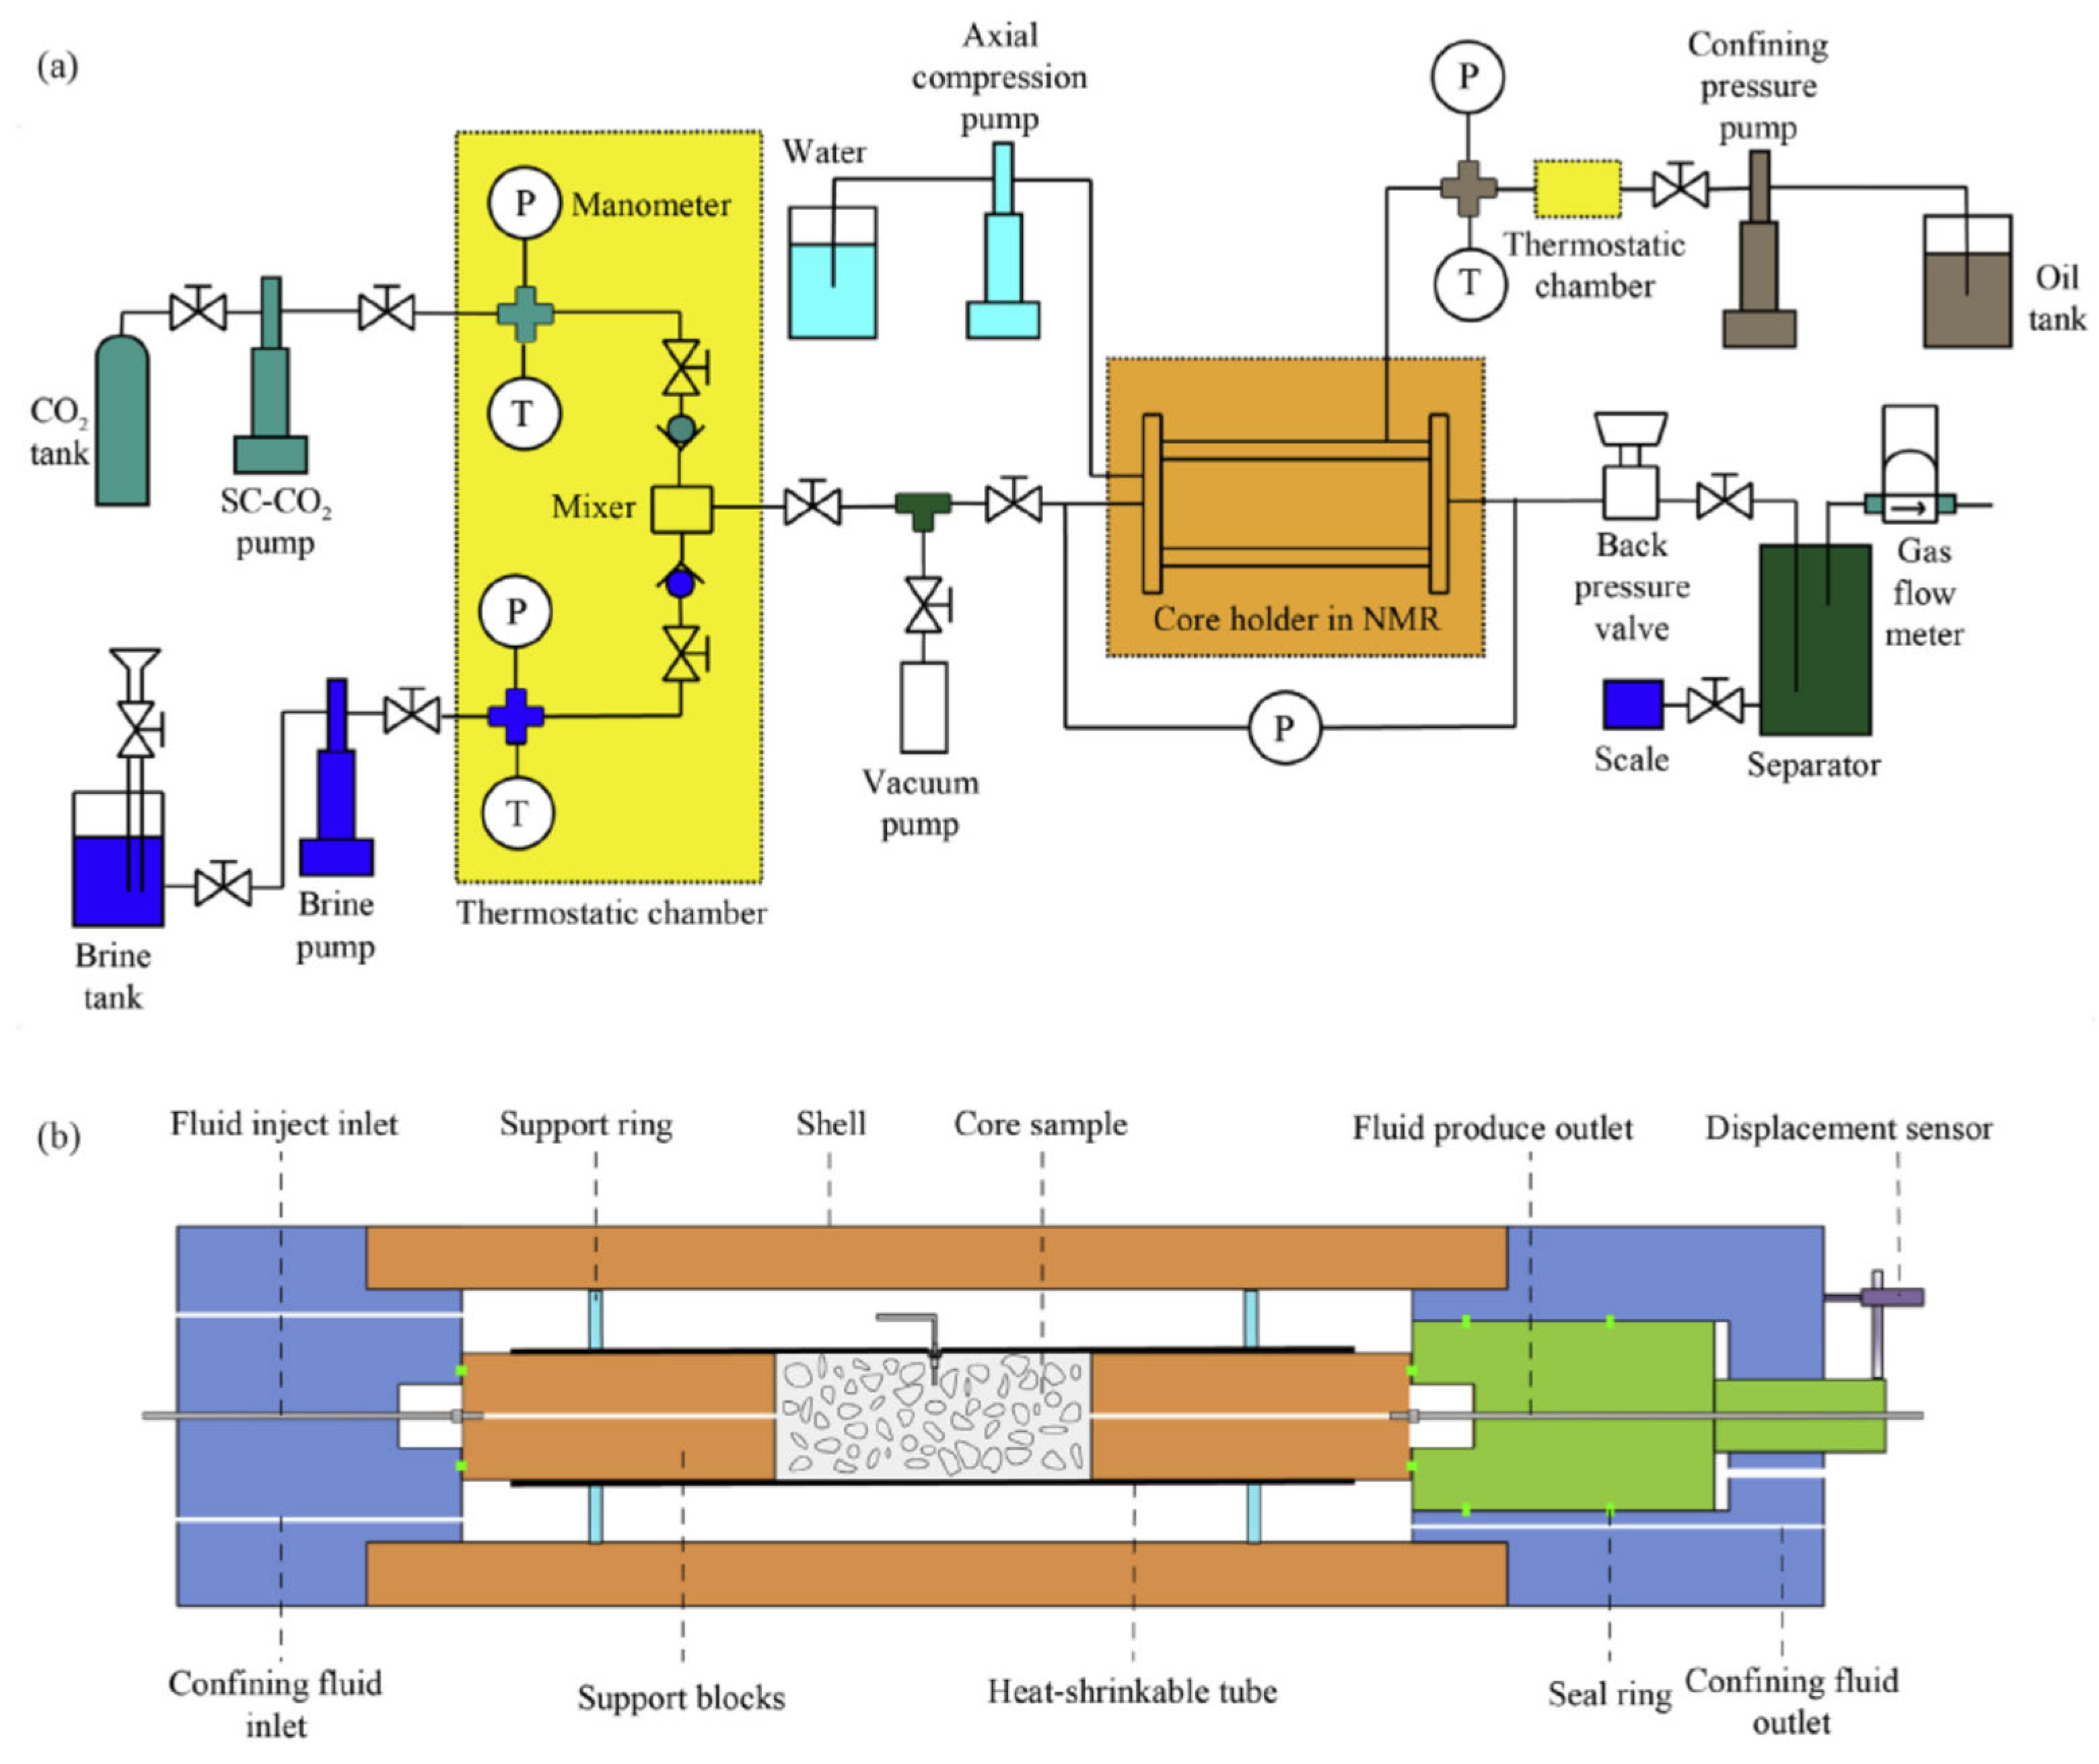
Figure 10.
Schematic of the pioneering research that developed the two equations starting from 1962 to 1973 concerning the Timur-Coates equation, and the SDR equation in 1988. Korringa et al. [94], Seevers [86], Timur [69], Coates and Dumanoir [95], Kenyon et al. [96].
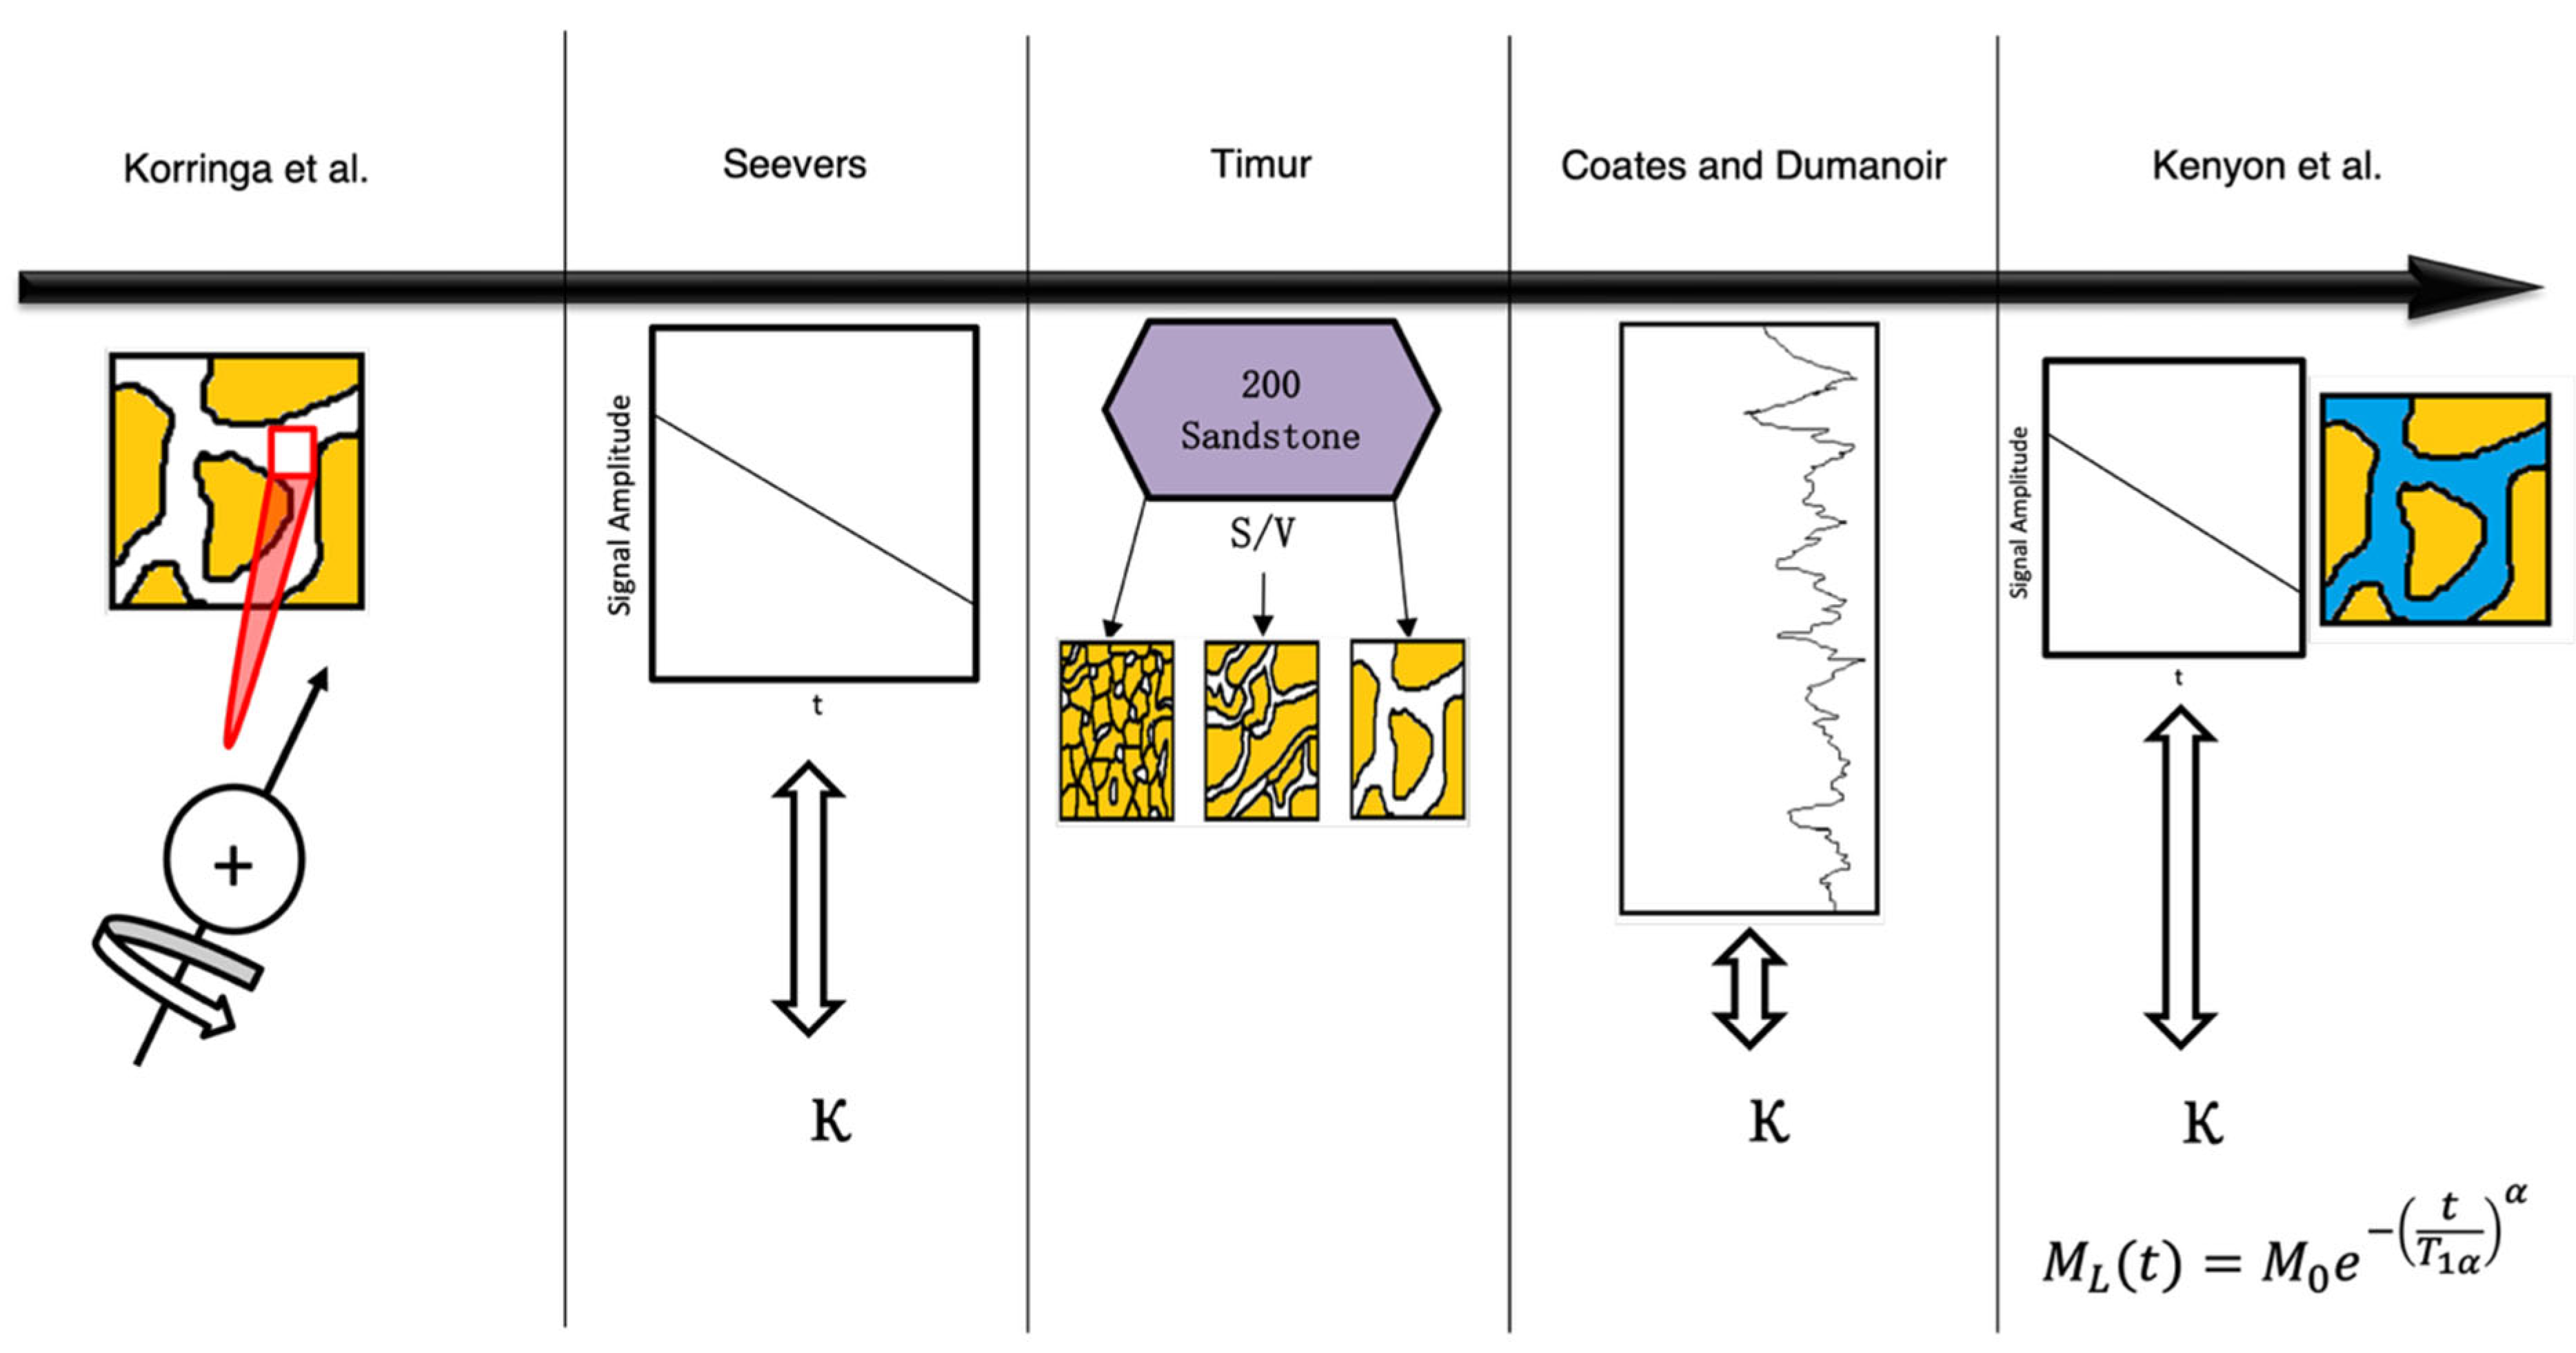
Figure 11.
MRI images of CO2 immiscible displacement in packed glass beads with different glass sizes [142]. The yellow and black regions represent water and CO2, respectively, without NMR signal. Copyright 2017 Elsevier.
Figure 11.
MRI images of CO2 immiscible displacement in packed glass beads with different glass sizes [142]. The yellow and black regions represent water and CO2, respectively, without NMR signal. Copyright 2017 Elsevier.
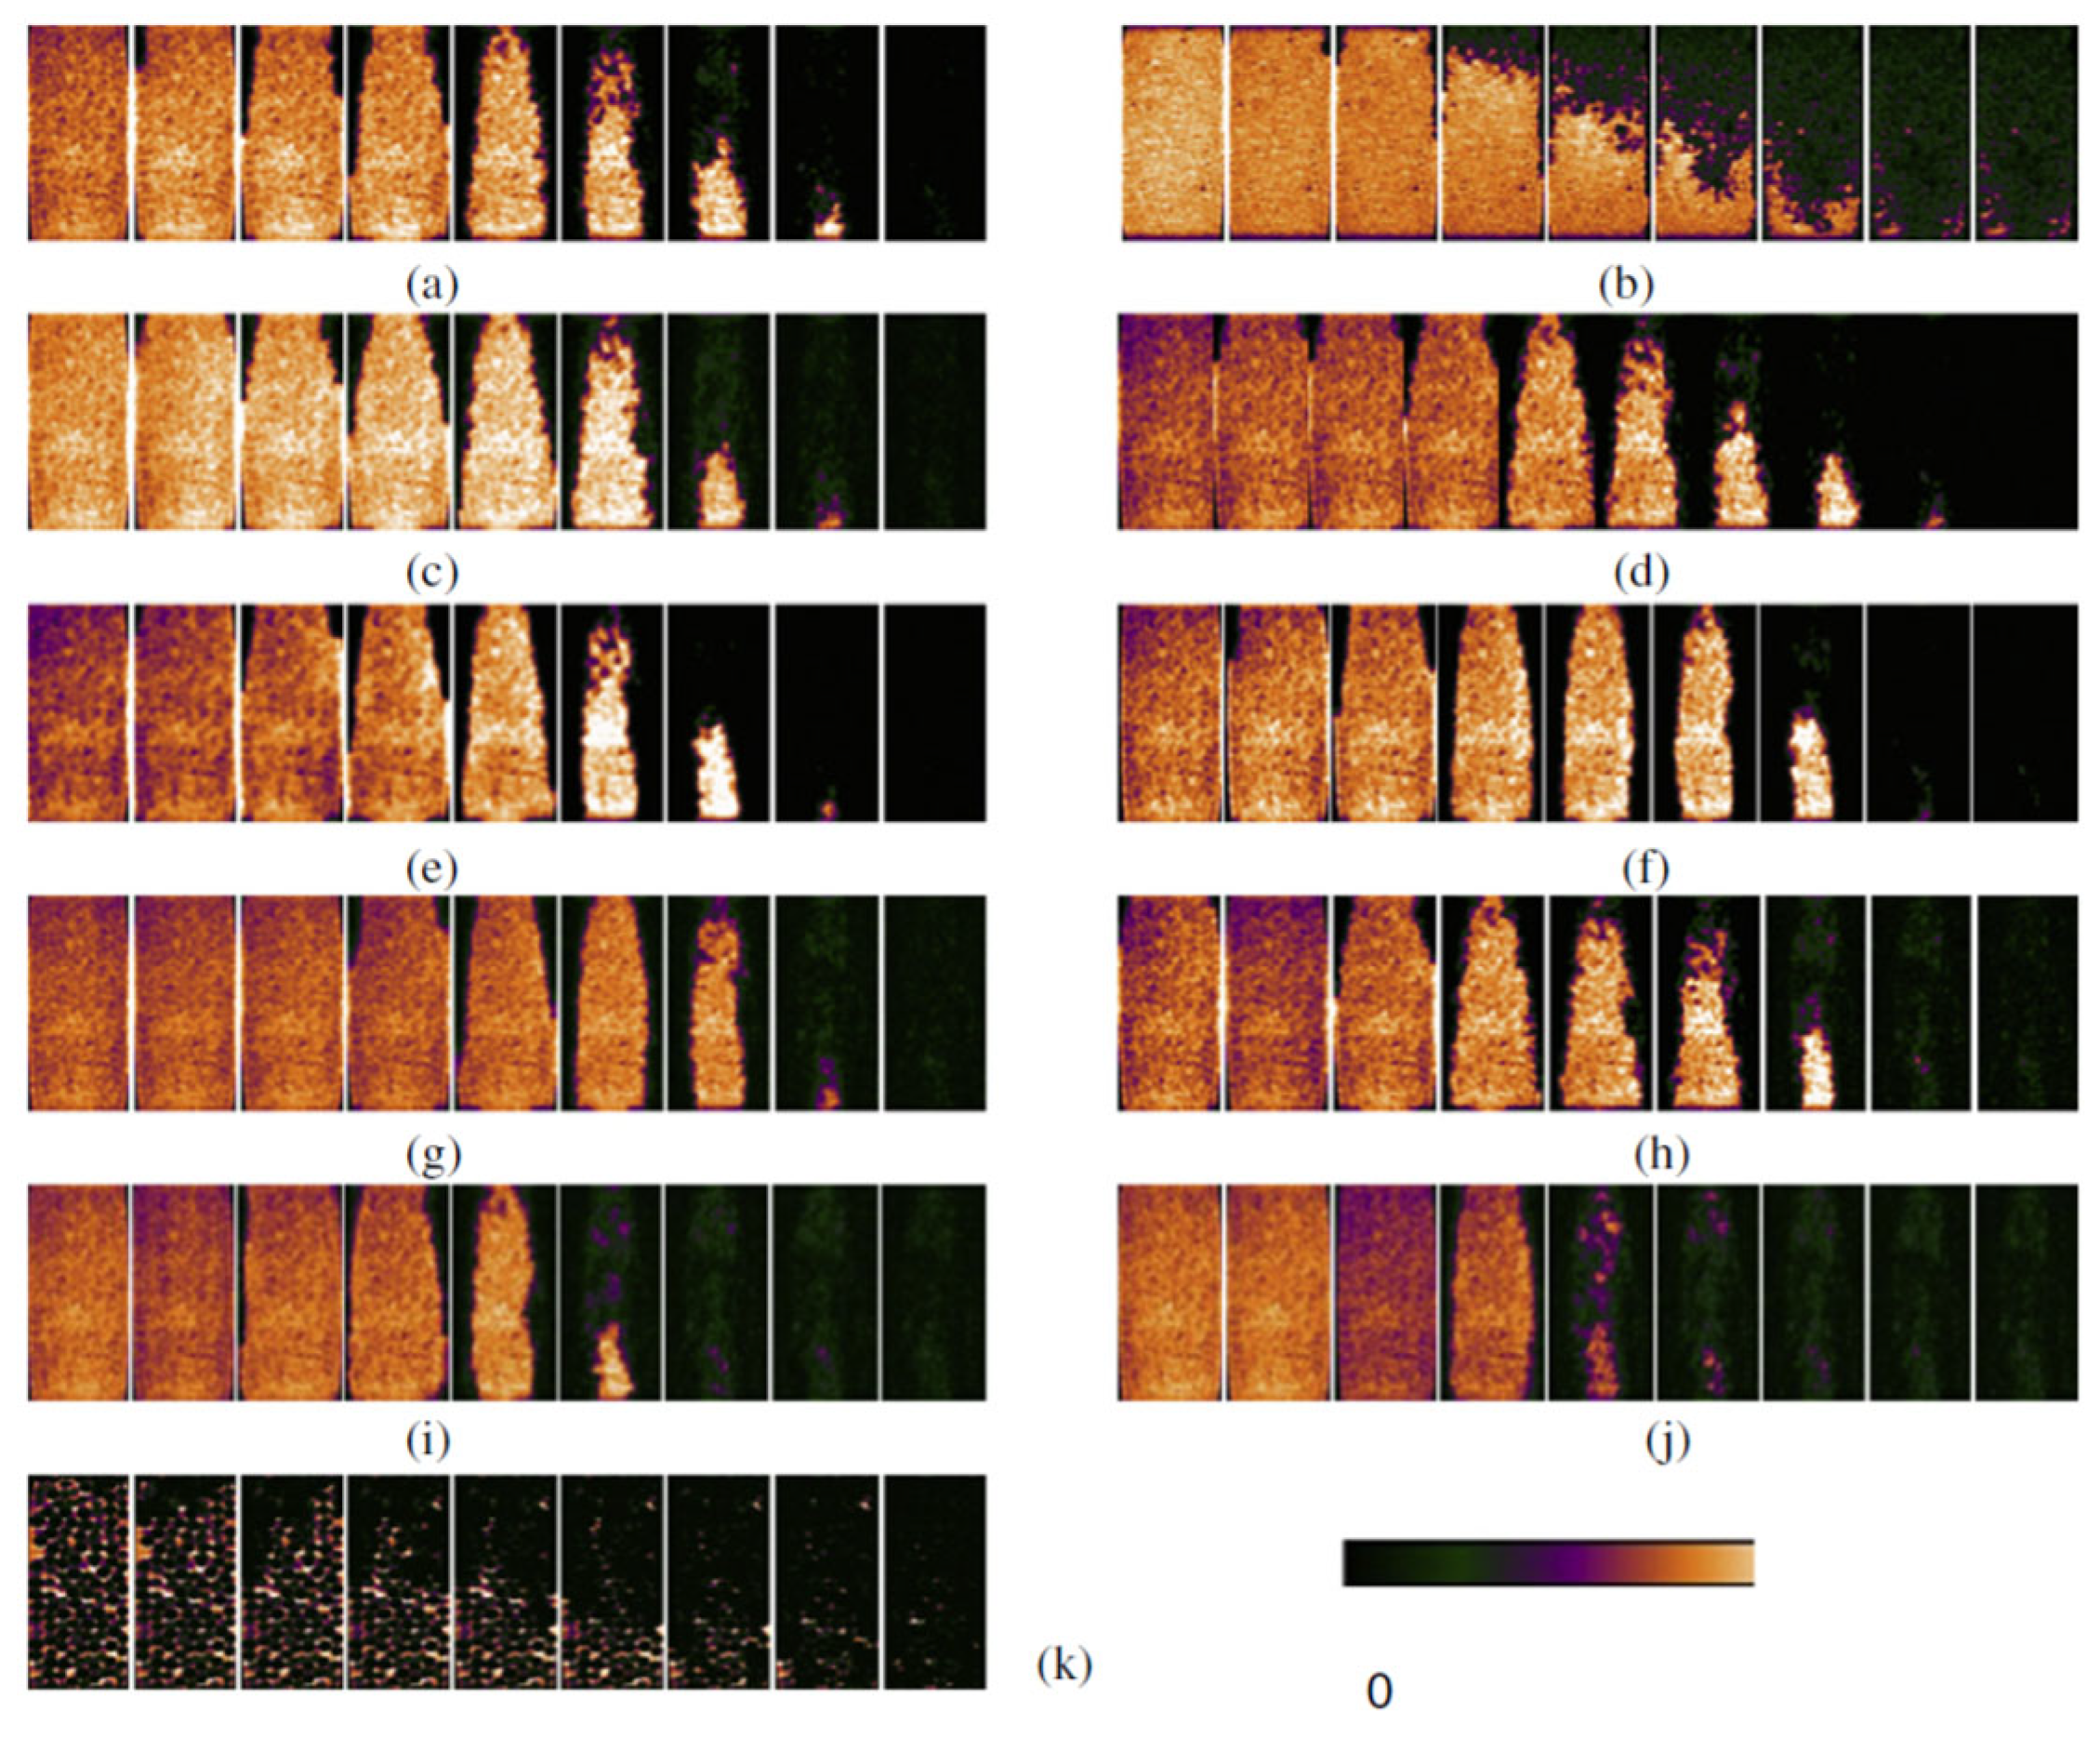
Figure 12.
MRI of an oil-displacement experiment in a hyperpermeability core [93]. Copyright 2021 The Authors. Published by the American Chemical Society. This publication is licensed under CC-BY-NC-ND.
Figure 12.
MRI of an oil-displacement experiment in a hyperpermeability core [93]. Copyright 2021 The Authors. Published by the American Chemical Society. This publication is licensed under CC-BY-NC-ND.
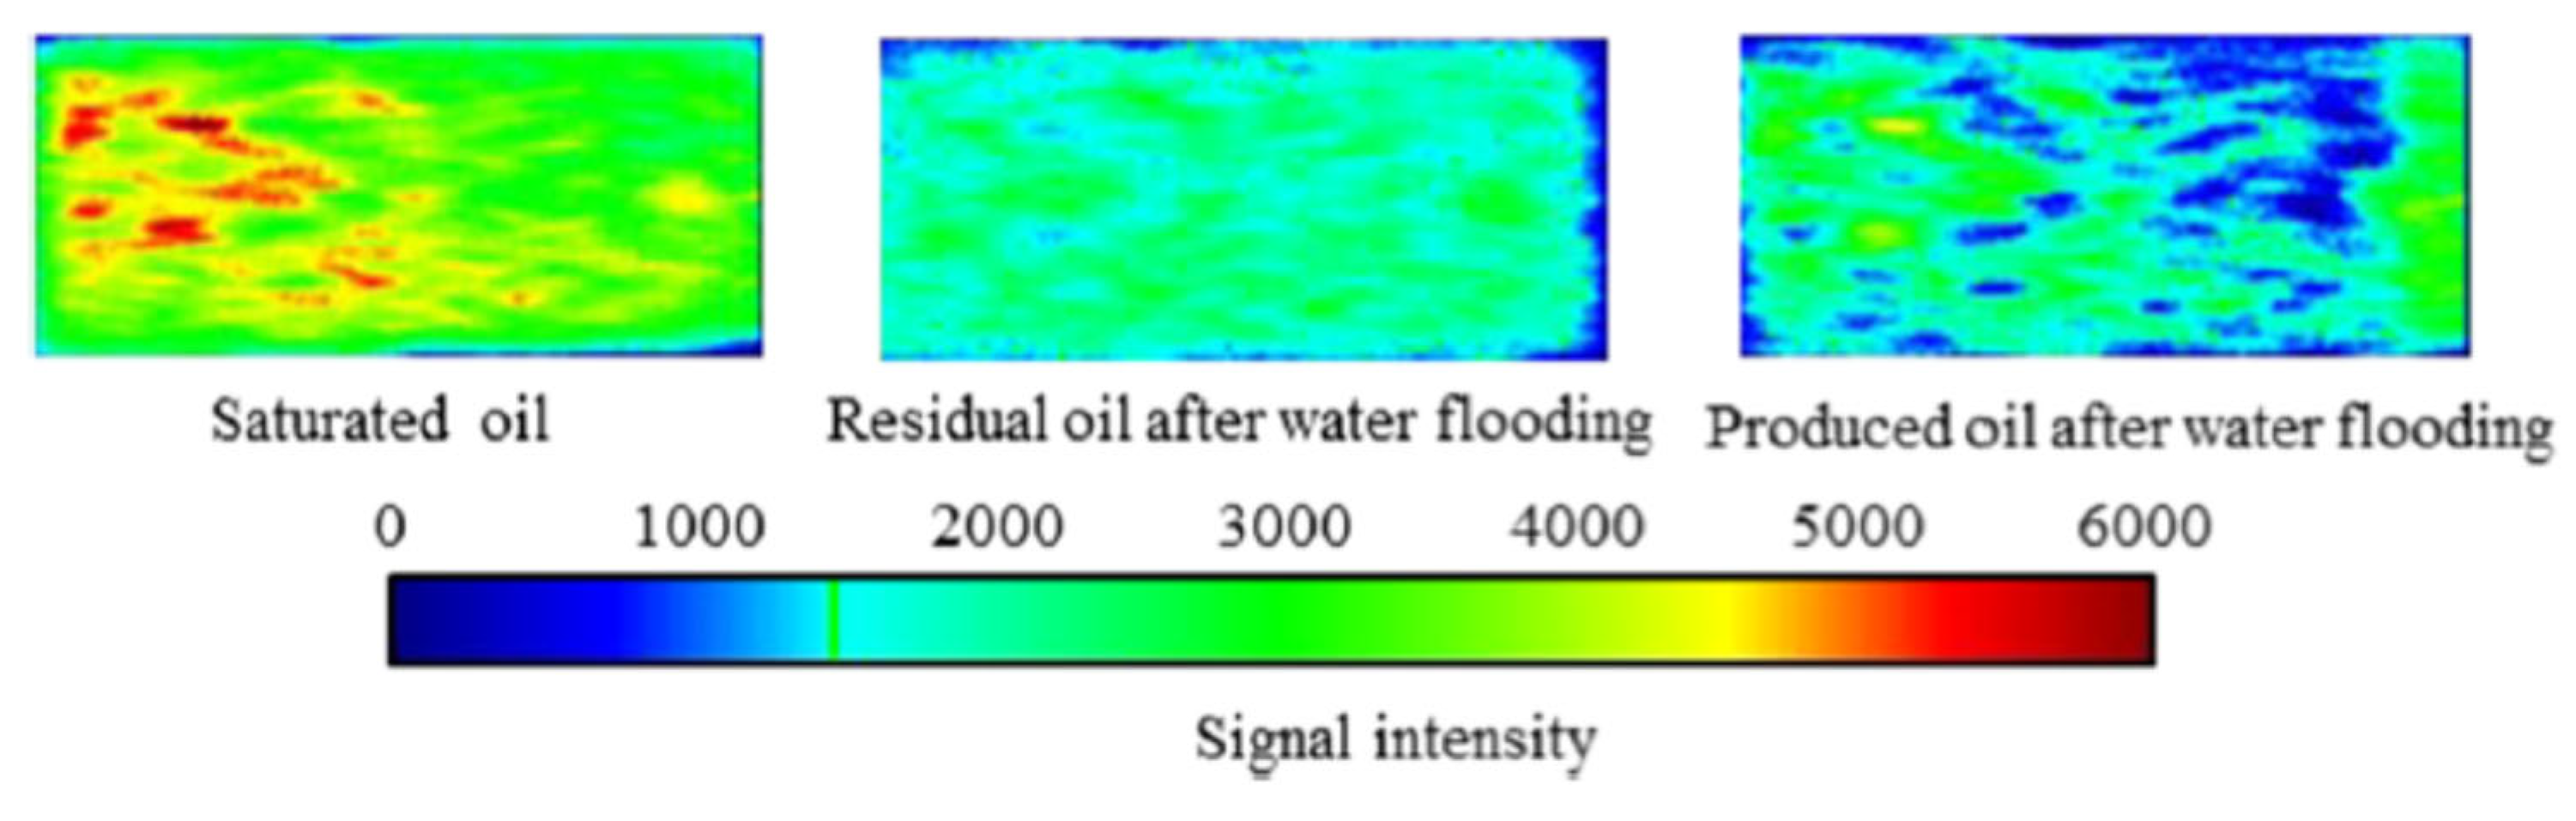
Figure 13.
MRI images of two rock core samples at different stages of the drainage and inhibition experiments [89]. Copyright 2026 Elsevier.
Figure 13.
MRI images of two rock core samples at different stages of the drainage and inhibition experiments [89]. Copyright 2026 Elsevier.
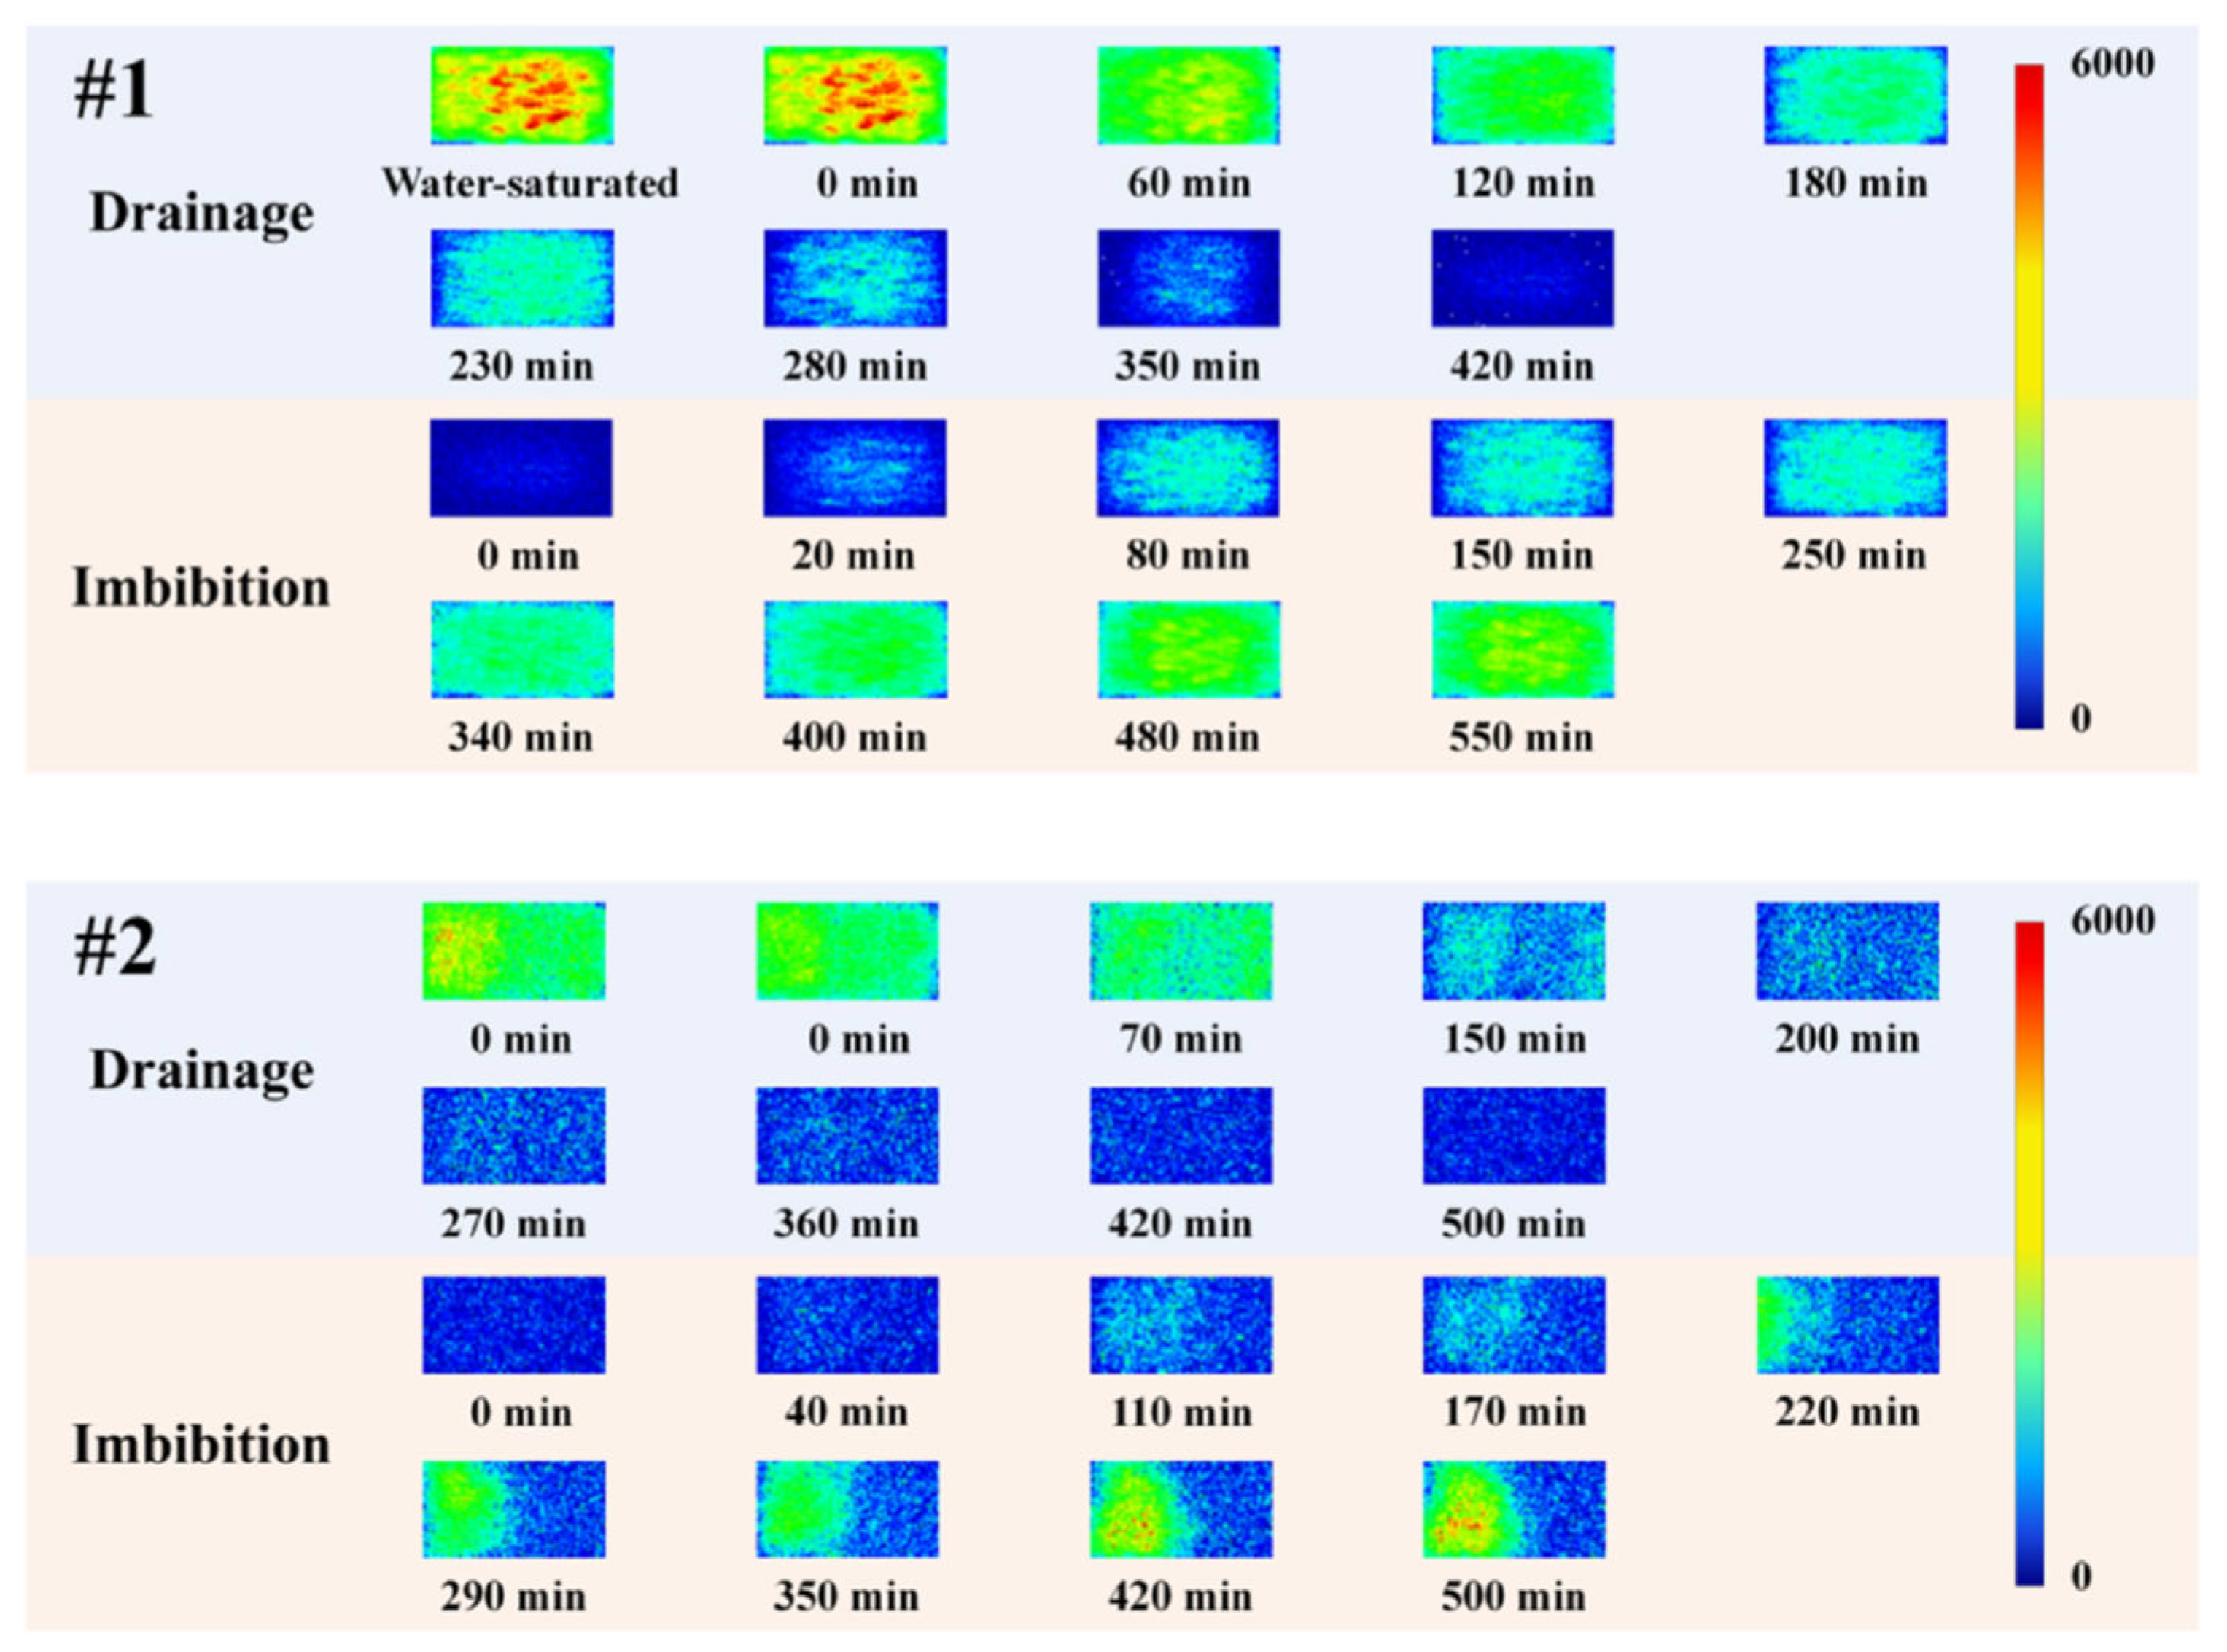
Figure 14.
T1 relaxation time distributions from sandstones: (a) Bentheimer, (b) Berea, and (c) Birchover. The data were acquired utilizing the double-shot T1 pulse sequence. For evaluation, T2, eff distributions are demonstrated, acquired with the classical single-shot CPMG pulse sequence with a range of echo durations, for (d) Bentheimer, (e) Berea, and (f) Birchover. The CPMG echo durations te are demonstrated in the legend and apply to distributions (d–f) [70]. Copyright 2014 Elsevier.
Figure 14.
T1 relaxation time distributions from sandstones: (a) Bentheimer, (b) Berea, and (c) Birchover. The data were acquired utilizing the double-shot T1 pulse sequence. For evaluation, T2, eff distributions are demonstrated, acquired with the classical single-shot CPMG pulse sequence with a range of echo durations, for (d) Bentheimer, (e) Berea, and (f) Birchover. The CPMG echo durations te are demonstrated in the legend and apply to distributions (d–f) [70]. Copyright 2014 Elsevier.
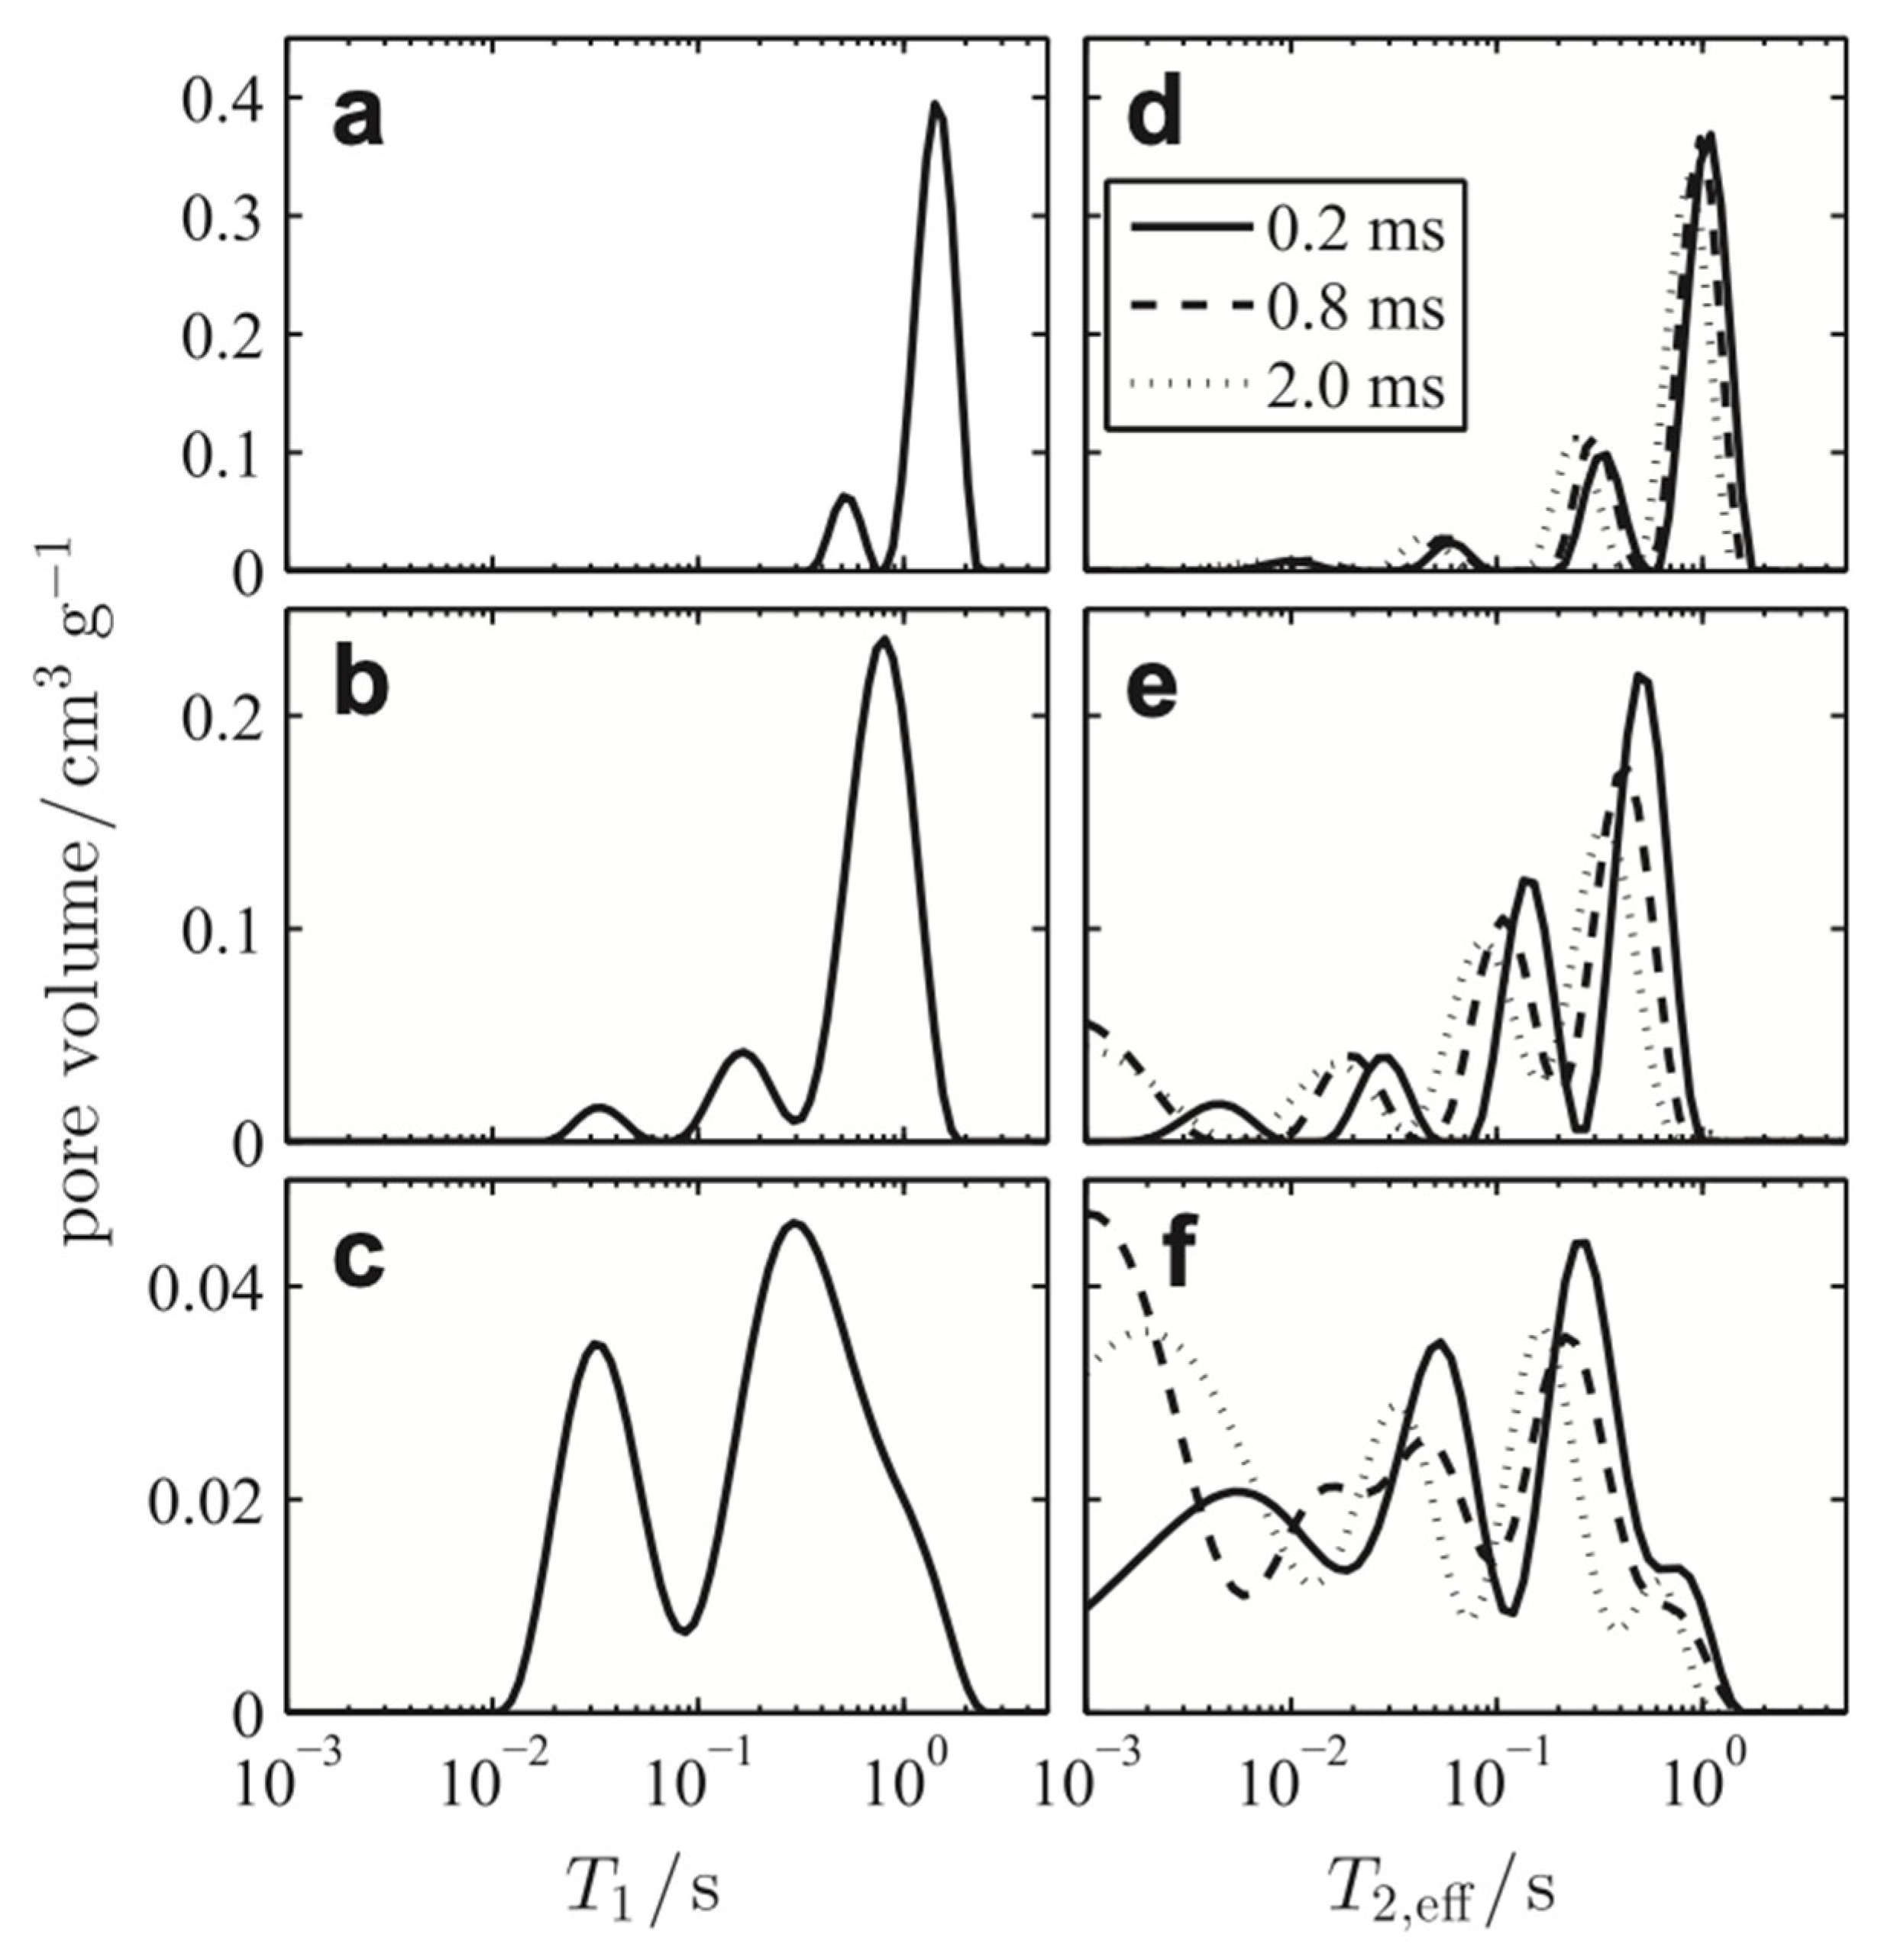
Figure 15.
Four types of characteristic NMR T2 distribution of carbonate rock (fully saturated). Unimodal type (a), bimodal type (b), triple-peak type (c), four-peak type (d) [30]. Copyright 2014 Springer Nature.
Figure 15.
Four types of characteristic NMR T2 distribution of carbonate rock (fully saturated). Unimodal type (a), bimodal type (b), triple-peak type (c), four-peak type (d) [30]. Copyright 2014 Springer Nature.
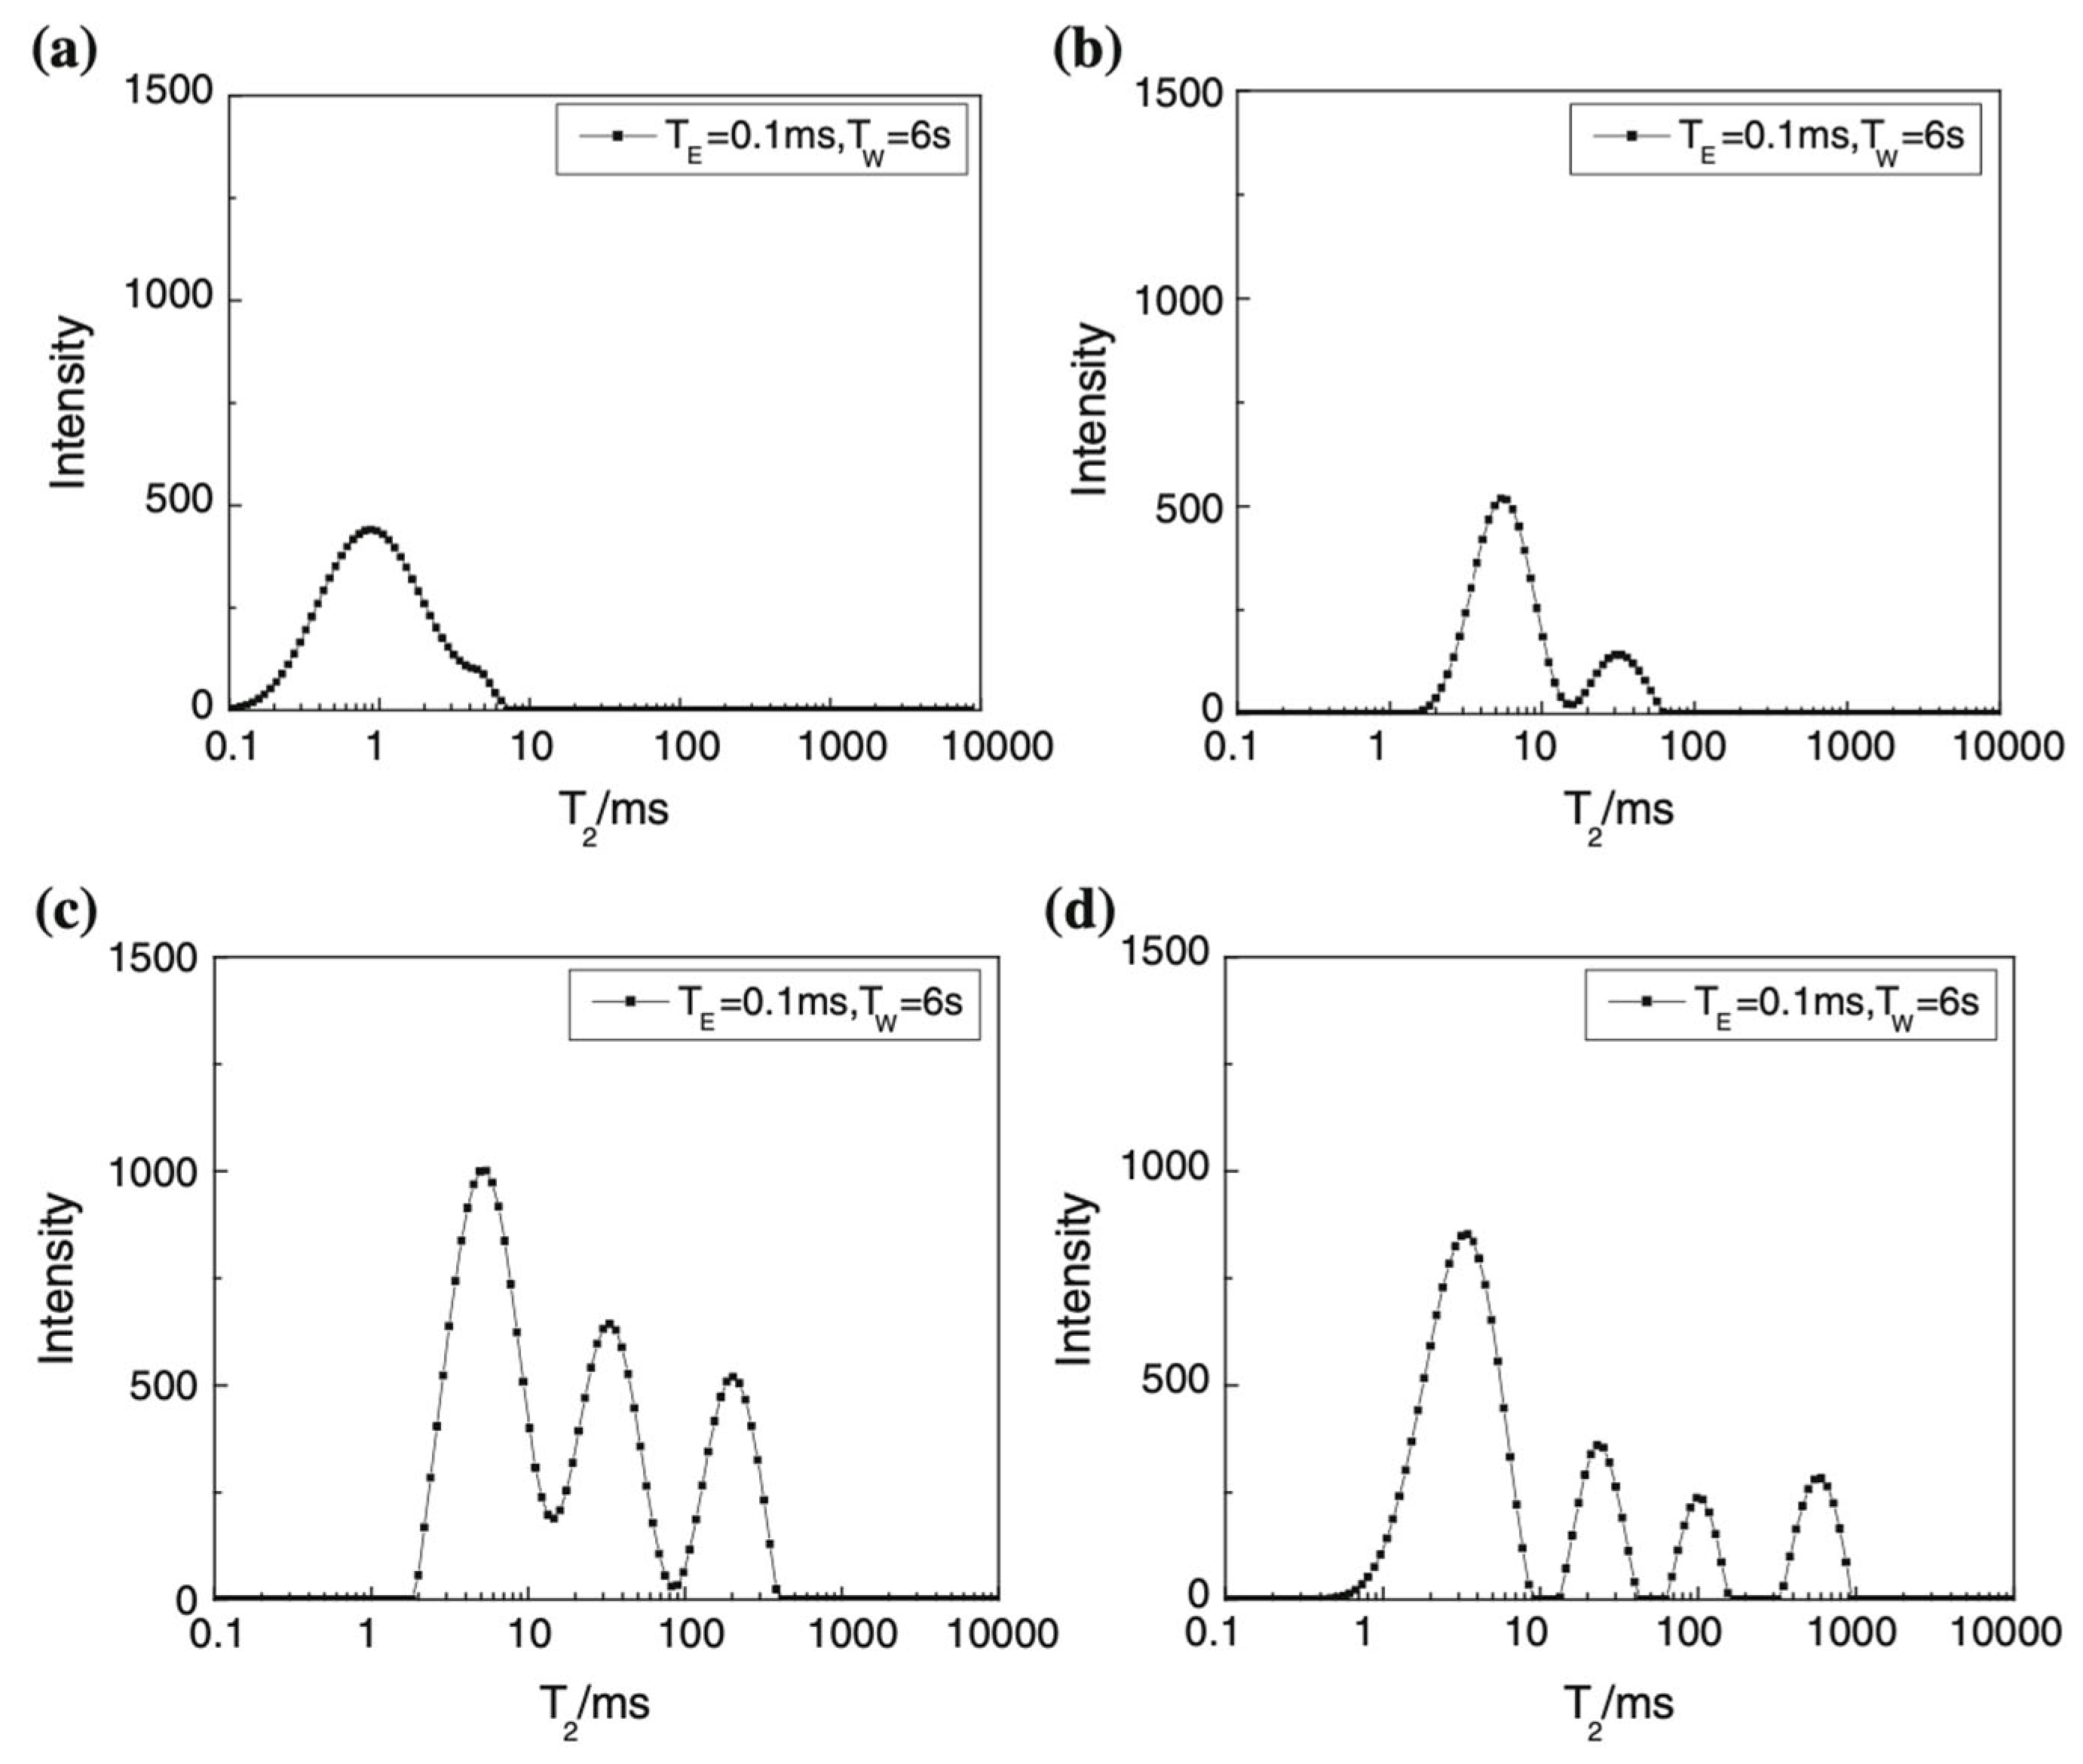
Figure 16.
Pore and throat in pore linkage exemplary (left) and Sphere–Cylinder model (right) [163]. Copyright 2016 Springer Nature.
Figure 16.
Pore and throat in pore linkage exemplary (left) and Sphere–Cylinder model (right) [163]. Copyright 2016 Springer Nature.
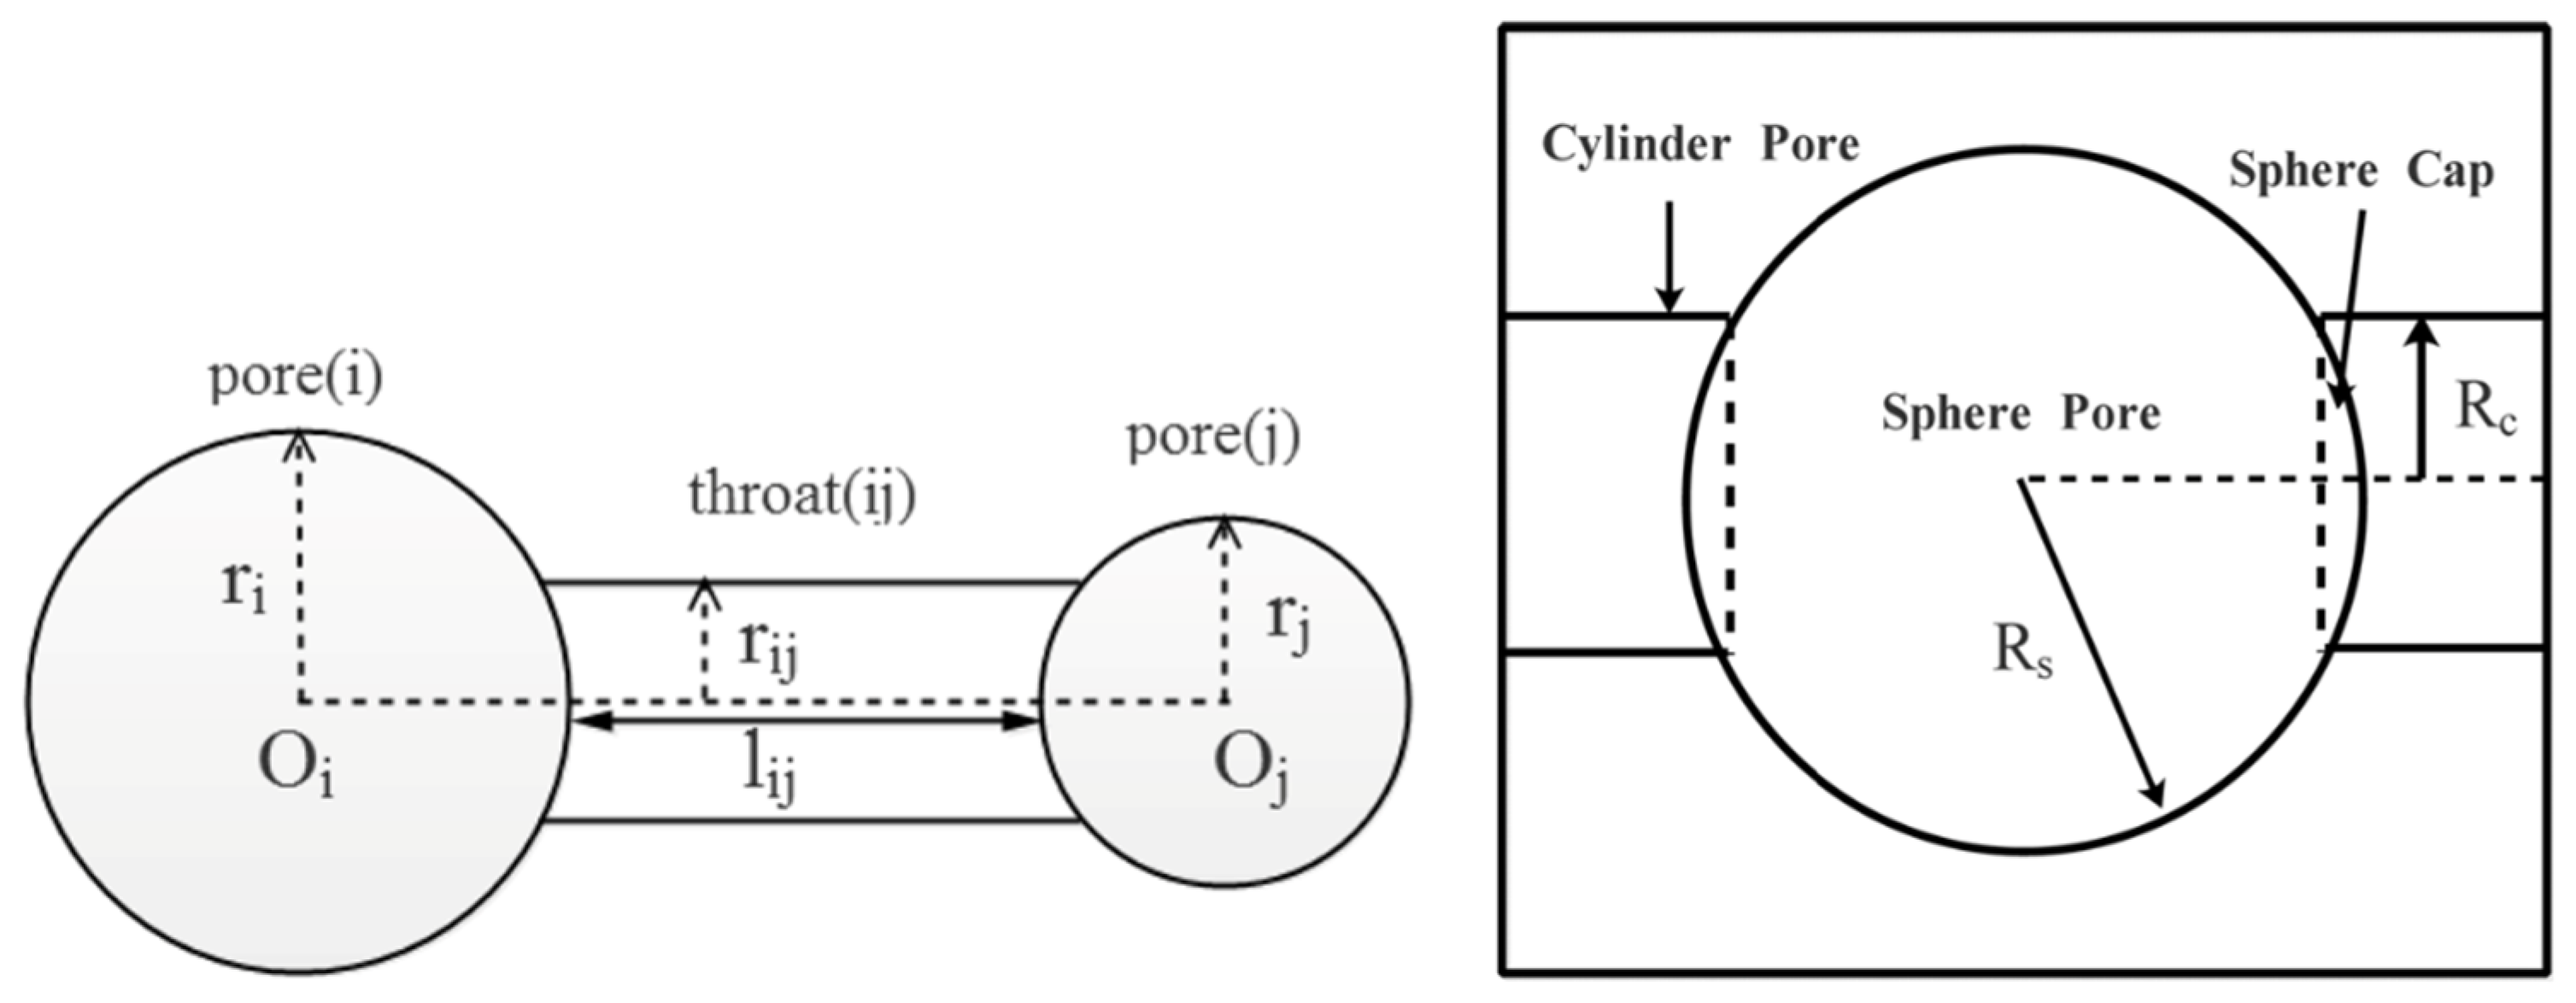
Figure 17.
Identification graph of hydrogen-bearing matters by using a 2D T1-T2 map [171]. Copyright 2017 Elsevier.
Figure 17.
Identification graph of hydrogen-bearing matters by using a 2D T1-T2 map [171]. Copyright 2017 Elsevier.
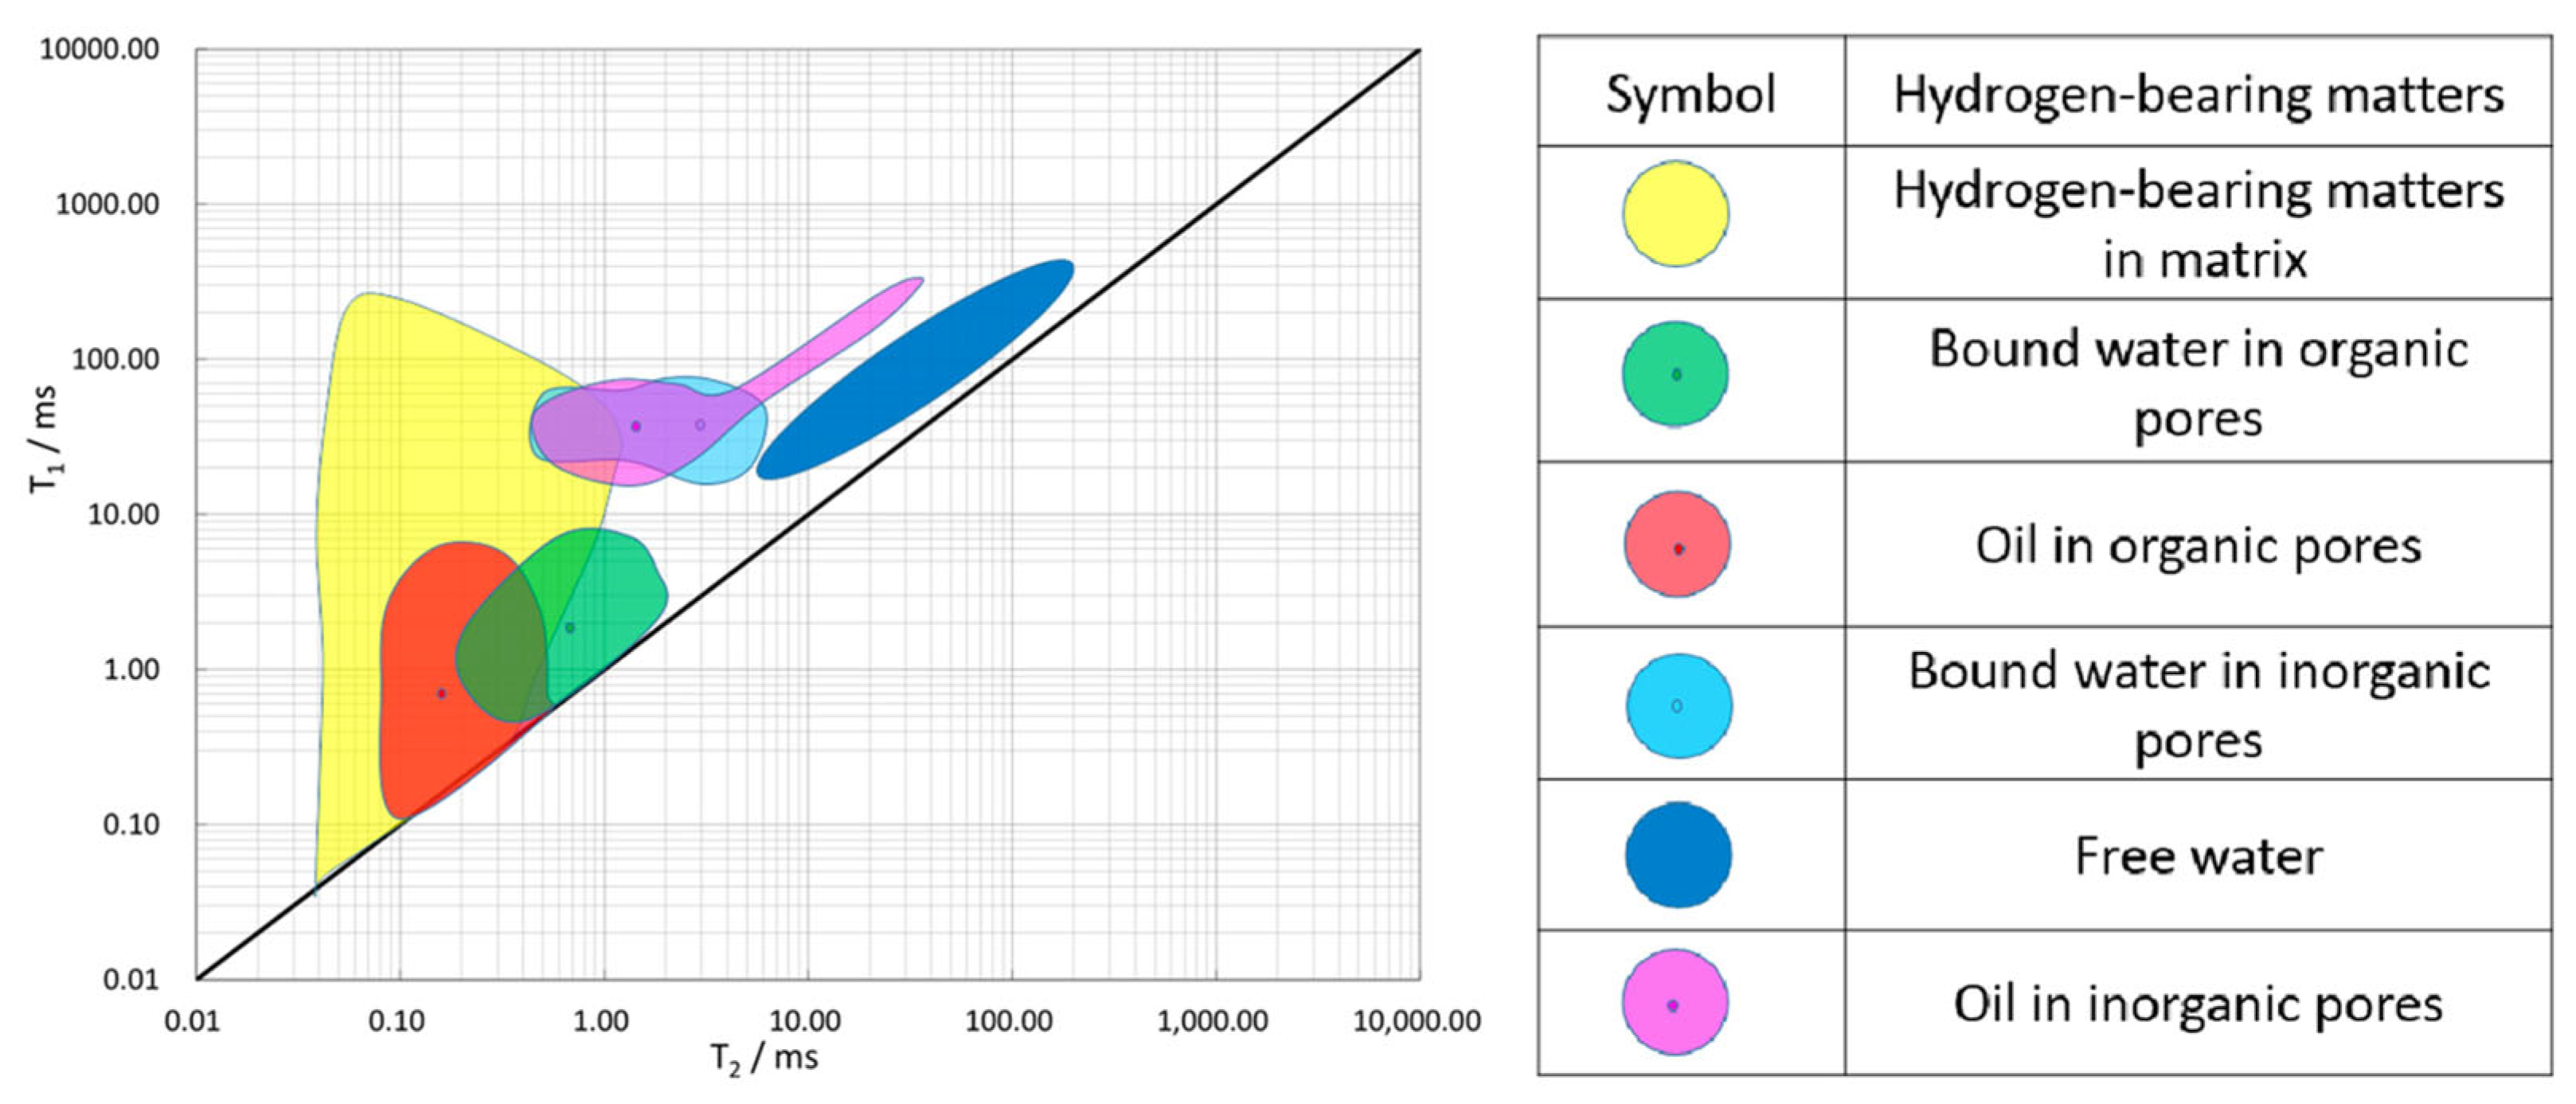
Figure 18.
3D MRI reconstruction of a brine-saturated Ninian sandstone core plug. A portion of the image is cut away to reveal the shale band (dark line) traversing the plug. Copyright 1990 The Royal Society Publishing [180].
Figure 18.
3D MRI reconstruction of a brine-saturated Ninian sandstone core plug. A portion of the image is cut away to reveal the shale band (dark line) traversing the plug. Copyright 1990 The Royal Society Publishing [180].
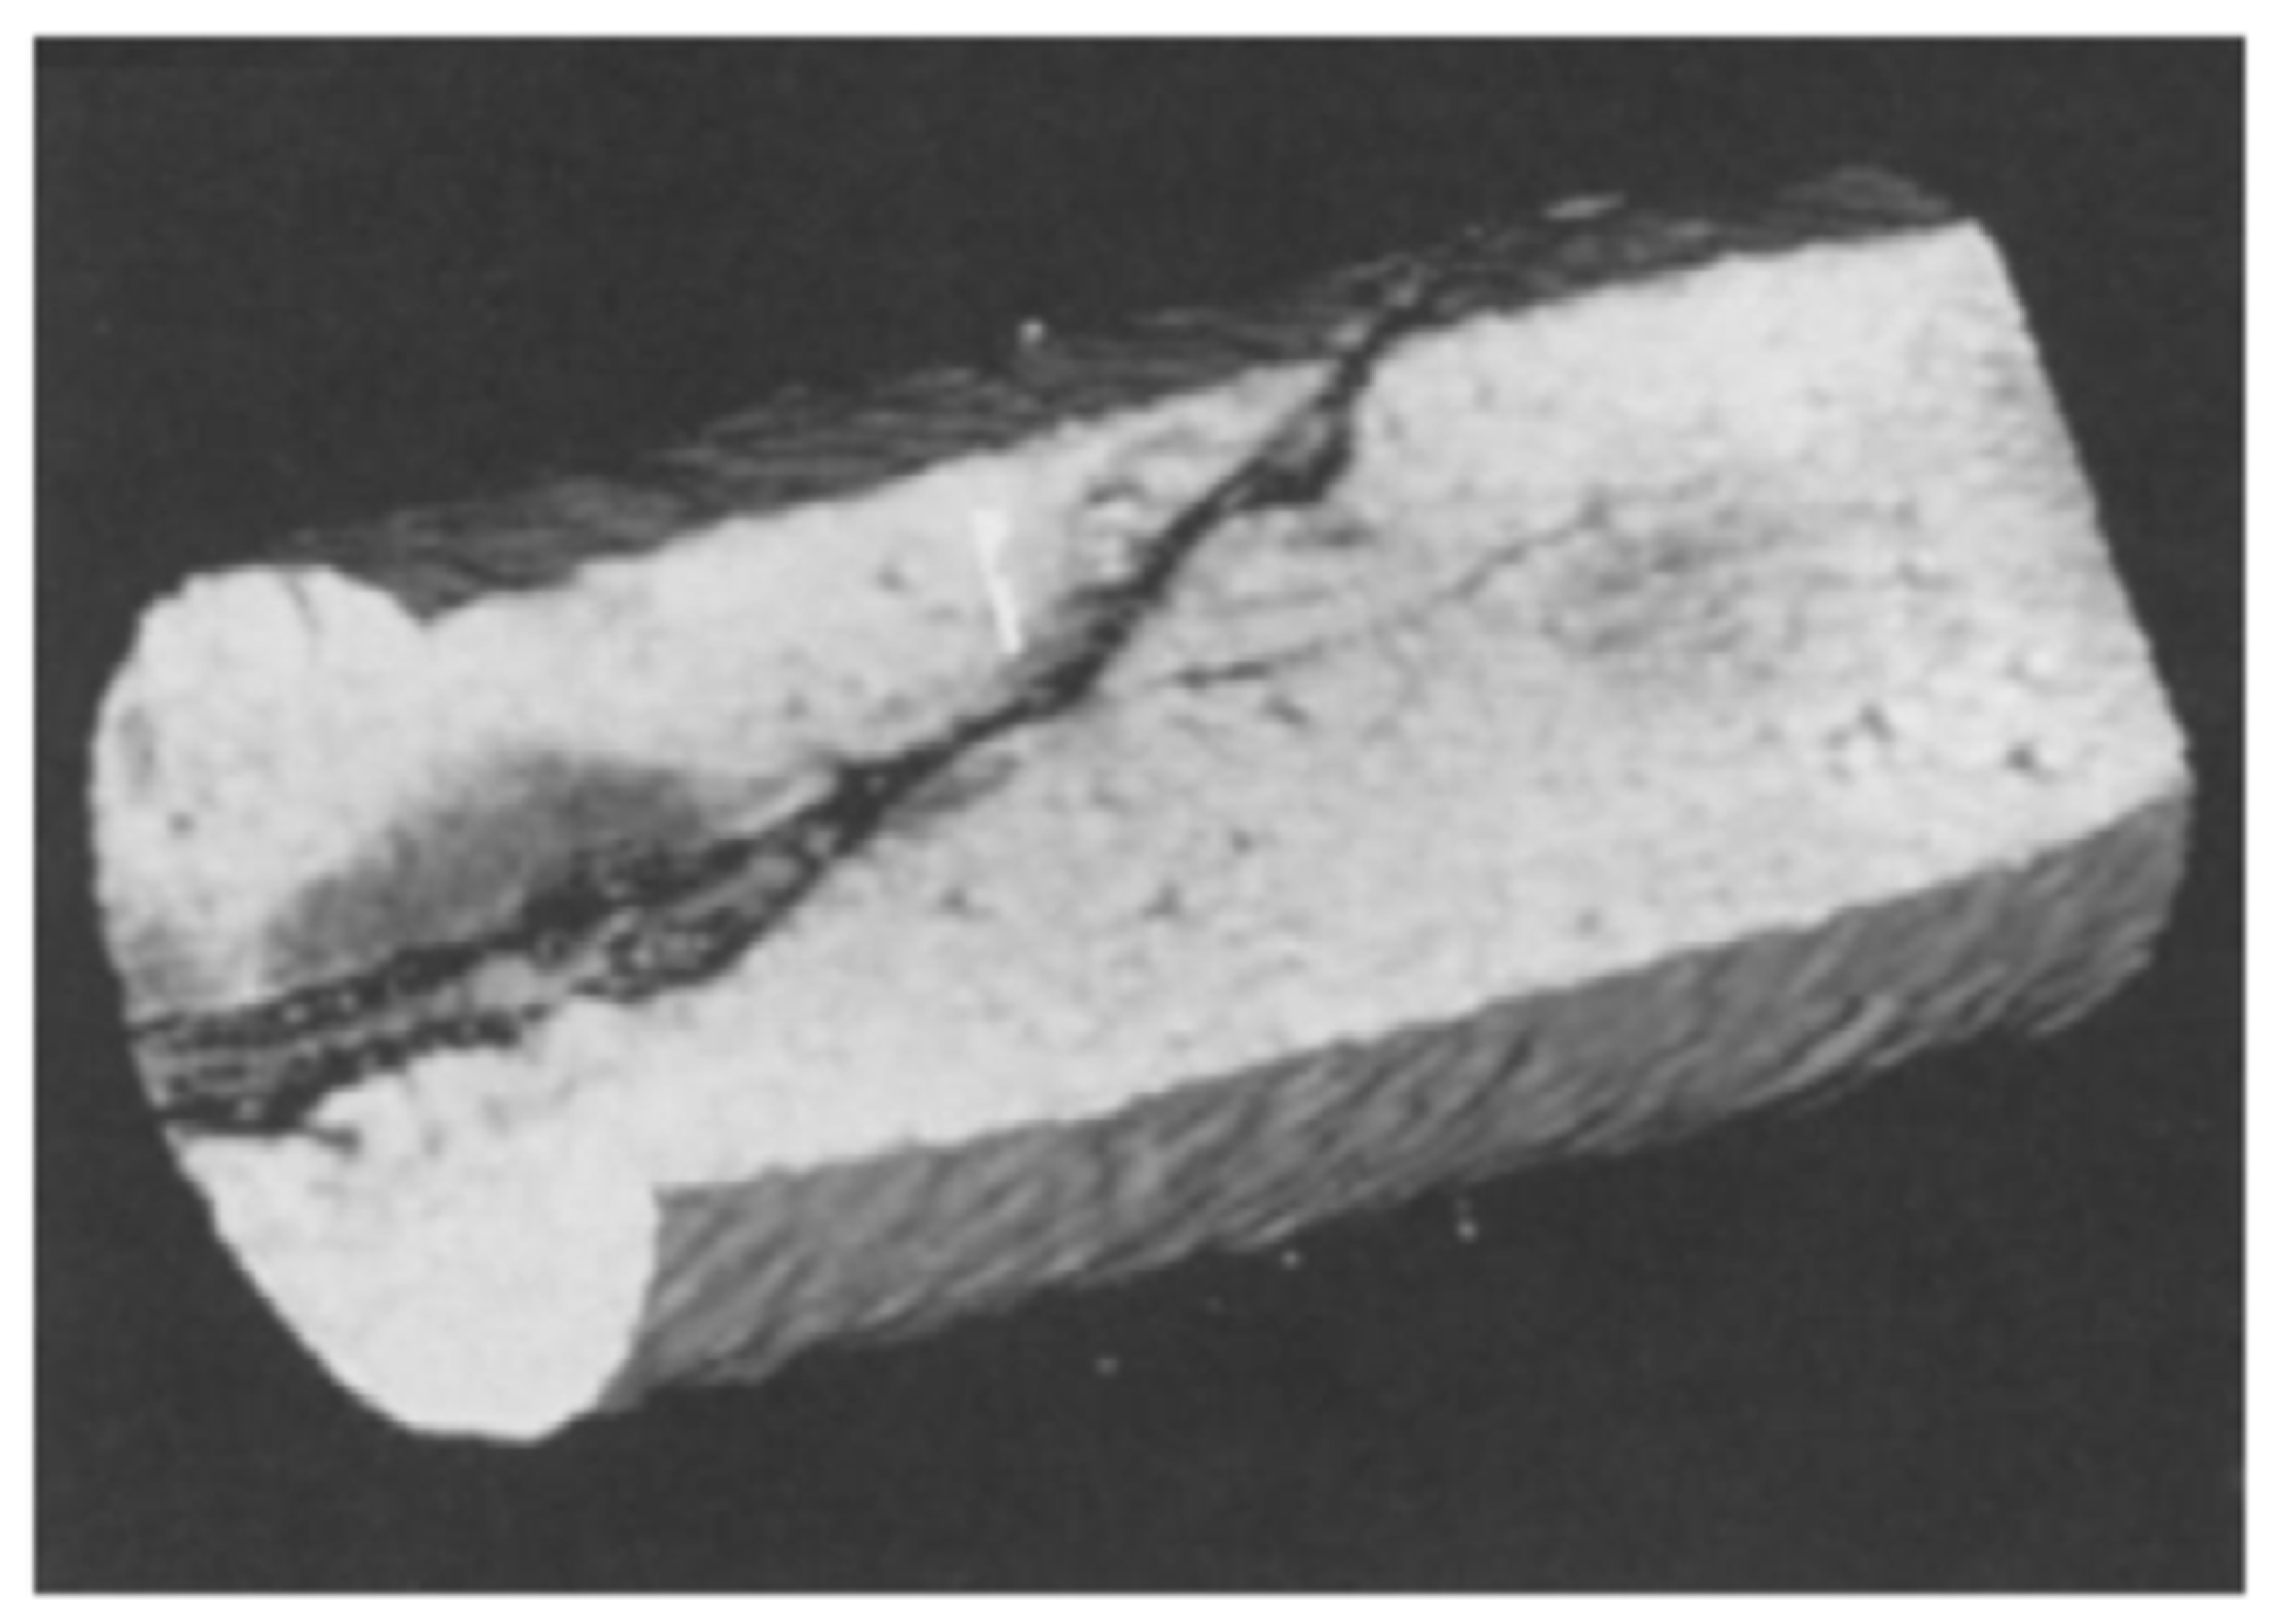
Figure 19.
a) Porosity and number of clusters vs threshold of a Madison Limestone core plug, and b) photograph of the same sample where the blue line indicates the field of view [92]. Copyright 2020 Wiley.
Figure 19.
a) Porosity and number of clusters vs threshold of a Madison Limestone core plug, and b) photograph of the same sample where the blue line indicates the field of view [92]. Copyright 2020 Wiley.
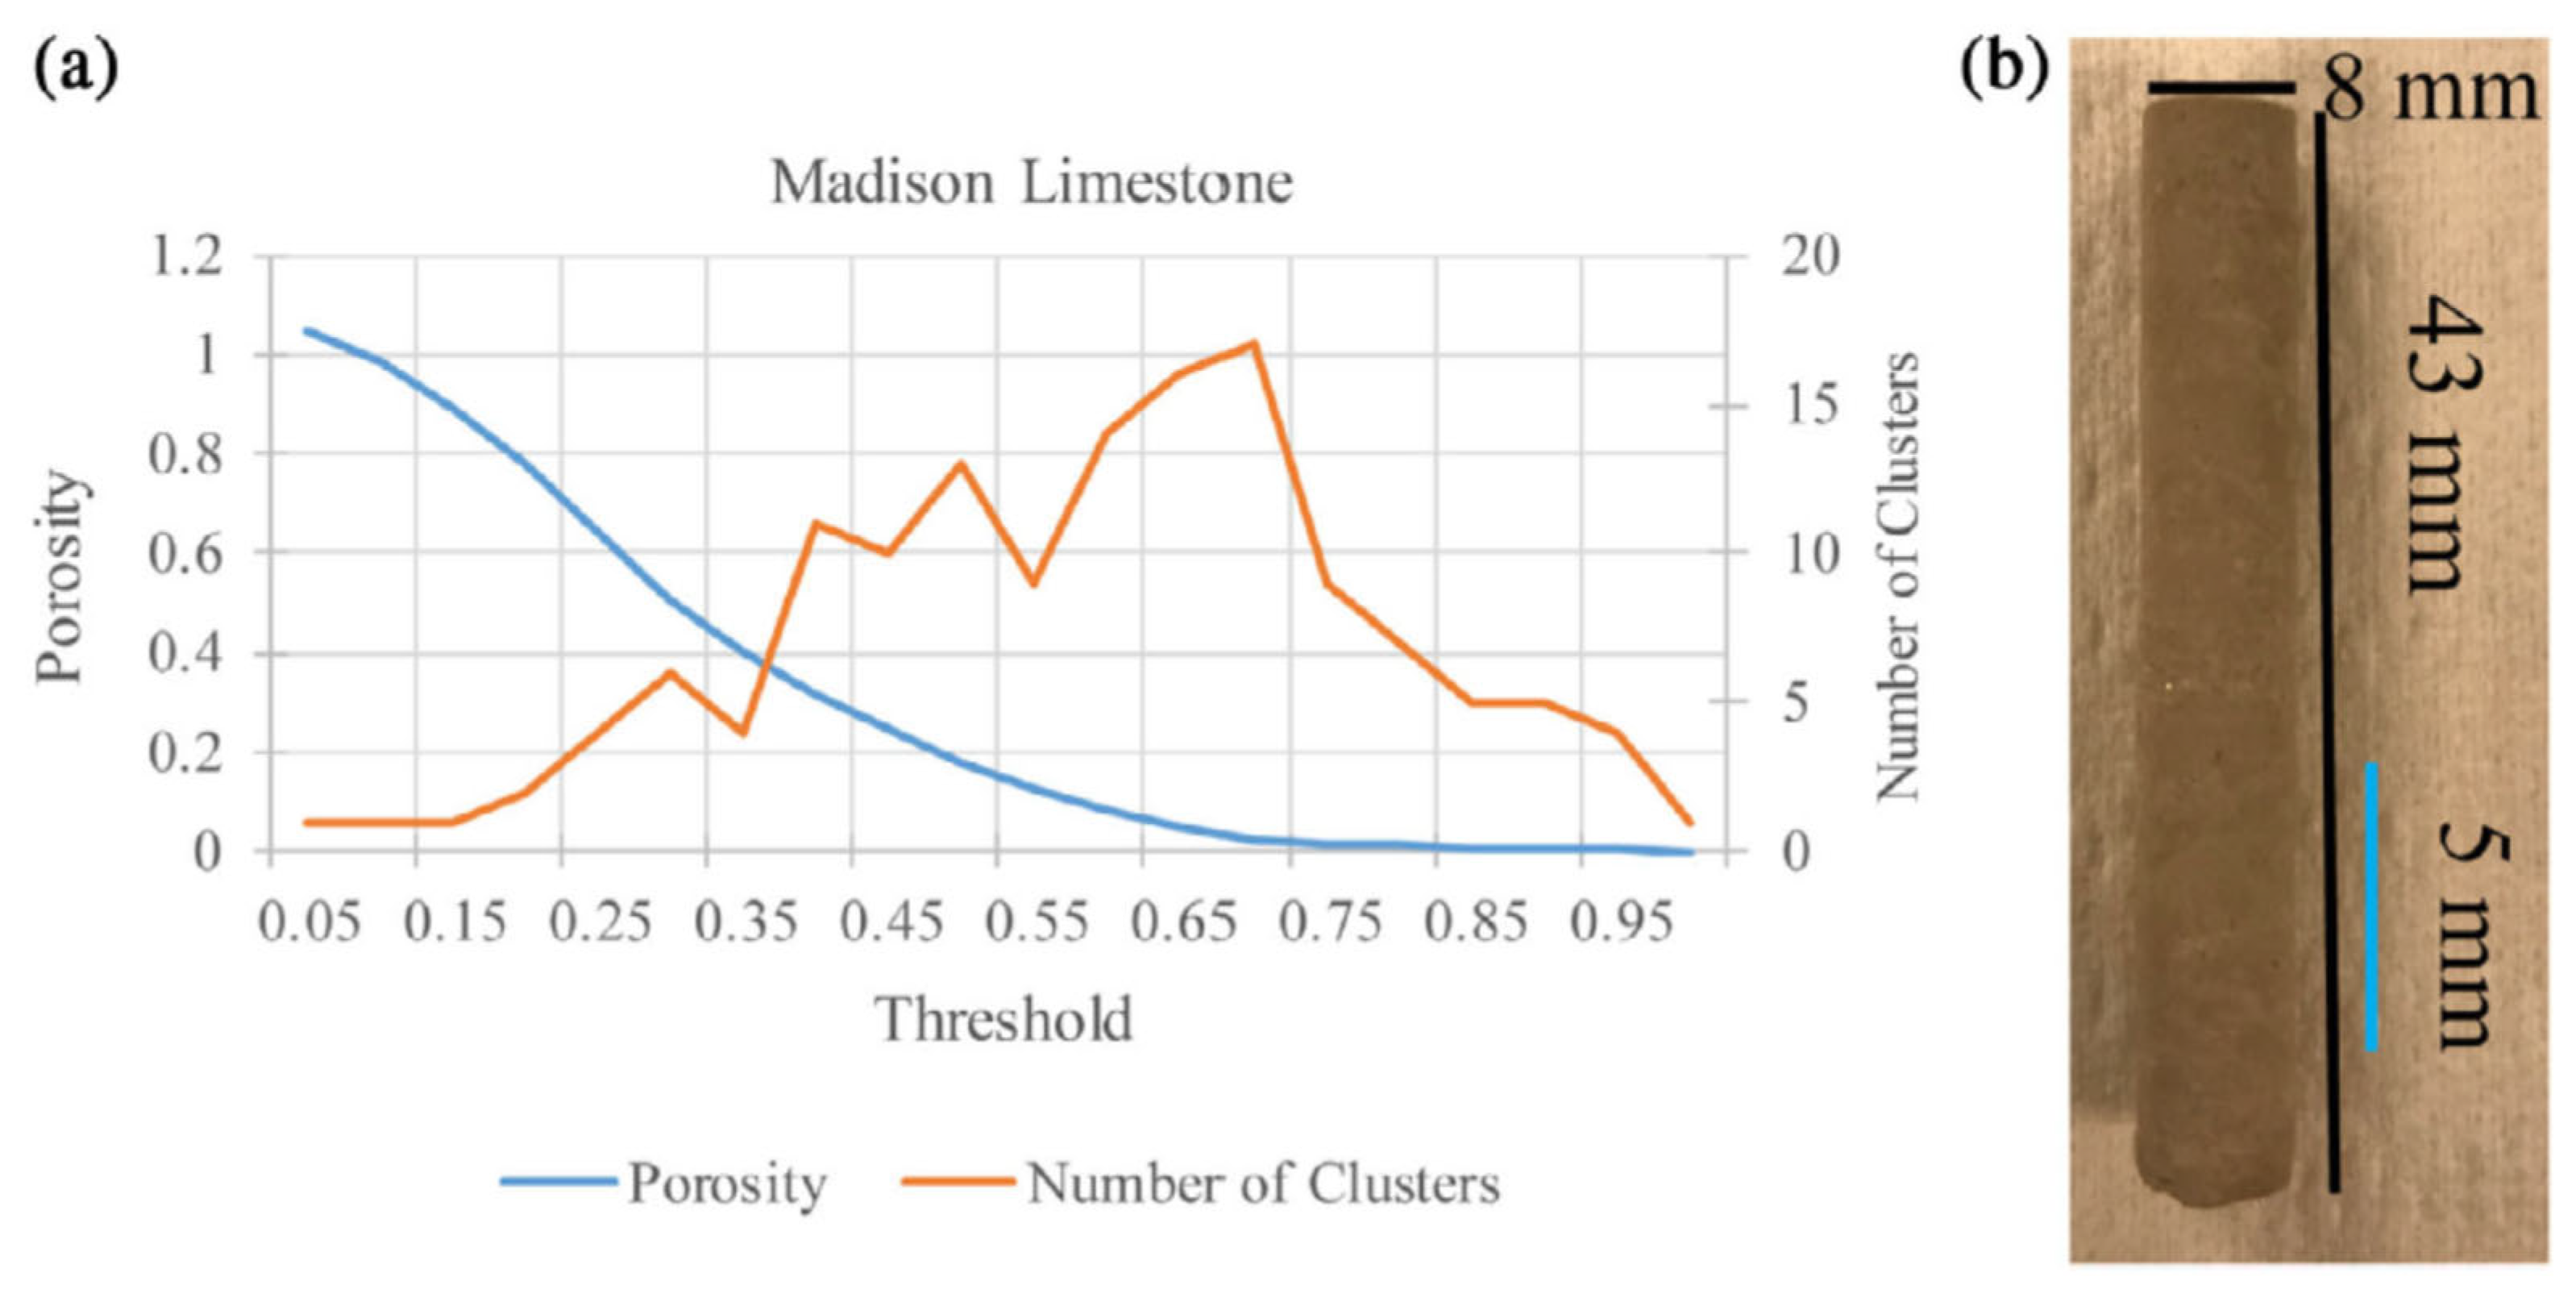

Table 1.
Summary of the Review Articles on Rock Core Characterization by NMR.
| Year | Summary | Reference |
| 2005 | Discussed the challenges of utilizing NMR for characterizing carbonate rock formations and proposed a pore-type classification scheme as an alternative to conventional assumptions applicable to siliclastic counterparts | [12] |
| 2014 | Reviewed NMR theory, instrumentation, and techniques across laboratory, borehole, and field scales and their associated challenges for near-surface characterization, including groundwater applications and petrophysical interpretation | [13] |
| 2017 | Investigated the capability of NMR in quantifying carbonate rock wettability for enhanced oil recovery processes | [14] |
| 2018 | Presented a critical review of the characterization of pore structure in tight sandstones and associated theories using a wide array of techniques, including NMR measurements | [15] |
| 2018 | Demonstrated the effective characterization by LF-NMR of shale reservoir properties—including porosity, permeability, movable fluid content, and pore size distribution—by linking transverse magnetization relaxation (T₂) relaxation behavior to pore structure and mineral composition, while providing permeability estimates and pore size distributions aligned with conventional measurements and SEM analyses. | [16] |
| 2019 | Reviewed six decades of research on NMR wettability determination in hydrocarbon reservoirs, emphasizing laboratory approaches and highlighting a representative field application | [17] |
| 2019 | Reviewed the use of high-frequency NMR relaxometry in tight shales for identifying organic matter type and maturity stages, demonstrating its viability when integrated with Rock-Eval pyrolysis and Vitrinite reflectance-equivalent measurements | [18] |
| 2020 | Presented a critical review of well-established relaxation theories and LF NMR techniques and their application in various petrophysical analyses, with particular emphasis on current challenges and limitations in unconventional reservoirs | [19] |
| 2022 | Reviewed the utilization of NMR techniques for the acquisition of petrophysical properties and hydrocarbon recovery factors and its applicability in EOR and drilling operations | [20] |
| 2023 | Reviewed the roles of surface geochemistry and network connectivity in understanding the pore coupling effect in rock geometries containing groundwater resources at different saturation conditions | [21] |
| 2024 | Provided a practical guideline for standardized NMR rock core analysis, outlining sample preparation, experimental procedures, data processing, and interpretation methods for T₂, longitudinal magnetization relaxation (T₁), T₁–T₂, and diffusion (D)–T₂ measurements to improve the reliability, comparability, and application of NMR-derived petrophysical properties such as porosity, permeability, fluid saturation, and pore structure. | [22] |
Table 2.
Comparison of Sandstone versus Carbonates.
| Property | Sandstone | Carbonates | References |
| Primary Composition | feldspar, quartz, clay minerals (kaolinite), and various oxides (SiO2, MgO, and CaO). | Calcite (CaCO3), dolomite (CaMg(CO3)2) | [23,24,49] |
| Origin | form in diverse sedimentary environments, shaped by marine, riverine (fluvial), and wind-driven processes | established in shallow and deep marine settings, evaporitic basins, windy deserts, and lakes | [23,39] |
| Pore System | a broad range of pore throat sizes, from the nano- to micro-scale, with complicated geometries and structures | numerous porosity types and heterogeneous pore-size distributions, including different biological roots | [15,31] |
| Porosity/Permeability | Correlation between the chemical composition of sandstones and reservoir quality; reservoirs with more than 10–15% clay minerals experience fast porosity loss due to mechanical compaction. Upon reaching depths greater than 13,000 feet, sandstone reservoirs exhibit high porosity and permeability. | In carbonate rocks, most petrophysical parameters, such as porosity and permeability, are regularly not directly correlated with each other. | [12,23,26] |
Table 3.
Lithology and NMR Response.
| Rock Type | Main NMR challenge |
| Clean sandstone | relatively uniform pore geometry |
| Tight sandstone | clay-bound water and short NMR relaxation time |
| Carbonate | vugs, fractures, multimodal pores |
| Shale | nanopores, organic matter, diffusion effects |
Table 4.
Comparison of Classical NMR Permeability Models.
| Model |
Main Parameter |
Physical Assumption |
Advantages | Limitations |
Best Reservoir Type |
| Seevers [86] | T1 | Large pores dominate flow | First NMR-permeability correlation | Ignores small pores | Clean sandstone |
| Timur [69] | T1 | Full pore network contributes to flow | Includes movable fluid volume | Empirical coefficients | Sandstone |
| Timur-Coates [69,95] | FFI/BVI | Bound and movable fluids can be separated by T2 cutoff | Easy implementation | Sensitive to cutoff selection | Sandstone, some carbonates |
| SDR [96] | T2LM | T2 reflects pore size distribution | Robust and simple | Assumes constant surface relaxivity | Sandstone |
Table 5.
Application of Multidimensional NMR Methods to Different Reservoir Types
| Method | Sandstone Application | Carbonate Application | Main Benefit |
| T1-T2 | Clay-bound vs movable water | Micropores vs vugs | Fluid typing |
| D-T2 | Pore connectivity | Fracture-vug systems | Diffusion characterization |
| FID-CPMG | Tight sandstone | Microporous carbonate | Recovery of short-T2 signal |
| LF-MRI | Flooding experiments | Fracture flow visualization | Spatial fluid mapping |
| EDC | Tight gas sandstone | Heterogeneous carbonate | Diffusion-aware PSD |
Table 6.
Complementary Methods for Constraining LF-NMR Interpretation in Complex Lithologies.
| t |
Information provided |
Relevant pore-size range | Key contribution to NMR interpretation |
Main limitations in NMR context |
| LF-NMR (T2, T1–T2, D–T2) | Relaxation behavior of hydro-gen-bearing phases; fluid mobility; surface and diffusion effects | ~nm to mm (indirect, model-dependent) |
Non-destructive characterization of fluids and pore systems; sensitivity to wettability, mineral-bound water, and organic matter | Non-unique interpretation; strong dependence on relaxation regime, diffusion effects, pulse sequence, and inversion protocol |
| LTNA (N₂ adsorption) | Specific surface area; micro- and mesopore size distribution | 0.5 – 50 nm | Constrains surface-controlled relaxation and restricted diffusion regimes; benchmarks NMR interpretations in nano- and microporous systems | Requires dry samples; probes adsorption-accessible pores only; limited relevance for macroporosity |
| MICP | Pore throat size distribution; connectivity; capillary entry pressures | 3 nm – 100 µm | Provides independent constraint on pore throat sizes for calibration and scaling of NMR-derived PSDs; supports permeability correlations | Destructive; insensitive to pore body size; assumes cylindrical throats; mercury accessibility limitations |
| Micro-CT | 3D pore geometry and connectivity (resolved pores) | 10 – 3000 µm | Visualizes pore networks underlying long- T2 components; aids interpretation of macropore-related relaxation | Resolution-limited; misses micro- and nanopores dominant in relaxation response |
| XRD | Bulk mineralogical composition; clay content; paramagnetic phases | Not pore-scale specific | Identifies mineralogical controls on surface relaxivity, wettability, and paramagnetic relaxation enhancement | No direct pore geometry or connectivity information |
Table 7.
Summary of Major LF-NMR Advances for Sandstone Reservoir Characterization.
| Study | Main challenge | LF-NMR advancement | Principal findings | Practical implication |
| Mitchell et al. [70] | Quantifying heterogeneity | Double-shot T1 measurements | T1 distributions successfully resolved both microscopic and macroscopic heterogeneity while reducing acquisition time | Enables rapid assessment of rock fabric and heterogeneity |
| Jácomo et al. [152] | Mineralogical effects on relaxation | Integrated NMR with SEM, micro-CT and magnetic measurements | Iron oxides and clay coatings shortened T2 independently of pore size | Mineralogy must be considered when interpreting relaxation times |
| Yang et al. [154] | Fluid mobility in tight sandstones | Combined NMR and MICP | Pores >0.1 μm dominate movable fluids; T2 cutoff varied significantly among samples | Demonstrates that T2 cutoff is formation-specific |
| Li et al. [160] | Accurate permeability prediction | Integration with PCP, SEM and microscopy | Three pore domains identified and new permeability model developed | Improves permeability estimation in tight sandstones |
| Wang et al. [161] | Lithology-dependent relaxation behavior | Comparative sandstone-carbonate analysis | Sandstones exhibited direct pore size-T2 relationships, unlike carbonates affected by pore coupling | Classical NMR models perform more reliably in sandstones than carbonates |
Table 8.
Summary of Major LF-NMR Advances for Carbonate Reservoir Characterization.
| Study | Main challenge | LF-NMR advancement | Principal findings | Practical implication |
| Ge et al. [30] | Reservoir quality assessment | T2 peak classification | Increasing number of T2 peaks correlated with increasing production potential | Peak distributions provide rapid reservoir quality screening |
| Da Silva et al. [162] | Permeability prediction | Machine learning using LF-NMR data | Random Forest and SMO significantly outperformed SDR and Timur-Coates models | AI captures complex nonlinear pore-flow relationships |
| Wang et al. [163] | Pore connectivity | Sphere-Cylinder model | Separate pore bodies and throats to estimate connectivity | Introduces connectivity into NMR interpretation beyond pore size alone |
| Aghda et al. [57] | Poor transferability of empirical equations | Reservoir-specific calibration of SDR and Timur-Coates | New empirical coefficients substantially improved permeability prediction | Classical equations require local calibration for carbonates |
| Ok et al. [11] | Fluid typing and wettability | Combined T1 and T2 relaxometry | T1/T2 ratios differentiated hydrocarbons from bound water and identified productive intervals | Multidimensional relaxation improves fluid characterization and reservoir evaluation |
Disclaimer/Publisher’s Note: The statements, opinions and data contained in all publications are solely those of the individual author(s) and contributor(s) and not of MDPI and/or the editor(s). MDPI and/or the editor(s) disclaim responsibility for any injury to people or property resulting from any ideas, methods, instructions or products referred to in the content. |
© 2026 by the authors. Licensee MDPI, Basel, Switzerland. This article is an open access article distributed under the terms and conditions of the Creative Commons Attribution (CC BY) license (http://creativecommons.org/licenses/by/4.0/).
Copyright: This open access article is published under a Creative Commons CC BY 4.0 license, which permit the free download, distribution, and reuse, provided that the author and preprint are cited in any reuse.


