
Preprint
Article

This version is not peer-reviewed.

AI‐Driven Credit‐Risk Stratification for Banking: A Leakage‐Controlled Ordinal Benchmark of Logistic Regression, Random Forest, XGBoost, and Neural Networks

Submitted:

20 July 2026

Posted:

22 July 2026

You are already at the latest version

Abstract
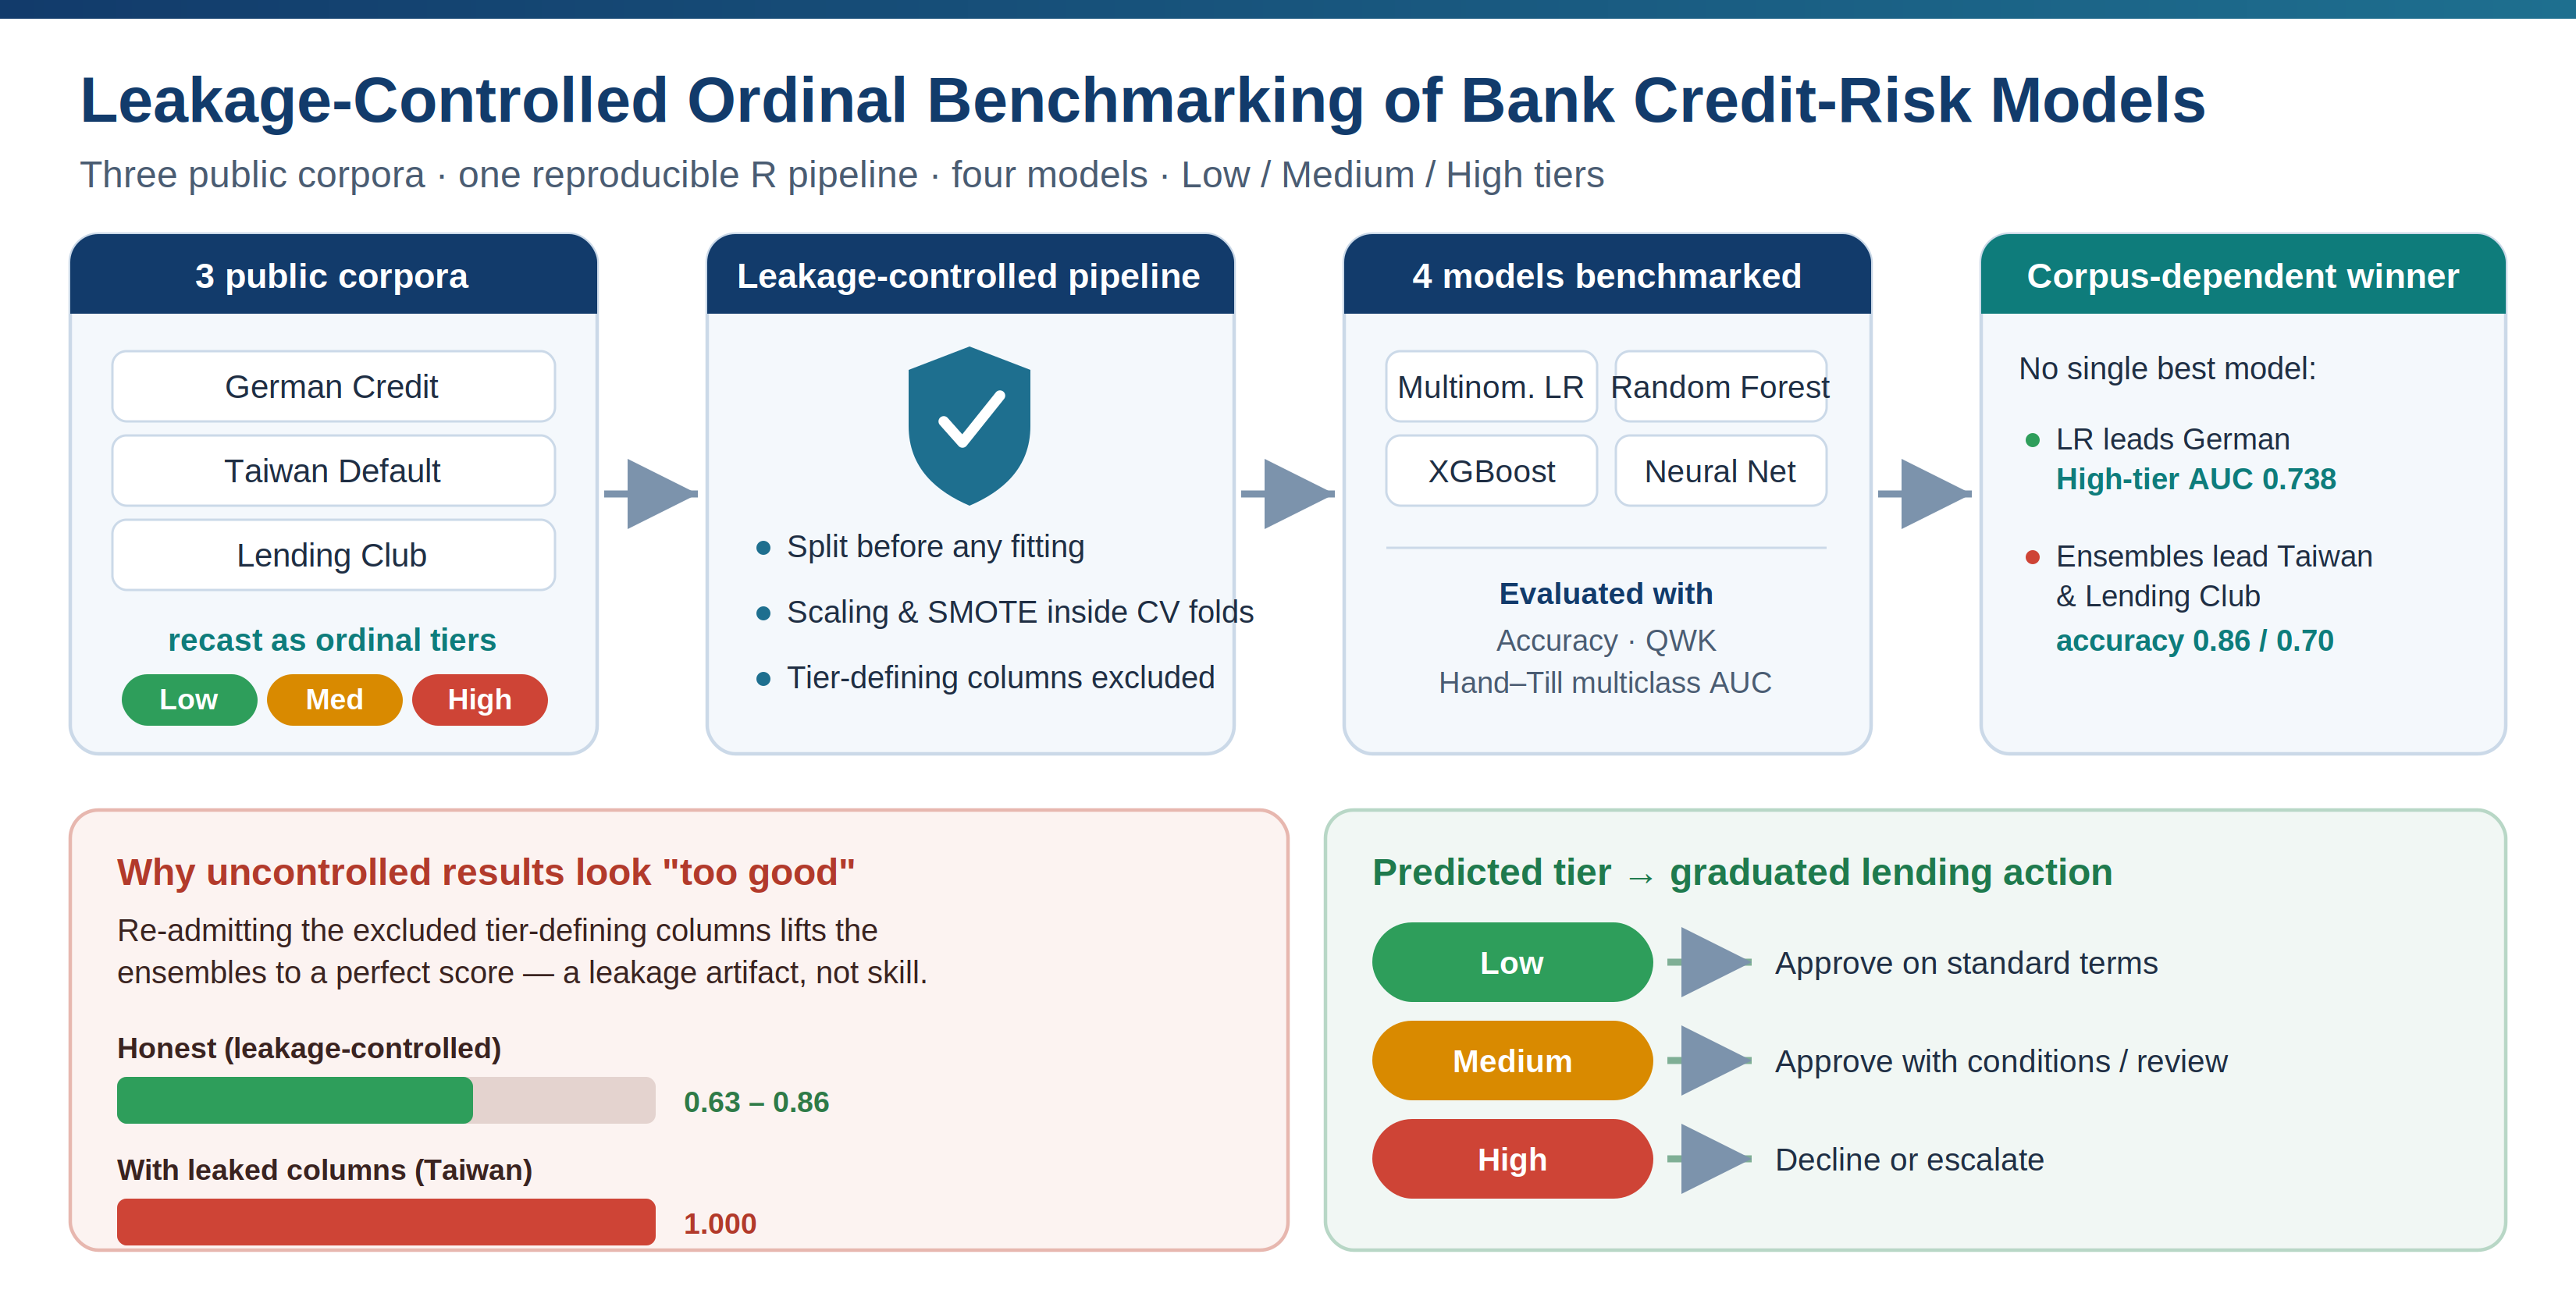
Retail-bank credit decisioning still relies on binary good/bad classifiers, and published results on the field's three canonical public corpora, German Credit, Taiwan Default, and Lending Club, are largely incommensurable because they differ in preprocessing placement, resampling design, and leakage control. This study contributes a leakage-controlled ordinal benchmark: multinomial logistic regression, random forest, XGBoost, and a neural network are compared on a three-tier (Low/Medium/High) formulation of all three corpora under one identical, fully reproducible R protocol in which the split precedes all fitting, scaling and SMOTE are estimated inside cross-validation folds, and tier-defining columns are excluded from the predictors. Under this protocol the best model is corpus-dependent: logistic regression leads on the small, weakly correlated German corpus (High-tier AUC 0.738), while tree ensembles lead on the larger Taiwan and Lending Club corpora (accuracy 0.86 and 0.70). Re-admitting the excluded columns lifts the ensembles to a perfect 1.000 on Taiwan, quantifying how much apparent performance uncontrolled designs can manufacture and explaining the wide spread of published results. The study also documents a multi-class probability-decoding fault that silently drives a trained model to chance, and maps predicted tiers to graduated lending actions for deployment.
Keywords: 
;  ;  ;  ;  ;  ;  ;  ;  

1. Introduction

Credit-risk quantification underpins the stability of the banking system and is increasingly intertwined with artificial intelligence (AI). Recent surveys document a rapid migration from rule-based and purely statistical scorecards toward learning-based and agentic systems across credit scoring, fraud detection, and regulatory technology (Ayari et al. 2025; Rizinski and Trajanov 2026; Shi et al. 2022). In parallel, the finance literature has begun to scrutinize how AI reshapes lending incentives, for example, by helping banks detect manipulated or “washed” disclosures and adjust loan terms accordingly (Liu and Li 2026; Zheng et al. 2026). Within this landscape, the operational core of consumer lending—separating creditworthy from non-creditworthy applicants—remains overwhelmingly binary, which oversimplifies a continuous risk spectrum and forecloses targeted treatment of intermediate-risk borrowers.
Credit scoring itself has evolved through three broad generations: judgmental and rule-based systems, statistical scorecards built on discriminant analysis and logistic regression, and, most recently, learning-based systems built on ensembles and neural networks (Baesens et al. 2003; Lessmann et al. 2015; Louzada, Ara, and Fernandes 2016). Progress in the third generation has been measured almost entirely on a small set of public benchmark corpora, of which the Statlog German Credit data, the Taiwan credit-card default data, and the Lending Club loan book are the most heavily used: systematic surveys consistently identify the German and Lending Club corpora as the most frequently reused public datasets in credit-risk research (Dastile, Celik, and Potsane 2020; Louzada, Ara, and Fernandes 2016), and hundreds of models have been fitted to each. A new study on these corpora therefore carries an obligation that this paper takes seriously: to state precisely what the existing results are, why they cannot be compared with one another, and what an additional study can add. Section 2.6 reviews that literature dataset by dataset; the short answer is that published results are largely incommensurable, for reasons that are methodological rather than algorithmic, and that they are almost exclusively binary.
Three limitations of binary scoring motivate the ordinal reformulation adopted here. First, a single threshold cannot distinguish a marginally risky applicant (who may be served with conditional terms) from an acutely risky one (who should be declined). Second, linear scorecards capture non-linear interactions among financial variables poorly. Third, the diversification of lending channels demands more granular, adaptive stratification. Machine learning addresses the second point well—tree ensembles in particular remain state-of-the-art on tabular data (Borisov et al. 2024; Grinsztajn, Oyallon, and Varoquaux 2022)—but introduces a persistent tension between predictive power and the interpretability demanded by model-risk governance.
A subtler obstacle, often unreported, is methodological: credit-scoring results are frequently inflated by target leakage, by preprocessing fitted before splitting, by labels that are deterministic functions of retained features, and by silent implementation faults in multi-class evaluation. Leakage is a leading cause of irreproducible machine-learning claims across scientific fields (Apicella, Isgrò, and Prevete 2025; Kapoor and Narayanan 2023), and Section 2.6 shows that published accuracies on the same credit corpus range from below 70% to above 95% depending on exactly these design choices. Both problems change conclusions, and both are controllable. This paper confronts them directly: we build one leakage-safe pipeline, run it unchanged on three heterogeneous datasets cast as the same ordinal three-tier problem, and report the honest numbers, including where models struggle and including a direct measurement of how much apparent accuracy the uncontrolled designs can manufacture.

1.1. Contributions

  • A leakage-controlled ordinal benchmark. To our knowledge, the first head-to-head comparison of multinomial logistic regression (MLR), random forest, XGBoost, and an artificial neural network (ANN) on an ordinal three-tier (Low/Medium/High) formulation of the German, Taiwan, and Lending Club corpora under one identical protocol: the split precedes all fitting, scaling and SMOTE are estimated inside each cross-validation fold, and tier-defining columns are excluded from the predictors. Existing work on these corpora is almost exclusively binary (Table 1).
  • A quantification of protocol-driven inflation. By reporting the transition from leaked to honest performance on the same data and models (Section 4.2: from 1.000 accuracy to 0.63–0.86), the study measures how much of the spread in published results on these corpora can be manufactured by preprocessing and resampling design alone, directly explaining why the results reviewed in Table 1 disagree.
  • Evidence against a universal winner. Under the controlled protocol the best model is corpus-dependent—MLR on the small, weakly correlated German corpus; tree ensembles on the larger Taiwan and Lending Club corpora—supporting protocol-conditional rather than universal model claims. The quadratic weighted kappa (QWK) is shown to reorder models relative to accuracy when errors concentrate in adjacent tiers.
  • A reproducible, deployable pipeline. A fully specified R/tidymodels implementation (pinned versions, fixed seed, serialized reload-and-score objects mapping tiers to graduated lending actions), together with a documented multi-class probability mis-decoding fault that silently drives a trained model to chance, and its diagnostic signature.
The remainder of the paper is organized as follows. Section 2 reviews related work, including a dataset-specific review of prior studies on the three corpora and the research gap; Section 3 describes the data and the controlled methodology; Section 4 reports results; Section 5 discusses the findings, compares them with the existing literature, and states limitations; Section 6 draws implications for AI, banking, and academia; and Section 7 concludes.

2. Literature Review

2.1. Machine Learning for Credit Scoring

Tree-based ensembles and gradient-boosted models continue to set the pace in applied credit scoring, with recent dedicated architectures reporting consistent gains over single classifiers and earlier ensembles on both consumer and small-firm portfolios (Akinjole et al. 2024; Liu, Fan, and Xia 2023; Zhou, Shen, and Ballester 2023). Subsequent evidence reinforced that tree-based models retain an edge over deep networks on heterogeneous tabular data (Borisov et al. 2024; Grinsztajn, Oyallon, and Varoquaux 2022). Systematic reviews confirm the dominance of ensembles and the growing use of hybrid and deep models, while flagging unresolved issues of reproducibility, fairness, and class imbalance (Ayari et al. 2025; Markov, Seleznyova, and Lapshin 2022; Mestiri 2024; Shi et al. 2022). A recent review of classification algorithms further shows that model ranking is sensitive to data traits (sample size, feature type, imbalance) and to the learning paradigm adopted, reinforcing the case for multi-dataset evaluation rather than single-corpus claims (Zhang and Yu 2024); metaheuristic feature-selection methods have likewise been surveyed as a complementary route to improving individual-level risk models (Paz et al. 2025), and alternative-data studies report that gradient-boosted ensembles continue to outperform classical baselines once non-traditional features are incorporated (Hlongwane, Ramaboa, and Mongwe 2024). Within this journal’s portfolio, comparative studies confirm the same pattern across settings: ensembles and deep networks lead machine-learning comparisons on credit-card customers (Chang et al. 2024) and on emerging-market loan-eligibility data (Nguyen et al. 2025), and machine learning improves corporate credit-rating assessment (de Oliveira and Basso 2025).

2.2. Imbalanced Credit Data

Defaulters typically form a minority class, biasing classifiers toward the majority. SMOTE (Chawla et al. 2002) and its variants remain the most common remedy; recent work studies the stability of model explanations under imbalance (Chen, Calabrese, and Martín-Barragán 2024), loss-function design for boosted trees (Mushava and Murray 2024), and generative oversampling with autoencoders and GANs (Oreski 2023). A frequently overlooked subtlety, central to this study, is that resampling must occur within cross-validation folds—and must not contaminate the evaluation distribution—to avoid optimistic bias.

2.3. Leakage and Reproducibility

Leakage is a leading cause of irreproducible machine-learning claims across scientific fields (Apicella, Isgrò, and Prevete 2025; Kapoor and Narayanan 2023). In credit scoring it appears in two forms controlled here: preprocessing fitted before splitting, and labels that are deterministic functions of retained features. A third, subtler form—evaluating on a synthetically resampled distribution rather than the natural one—recurs in the dataset-specific literature reviewed in Section 2.6.

2.4. Multi-Class and Ordinal Risk

While binary default classification dominates, multi-tier stratification recognizes the inherent ordering of risk and supports differentiated lending actions. Recent studies apply multi-class learners to corporate credit-rating prediction and report ensembles and neural networks as the leading performers (Darwish 2025; de Oliveira and Basso 2025); yet public, reproducible, head-to-head comparisons of statistical and machine-learning models under a common, leakage-controlled three-tier protocol remain rare. Dedicated ordinal learners—proportional-odds models and ordinal gradient-boosting variants—explicitly encode the Low < Medium < High ordering and are a natural baseline for tiered risk, though they remain comparatively underused in credit scoring. For evaluation, we use the Hand–Till generalization of AUC (Hand and Till 2001), the quadratic weighted kappa, and macro-averaged precision, recall, and F1.

2.5. Explainability and Governance

Regulatory expectations (e.g., the U.S. Federal Reserve’s SR 11-7, the EU GDPR’s “right to explanation,” and Basel model-risk principles) increasingly require transparency in credit models, motivating post hoc tools such as SHAP (Lundberg and Lee 2017) and LIME (Ribeiro, Singh, and Guestrin 2016) and a renewed appreciation of intrinsically interpretable baselines such as logistic regression. Application-level studies reinforce this trend, reporting SHAP-based explanations for deep and ensemble credit-default classifiers (Ariza-Garzón et al. 2020; Hjelkrem and de Lange 2023; Talaat et al. 2024; Zhu et al. 2023), explainable FinTech lending frameworks (Babaei, Giudici, and Raffinetti 2023; Bussmann et al. 2021), and dedicated metrics for quantifying AI-specific model risk under supervisory frameworks (Giudici, Centurelli, and Turchetta 2024). At the same time, recent evidence cautions that post hoc explanations are themselves fragile: SHAP attributions lose consistency under class imbalance and cost-sensitive designs (Ballegeer, Bogaert, and Benoit 2025) and vary with random seed initialization even at fixed data and hyperparameters (Lin and Wang 2025)—a reproducibility concern that parallels, in the explanation space, the leakage concerns this paper addresses in the performance space. Broader reviews of AI agents in finance similarly identify interpretability and accountability as first-order open problems (Rizinski and Trajanov 2026).

2.6. Prior Studies on the Three Benchmark Corpora

Because the German, Taiwan, and Lending Club corpora are among the most reused datasets in credit-risk research, we review the studies closest to ours on each corpus and tabulate representative entries in Table 1. The purpose is not exhaustiveness—systematic surveys catalogue hundreds of entries (Dastile, Celik, and Potsane 2020; Louzada, Ara, and Fernandes 2016; Markov, Seleznyova, and Lapshin 2022)—but to establish what has been found, under what protocols, and why the reported numbers cannot be pooled.
German Credit (UCI Statlog). The German corpus (1000 applicants, 20 attributes) has served as a standard test bed since the classifier benchmark of Baesens et al. (2003) and its 41-classifier update by Lessmann et al. (2015), both of which placed ensembles at or near the top while noting that differences among well-tuned classifiers are small on a corpus of this size. Trivedi (2020) showed on the same data that the accuracy ranking shifts with the feature-selection method, with tree ensembles performing best. Hussin Adam Khatir and Bee (2022) crossed classifiers with feature-selection and data-balancing techniques on the German data and reported random forest with recursive feature elimination and random oversampling as the best combination, and Mapfumo and Shongwe (2026) reported that SMOTE-ENN resampling combined with a multilayer perceptron attains an F1-score of 0.928 (accuracy 95.4%) on the German data—a figure obtained after aggressive synthetic resampling, and roughly thirty accuracy points above what any model achieves under the leakage-controlled protocol of the present study. This spread within a single small corpus is itself evidence for our thesis that protocol, not algorithm, drives much of the reported variation.
Taiwan Credit-Card Default. The Taiwan corpus (30,000 clients) originates with Yeh and Lien (2009), who compared six methods and found neural networks best for estimating the probability of default. Subsequent work has concentrated on the corpus’s pronounced class imbalance: Alam et al. (2020) evaluated a large grid of classifiers and resampling schemes across imbalanced credit corpora including Taiwan and reported that gradient-boosted trees with oversampling dominate, while Chang et al. (2024) compared machine-learning and deep-learning models on credit-card customer data of the same structure and likewise found ensemble methods strongest. Mapfumo and Shongwe (2026) reported SMOTE-ENN with random forest as the best Taiwan combination (F1 = 0.789); Bhandary and Ghosh (2025) contrasted statistical and machine-learning methods for credit-card default prediction on data of this type; and Lin and Wang (2025) used the same UCI Taiwan corpus to show that SHAP feature rankings from XGBoost are unstable across random seeds for mid-importance features, adding a reproducibility dimension to the corpus’s literature. Across these studies the label is binary (default next month), resampling is often applied before or outside cross-validation, and evaluation is sometimes conducted on the resampled distribution—three choices our protocol reverses.
Lending Club. The Lending Club loan book is the canonical peer-to-peer corpus. Malekipirbazari and Aksakalli (2015) established random forests as a strong default predictor on it; Serrano-Cinca, Gutiérrez-Nieto, and López-Palacios (2015) identified loan grade and indebtedness as dominant determinants of default; Ariza-Garzón et al. (2020) combined gradient boosting with SHAP to make a Lending Club granting model explainable; Chen et al. (2021) addressed its class imbalance directly; Kim and Cho (2019) applied deep networks to repayment prediction; and Suhadolnik, Ueyama, and Da Silva (2023) benchmarked ten statistical and machine-learning algorithms on more than 1.3 million Lending Club records, with XGBoost (accuracy 80.4%) clearly outperforming logistic regression (65.7%). As with the other two corpora, the published Lending Club literature is binary, uses heterogeneous vintage windows and feature sets, and rarely audits leakage: several high-accuracy studies retain post-origination payment fields whose inclusion makes the task nearly trivial.

2.7. Research Gap

Although hundreds of studies have evaluated credit-scoring models on the German, Taiwan, and Lending Club corpora, Table 1 shows that their reported performance is not directly comparable: preprocessing is fitted at different points in the pipeline; resampling is variously applied before splitting, outside cross-validation, or to the evaluation set itself; validation strategies and vintage windows differ; and evaluation metrics are heterogeneous. Consequently, it remains unclear how much of the spread in published results—from below 70% to above 95% accuracy on the same corpus—reflects genuine algorithmic superiority rather than methodological inconsistency. Moreover, the literature offers no ordinal, multi-tier baseline: the three corpora have been studied almost exclusively as binary problems. This study addresses both gaps. It evaluates MLR, random forest, XGBoost, and an ANN under a single leakage-controlled, fully reproducible protocol applied identically across all three corpora; recasts each corpus as the same ordinal three-tier problem evaluated with ordinal-aware metrics (quadratic weighted kappa alongside the Hand–Till AUC); and quantifies directly—by reporting the transition from leaked to honest performance—how much apparent accuracy the uncontrolled designs in Table 1 can manufacture. More broadly, existing studies focus primarily on improving predictive performance by proposing new algorithms or resampling schemes, whereas comparatively little attention has been devoted to establishing standardized, leakage-controlled benchmarking frameworks that enable fair comparisons across widely used credit-risk datasets. The core contribution of this study is therefore methodological standardization rather than another model comparison: a single controlled protocol against which past and future results on these corpora can be calibrated. We now turn to the data and the controlled setup that operationalize this commitment.

3. Data and Methodology

The pipeline is implemented in R 4.6.0 (R Core Team 2026) using the tidymodels framework (Kuhn and Wickham 2020) (recipes, rsample, parsnip, workflows, themis, yardstick). A single configuration file holds the dataset registry, seed, fold count, and column rules; the same code path runs on every dataset.

3.1. Datasets

Three publicly available, geographically and temporally diverse credit corpora are used (Table 2), each cast independently as the same Low/Medium/High problem. German Credit (Hofmann 1994) provides 1000 applicants over 20 attributes; Taiwan Credit Card Default (Yeh and Lien 2009) provides 30,000 clients with six months of repayment behavior; the Lending Club sample provides approximately 48,800 loans (Lending Club 2019). Unlike a single-dataset study, running one identical pipeline on all three supports a genuine cross-domain comparison.

3.2. Three-Tier Target Construction

Each dataset is mapped to Low/Medium/High by a transparent, dataset-specific rule (Table 3). For German Credit, a domain-weighted risk score sᵢ ∈ [0,100] over credit history, debt burden, savings, loan duration, and employment is discretized:
RiskTierᵢ = Low if 0 ≤ sᵢ ≤ 33; Medium if 34 ≤ sᵢ ≤ 66; High if 67 ≤ sᵢ ≤ 100 (1)
For Taiwan, the tier is the worst recent repayment delay across the six monthly status fields; for Lending Club, the lender-assigned grade is collapsed into three bands. The tiers map to graduated lending actions (Table 4).
Nature of the target: engineered proxy versus observed outcome. In all three datasets, the Low/Medium/High label is an engineered proxy constructed from observed attributes by the rules in Table 3, not an externally observed default event. The task is therefore proxy classification: the models predict a rule-derived risk tier rather than a realized credit outcome. Because each rule is a deterministic function of specific columns, some retained predictors remain structurally correlated with the constructed label even after the tier-defining columns are excluded (Section 3.4); results should be read with this proxy nature in mind. Three considerations nonetheless make the proxy formulation appropriate for the benchmarking purpose of this study. First, it is the only construction that yields a common ordinal target across all three corpora, which is precisely what a cross-dataset protocol comparison requires; observed multi-tier outcomes are not publicly available for these datasets. Second, because each rule is transparent and fully specified (Table 3), the labels are exactly reproducible—unlike proprietary risk grades—so any researcher can regenerate the benchmark. Third, the tiers mirror how lenders operationalize risk in practice: the Lending Club tiers collapse an actual lender-assigned grade, and the Taiwan tiers encode observed delinquency severity, so predicting them approximates the decision-support task of reproducing an institution’s graduated risk assessment from origination-time attributes. The German tiers are the most artificial of the three and are retained primarily as a small, controlled example.
Ordinal target, nominal learners. Although the risk tiers are ordinal (Low < Medium < High), all four models are trained under a nominal multi-class formulation that does not exploit this ordering. Ordinal-aware modelling (e.g., proportional-odds baselines) is deliberately reserved for future work in order to preserve benchmarking parity within the controlled setup across the four nominal learners (Section 7).

3.3. Exploratory Analysis

The datasets differ markedly in structure. Figure 1 shows that the German Credit numeric predictors are weakly correlated, supporting retention of the full feature set; the Low tier is very small (2.5%), which later depresses macro-averaged metrics. Taiwan (Figure 2) exhibits strong block correlation among the six monthly bill amounts and moderate correlation among payment amounts, while demographics are nearly independent. The Lending Club sample (Figure 3) shows mostly weak correlations with a few tightly coupled groups (e.g., the two FICO bounds are near-collinear). Distributions for all three corpora are shown in Figure 4, Figure 5 and Figure 6. These correlation structures also indicate redundancy among predictors: near-collinear groups (the two FICO bounds in Lending Club and the block of monthly bill amounts in Taiwan) carry largely overlapping variance, whereas the weakly correlated German predictors contribute more independent information. The distribution panels are right-skewed for monetary variables (credit amount, bill and payment amounts, income), with the dashed line marking the mean to the right of the median, motivating the standardization step, while bounded and categorical variables show modal concentration. All plots in Figure 1, Figure 2, Figure 3, Figure 4, Figure 5 and Figure 6 use the same preprocessing and scaling rules across datasets, so visual differences reflect the data rather than plotting choices.

3.4. Leakage-Safe Preprocessing Protocol

Three safeguards are enforced, in order:
  • Split first. An 80/20 stratified split (seed 123) is taken on the raw, labelled data before any transformation, isolating the test set.
  • Fit preprocessing inside resamples. These steps are applied in a fixed order inside a single recipe: (i) one-hot encoding of nominal variables, (ii) median imputation of missing values, (iii) zero-variance predictor removal, (iv) standardization, and (v) SMOTE oversampling (Chawla et al. 2002). The recipe is re-estimated within each of five cross-validation folds on the training partition only; SMOTE (k = 5) is applied solely within training folds, avoiding synthetic leakage, and the scaler never sees test rows. Evaluation is always performed on the untouched, natural class distribution.
  • Exclude tier-defining columns. Because each tier is derived from specific columns (Table 3), those columns are removed from the predictors: the five score inputs for German, the six PAY_* fields for Taiwan, and the grade-deterministic fields (grade, sub-grade, interest rate, installment) for Lending Club. Otherwise, a model trivially recovers the labelling rule.
For Lending Club, we additionally remove all post-origination columns (payments, recoveries, last-FICO, hardship, and settlement fields), dates, identifiers, and sparse joint/secondary-applicant fields, retaining only attributes available at origination—the realistic information set for predicting the assigned risk band.

3.5. Models

All four families are trained through the identical recipe, so differences reflect the learner rather than the preprocessing.
  • MLR. Penalized multinomial logistic regression (glmnet); class probabilities follow the softmax form in Equation (2), in which each risk tier k has its own coefficient vector βₖ (k = 1, …, K, with K = 3 tiers) and the denominator sums over all K tiers; coefficients are interpretable as log-odds relative to a reference tier.
P(yᵢ = k | xᵢ) = exp(βₖᵀxᵢ) / Σⱼ₌₁ᴷ exp(βⱼᵀxᵢ), k = 1, …, K
  • Random Forest. 500 trees (ranger) with impurity importance; class assigned by majority vote across decorrelated bootstrap trees (Breiman 2001; Liaw and Wiener 2002).
  • XGBoost. Regularised gradient boosting (xgboost), max_depth = 6, η = 0.05, 300 rounds, 0.8 subsampling (Chen and Guestrin 2016). Multi-class probabilities are decoded by the framework, avoiding the manual reshape fault discussed in Section 4.5.
  • ANN. A single-hidden-layer feed-forward network (nnet).

3.6. Model Persistence and Inference

Each fitted workflow—the preprocessing recipe plus the model—is serialized as a single object. During inference, the object ingests a raw applicant record and applies the same encoding, scaling, and column alignment before predicting the tier and class probabilities. Preprocessing is frozen at training time: the serialized workflow stores the recipe estimated on the training data and applies it unchanged at inference, with no per-record re-fitting. This decouples one-time training from repeated, lightweight scoring and supports on-premises or server-side deployment without re-implementing preprocessing.

3.7. Evaluation Metrics

Models are assessed by accuracy; macro-averaged precision, recall, and F1; the multi-class AUC computed by the Hand–Till pairwise decomposition averaged across all class pairs (Hand and Till 2001); and Cohen’s κ,
κ = (pₒ − pₑ) / (1 − pₑ) (3)
where pₒ is observed agreement and pₑ is chance agreement. We additionally report the quadratic weighted kappa (QWK), an ordinal agreement measure that penalizes errors in proportion to their squared distance from the true tier, and the High-tier one-vs-rest AUC, the most operationally consequential single-tier measure. The Hand–Till and High-tier AUCs are distinct quantities—the former summarizes separability over all tier pairs, the latter a single one-vs-rest contrast—and are therefore not directly comparable. In broad terms, AUC captures ranking quality, whereas QWK captures the ordinal severity of misclassifications. Package versions are pinned with renv for reproducibility.

4. Results

4.1. Comparative Performance

Table 5 reports held-out test performance for all four models on all three datasets. Two patterns are evident: task difficulty tracks the available signal, and the best model depends on the dataset. German appears most challenging under the current proxy formulation once the score’s own inputs are withheld; Taiwan shows the strongest separability under its engineered labelling scheme; Lending Club is intermediate. Model superiority is metric-dependent; results are therefore reported per metric and per dataset (bold in Table 5) without aggregating to a single global winner. On German, MLR leads precision, recall, F1, and QWK, random forest leads accuracy and κ, and XGBoost leads the Hand–Till AUC; on Taiwan, random forest leads accuracy, precision, F1, κ, and QWK, while XGBoost leads recall and AUC; on Lending Club, XGBoost leads every metric except recall, where MLR is highest. Probabilities are not calibrated, so AUC and QWK should be read as measures of ranking quality and ordinal agreement rather than probability accuracy; future work will assess calibration using the Brier score and reliability diagrams (Section 7). Table 5 also reports the quadratic weighted kappa, an ordinal-aware agreement measure that credits near-neighbour errors (Low–Medium, Medium–High) more than extreme ones (Low–High); comparing QWK with the unweighted κ therefore indicates how concentrated the errors are among adjacent tiers. In practice, QWK exceeds κ for ten of the twelve model–dataset combinations, markedly so on Taiwan and Lending Club, indicating that most misclassifications fall between adjacent tiers rather than between Low and High; the two German ensembles are marginal exceptions. In such imbalanced settings, the QWK ranking thus aligns more closely with operational tier adjacency than macro-averaged F1 does. The ranking can also shift: on German, MLR attains the highest QWK (0.31) although random forest leads on κ and accuracy, because MLR’s errors are predominantly one tier off, whereas on Taiwan and Lending Club the QWK leader (random forest and XGBoost, respectively) coincides with the accuracy leader.

4.2. Why Leakage Matters: An Inflated-Accuracy Cautionary Result

Before excluding the tier-defining columns, both tree ensembles reached exactly 1.000 accuracy and AUC on Taiwan, and German approached the ceiling. This is a clear signature of target leakage: the model reads the label off its own inputs. Removing those columns produces the honest numbers in Table 5; German falls to 0.63 accuracy and Taiwan to 0.86. We report this transition explicitly because such inflated performance—a systematic bias introduced by preprocessing leakage rather than genuine predictive skill—is common in the literature and rarely flagged. Section 5.2 uses this measured transition to interpret the spread of published results on the same corpora.

4.3. ROC Analysis: High-Tier Discrimination

Figure 7, Figure 8 and Figure 9 show one-vs-rest ROC curves for the High tier on each dataset. The High tier is the most separable risk tier, and its one-vs-rest AUC exceeds the Hand–Till values in Table 5. Because the two AUCs are computed differently (one-vs-rest versus all-pairs), this gap reflects the difference in definition as well as genuine separability and should not be read as a like-for-like improvement.
German (most challenging).Figure 7 shows MLR achieving the best High-tier AUC (0.738), followed by random forest (0.697), XGBoost (0.679), and the ANN (0.617). The linear model’s strength on this small, weakly correlated corpus suggests that the remaining features (after excluding the score’s own inputs) carry limited non-linear signal.
Taiwan (strongest separability).Figure 8 shows random forest and XGBoost tied at the top (AUC = 0.954), with the ANN close behind (0.930) and MLR trailing (0.815). The strong bill-amount and payment structure provides a rich signal that tree ensembles exploit effectively.
Lending Club (intermediate).Figure 9 shows XGBoost leading (AUC = 0.871), followed by random forest (0.851), MLR (0.845), and the ANN (0.838). The larger feature space (~60 predictors) and mixed data types favour gradient boosting’s regularised greedy structure.

4.4. Feature Importance

Importances are coherent with domain expectations. Within each panel, the scores are normalized to a common scale for readability; the measures are model-specific (random forest mean-decrease statistics versus XGBoost gain) and are not directly comparable across algorithms, so rankings rather than magnitudes should be compared. In both cases, importance reflects internal model heuristics rather than causal effect.
German Credit.Figure 10 shows that existing_credits, checking_account_A14, and residence_duration dominate the random forest rankings by both Mean Decrease in Accuracy and Mean Decrease in Gini. Figure 11 confirms that XGBoost ranks existing_credits, age, and residence_duration highest.
Taiwan.Figure 12 shows payment amounts (PAY_AMT1–2), bill amounts, and the credit limit drive the random forest model—unsurprising given the delinquency-severity target. Figure 13 confirms limit_bal, pay_amt1, and pay_amt2 as the top XGBoost features.
Lending Club.Figure 14 shows loan term (term_X60.months), the lower FICO bound, recent inquiries, and the debt-to-income ratio as most informative, mirroring the factors a lender uses to grade a loan at origination. Figure 15 confirms term_X60.months and fico_range_low as the dominant XGBoost features.

4.5. A Note on a Common Multi-Class Decoding Fault

We document here a diagnostic implementation failure observed during development: a learner returned chance-level accuracy (≈0.35 for three balanced classes) and AUC ≈0.50 while its feature importances remained sensible—an internally contradictory pattern that localizes the fault after fitting. The cause was a manual reshape of the flat multi-class probability vector that scrambled the class assignments; delegating decoding to the modelling framework eliminates it. We document this because such faults silently corrupt comparisons and are easily mistaken for a weak model.

5. Discussion

5.1. Dataset-Dependent Winners and the Signal–Model Interaction

The results do not support a single “best algorithm” claim. On the small, weakly correlated German corpus, MLR achieves the best High-tier AUC (0.738), suggesting that the residual features carry primarily linear signal once the score’s own inputs are excluded. On the larger corpora, tree ensembles lead: XGBoost on Lending Club, tying with random forest on Taiwan. This pattern is consistent with recent tabular benchmarks (Grinsztajn, Oyallon, and Varoquaux 2022) and with the data-trait sensitivity documented by Zhang and Yu (2024). Because the tiers are engineered proxies and only three corpora are examined, these rankings are conditional on dataset characteristics and should not be read as universal.

5.2. Comparison with Existing Literature

Our honest numbers sit well below the headline figures published for the same corpora, and this difference is informative rather than anomalous. Table 6 juxtaposes representative published results with ours. Three protocol differences account for the gap. First, the task: the published figures are binary, whereas ours are three-class; a three-class accuracy of 0.63 on German corresponds to a much harder decision problem, with a chance level of roughly one-third rather than one-half. Second, resampling design: the highest published German figures follow aggressive synthetic resampling (e.g., SMOTE-ENN in Mapfumo and Shongwe 2026), in some designs applied before splitting or reflected in the evaluation distribution; our pipeline confines SMOTE to the training folds and evaluates on the untouched natural distribution. Third, leakage: we exclude the tier-defining columns, and Section 4.2 shows that re-admitting them alone lifts our own ensembles to a perfect 1.000 on Taiwan—matching or exceeding the most optimistic published numbers and demonstrating concretely how such numbers can arise. Under this reading, the literature’s upper range and our results are not in conflict: they measure different quantities, and only the leakage-controlled quantity estimates deployable performance on new applicants. Where protocols are closest, the results agree: our Taiwan random-forest F1 of 0.773 on the natural test distribution is comparable to the 0.789 reported by Mapfumo and Shongwe (2026) under resampling, and the qualitative ordering—ensembles ahead of single learners on large corpora—matches Baesens et al. (2003), Lessmann et al. (2015), Chang et al. (2024), and Ariza-Garzón et al. (2020).

5.3. Tree Ensembles and the Interpretability–Accuracy Trade-Off

MLR remains attractive for governance (SR 11-7; Basel), but trails the ensembles by a wide margin on the two larger corpora (e.g., Taiwan accuracy 0.46 vs. 0.86). A pragmatic deployment pairs a high-performing ensemble as the scorer with MLR as an interpretable challenger and post hoc explanations (Babaei, Giudici, and Raffinetti 2023; Hjelkrem and de Lange 2023; Lundberg and Lee 2017; Ribeiro, Singh, and Guestrin 2016; Talaat et al. 2024) for audit.

5.4. Imbalance Shapes the Metrics

German’s macro-F1 (~0.43) is much lower than its accuracy (~0.63) because the Low tier is only 2.5% of cases; macro-averaging penalizes poor minority recall even when overall accuracy is moderate. Per-tier reporting, not accuracy alone, is essential in credit applications; SMOTE within folds mitigates, but does not erase, this effect.

5.5. Genuine Prediction, Not Rule Recovery

Excluding each tier’s defining columns removes the trivial leakage that previously produced near-perfect scores. The honest numbers therefore reflect prediction from the remaining attributes: German is genuinely challenging under this proxy formulation (the residual features carry limited information about the engineered tier), whereas the larger observed-behavior datasets (Taiwan, Lending Club) are far more learnable. We retain German as a transparent, controlled example whose modest numbers are the defensible ones.

5.6. Limitations

(i) German and Taiwan tiers are still derived from attributes partially correlated with retained features, so they lean toward rule recovery despite the exclusions; an externally observed default outcome would be preferable. (ii) Probabilities are not calibrated, and reliability has not been assessed (e.g., via the Brier score or calibration curves). (iii) We do not audit fairness: no disparate-impact or equalized-odds analysis across protected groups (e.g., age, sex, and marital status in Taiwan) is performed, so fairness gaps in both the proxy labels and the predictions remain uncharacterized. (iv) Evaluation uses random, not temporal, splits. (v) The ordinal structure is reflected in the target only; no ordinal baseline (e.g., a proportional-odds model) is evaluated, so the ordinal framing describes the labels rather than the learners; this choice preserves benchmarking parity across the four models, with ordinal-aware baselines deferred accordingly. (vi) Differences among models are reported descriptively; formal significance testing across cross-validation folds (e.g., a Friedman test with Nemenyi post hoc analysis) is a natural extension. Each of these limitations is revisited in Section 7.

6. Implications for AI, Banking, and Academia

For AI/ML research. The study is a concrete case study in leakage-aware, reproducible tabular machine learning: a split-first, resample-internal recipe makes leakage structurally difficult, and a configuration-driven design lets one pipeline serve many datasets. It adds evidence that the “best” model depends on corpus size and signal structure, and records two reproducibility hazards with their diagnostic signatures.
For banking and fintech. The ordinal three-tier framing is directly actionable: it supports graduated decisions, threshold-setting to institutional risk appetite, and an audit-friendly pairing of an ensemble scorer with an interpretable challenger. The single-object, reload-and-score deployment pattern enables consistent on-premises scoring.
For academia and pedagogy. The work provides a transparent, fully specified, three-dataset benchmark and a documented protocol that students and researchers can replicate and extend. By foregrounding the 100%-to-honest transition, it is a teachable demonstration of how leakage manufactures spurious successes for courses on machine learning, reproducible research, and financial analytics.

7. Conclusions and Future Work

We presented a reproducible framework for ordinal three-tier credit-risk classification, with structural safeguards against leakage, and applied it identically to three heterogeneous benchmark datasets on which the existing literature is extensive but methodologically incommensurable. After enforcing a split-first, resample-internal protocol and excluding tier-defining columns, the honest results are defensible and context-dependent: MLR leads on the most challenging corpus (German High-tier AUC 0.738), while tree ensembles lead on the larger, signal-rich corpora (XGBoost on Lending Club; RF/XGBoost effectively tied on Taiwan), with all comparisons interpreted within rather than across datasets. We showed that omitting these safeguards can lead to artificially inflated or near-perfect performance depending on feature overlap and model capacity—our own ensembles reach a perfect 1.000 on Taiwan when the excluded columns are re-admitted—which explains, and quantifies, the upper range of accuracies published for these corpora. We also documented a multi-class decoding fault that masquerades as a weak model.
Future work is organized at three levels, in descending order of priority. At the data level, we will replace the engineered proxy tiers with externally observed multi-tier outcomes (e.g., realized delinquency buckets) so the task measures prediction rather than rule recovery. At the model level, we will evaluate deep tabular architectures (TabNet, Arik and Pfister 2021; FT-Transformer, Gorishniy et al. 2021) and ordinal-aware, cost-sensitive objectives (e.g., proportional-odds and ordinal-boosting formulations) that respect the Low < Medium < High ordering, and will add formal significance testing across folds (Friedman/Nemenyi). At the evaluation level, we will calibrate probabilities (assessing the Brier score and reliability curves) and map them to expected-loss-optimal thresholds, adopt temporal and cross-institution validation, and audit fairness across protected groups while integrating SHAP/LIME explanations into the decision record.

Author Contributions

Conceptualization, H.M. and I.M.M.; methodology, H.M. and I.M.M.; software, H.M.; validation, H.M. and I.M.M.; formal analysis, H.M. and I.M.M.; investigation, H.M. and I.M.M.; resources, H.M. and I.M.M.; data curation, H.M. and I.M.M.; writing—original draft preparation, H.M.; writing—review and editing, H.M. and I.M.M.; visualization, H.M. and I.M.M.; supervision, I.M.M.; project administration, H.M. and I.M.M. All authors have read and agreed to the published version of the manuscript.

Funding

This research received no external funding.

Institutional Review Board Statement

Not applicable. This study analyzes publicly available, fully anonymized secondary datasets and involved no interaction with human subjects and no access to identifiable private information.

Data Availability Statement

The data presented in this study are available in public repositories. These data were derived from the following resources available in the public domain: the Statlog German Credit dataset (UCI Machine Learning Repository, https://doi.org/10.24432/C5NC77); the Taiwan Credit Card Default dataset (UCI Machine Learning Repository; Yeh and Lien 2009); and the Lending Club loan dataset (Kaggle, https://www.kaggle.com/datasets/wordsforthewise/lending-club). The complete R pipeline that reproduces every result, figure, and table reported in this study—with all package versions pinned via renv and a fixed random seed (123)—is openly available on GitHub at https://github.com/HarunaInyass/credit-risk-benchmark and permanently archived on Zenodo at https://doi.org/10.5281/zenodo.21397643. No new data were generated; all input datasets are the public corpora cited above.

Acknowledgments

During the preparation of this manuscript, the authors used a generative AI assistant for language editing and formatting support. The authors have reviewed and edited all content and take full responsibility for the content of this publication.

Conflicts of Interest

The authors declare no conflicts of interest.

References

  1. Akinjole, Abisola; Shobayo, Olamilekan; Popoola, Jumoke; Okoyeigbo, Obinna; Ogunleye, Bayode. Ensemble-Based Machine Learning Algorithm for Loan Default Risk Prediction. Mathematics 2024, 12, 3423. [Google Scholar] [CrossRef]
  2. Alam, Talha Mahboob; Shaukat, Kamran; Hameed, Ibrahim A.; Luo, Suhuai; Sarwar, Muhammad Umer; Shabbir, Shakir; Li, Jiaming; Khushi, Matloob. An Investigation of Credit Card Default Prediction in the Imbalanced Datasets. IEEE Access 2020, 8, 201173–98. [Google Scholar] [CrossRef]
  3. Apicella, Andrea; Isgrò, Francesco; Prevete, Roberto. Don’t Push the Button! Exploring Data Leakage Risks in Machine Learning and Transfer Learning. Artif. Intell. Rev. 2025, 58, 339. [Google Scholar] [CrossRef]
  4. Arik, Sercan Ö.; Pfister, Tomas. TabNet: Attentive Interpretable Tabular Learning. Paper presented at the AAAI Conference on Artificial Intelligence, 2021; vol. 35, pp. 6679–87. [Google Scholar] [CrossRef]
  5. Ariza-Garzón; Janny, Miller; Arroyo, Javier; Caparrini, Antonio; Segovia-Vargas, María-Jesús. Explainability of a Machine Learning Granting Scoring Model in Peer-to-Peer Lending. IEEE Access 2020, 8, 64873–90. [Google Scholar] [CrossRef]
  6. Ayari, Helmi; Guetari, Ramzi; Kraïem, Naoufel. Machine Learning Powered Financial Credit Scoring: A Systematic Literature Review. Artif. Intell. Rev. 2025, 59, 13. [Google Scholar] [CrossRef]
  7. Babaei, Golnoosh; Giudici, Paolo; Raffinetti, Emanuela. Explainable FinTech Lending. J. Econ. Bus. 2023, 125–126, 106126. [Google Scholar] [CrossRef]
  8. Baesens, Bart; Van Gestel, Tony; Viaene, Stijn; Stepanova, Maria; Suykens, Johan; Vanthienen, Jan. Benchmarking State-of-the-Art Classification Algorithms for Credit Scoring. J. Oper. Res. Soc. 2003, 54, 627–35. [Google Scholar] [CrossRef]
  9. Ballegeer, Matteo; Bogaert, Matthias; Benoit, Dries F. Evaluating the Stability of Model Explanations in Instance-Dependent Cost-Sensitive Credit Scoring. Eur. J. Oper. Res. 2025, 326, 630–40. [Google Scholar] [CrossRef]
  10. Bhandary, Rakshith; Ghosh, Bidyut Kumar. Credit Card Default Prediction: An Empirical Analysis on Predictive Performance Using Statistical and Machine Learning Methods. J. Risk Financ. Manag. 2025, 18, 23. [Google Scholar] [CrossRef]
  11. Borisov, Vadim; Leemann, Tobias; Seßler, Kathrin; Haug, Johannes; Pawelczyk, Martin; Kasneci, Gjergji. Deep Neural Networks and Tabular Data: A Survey. IEEE Trans. Neural Netw. Learn. Syst. 2024, 35, 7499–519. [Google Scholar] [CrossRef] [PubMed]
  12. Breiman, Leo. Random Forests. Mach. Learn. 2001, 45, 5–32. [Google Scholar] [CrossRef]
  13. Bussmann, Niklas; Giudici, Paolo; Marinelli, Dimitri; Papenbrock, Jochen. Explainable Machine Learning in Credit Risk Management. Comput. Econ. 2021, 57, 203–16. [Google Scholar] [CrossRef]
  14. Chang, Victor; Sivakulasingam, Sharuga; Wang, Hai; Wong, Siu Tung; Ganatra, Meghana Ashok; Luo, Jiabin. Credit Risk Prediction Using Machine Learning and Deep Learning: A Study on Credit Card Customers. Risks 2024, 12, 174. [Google Scholar] [CrossRef]
  15. Chawla, Nitesh V.; Bowyer, Kevin W.; Hall, Lawrence O.; Kegelmeyer, W. Philip. SMOTE: Synthetic Minority Over-Sampling Technique. J. Artif. Intell. Res. 2002, 16, 321–57. [Google Scholar] [CrossRef]
  16. Chen, Tianqi; Guestrin, Carlos. XGBoost: A Scalable Tree Boosting System. Paper presented at the 22nd ACM SIGKDD International Conference on Knowledge Discovery and Data Mining, San Francisco, CA, USA, 2016; pp. 785–94. [Google Scholar] [CrossRef]
  17. Chen, Yan-Ru; Leu, Jenq-Shiou; Huang, Sheng-An; Wang, Jui-Teng; Takada, Jun-Ichi. Predicting Default Risk on Peer-to-Peer Lending Imbalanced Datasets. IEEE Access 2021, 9, 73103–9. [Google Scholar] [CrossRef]
  18. Chen, Yujia; Calabrese, Raffaella; Martín-Barragán, Belén. Interpretable Machine Learning for Imbalanced Credit Scoring Datasets. Eur. J. Oper. Res. 2024, 312, 357–72. [Google Scholar] [CrossRef]
  19. Darwish, Jumanah A. Optimization and Prediction of Corporate Credit Rating through Advanced Feature Selection Based on AI and Deep Learning. Alex. Eng. J. 2025, 127, 586–94. [Google Scholar] [CrossRef]
  20. Dastile, Xolani; Celik, Turgay; Potsane, Moshe. Statistical and Machine Learning Models in Credit Scoring: A Systematic Literature Survey. Appl. Soft Comput. 2020, 91, 106263. [Google Scholar] [CrossRef]
  21. de Oliveira, Nazário A.; Basso, Leonardo F. C. Advancing Credit Rating Prediction: The Role of Machine Learning in Corporate Credit Rating Assessment. Risks 2025, 13, 116. [Google Scholar] [CrossRef]
  22. Giudici, Paolo; Centurelli, Mattia; Turchetta, Stefano. Artificial Intelligence Risk Measurement. Expert Syst. With Appl. 2024, 235, 121220. [Google Scholar] [CrossRef]
  23. Gorishniy, Yury; Rubachev, Ivan; Khrulkov, Valentin; Babenko, Artem. Revisiting Deep Learning Models for Tabular Data. Paper presented at Advances in Neural Information Processing Systems, 2021; vol. 34, pp. 18932–43. [Google Scholar]
  24. Grinsztajn, Léo; Oyallon, Edouard; Varoquaux, Gaël. Why Do Tree-Based Models Still Outperform Deep Learning on Typical Tabular Data? Paper presented at Advances in Neural Information Processing Systems, 2022; vol. 35, pp. 507–20. [Google Scholar]
  25. Hand, David J.; Till, Robert J. A Simple Generalisation of the Area under the ROC Curve for Multiple Class Classification Problems. Mach. Learn. 2001, 45, 171–86. [Google Scholar] [CrossRef]
  26. Hjelkrem, Lars Ole; de Lange, Petter Eilif. Explaining Deep Learning Models for Credit Scoring with SHAP: A Case Study Using Open Banking Data. J. Risk Financ. Manag. 2023, 16, 221. [Google Scholar] [CrossRef]
  27. Hlongwane, Rivalani; Ramaboa, Kutlwano K. K. M.; Mongwe, Wilson. Enhancing Credit Scoring Accuracy with a Comprehensive Evaluation of Alternative Data. PLoS ONE 2024, 19, e0303566. [Google Scholar] [CrossRef] [PubMed]
  28. Hofmann, Hans. Statlog (German Credit Data). In UCI Machine Learning Repository; 1994. [Google Scholar] [CrossRef]
  29. Khatir, Hussin Adam; Almustfa, Ahmed; Bee, Marco. Machine Learning Models and Data-Balancing Techniques for Credit Scoring: What Is the Best Combination? Risks 2022, 10, 169. [Google Scholar] [CrossRef]
  30. Kapoor, Sayash; Narayanan, Arvind. Leakage and the Reproducibility Crisis in Machine-Learning-Based Science. Patterns 2023, 4, 100804. [Google Scholar] [CrossRef] [PubMed]
  31. Kim, Ji-Yoon; Cho, Sung-Bae. Towards Repayment Prediction in Peer-to-Peer Social Lending Using Deep Learning. Mathematics 2019, 7, 1041. [Google Scholar] [CrossRef]
  32. Kuhn, Max; Wickham, Hadley. Tidymodels: A Collection of Packages for Modeling and Machine Learning Using Tidyverse Principles. 2020. Available online: https://www.tidymodels.org (accessed on 14 July 2026).
  33. Lending Club. Lending Club Loan Data. Kaggle. 2019. Available online: https://www.kaggle.com/datasets/wordsforthewise/lending-club (accessed on 14 July 2026).
  34. Lessmann, Stefan; Baesens, Bart; Seow, Hsin-Vonn; Thomas, Lyn C. Benchmarking State-of-the-Art Classification Algorithms for Credit Scoring: An Update of Research. Eur. J. Oper. Res. 2015, 247, 124–36. [Google Scholar] [CrossRef]
  35. Liaw, Andy; Wiener, Matthew. Classification and Regression by randomForest. R News 2002, 2, 18–22. [Google Scholar]
  36. Lin, Luyun; Wang, Yiqing. SHAP Stability in Credit Risk Management: A Case Study in Credit Card Default Model. Risks 2025, 13, 238. [Google Scholar] [CrossRef]
  37. Liu, Weiqi; Li, Meifang. The Impact of AI Washing on Enterprises’ Access to Bank Loans: From the Perspective of External Governance. Financ. Res. Lett. 2026, 98, 109884. [Google Scholar] [CrossRef]
  38. Liu, Wanan; Fan, Hong; Xia, Meng. Tree-Based Heterogeneous Cascade Ensemble Model for Credit Scoring. Int. J. Forecast. 2023, 39, 1593–614. [Google Scholar] [CrossRef] [PubMed]
  39. Louzada, Francisco; Ara, Anderson; Fernandes, Guilherme B. Classification Methods Applied to Credit Scoring: Systematic Review and Overall Comparison. Surv. Oper. Res. Manag. Sci. 2016, 21, 117–34. [Google Scholar] [CrossRef]
  40. Lundberg, Scott M.; Lee, Su-In. A Unified Approach to Interpreting Model Predictions. Paper presented at Advances in Neural Information Processing Systems, 2017; vol. 30, pp. 4765–74. [Google Scholar]
  41. Malekipirbazari, Milad; Aksakalli, Vural. Risk Assessment in Social Lending via Random Forests. Expert Syst. With Appl. 2015, 42, 4621–31. [Google Scholar] [CrossRef]
  42. Mapfumo, Irvine; Shongwe, Thokozani. Performance Evaluation of Machine Learning and Deep Learning Models for Credit Risk Prediction. J. Risk Financ. Manag. 2026, 19, 210. [Google Scholar] [CrossRef]
  43. Markov, Anton; Seleznyova, Zinaida; Lapshin, Victor. Credit Scoring Methods: Latest Trends and Points to Consider. J. Financ. Data Sci. 2022, 8, 180–201. [Google Scholar] [CrossRef]
  44. Mestiri, Sami. Credit Scoring Using Machine Learning and Deep Learning-Based Models. Data Sci. Financ. Econ. 2024, 4, 236–48. [Google Scholar] [CrossRef]
  45. Mushava, Jonah; Murray, Michael. Flexible Loss Functions for Binary Classification in Gradient-Boosted Decision Trees: An Application to Credit Scoring. Expert Syst. With Appl. 2024, 238, 121876. [Google Scholar] [CrossRef]
  46. Nguyen, Thi Hong Thuy; Nguyen, Thi Vinh Ha; Nguyen, Nam Trung; Vu, Thi Thanh Binh; Nguyen, Thu Hang; The Binh Vu. Comparing the Effectiveness of Machine Learning and Deep Learning Models in Student Credit Scoring: A Case Study in Vietnam. Risks 2025, 13, 99. [Google Scholar] [CrossRef]
  47. Oreski, Goran. Synthesizing Credit Data Using Autoencoders and Generative Adversarial Networks. Knowl.-Based Syst. 2023, 274, 110646. [Google Scholar] [CrossRef]
  48. Paz, Álex; Crawford, Broderick; Monfroy, Eric; Barrera-García, José; Fritz, Álvaro Peña; Soto, Ricardo; Cisternas-Caneo, Felipe; Yáñez, Andrés. Machine Learning and Metaheuristics Approach for Individual Credit Risk Assessment: A Systematic Literature Review. Biomimetics 2025, 10, 326. [Google Scholar] [CrossRef] [PubMed]
  49. R Core Team. R: A Language and Environment for Statistical Computing; R Foundation for Statistical Computing: Vienna, 2026; Available online: https://www.R-project.org (accessed on 14 July 2026).
  50. Ribeiro, Marco Tulio; Singh, Sameer; Guestrin, Carlos. “Why Should I Trust You?”: Explaining the Predictions of Any Classifier. Paper presented at the 22nd ACM SIGKDD International Conference on Knowledge Discovery and Data Mining, San Francisco, CA, USA, 2016; pp. 1135–44. [Google Scholar] [CrossRef]
  51. Rizinski, Maryan; Trajanov, Dimitar. AI Agents in Finance and Fintech: A Scientific Review of Agent-Based Systems, Applications, and Future Horizons. Comput. Mater. Contin. 2026, 86, 1–34. [Google Scholar] [CrossRef]
  52. Serrano-Cinca, Carlos; Gutiérrez-Nieto, Begoña; López-Palacios, Luz. Determinants of Default in P2P Lending. PLoS ONE 2015, 10, e0139427. [Google Scholar] [CrossRef] [PubMed]
  53. Shi, Si; Tse, Rita; Luo, Wuman; D’Addona, Stefano; Pau, Giovanni. Machine Learning-Driven Credit Risk: A Systemic Review. Neural Comput. Appl. 2022, 34, 14327–39. [Google Scholar] [CrossRef]
  54. Suhadolnik, Nicolas; Ueyama, Jo; Da Silva, Sergio. Machine Learning for Enhanced Credit Risk Assessment: An Empirical Approach. J. Risk Financ. Manag. 2023, 16, 496. [Google Scholar] [CrossRef]
  55. Talaat, Fatma M.; Aljadani, Abdussalam; Badawy, Mahmoud; Elhosseini, Mostafa. Toward Interpretable Credit Scoring: Integrating Explainable Artificial Intelligence with Deep Learning for Credit Card Default Prediction. Neural Comput. Appl. 2024, 36, 4847–65. [Google Scholar] [CrossRef]
  56. Trivedi, Shrawan Kumar. A Study on Credit Scoring Modeling with Different Feature Selection and Machine Learning Approaches. Technol. Soc. 2020, 63, 101413. [Google Scholar] [CrossRef]
  57. Yeh, I-Cheng; Lien, Che-Hui. The Comparisons of Data Mining Techniques for the Predictive Accuracy of Probability of Default of Credit Card Clients. Expert Syst. With Appl. 2009, 36, 2473–80. [Google Scholar] [CrossRef]
  58. Zhang, Xiaoming; Yu, Lean. Consumer Credit Risk Assessment: A Review from the State-of-the-Art Classification Algorithms, Data Traits, and Learning Methods. Expert Syst. With Appl. 2024, 237, 121484. [Google Scholar] [CrossRef]
  59. Zheng, Mengmeng; Zhang, Lu; Tripe, David; Zhang, Yuming. Can Artificial Intelligence Mitigate Greenwashed Green Credit? Evidence from Loan Contracts of Chinese Listed Firms. Int. Rev. Financ. Anal. 2026, 110, 104948. [Google Scholar] [CrossRef]
  60. Zhou, Ying; Shen, Long; Ballester, Laura. A Two-Stage Credit Scoring Model Based on Random Forest: Evidence from Chinese Small Firms. Int. Rev. Financ. Anal. 2023, 89, 102755. [Google Scholar] [CrossRef]
  61. Zhu, Xu; Chu, Qingyong; Song, Xinchang; Hu, Ping; Peng, Lu. Explainable Prediction of Loan Default Based on Machine Learning Models. Data Sci. Manag. 2023, 6, 123–33. [Google Scholar] [CrossRef]
Figure 1. Pearson correlation of numeric predictors (German Credit). The retained features are weakly correlated, justifying their joint use.
Preprints 224158 g001
Figure 2. Pearson correlation of numeric predictors (Taiwan Credit Card Default). Strong block correlation among bill amounts is visible.
Preprints 224158 g002
Figure 3. Pearson correlation of numeric predictors (Lending Club). Mostly weak correlations with a few tightly coupled groups.
Preprints 224158 g003
Figure 4. Distribution of principal numeric features (German Credit). Right-skew in credit amount and duration motivates scaling prior to model fitting.
Preprints 224158 g004
Figure 5. Distribution of principal features (Taiwan Credit Card Default).
Preprints 224158 g005
Figure 6. Distribution of principal features (Lending Club).
Preprints 224158 g006
Figure 7. One-vs-rest ROC for the High tier, German Credit. MLR achieves the best AUC (0.738) on this most challenging task; the ANN lags.
Preprints 224158 g007
Figure 8. One-vs-rest ROC for the High tier, Taiwan. Tree ensembles reach ~0.95 AUC; MLR lags substantially.
Preprints 224158 g008
Figure 9. One-vs-rest ROC for the High tier, Lending Club. XGBoost leads (AUC = 0.871).
Preprints 224158 g009
Figure 10. Random forest variable importance (German): existing_credits, checking_account, and residence_duration are most predictive.
Preprints 224158 g010
Figure 11. XGBoost gain importance (German): existing_credits, age, and residence_duration dominate.
Preprints 224158 g011
Figure 12. Random forest variable importance (Taiwan): payment and bill amounts and the credit limit are most predictive of delinquency severity.
Preprints 224158 g012
Figure 13. XGBoost gain importance (Taiwan): limit_bal, pay_amt1, and pay_amt2 dominate.
Preprints 224158 g013
Figure 14. Random forest variable importance (Lending Club): loan term, FICO bounds, and recent inquiries are most informative.
Preprints 224158 g014
Figure 15. XGBoost gain importance (Lending Club): term_X60.months and fico_range_low dominate the assigned risk band.
Preprints 224158 g015
Table 1. Representative prior studies on the three benchmark corpora. Reported results are as published and are not comparable across rows; the final column states the protocol feature that limits comparability.
Study Venue/Year Dataset(s) Models Compared Headline Finding (as Published) Comparability Limitation
Baesens et al. JORS 2003 8 credit sets incl. German 17 classifiers Small differences among well-tuned classifiers Binary; pre-leakage-era protocols
Lessmann et al. EJOR 2015 8 credit sets incl. German 41 classifiers Heterogeneous ensembles best overall Binary; per-dataset preprocessing varies
Yeh and Lien ESWA 2009 Taiwan 6 methods incl. ANN ANN best for default probability Binary; no leakage audit
Malekipirbazari and Aksakalli ESWA 2015 Lending Club RF, SVM, LR, k-NN Random forest best Binary; random split, single vintage
Serrano-Cinca et al. PLoS ONE 2015 Lending Club LR, survival analysis Grade and indebtedness drive default Explanatory focus, not a benchmark
Trivedi Technol. Soc. 2020 German 5 classifiers × 3 FS methods Ranking shifts with feature selection Binary; single small corpus
Alam et al. IEEE Access 2020 Taiwan + others Classifier × resampling grid GBDT + oversampling dominate Resampling outside CV folds
Ariza-Garzón et al. IEEE Access 2020 Lending Club XGBoost + SHAP Explainable granting model Binary; single corpus
Hussin Adam Khatir and Bee Risks 2022 German Classifiers × FS × balancing RF + RFE + random oversampling best Binary; single small corpus
Suhadolnik et al. JRFM 2023 Lending Club (1.3M loans) 10 statistical and ML algorithms XGBoost best (80.4% vs. LR 65.7%) Binary; single corpus
Chang et al. Risks 2024 Credit-card customers ML and DL models Ensembles strongest Binary; single corpus
Nguyen et al. Risks 2025 Student loans (Vietnam) RF, GB, SVM, DNN DNN best (85.6% accuracy) Binary; private survey data
Lin and Wang Risks 2025 Taiwan 100 XGBoost seeds + SHAP SHAP rank stability tied to importance level Explainability focus; binary
Mapfumo and Shongwe JRFM 2026 German + Taiwan 10 ML/DL × SMOTE variants SMOTE-ENN + MLP: F1 0.928 (German) Evaluation after synthetic resampling
This study German + Taiwan + Lending Club MLR, RF, XGBoost, ANN Leakage-controlled ordinal three-tier benchmark Proxy tiers on two corpora (stated)
Table 2. Datasets and resulting three-tier class distribution.
Dataset Instances Predictors ¹ Low/Medium/High
German Credit 1000 ~15 25/436/539
Taiwan Default 30,000 ~17 19,931/8876/1193
Lending Club 48,808 ~60 17,370/24,845/6593
¹ After excluding identifiers, dates, post-origination fields, and tier-defining columns (Section 3.4).
Table 3. How the Low/Medium/High tiers are defined.
Dataset Three-Tier Rule
German Engineered risk score s ∈ [0,100]; s ≤ 33 Low, 34–66 Medium, ≥ 67 High.
Taiwan Worst recent delay over PAY_0–PAY_6: ≤ 0 Low, 1–2 months Medium, ≥ 3 months High.
Lending Club Lender grade collapsed: A–B Low, C–D Medium, E–G High.
Table 4. Tier-to-action mapping.
Tier Lending Action
Low Streamlined approval (high creditworthiness)
Medium Conditional approval; monitor/extra documentation
High Decline or require collateral/guarantor
Table 5. Held-out test performance (three-tier, leakage-controlled). Best value per metric within each dataset in bold.
Dataset Model Accuracy Precision Recall F1 AUC (Hand–Till) κ QWK
German MLR 0.5572 0.4671 0.5328 0.4337 0.6759 0.2615 0.3066
Random Forest 0.6318 0.4265 0.4297 0.4273 0.6480 0.2855 0.2756
XGBoost 0.6219 0.4197 0.4228 0.4205 0.6787 0.2662 0.2582
ANN 0.5075 0.3595 0.3435 0.3502 0.5518 0.0841 0.1683
Taiwan MLR 0.4646 0.4132 0.5282 0.3694 0.7190 0.1454 0.2327
Random Forest 0.8649 0.7902 0.7581 0.7730 0.9049 0.7076 0.7693
XGBoost 0.8604 0.7546 0.7798 0.7652 0.9145 0.7008 0.7688
ANN 0.7260 0.5773 0.6961 0.6060 0.8610 0.4554 0.6074
Lending Club MLR 0.6020 0.5797 0.6452 0.5866 0.8187 0.3864 0.5752
Random Forest 0.6810 0.6653 0.5973 0.6175 0.8239 0.4406 0.5672
XGBoost 0.6969 0.6819 0.6155 0.6358 0.8404 0.4701 0.5994
ANN 0.6153 0.5826 0.6320 0.5940 0.8121 0.3916 0.5651
Table 6. Published results on the same corpora versus this study. Published figures are reproduced as reported and are binary; they are not directly comparable with our three-class, leakage-controlled results—that non-comparability operationalizes the gap identified in Section 2.7.
Prior Study Corpus Reported (Binary, as Published) This Study (Three-Class, Leakage-Controlled)
Mapfumo and Shongwe (2026) German Accuracy 95.4%, F1 0.928 (SMOTE-ENN + MLP) Best accuracy 0.632 (RF); best QWK 0.307 (MLR)
Lessmann et al. (2015) German Ensembles lead; small margins among tuned classifiers Qualitative pattern holds only on larger corpora; MLR leads QWK on German
Hussin Adam Khatir and Bee (2022) German RF + RFE + random oversampling best combination RF leads accuracy (0.632) but MLR leads ordinal agreement
Yeh and Lien (2009) Taiwan ANN best for default-probability estimation RF best (accuracy 0.865, QWK 0.769); ANN trails ensembles
Mapfumo and Shongwe (2026) Taiwan F1 0.789 (SMOTE-ENN + RF) RF F1 0.773 on the natural test distribution
Malekipirbazari and Aksakalli (2015) Lending Club Random forest best XGBoost best (accuracy 0.697, QWK 0.599); RF second
Suhadolnik et al. (2023) Lending Club XGBoost best: accuracy 80.4% vs. LR 65.7% Same ranking: XGBoost first, MLR last on accuracy (0.697 vs. 0.602, three-class)
Ariza-Garzón et al. (2020) Lending Club Boosting + SHAP; strong binary discrimination Consistent: boosting leads; SHAP integration deferred to future work
Disclaimer/Publisher’s Note: The statements, opinions and data contained in all publications are solely those of the individual author(s) and contributor(s) and not of MDPI and/or the editor(s). MDPI and/or the editor(s) disclaim responsibility for any injury to people or property resulting from any ideas, methods, instructions or products referred to in the content.
Copyright: This open access article is published under a Creative Commons CC BY 4.0 license, which permit the free download, distribution, and reuse, provided that the author and preprint are cited in any reuse.
Prerpints.org logo

Preprints.org is a free preprint server supported by MDPI in Basel, Switzerland.

Subscribe

© 2026 MDPI (Basel, Switzerland) unless otherwise stated

Accessibility

Disclaimer

Terms of Use

Privacy Policy

Privacy Settings