

Submitted:
21 July 2026
Posted:
21 July 2026
You are already at the latest version
Abstract
Renewable energy sources are expanding rapidly, with wind energy representing one of the fastest-growing sectors. In parallel, digital twins are transforming structural monitoring and inspection by enabling near real-time structural assessment. However, the high computational cost associated with high-fidelity numerical models requires reduced-order or surrogate modelling strategies. Within this context, composite laminate thickness plays a critical role in wind turbine blade design and assessment. In this study, a computational fluid dynamics (CFD)-based numerical model developed in ANSYS was employed to predict von Mises stresses in a three-dimensional wind turbine blade geometry derived from the Carbo4Power project. The numerical results were validated against published literature, enabling identification of a thickness–stress relationship. This foundational analysis supports the development of reduced-order models suitable for digital twin applications in wind turbine blade structural assessment.
Keywords:
wind turbine blade
; digital twin
; reduced-order modelling
; composite laminate
; computational fluid dynamics
; finite element analysis
; fluid–structure interaction
; von Mises stress
; laminate thickness
1. Introduction
Wind energy is one of the fastest-growing renewable energy sources worldwide and plays a critical role in the global transition toward low-carbon electricity generation. According to the International Renewable Energy Agency (IRENA), global offshore wind capacity is projected to increase from several hundred gigawatts at present to multiple terawatts by 2050 [1]. China currently leads the world in installed wind power capacity, followed by the United States and Germany [2]. As rotor diameters and rated power continue to increase to more than 150 m and 26 MW, respectively, wind turbine blades (WTBs) remain the most structurally critical and failure-sensitive components of modern turbines, dominating both capital expenditure and long-term operational costs [3,4,5].
WTBs are subjected to complex combinations of aerodynamic loading, gravitational bending, centrifugal forces, and transient dynamic excitation due to wind speed variations and turbulence. These loads generate multi-axial stress states that govern stiffness, fatigue damage accumulation, and ultimate failure [6]. With blade lengths now typically exceeding 80–100 m in modern offshore turbines, experimental full-scale testing has become more complicated due to a lack of available testing facilities with adequate capacity. Moreover, such tests are financially prohibitive, time-consuming, and logistically challenging to organise and conduct. As such, the need for reliable numerical simulation tools for design verification and structural integrity assessment has grown in recent years, including as part of the certification of commercially produced blades [7,8].
Among the available numerical approaches, blade element momentum (BEM) theory and computational fluid dynamics (CFD) are widely employed for aerodynamic analysis. While BEM offers high computational efficiency, it relies on two-dimensional airfoil data and simplified wake assumptions [8]. In contrast, CFD resolves three-dimensional flow fields around realistic blade geometries and enables direct evaluation of pressure distributions under operating conditions. For rotating blades, multiple reference frame (MRF) and dynamic mesh approaches are commonly adopted, with MRF providing steady-state efficiency and dynamic meshing capturing transient blade–flow interaction at significantly higher computational cost [9].
To translate aerodynamic loading into structural response, CFD results are frequently coupled with finite element analysis (FEA) through one- or two-way fluid–structure interaction (FSI) frameworks [10,15,16,17]. These approaches enable prediction of deformation, strain, and von Mises stress under operational wind conditions. However, many published FSI studies adopt simplified composite definitions, often assuming uniform shell thickness or idealised layups, while detailed representation of industrial composite architectures, such as spar caps, shear webs, foam cores, and locally thickened regions, remains limited [11,16].
From a structural mechanics perspective, laminate thickness is one of the most influential geometric parameters governing wind turbine blade behaviour. Thickness directly controls sectional bending stiffness, mass distribution, buckling resistance, natural frequencies, and local stress magnitude under aerodynamic and gravitational loading [7,13,14]. In composite blades, thickness varies substantially along the span due to spar caps, shear webs, sandwich skins, and locally reinforced regions, which are deliberately engineered to satisfy stiffness and fatigue constraints while minimising mass in bending-dominated regions near the root and mid-span.
Early rotor scaling and blade design studies demonstrated that increases in blade length require non-linear growth in laminate thickness to maintain acceptable stress and deflection limits [19]. This behaviour has been further confirmed in reference blade definitions and optimisation studies for multi-megawatt turbines, where thickness is treated as a primary design variable alongside chord and material selection [20,21]. In such studies, spar-cap and shell thickness distributions are commonly parameterised using spanwise control points, revealing that tapered thickness profiles provide structurally efficient solutions while strongly influencing stress corridors and failure margins [22,23,24,25].
Despite its recognised importance, thickness is rarely treated as an explicit comparative parameter in published finite element and FSI studies. Many investigations report von Mises stress distributions or peak stress values without publishing full thickness fields, instead embedding thickness implicitly within composite layup definitions [10,15,16,17]. This practice complicates cross-study validation and limits the ability to isolate quantitative thickness–stress relationships or benchmark blades on a consistent geometric basis. Comparative modelling work has shown that shell-based blade representations effectively collapse three-dimensional laminate geometry into section properties, making the interpretation of thickness particularly critical when validating models of different fidelity [26].
From a manufacturing and operational standpoint, thickness is also subject to variability due to production tolerances, erosion, repairs, and long-term damage accumulation. Experimental blade testing programmes and industrial failure analyses have identified insufficient spar-cap or shell thickness as a key contributor to buckling and fatigue failures [27,28]. Consequently, thickness should be regarded not only as a design parameter but also as a structural state variable that may evolve throughout the blade life cycle.
The emergence of digital twin (DT) technology further amplifies the need for reliable thickness estimation. Digital twins integrate physics-based numerical models with operational and inspection data to enable real-time structural assessment and life-cycle management [18,29]. In blade applications, reduced-order or surrogate models are required to replace computationally expensive full-order finite element models. Establishing physically interpretable parametric relationships, such as thickness–stress correlations, enables surrogate models to be embedded within digital twin architectures, allowing continuous updating of structural reliability as laminate thickness evolves due to erosion, fatigue damage, or repair interventions.
Motivated by these gaps, the present study establishes a physically consistent thickness–stress relationship for a realistic composite wind turbine blade using coupled CFD–FEA simulations. A 5.27 m industrial research blade is analysed using both linear extrapolated and detailed manufacturing-derived composite layups. Representative laminate thickness values are extracted from full-field thickness maps and benchmarked against published blades of varying scales, providing a transparent validation framework and foundational data for future reduced-order modelling and digital-twin development of composite wind turbine blades.
2. Materials and Methods
2.1. Computational Fluid Dynamics (CFD)
2.1.1. Geometry
The starting blade geometry had a length of 5.27 m (Figure 1) and was provided by the H2020 Carbo4Power (C4P) project team. The original model consisted of 248 blade surfaces and was intended for finite element (FE) analysis; therefore, it was too detailed for efficient CFD pressure extraction. The blade was merged into 10 faces, enclosed as a single solid, stitched, and blended to minimise geometry complexity and reduce computational time (Figure 2). Figure 3 shows the fluid body and its boundary conditions. The blade wall retained the exact blade configuration but was represented as a hollow shape, serving as a negative imprint of the blade solid. This enabled fluid–structure interaction around the blade without a moving mesh, with the fluid bypassing the blade. The blade imprint was surrounded by a fluid enclosure constructed as a one-third cylindrical domain with a radius of 30 m. A velocity inlet was placed 20 m from the pressure side, and a pressure outlet was placed 70 m from the suction side of the blade. Two periodic boundaries were used as interfaces because only a single blade was modelled instead of three.
2.1.2. Mesh
Multiple sizing methods were implemented to achieve a fine mesh with approximately 11 million tetrahedral cells (Figure 4a), with local refinement around the blade. Around the blade, a sphere with a radius of 4.5 m ensured that elements in that region were not larger than 0.068 m. Face sizing was employed in the blade area so that the element size did not exceed 4.50 × 10⁻³ m. Inflation control was also employed, with a first-layer height of 0.1 mm and a growth rate of 1.35 for 10 layers. This ensured a high-quality mesh, with orthogonal quality of 0.759 ± 0.144 and skewness of 0.232 ± 0.130. The final mesh is shown in Figure 4b,c. Match control was applied to the side faces of the cylinder to ensure periodicity and matching faces for post-processing.
2.1.3. Boundary Conditions
ANSYS Fluent 24 [12] was used for the CFD simulation with the SST k-ω turbulence model. The turbulence intensity and turbulent viscosity ratio were set as 5% and 10, respectively. The air density and dynamic viscosity were set as 1.225 kg m−3 and 1.79894 × 10⁻⁵ kg m−1 s−1, respectively. These settings were selected to represent normal operating conditions, with an air speed of 12 m s−1 that causes the blade to rotate at 5.7596 rad s−1. The two interfaces were treated as a single periodic interface, allowing the blade to rotate periodically without motion of the entire mesh.
2.2. Finite Element Analysis (FEA)
2.2.1. Geometry and Material Properties
The blade geometry for FEA was identical to that provided by the H2020 C4P project (Figure 1). The blade was divided into multiple faces to facilitate targeting of individual sections of interest, such as spar strengthening. This enabled composite layup and thickness to be applied locally where specialised treatment was required. The two materials used for most of the blade are listed in Table A1. Gelcoat was applied to the blade surface as an outer layer to reduce erosion and ultraviolet penetration. It had a density of 1235 kg m−3, Young’s modulus of 3.44 × 10^9 Pa, and Poisson’s ratio of 0.3.
2.2.2. Mesh
The blade and shear webs were primarily meshed using quadrilateral quadratic elements, with triangular quadratic elements incorporated to accommodate complex geometrical features. Each element had a uniform size of 0.03 m, resulting in a final mesh consisting of 148,619 nodes and 126,119 elements (Figure 5).
2.2.3. Fluid–Structure Interaction (FSI)
The interaction between aerodynamic loading and structural response was modelled using a one-way fluid–structure interaction (FSI) framework appropriate for steady operating conditions. Aerodynamic surface pressure distributions obtained from the CFD analysis were fully mapped to the structural model and applied as distributed loads on the blade surface. This pressure mapping preserved the spatial variation of aerodynamic loading along the blade span and chord, enabling realistic reproduction of the flapwise bending moment that dominates blade structural response under normal operation. Root constraints were applied to represent the hub–blade connection, allowing the transferred pressure field to induce bending deformation and associated stress development.
2.2.4. Advanced Composite Pre (ACP)
The composite stack-up information was completed using the ANSYS ACP package, where the stack-up sequence of the blade shell, spar cap, shear webs, and related components can be defined in detail. Two types of composite layup were used on the same blade geometry: a linear thickness variation, where the thickest region was located at the root and gradually decreased towards the tip (Figure 6a), and the exact composite layup and thickness definitions provided by the H2020 C4P project partners (Figure 6b), which are listed in Appendix B.
2.2.5. Construction of a Literature-Based Thickness–Stress Dataset
To validate the structural plausibility of the present numerical results, a literature-based dataset linking representative laminate thickness and peak von Mises stress was constructed from published studies on composite wind turbine blades. The selected literature spans a wide range of blade sizes, including small-scale demonstrator blades, mid-scale research blades, and multi-MW industrial reference rotors, thereby enabling cross-scale benchmarking [30,31,32,33].
For each literature case, the reported maximum von Mises stress was extracted directly from numerical or experimental results under operating or extreme loading conditions. Where full-field laminate thickness distributions were explicitly reported, representative thickness values were computed as the area-weighted mean thickness over bending-dominated regions of the blade. However, in most stress-focused studies, detailed thickness fields were not available. In such cases, representative laminate thickness values were inferred using one of the following established approaches: (i) linear interpolation between reported root and tip thickness values, (ii) adoption of mid-span laminate thickness reported in structural analyses, or (iii) extraction from published reference blade structural definitions, such as the NREL 5 MW blade.
All inferred thickness values were derived exclusively from geometric information provided in the original sources and were not arbitrarily assumed. This approximation strategy follows established practice in blade scaling studies and reference rotor analyses, where representative geometric parameters are routinely inferred to enable comparative assessment across blades of differing size, architecture, and material system. The resulting dataset was used solely for trend-level validation rather than quantitative prediction, allowing assessment of whether the present blade exhibits stress–thickness behaviour consistent with established structural scaling.
3. Results and Discussion
3.1. CFD Results
3.1.1. Convergence
Several monitors, including integral pressure, drag coefficient, torque, and mass flow rate, were set to determine solver convergence. Although the initial number of iterations was set to 8000, the model was deemed to have converged after approximately 3000 iterations, when the monitors remained steady and the mass flow rate approached zero (Figure 7).
3.1.2. Pressure Results
In CFD modelling, the interaction between the fluid and blade was captured through three key factors: blade velocity, pressure contours, and velocity streamlines. These aspects are crucial for validating the simulation model and comparing it with theoretical calculations. Figure 8 indicates that blade velocity increases from the root to the tip, reaching a peak velocity of 30 m s−1 at the tip. Considering an angular velocity of 5.7596 rad s−1 and a blade length of 5.27 m, the blade tip velocity can be estimated as 30.35 m s−1, which is in line with the CFD result. Figure 9 presents the velocity streamline from the inlet to the outlet, with a noticeable velocity drop behind the blade, which is expected because the pressure difference between the pressure and suction sides primarily drives wind turbine rotation. Pressure contour plots confirming this behaviour are shown in Figure 10; most aerodynamic pressure is concentrated on the leading edge towards the blade tip.
3.2. Structural FEA Modelling
Figure 11 shows the stress distribution for the blade with linear thickness. The maximum stress was distributed on the CFRP spar cap, with a magnitude of 7.68 MPa.
Figure 12 shows the stress distribution on the spar cap and shear webs for the C4P thickness configuration. The stress location on the spar caps was similar to the linear thickness case; however, in this case, the stress patterns corresponded to the spar cap location below the blade skin surface, while the outer blade skin remained in a relatively low-stress condition.
3.3. Cross-Study Validation Using the Thickness–Stress Relationship
Table 1 summarises the literature-based thickness–stress dataset used for validation in this study, including representative laminate thickness, peak von Mises stress, loading condition, and data source.
Figure 13 presents a cross-study comparison between representative laminate thickness and peak von Mises stress for the present blade and selected literature cases, with the underlying data summarised in Table 1. The present blade results, corresponding to representative thicknesses of 22.46 mm and 25.4 mm, lie within the lower region of the stress–thickness envelope. This behaviour is consistent with the relatively modest flapwise bending moments associated with shorter blades operating under rated conditions.
As blade scale increases, the literature cases show a pronounced increase in peak stress despite the use of significantly thicker laminates. In particular, the Hybrid HAWT blade and the NREL 5 MW reference blade exhibit representative thicknesses exceeding 50 mm while sustaining substantially higher stress levels under both operating and extreme loading conditions [30,31,32,33]. This observation reinforces that laminate thickness alone does not determine structural stress response. The monotonic trend observed across the dataset supports the use of representative laminate thickness as a physically meaningful scalar parameter for cross-study comparison. Despite differences in blade geometry, material systems, and modelling fidelity, the present results align well with the literature-derived trend, indicating that the adopted thickness metric captures the dominant stiffness contribution governing global bending behaviour.
3.4. Validity and Limitations of Literature-Based Thickness Estimates
It should be noted that several literature-based thickness values used in the dataset were inferred rather than extracted directly from full-field laminate thickness maps. This limitation arises because many stress-focused wind turbine blade studies do not explicitly report complete thickness distributions, instead embedding thickness implicitly within composite layup definitions [19,26,27,28,29]. In such cases, representative thickness values were derived from published geometric definitions, including root–tip thickness ranges, mid-span laminate values, or reference blade specifications.
The scatter observed in Figure 13 therefore reflects not only uncertainty associated with thickness estimation but also variations in material properties, laminate architecture, load case definition, and numerical modelling approaches across studies. Nevertheless, the consistency of the overall trend suggests that these uncertainties do not obscure the dominant relationship between thickness and stress response. The dataset was used strictly for trend-level validation rather than quantitative prediction, and the agreement between the present results and established literature benchmarks supports the robustness of the adopted methodology.
3.5. Implications for Blade Design and Digital Twin Development
The observed sensitivity of peak stress to relatively small changes in representative laminate thickness has important implications for both blade design and structural health assessment. The present results indicate that millimetre-scale variations in laminate thickness can lead to measurable changes in local stress levels, even for sub-utility-scale blades. This finding is particularly relevant in the context of manufacturing tolerances, in-service erosion, and damage accumulation, where local thinning may significantly reduce structural margins [27,28].
From a digital twin perspective, the validated thickness–stress relationship provides a compact and physically interpretable basis for reduced-order modelling. Digital twin frameworks rely on simplified geometric and material descriptors to enable real-time structural assessment without the computational cost of full three-dimensional finite element models [18,29]. Treating representative laminate thickness as an evolving state variable allows surrogate models to capture stiffness degradation arising from wear, fatigue, or repair, thereby improving the fidelity of life-cycle prediction and condition monitoring strategies.
Although the current model provides a realistic representation of the C4P blade, there is room for further refinement. A more detailed CFD model could improve the resolution of pressure distribution, especially near the blade tip. However, such improvements would significantly increase computational demands in terms of both processing time and hardware requirements. On the FEA side, incorporating additional structural features, such as the foam core adjacent to the spar and reinforcements at the leading and trailing edges, would enhance the model fidelity. The challenge lies in the non-uniform thickness of these reinforcements along both the blade length and cross-section, which introduces numerical instabilities. A finer mesh would also improve the accuracy of the FEA model. Generating a high-quality mesh with strong connectivity, especially between the blade and the shear webs, remains challenging and requires further investigation. Moreover, using a solid model would better capture interlaminar stress distributions. However, the extrusion process in ANSYS ACP Pre, combined with the blade geometric complexity, often results in meshing and modelling errors. The nature of the blade-to-shear-web connections, varying from edge-to-edge to face-to-face, adds another layer of difficulty to achieving a reliable simulation.
4. Conclusions
This study established a transparent and physically interpretable relationship between representative laminate thickness and stress response in a realistic composite wind turbine blade using a coupled CFD–FEA framework based on an industrial research geometry. By analysing both an average-mean linear thickness and a manufacturing-derived laminate definition, the work demonstrates that modest changes in effective laminate thickness can lead to measurable variations in von Mises stress, even under steady operating conditions. Importantly, the present blade responses align well with stress–thickness trends observed across published blades spanning multiple scales, lending confidence to the reliability of thickness as a comparative structural parameter.
Beyond the specific numerical results, the primary contribution of this work lies in its relevance to early-stage digital twin development for wind turbine blades. Thickness is typically embedded implicitly within composite layups in high-fidelity models and is rarely exposed as an explicit, trackable variable. By collapsing detailed laminate information into representative thickness metrics that retain physical meaning, this study provides a practical link between full-order finite element models and reduced-order or surrogate representations. Such a formulation is particularly valuable for digital twin architectures, where computational efficiency and interpretability are essential and where geometric design is influenced by manufacturing variability and operational conditions.
For researchers working on digital twins or reduced-order blade models, these results show that using laminate thickness as a key parameter provides a reasonable first-order description of the overall structural behaviour. Thickness alone does not fully control stress, but the clear and consistent trend observed across blades of different sizes shows that it captures the main stiffness effect governing flapwise bending. This makes thickness a practical starting point, onto which other factors such as material degradation, load uncertainty, or local damage can be added progressively.
This study is intended as a foundation rather than a complete solution. Its main value is in showing how simple, physically meaningful thickness–stress relationships can be obtained from realistic blade models and checked against published work without relying on proprietary full-field data. In this way, it provides a useful and transferable starting point for reduced-order modelling and early digital twin development in composite wind turbine blades.
Supplementary Materials
Not applicable.
Author Contributions
Conceptualization, Z.Z., V.B. and M.P.; methodology, Z.Z. and V.B.; software, Z.Z.; validation, Z.Z. and V.B.; formal analysis, Z.Z.; investigation, Z.Z.; resources, M.P.; data curation, Z.Z.; writing—original draft preparation, Z.Z.; writing—review and editing, V.B., M.G., F.P.G.M. and M.P.; visualization, Z.Z.; supervision, V.B., M.G. and M.P.; project administration, M.P.; funding acquisition, M.P. All authors have read and agreed to the published version of the manuscript. Please verify author initials and contributions before submission.
Funding
This research was partially funded by the European Commission under the H2020 CARBO4POWER project, grant agreement No. 953192. APC funding information should be confirmed before submission.
Data Availability Statement
The data supporting the findings of this study are available from the corresponding author upon reasonable request. Any restrictions associated with project or proprietary data should be confirmed before submission.
Acknowledgments
The authors are grateful to the European Commission for partially funding this research under the H2020 CARBO4POWER project (GA 953192). The authors would also like to sincerely thank Dr. Valter Jantara Junior for his contribution to the early parts of the present study.
Conflicts of Interest
The authors declare no conflicts of interest.
Abbreviations
The following abbreviations are used in this manuscript:

Table 2.
Abbreviations used in the manuscript.
| ACP | Advanced Composite Pre |
| BEM | Blade element momentum |
| C4P | Carbo4Power |
| CFD | Computational fluid dynamics |
| CFRP | Carbon-fibre-reinforced polymer |
| DT | Digital twin |
| FE | Finite element |
| FEA | Finite element analysis |
| FSI | Fluid–structure interaction |
| GFRP | Glass-fibre-reinforced polymer |
| MRF | Multiple reference frame |
| WTB | Wind turbine blade |
Appendix A
Appendix A.1. Material Properties
Table A1.
Material properties for composite materials.
| Material property | Material property | GFRP | CFRP |
| Density (kg m-3) | Density (kg m-3) | 1840 | 1590 |
| Orthotropic Elasticity (Pa) | Young's modulus X direction | 4.27E+10 | 9.44E+10 |
| Orthotropic Elasticity (Pa) | Young's modulus Y direction | 1.218E+10 | 6.2E+09 |
| Orthotropic Elasticity (Pa) | Young's modulus Z direction | 1.218E+10 | 6.2E+09 |
| Orthotropic Elasticity (Pa) | Poisson's Ratio XY | 0.19 | 0.29 |
| Orthotropic Elasticity (Pa) | Poisson's Ratio YZ | 0.19 | 0.29 |
| Orthotropic Elasticity (Pa) | Poisson's Ratio XZ | 0.19 | 0.29 |
| Orthotropic Elasticity (Pa) | Shear modulus XY | 3.96E+09 | 2.27E+09 |
| Orthotropic Elasticity (Pa) | Shear modulus YZ | 3.96E+09 | 2.27E+09 |
| Orthotropic Elasticity (Pa) | Shear modulus XZ | 3.96E+09 | 2.27E+09 |
| Orthotropic Stress limits (Pa) | Tensile X direction | 7.3E+08 | 1.397E+09 |
| Orthotropic Stress limits (Pa) | Tensile Y direction | 5.44E+07 | 1.67E+07 |
| Orthotropic Stress limits (Pa) | Tensile Z direction | 5.44E+07 | 1.67E+07 |
| Orthotropic Stress limits (Pa) | Compressive X direction | -6.87E+08 | -5.40E+08 |
| Orthotropic Stress limits (Pa) | Compressive Y direction | -1.11E+08 | -1.16E+08 |
| Orthotropic Stress limits (Pa) | Compressive Z direction | -1.11E+08 | -1.00E+08 |
| Orthotropic Stress limits (Pa) | Shear XY | 5.91E+07 | 3.63E+07 |
| Orthotropic Stress limits (Pa) | Shear YZ | 5.91E+07 | 3.63E+07 |
| Orthotropic Stress limits (Pa) | Shear XZ | 5.91E+07 | 3.63E+07 |
| Tsai-Wu Constants | Coupling Coefficient XY | -1 | -1 |
| Tsai-Wu Constants | Coupling Coefficient YZ | -1 | -1 |
| Tsai-Wu Constants | Coupling Coefficient XZ | -1 | -1 |
| Ply type | Type | Regular | Regular |
Table A2.
Puck constants for glass and carbon material classifications.
| Puck Constants | Material classification | Glass | Carbon |
| Puck Constants | Compressive indination XZ | 0.25 | 0.3 |
| Puck Constants | Compressive indination YZ Tensile indination XZ Tensile indination YZ | 0.2 0.3 0.2 | 0.25 0.35 0.25 |
| Additional Puck Constant | Interface Weakening Factor Degradation Parameter s Degradation Parameter M | 0.8 0.5 0.5 | 0.8 0.5 0.5 |
Appendix B
Appendix B.1. Composite Layup Definition
Table A3.
Composite layup definition and thickness information.
| Component | Side | Type | UD_GF | BIAX_GF | UD_CF | Max. Length (m) | Min. Length (m) | Weight (kg) | Total Layers | Thickness (mm) |
| SEG 1 | SS | Shell | 40 | 40 | 80 | 250 | ||||
| Spar | 44 | 1.514 | 0.065 | 0.95 | 44 | 10 | ||||
| PS | Shell | 40 | 40 | 80 | ||||||
| Spar | 44 | 1.514 | 0.065 | 0.95 | 44 | 10 | ||||
| Web | 2 | 2 | 0.9 | |||||||
| PATCH 1 | SS | Shell | 6 | 10 | 16 | 116 | ||||
| Spar | 6 | 10 | 42 | 0.39 | 0.020 | 0.13 | 42 | 9.6 | ||
| Shell | 16 | 7.6 | ||||||||
| Spar | 42 | 0.39 | 0.020 | 0.13 | 42 | 9.6 | ||||
| SEG 2 | SS | Shell | 9 | 15 | 24 | 140 | ||||
| Spar | 45 | 1.69 | 0.025 | 0.82 | 45 | 10.3 | ||||
| PS | Shell | 9 | 15 | 24 | 11.4 | |||||
| Spar | 45 | 1.69 | 0.025 | 0.82 | 45 | 10.3 | ||||
| Web | 2 | 2 | 0.92 | |||||||
| PATCH 2 | SS | Shell | 4 | 4 | 8 | 66 | ||||
| Spar | 4 | 4 | 25 | 0.29 | 0.065 | 0.09 | 25 | 5.7 | ||
| Shell | 8 | 3.8 | ||||||||
| Spar | 25 | 0.29 | 0.065 | 0.09 | 25 | 5.7 | ||||
| SEG 3 | SS | Shell | 3 | 3 | 6 | 64 | ||||
| Spar | 25 | 1.54 | 0.044 | 0.5 | 25 | 5.7 | ||||
| PS | Shell | 3 | 3 | 6 | 2.8 | |||||
| Spar | 25 | 1.54 | 0.044 | 0.5 | 25 | 5.7 | ||||
| Web | 2 | 2 | 0.9 | |||||||
| Total Layers: 636 |
References
- International Renewable Energy Agency (IRENA). Future of Wind: Deployment, Investment, Technology, Grid Integration and Socio-Economic Aspects; International Renewable Energy Agency: Abu Dhabi, United Arab Emirates, 2019; Available online: https://www.irena.org/-/media/Files/IRENA/Agency/Publication/2019/Oct/IRENA_Future_of_wind_2019.pdf (accessed on 11 November 2025).
- International Energy Agency (IEA). Wind Electricity; IEA: Paris, France, 2023; Available online: https://www.iea.org/reports/wind-electricity (accessed on 11 November 2025).
- Maheshwari, Z.; Kengne, K.; Bhat, O. A Comprehensive Review on Wind Turbine Emulators. Renew. Sustain. Energy Rev. 2023, 180, 113297. [Google Scholar] [CrossRef]
- Yilmaz, M.; Dhansri, N.R. Laboratory Emulation of Wind Turbine Operations. In Proceedings of the 2014 ASEE Annual Conference and Exposition, Indianapolis, IN, USA, 15-18 June 2014; pp. 24.840.1–24.840.12. [Google Scholar] [CrossRef]
- Shi, R.; Fan, X.; He, Y. Comprehensive Evaluation Index System for Wind Power Utilization Levels in Wind Farms in China. Renew. Sustain. Energy Rev. 2017, 69, 461–471. [Google Scholar] [CrossRef]
- MacPhee, D.W.; Beyene, A. Fluid-Structure Interaction Analysis of a Morphing Vertical Axis Wind Turbine. J. Fluids Struct. 2016, 60, 143–159. [Google Scholar] [CrossRef]
- Forcier, L.C.; Joncas, S. Development of a Structural Optimization Strategy for the Design of Next Generation Large Thermoplastic Wind Turbine Blades. Struct. Multidiscip. Optim. 2012, 45, 889–906. [Google Scholar] [CrossRef]
- Bai, C.J.; Wang, W.C. Review of Computational and Experimental Approaches to Analysis of Aerodynamic Performance in Horizontal-Axis Wind Turbines (HAWTs). Renew. Sustain. Energy Rev. 2016, 63, 506–519. [Google Scholar] [CrossRef]
- Shourangiz-Haghighi, A.; Haghnegahdar, M.A.; Wang, L.; Mussetta, M.; Kolios, A.; Lander, M. State of the Art in the Optimisation of Wind Turbine Performance Using CFD. Arch. Comput. Methods Eng. 2020, 27, 413–431. [Google Scholar] [CrossRef]
- Wang, L.; Quant, R.; Kolios, A. Fluid Structure Interaction Modelling of Horizontal-Axis Wind Turbine Blades Based on CFD and FEA. J. Wind Eng. Ind. Aerodyn. 2016, 158, 11–25. [Google Scholar] [CrossRef]
- Wang, B.; Li, Y.; Gao, S.; Shen, K.; Zhao, S.; Yao, Y.; Zhou, Z.; Hu, Z.; Zheng, X. Stability Analysis of Wind Turbine Blades Based on Different Structural Models. J. Mar. Sci. Eng. 2023, 11, 1106. [Google Scholar] [CrossRef]
- ANSYS, Inc. ANSYS Fluent Theory Guide; ANSYS Inc.: Canonsburg, PA, USA, 2024; pp. 724–746. [Google Scholar]
- Thomsen, O.T. Sandwich Materials for Wind Turbine Blades - Present and Future. J. Sandw. Struct. Mater. 2009, 11, 7–26. [Google Scholar] [CrossRef]
- Sun, Y.; Hu, C.; Li, J. Impact of Process Technology on Properties of Large-Scale Wind Turbine Blade Composite Spar Cap. Energies 2024, 17, 1149. [Google Scholar] [CrossRef]
- Wang, L.; Liu, X.; Kolios, A. State of the Art in the Aeroelasticity of Wind Turbine Blades: Aeroelastic Modelling. Renew. Sustain. Energy Rev. 2016, 64, 195–210. [Google Scholar] [CrossRef]
- Finnegan, W.; Jiang, Y.; Dumergue, N.; Davies, P.; Goggins, J. Investigation and Validation of Numerical Models for Composite Wind Turbine Blades. J. Mar. Sci. Eng. 2021, 9, 525. [Google Scholar] [CrossRef]
- Zhang, W.; Calderon-Sanchez, J.; Duque, D.; Souto-Iglesias, A. Computational Fluid Dynamics (CFD) Applications in Floating Offshore Wind Turbine (FOWT) Dynamics: A Review. Appl. Ocean Res. 2024, 150, 104075. [Google Scholar] [CrossRef]
- Gee, M. AI/Machine Learning Based on Piezoelectric AE Sensors for Quantification of Damage in Composite Structures; Unpublished Report; University of Birmingham: Birmingham, UK, 2024. [Google Scholar]
- Griffin, D.A. NREL/TP-500-29492; WindPACT Turbine Design Scaling Studies: Rotor, Blade, and Hub Design. National Renewable Energy Laboratory: Golden, CO, USA, 2001.
- Resor, B.R. SAND2013-2569; Definition of a 5-MW/61.5-m Wind Turbine Blade Reference Model. Sandia National Laboratories: Albuquerque, NM, USA, 2013.
- Sun, Z.; Sessarego, M.; Chen, J.; Shen, W.Z. Design of the OffWindChina 5 MW Wind Turbine Rotor. Energies 2017, 10, 777. [Google Scholar] [CrossRef]
- Sjølund, J.H.; Lund, E. Structural Gradient-Based Sizing Optimization of Wind Turbine Blades with Fixed Outer Geometry. Compos. Struct. 2018, 203, 725–739. [Google Scholar] [CrossRef]
- Sjølund, J.H.; Berggreen, C.; Branner, K. Structural Gradient-Based Sizing Optimisation of Wind Turbine Blades. Compos. Struct. 2018, 193, 36–48. [Google Scholar]
- Hermansen, S.M.; Lund, E.; Thomsen, O.T. Gradient-Based Structural Optimization of a Wind Turbine Blade Root Section Including High-Cycle Fatigue Constraints. Eng. Optim. 2025, 57, 3134–3165. [Google Scholar] [CrossRef]
- Zhu, J.; Cai, X.; Ma, D.; Zhang, J.; Ni, X. Improved Structural Design of Wind Turbine Blade Based on Topology and Size Optimization. Int. J. Low.-Carbon Technol. 2022, 17, 69–79. [Google Scholar] [CrossRef]
- Camarena, E.; Resor, B.; Griffith, D. Verification of Beam and Shell Models for Wind Turbine Blades. Wind Energy Sci. 2021, 6, 123–138. [Google Scholar] [CrossRef]
- Desmond, M.; White, J.; Rumsey, M. Structural Testing of Blade Reliability Collaborative Blades; NREL Report; National Renewable Energy Laboratory: Golden, CO, USA, 2015. [Google Scholar]
- Nixon-Pearson, O.; Branner, K.; Mishnaevsky, L. Wind Turbine Blade Design and Manufacturing: A Review. Renew. Sustain. Energy Rev. 2022, 164, 112523. [Google Scholar]
- León-Medina, J.X.; Dervilis, N.; Worden, K. Digital Twin Technology in Wind Turbine Components: A Review. Renew. Energy 2024, 216, 119–135. [Google Scholar]
- Deshmukh, A.; Khodke, P. Stress Analysis of Composite Wind Turbine Blade by Finite Element Method. IOP Conf. Ser. Mater. Sci. Eng. 2017, 241, 012015. [Google Scholar] [CrossRef]
- Corkery, J. Modelling and Design of a Wind Turbine Blade for Structural Integrity Analysis. Master's Thesis, University of Strathclyde, Glasgow, UK, 2021. [Google Scholar]
- Resor, B.R. SAND2013-2569; Definition of a 5-MW/61.5-m Wind Turbine Blade Reference Model. Sandia National Laboratories: Albuquerque, NM, USA, 2013.
- Deng, Z.; Xiao, Q.; Huang, Y.; Yang, L.; Liu, Y. A General FSI Framework for an Effective Stress Analysis on Composite Wind Turbine Blades. Ocean Eng. 2024, 291, 116412. [Google Scholar] [CrossRef]
Figure 1.
Carbo4Power 3D blade geometry.
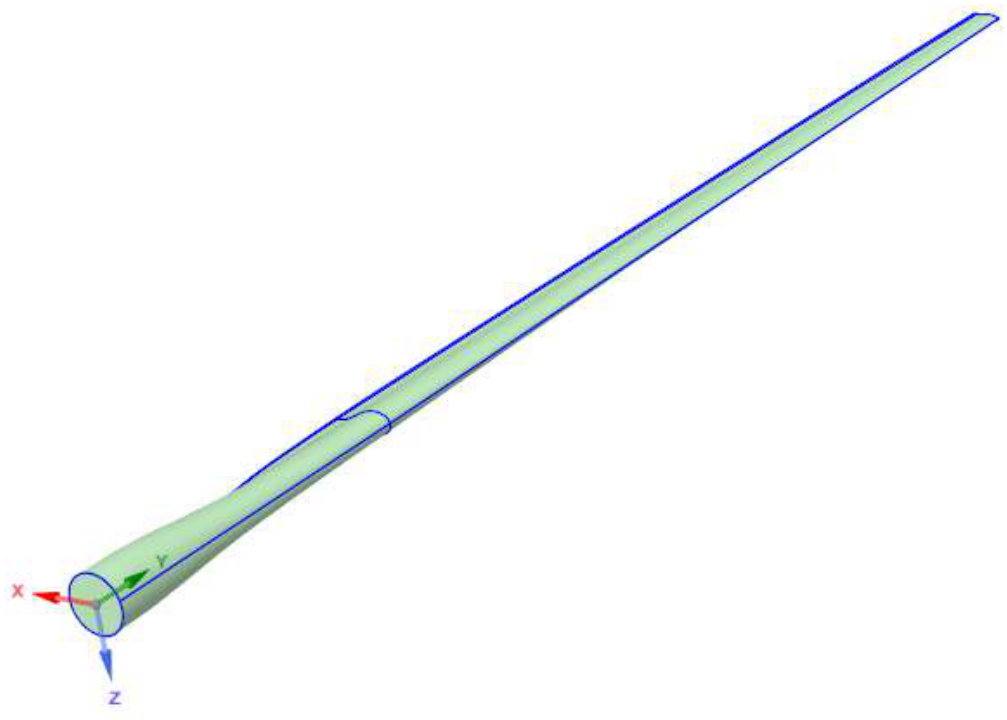
Figure 2.
Enclosed solid geometry for CFD.
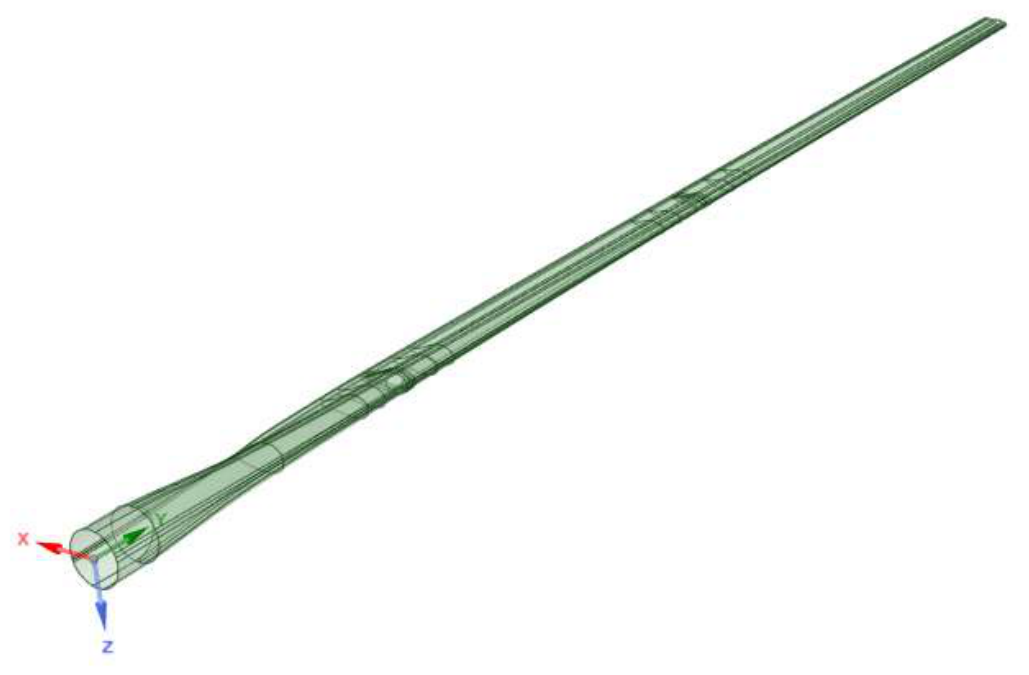
Figure 3.
Fluid configuration with blade negative imprint.
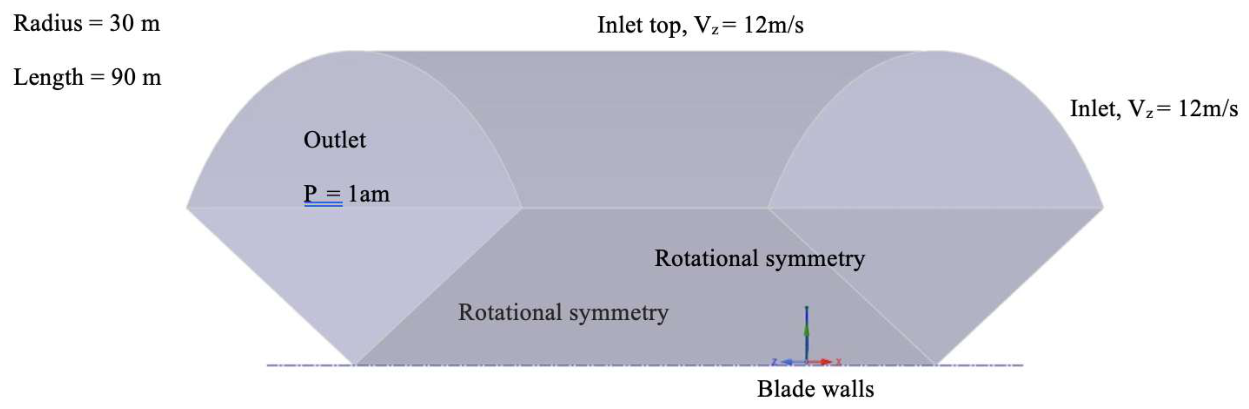
Figure 4.
(a) Mesh of fluid with refined mesh around the blade area; (b) fine mesh around the blade geometry; (c) inflation layer at the blade tip.
Figure 4.
(a) Mesh of fluid with refined mesh around the blade area; (b) fine mesh around the blade geometry; (c) inflation layer at the blade tip.
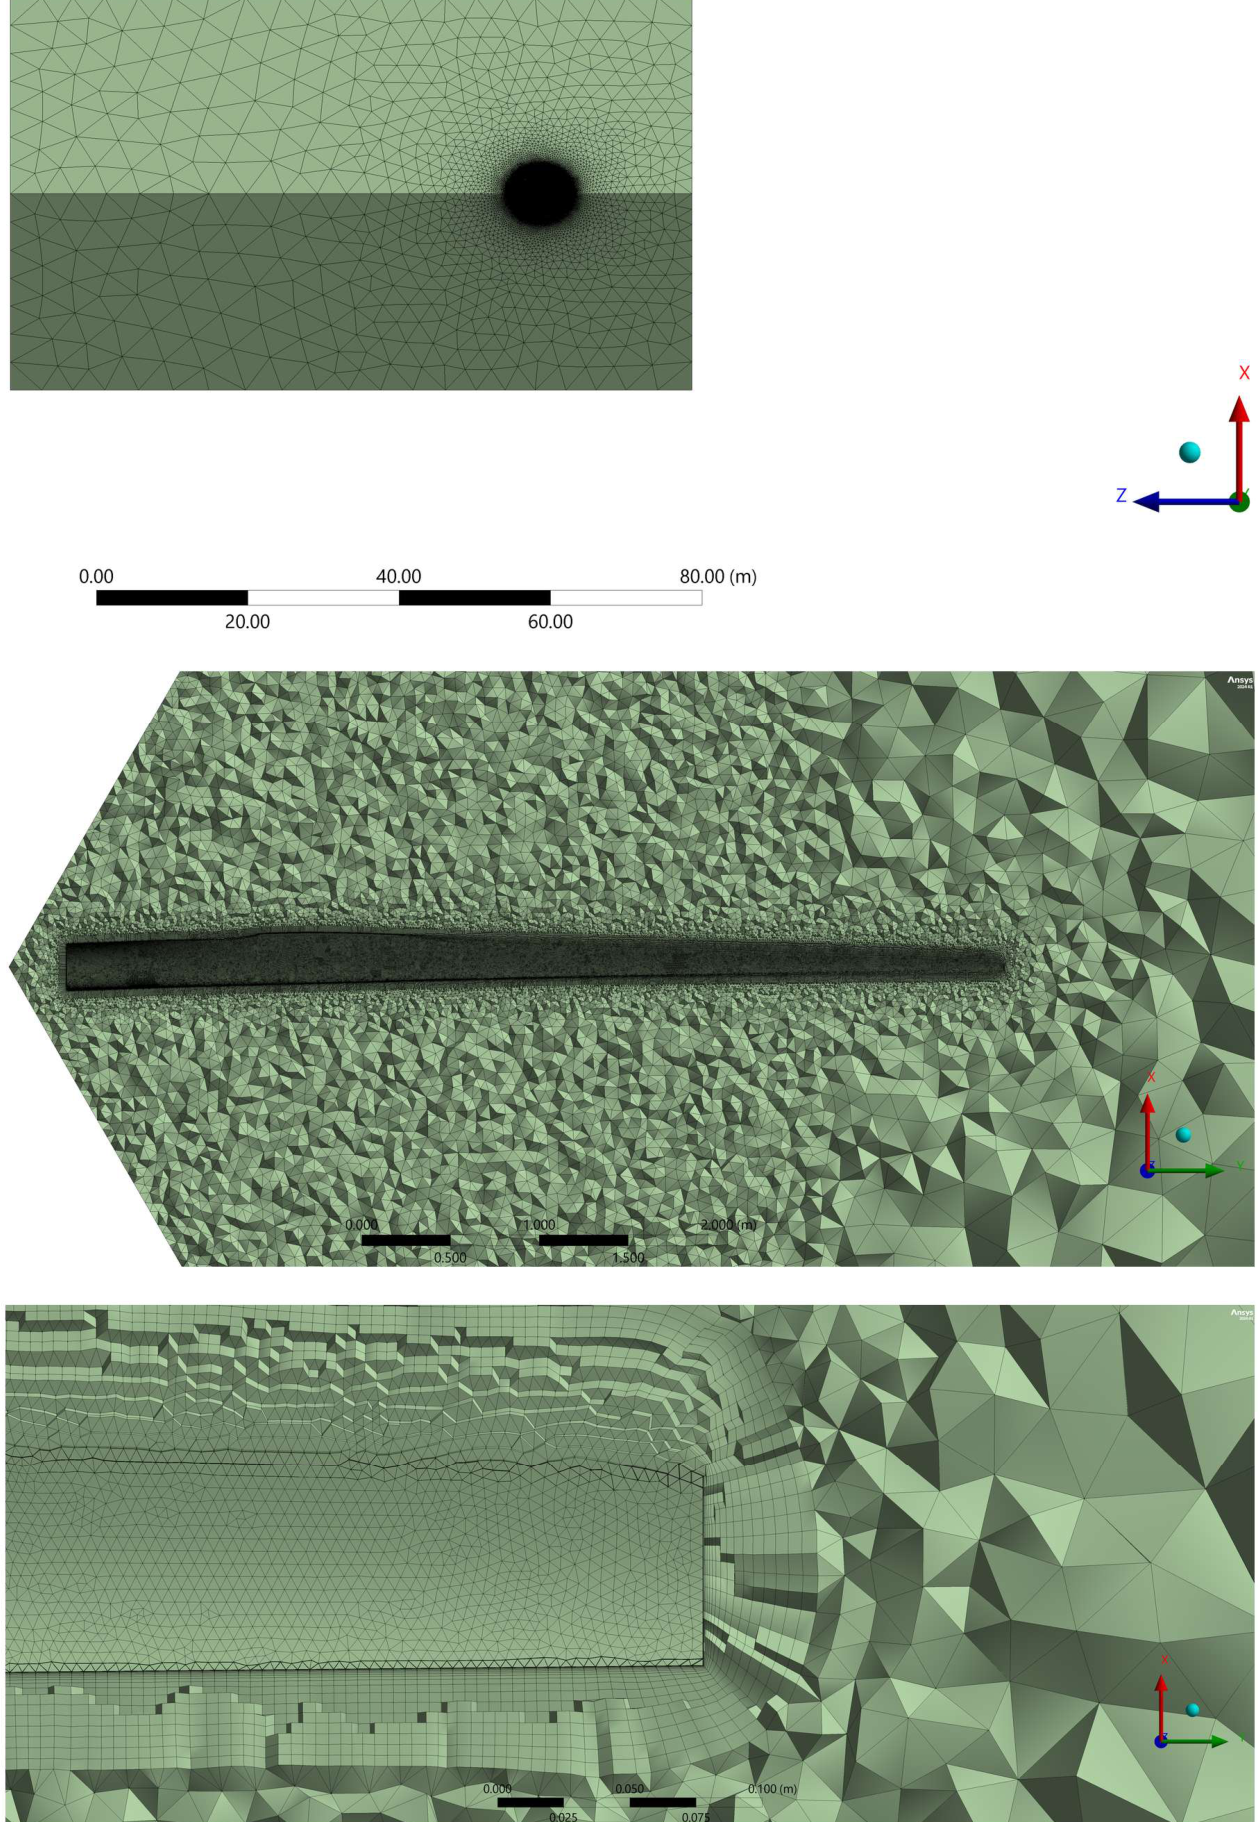
Figure 5.
FEA mesh.

Figure 6.
(a) Linear thickness distribution; (b) realistic C4P thickness distribution.
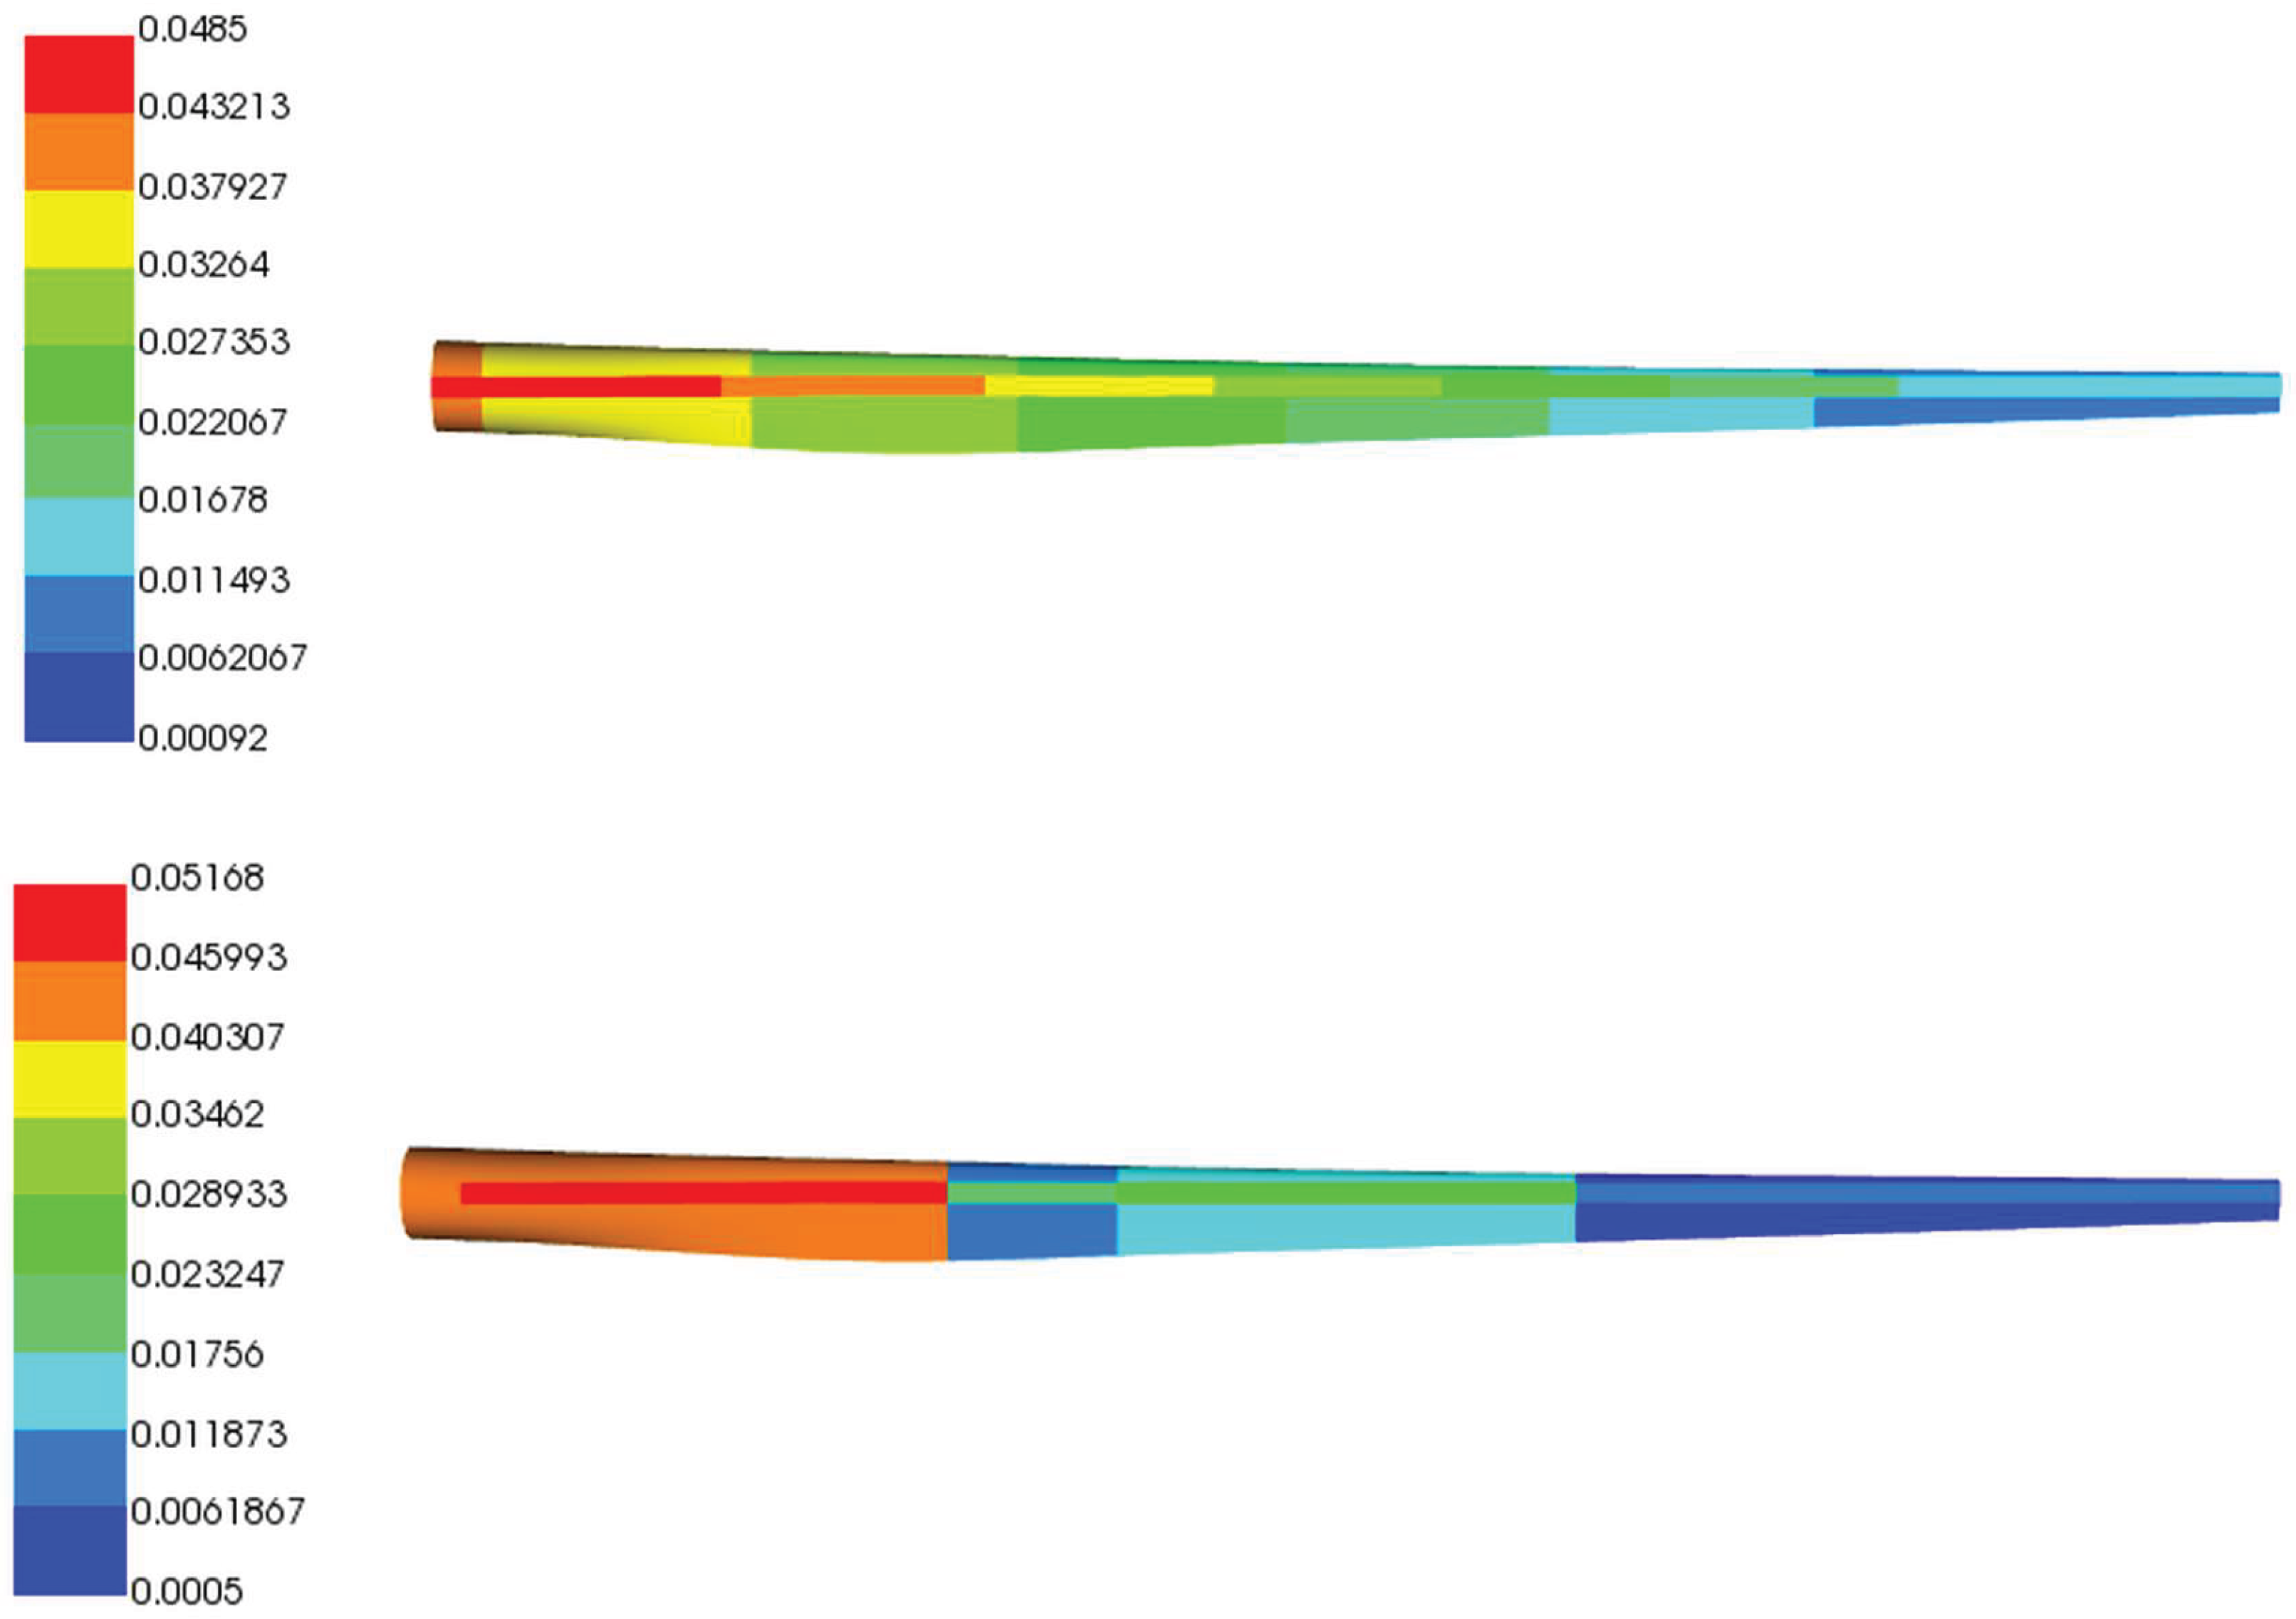
Figure 7.
Convergence criteria including drag coefficient (top left), torque (top right), integral pressure (bottom left), and mass flow rate (bottom right).
Figure 7.
Convergence criteria including drag coefficient (top left), torque (top right), integral pressure (bottom left), and mass flow rate (bottom right).
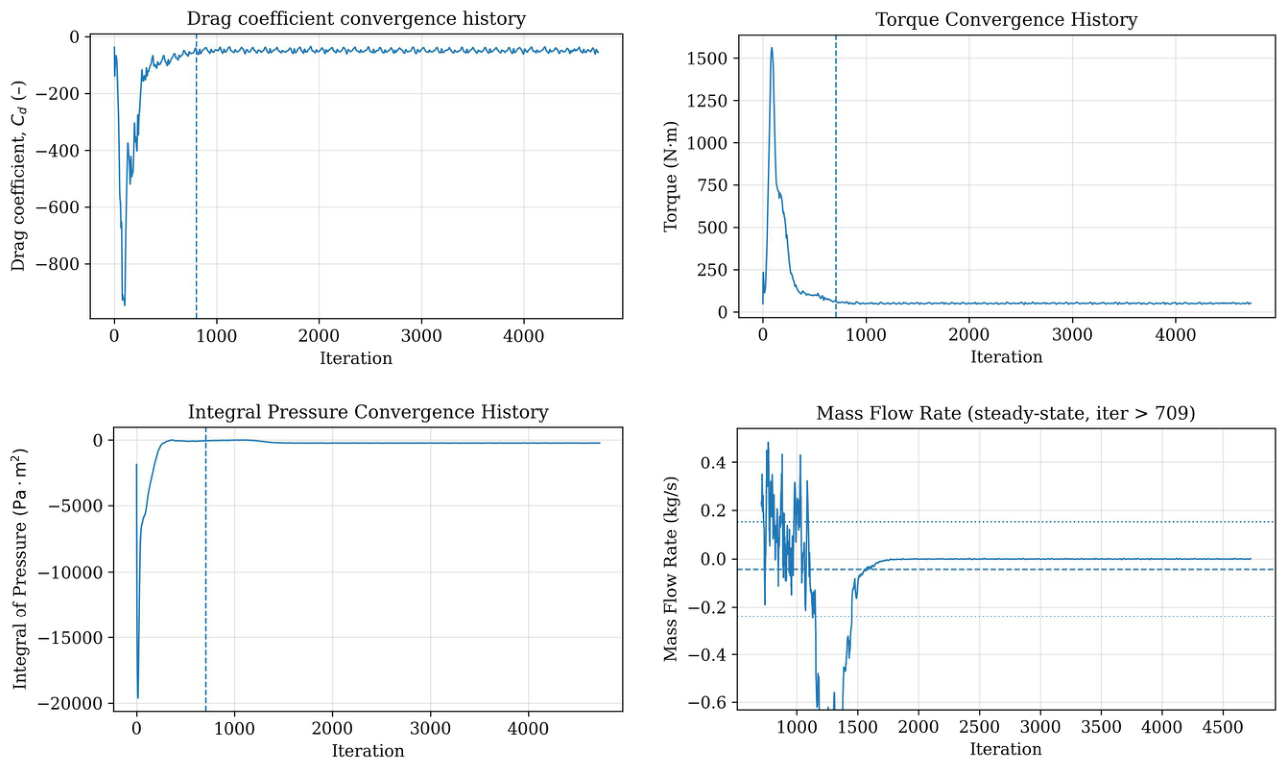
Figure 8.
Blade velocity.
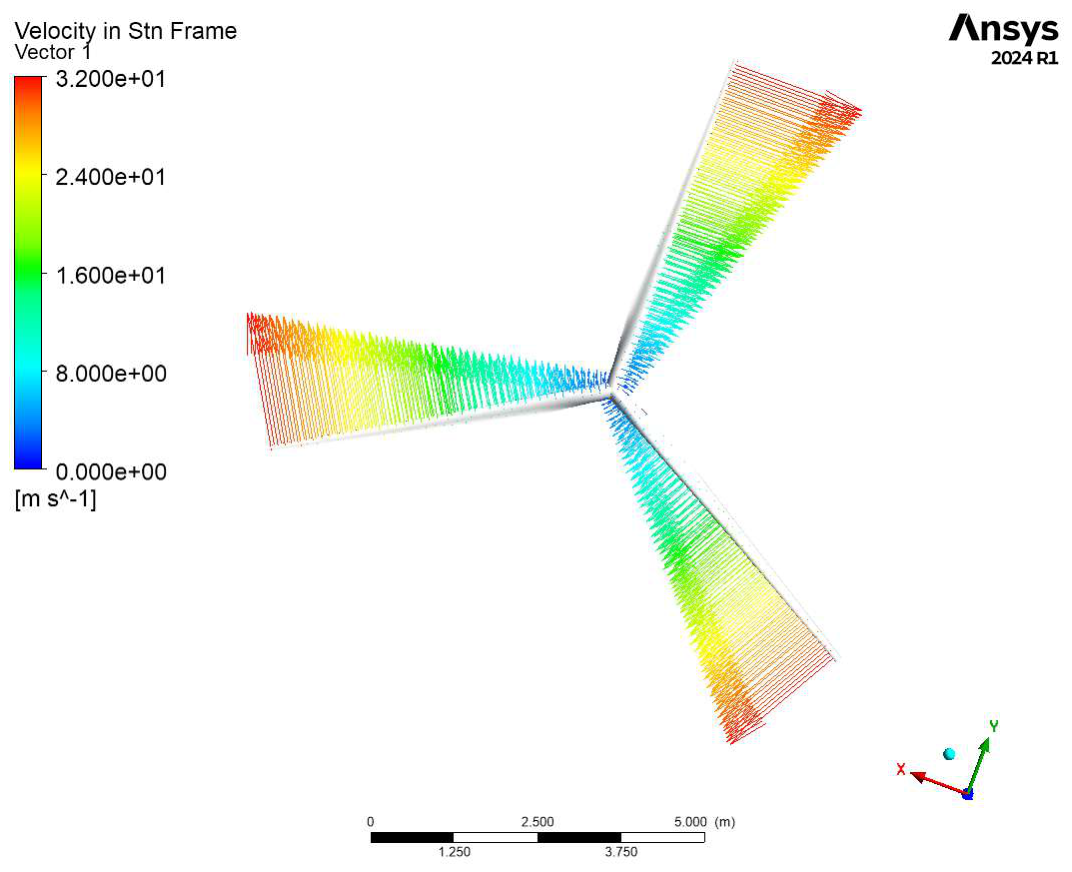
Figure 9.
Velocity streamline.
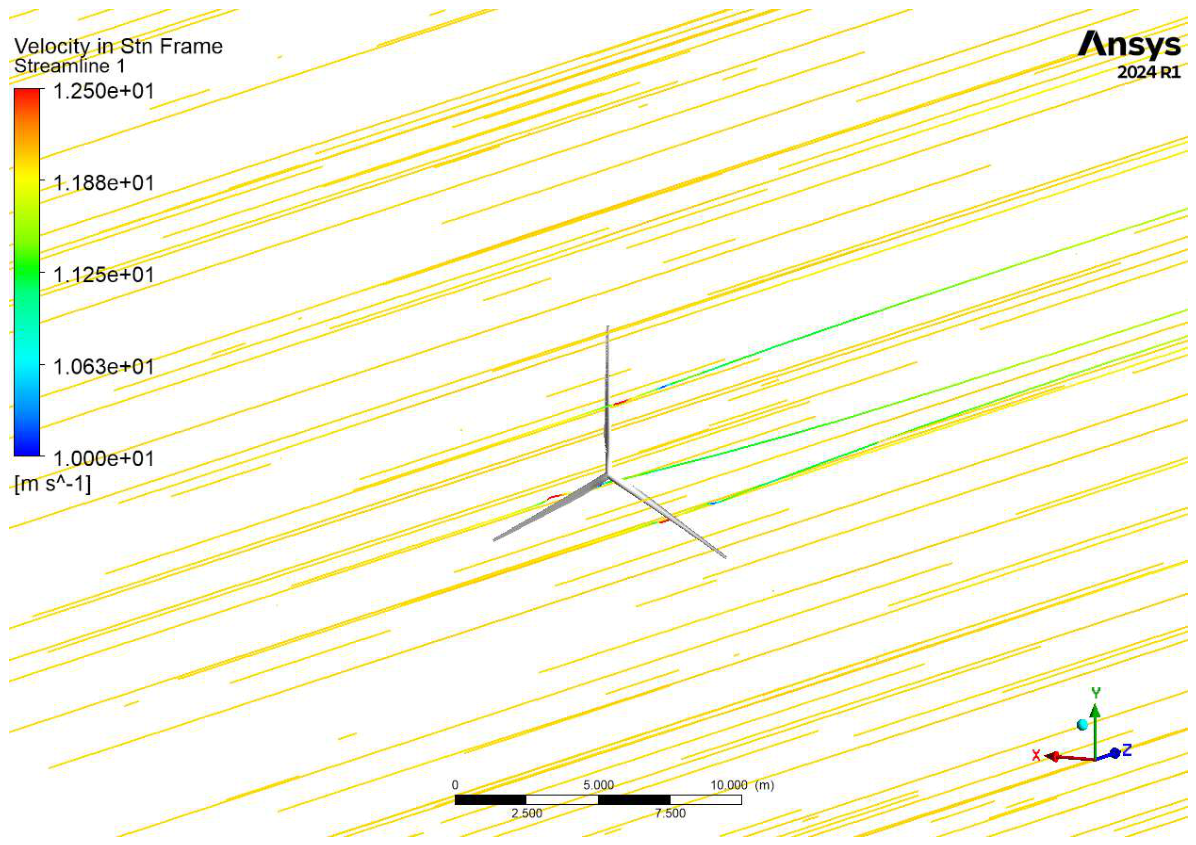
Figure 10.
(a) Pressure contour on the pressure side; (b) pressure contour on the suction side.
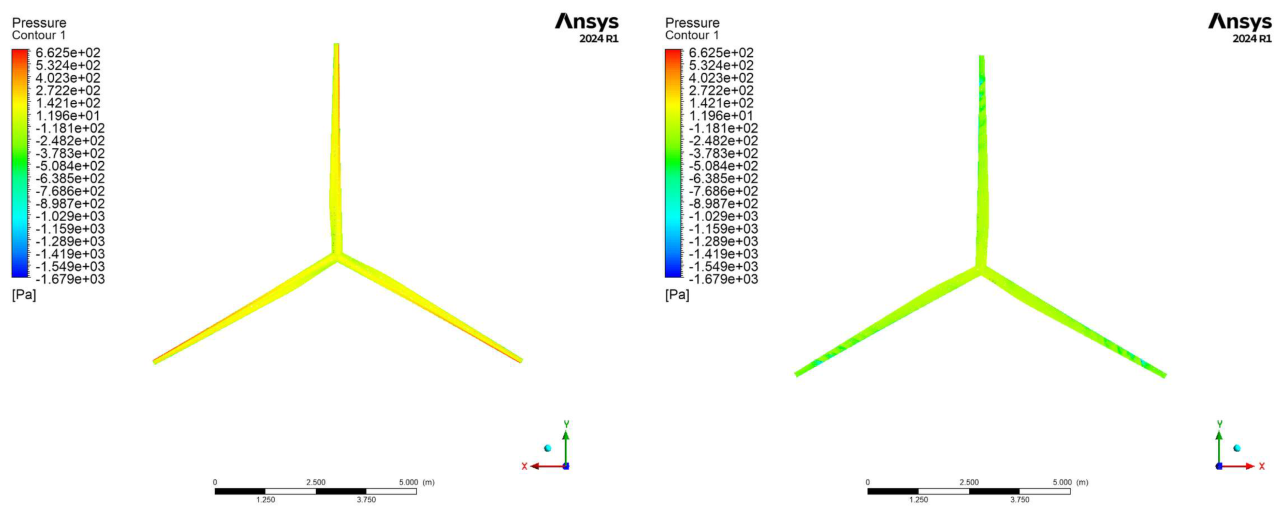
Figure 11.
Linear thickness von Mises stress distribution.
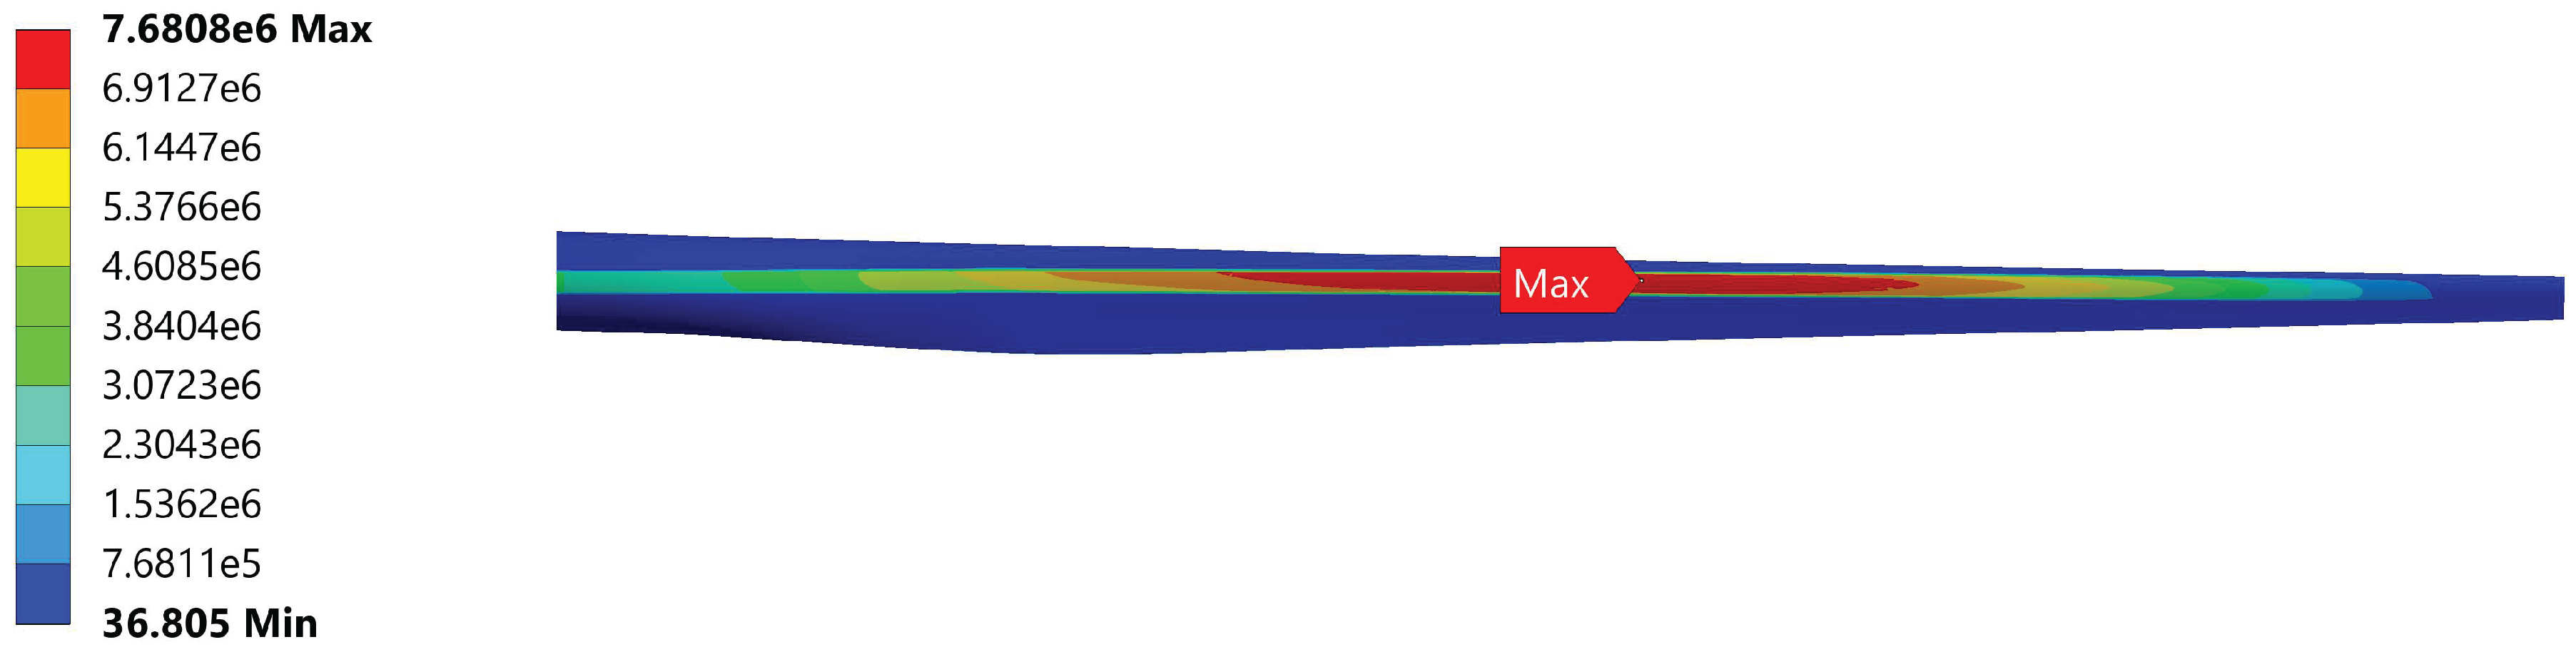
Figure 12.
C4P thickness von Mises stress distribution.
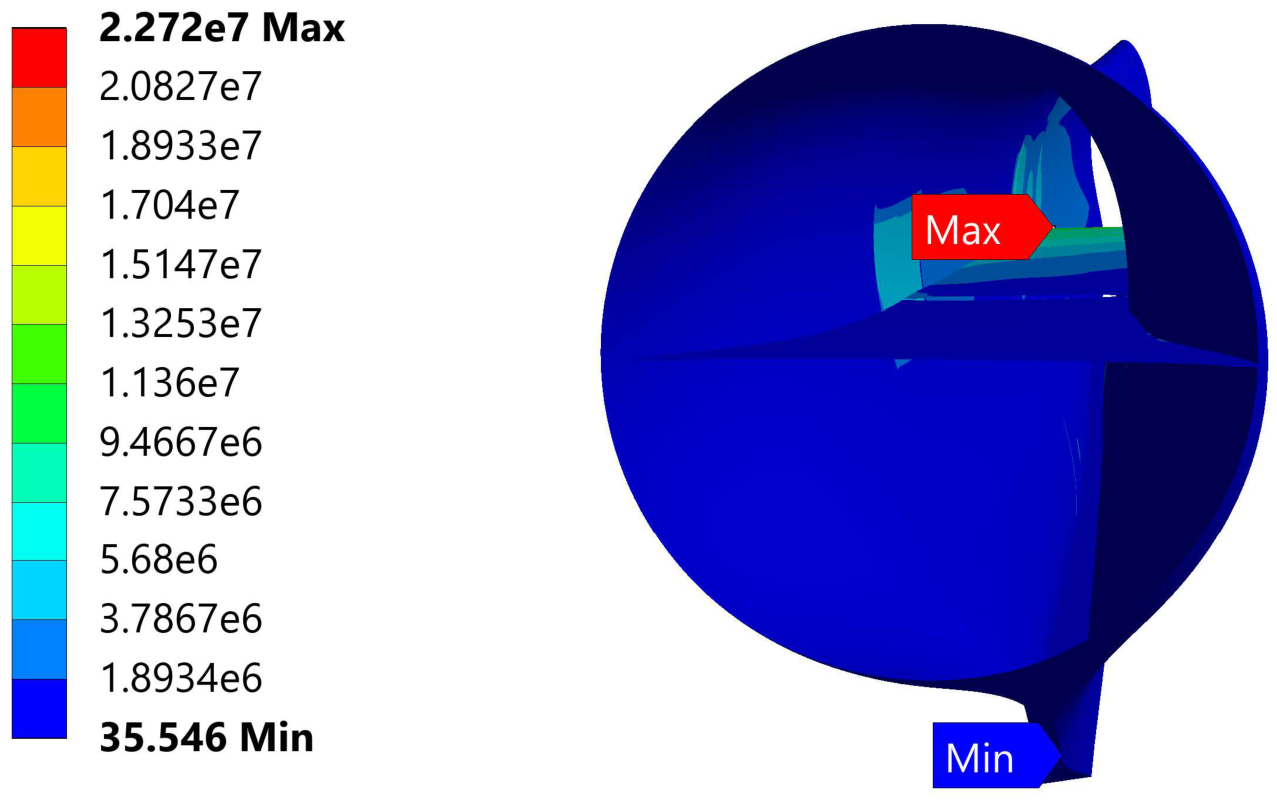
Figure 13.
Cross-study comparison between representative laminate thickness and maximum von Mises stress for the present composite blade and published wind turbine blades [30,31,32,33]. Individual data points are summarised in Table 1.
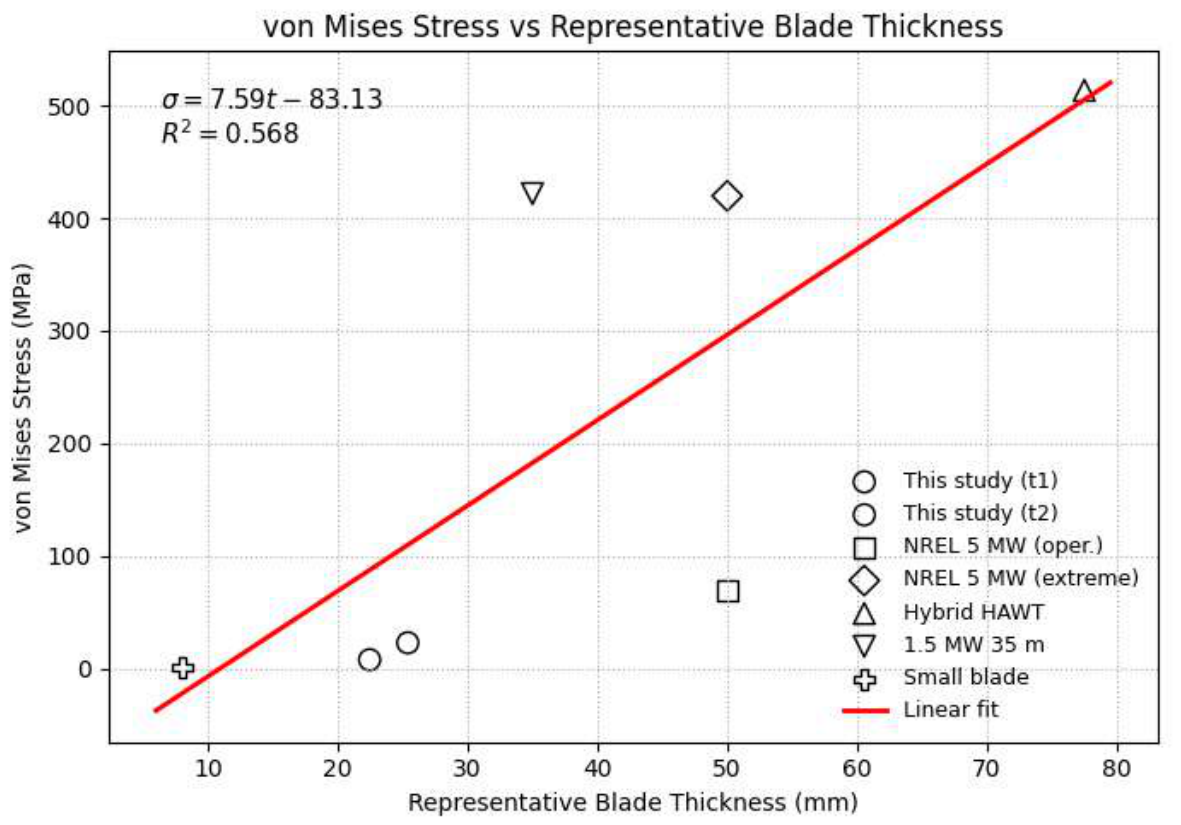
Table 1.
Literature-based thickness–stress dataset used for validation.
| Case | Blade type/scale | Blade length (m) | Representative thickness (mm) | Peak von Mises stress (MPa) | Loading condition | Thickness derivation | Reference |
| This study – Case 1 | Research composite blade | 5.27 | 25.4 | 22.7 | Operating | Area-weighted mean | This work |
| This study – Case 2 | Research composite blade | 5.27 | 22.46 | 7.68 | Operating | Area-weighted mean | This work |
| Literature A | Small composite blade | ~1–2 | ~8 | ~0.85 | Operating | Mid-span estimate | [30] |
| Literature B | 1.5 MW blade | ~35 | ~35 | ~421.8 | Extreme | Reported laminate | [31] |
| Literature C | Hybrid HAWT blade | ~60 | 77.5 | ~513.6 | Extreme | Linear taper | [32] |
| Literature D | NREL 5 MW blade | 61.5 | ~50 | ~69.1 | Operating | Reference definition | [33] |
| Literature E | NREL 5 MW blade | 61.5 | ~50 | ~419.8 | Extreme | Reference definition | [33] |
Disclaimer/Publisher’s Note: The statements, opinions and data contained in all publications are solely those of the individual author(s) and contributor(s) and not of MDPI and/or the editor(s). MDPI and/or the editor(s) disclaim responsibility for any injury to people or property resulting from any ideas, methods, instructions or products referred to in the content. |
© 2026 by the authors. Licensee MDPI, Basel, Switzerland. This article is an open access article distributed under the terms and conditions of the Creative Commons Attribution (CC BY) license.
Copyright: This open access article is published under a Creative Commons CC BY 4.0 license, which permit the free download, distribution, and reuse, provided that the author and preprint are cited in any reuse.


