

Submitted:
21 July 2026
Posted:
21 July 2026
You are already at the latest version
Abstract
Additively manufactured components require machining of functional surfaces to meet geometric requirements. Due to low stiffness and non-nominal as-built geometry, they are susceptible to milling-induced shape deviations. This paper presents a hybrid process simulation for predicting shape errors in compliant metallic laser powder bed fusion components. The method combines real-geometry-based technological NC simulation, quasi-static force prediction, finite element-based structural response simulation, and surface reconstruction between roughing and finishing to enable multistage operation. The approach is validated for linear and non-linear toolpaths with varying immersion angles and compliance conditions. The results show reproduced force profiles, while magnitude deviations highlight the relevance of deformation-dependent engagement feedback in high-compliance regions. An analytical back-calculation based on the effective engagement cross-section reveals that accounting for deflection-induced engagement reduction reduces force deviations. During roughing, maximum shape errors for linear and non-linear toolpaths are overestimated by 4–5 %, and critical high-error regions are identified. The reconstructed intermediate geometry after roughing is essential for finishing, since neglecting geometry feedback underestimates finishing forces. With geometry feedback, the maximum finishing shape error is predicted as 0.090 mm, while the measured value is 0.086 mm. The simulation captures dominant quasi-static shape-error regimes and supports process-chain-oriented prediction in additive-subtractive manufacturing.
Keywords:
hybrid manufacturing
; simulation
; additive manufacturing (AM)
; milling
; deformation
1. Introduction
Additive manufacturing (AM) has evolved into a key enabler for weight-critical structures in the aerospace and related sectors due to the design freedom it offers and its favourable buy-to-fly ratios [1,2,3]. Nevertheless, functional surfaces and tight geometric dimensioning and tolerancing (GD&T) still require subtractive finishing. The as-built quality of metallic powder bed fusion (PBF-LB/M) parts has been shown to be comparable to that of sand-cast components. Surface roughness values of Ra ≈ 20-30 µm and dimensional deviations within the ISO tolerance grades IT12-IT17 are characteristic of PBF-LB/M [4,5]. Consequently, machining remains essential for achieving application-grade surface quality and dimensional accuracy in AM process chains [6]. In the context of aerospace applications, the presence of additional milling-induced deformations of the tool and workpiece serves to further accentuate the necessity for systematically planned finish-milling operations [7]. In the case of AM parts, which are typically compliant, topology-optimised and thin-walled, milling-induced shape deviations are primarily attributable to force-induced quasi-static deflections of the tool and workpiece [8]. The underlying mechanism is governed by the interaction between the stiffness of the system and resultant force FZ, defined as the force arising between the cutting edge and the workpiece. The rigidity of the system is contingent on geometric, material, and fixture properties [9]. However, the process forces are represented by the cartesian force compontens Fx, Fy and Fz. These components are determined by the local cutter-workpiece engagement conditions, process kinematics, and workpiece material properties. The local engagement conditions describe the instantaneous interaction between the rotating tool and the workpiece material and are represented by the local depth of cut ap , width of cut ae , immersion angle φ, and maximum undeformed chip thickness hcu max. Here, φ denotes the instantaneous immersion angle of the cutting edge within the angular engagement range between the entry angle φe and the exit angle φa . These quantities result from the local intersection of the tool envelope with the workpiece and therefore depend on the current tool position, the tool orientation, and the actual workpiece geometry. In mechanistic process-force models, the relationship between local engagement conditions and the resulting force components is commonly described by empirically identified model coefficients. These coefficients represent the specific tool–workpiece material pairing and the relevant tool geometry [10]. As material is removed, the structural stiffness of the workpiece decreases, thereby amplifying quasi-static deformation and increasing the sensitivity to local engagement variations, especially on curved or non-flat surfaces [11]. Therefore, this work focuses on the prediction of quasi-static, force-induced shape errors during the milling of compliant AM components. The central challenge addressed in this paper is not the general modelling of all process disturbances but the consistent transfer of real-geometry-based engagement conditions, predicted process forces, and changing workpiece compliance into a simulation chain that can predict the resulting machined surface.
Two overarching modelling paradigms can be distinguished for predicting such shape deviations: data-driven and physics-based approaches. Data-driven methodologies involve the correlation of process variables and process-state information with resulting deviations, utilising empirical regression or machine-learning models [12,13,14,15]. While such models have been shown to achieve high local prediction quality, they remain dependent on representative training data and exhibit limitations in terms of transferability to new geometries, tools and process conditions. This is problematic in the context of AM parts, w[12–15hich typically have low batch sizes and first-part-right requirements [12,14]. Physics-based methods, in contrast, model the causal chain from engagement to loads to structural response [16]. Fully numerical approaches, such as chip-formation finite element method (FEM) or coupled cutter-workpiece simulations, offer high fidelity but are computationally expensive for larger AM components [17,18]. Analytical beam- or plate-based models are more efficient, but rely on restrictive assumptions that limit their applicability to complex AM geometries [19].
Geometric-numerical frameworks provide an intermediate modelling strategy that bridges these two extremes. The combination of engagement calculation, material removal, force modelling and structural response simulation enables the prediction of quasi-static deflection-induced errors on the in-process workpiece (IPW) [20,21]. Within this class, two principal strategies can be distinguished. In the first case, the FE model itself is used to represent the evolving IPW [22,23]. Material removal is then introduced directly into the structural discretisation. This objective can be realised through the utilisation of irregular or process-adapted meshes to represent successive intermediate workpiece states [22,23]. A more recent approach involves the deactivation of elements intersected by the swept tool volume. In commercial finite element (FE) environments, this is often implemented by birth-death techniques, where removed elements remain part of the mesh topology but no longer contribute significantly to the structural stiffness [21]. Furthermore, geometry-orientated variants modify boundary nodes or contact-zone nodes to better approximate the actual machined contour and the deformation-dependent cutter-workpiece engagement [21]. Alternatively, the changing compliance can be represented by updating the system stiffness matrix directly, for example, by subtracting the stiffness contributions of removed elements or by using substructuring techniques [24]. This provides direct consistency between removed material, structural state, and force application, but increases computational cost and numerical sensitivity because geometric updates and structural solutions remain tightly coupled [21,23,24]. In the second, geometric material removal and structural response simulation are treated separately. In this case, the in-process workpiece is updated in an independent geometric model, while the structural response is solved on a separate numerical discretisation [25,26,27,28]. This enhancement ensures scalability and flexibility for complex tool paths and free-form AM geometries. However, it is imperative to note that a robust transfer of geometry, engagement, and process forces between domains is necessary for the effective utilisation of this approach [27]. A limitation of this class is that displacement-induced changes in cutter-workpiece engagement must be handled through the coupling of two environments. As a result, deformation-aware force-feedback loops are technically demanding and computationally expensive, because engagement, chip thickness, force distribution, and structural response must be updated iteratively until convergence is reached [21,27]. Compared with one-way coupled approaches, this leads to a significant performance trade-off and makes robust implementation particularly challenging for complex tool paths and large numbers of cutter location points [25,27].
A further differentiating aspect is the representation of force transfer between the cutter and the compliant workpiece. Earlier approaches demonstrated that reducing the cutter-workpiece interaction to an equivalent concentrated point force is inadequate for accurately predicting local surface errors [28,29]. Subsequent FE-based models thus introduced the concept of distributed force application along the cutter axis or along local contact-related node sets [23,28], whereas more recent voxel-/finite-cell-based approaches derive the application boundary directly from the current cutter-workpiece engagement and apply the process force over the corresponding engagement zone [27]. These diverse approaches mirror the prevailing trade-off between physical fidelity and computational and implementation effort.
Existing literature indicates that geometric–numerical simulation frameworks currently provide the most suitable basis for predicting milling-induced shape deviations in compliant additively manufactured components, as they combine the capability to represent complex geometries and tool paths with a physics-based description of engagement conditions, force generation, and structural response [24,25,27]. However, significant performance-limiting factors remain in force calculation and force transfer, particularly when tool helix angle, cutter angular position, feed motion, and geometry-dependent cutter-workpiece engagement must be considered simultaneously. In addition, deformation-aware feedback of structural deflection into the cutting process increases implementation effort and computational cost, which limits industrial applicability. These limitations become even more critical for AM components with non-nominal initial geometries. Increased process forces occur during rough machining due to larger engagement sizes, leading to greater deformation of both the workpiece and the tool. Consequently, the actual chip cross-section during the finishing process differs from the ideal one. This interaction has not yet been systematically investigated in the literature.
This paper proposes a hybrid process simulation for predicting milling-induced shape errors in compliant AM components. Accordingly, the method can be classified as a geometric-numerical framework: cutter-workpiece engagement and material removal are determined using a dexel-based geometric simulation, while the resulting cutting forces are transferred to a finite element model to compute the workpiece deflection. Section 2 establishes the conceptual basis of the approach by embedding the hybrid process simulation in the additive-subtractive process chain and by introducing the industrial context and the investigated AM-derived specimens. Section 3 creates the experimental and modelling basis for the hybrid process simulation. It includes the acquisition of process force data using additively manufactured rigid test specimens, the derivation of force models, and the experimental setup for analysing the interaction between milling forces and compliant AM specimens. Building on this basis, Section 4 develops the implemented modules of the hybrid process simulation. Section 4.1 establishes the technological NC simulation for determining local engagement conditions on the real AM geometry and predicting the corresponding process forces. Section 4.2 develops the structural response simulation for transferring these forces to FE-based in-process workpiece states and calculating the resulting static deformations. Section 4.3 introduces the surface reconstruction strategy, which converts the simulated deformations into an updated workpiece geometry for subsequent machining stages. Section 5 provides the experimental validation of the developed simulation methods using a compliant specimen. Section 6 evaluates the results and discusses methodological limitations of the approach. The paper closes with conclusions and an outlook on future work.
2. Approach
The proposed hybrid process simulation is designed to predict machining-force-induced shape errors in compliant additively manufactured components. This paper focuses on compliant PBF-LB/M components from the high-strength aluminium alloy Scalmalloy®. The components of interest exhibit slender, cantilever-like geometric features with functional surfaces that require final machining. Figure 1 displays two representative reference parts from the aerospace sector that have been selected to define the industrial context: a pitot-tube holder used in helicopter applications and a bracket employed in commercial aircraft structures.
Based on two aerospace reference parts, a pitot-tube holder and an aircraft bracket, two simplified specimens were derived to represent typical compliant functional surfaces of PBF-LB/M components. The beam specimen provides a clearly traceable linear toolpath and a cantilever-like compliance distribution. The freeform specimen introduces concave and convex toolpath segments with varying local immersion and compliance. Both specimens include functional surfaces with a representative flatness tolerance of 0.02 mm and serve as controlled validation geometries for the proposed simulation method (Section 5). Figure 1 also shows the build direction within the build chamber of the PBF-LB/M machine. The specimens are oriented vertically to minimize the need for support structures. As shown in Figure 2, the hybrid process simulation is positioned within the additive-subtractive process chain presented by Lachmayer et al. [30]. The process chain begins with the computer-aided design (CAD) of the part (Figure 2, step 1). After the design data have been prepared for additive manufacturing, the part is produced using the PBF-LB/M process. The real workpiece geometry and its position within the machine tool are then acquired. Based on these data, computer-aided manufacturing (CAM) generates the numerical control (NC) code for the subsequent machining process (Step 2). In the overall approach, the hybrid process simulation provides the basis for analysing the planned machining process and for deriving adapted NC code. The process optimisation module itself is not addressed within the scope of this paper. The process chain concludes with the milling operation and the quality assurance of the machined AM part. The proposed hybrid process simulation is classified as a geometric-numerical framework. Material removal and structural response analysis are performed in separate but sequentially coupled domains, represented by the technological NC simulation (Step 4.1) and the structural response simulation (Step 4.2), as displayed in Figure 2.
The technological NC simulation is based on a dexel-based kinematic milling simulation, in which material removal is calculated from the intersection between the workpiece and the tool along the imported NC code. The workpiece geometry is represented by a multi-dexel model. A dexel consists of a start point and an end point, which represent surface points of the discretised geometry. By combining three orthogonal dexel grids in Cartesian coordinates, the real initial geometry of the AM part can be represented with high geometric detail [32]. The technological NC simulation enables the calculation of local engagement conditions based on the real workpiece geometry and provides the corresponding process forces. In addition, a sampled toolpath (TPS, list of tool centre points) and the corresponding force vectors in the workpiece coordinate system are generated as input for the subsequent structural response simulation.
While the technological NC simulation presented here operates on a dexel-based geometry representation, the finite element analysis requires a closed volumetric workpiece model. This incompatibility is particularly relevant for additively manufactured components, since their initial geometry can deviate substantially from the nominal CAD model and is typically available as triangulated surface meshes, for example in STL format. To address this issue, the milling process is reconstructed within the structural response simulation module (Step 4.2) based on the information exported from the technological NC simulation. The exported toolpath sampling data and tool metadata are used to reproduce the material removal for each TPS step by Boolean operations. In this way, closed solid-body representations of the in-process workpiece states are generated for the subsequent FE-based deformation simulation. For each generated IPW state, the corresponding quasi-static structural response is calculated. This sequential procedure is repeated until all TPS points have been processed. If further machining stages remain, the predicted cumulative displacement field is evaluated to derive the resulting shape deviation and to reconstruct the simulated workpiece geometry after the preceding machining stage (Step 4.3). This updated geometry is then fed back into the technological NC-simulation, allowing the simulation cycle to be repeated for the subsequent process step. Once all machining stages have been completed, the predicted shape deviation provides the basis for subsequent process optimisation (Step 4.4), which is outside the scope of this paper.
In general, the simulation is implemented as a one-way coupling. In the present paper, engagement conditions are evaluated from the current workpiece state, either scanned real geometry or fed back reconstructed geometry after roughing and used to derive process forces, while the structural response is calculated subsequently without feeding the in-process deflection back into the technological NC-Simulation. This assumption reduces modelling complexity and computational effort, but introduces a case-specific modelling error because the actual error depends on the local workpiece stiffness, the cutter-workpiece contact zone, and the process forces. Therefore, the influence of this assumption is assessed for the presented application case by experimental validation. The resulting approach is therefore aimed at a robust and practically applicable prediction methodology for compliant AM components.
3. Materials and Methods
3.1. Force Data Acquisition
To record quasi-static process forces, milling experiments were conducted on a five-axis machining centre, the DMG MORI HSC 55 linear. A short-overhang, Carb-coated solid carbide end mill of type Guhring Ratio RF 100 AL D10 6978 with a bottom cutting edge angle of 178° and three teeth is selected to keep tool deflection negligible compared to workpiece deflection. Cutting forces were measured using a piezoelectric multi-component dynamometer of type Kistler 9257B. The charge signals were conditioned with Kistler 5015 charge amplifiers and digitized using an NI 9215 A/D module. The force signal was recorded at a sampling rate of 100 kHz and subsequently processed using a low-pass filter with a cutoff frequency of 10 kHz. The measurement data were recorded using LabVIEW-based in-house acquisition software.
For parameterisation of the force models, rigid parameterization specimens were additively manufactured from the high-strength aluminium alloy Scalmalloy® using a PBF-LB/M system, the Aconity MIDI+ [31]. The specimens had a height of 36 mm to ensure that, despite progressive material removal, the engagement region remained within the calibrated measurement range located up to 25 mm above the dynamometer top surface. The specimens were bolted directly onto the dynamometer and machined under full-factorial variation of the cutting parameters (Table 1).
In the finish machining of additively manufactured components, combined roughing–finishing strategies are commonly applied; therefore, the geometric engagement conditions for calibration were selected based on typical stock allowances for functional-surface finalisation, the maximum usable cutting-edge length of the tool, and the need to cover both roughing and finishing chip-volume regimes. The stock allowance typically ranges from 0.5 to 2 mm and depends strongly on the expected deviation from nominal geometry resulting from the additive manufacturing process. The investigated cutting-parameter levels and the relevant variables from the additive process are summarised in Figure 3. All milling trials were performed in down-milling, since preliminary tests indicated that up-milling tended to be less stable and resulted in higher surface roughness. The forces recorded by the dynamometer in the x-, y-, and z-directions are transformed into the process coordinate system (PCS) and interpreted as the feed force Ff, the feed normal force FfN, and the passive force Fp.
3.2. Force Modelling
The force model parameterized in this study provides quasi-static cutting force components for subsequent use in the hybrid process simulation. It predicts the feed force Ff, feed-normal force FfN, and passive force Fp in the process coordinate system (PCS) as functions of local engagement conditions. Since the shape deviations considered here are governed primarily by the low-frequency process load, the modelling is restricted to quasi-static force components, while tooth-passing and higher-frequency vibration-related contributions are suppressed. Quasi-static force signals are extracted from the measurements using a phase-free fourth-order Butterworth low-pass filter with a cutoff frequency of
fn is the spindle rotation frequency. The model formulation follows the established empirical relationship between undeformed chip geometry and process forces, as used in Kienzle-type force modelling [33]. In the present work, this relationship is adapted to the process coordinate system (PCS) force components feed force Ff , the feed-normal force FfN, and the passive force Fp, which are not local cutting-edge forces but projected process force components. Therefore, the influence of the specific workpiece-material/tool pairing, cutting edge geometry, and circumferential engagement is represented by component-specific effective model coefficients. The resulting semi-empirical model is formulated as:
with
and
Here, denotes the respective PCS force component, ap is the local axial depth of cut, hcu max is the maximum undeformed chip thickness, and φ is the immersion angle. q90 denotes the empirical 90% residual band around the ideal prediction line, based on the absolute deviations between measured and predicted force values.
The normalized angle xφ is dimensionless and is introduced to ensure unit consistency of the polynomial coefficient term. The parameters αi, K0,i , K1,i , K2,i , are empirically identified for each force component. The immersion angle φ is emphasized because it represents the circumferential extent of the tool–workpiece engagement and therefore affects both the number of active cutting edge segments and the projection of the local cutting forces into the PCS. A quadratic formulation of Ki(φ) was chosen as the lowest-order polynomial extension that can capture the nonlinear influence of angular engagement while keeping the model compact and avoiding unnecessary additional parameters.
For the passive force component Fp, measurements with ap < 1 mm were excluded from the parameter identification. This low-ap range showed a distinct force regime with very small force magnitudes and partly negative measured values, which indicates a disproportionate influence of bottom-edge effects and local contact conditions. Since the subsequent hybrid process simulation applies the force model to cutting conditions with ap ≥ 1 mm, where the flank cutting edges dominate the process force generation, the exclusion avoids mixing two different force regimes within one empirical coefficient set.
This formulation retains the established power-law dependence on the undeformed chip geometry while introducing an engagement-dependent effective coefficient term. Consequently, the immersion angle does not enter the model as an additional linear force term, but modifies the effective coefficient Ki(φ). The model was identified using the training data and evaluated on an independent test dataset containing unseen process-parameter combinations. The measured and predicted force components show good agreement for all three process force components (Figure 4). On the test dataset, the model achieves R²TE = 0.996 and MAETE = 1.37 N for Ff, R²TE = 0.997 and MAETE = 2.76 N for FfN and R²TE = 0.994 and MAETE = 1.52 N for Fp. The empirical 90% residual bands shown in Figure 4 indicate that the remaining deviations are small relative to the investigated force range. The semi-empirical model therefore provides a compact and simulation-compatible representation of the quasi-static process forces within the investigated parameter range.
3.3. Experimental Setup for Compliant Workpieces
The experimental setup for the compliant specimens was designed to compare the simulation-based prediction of shape errors with the experimentally obtained results. Prior to machining, each specimen was optically scanned using the ATOS Core 200 Line Scan Sensor from ZEISS. The acquired point cloud was processed in GOM ATOS software by removing non-relevant measurement points, polygonizing the workpiece surface, repairing mesh defects, and exporting the resulting closed surface mesh in STL format [34]. Subsequently, the specimen was clamped on a Kistler 9257B dynamometer mounted on the DMG MORI HSC 55 linear machine tool and referenced accordingly (Figure 5). Process forces were recorded during both roughing and finishing. After each operation, the geometry of the machined surfaces was measured on-machine in the current workpiece coordinate system using the integrated tactile probe Heidenhain TS 642. To ensure comparability, all parts were machined using identical process parameters (Figure 5). For geometry acquisition, measurement points were distributed in a rectangular grid over the machined surface. A minimum edge distance of 0.5 mm was maintained to avoid measurement errors caused by the 6 mm probe ball. In order to facilitate the capture of edge effects, as reported in the literature, the point density was increased to 1 point per millimetre in the tool entry and tool exit regions of the beam specimen. The width of these refined edge zones was chosen to correspond to the tool radius.
4. Hybrid Process Simulation
This chapter describes the methodological implementation of the hybrid process simulation. It comprises the coupling of a technological NC simulation for engagement determination, a structural response simulation, and a subsequent surface reconstruction. The objective is to consistently capture the interactions between tool motion, local engagement conditions with the real workpiece geometry and process forces.
4.1. Technological NC-Simulation
The core of the technological NC simulation as displayed in Figure 2 is a dexel-based milling simulation, which is performed using the in-house software IFW CutS [32]. This simulation takes a processed closed scan of the AM workpiece in the workpiece coordinate system (WCS) as input. In addition, the NC code, including the macrogeometric tool information, is imported from the CAM system.
Section 3 introduced the force models used to predict the quasi-static force magnitudes of the three main force components Ff , FfN , and Fp in the process coordinate system (PCS) presented in Figure 3 and Figure 4. The required model inputs are the maximum undeformed chip thickness hcu max, the depth of cut ap , and the engagement angle φ, which are determined locally in the PCS.
As schematically shown in Figure 6, AM-typical geometrical deviations can lead to local variations of the chip cross-section along the tool axis. The blue contour line represents a cross-section of the real workpiece geometry in the axial direction at the cutting edge entry side. To resolve these local variations in the force calculation, the virtual tool is represented by a cylindrical envelope model of the end mill and discretised along the tool axis into disc elements of height dS, while maintaining a computationally efficient representation. For each disc element, the local chip cross-section is described by the disc height dS and the local maximum undeformed chip thickness . is calculated according to Eq. 5:
For the calculation of φ, the intersected dexels of a given simulation time step are evaluated. These dexels are accumulated in a differential dexel grid (Permissible and impermissible diff grid, Figure 6) representing the material removed during that time step. However, the dexel grid contains dexels that are positioned more than 90° away from the feed direction (i.e., dexels located behind the TCP with respect to the feed vector vf). These dexels distort the calculation of the immersion angle (impermissible dexel grid, Figure 6). Therefore, all dexels that do not lie on the permissible contact arc are excluded from the evaluation in order to determine the physically valid immersion angle for the current time step.
Based on the disc-specific engagement quantities, the resulting process force magnitudes are calculated in the PCS and subsequently transformed into the WCS (Eq. 6). The corresponding transformation matrix T is given in Eq. 8. Here, denotes the normalized feed vector and the tool axis vector. The vectoris the feed-normal vector obtained from the cross product of f̂ and a.
Following the technological NC simulation, a mechanical structural response simulation is performed to predict the deformation of the in-process workpiece under the calculated process forces. This simulation is based on an FE-based deformation analysis and is therefore computationally expensive. Consequently, not every time step of the NC simulation can be transferred and evaluated in the structural model. For this reason, the toolpath (Figure 7) is sampled and stored together with the corresponding force vectors and axis vectors in a toolpath sampling list (TPS). After the virtual machining process, all time steps are identified for each surface at which contact occurred for the last time, i.e., where a change in the dexel grid was detected. This allows the last contact time (TCPlast) and the first contact time (TCPfirst) for each surface to be identified (Figure 7). This ensures that the first surface contact point indeed corresponds to the first contact on the functional surface. At TCPfirst, the following condition is fulfilled: the cylindrical tool surface transitions tangentially into the functional surface. Based on these identifiers, every TCP in between and the corresponding TCP positions associated with actual cutting engagement are extracted.
The resulting list of TCP positions is then filtered using a distance criterion (dTCP) and an angular criterion (αTCP). The distance criterion selects the next TCP once the accumulated path length between successive TCP positions reaches the specified threshold. If the limit angle αTCP between two feed directions is undershot, the respective TCP position is excluded from filtering. In addition, the first TCP position before TCPfirst (TCPstart) is added to the TPS, as this information is required for the subsequent structural response simulation.
4.2. Structural Response Simulation
The structural response simulation is used to transfer the process forces calculated in the technological NC simulation into an FE-based structural model in order to determine the static displacement of the workpiece. Based on the coupling concept introduced in Section 2, a Constructive Solid Geometry (CSG)-based material removal simulation was developed to reproduce the cut previously executed in the technological NC simulation.
The purpose of this step is to generate solid-body states of the in-process workpiece (IPW), which can be used in the subsequent mechanical deformation simulation.
The CSG simulation starts with the import of the tool path sampling list (TPS) provided by the technological NC simulation (Figure 8). It contains the tool centre points TCPj, tool axis vectors , force vectors Fj, and tool metadata provided by the technological NC simulation, including the macro geometry of the tool and the disc discretisation increment dS. Here, the index j denotes the global simulation running index and is incremented continuously across all segments n of the TPS until the total number of time steps Jmax:
In addition, the nominal raw-part geometry is integrated into the simulation environment. Local deviations of the real geometry are not considered at this stage. Based on the tool metadata, a cylindrical body is constructed whose frontal origin is located at TCPstart of the TPS. This frontal face defines the reference plane Plane0, which serves as the extrusion plane of the cylindrical tool envelope and passes through the respective tool centre point TCP (Figure 8). The axis vectors from the TPS are used to orient the cylinder in the workpiece coordinate system WCS. The diameter of the cylindrical tool envelope is defined by the cutting diameter measured with a Zoller Venturion 450 tool presetting and measuring machine. Its length is defined by the cutting-edge length specified in the tool data sheet. Named selections and force coordinate systems can be clearly defined within the CSG environment and transferred to the subsequent FEM environment. The named selections are used to identify the force application surfaces Si on the IPW, the cutter exit edge CEE, and local corresponding force coordinate systems Csysi (Figure 8). The method is implemented in the CAD system Autodesk Inventor. The clamping faces are selected on the nominal geometry in order to reproduce the fixturing situation in the machine tool.
The first IPW state is generated by a linear sweep of the cylindrical tool envelope along the TCP positions. The swept volume is then subtracted from the workpiece volume using a Boolean operation. By sweeping from TCPstart to TCPfirst (Figure 7) the criterion j = Jmax is fulfilled and the milling process is completed.
The CEZ is subdivided into axial surface segments using the disc height dS transferred from the technological NC simulation (Figure 8). Starting from the reference plane Plane0, parallel section planes are constructed along the tool axis with a constant spacing of dS and used to partition the engagement zone into surface segments S. The segment index i starts at the TCP-side segment and increases along the tool axis, with Imax defined by the tool-envelope length and dS. For each segment, a local coordinate system Csysi is generated whose x-axis is aligned with the direction of the corresponding local force vector Fi. The cutter engagement zone (CEZ) is identified by automated geometric feature recognition based on the local curvature, which must correspond to the tool radius. The cutter exit edge CEE is identified by searching for the transition edge to a tangentially adjacent surface. The cutter engagement zone segments (Sj,i) and the cutter exit edge (CEEj,i) of the current simulation running step j, as well as the clamping faces (NSFix) are defined as named selections. Together with the corresponding local coordinate systems (Csysj,i), these entities are transferred via an associative interface to the Ansys static-structural simulation. There, the imported information is used in a static structural simulation in which the forces Fj,i are aligned with the x-components of the local coordinate systems Csysj,i and applied to the corresponding surface segments Sj,i. The rule-based definition of these entities provides a robust interface between the CSG simulation and the subsequent FEM analysis.
The generation of the IPW states and their transfer into FE models, including named selections, coordinate systems, and force definitions, is fully automated. Except for the initialization step, in which the clamping faces must be selected once on the nominal geometry, all operations are carried out automatically using the programming languages listed in Tab. 3.

Table 3.
Automation tools for structural response simulation.
| Function | Tool | Programming language |
| Orchestration | - | PowerShell |
| CSG automation | Inventor | iLogic (VB.NET) |
| Workbench orchestration | Ansys Workbench | IronPython |
| Static-structural automation | Ansys Mechanical | PyMAPDL |
| Nodal export | Ansys Mechanical | Ansys APDL |
This automation is required because a large number of sequentially dependent states must be processed. The simulation coupling is orchestrated by the simulation running variable j. At the end of each deformation simulation, the nodal coordinates Xnom and displacement vectors ûi are exported for the respective j state.
4.3. Surface Reconstruction
The machining of additively manufactured parts is typically carried out in multiple stages, including roughing and finishing. During the roughing process, most of the machining allowance is removed. This is where the highest cutting forces occur within the subtractive post-processing chain. As a result, large workpiece deflections and correspondingly large shape errors are generated before finishing. These deflections affect the local undeformed chip thickness during finishing and, consequently, the final shape quality. Feedback of the updated workpiece geometry from the roughing stage into the finishing stage is therefore essential. For this purpose, a method was developed that enables the cumulative evaluation of the resulting deviations of the CEE for each simulation step j and their transformation into a geometric representation. For each node n, defined by its nominal position Xnom (Eq. 12) and the displacement vector û (Eq. 13), the local deformation caused by machining-induced deflection can be determined. By inverting the displacement vector, the resulting surface point on the workpiece surface is obtained according to Eq. 14.
The transformed nodal points Xrec are reconstructed in the CAD system Inventor as a closed surface. For this purpose, the points assigned to each cutter exit edge CEE are interpolated by spline curves. These curves are subsequently used as section curves to generate a surface patch, which is sewn into a closed surface representation. The reconstructed surface is then extruded toward the target surface of the final nominal geometry and merged with the workpiece model by means of a Boolean operation, either additively or subtractively, depending on the local deflection direction. In this way, an updated solid model is generated. This updated geometry is then fed back into the hybrid process simulation (Figure 2, step 4.1) as a derived real geometry. By coupling the technological NC simulation, the mechanical structural response simulation, and the iterative geometry update, a continuous simulation chain is established for the prediction of force-induced shape deviations in multi-stage machining processes.
5. Results and Validation
The following section presents the results and experimental validation of the hybrid process simulation applied to additively manufactured Scalmalloy® specimens (Figure 1). In particular, force and shape-related results obtained from simulation and experiment are compared. In addition, the applicability of the proposed methods to non-linear toolpaths is assessed using the freeform specimen.
5.1. Force Prediction
As described in Section 3, the force model was parameterized using force data acquired from rigid workpieces. In the following, the force predictions obtained from the technological NC simulation based on the real geometries of the specimens are compared with the measured forces from the compliant physical specimens (cf. experimental setup in Section 3.3). For the dexel-based simulation, a dexel density of 40 dexels/mm was selected in an x-y-z dexel grid, together with a simulation cycle time of 0.005 s. This resolution is sufficiently fine to capture local geometric deviations, such as weld beads or surface irregularities on the AM specimen. The tool was represented by a cylindrical envelope body with the actual tool diameter of 9.98 mm, measured using a Zoller Venturion 450 tool presetting and measuring machine. This value represents the maximum effective cutting diameter and therefore includes the radial runout of the tool. The cylindrical envelope was discretised along the tool axis into disc elements with a thickness of dS = 0.1 mm.
Figure 9 shows the quasi-static force components obtained from simulation and measurement for the beam analogy specimen for roughing under the indicated process conditions. The measured data are based on three repeated experiments.
The repeated experiments are visualized as transparent lines (Figure 9). In the Ff and Fp directions, the measured force profiles of the repeated trials agree very well, with maximum deviations of approximately 5 N in both cases.
In contrast, substantially larger differences of up to 23 N are observed between the repeated trials in the FfN direction. During tool entry, Ff and Fp increase in a degressive manner and remain at an approximately constant force level until the beginning of tool exit at t = 0.96 s, with mean values of 172 N and 119 N, respectively. In the exit region, Fp decreases monotonically and degressively to 0 N. At the beginning of tool exit, Ff first exhibits a short local force increase of approximately 26 N. The FfN component shows a curved, concave profile between tool entry and tool exit, with a maximum force occurring in the central region of the beam. For the quantitative comparison, the simulated and measured force levels were evaluated at the defined measurement position x = 22 mm (Figure 9), corresponding to a process time of t = 0.56 s. At this position, the simulated force components exceed the measured values by +21.1% for Ff, +52.2% for FfN, and +28.8% for Fp. The simulated prediction of the quasi-static force components reproduces the characteristic force plateau between tool entry and tool exit. Only the local force increase in Ff at the beginning of tool exit, as well as the the concave profile observed FfN is not captured by the simulation.
Additional force measurements and predictions were carried out for the finishing process. To evaluate the effect of surface reconstruction, the force prediction was performed both on the basis of the reconstructed surface after the roughing process simulation and on the basis of an ideal, non-reconstructed geometry with a finishing allowance of 0.1 mm. Figure 10 shows the resulting force profiles exemplarily for FfN. The measured profile exhibits a convex shape with a force minimum of 57 N at the centre of the beam. From t = 0.88 s onward, the profile changes to a nonlinearly degressive decrease before the force drops steeply to 0 N at the start of tool exit. The simulation based on the ideal geometry underestimates the forces by 72.9% and predicts only an almost constant force level of approximately 16 N. In contrast, the simulation based on the reconstructed surface still overestimates the force by 25.4%, but clearly reproduces both the characteristic convex profile and the degressive force decrease starting at t = 1.35 s.
Using the freeform specimen as an example, it becomes evident that measurement and simulation yield qualitatively similar force profiles, while locally significant quantitative deviations remain (Figure 10). The largest differences occur in the time interval between 0.12 s and 0.24 s. In this section, the tool follows a concave path and reaches its maximum engagement at an immersion angle of 66.2°. Here, the simulation overestimates Fx by 32.4% and Fy by 34.8%, whereas Fz is overestimated by 22.7%. From t = 0.28 s, the engagement angle reaches 52.4°. During the subsequent section with a constant engagement angle, the predicted and measured Fx values are almost congruent. At the beginning of a convex toolpath segment from t = 0.53 s onward, the simulated Fx increases again and eventually exceeds the measured force. In the tool exit region, measurement and simulation again show good agreement in both profile and magnitude. Over the entire interval between tool entry and tool exit, Fy is overestimated by an average of 28%. Overall, the results indicate a systematic overestimation of Fy and Fz. Fx, however, does not show a systematic overestimation. At an engagement angle of 52.4°, the predicted and measured force values are nearly congruent, with a local standard deviation of approximately 4 N.
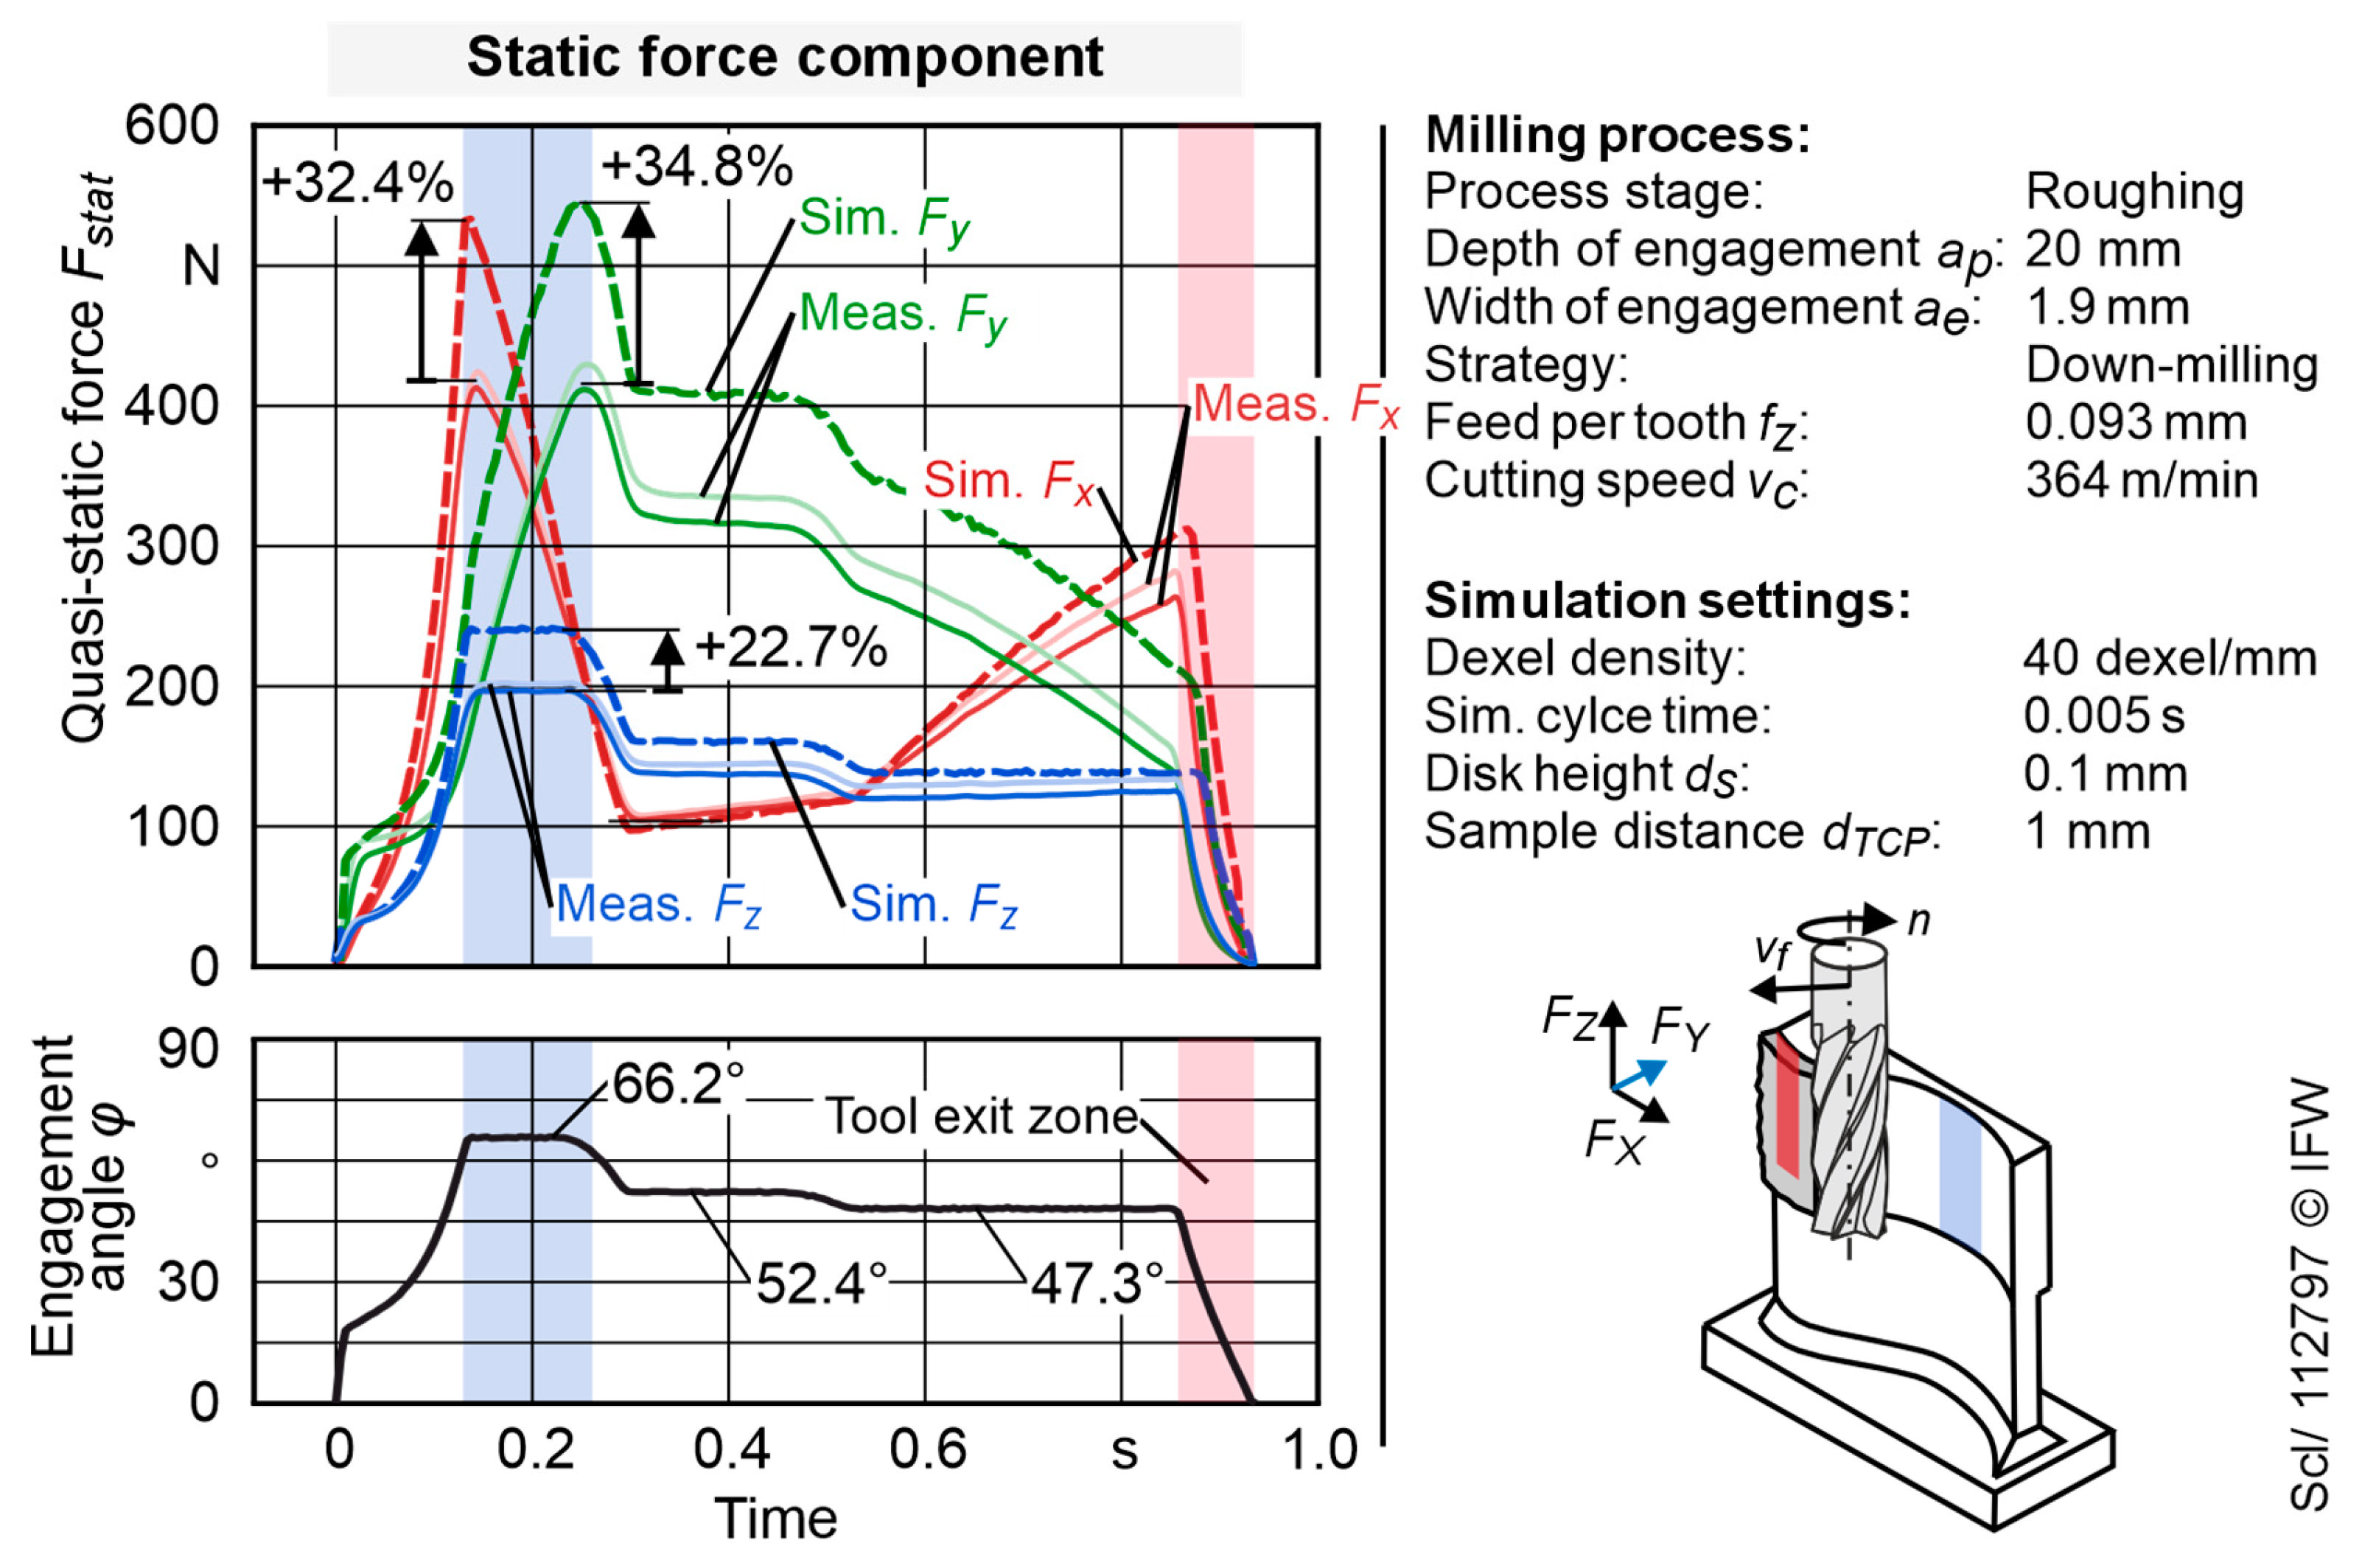
Figure 11.
Simulated and measured force components on the freeform specimen.
5.2. Shape Error Prediction
For shape error prediction, the developed structural response simulation was additionally applied. From the technological NC simulation, the TPS was exported using a sampling distance of dTCP = 2 mm and a limit angle of αTCP = 30°. The fixation surfaces were defined as fixed support and are shown in red in Figure 12. For the FE model, Scalmalloy® was assigned with a Young’s modulus of 71,015 MPa and a Poisson’s ratio of 0.34, both derived from uniaxial tensile tests conducted in accordance with DIN EN ISO 6892-1 on three specimens manufactured via laser powder bed fusion. In the static structural analysis, a tetrahedral mesh with an element size of 1 mm was generated. This mesh size was selected as a compromise between spatial resolution and computational effort, providing sufficient accuracy for resolving the deformation behaviour while keeping the simulation time feasible for the sequential analysis workflow. Based on the simulated displacements of the cutting exit edge CEE for each design point, the resulting surface was reconstructed according to Section 4.3. Figure 12 compares the measured and simulated shape error for the beam specimen. The simulation reproduces the global characteristics of the shape error field. In both cases, the shape error is elevated on the tool entry side (right), decreases along the feed direction toward the centre of the beam, and then increases again markedly toward the highlighted tool exit region.
At the same time, a similar gradient is visible in the axial direction, with higher shape errors in the upper regions than in the lower regions. The plotted iso-lines indicate that the fundamental shape error regimes are consistent between measurement and simulation. Quantitatively, however, local deviations remain. The maximum shape error occurs in the upper right region for both measurement and simulation, with 0.691 mm measured and 0.723 mm predicted, corresponding to an overestimation of 4.6%. The minimum values also agree well, with 0.032 mm measured and 0.035 mm predicted, corresponding to an absolute deviation of 0.003 mm. In addition, the measurement shows a slight local waviness of the iso-lines within the exit region (Figure 12). This feature is not reproduced by the simulation, where the profile appears approximately linear. The three repeated measurements indicate that this local waviness occurs reproducibly, although its exact manifestation varies. The comparison demonstrates agreement in the dominant spatial deviation pattern, while local waviness in the tool-exit region is not reproduced.
The simulated shape error prediction was also carried out for the finishing process using the reconstructed workpiece geometry. As in the roughing stage, the measured and simulated results show the same characteristic shape error progression in both feed direction and tool-axis direction. In both cases, the maximum deviations are located in the upper region of the surface. The maximum simulated shape error amounts to 0.09 mm, while the measured maximum is 0.086 mm. Thus, the absolute deviation between simulation and experiment for the finishing process is only 0.004 mm.
The comparison between the simulated and measured shape error of the freeform analogy specimen is shown in Figure 13. In this case, 272 experimentally acquired probing points are compared with a total of 860 nodal displacements exported from the simulation. The freeform specimen also shows a qualitative agreement in the shape error progression along the feed direction and in the axial direction, which is particularly evident from the iso-lines. In the region of the concave toolpath segment, where the immersion angle and thus the process forces reach their maximum, the highest shape errors occur in both simulation and experiment. To compare the simulation and measurement data, an evaluation window (comparison contour, Figure 13) corresponding to the tactile probing area was defined within the simulated point data and used for the subsequent analysis.
The total maximum simulated shape error is 0.323 mm and is located in the centre of the blue region, where the highest engagement angle occurs (Figure 13). Within the comparison contour, the maximum simulated shape error is 0.300 mm at an x-position of −5.29 mm, while the maximum measured shape error is 0.288 mm at an x-position of −8.55 mm. This corresponds to an absolute deviation of 0.012 mm and a relative overestimation of 4.2% with respect to the measured value. The maxima are located at the same height of z = 2.5 mm. The remaining feed-direction offset must be interpreted in relation to the different spatial discretisations of the tactile probing grid and the tool-path sampling list TPS. Therefore, the position of the maximum in feed direction can be regarded as largely consistent between simulation and experiment. Both shape-error plots show the characteristic tool-exit zone that was already observed for the beam specimen (Figure 12). Furthermore, the iso-lines of the measurement are slightly more elongated along the surface in x-direction. In the measurement, the low-deviation range between 0 and 0.05 mm is more dominant and extends over almost the entire length of the surface. In contrast, this range is less pronounced in the simulation and occurs mainly between x = −26 mm and x = −43 mm.
6. Discussion
This paper presents a hybrid process simulation for predicting milling-induced shape deviations in compliant PBF-LB/M components. The method couples technological NC simulation, structural response simulation, and geometry feedback across multiple machining stages. The discussion focuses on the reproduction of force and shape-error regimes and on the limitations caused by the applied modelling simplifications. The beam specimen is used to evaluate the method under clearly traceable linear toolpath conditions, while the freeform specimen assesses its applicability to non-linear toolpaths with varying immersion and changing structural compliance.
6.1. Model Assumptions
The results are interpreted under the premise that the dominant compliance originates from the workpiece rather than from the tool. This is justified by the considerably higher cutter stiffness and by the measured shape-error distribution, which does not indicate tool-deflection-dominated behaviour. The real AM geometry is used in the technological NC simulation to calculate local engagement conditions, whereas the structural response is computed on the nominal solid model. This simplification is acceptable for the investigated specimens, which exhibited only small as-built deviations of approximately 0.1 mm on average. Larger initial geometry deviations may also affect the global receptance and should therefore be investigated in future work. The second relevant assumption is the one-way coupling: process forces are calculated without iterative feedback of the in-process workpiece deflection into the engagement calculation, which can lead to force overestimation in compliant regions.
6.2. Force Prediction
Against this background, the force prediction results can be interpreted consistently. For the beam specimen, the quasi-static force components Ff, FfN, and Fp reproduce the characteristic force progression during tool entry, steady cutting, and tool exit. In terms of magnitude, however, the simulation overestimates the measured force levels. This is attributed to elastic workpiece deflection during machining, which reduces the effective cutter–workpiece engagement compared with the nominal engagement state used for force calculation. Similar mechanisms have been described for low-rigidity milling, where part deflection alters chip thickness, immersion angle, and cutter–workpiece engagement and therefore has to be considered in force and shape-error prediction [8,20,21,27]. This corresponds conceptually to flexible force modelling approaches in which immersion conditions are updated as a function of part deflection [35].
To substantiate this interpretation, an analytical back-calculation of the effective quasi-static force components Ff,eff, FfN,eff, and Fp,eff was performed based on the effective cross-sectional engagement area Aeff. The analysis was conducted at the axial position x = 22 mm, where the simulated and measured force levels were compared. The tactile surface measurement along the z-axis was supplemented by two linearly extrapolated boundary points at z = 0 mm and z = −20 mm in order to cover the full nominal depth of cut ap = 20 mm (Figure 14, left). The locally effective width of cut ae,eff(z) was derived from the local displacement u(z) of the measured surface profile relative to the nominal profile:
where ae,nom = 1.9 mm denotes the nominal width of cut required to generate the ideal surface profile. The effective engagement area Aeff was discretised along the z-axis into n = 200 slices with a thickness of dS = 0.1 mm. For each slice i, the local effective immersion angle φeff,i was calculated according to:
where D is the tool diameter. The corresponding maximum undeformed chip thickness hcu max was then evaluated using Eq. (5) and introduced into the force models (Figure 4). The effective total force was obtained by summing the slice-wise force contributions:
Figure 14 compares the nominal force Fnom calculated for the constant nominal width of cut ae,nom = 1.9 mm, which corresponds to the technological NC simulation output, the back-calculated effective force Feff derived from the measured surface profile, and the measured quasi-static force Fmeas at x = 22 mm. Aeff substantially reduces the deviation between prediction and measurement. Referenced to Fmeas, the deviation decreases from +20.8% to +7.9% for Ff, from +52.2% to +15.8% for FfN, and from +28.6% to −0.5% for Fp. This demonstrates that in-process workpiece deflection is the dominant source of the force overestimation observed in the one-way coupled simulation.
The remaining deviations differ between the force components and can be interpreted in relation to the directional compliance of the workpiece. FfN acts predominantly in the most compliant direction of the clamped beam specimen and is therefore more sensitive to small differences in clamping, referencing, and geometry. This is also reflected in the larger variation between repeated trials. In contrast, Fp acts perpendicular to the machined surface, where the workpiece compliance is the lowest. The near-zero deviation for Fp after the Aeff correction therefore indicates that the effective engagement correction is sufficient for this component in the investigated case.
The degressive force increase at tool entry and the degressive decrease at tool exit result from the radial entry and exit of the cylindrical cutter. The short local increase in Ff at the beginning of tool exit (Figure 9), which is not reproduced by the simulation, can plausibly be attributed to spring-back of the workpiece in feed-normal direction. This locally increases the effective engagement in feed direction and causes a short force peak in the stiffer feed direction. Similarly, the concave FfN profile during roughing is consistent with the local compliance distribution of the beam specimen. In the edge regions, bending and torsion are superimposed, which increases the local compliance and reduces the effective chip thickness. As a result, the measured FfN values are lower in the boundary regions than in the central region.
For the finishing process, the force prediction highlights the relevance of the reconstructed intermediate geometry (Figure 10). The finishing force cannot be predicted consistently on the basis of an idealised intermediate geometry, because the roughing-induced shape error defines the locally remaining finishing allowance. Regions with larger roughing-induced deviations lead to locally increased chip thickness during finishing. This explains why the reconstructed workpiece geometry is required to reproduce the characteristic finishing force profile.
For the freeform specimen, the largest force deviations occur in the concave toolpath segment between t = 0.12 s and t = 0.24 s, where the immersion angle φ reaches its maximum value of 66.2°. In this region, all three force components are overestimated. This is attributed to workpiece deflection during machining, which reduces the effective engagement relative to the nominal simulation state. The effect is most pronounced where high immersion and increased local compliance coincide. In the subsequent section at an immersion angle of 52.4°, the simulated and measured Fx values are nearly congruent, with a local standard deviation of approximately 4 N. This indicates that the resultant force vector Fres is oriented close to a direction of high structural stiffness of the workpiece in this toolpath segment. As a result, the deflection-induced change in effective engagement is reduced, and the predicted Fx component remains close to the measured value. In contrast, Fy and Fz remain systematically overestimated, with Fy exceeding the measured values by an average of 28% between tool entry and tool exit. In the convex segment from t = 0.53 s onward, the increasing deviation of Fx demonstrates that the prediction error depends on the local combination of toolpath curvature, force direction, and structural compliance.
Overall, the main limitation of the current force prediction is the non-updated engagement state in the one-way coupled simulation. The back-calculation based on Aeff hows that accounting for the actual effective engagement geometry substantially reduces the force prediction error. In a predictive simulation framework, this correction would have to be computed directly by coupling the local workpiece deflection with the engagement calculation. For each discretised disc element, the local deflection would modify ae,eff, the immersion angle φeff, and consequently the predicted force Fres. This corresponds conceptually to flexible force and deformation prediction approaches for low-rigidity milling, where the local cutter–workpiece engagement and immersion conditions are updated as a function of workpiece deflection and solved iteratively until convergence [21,35].
6.3. Shape Error Prediction
The shape-error results are evaluated by combining the spatial deviation pattern (iso-lines) with the quantitative extrema. The spatial pattern indicates whether the same deviation regions are identified, while the extrema assess the predicted error magnitude. For both investigated specimens, the simulation reproduces the dominant high-error regions: for the beam specimen, increased deviations occur in the upper surface regions (Figure 12), whereas for the freeform specimen the critical region is located in the concave toolpath segment with the highest local immersion angle (Figure 13). Thus, the simulation captures the dominant interaction between local engagement, structural compliance, and force-induced deformation. Remaining deviations mainly concern the exact position of the maximum, local iso-line waviness, and the spatial extent of individual deviation regimes.
For the beam specimen during roughing (Figure 12), the measured and simulated iso-lines show the same dominant contour topology. Lower deviations occur in the lower and central regions of the machined surface, while higher deviations are concentrated in the upper left and upper right regions. This distribution is mechanically consistent with the clamped beam structure, since bending and torsion are superimposed in the upper boundary regions and locally increase the displacement under the applied process forces. The simulated maximum shape error for roughing is overestimated by 4.6%.
For the finishing process, the result primarily evaluates the surface reconstruction step. With the reconstructed intermediate geometry, the measured and simulated shape-error fields show the same characteristic progression in feed direction and along the tool axis. The measured maximum shape error is 0.086 mm, while the simulation predicts 0.090 mm. The relative deviation of 4.7% indicates that the roughing-induced intermediate geometry is transferred into the finishing simulation with sufficient accuracy for the investigated beam specimen. Surface reconstruction is therefore not a secondary refinement step, but a necessary prerequisite for a reliable multi-stage process simulation.
A further reduction of the remaining deviations would require a two-way coupling of deformation and engagement, as discussed in Section 6.2. In addition, the measured roughing result indicates a locally wavy iso-line pattern in the tool-exit region, while the simulated field is smoother. This is attributed to the segment-wise quasi-static force transfer, which smooths local axial force variations. Wimmer et al. [22] showed that local axial surface errors can become more pronounced when the contact ratio decreases. The missing local waviness therefore indicates that the current force application is sufficient to capture the global deformation field, but not to resolve local axial surface structures. However, these local deviations introduce an additional error of less than 0.01 mm and are therefore secondary compared with the global shape-error magnitude.
For the freeform specimen, the interpretation is restricted to the common comparison contour covered by the tactile probing data. Within this contour, measurement and simulation identify the same critical high-error region in the concave toolpath segment. The simulation slightly overestimates the maximum shape error by 0.012 mm, corresponding to 4.2%. More importantly, the critical region is predicted at the same axial height as in the measurement. The remaining offset in feed direction is considered acceptable, since the tactile probing grid and the simulation step width dTCP use different spatial discretisations. Despite the agreement in the dominant high-error region, the spatial extent of the individual deviation regimes differs between measurement and simulation. In particular, the low-deviation range is more pronounced in the measurement and extends over a larger part of the surface. This is consistent with the systematic overestimation of the process forces in the simulation, which leads to higher predicted deflections and therefore reduces the spatial extent of the low-error regime. Conversely, the simulation predicts a more confined low-error region and a shorter extension of the intermediate deviation ranges in feed direction. The remaining deviations for the freeform specimen are caused by the superposition of varying local immersion, changing structural compliance, spring-back, and torsional deformation along the non-linear toolpath.
7. Conclusions and Outlook
This study presents a hybrid process simulation for predicting force-induced shape errors in compliant additively manufactured (AM) components. The method combines real-geometry-based technological NC simulation, sequential structural response simulation, and surface reconstruction between roughing and finishing. This enables the consideration of both as-built geometry deviations and machining-induced intermediate geometry states within a multistage operation.
The force prediction results show that the characteristic force profiles are reproduced, while the force magnitudes are overestimated in regions of high structural compliance. The analytical back-calculation based on the effective cross-sectional engagement area Aeff demonstrates that the deviation between prediction and measurement is substantially reduced when the deflection-induced reduction of engagement is considered. For the beam specimen, the force deviation decrease from +20.8% to +7.9% for Ff, from +52.2% to +15.8% for FfN, and from +28.6% to −0.5% for Fp. This confirms that the non-updated engagement state in the one-way coupled simulation is a main source of the force overestimation.
The shape-error results show that the simulation identifies the dominant deviation regions for both investigated specimens. During roughing, the simulated maximum shape errors are overestimated by 4.6 % for the specimen with linear tool-path and 4.2 % for the specimen with non-linear toolpath, within the common comparison contour. For finishing, the reconstructed intermediate geometry is essential, since it defines the locally remaining finishing allowance. With surface reconstruction, the maximum shape error after finishing is predicted as 0.090 mm compared with a measured value of 0.086 mm. Without this geometry feedback, the finishing force is strongly underestimated because the roughing-induced stock distribution is not represented.
Overall, the results demonstrate that the proposed simulation chain can predict the relevant shape-error regions and the resulting error magnitudes for compliant AM components in roughing and finishing. The integration of real geometry and reconstructed intermediate geometry is particularly important for multistage operation, because the local stock distribution after roughing directly determines the engagement conditions during finishing.
Future work should integrate force feedback into the simulation chain to improve force prediction for low-rigidity workpieces. In such an approach, the local deflection of each discretised disc element would update the effective width of cut and the immersion angle, which in turn changes the predicted force. The resulting force–deflection relation would then be solved iteratively. This follows the concept of deformation-dependent cutter–workpiece engagement used in flexible force and deformation prediction models [21,35]. In addition, the method should be validated on components with larger initial geometry deviations and higher structural compliance. Although the influence of the as-built geometry and the roughing-induced intermediate geometry was demonstrated in this study, it has not yet been analysed systematically over a wider range of geometry deviations. Such investigations are required to define the applicable range of the proposed simulation chain for compliant AM components in multistage operation.
Author Contributions
Conceptualization, F.S. and K.M.H.; methodology, F.S. and J.N.; software, F.S. and J.N.; validation, K.M.H.; formal analysis, F.S.; investigation, F.S.; resources, B.D. and R.L.; data curation, F.S.; writing—original draft preparation, F.S.; writing—review and editing, K.M.H., B.D., R.L. and J.N.; visualization, F.S.; supervision, K.M.H.; project administration, F.S. and J.N.; funding acquisition, B.D., R.L. and K.M.H. All authors have read and agreed to the published version of the manuscript.
Funding
This research was funded by the Deutsche Forschungsgemeinschaft (DFG, German Research Foundation) within the project “Methodology for Optimizing the Interactions between Additive and Machining Manufacturing” (project number 513747002). The research building SCALE - Scalable Production Systems of the Future and the testing equipment "Additive Großfertigungsanlage" were funded by the Federal Ministry of Education and Research (BMBF) and zukunft.niedersachsen, a funding program of the Ministry for Science and Culture of Lower Saxony (MWK) and the Volkswagen Foundation.
Data Availability Statement
Data is contained within the article.
Acknowledgments
During the preparation of this manuscript, the authors used ChatGPT (OpenAI, GPT-5, 2025) to improve the clarity and language of the text. The authors have reviewed and edited the output and take full responsibility for the content of this publication.
Conflicts of Interest
The authors declare no conflicts of interest.
Abbreviations
The following abbreviations are used in this manuscript:
| AM | Additive manufacturing |
| PBF-LB/M | Powder bed fusion by laser beam / metallic |
| GD&T | Geometric dimensioning and tolerancing |
| FEM | Finite element method |
| NC | Numerical Control |
| CAM | Computer-aided manufacturing |
| CSG | Constructive solid geometry |
| IPW | In-process workpiece |
| WCS | Workpiece coordinate system |
| PCS | Process coordinate system |
| TPS | Toolpath sampling list |
| TCP | Tool centre point |
| CEZ | Cutter engagement zone |
| j | Simulation running index |
| i | Tool segment running index |
| APDL | ANSYS Parametric Design Language |
| NSCF | Named selection of cutter engagement surface segments |
| NSCEE | Named selection of the cutter exit edge |
| NSFix | Named selection of the fixation surfaces |
| Ff | Feed force |
| FfN | Feed-normal force |
| Fp | Passive force |
| Fx | Force component in x-direction |
| Fy | Force component in y-direction |
| Fz | Force component in z-direction |
| Fstat | Quasi-static force component |
| Feff | Effective predicted process force |
| Fnom | Nominal predicted process force |
| Fmeas | Measured predicted process force |
| Fj,i | Local force acting on disc segment i at simulation running index j |
| q90 | Empirical 90% residual band |
| ap | Depth of cut |
| ae | Width of cut |
| ae,eff | Effective width of cut |
| ae,nom | Nominal width of cut |
| fz | Feed per tooth |
| vc | Cutting speed |
| vf | Feed velocity |
| hcu max | Maximum undeformed chip thickness |
| φ | Immersion angle |
| Tool axis vector | |
| dS | Disc height / disc discretisation increment |
| dTCP | Sampling distance between selected TCPs |
| αTCP | Limit angle for TPS filtering |
| fn | Spindle rotation frequency |
| ffilter | Cutoff frequency of the low-pass filter |
| n | Spindle speed |
| Xn | Nominal node position |
| Displacement vector | |
| Csysj,i | Local coordinate system of disc segment j at design point i |
| Normalized feed vector | |
| Tool axis vector | |
| Feed-normal vector | |
| Aeff | Effective cross-sectional engagement area |
| Anom | Nominal cross-sectional engagement area |
| TE | Test dataset |
| TR | Training dataset |
| R2 | Coefficient of determination |
| MAE | Mean absolute error |
References
- Lachmayer, R.; Lippert, R.B.; Fahlbusch, T., Eds. 3D-Druck beleuchtet: Additive Manufacturing auf dem Weg in die Anwendung; Springer Vieweg: Berlin/Heidelberg, Germany, 2016. [CrossRef]
- Lachmayer, R.; Lippert, R.B.; Kaierle, S., Eds. Additive Serienfertigung: Erfolgsfaktoren und Handlungsfelder für die Anwendung; Springer Vieweg: Berlin/Heidelberg, Germany, 2018. [CrossRef]
- Barz, A.; Buer, T.; Haasis, H.-D. A study on the effects of additive manufacturing on the structure of supply networks. IFAC-PapersOnLine 2016, 49, 72–77. [CrossRef]
- Kempen, K.; Thijs, L.; van Humbeeck, J.; Kruth, J.-P. Mechanical properties of AlSi10Mg produced by selective laser melting. Phys. Procedia 2012, 39, 439–446. [CrossRef]
- Lieneke, T.; Adam, G.A.O.; Leuders, S.; Knoop, F.; Josupeit, S.; Delfs, P.; Funke, N.; Zimmer, D. Systematical determination of tolerances for additive manufacturing by measuring linear dimensions. In Proceedings of the 26th Annual International Solid Freeform Fabrication Symposium, Austin, TX, USA, 10–12 August 2015; pp. 371–384.
- Grzesik, W. Hybrid additive and subtractive manufacturing processes and systems: A review. J. Mach. Eng. 2018, 18, 5–24. [CrossRef]
- Denkena, B.; Friebe, S.; Lachmayer, R.; Niedermeyer, J.; Schlenker, F. Analysis of shape deviation in milling processes for non-rigid 316L aircraft brackets. Procedia CIRP 2026, 138, 486–491.
- Kline, W.A.; DeVor, R.E.; Shareef, I.A. The prediction of surface accuracy in end milling. J. Eng. Ind. 1982, 104, 272–278. [CrossRef]
- Niedermeyer, J.; Schlenker, F.; Huuk, J.; Ehlers, T.; Denkena, B.; Lachmayer, R. Design guidelines for additively manufactured stiffening structures to reduce vibrations in milling. Procedia CIRP 2026, 138, 674–679.
- Tönshoff, H.K.; Denkena, B. Basics of Cutting and Abrasive Processes; Springer: Berlin/Heidelberg, Germany, 2013.
- Agarwal, A.; Desai, K.A. Predictive framework for cutting force-induced cylindricity error estimation in end milling of thin-walled components. Precis. Eng. 2020, 66, 209–219. [CrossRef]
- Uhlich, F. Lernende Prozesssimulation für die Prognose und Kompensation von Formabweichungen in der Einzelteilfertigung. Ph.D. Thesis, Gottfried Wilhelm Leibniz Universität Hannover, Hannover, Germany, 2022.
- Denkena, B.; Wichmann, M.; Wulf, M. Architecture for autonomous shape error compensation in tool grinding. CIRP J. Manuf. Sci. Technol. 2025, 58, 80–86. [CrossRef]
- Dittrich, M.-A.; Uhlich, F. Self-optimizing compensation of surface deviations in 5-axis ball-end milling based on an enhanced description of cutting conditions. CIRP J. Manuf. Sci. Technol. 2020, 31, 224–232. [CrossRef]
- Huuk, J.; Denkena, B.; Dhingra, A.; Ntoutsi, E. Shape error prediction in 5-axis machining using graph neural networks. Procedia CIRP 2026, 138, 474–479. [CrossRef]
- Kersting, P.; Biermann, D. Modeling techniques for simulating workpiece deflections in NC milling. CIRP J. Manuf. Sci. Technol. 2014, 7, 48–54. [CrossRef]
- Movahhedy, M.R.; Gadala, M.S.; Altintas, Y. Simulation of chip formation in orthogonal metal cutting process: An ALE finite element approach. Mach. Sci. Technol. 2000, 4, 15–42. [CrossRef]
- Bolar, G.; Joshi, S.N. Three-dimensional numerical modeling, simulation and experimental validation of milling of a thin-wall component. Proc. Inst. Mech. Eng. Part B J. Eng. Manuf. 2017, 231, 792–804.
- Budak, E. Analytical models for high-performance milling. Part I: Cutting forces, structural deformations and tolerance integrity. Int. J. Mach. Tools Manuf. 2006, 46, 1478–1488. [CrossRef]
- Ratchev, S.; Govender, E.; Nikov, S.; Phuah, K.; Tsiklos, G. Force and deflection modelling in milling of low-rigidity complex parts. J. Mater. Process. Technol. 2003, 143–144, 796–801. [CrossRef]
- Lin, M.; Wang, C.; Yue, T.; Guo, G.; Guan, W.; Shen, B. Deformation prediction in flank milling of thin-walled parts based on cutter–workpiece engagement. J. Manuf. Process. 2024, 115, 375–386. [CrossRef]
- Wan, M.; Zhang, W.; Qiu, K.; Gao, T.; Yang, Y. Numerical prediction of static form errors in peripheral milling of thin-walled workpieces with irregular meshes. J. Manuf. Sci. Eng. 2005, 127, 13–22. [CrossRef]
- Wimmer, S.; Hunyadi, P.; Zaeh, M.F. A numerical approach for the prediction of static surface errors in the peripheral milling of thin-walled structures. Prod. Eng. 2019, 13, 479–488. [CrossRef]
- Brecher, C.; Zhao, G.; Fey, M. An efficient method to simulate the varying static receptance of a thin-walled workpiece. MM Sci. J. 2023, 2023, 7148–7155. [CrossRef]
- Denkena, B.; Schmidt, C. Experimental investigation and simulation of machining thin-walled workpieces. Prod. Eng. 2007, 1, 343–350. [CrossRef]
- Denkena, B.; Schmidt, A.; Henjes, J.; Niederwestberg, D.; Niebuhr, C. Modeling a thermomechanical NC-simulation. Procedia CIRP 2013, 8, 69–74. [CrossRef]
- Wang, Z.; Li, B.; Zhang, H.; Ye, P. Voxel-based rapid modeling of milling material removal for machining deformation prediction using finite cell method. CIRP J. Manuf. Sci. Technol. 2026, 65, 295–309. [CrossRef]
- Ratchev, S.; Liu, S.; Huang, W.; Becker, A.A. Milling error prediction and compensation in machining of low-rigidity parts. Int. J. Mach. Tools Manuf. 2004, 44, 1629–1641. [CrossRef]
- Tsai, J.-S.; Liao, C.-L. Finite-element modeling of static surface errors in the peripheral milling of thin-walled workpieces. J. Mater. Process. Technol. 1999, 94, 235–246. [CrossRef]
- Lachmayer, R.; Ehlers, T.; Lippert, R.B., Eds. Design for Additive Manufacturing; Springer Vieweg: Berlin/Heidelberg, Germany, 2024.
- Niedermeyer, J.; Witte, T.; Schlenker, F.; Wahl, J.P.; Maalaoui, M.; Oel, M.; Meyer, I.; Denkena, B.; Lachmayer, R. Process parameter development and optimization for the Scalmalloy® alloy in the additive manufacturing of aircraft applications. In Proceedings of the Lasers in Manufacturing Conference 2025, Munich, Germany, 2026. [CrossRef]
- Böß, V.; Rust, F.; Dittrich, M.-A.; Denkena, B. Compensation of part distortion in process design for re-contouring processes. Procedia CIRP 2019, 81, 820–825.
- Kienzle, O. Die Bestimmung von Kräften und Leistungen an spanenden Werkzeugen und Werkzeugmaschinen. VDI-Z. 1952, 94, 299–305.
- Bloomenthal, J. Polygonization of implicit surfaces. Comput. Aided Geom. Des. 1988, 5, 341–355.
- Ratchev, S.; Liu, S.; Huang, W.; Becker, A.A. A flexible force model for end milling of low-rigidity parts. J. Mater. Process. Technol. 2004, 153–154, 134–138. [CrossRef]
- Agarwal, A.; Desai, K.A. Importance of bottom and flank edges in force models for flat-end milling operation. Int. J. Adv. Manuf. Technol. 2020, 107, 1437–1449. [CrossRef]
Figure 1.
Industrial reference parts and specimens.
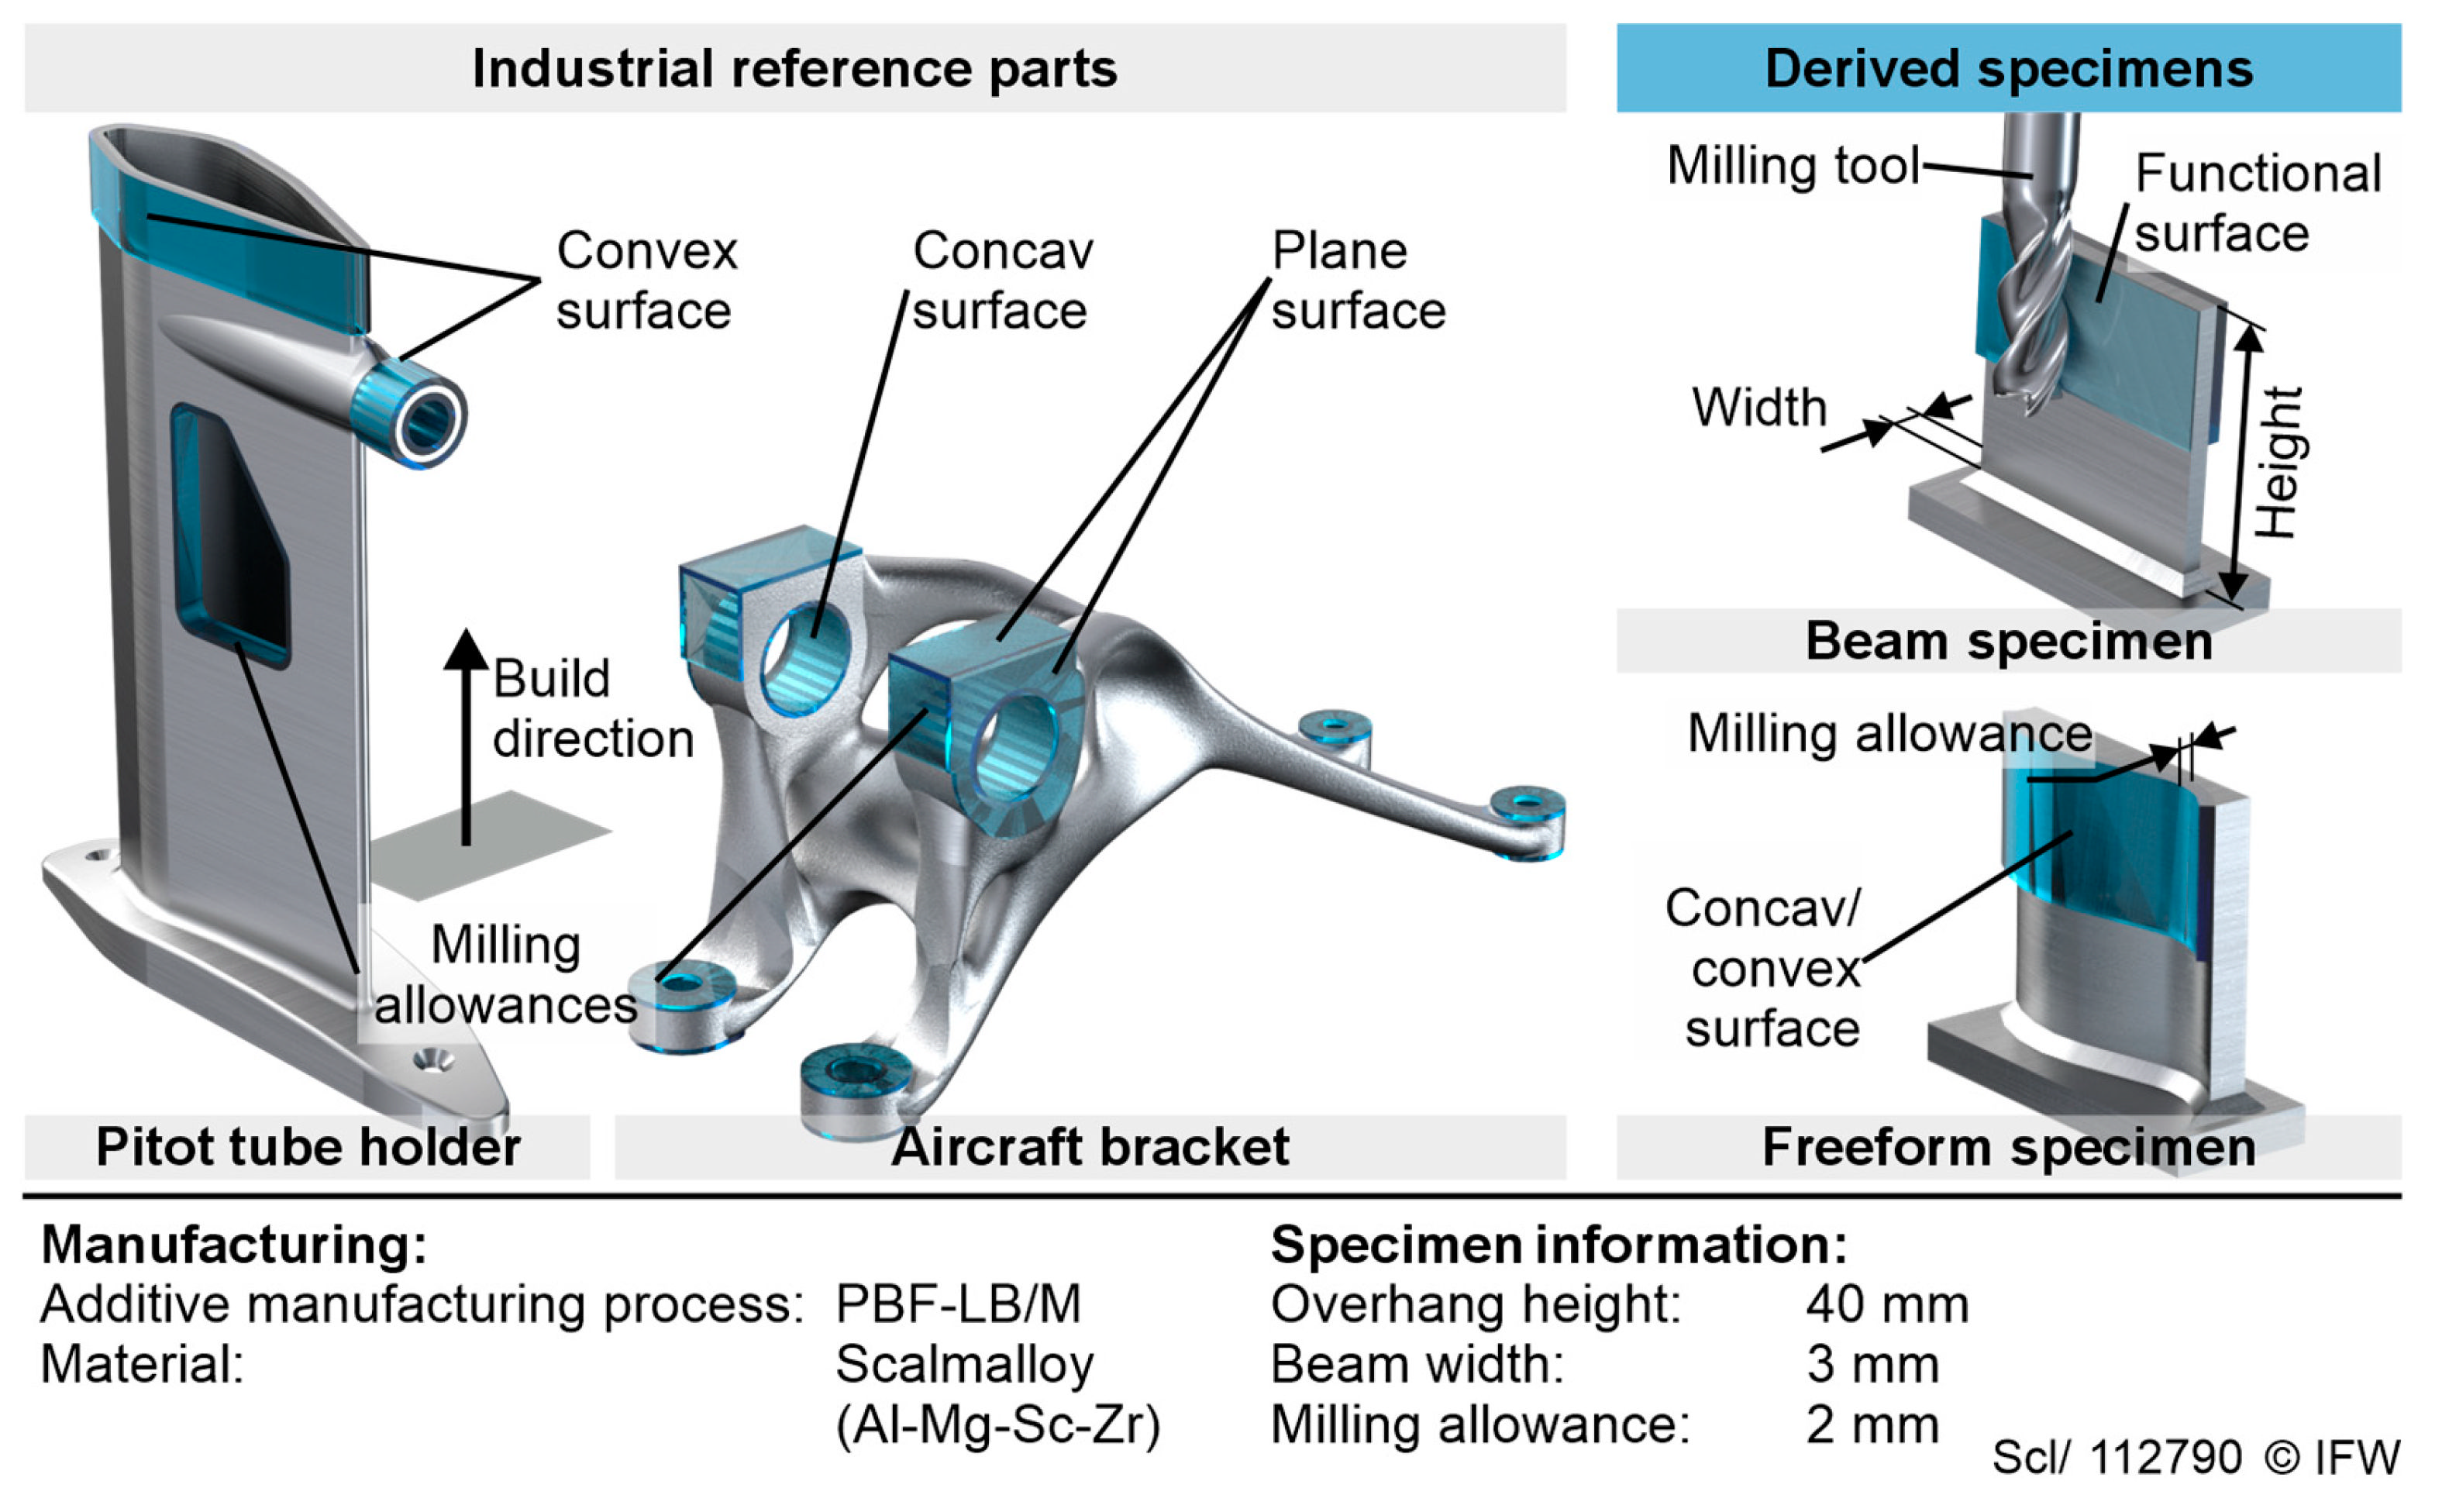
Figure 2.
Additive-subtractive process chain with integrated hybrid process simulation. .
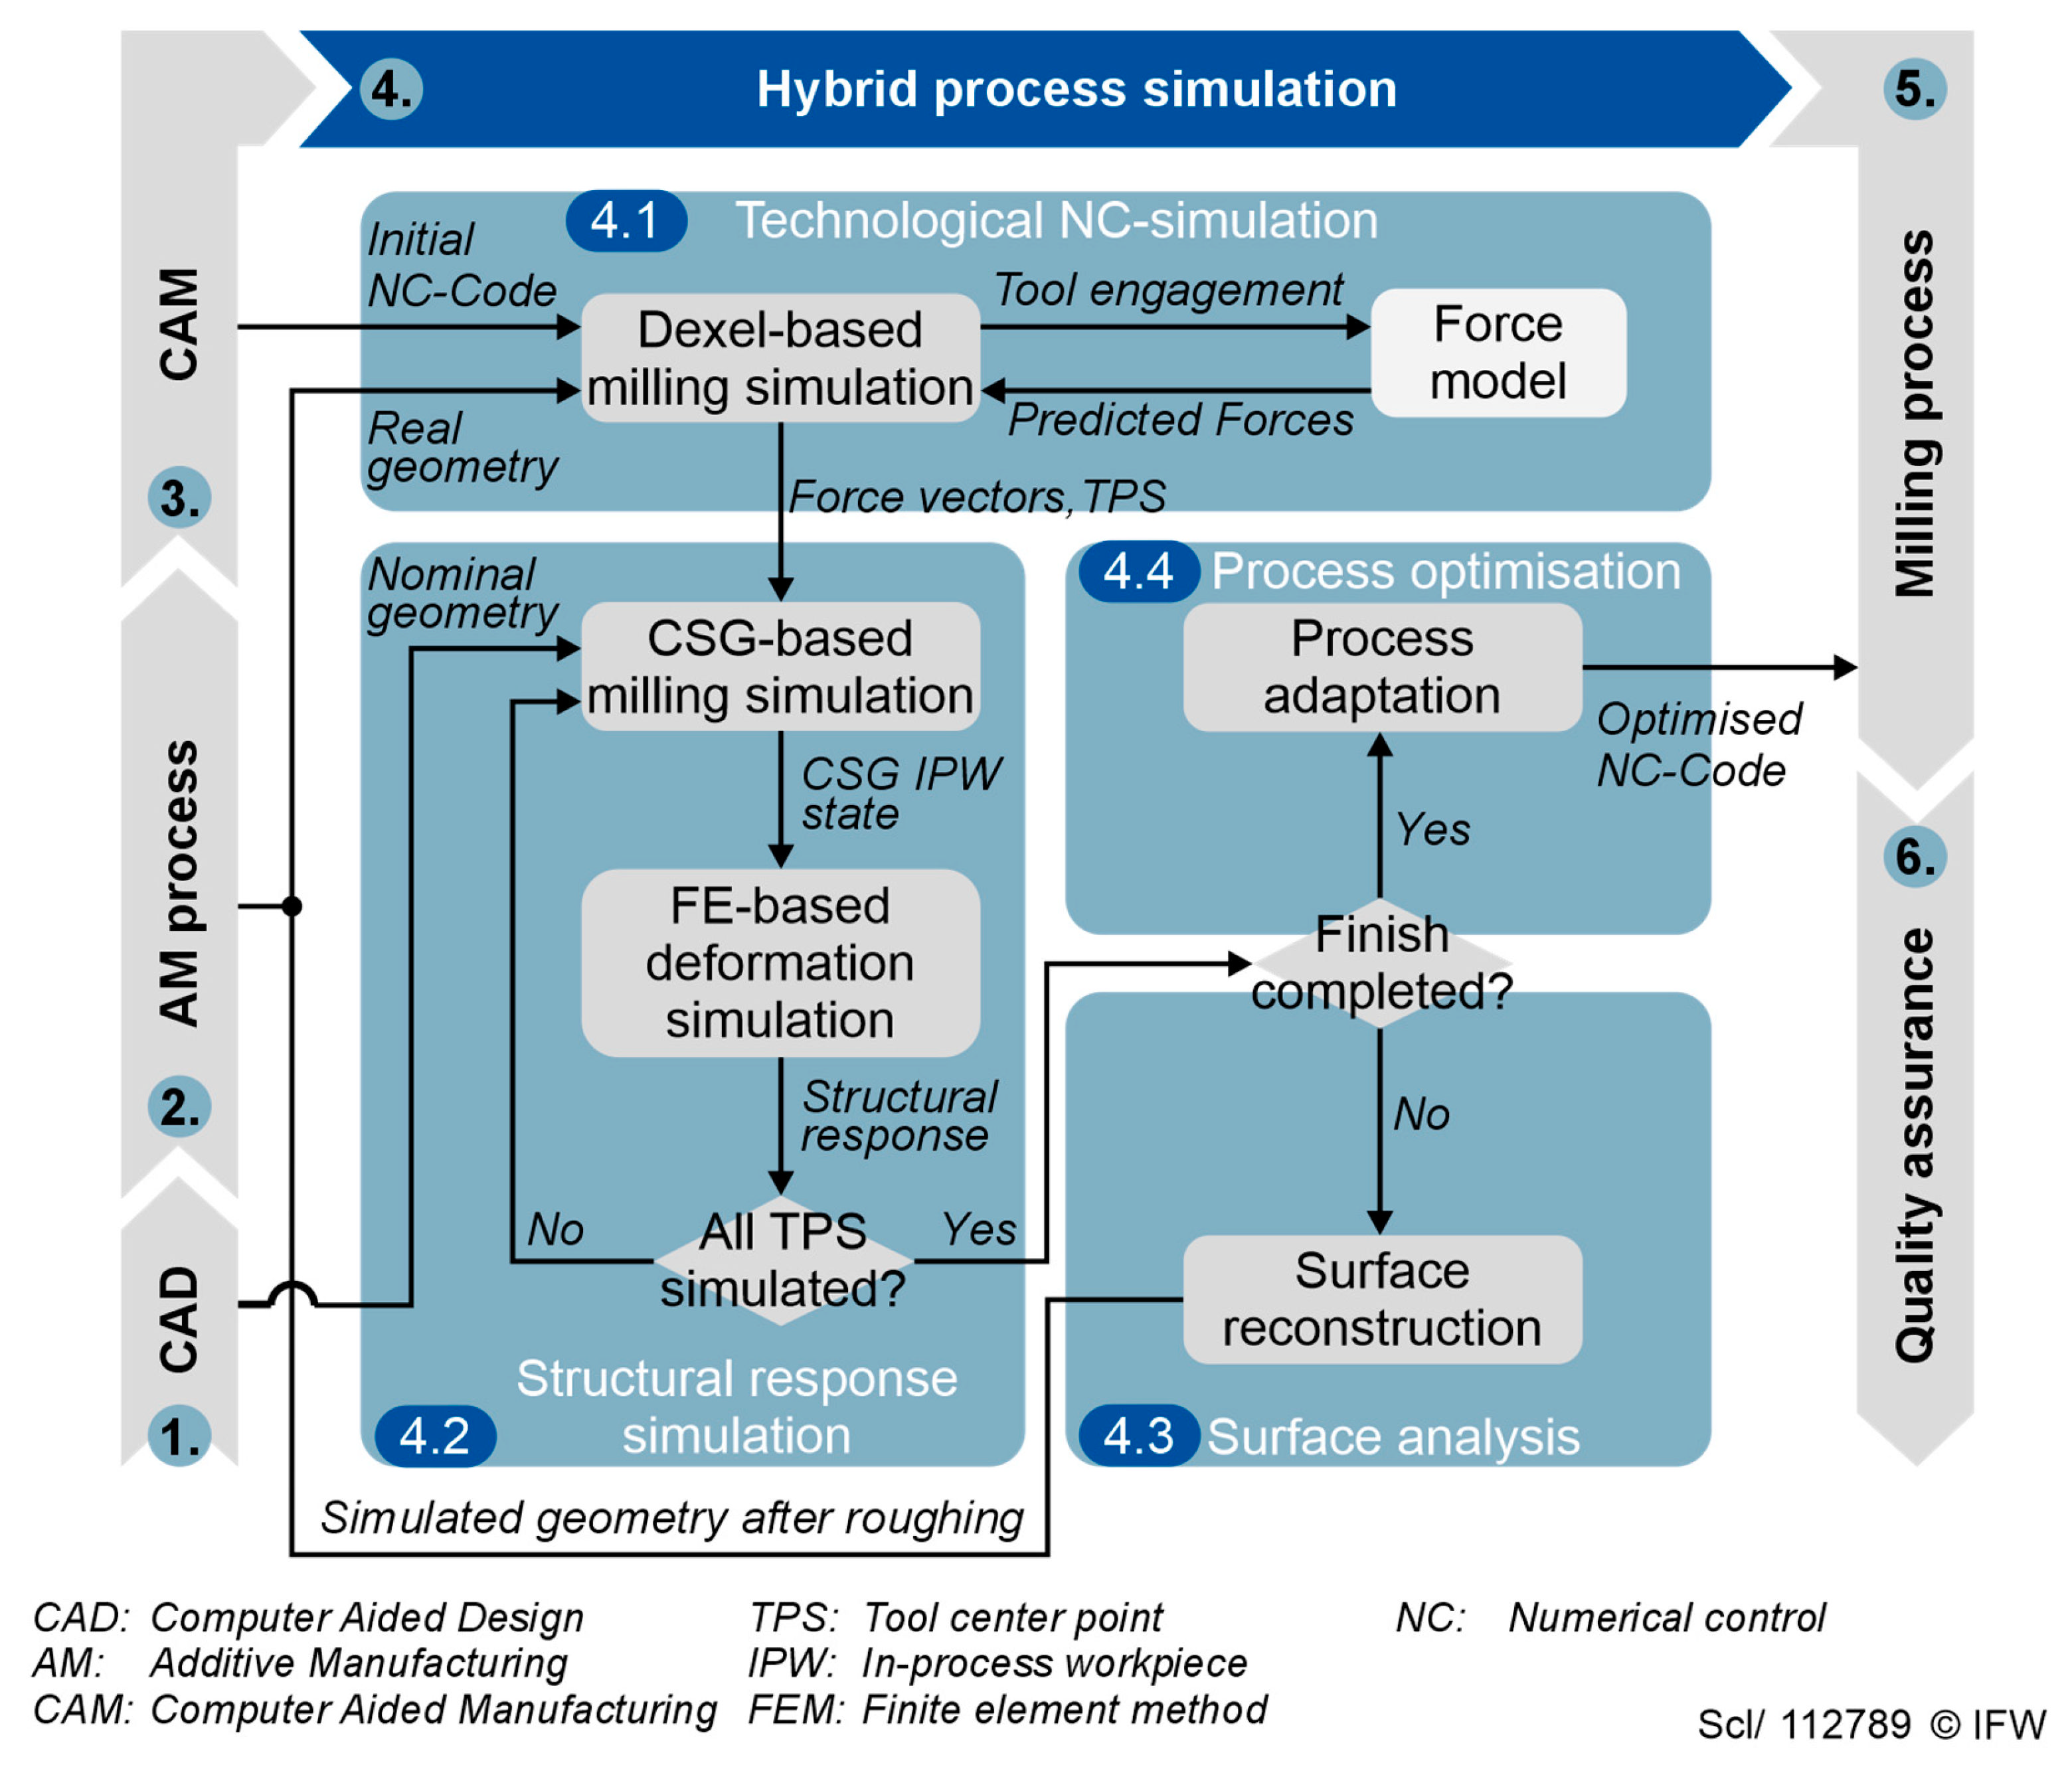
Figure 3.
Experimental setup for milling force parameterisation on rigid AM-Scalmalloy specimen.
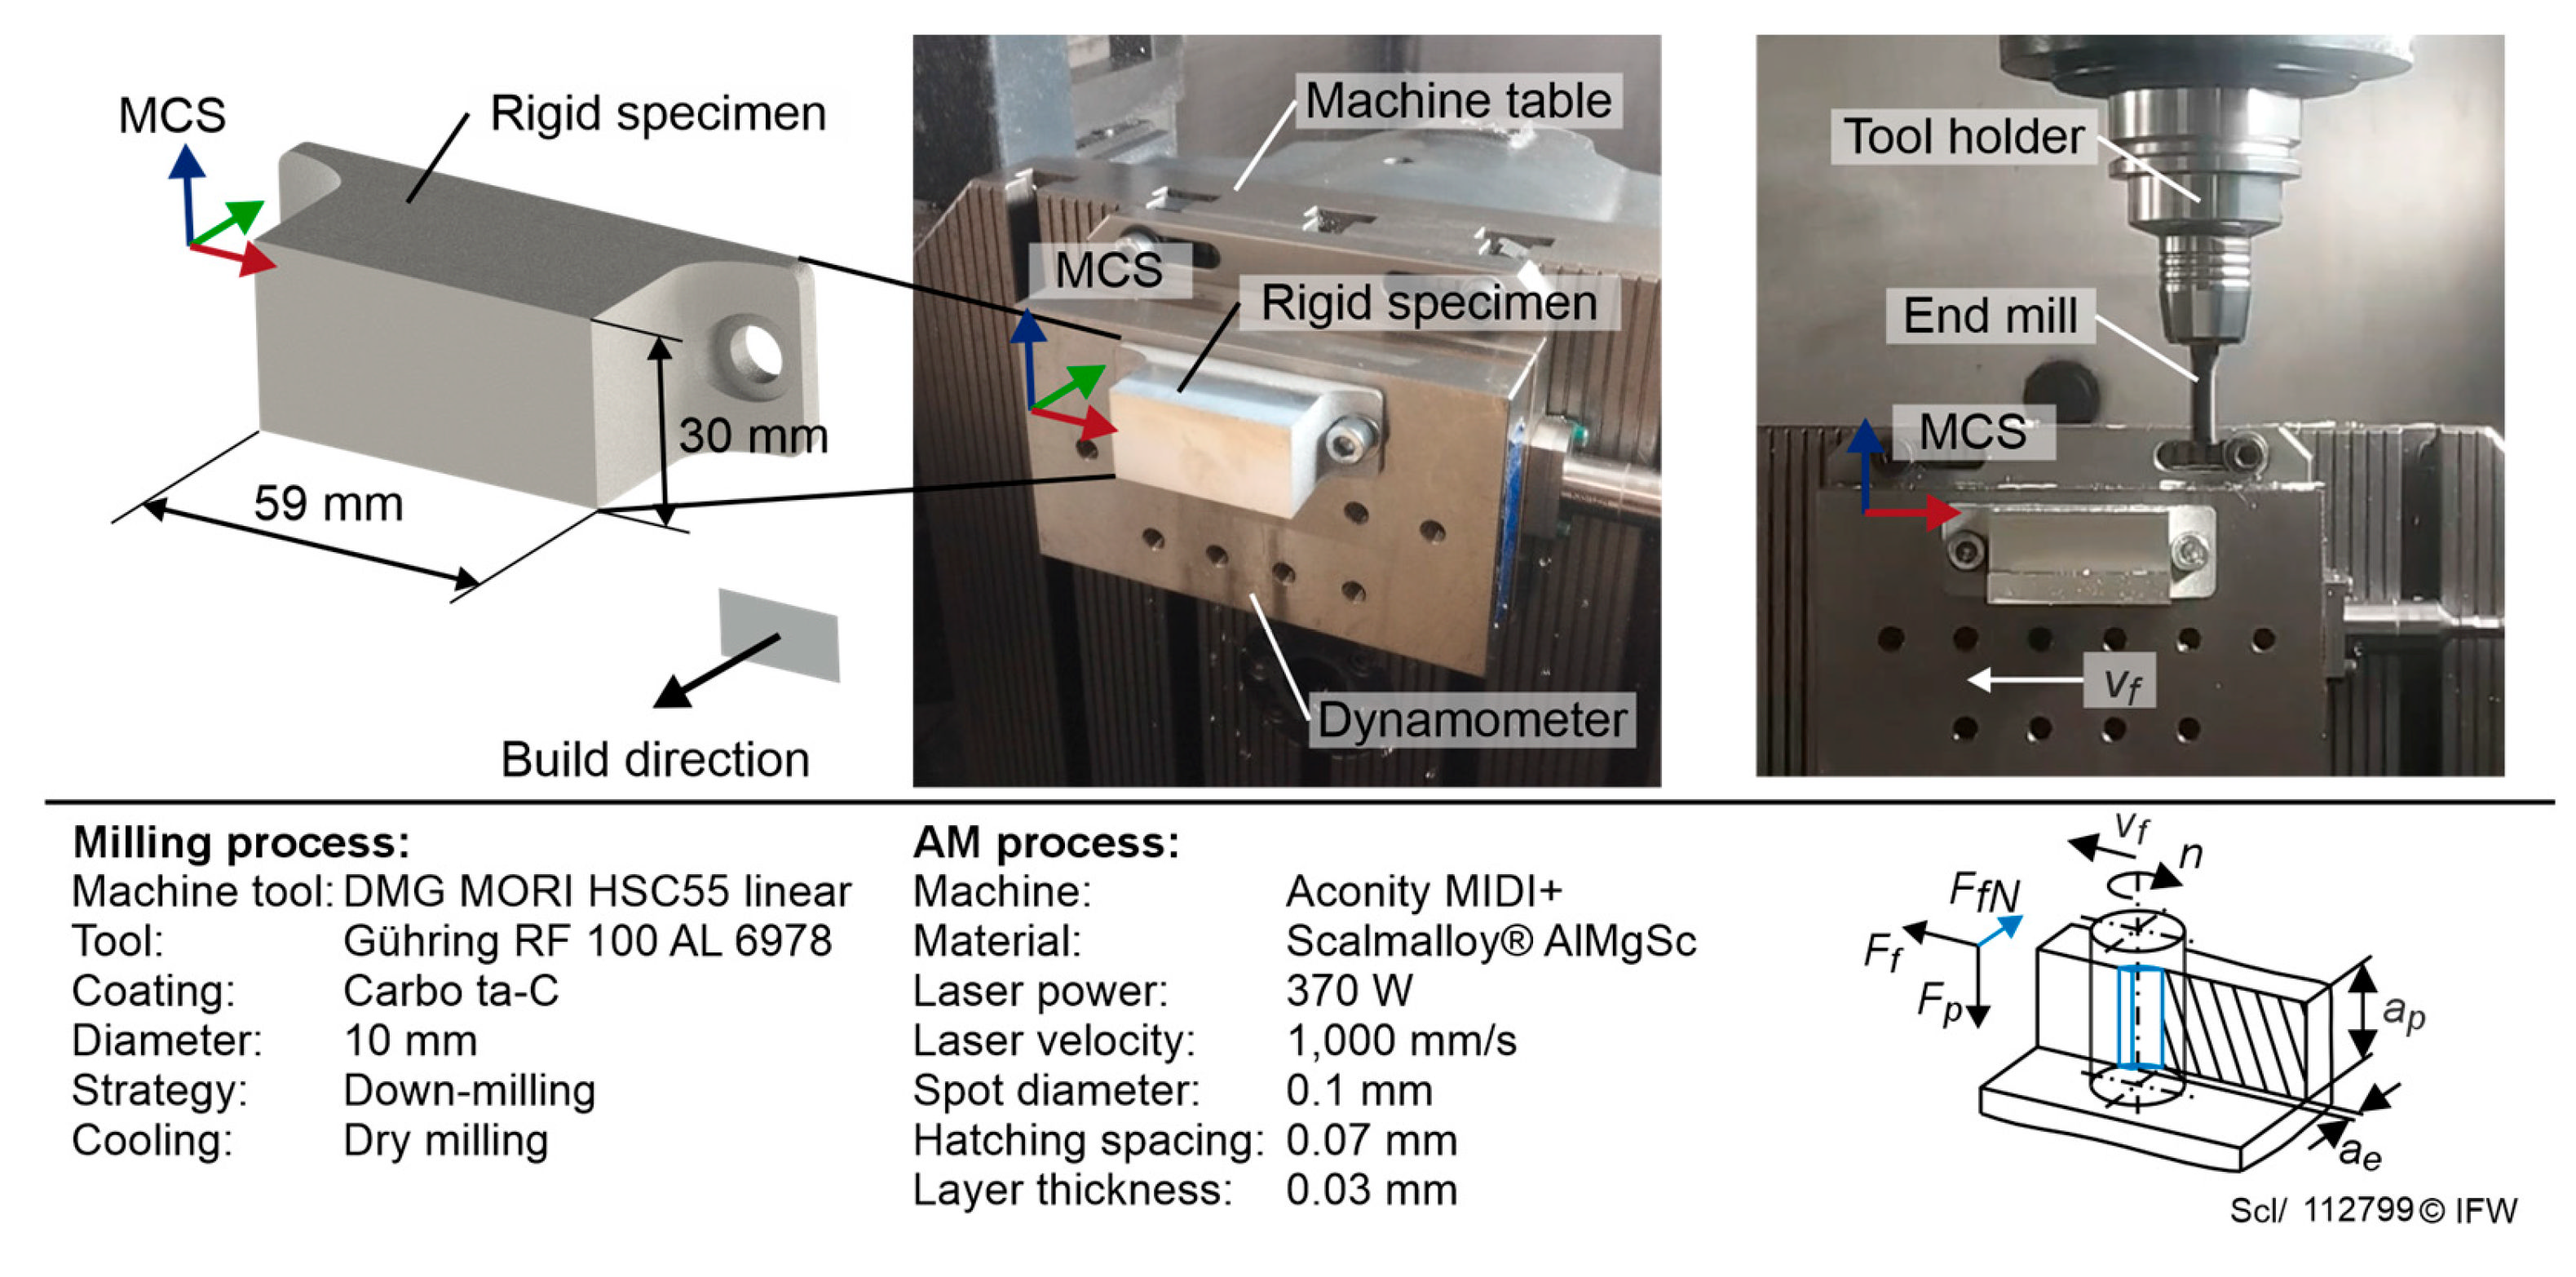
Figure 4.
Prediction accuracy of the calibrated force model for the quasi-static force components.
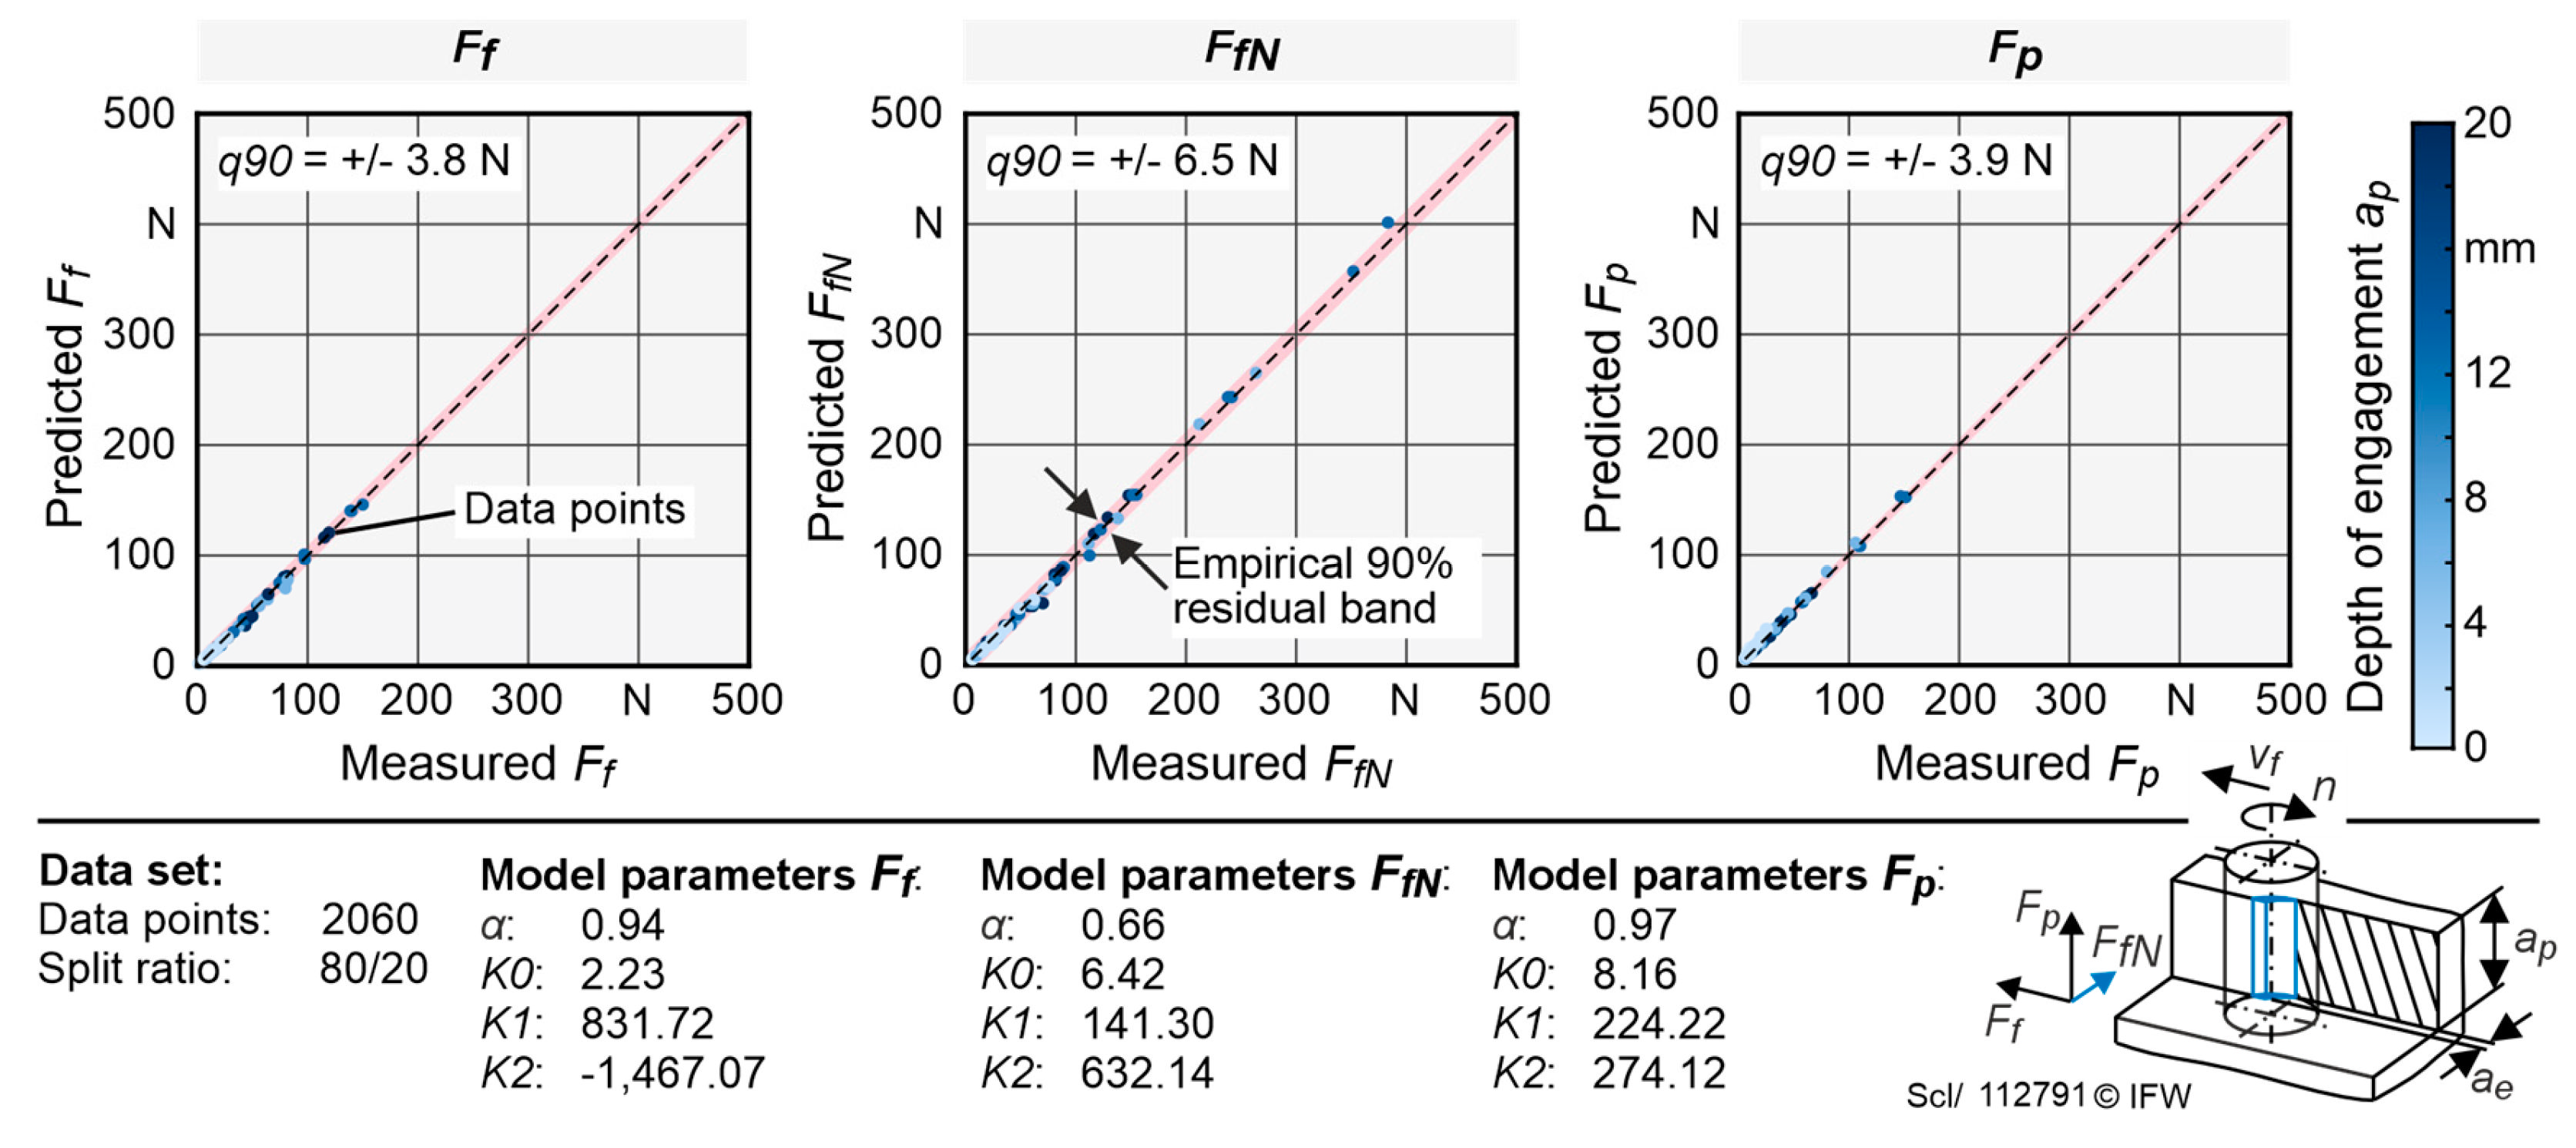
Figure 5.
Experimental setup on compliant workpieces.
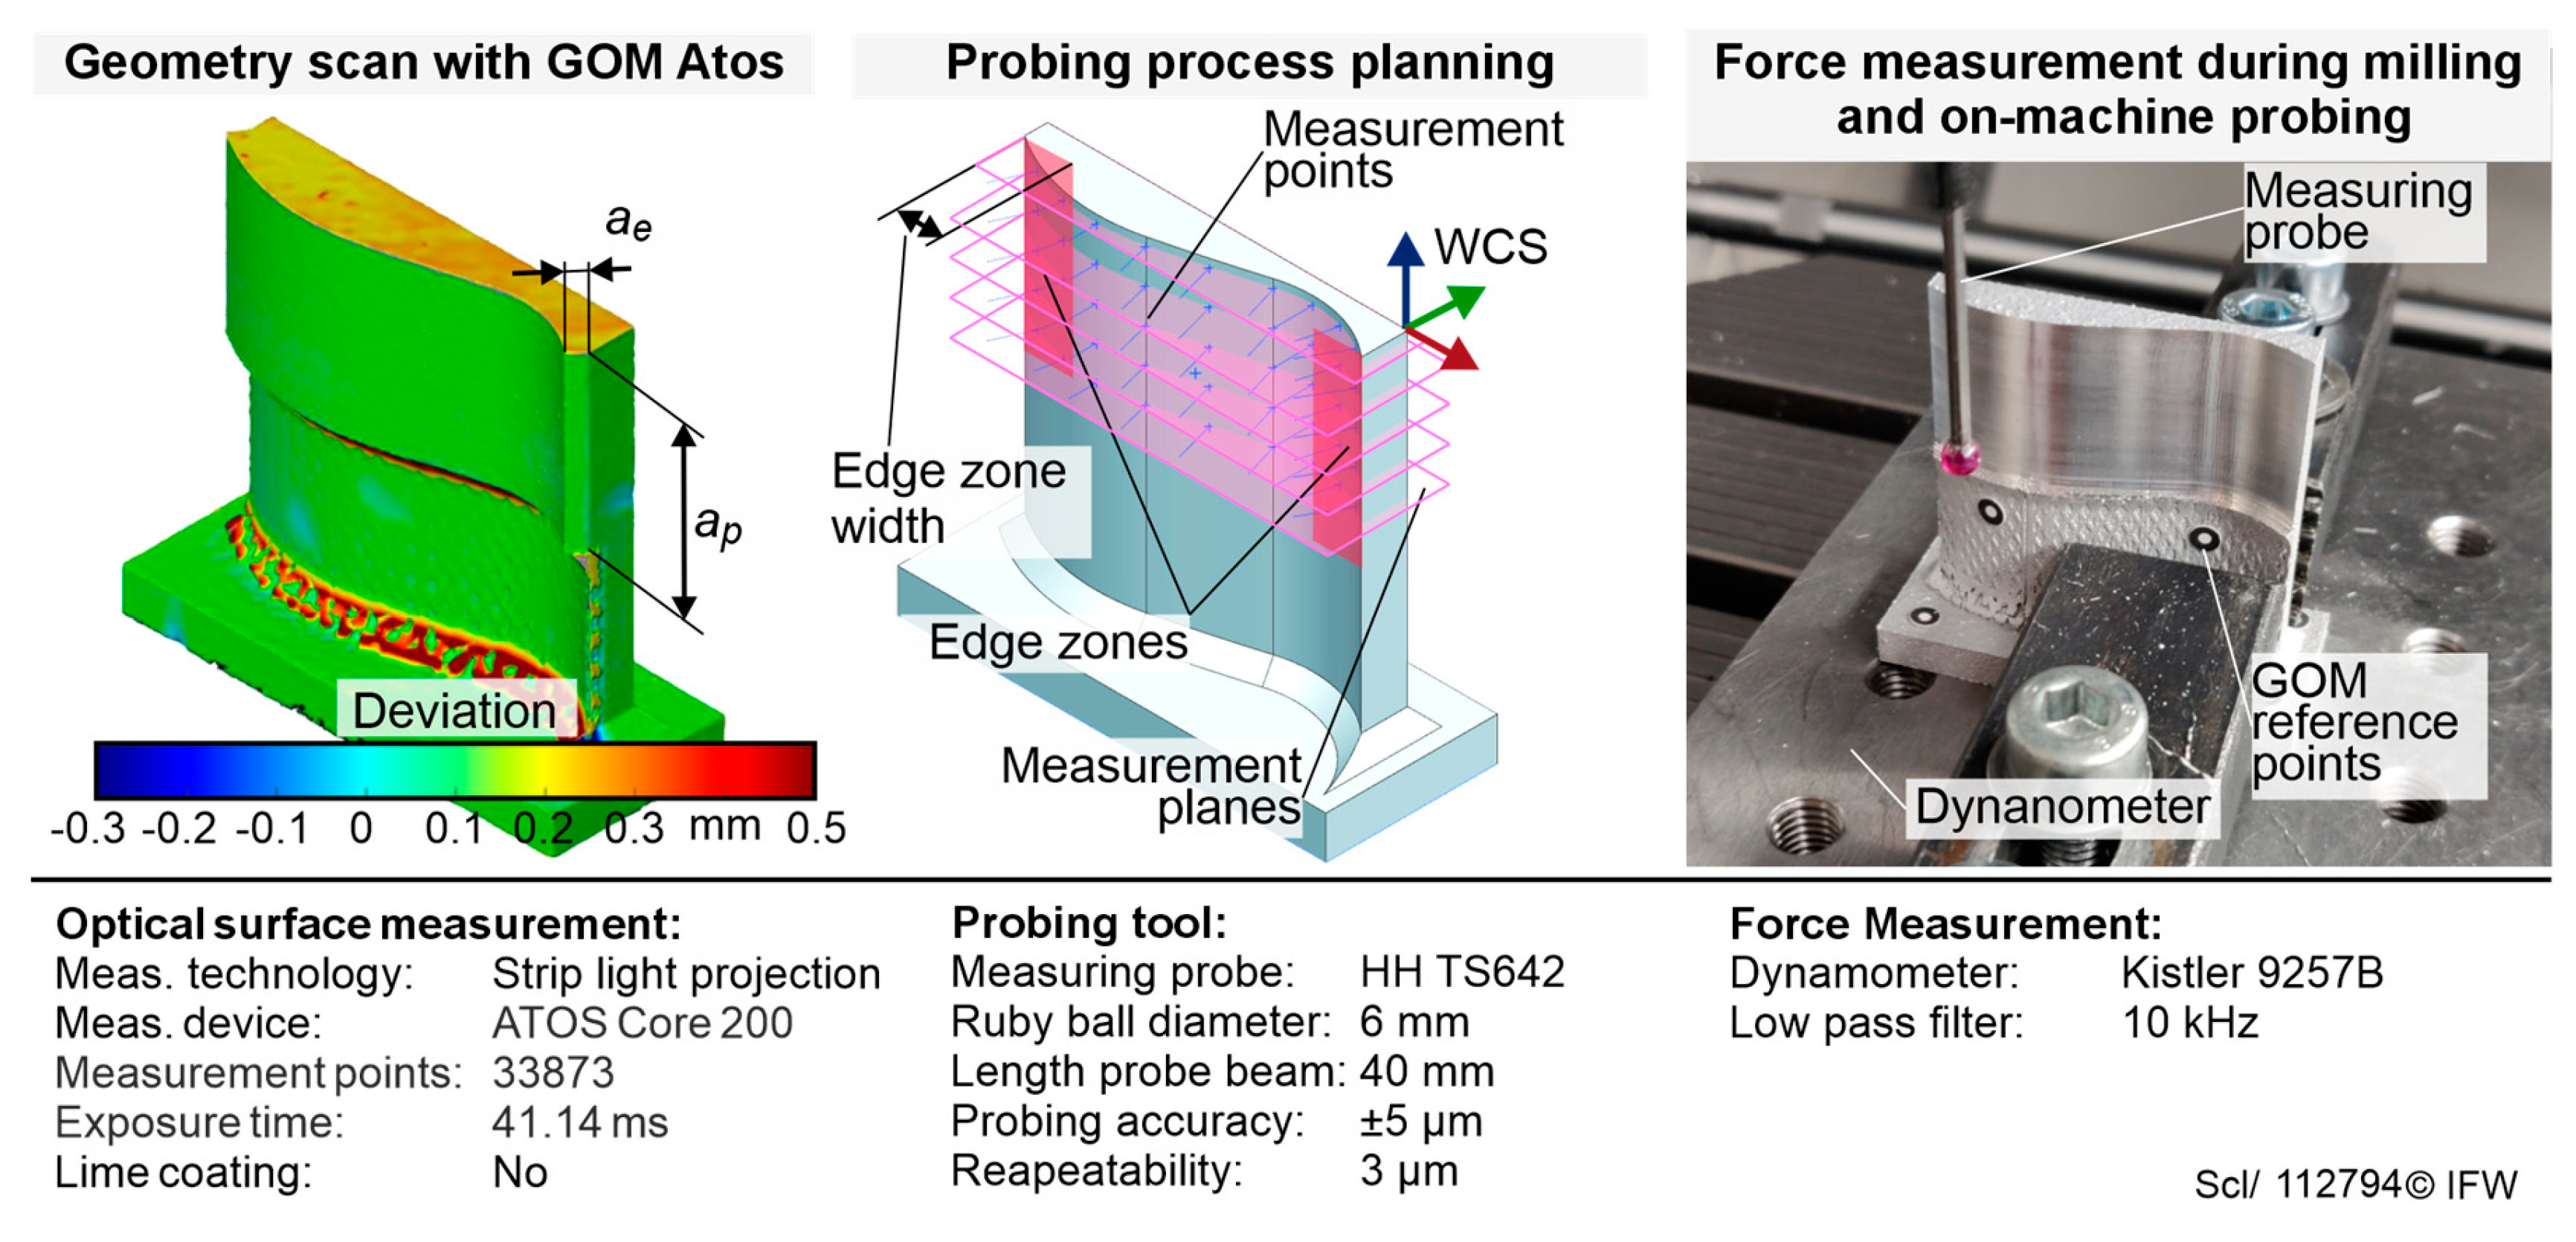
Figure 6.
Depiction of the calculation of engagement sizes within the technological NC-Simulation.
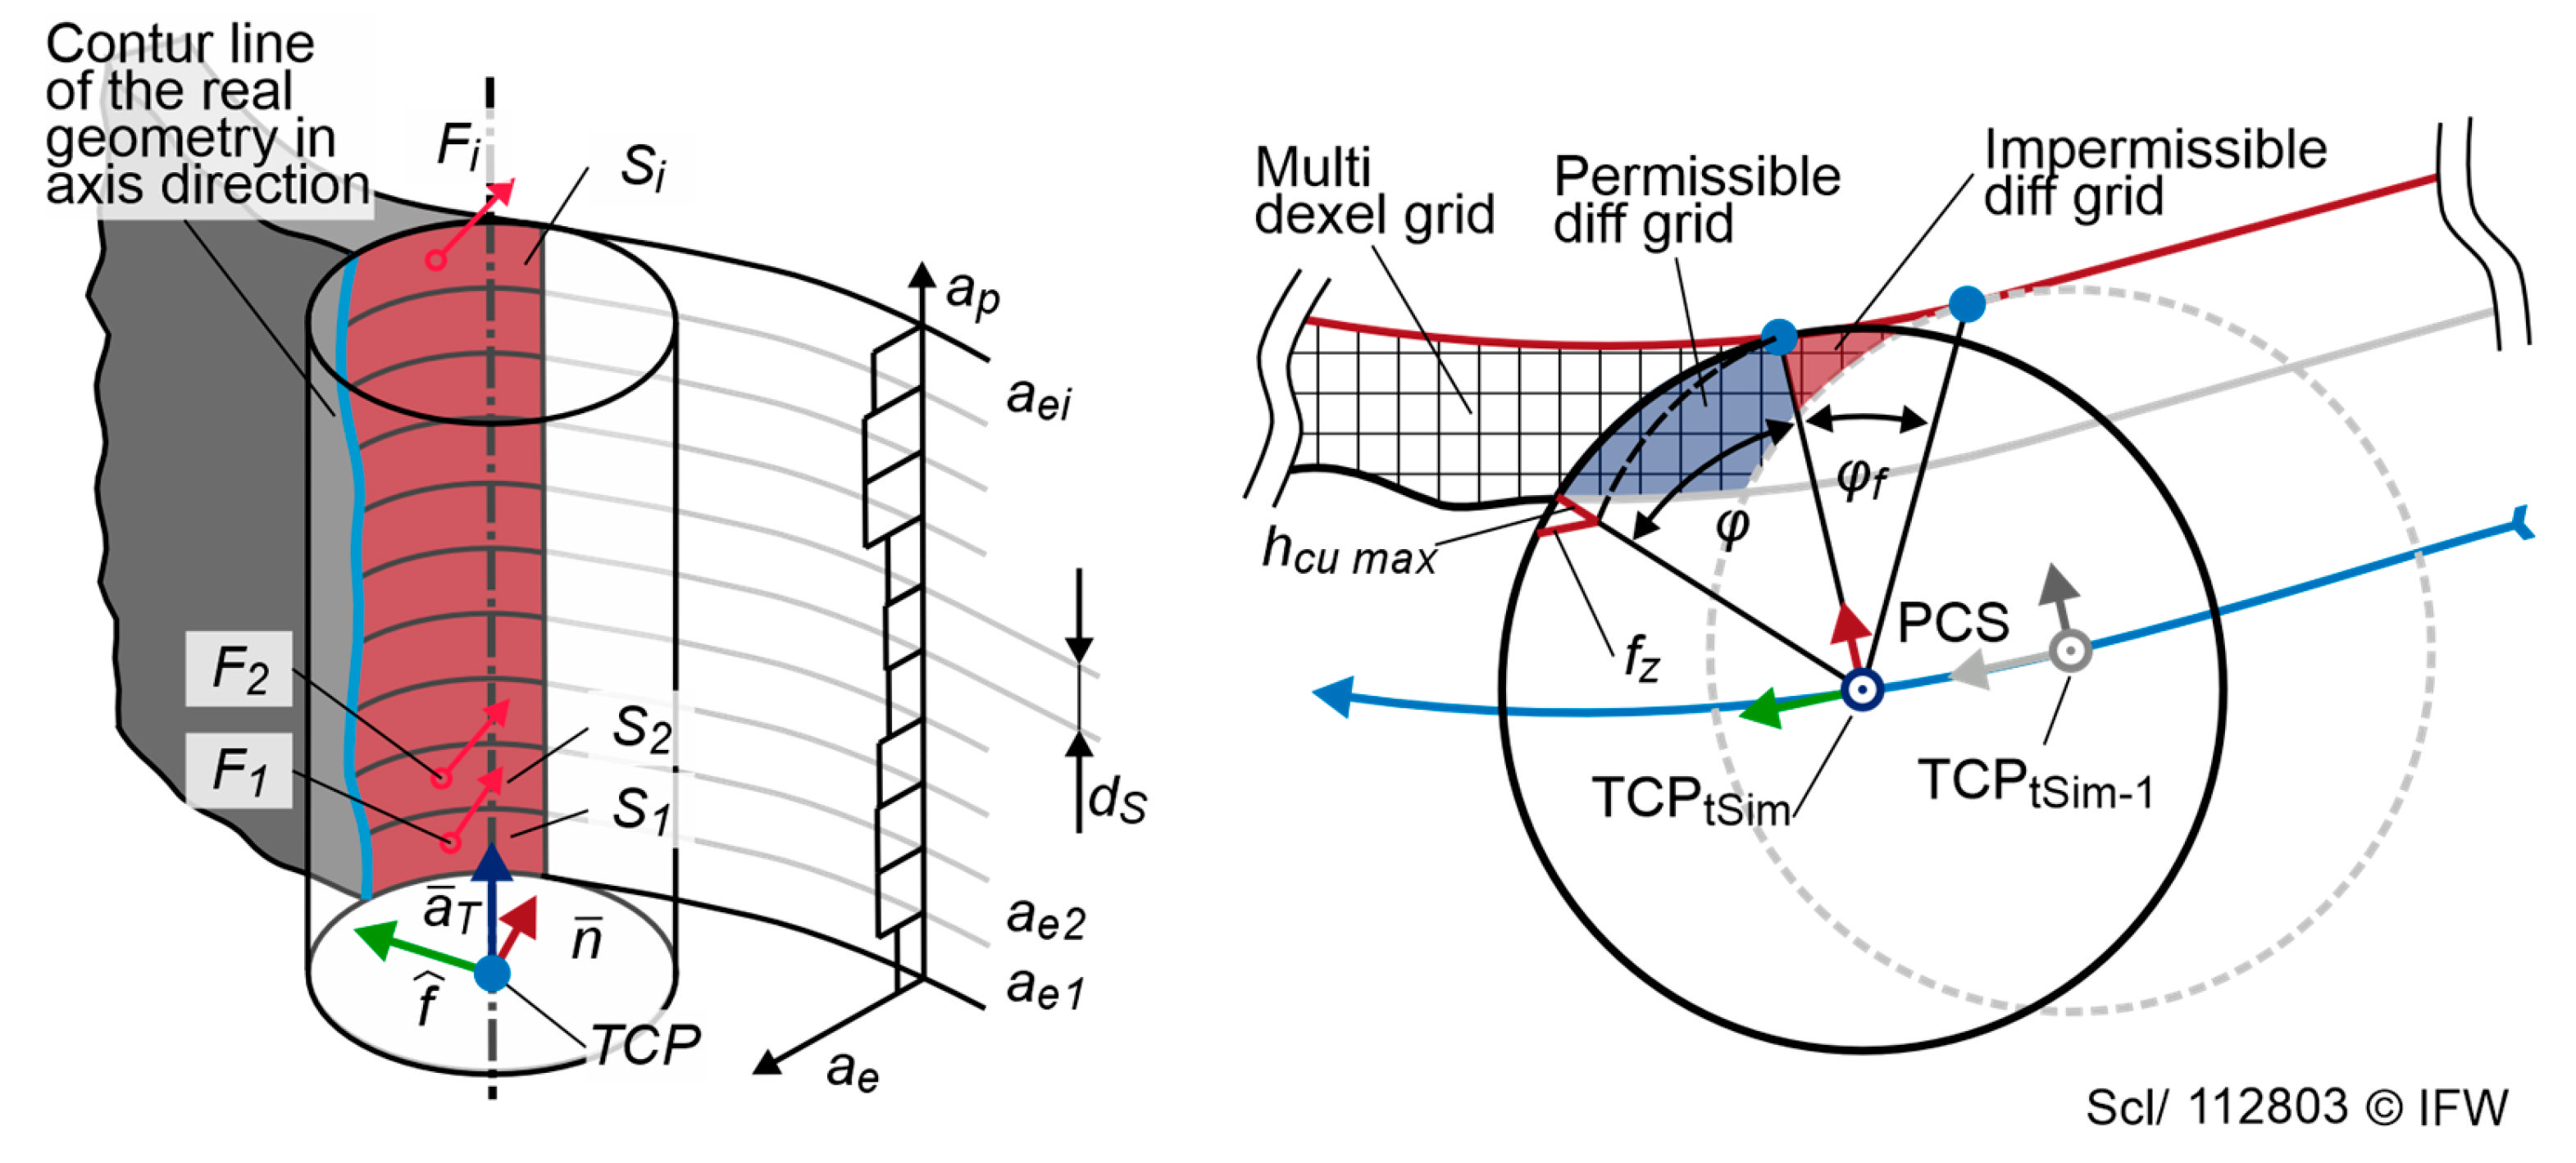
Figure 7.
Depiction of the tool path filtering within the technological NC-Simulation.
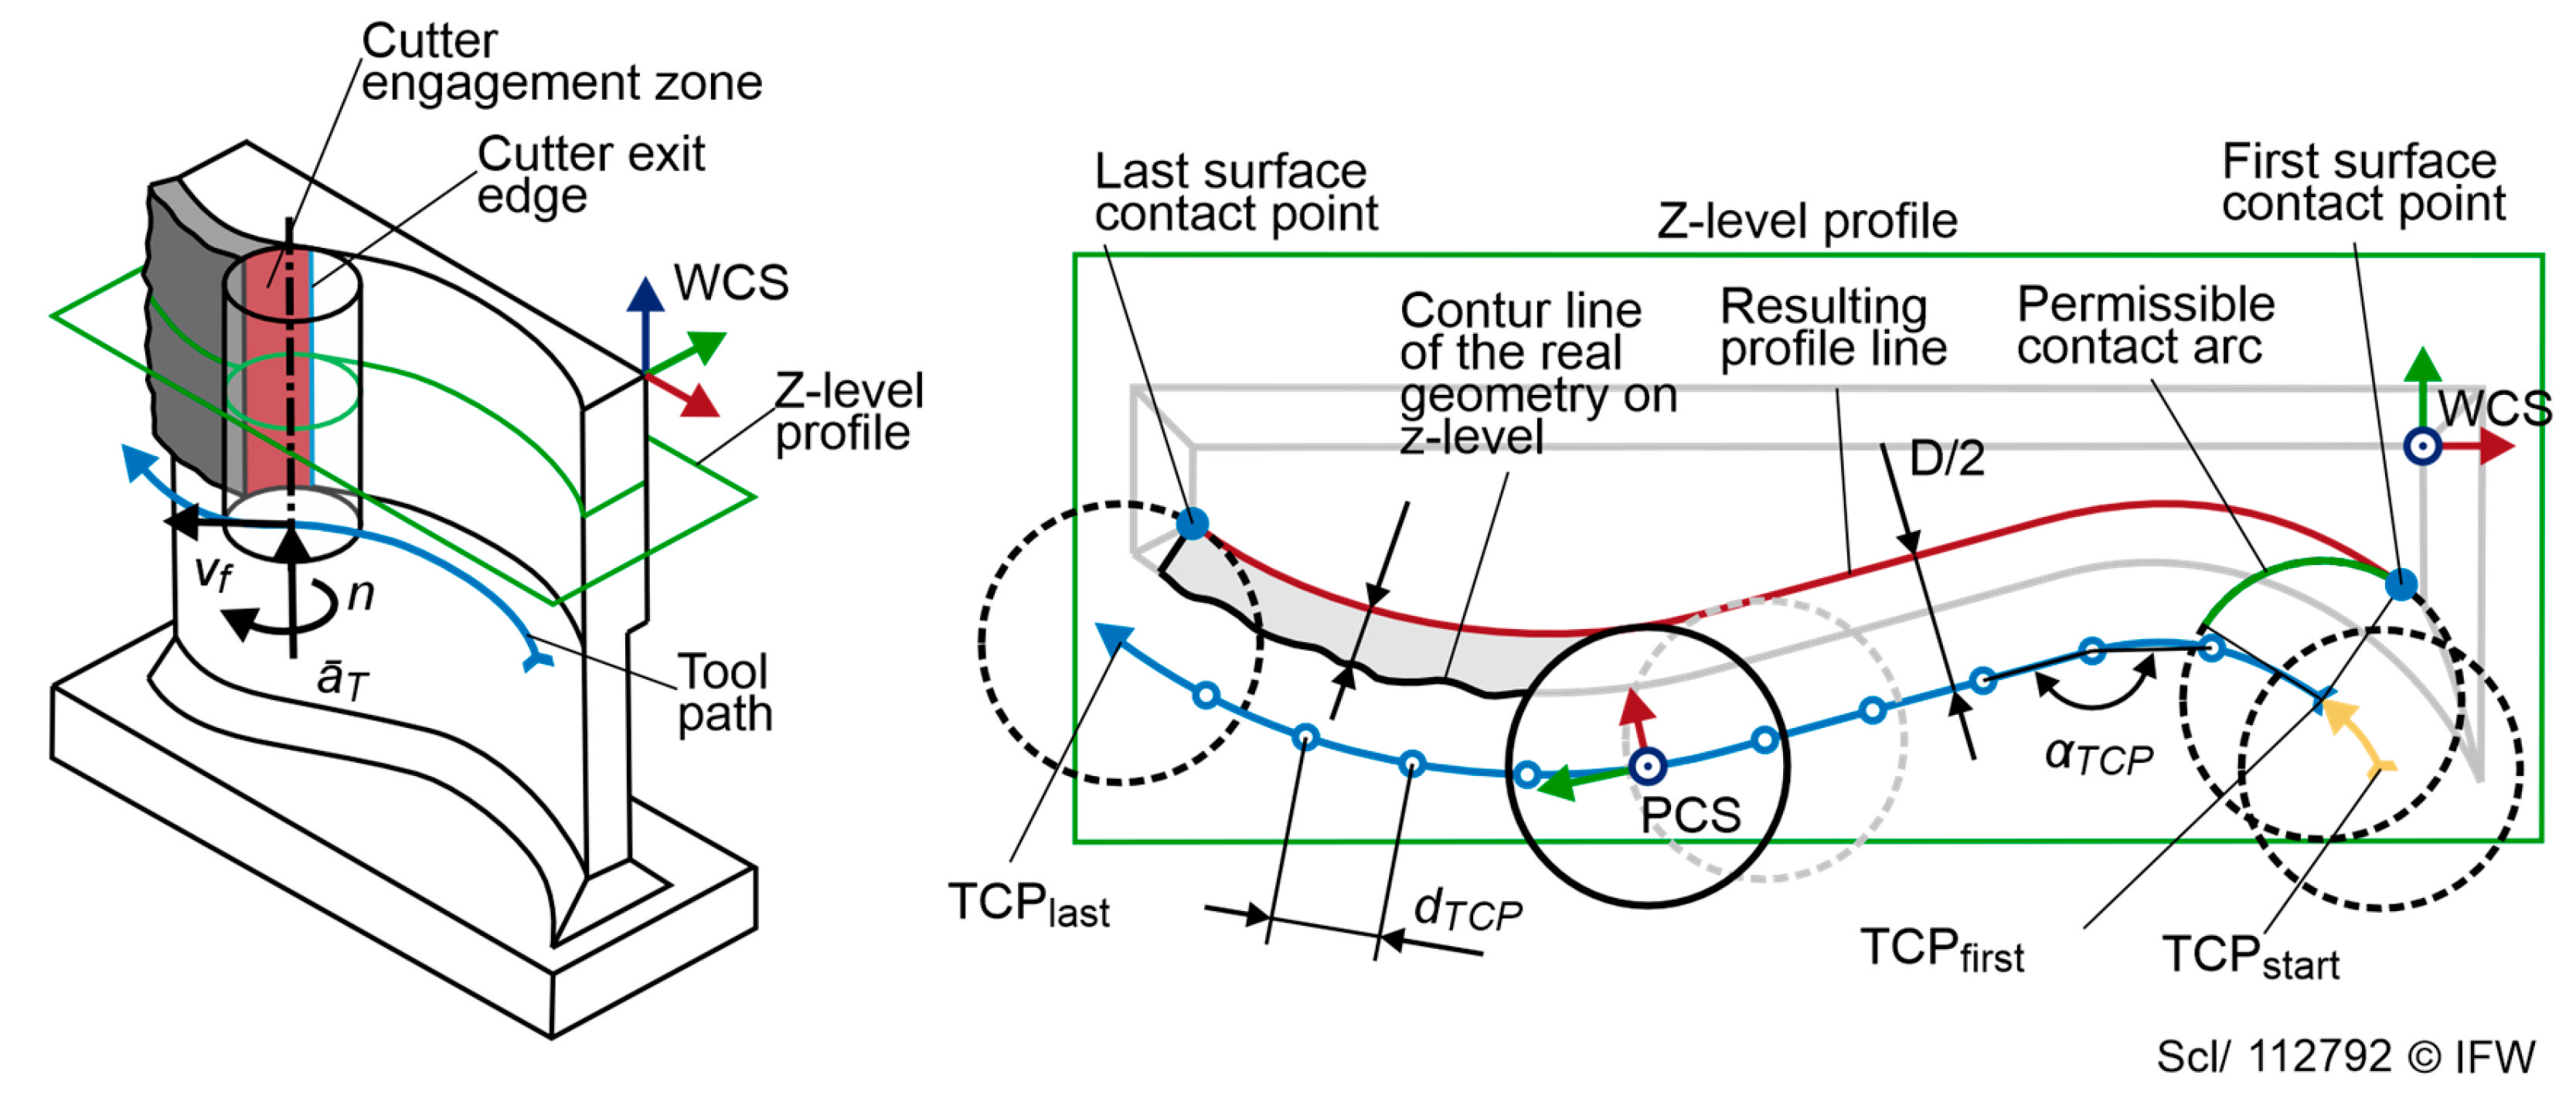
Figure 8.
Process scheme of the structural response simulation.
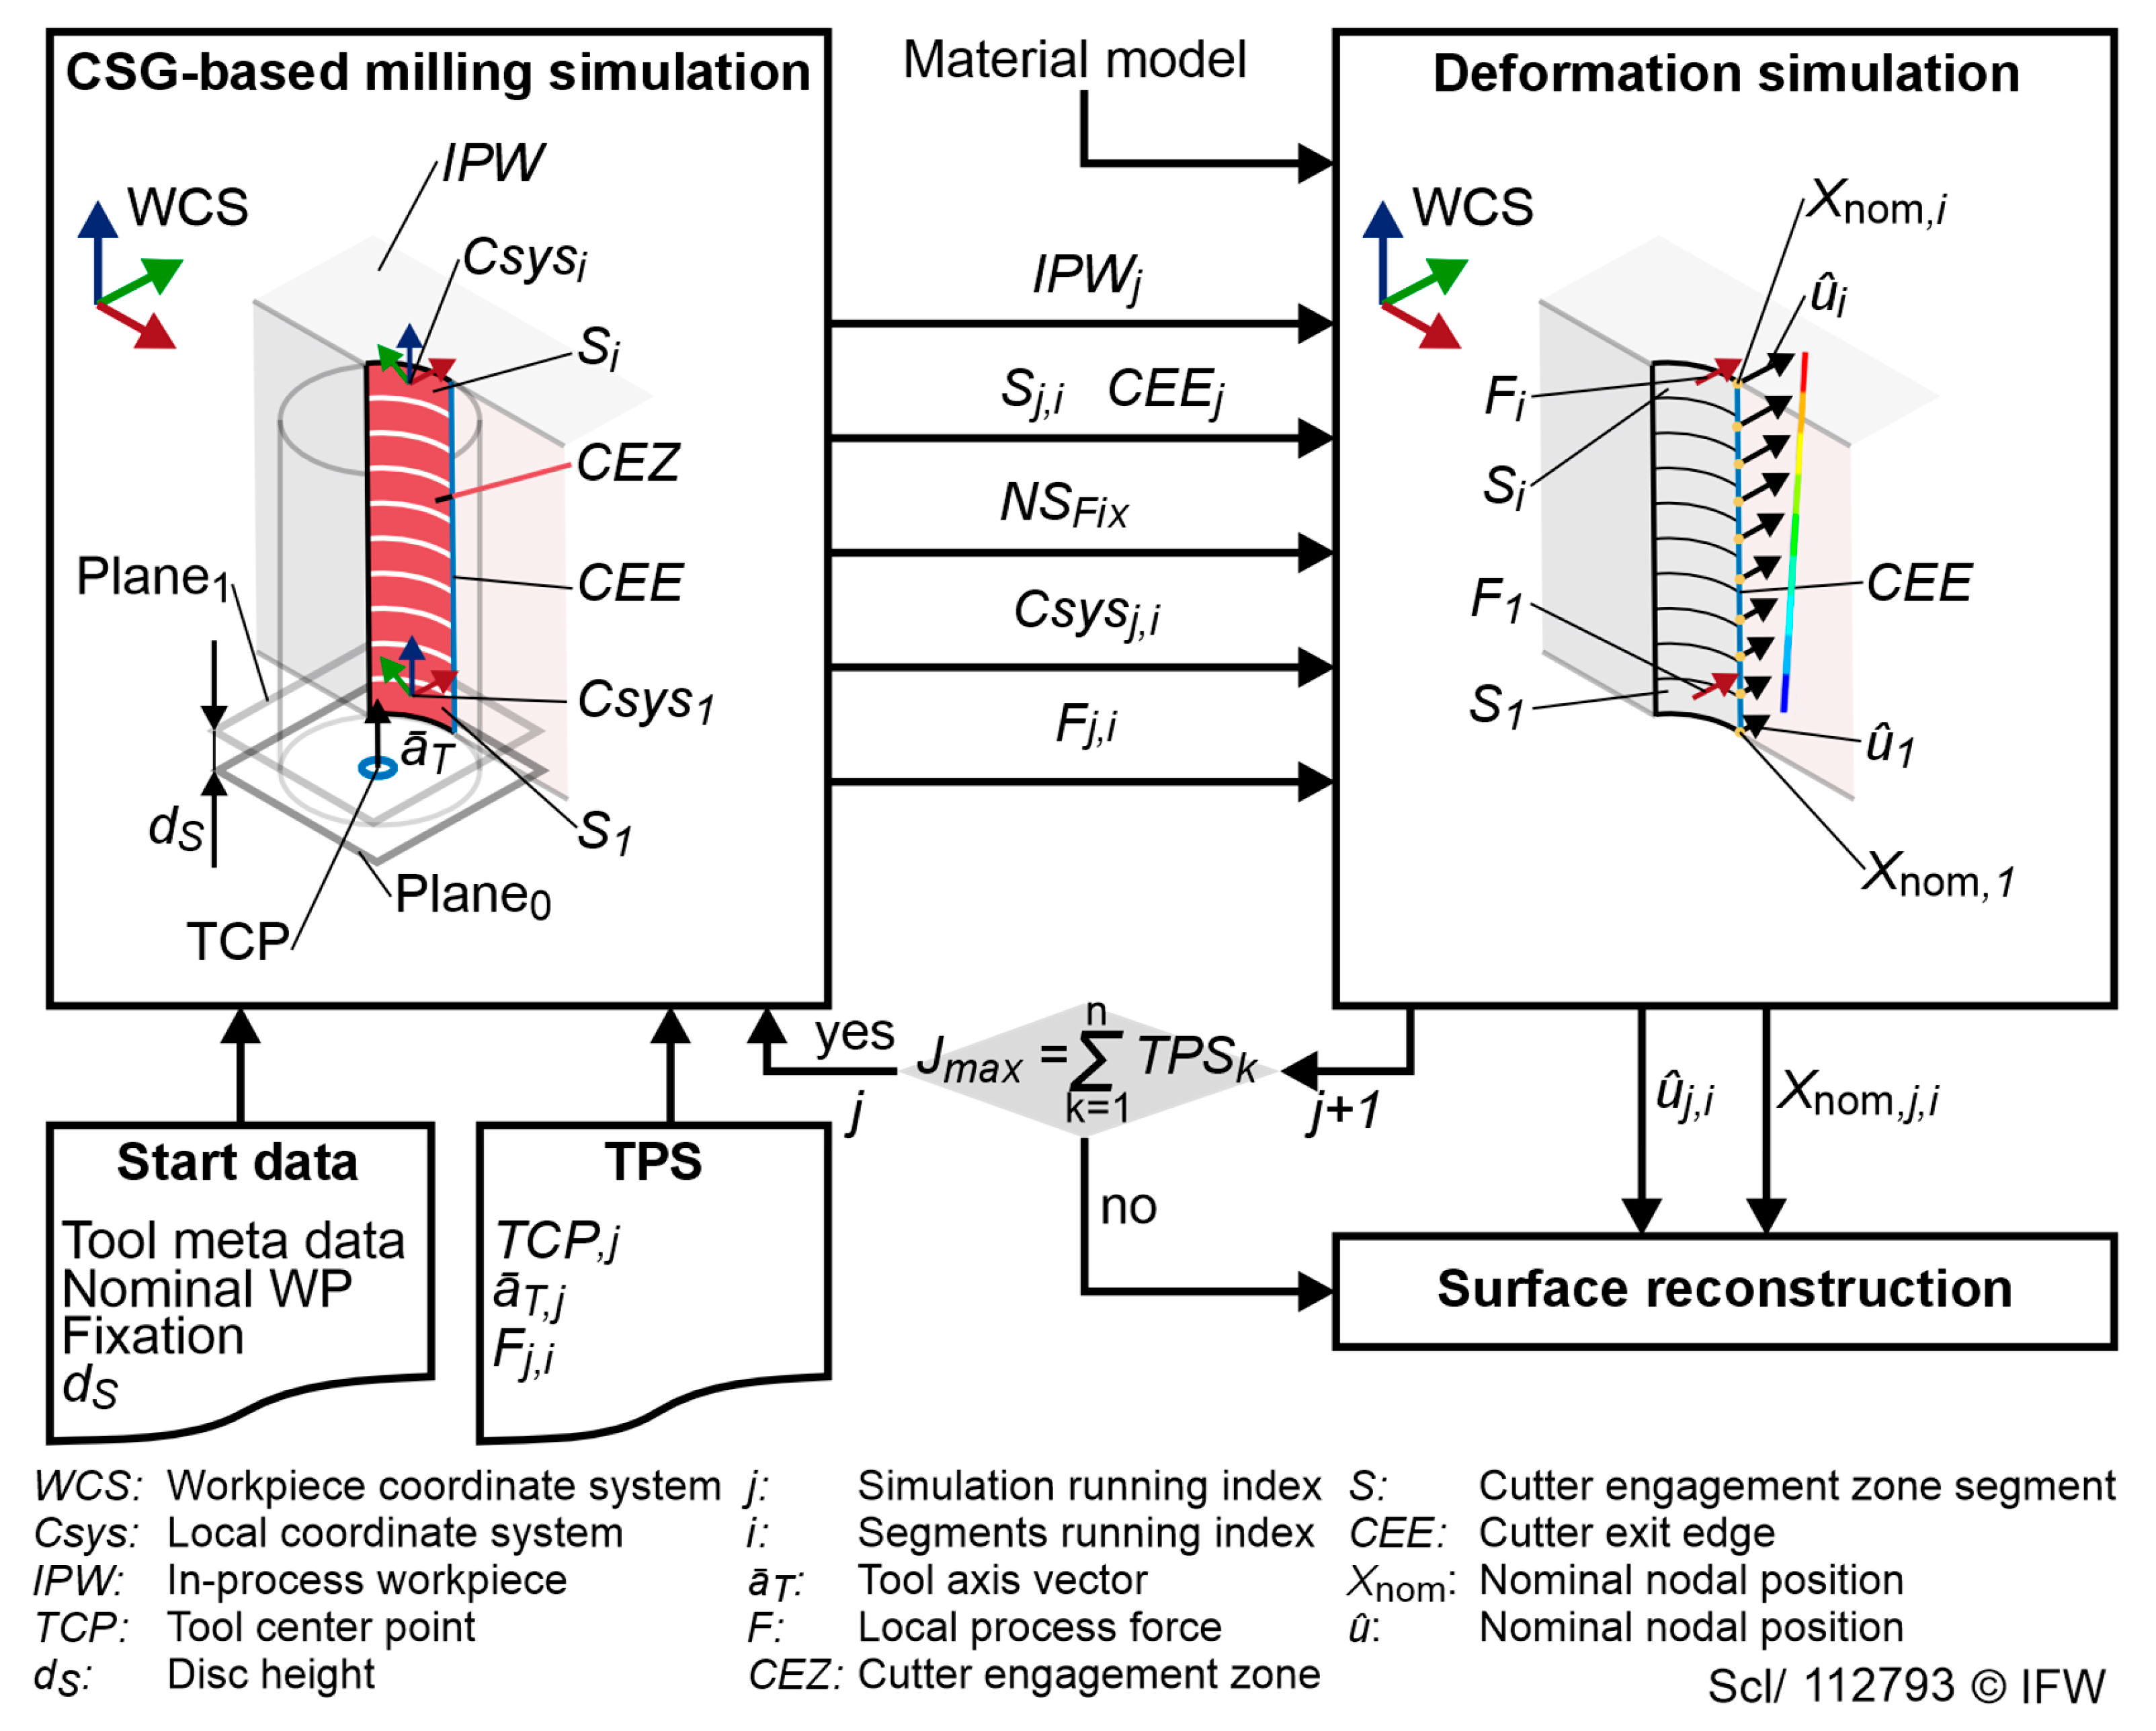
Figure 9.
Simulated and measured force components on the beam analogy specimen.
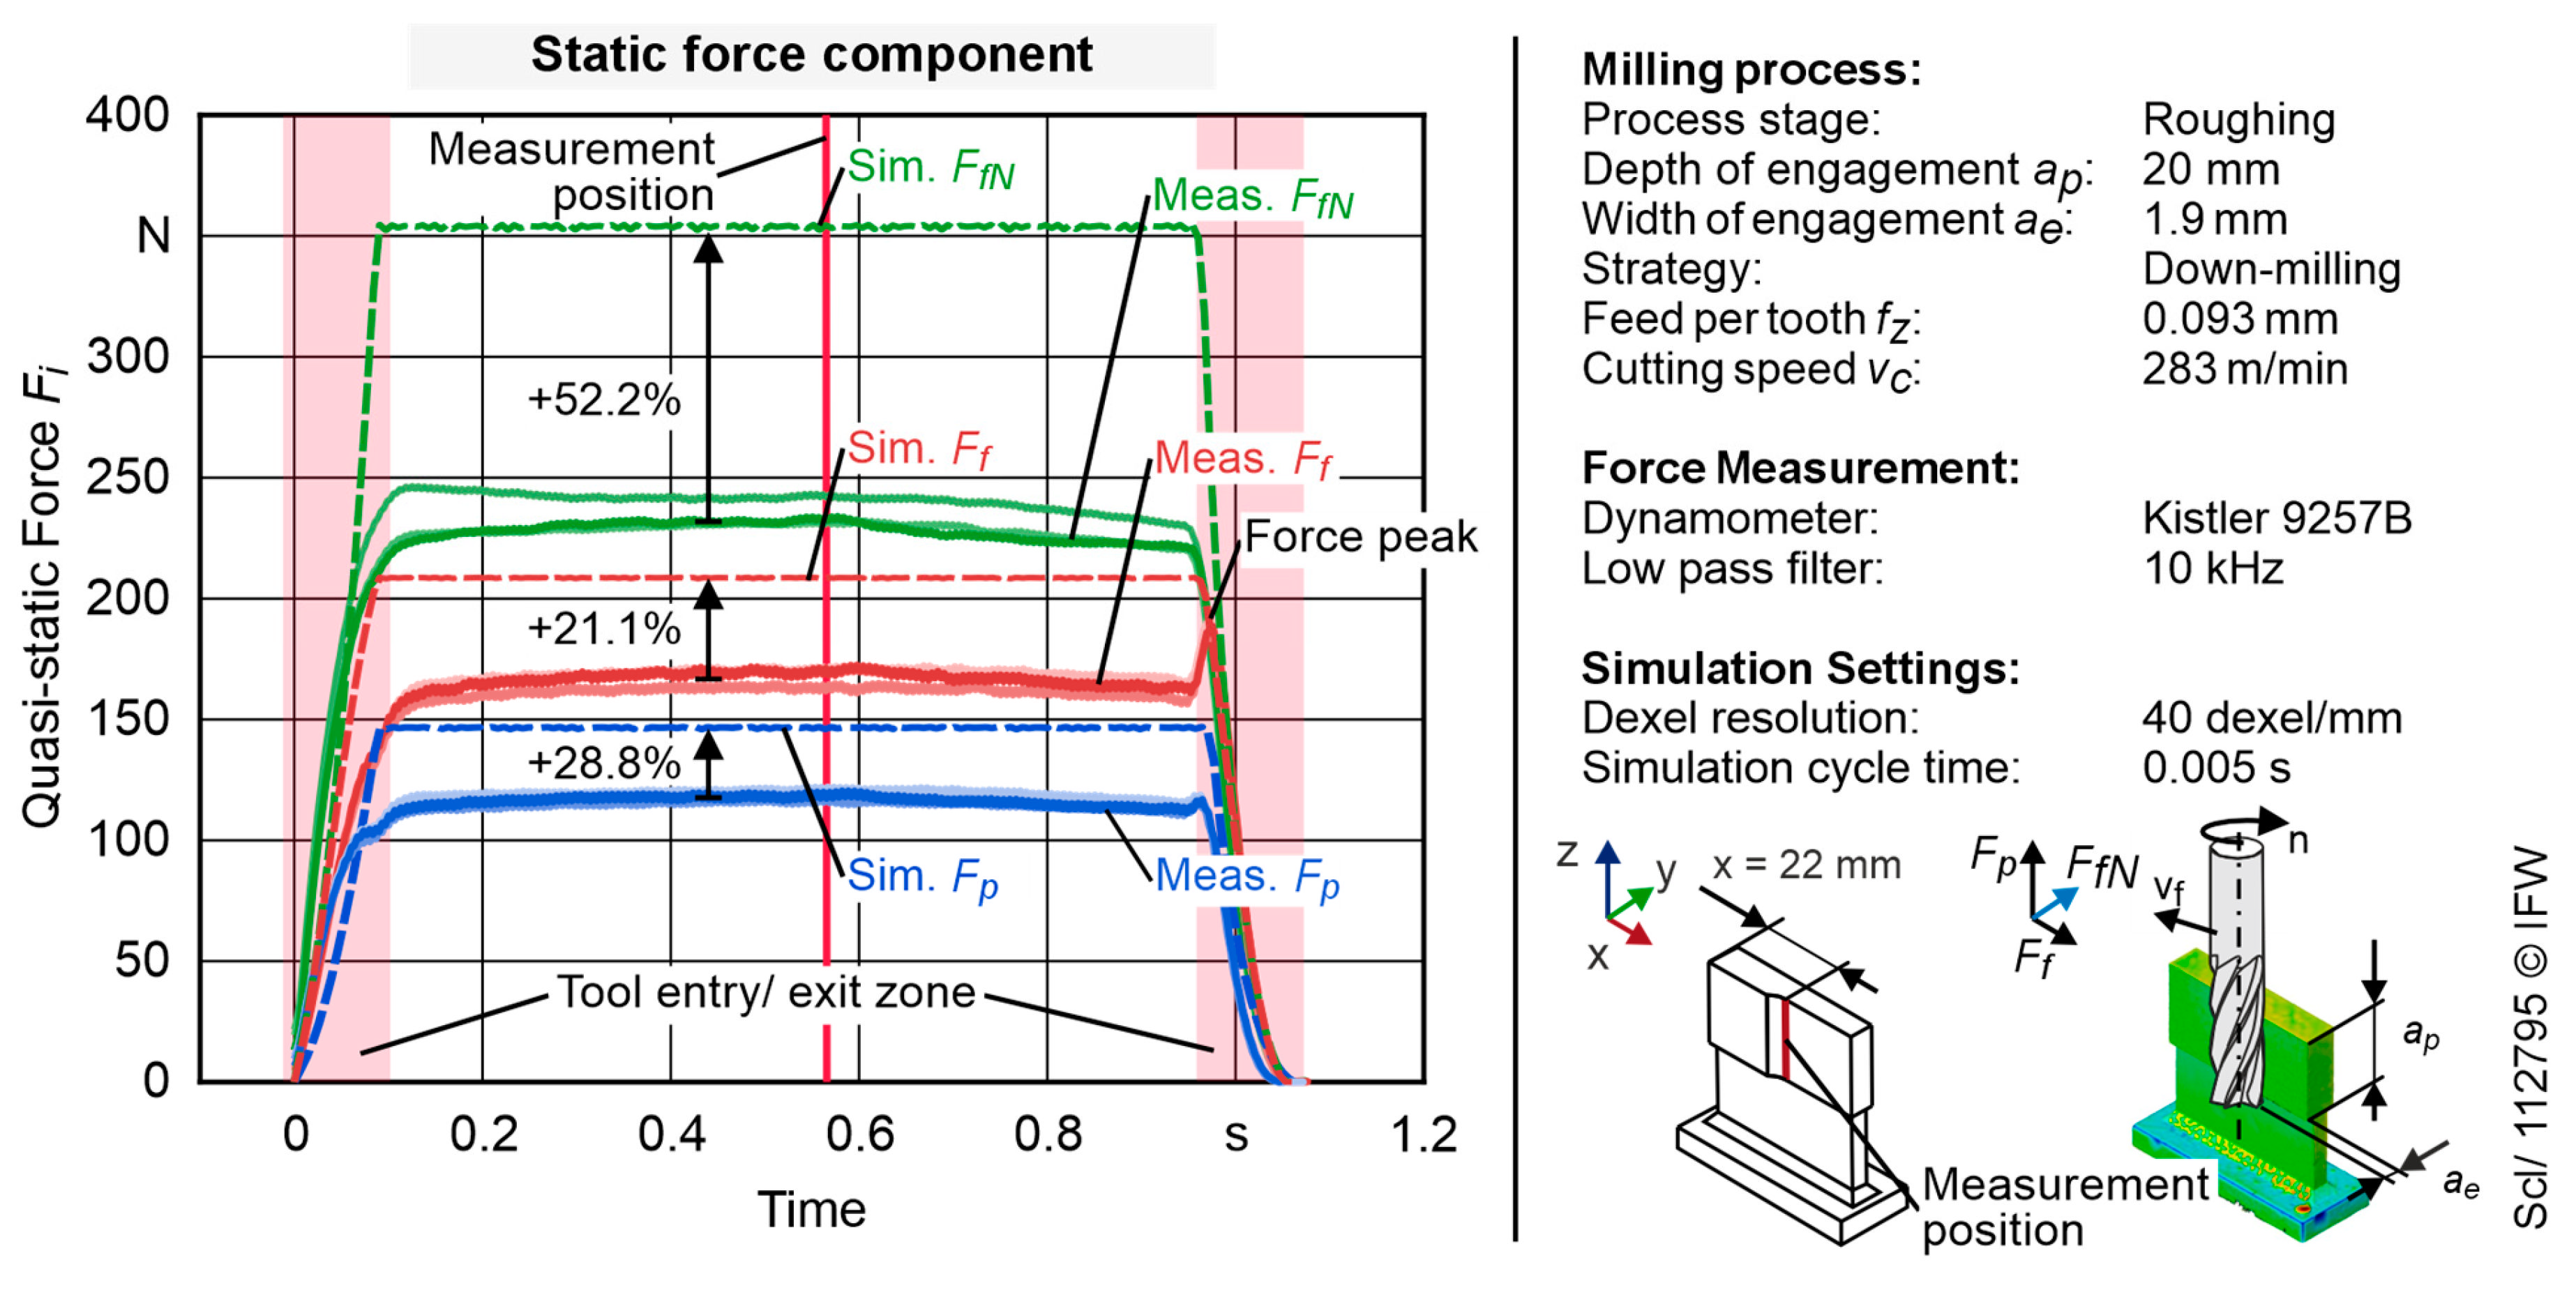
Figure 10.
Force prediction and measurement for the finishing process.
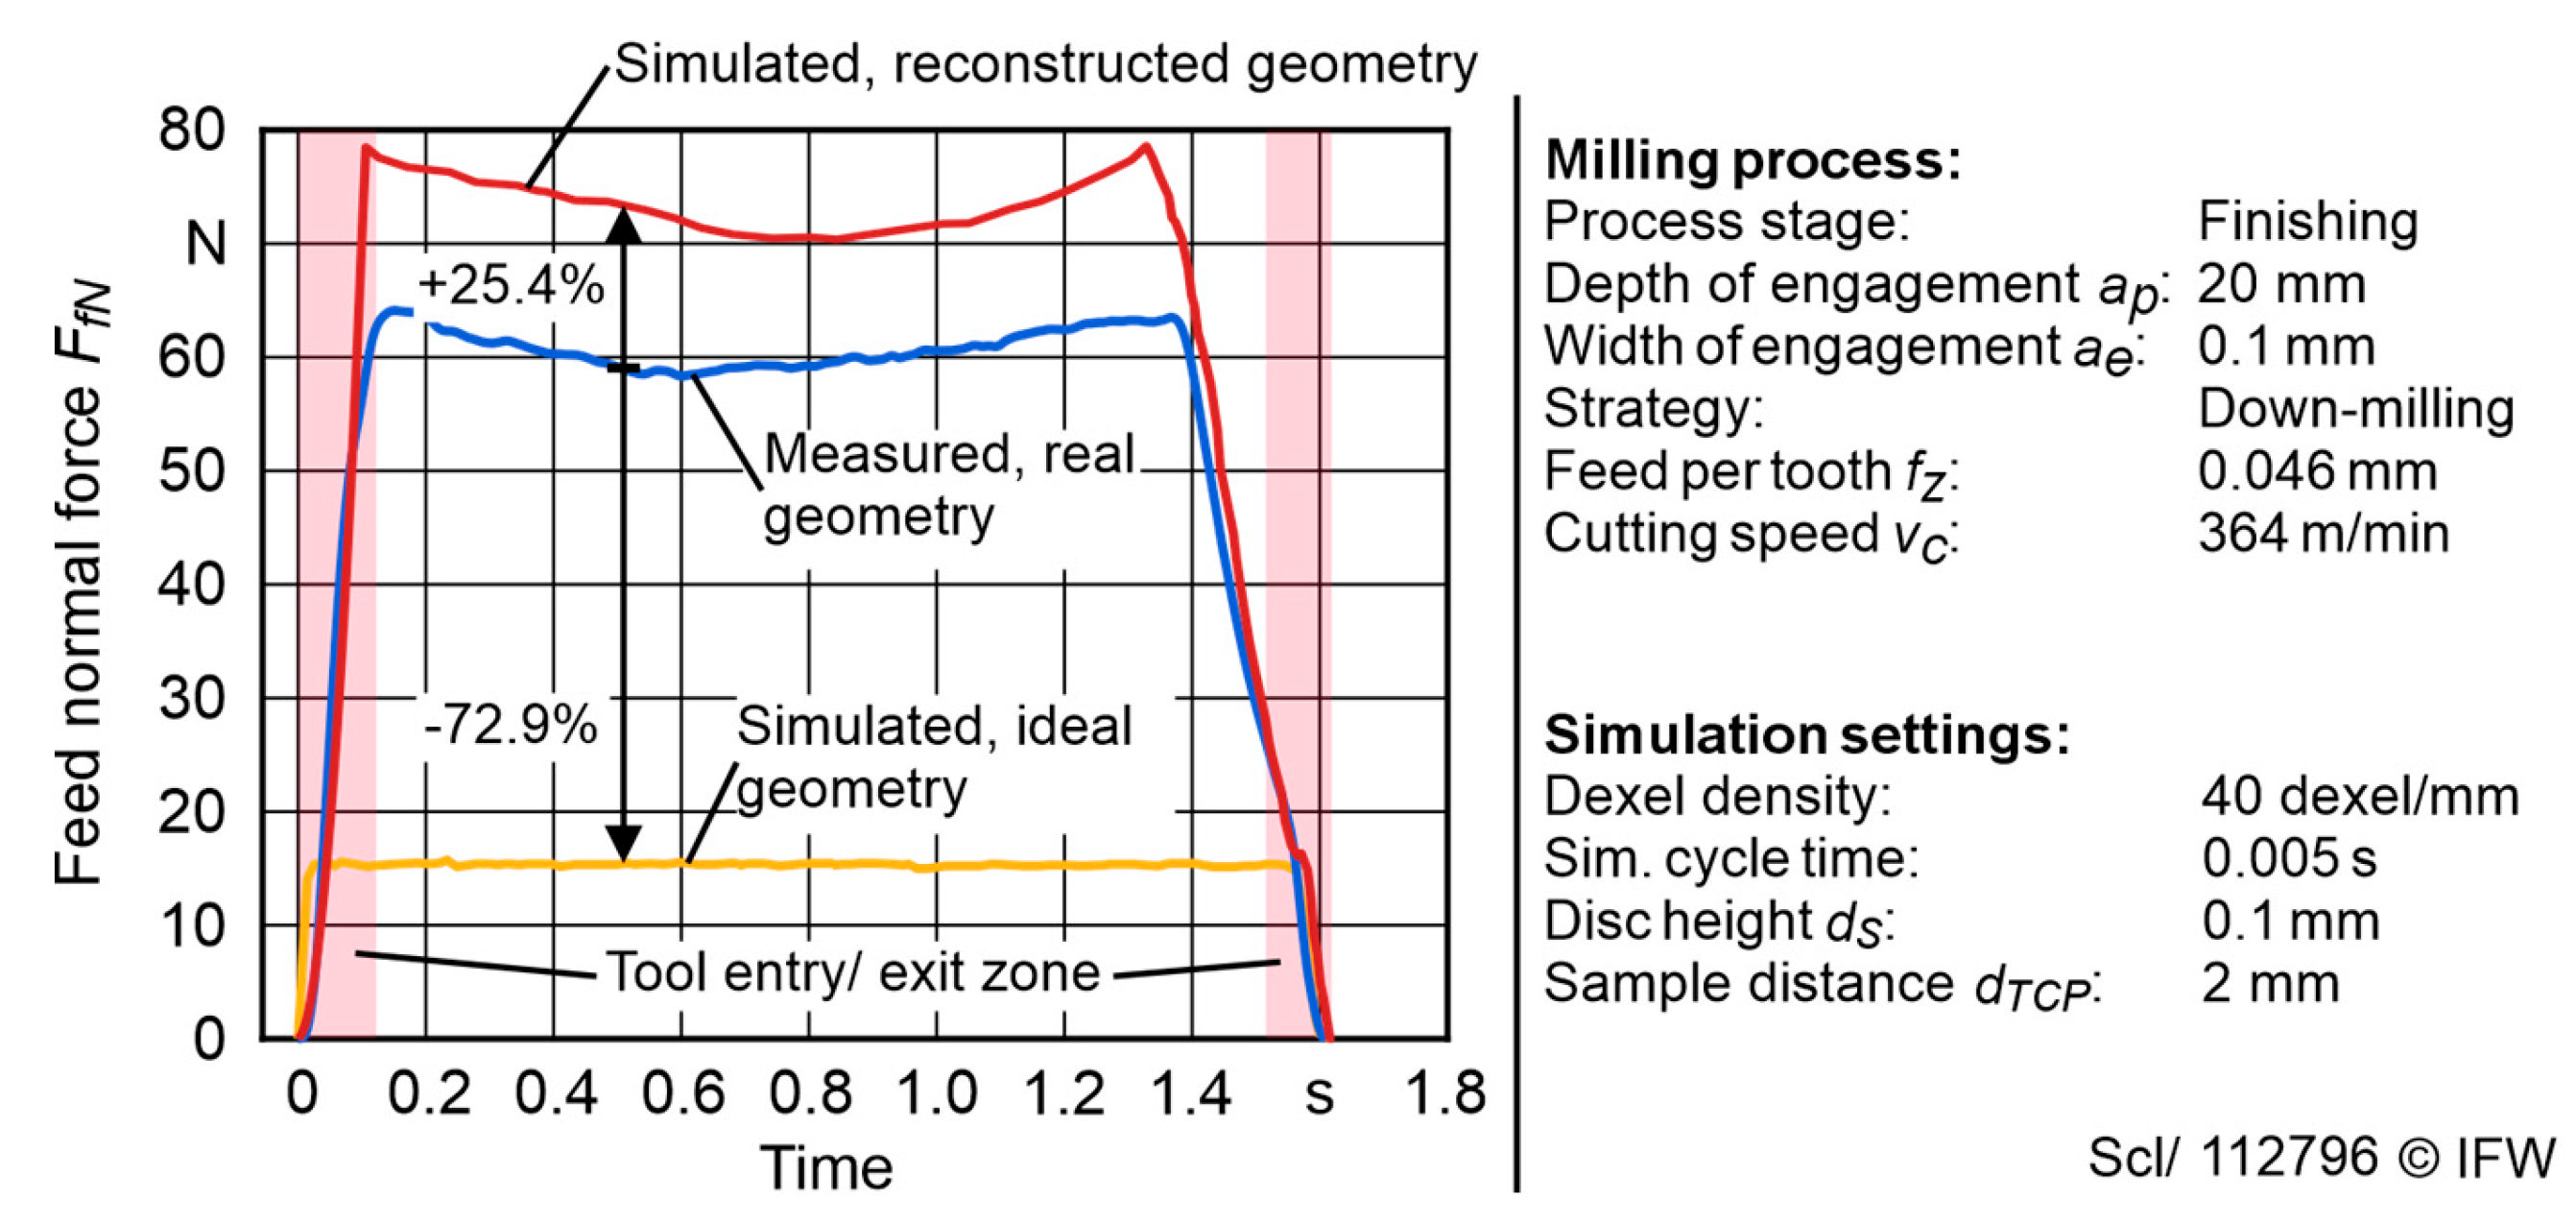
Figure 12.
Comparison between measured and simulated shape error on beam specimen.
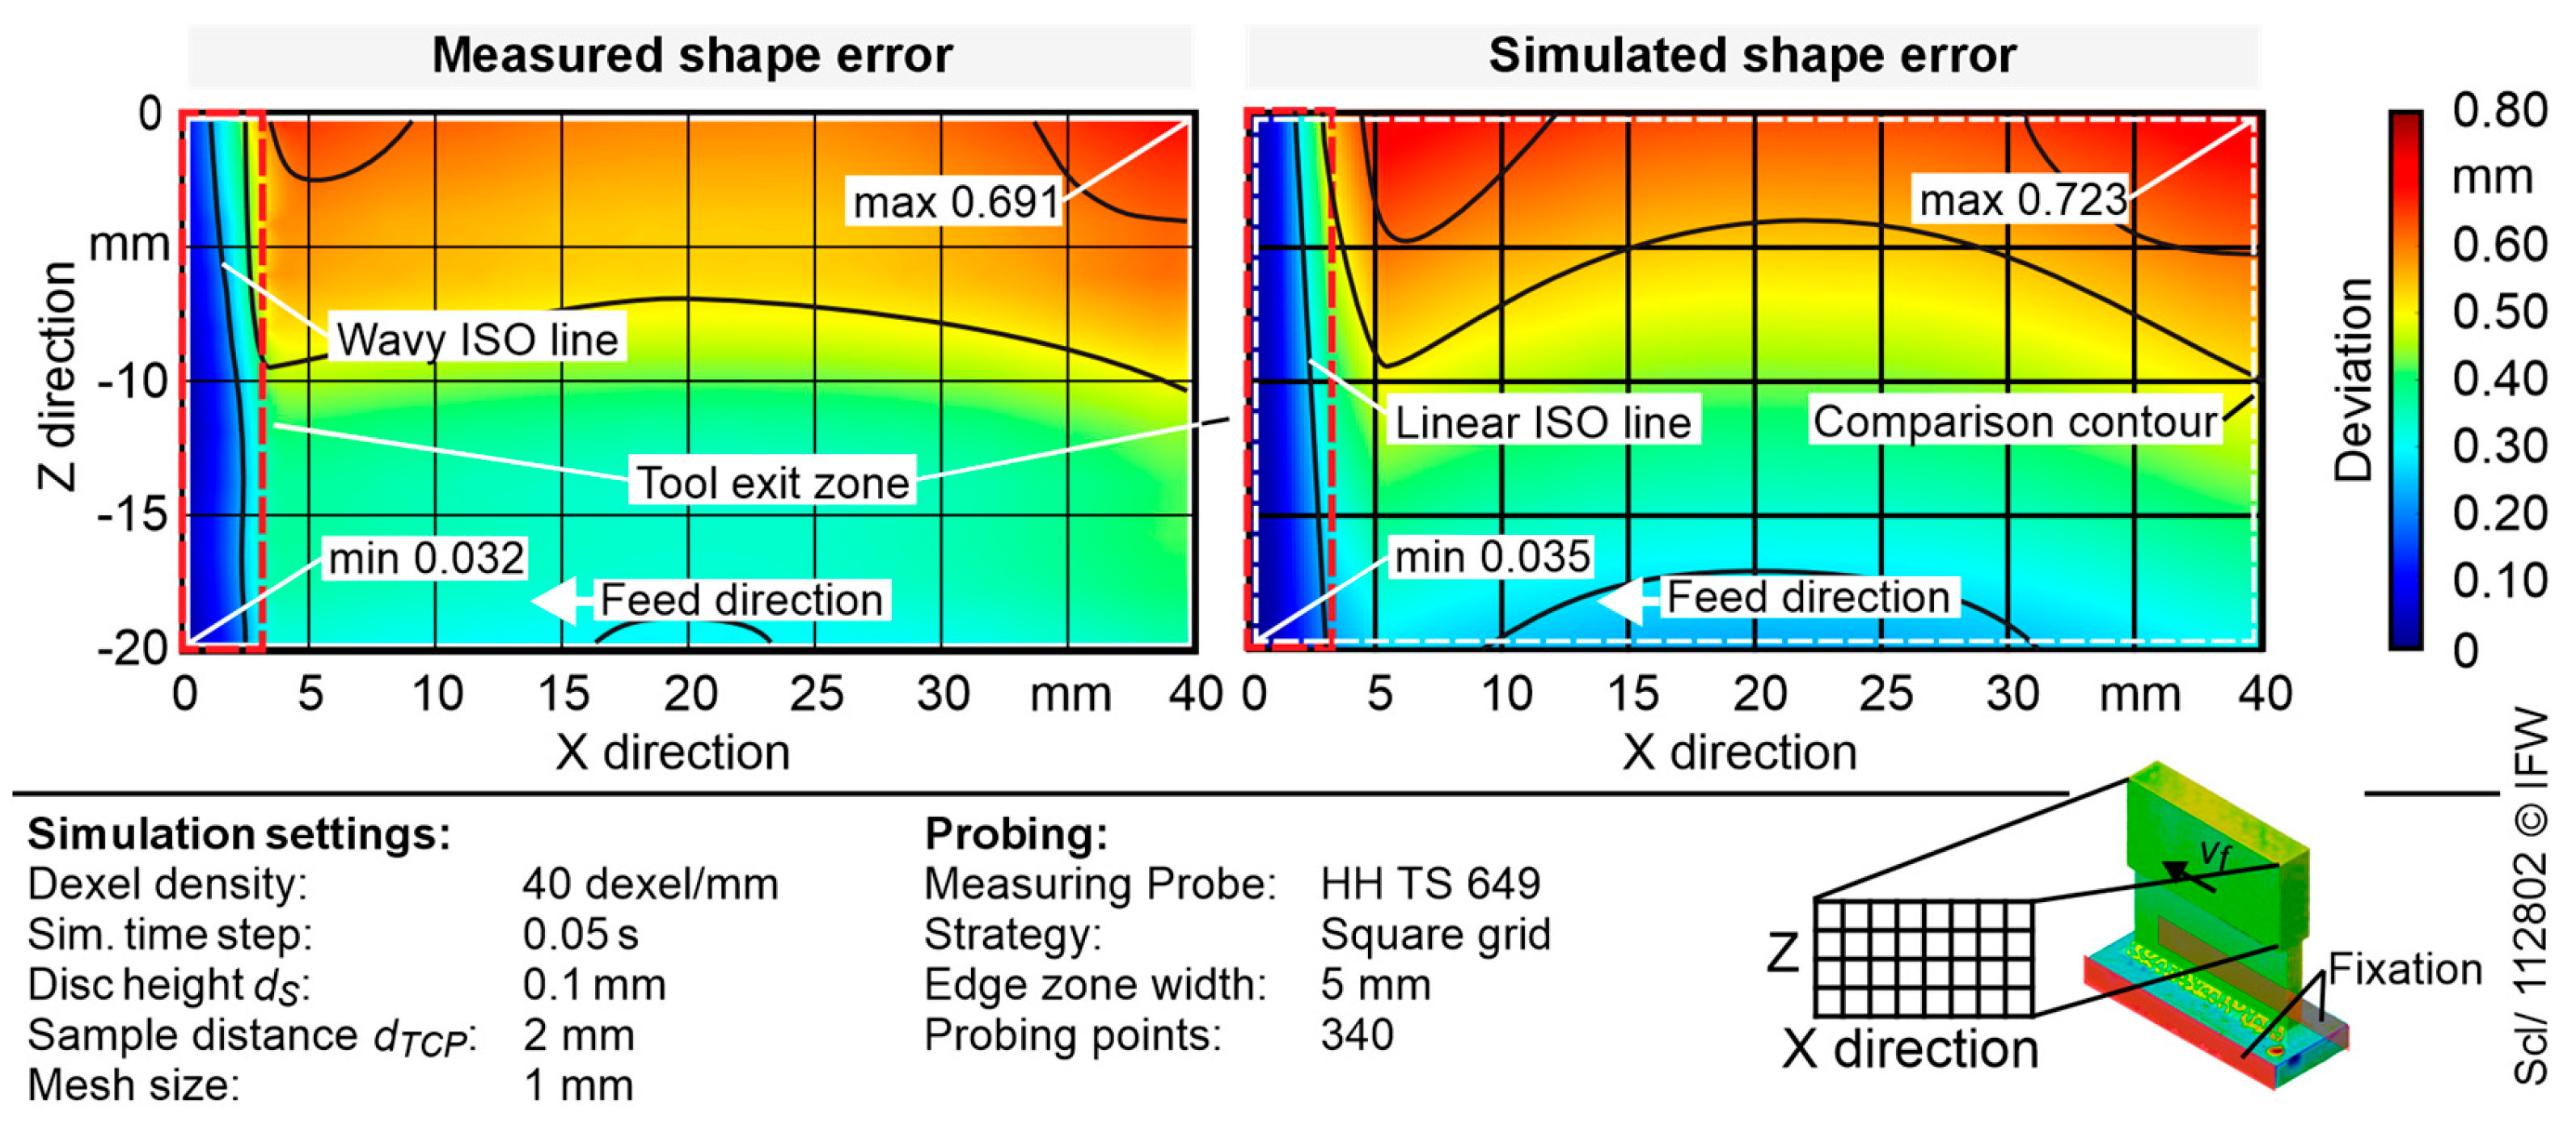
Figure 13.
Measured and simulated shape error on freeform analogy specimen.
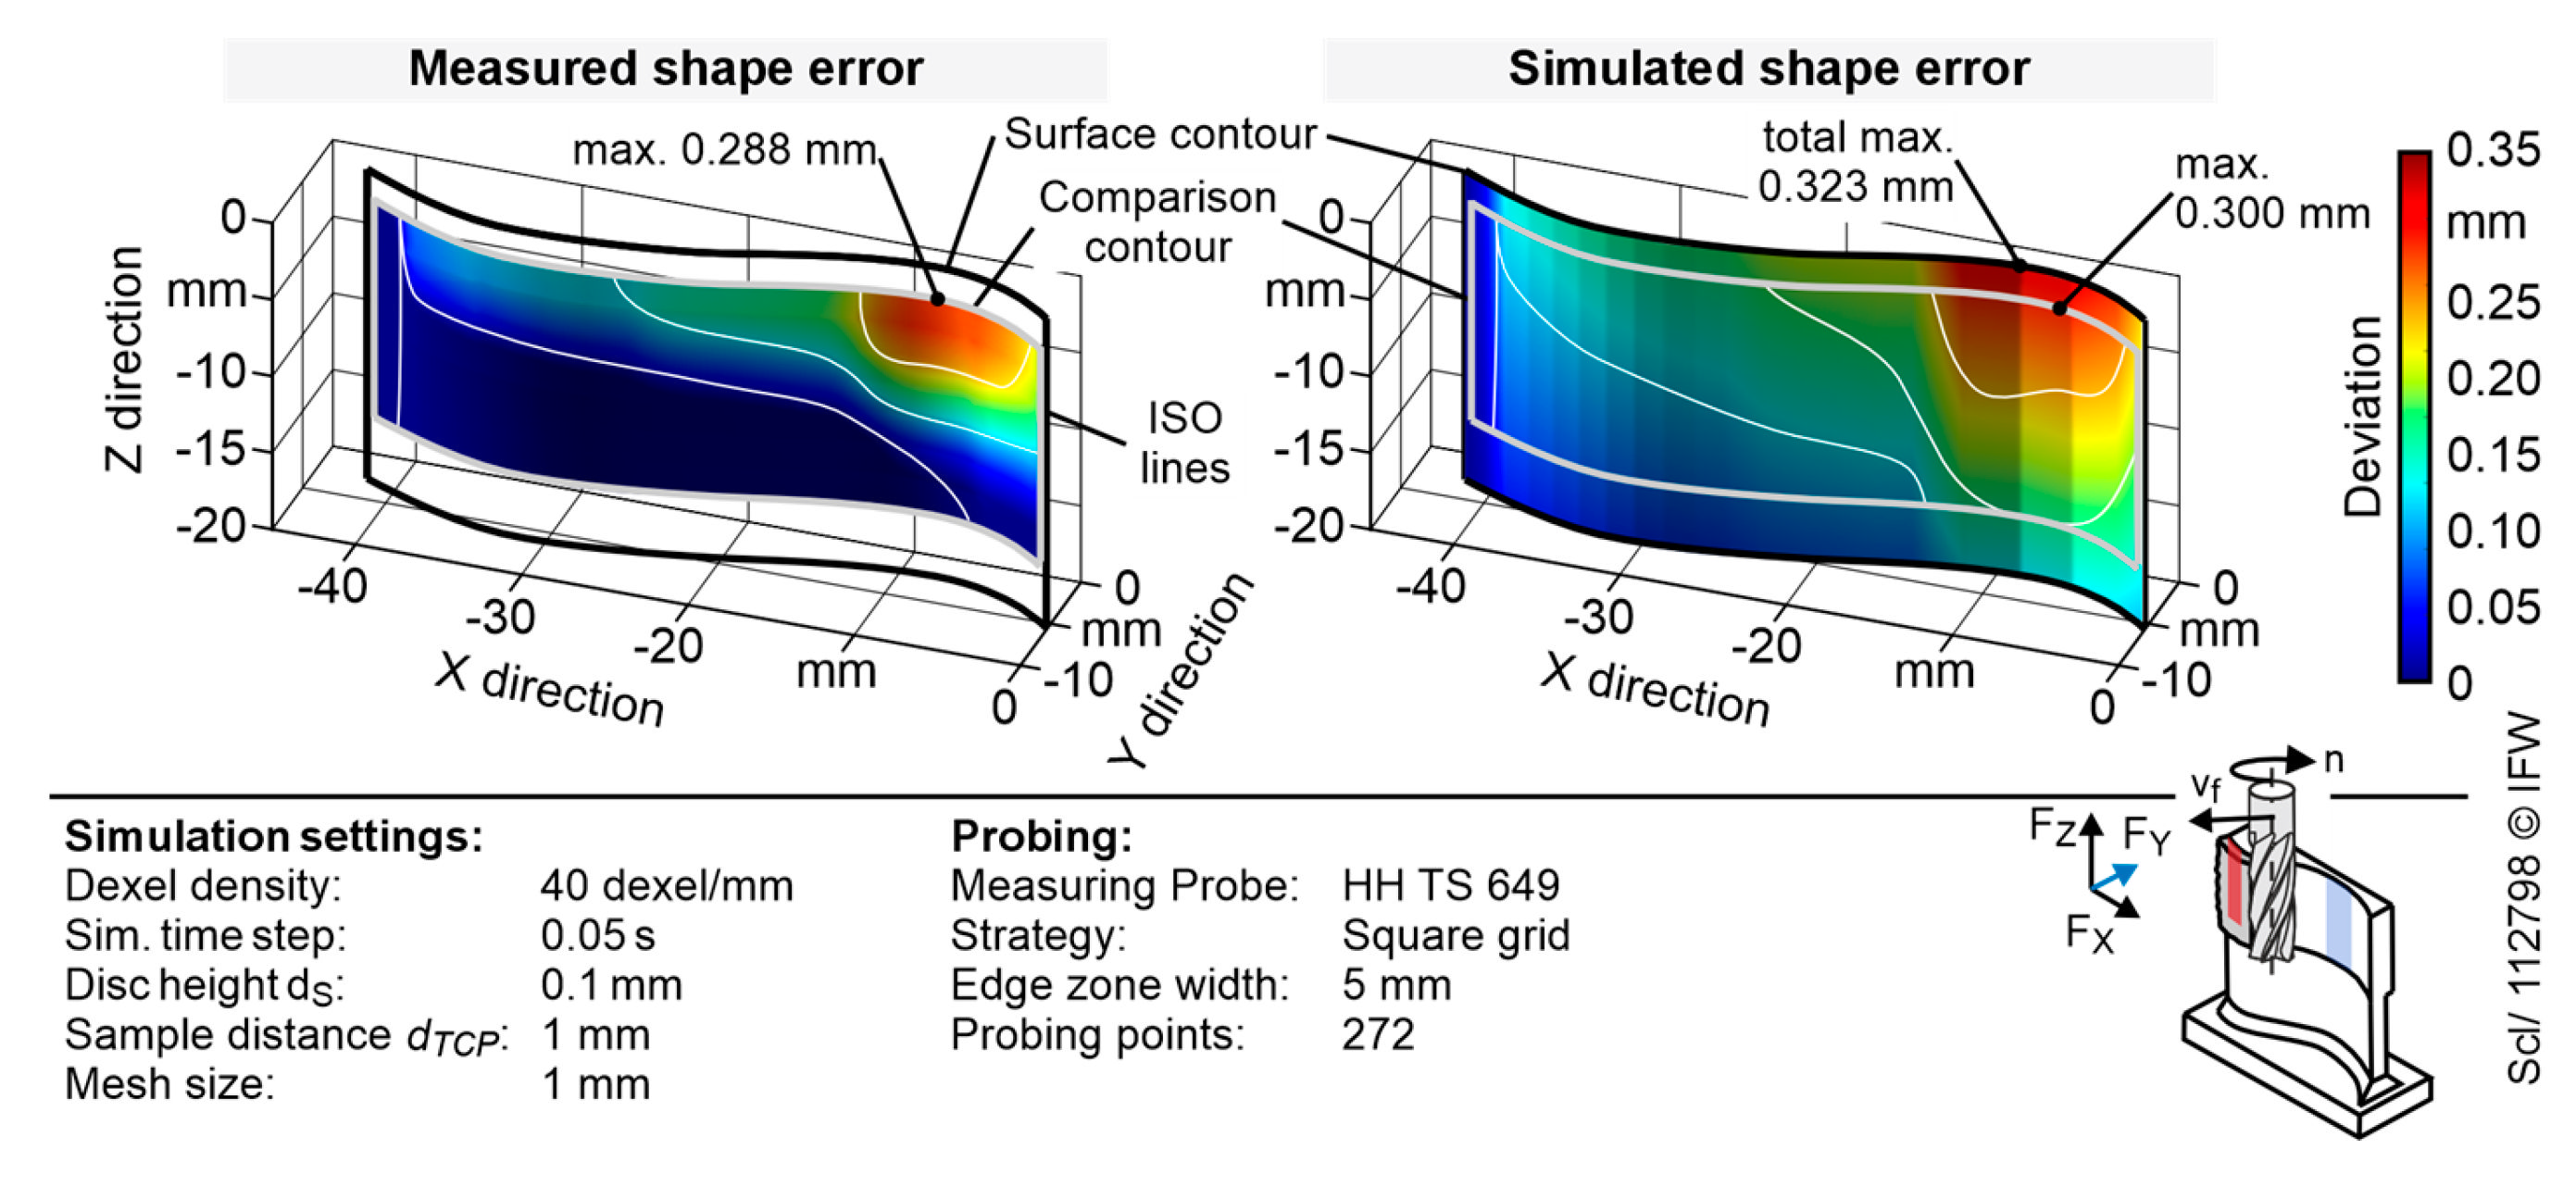
Figure 14.
Calculation of effective process forces from geometry measurement data.
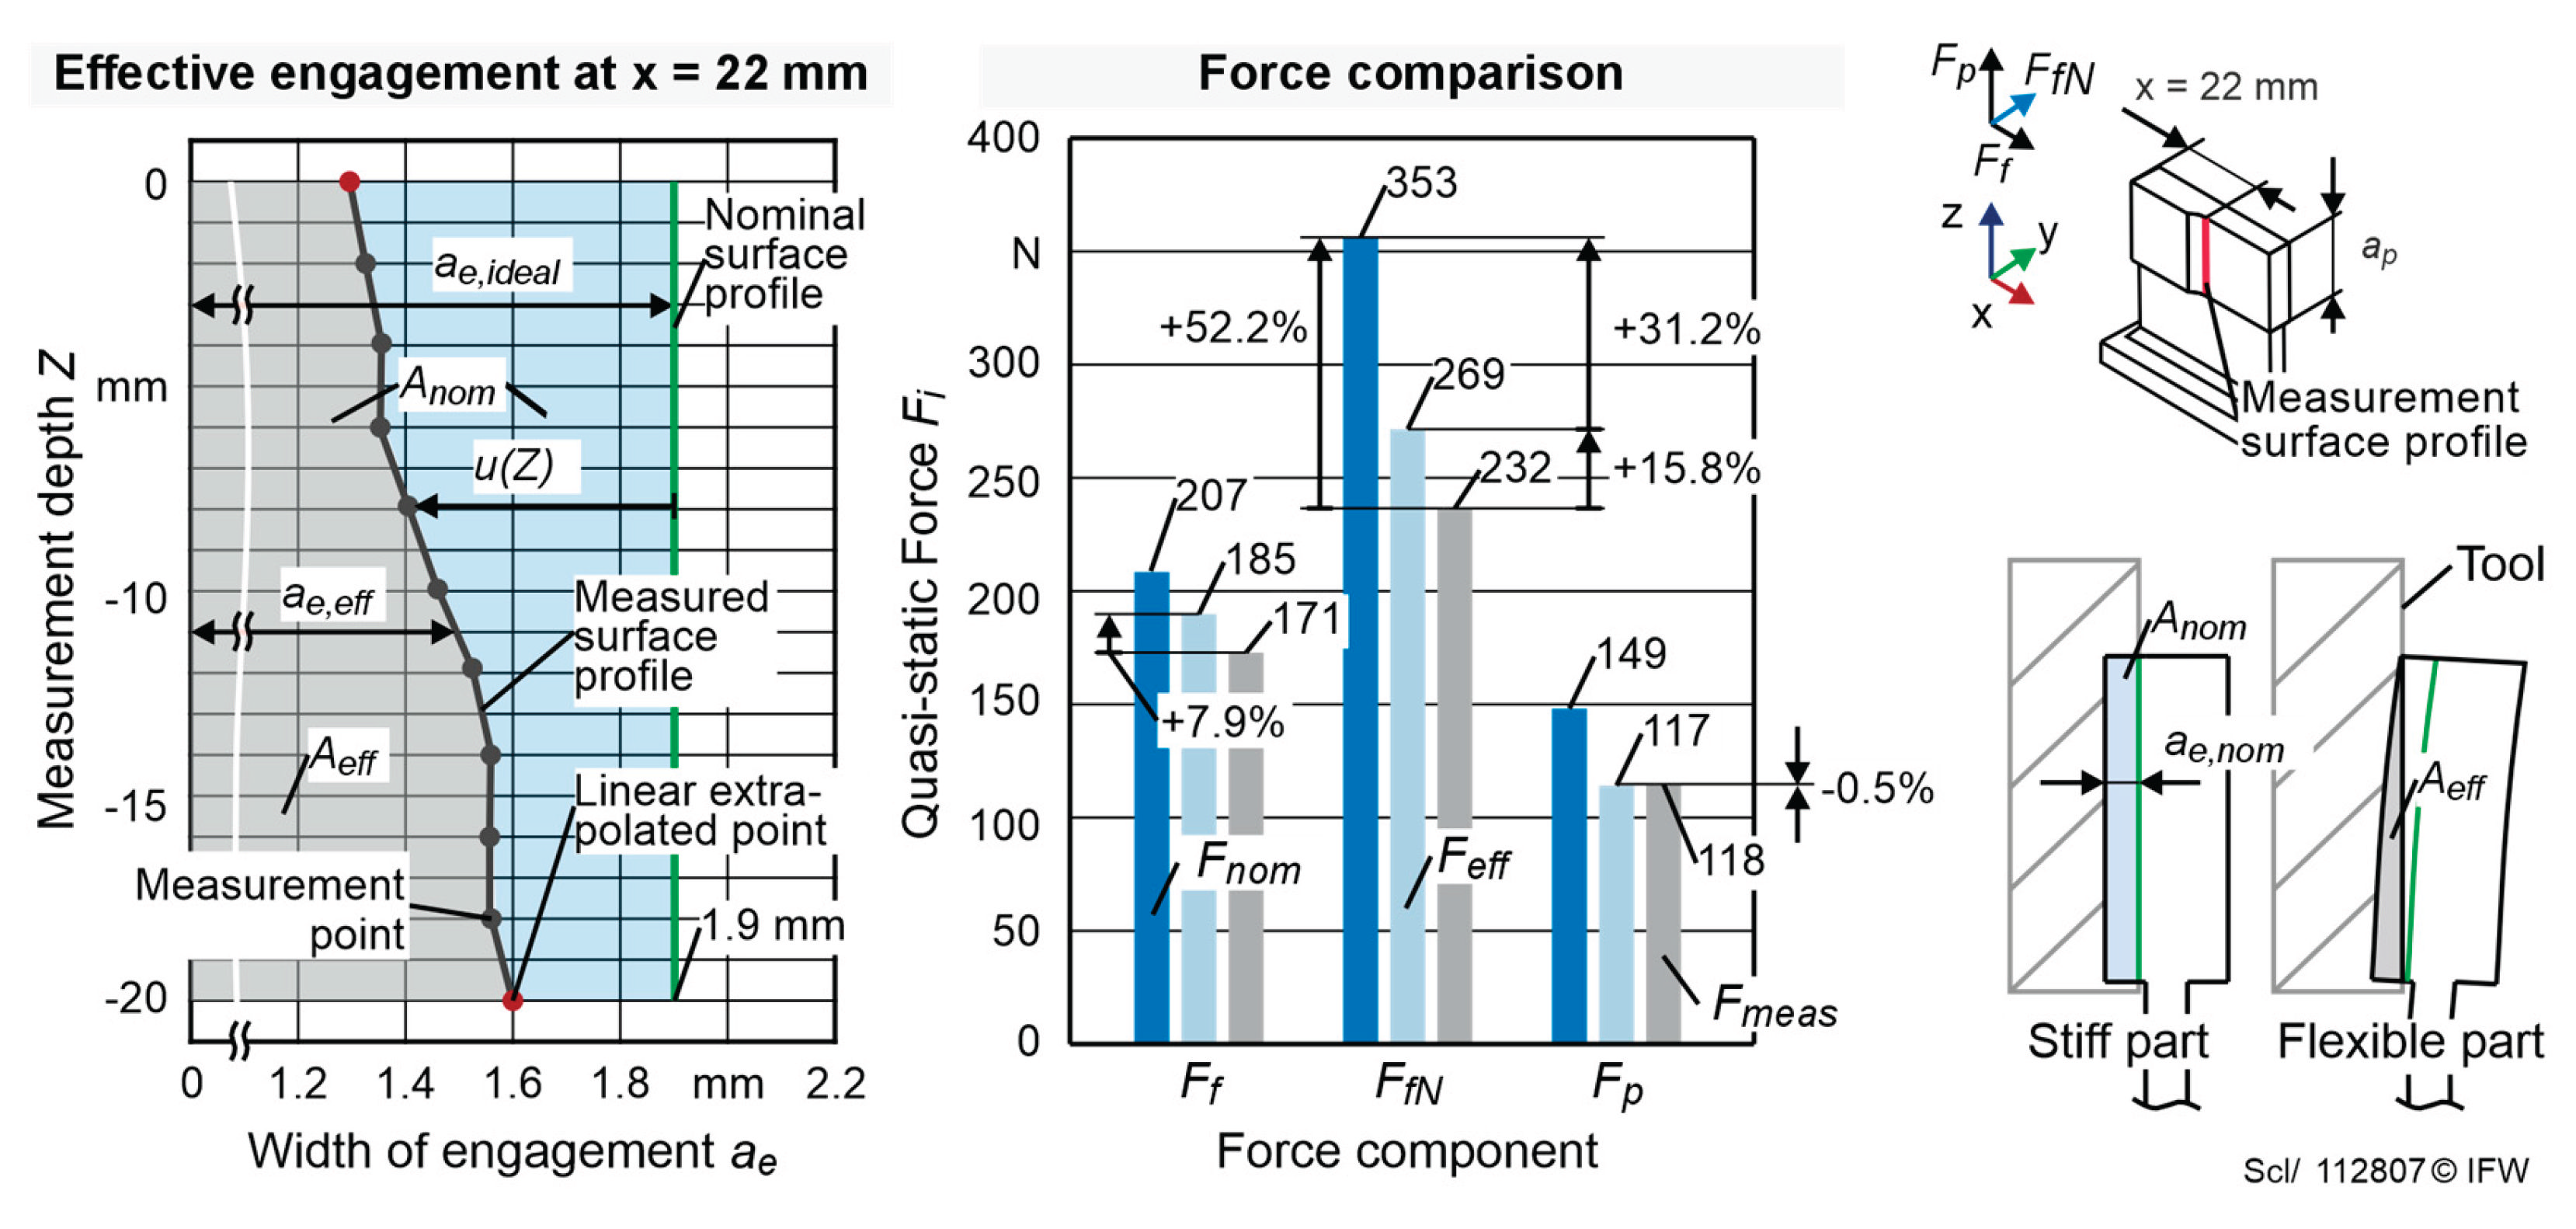
Table 1.
Process parameters for parametrising the force models.
| Process parameters | Peripheral milling range | Face milling range |
| Cutting speed vc [m/min] | 121, 202, 283, 377 | 121, 202, 283, 377 |
| Feed per tooth fz [mm] | 0.023, 0.046, 0.069, 0.093 | 0.023, 0.046, 0.069, 0.093 |
| Width of cut ae [mm] | 0.1, 0.4, 0.7, 1.0, 2.0, 2.9, 3.9 | 1.0, 2.0, 3.5, 5.0 |
| Depth of cut ap [mm] | 1.0, 7.0, 13.0, 20.0 | 0.1, 0.4, 0.7, 1.0, 2.0 |
Table 2.
Measurement strategy for on-machine probing of the specimens.
| Specimens |
Measurement points (x, y) [#] |
Measurement point total [-] | Measurement edge zone width [mm] |
| Beam | 34, 10 | ∑ 340 | 5 |
| Freeform | 34, 8 | ∑ 272 | 5 |
Disclaimer/Publisher’s Note: The statements, opinions and data contained in all publications are solely those of the individual author(s) and contributor(s) and not of MDPI and/or the editor(s). MDPI and/or the editor(s) disclaim responsibility for any injury to people or property resulting from any ideas, methods, instructions or products referred to in the content. |
© 2026 by the authors. Licensee MDPI, Basel, Switzerland. This article is an open access article distributed under the terms and conditions of the Creative Commons Attribution (CC BY) license (http://creativecommons.org/licenses/by/4.0/).
Copyright: This open access article is published under a Creative Commons CC BY 4.0 license, which permit the free download, distribution, and reuse, provided that the author and preprint are cited in any reuse.


