
Submitted:
21 July 2026
Posted:
21 July 2026
You are already at the latest version
Abstract
The rise of urban air mobility (UAM) has made vertiport siting a critical planning problem linking ground and air transport. Conventional location studies typically treat demand as exogenous, capacity as a hard constraint, and vertiports as always available, thereby failing to capture demand feedback, in-facility congestion, and weather disruptions in real operations. This paper develops a demand-endogenous, capacity-coupled, distributionally robust six-objective mixed-integer nonlinear programming model. In-facility delay under graded capacity is characterized by M/M/c queues; a multinomial logit mode-choice mechanism lets demand evolve endogenously with the layout, forming a demand-congestion fixed-point coupling; and a Wasserstein distributionally robust framework adds a worst-case serviceable-reliability objective. To solve the six-dimensional many-objective problem, a reference-point-based improved NSGA-III is designed, featuring a three-layer nested evaluation (outer evolution-middle fixed point-inner robust dual) with evaluation caching and vectorized acceleration (a surrogate model is retained as an optional extension). A case study of Huangpu District, Guangzhou, shows that the proposed algorithm attains the best hypervolume (the combined convergence-diversity metric) at the lowest computational cost, with IGD+ comparable to NSGA-II and superior to standard NSGA-III and MOEA/D. The model further internalizes the self-limiting effect of in-facility congestion on hub over-concentration (a congestion-coverage tension) and quantifies the price of robustness: the guaranteeable worst-case serviceable reliability decreases monotonically as the uncertainty budget grows while nominal coverage remains saturated; it also reveals the significant influence of endogenous demand feedback on the UAM-captured demand and in-facility congestion.
Keywords:
urban air mobility
; vertiport siting
; multi-objective optimization
; NSGA-III
; distribu-tionally robust optimization
; endogenous demand
1. Introduction
In recent years, urban air mobility (UAM) carried by electric vertical take-off and landing (eVTOL) aircraft has been regarded as an important direction for relieving ground traffic congestion and reshaping the three-dimensional mobility pattern of cities. As the core infrastructure linking ground access and low-altitude flight, the spatial layout of vertiports directly determines the service coverage, travel efficiency, construction economy, and operational safety of the UAM system, and is therefore a key element requiring scientific decision-making in the implementation of the low-altitude economy.
Compared with the siting of conventional transport hubs, vertiport layout faces more complex multi-objective conflicts and uncertainties. On the one hand, travelers, operators, and the government/society hold divergent and mutually constraining demands regarding coverage, cost, timeliness, environment, and equity. On the other hand, UAM is still at the pilot stage: demand evolves dynamically with infrastructure supply, limited in-facility capacity induces congestion, and weather conditions significantly affect take-off/landing availability, all of which make deterministic, demand-exogenous classical siting models inadequate. Therefore, constructing a multi-objective optimization model that captures demand feedback, capacity congestion, and weather uncertainty, and designing an efficient many-objective solution algorithm, carry both theoretical significance and engineering value.
Existing research on this topic can be summarized along three lines. The first is facility location and covering models. Since Church and ReVelle proposed the maximal covering location problem, it has become a classical framework for the layout of public facilities and transport hubs [9]; for UAM scenarios, Zeng et al. built an optimization model for vertiport siting in complex urban environments [10]. However, such studies generally treat demand as an exogenous input and capacity as a hard upper bound, and do not characterize the endogenous feedback of demand to the layout or in-facility queuing congestion.
The second is multi-objective evolutionary algorithms and their application to siting. NSGA-II, with its fast non-dominated sorting and crowding-distance mechanism, has become a classical algorithm for multi-objective optimization [1], while MOEA/D pioneered a decomposition-based paradigm [3]. However, when the number of objectives exceeds three, the Pareto dominance relation nearly fails and the selection pressure of NSGA-II decays markedly; to address this, Deb and Jain proposed the reference-point-based NSGA-III for many-objective optimization [2], whose reference points can be generated by the normal-boundary intersection method of Das and Dennis [6], while algorithm performance is commonly evaluated by hypervolume[4] and the Pareto-compliant IGD+ indicator [5]. Few existing UAM siting studies adopt many-objective algorithms for problems with six or more objectives.
The third is demand modeling and optimization under uncertainty. Travel mode choice is usually characterized by McFadden's discrete choice theory [8], but in siting studies it mostly serves as a static, upstream demand input and does not form a coupled closed loop with the layout decision. Regarding uncertainty modeling, the data-driven Wasserstein distributionally robust optimization proposed by Mohajerin Esfahani and Kuhn can, under sparse-sample conditions, construct an ambiguity set centered on the empirical distribution and obtain a tractable dual reformulation [7], providing a theoretical tool for characterizing UAM weather uncertainty; however, it has not yet been applied to modeling the reliability objective of vertiports.
In summary, existing research still leaves clear gaps in four aspects—endogenous demand feedback, characterization of capacity congestion, weather distributional robustness, and many-objective solution—and lacks a modeling and algorithmic framework that unifies these elements. This is precisely the direction this paper seeks to fill.
To address the above gaps, the main contributions of this paper are as follows. First, at the modeling level, queuing theory and discrete choice theory are embedded into the siting model: M/M/c queues characterize in-facility delay under graded capacity, and a multinomial logit mode choice lets demand evolve endogenously with the layout, forming a demand-congestion fixed-point coupling, thereby extending the model from a deterministic mixed-integer linear program to a demand-endogenous mixed-integer nonlinear program. Second, a Wasserstein distributionally robust framework is introduced, adding a worst-case serviceable-reliability objective and providing a closed-form dual expression that can be embedded in the fitness evaluation of evolutionary algorithms, achieving a robust characterization of weather uncertainty. Third, at the algorithmic level, a reference-point-based improved NSGA-III is designed for the six-objective many-objective problem, coupled with an outer-evolution-middle-fixed-point-inner-robust-dual three-layer nested evaluation and assisted by evaluation caching and vectorized acceleration to reduce expensive evaluation cost (a surrogate model is retained as an optional extension). Its effectiveness is then verified through the Huangpu District case study, characterizing the self-limiting effect of capacity congestion on hub over-concentration (the congestion-coverage tension), quantifying the price of robustness, and revealing the significant influence of endogenous demand feedback on the captured demand scale and in-facility congestion level.
The remainder of the paper is organized as follows. Section 2 defines the problem and modeling assumptions; Section 3 builds the demand-endogenous, capacity-coupled distributionally robust six-objective optimization model; Section 4 designs the improved NSGA-III algorithm and the nested evaluation framework; Section 5 conducts an empirical and sensitivity analysis using Huangpu District, Guangzhou, as a case study; and Section 6 summarizes the main conclusions, planning implications, and research prospects.
2. Problem Description and Modeling Assumptions
This study defines the research object, decision content, and optimization demands of the multi-objective vertiport layout optimization problem, and on this basis provides the premises and assumptions required for modeling, laying the foundation for the mathematical model in Section 3. In contrast to conventional siting studies that treat demand as exogenously given, capacity as a hard upper bound, and facilities as always available, this section starts from the real operational characteristics of urban air mobility and explicitly incorporates endogenous demand evolution and availability fluctuations under weather disturbances into the problem scope.
2.1. Problem Description
The essence of vertiport layout optimization is to decide, over a given set of candidate sites, the site selection, the number of facilities to build, and the capacity-level configuration, so that the resulting vertiport network achieves Pareto optimality among multiple conflicting objectives. Specifically, subject to rigid conditions such as airspace safety, land-use compliance, budget constraints, and operational capacity, the decision-maker must answer three progressively nested questions: where to build vertiports (siting), how many to build (scale), and which capacity level to adopt at each (graded configuration).
The complexity of the problem stems from the inherent conflicts among the demands of multiple stakeholders. From the traveler's perspective, vertiports should be as close as possible to trip origins and destinations, door-to-door time as short as possible, and service as reliable as possible; from the operator's perspective, the goal is to obtain the highest possible demand coverage and revenue at the lowest possible construction and operating cost; from the government and society's perspective, negative externalities such as noise and visual intrusion should be controlled, spatial service equity guaranteed, and system resilience under disturbances maintained. These demands can hardly be satisfied simultaneously: expanding coverage tends to raise cost, concentrating on high-demand core areas improves timeliness but aggravates noise and congestion, and pursuing weather robustness requires sacrificing nominal efficiency. Therefore, this problem is modeled as a multi-objective optimization over the candidate site set with six objectives: population coverage, construction cost, response timeliness, system redundancy, environmental impact, and weather-robust reliability.
Crucially, the problem exhibits two endogenous features that traditional models ignore but that are vital for UAM. The first is demand endogeneity: the vertiport layout itself changes the door-to-door generalized travel time, which in turn, through travelers' choice behavior between air and ground modes, alters the scale and spatial distribution of demand captured by the UAM system—demand is no longer a static input but an endogenous variable mutually coupled with the layout. The second is capacity congestion: the final approach and landing areas and the number of parking stands at vertiports are limited, so when demand concentrates on a few hubs, the in-facility queuing delay grows nonlinearly with arrival intensity, transforming capacity from a mere scale upper bound into an operational variable that directly affects the timeliness objective. Together, these determine that the problem cannot be characterized by a deterministic linear model but must be described using queuing theory, discrete choice theory, and distributionally robust optimization.
2.2. Modeling Assumptions
To ensure the model is logically rigorous, tractable, and consistent with the current reality of low-altitude passenger operations, the following assumptions are made prior to modeling from three aspects: space and airspace, demand and operation, and construction and cost.
2.2.1. Space and Airspace
The research object is vertiport layout optimization for low-altitude passenger travel, focusing on passenger scenarios such as peak commuting, business travel, airport access, and emergency medical rescue. It is assumed that the low-altitude airspace in the study area has been opened in a classified and graded manner, that compliant routes allow straight-line passage, that the low-altitude traffic management system can achieve conflict avoidance and safe scheduling, and that the minimum safe separation for passenger flight is satisfied between sites. The candidate site set is obtained through prior suitability evaluation, all satisfying rigid conditions such as airspace safety, land-use compliance, and ecological and noise constraints, and can be directly used as the optimization candidate set; the constraint boundaries of land, planning, and airspace remain stable during the planning horizon and undergo no major adjustment. It should be noted that this section no longer assumes that sites are always available during operation, but instead accounts for availability fluctuations caused by weather events such as strong crosswinds, low visibility, and precipitation, which are characterized in Section 3 using a distributionally robust optimization framework.
2.2.2. Demand and Operation
The potential OD distribution obtained from travel demand forecasting is taken as the demand baseline, with clear morning/evening tidal peak characteristics and a total volume that is relatively stable over the planning horizon. In contrast to conventional siting models that treat demand as exogenously given and assume passengers always choose the nearest site, this paper assumes that travelers choose probabilistically between UAM and ground modes according to the principle of minimum generalized travel cost and a multinomial logit model, so that the demand actually captured by the UAM system and its allocation among sites evolve endogenously with the layout. Meanwhile, the final approach and landing areas and the number of parking stands at each grade of vertiport are limited, and the in-facility queuing delay grows nonlinearly with arrival intensity. The service radius, take-off/landing capacity, service rate, and technical parameters of different vertiport grades are set with reference to current eVTOL passenger airworthiness standards and engineering practice, with stable performance that meets regional route range requirements.
2.2.3. Construction and Cost
It is assumed that the construction and operating costs of each site grade conform to current engineering quotas, without considering external shocks such as inflation or drastic land-price fluctuations, and that the optimized siting is feasible at the levels of land-use approval and construction implementation. The model optimizes only site location, quantity, and grade configuration, without involving in-facility micro-design; apart from the nonlinear terms related to queuing delay, endogenous demand, and weather robustness, all other constraints and objectives are set on a spatially explicit basis and the safety baseline of passenger operations. These assumptions are consistent with the current reality of the low-altitude passenger pilot stage—sparse samples and as-yet-undetermined demand and operating patterns—while reasonably simplifying system complexity and preserving the engineering reference value of the optimization results.
3. Demand-Endogenous, Capacity-Coupled Distributionally Robust Multi-Objective Optimization Model
This paper constructs a multi-objective layout optimization model for the urban vertiport network. In contrast to the deterministic treatment in conventional siting studies that regard demand as exogenously given, capacity as a hard upper bound, and facilities as always available, this section starts from the real operational characteristics of urban air mobility (UAM) and embeds queuing theory, discrete choice theory, and distributionally robust optimization into a unified optimization framework. On the one hand, queuing delay under graded capacity characterizes in-facility congestion, and a multinomial logit mode choice lets demand evolve endogenously with the layout, the two forming a demand-congestion fixed-point coupling; on the other hand, a Wasserstein distributionally robust framework characterizes site availability fluctuations under weather disturbances, adding a worst-case serviceable-reliability objective. Thus, the model is extended from a conventional mixed-integer linear program (MILP) to a demand-endogenous, capacity-coupled six-objective mixed-integer nonlinear program (MINLP).
3.1. Sets and Parameter Notation
Let the candidate site set be V, the demand point set be D, the noise- and safety-sensitive point set be N, the vertiport function type set be T = {traf, emer, med, gov}, and the capacity level set be L = {1, 2, 3}. The core decision variables of the model include: the siting binary variable yi, indicating whether candidate site i is built; the type-grade assignment variable z{i,t,l}, indicating whether site i is built as type t and grade l; and the coverage-allocation variable x{ik}, indicating whether demand point k is served by site i. The main parameters are summarized in Table 1. Hereafter, t and l denote the type and grade adopted by site i.
3.2. Objective Function System
Integrating the demands of operators, the government, and travelers, the model sets six mutually conflicting optimization objectives. Objective 1 maximizes the weighted population coverage, so that as many weighted demand points as possible are served:
(1)
Objective 2 minimizes the total construction cost, reflecting economic efficiency under fiscal constraints:
(2)
Objective 3 minimizes the weighted response time including in-facility queuing, which, beyond conventional access and flight times, accounts for the queuing waiting delay that grows nonlinearly with demand intensity; its specific form is given in Section 3.3.
(3)
Objective 4 minimizes negative environmental and social impacts, integrating the externalities of land occupation, noise, and disturbance to sensitive points:
(4)
Objective 5 maximizes the expected serviceable demand under the worst-case distribution of weather disturbances; its definition and dualization are given in Section 3.4. Here f1, f3, and f5 are maximized, while f2 and f4 are minimized; for unified treatment, the maximization objectives are negated and converted to minimization during evolutionary solution.
3.3. Demand-Endogenous Capacity Queuing and Generalized Travel Cost Modeling
Traditional models measure timeliness by the sum of access and flight times from candidate sites to demand points, implicitly assuming ideal conditions of unlimited site service capacity and passengers departing immediately upon arrival. However, in real UAM operations, the final approach and landing areas (FATOs) and the number of parking stands at vertiports are limited, morning/evening tidal demand is highly concentrated, and the in-facility queuing waiting delay is non-negligible and amplified nonlinearly with demand intensity; more importantly, the layout itself changes the door-to-door generalized travel time and, through travelers' mode-choice behavior, feeds back to the demand scale. Therefore, this section embeds queuing theory and discrete choice theory into the model, constructing a closed-loop feedback mechanism of layout-generalized time-mode share-demand.
3.3.1. Queuing Delay Under Graded Capacity
Each grade of vertiport is regarded as an M/M/c queuing system with c{t,l} parallel servers (number of FATOs/stands) and unit service rate mu{t,l}. Let the arrival rate allocated to site i be lambdai; then Objective 3 adds, on top of access and flight time, a queuing waiting delay Wi coupled with the capacity grade:
(5)
The queuing waiting delay W_i is given by the steady-state solution of the M/M/c queue, where rhoi is the system utilization:
(6)
Here C(c, rho) is the Erlang-C formula, denoting the probability that an arriving customer must wait in queue:
(7)
To ensure the existence of a steady state and a bounded waiting delay, a stability constraint is imposed, requiring the total arrival rate allocated to any site to be strictly less than the total service capacity of its built grade:
(8)
This constraint transforms capacity from a mere hard upper bound in traditional models into a continuous variable that directly enters the timeliness objective: when demand over-concentrates on a few high-grade hubs, rhoi approaches 1 and Wi diverges sharply, forcing the model to trade off between scaled concentration and dispersed deployment, thereby endogenously characterizing the congestion effect of the UAM system.
3.3.2. Demand Endogenization via Logit Mode Choice
Changes in the door-to-door generalized travel cost reshape travelers' choice behavior between UAM and ground modes. Assuming that travelers at demand point k choose probabilistically among reachable vertiports and the ground mode according to the principle of minimum generalized cost and a multinomial logit (MNL) model, the probability of choosing site i is:
(9)
Here theta is the traveler's sensitivity parameter to generalized time (demand elasticity coefficient), taukg is the generalized travel time of the ground mode, and tau{ik} is the UAM door-to-door generalized travel time via site i, covering access, flight, egress, in-facility queuing, and monetized fare:
(10)
Consequently, the demand actually captured by the UAM system, d-hatk, and the arrival rate lambdai allocated to site i both become endogenous functions of the layout scheme:
(11)
Note that lambdai affects the queuing delay Wi, Wi in turn affects the choice probability P{ik} via tau{ik}, which then feeds back to lambdai; the three form a fixed-point coupling. Therefore, a fixed-point iteration must be embedded in the fitness evaluation of the algorithm to solve for the self-consistent demand-congestion equilibrium:
(12)
Here Phi is the fixed-point mapping composed of Eqs. (9)-(11), and e_lambda is the convergence tolerance. This inner iteration usually converges within a few steps, and its existence is guaranteed by Brouwer's fixed-point theorem (the mapping is continuous and maps a compact convex set into itself). This mechanism reveals a self-reinforcing-self-inhibiting effect that deterministic models cannot capture: high-quality sites increase mode share and arrival rate, but simultaneously raise the in-facility queuing delay and suppress their own attractiveness, so the system ultimately converges to an endogenous equilibrium.
3.4. Distributionally Robust Reliability Objective for Weather Uncertainty
eVTOL take-off and landing depend heavily on meteorological conditions; weather events such as strong crosswinds, low visibility, and precipitation cause specific sites to lose availability during specific periods, leading to unfulfilled demand and reduced service reliability. The preceding objective functions are all built on the nominal assumption of certain meteorological conditions and always-available sites, making it difficult to characterize the robustness of a plan under weather disturbances. Considering that UAM is still at the pilot stage with sparse historical meteorology-operation samples whose true probability distribution is hard to estimate precisely, this section adopts a distributionally robust optimization (DRO) framework, constructing a Wasserstein ambiguity set centered on the empirical distribution and adding a sixth optimization objective—maximizing the expected serviceable demand under the worst-case distribution.
Let the site availability random vector be xi = (xi1, ..., xi{|V|}), where xi in {0,1} indicates whether site i is available under weather disturbance. The sixth objective function f5 is defined as the expected serviceable demand under the worst-case distribution within the ambiguity set P:
(13)
The ambiguity set P is defined as a 1-Wasserstein ball of radius e centered on the empirical distribution P-hatN constructed from N historical meteorological samples:
(14)
The 1-Wasserstein distance measures the optimal transport cost between two distributions:
(15)
The radius e is the weather uncertainty budget, characterizing the decision-maker's degree of conservatism toward distribution shift: when e = 0 the model degenerates to the stochastic expectation based on the empirical distribution (risk-neutral), and the larger e is, the stronger the defense against distributional ambiguity. Directly solving the inner min is an infinite-dimensional optimization and is intractable. Using the strong duality theorem of Wasserstein DRO, the inner worst-case expectation can be equivalently transformed into a finite-dimensional convex dual problem:
(16)
Here eta is the dual variable (corresponding to the Lipschitz modulus), and g(xi) is the negative of the serviceable demand. Since xi is a binary availability vector and the serviceable demand is linear in xi, the above dual can be further simplified into a closed-form expression embeddable in evolutionary-algorithm evaluation. When the Wasserstein-infinity or an equivalent budgeted uncertainty-set approximation is adopted, the worst case can be interpreted as the robust counterpart allowing at most kappa = ceil(e|V|) sites to fail simultaneously, and its worst-case serviceable demand is given by the total service volume minus the service volumes of the kappa largest-contributing sites:
(17)
Here si is the service volume of site i, and Vkappa is the set of the kappa sites with the largest service volumes. This closed-form solution reduces the evaluation complexity of f6 to O(|V| log|V|) (a single sort), enabling efficient computation in the massive fitness evaluations of multi-objective evolution and balancing theoretical rigor with engineering tractability.
3.5. Constraints
The model must satisfy the following constraints. Eq. (18) is the unique-assignment constraint, ensuring each selected site has exactly one type-grade combination; Eq. (19) limits the number of built sites to at most m; Eq. (20) is the budget constraint, keeping total construction cost within budget B; Eq. (21) couples the coverage and allocation variables, ensuring each demand point marked as covered has at least one allocation source; and Eq. (22) is the service-radius constraint, allowing allocation only when the site is built at the corresponding type-grade and the demand point lies within the service radius.
(18)
(19)
(20)
(21)
(22)
In addition, the model must satisfy: the capacity stability constraint (Eq. (8), ensuring queuing steady state); the land-area constraint (the minimum footprint of the selected grade does not exceed the available area of the site); the hard-exclusion-zone constraint (siting is prohibited in legally restricted areas); the flight-track crossing constraint (approach and departure tracks do not cross hard exclusion zones); the sensitive-point cumulative-disturbance upper-bound constraint (the cumulative noise impact on sensitive objects such as schools and hospitals does not exceed a threshold); the prior-feasibility constraint (decisions are made only over legally and land-use-permitted type-grade combinations); and the variable-domain constraint (each decision variable takes values in the corresponding binary or nonnegative real domain). These constraints, together with the objective functions in Section 3.2, Section 3.3 and Section 3.4, constitute the demand-endogenous, capacity-coupled distributionally robust six-objective MINLP model.
4. Improved NSGA-III Algorithm for the Many-Objective Problem
The constructed model is a demand-endogenous, capacity-coupled five-objective mixed-integer nonlinear program whose decision variables combine discrete siting attributes and continuous grade configuration, whose constraints cover multi-dimensional rigid requirements such as construction scale, budget, capacity stability, and operational service, and whose fitness evaluation embeds demand-congestion fixed-point solution and distributionally robust duality—a typical high-dimensional, strongly constrained, evaluation-expensive multi-objective combinatorial optimization problem. Classical NSGA-II relies on Pareto dominance and crowding distance to maintain population diversity; when the number of objectives exceeds three, the vast majority of individuals in the population are mutually non-dominated, the dominance relation nearly fails, selection pressure decays sharply, and both convergence and diversity deteriorate, making it inadequate for many-objective optimization with four or more objectives. Therefore, on the basis of NSGA-II's fast non-dominated sorting and elitism framework, its diversity-maintenance mechanism is upgraded to reference-point-based NSGA-III, and—targeting the expensive-evaluation characteristics of 40 candidate sites and 24 time-sliced demand units—heuristic initialization, centroid-guided mutation, constraint penalty, exact evaluation caching, and vectorized evaluation acceleration are designed, forming an improved NSGA-III algorithm suited to the many-objective siting problem.
4.1. Population Encoding and Heuristic Initialization
To achieve an effective mapping between decision variables and genetic operators, a segmented integer encoding is adopted: each individual is composed of the build status and grade configuration of the candidate sites, with the i-th gene taking a value in {0, 1, ..., |L|}, where 0 denotes not building and a nonzero value denotes building at the corresponding grade. This unifies the siting variable yi and the type-grade variable z{i,t,l} in a single chromosome, avoiding the inconsistent individuals easily produced by separate encoding of the two.
Random initialization readily produces many infeasible individuals under strong constraints, leading to low early search efficiency. Therefore, a composite suitability score Si is constructed from the availability, demand accessibility, and risk level of candidate sites, and a heuristic initialization is designed accordingly: using the composite suitability score Si as weight, sites are preferentially deployed in high-suitability areas via roulette-wheel selection, and the initial probability of site i being built in an individual is:
(23)
Here Si is the suitability score of site i and V is the candidate site set. This strategy makes the initial population more concentrated in the feasible region while satisfying the site-number and budget constraints, markedly improving the feasible-solution proportion of the initial population and subsequent search efficiency.
4.2. Reference-Point-Based Selection Mechanism
NSGA-III uses a set of structured reference points instead of crowding distance as the basis for diversity maintenance. First, the Das-Dennis normal-boundary intersection (NBI) method generates a uniformly distributed reference-point set Z on the normalized hyperplane; for M objectives with each dimension divided into p segments, the total number of reference points is:
(24)
After the population is divided into non-dominated fronts F1, F2, ... by fast non-dominated sorting, for candidate individuals in the critical front, a normalized hyperplane is first constructed using the ideal point zmmin and extreme points of each objective, the objective values are adaptively normalized, and then the perpendicular distance of each individual to each reference direction w is computed and the individual is associated with the nearest reference point:
(25)
Here f-tildem is the normalized m-th objective value, am is the intercept of the hyperplane on the m-th axis, and dperp(s, w) is the perpendicular distance of individual s to reference direction w. In environmental selection, a niche-preservation operation counts the number of individuals rhoj already associated with each reference point, and individuals are preferentially selected from the neighborhood of the reference point with the fewest associated individuals to fill the next generation:
(26)
This mechanism explicitly maintains the uniform spread of solutions along reference directions in the multi-dimensional objective space, overcoming the failure of NSGA-II's crowding distance in high-dimensional objective spaces. The empirical study adopts a Das-Dennis division of p = 4, generating H = C(6+4-1, 4) = 126 reference points; to avoid niche-selection distortion caused by a population size smaller than the number of reference points, the population size is set to N = 160, satisfying N >= H.
4.3. Constraint Handling and the Penalty-Evaluation Nested Structure
For the model's multi-dimensional rigid constraints, a dynamic-penalty idea is adopted: for individuals violating constraints such as airspace safety separation, no-fly zones, budget, and capacity stability (Eq. (8)), the penalty strength increases with the iteration progress, and the degree of constraint violation is incorporated into the fitness:
(27)
Here cv(x) is the violation of the v-th constraint, Psi(g) is a dynamic penalty factor increasing monotonically with iteration count g, G is the maximum number of iterations, and alpha is the penalty-growth exponent. The penalty is weak in early iterations to maintain population diversity and allow the algorithm to traverse infeasible regions, and increases sharply in later iterations to drive the Pareto front toward the feasible region. It should be noted that, for simplicity and numerical stability, the numerical implementation adopts a fixed-scale penalty weighted by the worst-case magnitude of each objective's dimension (i.e., Psi is taken as a constant); the progress-increasing dynamic penalty in Eq. (27) can be regarded as its generalization.
Unlike deterministic models, the fitness evaluation of this problem is itself a nested process. Each individual evaluation must first execute the demand-congestion fixed-point iteration of Section 3 (Eqs. (9)-(12)) to obtain the self-consistent arrival rate lambda and captured demand d-hatk, and then compute the queuing-inclusive objective f3; for the robust reliability objective f4, the worst-case serviceable demand is obtained within O(|V| log|V|) via the Wasserstein dual closed-form solution of Section 3.4 (Eq. (17)). This forms the outer-evolutionary-search-middle-fixed-point-equilibrium-inner-robust-dual three-layer nested evaluation framework, as shown in the evaluation flow of Eq. (28):
| (28) |
Here the outer layer generates candidate individuals via evolutionary operators, the middle layer solves the demand-congestion equilibrium, and the inner layer solves the distributionally robust worst case; the three layers are invoked level by level from outer to inner and return fitness level by level from inner to outer.
4.4. Expensive-Evaluation Caching and Vectorized Acceleration
Since each fitness evaluation must solve the demand-congestion fixed-point equilibrium, its computational cost is markedly higher than that of deterministic models, and 40 candidate sites and 24 time-sliced demand units further amplify the evaluation cost. The current numerical implementation adopts two exact acceleration strategies. First, an evaluation cache keyed on the integer-encoded site-grade vector and the model configuration directly reuses the six objective values and constraint violations for layout schemes that recur during evolution, avoiding repeated fixed-point solution. Second, in the fixed-point iteration, the service-radius reachability check between built sites and demand units is changed from a per-site loop to array-based Boolean operations, while retaining the O(|V| log|V|) closed-form sorted solution of the Wasserstein robust objective. These treatments do not change the meaning of the objective functions or constraints but significantly reduce the repeated-evaluation cost in a pure-Python environment.
(29)
In larger-scale or paper-level repeated experiments, a Kriging (Gaussian process) surrogate model can be further introduced as an extended acceleration module. The Gaussian process, using individuals with completed true evaluations as samples, provides predictive means and predictive variances for the expensive objectives f3 and f6:
(30)
Here f* is the current best value, and Phi and phi are the cumulative distribution function and probability density function of the standard normal distribution, respectively. The surrogate-assisted version can trigger true fixed-point evaluation only for individuals with large EI (high predictive uncertainty or large expected improvement), pre-screening the rest with surrogate predictions; the current code implementation is based mainly on exact evaluation caching and vectorized acceleration, with the Kriging surrogate as an extensible module for subsequent large-scale batch experiments.
4.5. Overall Algorithm Flow
Integrating the above improved operators, the overall solution flow of the improved NSGA-III is as follows:
Step 1 (Initialization): Generate an initial population of size N = 160 according to the heuristic strategy of Eq. (23), and generate the Das-Dennis reference-point set Z with p = 4, ensuring the population size is not smaller than the number of reference points; initialize the evaluation cache.
Step 2 (Fitness evaluation): For each individual, first query the evaluation cache; on a miss, execute the three-layer nested evaluation—the middle layer solves the demand-congestion fixed-point equilibrium to obtain lambda and d-hatk, the inner layer solves the distributionally robust dual to obtain f5—incorporate the constraint penalty according to Eq. (27), and then write the exact evaluation result into the cache.
Step 3 (Genetic operations): Perform crossover and centroid-guided mutation to generate offspring. The implementation adopts simulated binary crossover (SBX) with a fixed crossover probability (Pc = 0.9); as an extensible improvement, the crossover probability can be adaptively adjusted with the fitness difference between individuals, lowering Pc for superior individuals to protect their gene structure. Centroid-guided mutation, when mutation occurs, preferentially shifts a site toward the demand centroid rather than fully random flipping, improving the directionality of the search.
Step 4 (Environmental selection): Merge parents and offspring and perform fast non-dominated sorting; for individuals in the critical front, associate reference points according to Eq. (25) and perform niche preservation according to Eq. (26), selecting N individuals to form the next generation.
Step 5 (Termination check): If the maximum number of evaluations is reached (the implementation baseline is 20,000), terminate and output the non-dominated solution set as the final layout scheme set; otherwise return to Step 2.
4.6. Multi-Algorithm Comparison and Convergence Evaluation Metrics
To objectively evaluate the solution performance of the improved NSGA-III, classical NSGA-II, decomposition-based MOEA/D, and standard NSGA-III are used as benchmark algorithms, running independently under identical candidate site sets, demand inputs, population size, maximum number of evaluations, and random-seed settings. Considering the computational burden from 40 candidate sites, 24 demand units, and fixed-point evaluation, the current implementation baseline is set to 10 independent runs per algorithm; for the final statistical tests in the paper, this can be extended to 30 independent runs within the same parameter framework. Three classes of metrics comprehensively measure algorithm performance. Hypervolume (HV) measures the combined convergence and diversity performance by the objective-space volume enclosed by the non-dominated solution set relative to a reference point; larger is better:
(31)
The enhanced inverted generational distance (IGD+) measures the closeness of the algorithm's solution set to the true front; smaller is better. It penalizes only deviations in the directions dominated by the reference points, and, being Pareto-compliant compared with conventional IGD, is more suitable for performance comparison in high-dimensional objective spaces:
(32)
Here Z is the reference front point set, S is the non-dominated solution set obtained by the algorithm, and d+ counts only the deviation component in the dominated direction. The Spacing metric measures the uniformity of the solution distribution; smaller values indicate a more uniform distribution:
(33)
Here di is the objective-space distance from the i-th solution to its nearest neighbor, and d-bar is its mean. In addition, the paired Wilcoxon rank-sum test is used to determine the significance of the metric differences among algorithms, verifying the effectiveness of the improved strategies in a statistical sense. The algorithm uses the relative fluctuation of HV over several consecutive generations falling below a threshold as the convergence termination criterion.
5. Empirical Study: The Case of Huangpu District, Guangzhou
To verify the effectiveness of the constructed model and the improved NSGA-III algorithm, a case study is conducted using Huangpu District, Guangzhou. As a pioneer demonstration zone for the low-altitude economy and urban air mobility in Guangzhou, Huangpu District features high-density commuting corridors, multi-type functional clusters, and complex airspace constraints, making it a typical scenario for testing multi-objective vertiport layout optimization methods. The study area and data (Section 5.1) and parameter settings (Section 5.2) are introduced in turn, followed by an empirical analysis at three levels: algorithm performance verification and ablation analysis (Section 5.3), layout schemes and result analysis (Section 5.4), and sensitivity analysis (Section 5.5).
5.1. Study Area and Data
The study area is Huangpu District, Guangzhou, with a planning target year of 2030. The district has a long, narrow north-south shape; the southern Lingang economic zone, the central Science City and Yunpu industrial area, and the northern Jiufo and Knowledge City clusters differ markedly in population density, land-use nature, and travel intensity, providing a typical background of spatial heterogeneity for graded layout.
Determination of the candidate site set: based on the suitability evaluation results, the district-wide grid is screened from dimensions such as airspace safety, land-use compliance, and ecology and noise, removing hard exclusion zones and non-buildable units to obtain the candidate site set V satisfying the rigid constraints. The current empirical code reads the longitudes and latitudes of 40 real candidate sites as the optimization decision space, with site grades taking values 0, 1, 2, 3, where 0 denotes not building and 1-3 denote different capacity grades. Figure 1 shows the study area extent, the distribution of functional clusters, and the spatial distribution of candidate sites.
The potential OD distribution of low-altitude passenger travel in Huangpu District, obtained from travel demand forecasting, is taken as the potential demand baseline. The current implementation contains 8 typical OD pairs, each expanded into independent demand units for the morning peak, off-peak, and evening peak, forming 24 demand units in total; each demand unit inherits the spatial anchor of the corresponding OD and adjusts the potential demand intensity by a period coefficient. This treatment reflects demand differences across periods better than statically aggregating the 8 ODs, and allows the spatial value of the 40 candidate sites to be more fully expressed in the optimization. Figure 2 shows the spatial heat distribution of morning, off-peak, and evening tidal demand and the main commuting corridors.
As the reference for UAM in the multinomial logit mode-choice model (Eq. (9)), the door-to-door travel time taukg of each demand point by ground transport must be measured per OD and per period. It is collected in batches via the route-planning API of an electronic map service provider: taking all valid OD pairs in the OD matrix of Section 3 as spatial units, both transit and driving routes are queried, and the smaller of their door-to-door durations is taken as the ground generalized-time baseline. In the time dimension, stratified multi-day sampling rather than a single-day snapshot is adopted to avoid systematic contamination of single-day samples by occasional events (traffic accidents, severe weather, large events); considering that travel times for the same OD in the same period on weekdays are relatively stable, continuous daily sampling over a whole month is unnecessary. Specifically, the collection window spans 2 to 4 weeks, with 10-15 weekday samples collected for each OD pair in each of the morning peak (07:30-09:00), evening peak (17:00-19:00), and off-peak (around 12:00) periods, excluding statutory holidays and abnormal dates such as rainstorms, and the median of the samples for each OD combination is taken as the estimate of taukg to enhance robustness to the congestion long tail.
The sample size is determined by controlling the relative error of the mean estimate. Let the coefficient of variation of travel time for the same OD in the same period be CV, the acceptable relative error be r, and the significance level be alpha; then the required sample size is n ~= (z{alpha/2} * CV / r)^2. The coefficient of variation of urban road travel time is typically between 0.15 and 0.30; taking CV = 0.25 at the 95% confidence level, controlling the relative error within +/-15% requires about 11 samples, and within +/-10% requires about 24 samples. Accordingly, 10-15 weekday samples per OD correspond to an estimation error of about +/-12%-15%, sufficiently reliable for planning-level siting studies; for congested corridors with large travel-time fluctuations (CV close to 0.30), sampling is correspondingly increased to 15-20 weekdays. While collecting taukg, the UAM door-to-door time tau{ik} via each candidate site (including ground access, flight, in-facility queuing, and egress time) is recorded, the two jointly forming the input to the mode-choice model.
The distributionally robust model of Section 3 (Eqs. (3-13)-(3-17)) uses the empirical distribution P-hatN of the site availability random vector xi as the center of the Wasserstein ambiguity set, so historical meteorological observations must be converted into binary availability samples. The collected meteorological variables are determined by the eVTOL operational meteorological thresholds, mainly including hourly wind speed and gusts, horizontal visibility, and precipitation intensity, supplemented by strong-convection indicators such as cloud-base height and thunderstorms. The availability rule is: for any historical time t and candidate site i, if all meteorological variables satisfy the operating conditions at that time, then xii(t) = 1 (available); if any of sustained wind speed, gusts, visibility, precipitation, or thunderstorm breaches the grounding threshold (conservatively set in this study as sustained wind > 12 m/s, gusts > 15 m/s, visibility < 1.5 km, precipitation at moderate rain or above, or thunderstorm occurrence), then xii(t) = 0 (unavailable). Only times relevant to UAM operating hours (e.g., 06:00-22:00 daily) are retained; traversing all historical times yields N availability vectors whose collection constitutes the empirical distribution P-hatN. To reflect spatial heterogeneity among sites, the wind-speed and visibility thresholds are fine-tuned according to each site's proximity to the river, terrain height, and openness, so that riverside high-wind or high-rise sites are more likely to trigger grounding than inland sites under the same meteorological conditions.
The sample size is determined by the periodicity of the meteorological process rather than the number of collection days. Given the pronounced seasonality (spring gales, summer strong-convection thunderstorms, autumn-winter low visibility and haze) and interannual variability of meteorological conditions, the collection time span must cover a complete annual cycle, using hourly observation series from the past 3-5 years to smooth interannual differences. At 16 operating hours per day, one year yields about 5,800 time samples and three years about 17,000, sufficient to support the empirical-distribution estimation of the Wasserstein ambiguity set; by distributionally robust optimization theory, the larger the sample size N, the closer the empirical distribution approximates the true distribution, and the smaller the Wasserstein radius e can correspondingly be taken. Meteorological data sources include hourly observations from national-level ground stations of the China Meteorological Data Network, aviation meteorological reports from Baiyun Airport and others, and ECMWF's ERA5 reanalysis data; ERA5 can be interpolated by the longitude and latitude of each candidate site to obtain a spatially continuous meteorological series, facilitating the natural generation of availability differences among sites, and is the recommended data source for constructing the spatial heterogeneity of xi.
5.2. Parameter Settings
The main parameter settings of the model and algorithm are shown in Table 2. Among them, the algorithm parameters (population size, reference-point division, maximum number of evaluations, number of independent runs, crossover and mutation probabilities, etc.) are set uniformly across algorithms to ensure fair comparison; the model parameters (service radius, capacity and service rate, budget, Wasserstein radius e, and Logit time sensitivity theta, etc.) determine baseline values based on eVTOL engineering practice and literature, with e and theta serving as the core variables of the sensitivity analysis in Section 5.5.
It should be noted that urban air mobility is still in the early pilot stage, with no field data from large-scale passenger operations available for parameter calibration. Therefore, the above capacity, cost, noise, and behavioral parameters are not regressed from field data of Huangpu District, but are taken as the midpoints of reasonable ranges given by eVTOL specifications, vertiport design standards (such as the U.S. FAA Engineering Brief EB-105 and the EASA PTS-VPT-DSN prototype technical specification), and travel-behavior literature—scenario assumptions for the early planning stage rather than field calibration. Specifically, the number of servers and service radius are set according to graded design standards combined with the long, narrow north-south spatial scale of Huangpu District; the service rate is back-calculated from the FATO occupancy time per movement; the construction cost is estimated in three tiers of existing-rooftop retrofit, medium-scale new build, and hub-level new build; the noise source level is taken from publicly available eVTOL take-off/landing noise measurement ranges and attenuated by the geometric spreading law of a point source; and the time sensitivity theta is taken with reference to the empirical magnitude of the time coefficient in mode-choice models.
To prevent hypothetical parameters from weakening the reliability of the conclusions, this study adopts two measures. First, for parameters with clear dimensions and engineering consensus (such as cruise speed, the noise attenuation law, and algorithm parameters), literature baseline values are taken directly. Second, for the two most uncertain parameters with the greatest impact on results—the demand elasticity coefficient theta and the weather uncertainty budget e—rather than relying on a single value, sensitivity analyses are conducted in Section 5.5.5 and Section 5.5.4, respectively, to examine the robustness of the conclusions to their variation. This strategy of literature values plus key-parameter sensitivity sweeps explicitly incorporates the uncertainty from parameter assumptions into the analysis framework, making the derived regularities (such as the self-limiting mechanism of capacity congestion on concentration and the price of robustness) independent of any specific parameter set, and thus methodologically credible even without field calibration.
5.3. Algorithm Performance Verification and Ablation Analysis
Before applying the improved NSGA-III to the empirical layout of Huangpu District, its convergence, diversity, and robustness on this study's six-objective, demand-endogenous, distributionally robust problem must first be verified. Using classical NSGA-II, decomposition-based MOEA/D, and standard NSGA-III as benchmarks, each algorithm is run independently 10 times under identical settings of 40 candidate sites, 24 time-sliced demand units, population size, and maximum number of evaluations at the current implementation baseline; for final statistical testing in the paper, this can be extended to 30 independent runs. Verification is carried out at three levels: convergence curves, comprehensive metrics, and ablation experiments.
5.3.1. Convergence Curves and Metric Comparison
Figure 3 shows the evolution curves of hypervolume (HV) versus the number of evaluations for the four algorithms. The improved NSGA-III has the fastest HV convergence, the highest final mean (0.592), and the smallest post-convergence fluctuation (standard deviation 0.013); classical NSGA-II is second (0.581), and standard NSGA-III is 0.532, all markedly higher than MOEA/D—whose decomposition weight directions are mismatched with the dimensional differences of the objectives, giving the lowest HV (only 0.075) and clearly lagging convergence. This indicates that in the six-dimensional objective space, MOEA/D's decomposition framework struggles to maintain convergence pressure due to the mismatch between weight directions and objective dimensions; both Pareto-dominance-based NSGA-II and reference-point-based NSGA-III maintain stronger convergence, while the improved NSGA-III, benefiting from heuristic initialization and cache-vectorized acceleration, further outperforms standard NSGA-III and classical NSGA-II in convergence speed and final HV.
Table 3 summarizes the HV, IGD+, and Spacing metrics and average running time (mean +/- standard deviation) of each algorithm over 10 independent runs. The improved NSGA-III attains the best mean HV (0.592) with the smallest standard deviation, while also having the shortest average running time (about 135 s, markedly faster than the about 205 s of classical NSGA-II and standard NSGA-III), reflecting the benefits of heuristic initialization and cache-vectorized evaluation acceleration; on IGD+ it is on the same order as classical NSGA-II (0.058 vs. 0.040), and on Spacing its value is relatively large because the non-dominated solutions spread more widely along the reference directions. Overall, the improved NSGA-III achieves the best comprehensive convergence-diversity performance (HV) at the lowest computational cost, but does not dominate on the single metrics of pure front approximation (IGD+) and distribution uniformity (Spacing). In paper-level 30-run experiments, the paired Wilcoxon rank-sum test can further determine the significance of HV differences among algorithms.
5.3.2. Ablation Experiment
To clarify the independent contribution of each modeling innovation to the final solution quality, an ablation experiment is designed: taking the full model (demand-endogenous queuing + distributional robustness + improved NSGA-III) as the baseline, a single module is removed in turn and the problem re-solved, comparing the key performance of the Pareto compromise solution, as shown in Table 4. The table takes the Pareto compromise solution as the object and uniformly re-evaluates each configuration under the full model; besides the response time f3 and worst-case serviceable volume f6, a column survivable serviceable volume (n-1) is added, measuring the demand that each configuration's compromise solution can still serve after its busiest built site fails, providing a robustness diagnosis that remains valid for small-scale networks. The results show: for the distributional-robustness ablation, the survivable serviceable volume of the full-model compromise solution is 224.2, markedly higher than the 138.0 of the configuration without distributional robustness—the latter, to reduce cost, instead chooses a more concentrated and cheaper network of one grade-3 plus one grade-2 site (construction cost falling from 3.0x10⁴ to 1.9x10⁴ CNY 10k), whose grade-3 hub, once failed, loses about 70% of its service capacity, confirming that incorporating the distributionally robust objective makes the layout more resilient to single-point failure. After removing demand endogeneity, the response time of the compromise solution under real demand-congestion feedback deteriorates from 6773 s to 6953 s, confirming that the static-OD assumption overestimates the sustainable throughput capacity of hubs. It should be noted that the survivability values of the configurations without demand endogeneity (281.6) and without queuing (282.8), though higher, stem from the systematic overestimation of hub throughput by static-demand and no-queuing assumptions (their nominal total serviceable volumes of 563.4 and 570.7 also exceed the full model's 539.3), an optimistic bias rather than a true robustness improvement; the original f6 is 0 at each configuration's compromise solution because it counts ceil(e*|V|) = 4 sites failing simultaneously (by total candidate count) while the compromise solution builds only 2 sites, so the survivable serviceable volume (n-1) is used as a more appropriate robustness measure at the compromise-solution level.
5.4. Layout Schemes and Result Analysis
5.4.1. Overall Scheme Comparison
From the Pareto solution set obtained by the improved NSGA-III (25 non-dominated solutions in total), five representative schemes—coverage-oriented, cost-oriented, timeliness-oriented, environment-oriented, and compromise—are selected for comparison; their site-grade configurations and six-objective quantitative performance are shown in Figure 4 and Table 5, respectively. The coverage-oriented scheme achieves full-area population coverage (1052.5) with a single grade-3 hub relying on its large service radius, but because the single-point layout lacks secondary-reachability redundancy and the redundancy objective f4 includes a siting-risk penalty term, it takes a negative value (about -23), and its response time is also long (about 10319 s); the cost-oriented and environment-oriented schemes both degenerate to a single grade-1 site, trading the lowest coverage (267.5) for the lowest construction cost (8 million CNY) and the smallest environmental impact (52.6); the timeliness-oriented scheme concentrates 7 grade-3 and 6 grade-2 hubs to achieve the shortest response time (about 4565 s), but with the highest construction cost (1.29x10⁵ CNY 10k) and environmental impact (1120); the compromise scheme achieves a relative balance among objectives with 2 grade-3 sites (coverage 1052.5, cost 3.0x10⁴ CNY 10k, response about 6698 s, redundancy 1029.8). Overall, the five schemes clearly depict the Pareto trade-offs among coverage, cost, timeliness, environment, and robustness.
5.4.2. Analysis of Pareto Front Solutions
A parallel-coordinates plot maps the 25 non-dominated solutions obtained by the search into the multi-dimensional objective space, as shown in Figure 5, where the axes correspond to population coverage, construction cost, response time, redundancy, environmental impact, and robust reliability. By comparing the polyline trends of different planning orientations, the multi-criteria game mechanism in the Huangpu vertiport layout can be quantitatively revealed. First, robust reliability is highly positively correlated with construction cost and environmental impact (correlation coefficients about 0.82 and 0.96, respectively), indicating that worst-case serviceable capacity comes at the price of higher investment and greater environmental negative externalities, confirming the price of robustness at the solution-set level. Second, population coverage is moderately positively correlated with construction cost (about 0.34), indicating that improving coverage requires higher construction investment; while response time and environmental impact are only weakly correlated (about -0.14), with no significant systematic opposition. The compromise solution lies in the median range on all objectives, providing decision-makers with a knee-point scheme that balances multiple demands.
5.5. Sensitivity Analysis
To test the robustness of the plan to key parameters and to uncover the unique insights of demand-endogenous and distributionally robust modeling, the Pareto compromise scheme is taken as the baseline, and the sensitivity to five classes of parameters—cost budget, construction cost, social sensitivity, weather uncertainty budget, and demand elasticity—is examined in turn.
5.5.1. Cost Budget Sensitivity
The evolution of population coverage, average response time, and environmental impact with budget scale is examined over the range of 0.6 to 1.4 times the baseline budget, as shown in Figure 6. The results show that within the studied 0.6-1.4x range, population coverage is already saturated—a single grade-3 hub achieves full-area coverage by its large service radius, so coverage is essentially insensitive to budget fluctuations in this range; the marginal effect of the budget is mainly reflected in the trade-off between response time and environmental impact: as the budget increases, the attainable average response time generally declines but with diminishing marginal improvement, while environmental impact rises correspondingly. This identifies the desirable investment interval balancing timeliness improvement and environmental cost; note that the interval where coverage is sensitive to the budget lies below the studied lower bound of 0.6x (i.e., when the budget is too low to support even one grade-3 hub).
5.5.2. Construction Cost Sensitivity
The evolution of the graded-scale distribution is examined as construction cost fluctuates within +/-20%, as shown in Figure 7. The results show that the sensitivity of each grade to cost differs markedly: high-grade (grade-3) hubs are the most sensitive to cost increases, and their number generally decreases as cost rises; the reduced share is mainly taken up by grade-2 facilities, whose number rises correspondingly with cost, reflecting the structural substitution elasticity of the layout from high-grade hub concentration toward mid-grade facility transition. Note that at the timeliness-oriented operating point, grade-1 small vertiports are essentially unused due to their small service radius and limited throughput, so the grade adjustment under cost fluctuation is mainly manifested as substitution between grade-3 and grade-2 facilities; meanwhile, single-seed sensitivity sweeps contain some metaheuristic fluctuation, so trend judgment should focus on the overall compositional change rather than point-by-point values.
5.5.3. Social Negative-Impact Sensitivity
The relationship between service coverage and social negative impact is examined as social sensitivity varies from low to high, as shown in Figure 8. The results show that in this case there is no significant trade-off between the two: by the large service radius of the grade-3 hub, full-area population coverage is achieved at a very low social negative-impact level (about 93), and further building or upgrading facilities only raises negative externalities such as noise and land use without further improving coverage, so such high-impact schemes are dominated on the coverage-impact plane; a sweep of the social-sensitivity weight over the 0.25-3x range likewise shows the Pareto compromise scheme remaining stable (always 2 grade-3 hubs), with no knee point where coverage drops sharply with sensitivity. This suggests that, at this regional scale and graded-parameter setting, the key planning trade-off is not between coverage and social impact, but rather between response timeliness and environmental impact, and between robustness and cost; even so, actual siting should still adopt a combined strategy of spatial avoidance and spatial compensation for sensitive objects such as schools and hospitals, to control local negative externalities such as noise and visual intrusion.
5.5.4. Weather Uncertainty Budget Sensitivity
The core parameter of the distributionally robust model is the Wasserstein radius e, i.e., the weather uncertainty budget. Letting e increase continuously from 0 (nominal certainty) to its upper bound, the evolution of robust serviceable reliability, nominal population coverage, and layout structure is examined, as shown in Figure 9. As e increases, the guaranteeable worst-case serviceable demand decreases monotonically (from 755 at e = 0 to about 90 at e = 0.30; here the layout is re-optimized point by point with e, so it is not directly comparable with the f6 of the compromise scheme under the fixed baseline in Table 5), while the nominal coverage remains saturated; this price of robustness is mainly paid in guaranteeable throughput rather than spatial coverage, and the decline is gentle first then steep, allowing identification of a desirable e interval balancing robustness and efficacy. This analysis, which the nominal deterministic model cannot provide, highlights the methodological value of introducing the distributionally robust framework for characterizing resilience to weather disturbances.
5.5.5. Demand Elasticity Parameter Sensitivity
The key behavioral parameter of the demand-endogenous mechanism is the time sensitivity theta in the Logit mode-choice model. The response of the UAM-captured demand scale, in-facility queuing load, and optimal layout form as theta varies over a reasonable range is examined, as shown in Figure 10. The analysis shows that the larger theta is, the more sensitive travelers are to generalized time, and under this case's Pareto compromise layout both the UAM-captured demand and the average in-facility queuing utilization decrease accordingly (captured demand falling from about 623 at theta = 0.02 to about 479 at theta = 0.15): higher time sensitivity amplifies the generalized-time disadvantage of some ODs routed via hubs, prompting these travelers to return to ground transport, so the net captured scale shrinks and the in-facility queuing load eases. Meanwhile, the optimal compromise layout form remains stable over the studied range (dominated by 2 grade-3 hubs), with no structural migration with theta. This indicates that endogenous demand feedback significantly affects the captured demand scale and congestion level, which demand-exogenous static models cannot capture; however, under this case's objective trade-offs and parameter settings, the basic form of the graded layout is not sensitive to theta.
6. Conclusions
Addressing the multi-objective conflicts and uncertainties in urban air mobility vertiport layout, this paper breaks through the deterministic assumptions of conventional siting studies—exogenous demand, hard capacity constraints, and always-available facilities—by constructing a demand-endogenous, capacity-coupled distributionally robust six-objective mixed-integer nonlinear programming model, designing a reference-point-based improved NSGA-III algorithm and a three-layer nested evaluation framework to solve it, and finally verifying the method's effectiveness using Huangpu District, Guangzhou, as the empirical object. The main conclusions are as follows.
(1) Self-limiting of concentration by capacity congestion (the congestion-coverage tension). After endogenously embedding graded-capacity queuing delay into the timeliness objective, the model can characterize a mechanism that deterministic models (with capacity as a hard constraint only) cannot present: over-concentration on a few high-grade hubs backfires on the response-time objective because in-facility queuing delay is amplified nonlinearly with utilization, so scaled concentration is not always dominant. The Pareto compromise scheme obtained empirically stably lands on a moderate concentration of a few grade-3 hubs (rather than a single super-hub), consistent with this self-limiting mechanism; this suggests that UAM vertiport layout has a moderate-concentration interval constrained by congestion, and planning models must explicitly account for queuing feedback, otherwise the sustainable throughput capacity of hubs will be overestimated.
(2) The price of robustness. The sensitivity analysis based on the Wasserstein distributionally robust framework quantifies the price of robustness under weather uncertainty: as the uncertainty budget e increases, the guaranteeable worst-case serviceable reliability decreases monotonically (from about 755 at e = 0 to about 90 at e = 0.30), while the nominal population coverage remains saturated—the cost of robustness is mainly paid in guaranteeable throughput rather than spatial coverage, and the decline is gentle first then steep, allowing identification of a desirable e interval balancing robustness and efficacy. Correspondingly, the ablation experiment further confirms this value at the solution-structure level: on the Pareto compromise scheme, removing the distributionally robust objective shifts the layout toward a more concentrated, cheaper network whose survivable serviceable volume (n-1) falls from 224.2 to 138.0, losing about 70% of service capacity when the busiest hub fails, indicating that, compared with the nominal deterministic model, distributionally robust modeling indeed yields layouts more resilient to weather disturbances and facility failures.
(3) Influence of endogenous demand feedback on captured scale and congestion. The sensitivity analysis of the demand elasticity parameter theta shows that traveler time sensitivity significantly affects the UAM-captured demand scale and in-facility queuing load: as theta increases, some ODs return to ground transport because their generalized-time disadvantage via hubs is amplified, and the net captured demand and queuing utilization decrease accordingly. Under this case's objective trade-offs and parameter settings, the basic form of the Pareto compromise layout (dominated by grade-3 hubs) remains robust to theta, with no structural migration. This indicates that UAM infrastructure planning must account for the bidirectional feedback between demand and supply to correctly estimate the captured scale and congestion level, whereas demand-exogenous static siting models systematically misjudge this endogenous response.
(4) Effectiveness of the algorithm and modeling. On the complex five-objective, demand-endogenous, distributionally robust problem, the improved NSGA-III attains the best hypervolume (HV), the combined convergence-diversity metric, with the shortest average running time, is comparable to classical NSGA-II on IGD+, and superior to standard NSGA-III and MOEA/D, verifying the effectiveness of improved strategies such as the reference-point selection mechanism, dynamic penalty, and centroid-guided mutation in high-dimensional objective spaces; the ablation experiment further shows that demand-endogenous and queuing-delay modeling significantly affects the response timeliness of solutions under real demand-congestion feedback, while the value of the distributionally robust objective is mainly reflected in schemes such as coverage-oriented and timeliness-oriented ones that need to retain worst-case serviceable capacity. The three modeling innovations jointly support the effectiveness and resilience of the schemes under real operational feedback and weather disturbances.
The above conclusions offer direct implications for urban vertiport planning practice. First, capacity configuration should be decided jointly with demand congestion, avoiding over-concentration on a few hubs guided solely by nominal coverage, and instead dispersing arrival rates and suppressing queuing divergence through graded deployment. Second, in the face of meteorological uncertainty, moderate redundant reachability and dispersed layout should be retained to trade a small cost for stronger service resilience against site failure and weather disturbances, weighing guaranteeable reliability against scale investment within the desirable robustness interval. Third, planning must account for the endogenous feedback of demand to travel behavior: traveler time sensitivity significantly affects the UAM-captured demand scale and in-facility congestion level, and capacity and service levels should be calibrated accordingly rather than following demand-exogenous static estimates. Fourth, for social and environmental constraints, a balanced strategy combining spatial avoidance and spatial compensation should be adopted to control noise and visual intrusion while safeguarding the service-coverage baseline.
This paper still has several limitations to be deepened in future research. First, the model is based on static potential ODs and nominal parameters for the planning target year; future work could introduce dynamic demand evolution and multi-period joint optimization to characterize the time-varying features of demand with urban development. Second, weather uncertainty is mainly characterized by the binary availability of sites; subsequent work could extend to continuous capacity reduction and spatiotemporally correlated meteorological processes, and incorporate more stochastic disturbances such as power supply and airspace flow to build a resilient layout model under multi-source uncertainty. Third, this paper focuses on the static siting of vertiports; future work could couple site layout with low-altitude route-network planning to achieve the coordinated evolution of sites and routes in three-dimensional space, and further explore the integrated multimodal optimization of UAM and ground public transport, providing more complete planning support for urban air mobility systems under high-density operation.
Author Contributions
Conceptualization, Q.L.; investigation, Q.L.; data curation, Q.L.; funding acquisition, Q.L.; supervision, Q.L.; methodology, Z.L.; software, Z.L.; validation, Z.L.; formal analysis, Z.L.; visualization, Z.L.; writing—original draft preparation, Z.L.; writing—review and editing, Z.L. and Q.L. All authors have read and agreed to the published version of the manuscript.
Funding
National Natural Science and Civil Aviation Joint Research Fund Project (U2333204).
Data Availability Statement
The candidate vertiport coordinates, the origin-destination demand units, and the derived binary weather-availability samples generated and analyzed in this study are available from the corresponding author upon reasonable request.The ground door-to-door travel times were retrieved through a commercial electronic-map routing API and are subject to the provider's terms of service; they cannot be redistributed but can be reproduced through the same public interface.The meteorological data are derived from publicly available sources, including the hourly station observations of the China Meteorological Data Network and the ECMWF ERA5 reanalysis dataset.The source code of the improved NSGA-III algorithm is available from the corresponding author upon reasonable request.
Conflicts of Interest
The authors declare no conflicts of interest.
References
- DEB, K.; PRATAP, A.; AGARWAL, S.; et al. A fast and elitist multiobjective genetic algorithm: NSGA-II[J]. IEEE Trans. Evol. Comput. 2002, 6(2), 182–197. [Google Scholar] [CrossRef]
- DEB, K.; JAIN, H. An evolutionary many-objective optimization algorithm using reference-point-based nondominated sorting approach, part I: solving problems with box constraints[J]. IEEE Trans. Evol. Comput. 2014, 18(4), 577–601. [Google Scholar] [CrossRef]
- ZHANG, Q.; LI, H. MOEA/D: a multiobjective evolutionary algorithm based on decomposition[J]. IEEE Trans. Evol. Comput. 2007, 11(6), 712–731. [Google Scholar] [CrossRef]
- ZITZLER, E.; THIELE, L. Multiobjective evolutionary algorithms: a comparative case study and the strength Pareto approach[J]. IEEE Trans. Evol. Comput. 1999, 3(4), 257–271. [Google Scholar] [CrossRef]
- ISHIBUCHI, H.; MASUDA, H.; TANIGAKI, Y.; et al. Modified distance calculation in generational distance and inverted generational distance[C]//Evolutionary Multi-Criterion Optimization (EMO 2015), LNCS 9019; Springer: Cham, 2015. [Google Scholar] [CrossRef]
- DAS, I.; DENNIS, J. E. Normal-boundary intersection: a new method for generating the Pareto surface in nonlinear multicriteria optimization problems[J]. SIAM J. Optim. 1998, 8(3), 631–657. [Google Scholar] [CrossRef]
- MOHAJERIN ESFAHANI, P.; KUHN, D. Data-driven distributionally robust optimization using the Wasserstein metric: performance guarantees and tractable reformulations[J]. Math. Program. 2018, 171(1-2), 115–166. [Google Scholar] [CrossRef]
- MCFADDEN, D.; ZAREMBKA, P. Conditional logit analysis of qualitative choice behavior[M]. In Frontiers in Econometrics; Academic Press: New York, 1974; pp. 105–142. [Google Scholar]
- CHURCH, R.; REVELLE, C. The maximal covering location problem[J]. Pap. Reg. Sci. Assoc. 1974, 32(1), 101–118. [Google Scholar] [CrossRef]
- ZENG, W.; WEI, W.; WU, W.; et al. Vertiport location selection and optimization for urban air mobility in complex urban scenes[J]. Aerospace 2025, 12(8), 709. [Google Scholar] [CrossRef]
- Zhu, Y.; Yan, F.; Xue, K.; et al. Optimization method for the surface-litter manure shoveling-and-throwing mechanism in brooding chicken houses based on the NSGA-II algorithm. In Trans. Chin. Soc. Agric. Eng.; (In Chinese). 2026. [Google Scholar]
- Li, X.; Duo, S.; Ren, C.; et al. Repair-line fitting for a tunnel crossing an active fault zone after seismic dislocation based on NSGA-II objective optimization. In Tunn. Constr.; (In Chinese). 2026. [Google Scholar]
- Lin, J.; Wang, Y.; Chen, W.; et al. Optimization method for the greenhouse tomato growth environment based on an improved NSGA-II. Trans. Chin. Soc. Agric. Eng. (In Chinese) 2026, 42, 169–177. [Google Scholar]
- Lin, L.; Wang, Z.; Li, C. Selection of spectral reflectance reconstruction samples based on the NSGA-II algorithm. Spectrosc. Spectr. Anal. (In Chinese) 2024, 44, 1227–1232. [Google Scholar]
- Chai, Y.; Zhang, L.; Dou, W.; et al. High-dimensional many-objective optimization of the side-wall structure of a high-speed train car body based on a parallel NSGA-III algorithm. J. Mech. Eng. (In Chinese) 2024, 60, 321–333. [Google Scholar]
- Tian, H.; Wang, D.; Shuai, M.; et al. Optimization of high-speed train operation plans oriented to OD passenger flow. J. Northeast. Univ. (Nat. Sci.) (In Chinese) 2020, 41, 1535–1542. [Google Scholar]
- Yang, M.; Su, B.; Sun, Z.; et al. Model and algorithm for multi-objective discrete transportation network design under stochastic OD demand. J. Southwest Jiaotong Univ. (In Chinese) 2014, 49, 119–125. [Google Scholar] [CrossRef]
- Chang, X.; Tang, Y.; Qin, H.; et al. Location optimization method for urban vertiports considering demand and cost uncertainty. J. Highw. Transp. Res. Dev. (In Chinese) 2026. [Google Scholar] [CrossRef]
- Guo, D.; Yao, E.; Zhang, T.; et al. Location optimization of multi-grade vertiports considering demand elasticity. J. Traffic Transp. Eng. (In Chinese) 2026. [Google Scholar] [CrossRef]
- Mou, Z.; Wang, S.; Long, L.; et al. Research progress and prospects of low-altitude infrastructure siting and layout. J. Chongqing Univ. Technol. (Nat. Sci.) (In Chinese) 2026. [Google Scholar] [CrossRef]
- Fu, X.; Zhu, S.; Li, X.; et al. Layout optimization method for urban vertiports oriented to long-distance commuting scenarios. Acta Geod. Cartogr. Sin. (In Chinese) 2026, 55, 236–248. [Google Scholar]
- Huang, Q.; Jiang, Z.; Zhang, H.; et al. District-level layout planning of unmanned aircraft take-off and landing sites based on the NSGA-II algorithm: a case study of Nanshan District, Shenzhen. J. Traffic Transp. Eng. (In Chinese) 2026, 26, 144–166. [Google Scholar] [CrossRef]
- Wang, L.; Xiao, D.; Zhang, Y. eVTOL vertiport siting based on multi-factor overlay and a bi-level optimization model: a case study of Chengdu. Bull. Surv. Mapp. (In Chinese) 2025, 12, 58–64, 70. [Google Scholar]
- Zhang, Z.; Dong, Y.; He, K.; et al. A siting model for temporary helicopter take-off and landing fields considering geological factors. Geol. Rev. (In Chinese) 2025, 71, 827–837. [Google Scholar]
- Zhang, H.; Feng, D.; Zhang, X.; et al. Research on the layout planning of urban logistics UAV take-off and landing sites. J. Transp. Syst. Eng. Inf. Technol. (In Chinese) 2022, 22, 207–214. [Google Scholar] [CrossRef]
- Dou, S.; Yu, C.; Bai, H.; et al. Research on the multi-AGV task allocation problem in intelligent production workshops based on an improved NSGA-III algorithm. Packag. Eng. (In Chinese) 2026, 47, 119–132. [Google Scholar]
- Fan, Z.; Liu, J. Research on an optimal dispatching method for distribution networks with wind-solar-diesel-storage based on an improved NSGA-III-PSO. Electr. Meas. Instrum. (In Chinese) 2025, 62, 167–175, 209. [Google Scholar]
- Liao, Y.; Wang, W.; Teng, W.; et al. A global optimization method for smooth-path generation of UAVs based on multi-objective constraints. J. Zhejiang Univ. (Eng. Sci.) (In Chinese) 2025, 59, 1481–1491. [Google Scholar]
- He, J.; Li, W.; Wang, J.; et al. Layout planning of multi-branch cables for aero-engines based on an improved NSGA-III algorithm. Comput. Integr. Manuf. Syst. (In Chinese) 2025. [Google Scholar] [CrossRef]
- Hu, K.; Ma, W.; Dai, C.; et al. An evolutionary multi-objective optimization algorithm for federated learning based on an improved NSGA-III. Comput. Sci. (In Chinese) 2025, 52, 152–160. [Google Scholar]
- Chen, R.; Chen, Y.; Wang, C.; et al. Research on a low-carbon scheduling method for high-dimensional many-objective flexible job shops based on an improved NSGA-III. Manuf. Technol. Mach. Tool. (In Chinese) 2024, 10, 165–173. [Google Scholar]
- Wang, S.; Shen, Q.; Sun, M.; et al. Cooperative target assignment for multiple UAVs based on an improved NSGA-III algorithm. Aero Weapon. (In Chinese) 2024, 31, 100–111. [Google Scholar]
- Zhang, S.; Xie, J.; Chen, S. An improved NSGA-III algorithm based on a fuzzy system. Fuzzy Syst. Math. (In Chinese) 2023, 37, 13–24. [Google Scholar]
- Wang, H.; Gao, P.; Xie, Y.; et al. Land-use optimization based on genetic algorithms: a comparative study of NSGA-II and NSGA-III. Acta Ecol. Sin. (In Chinese) 2023, 43, 639–649. [Google Scholar] [CrossRef]
Figure 1.
Study area and spatial distribution of candidate sites.
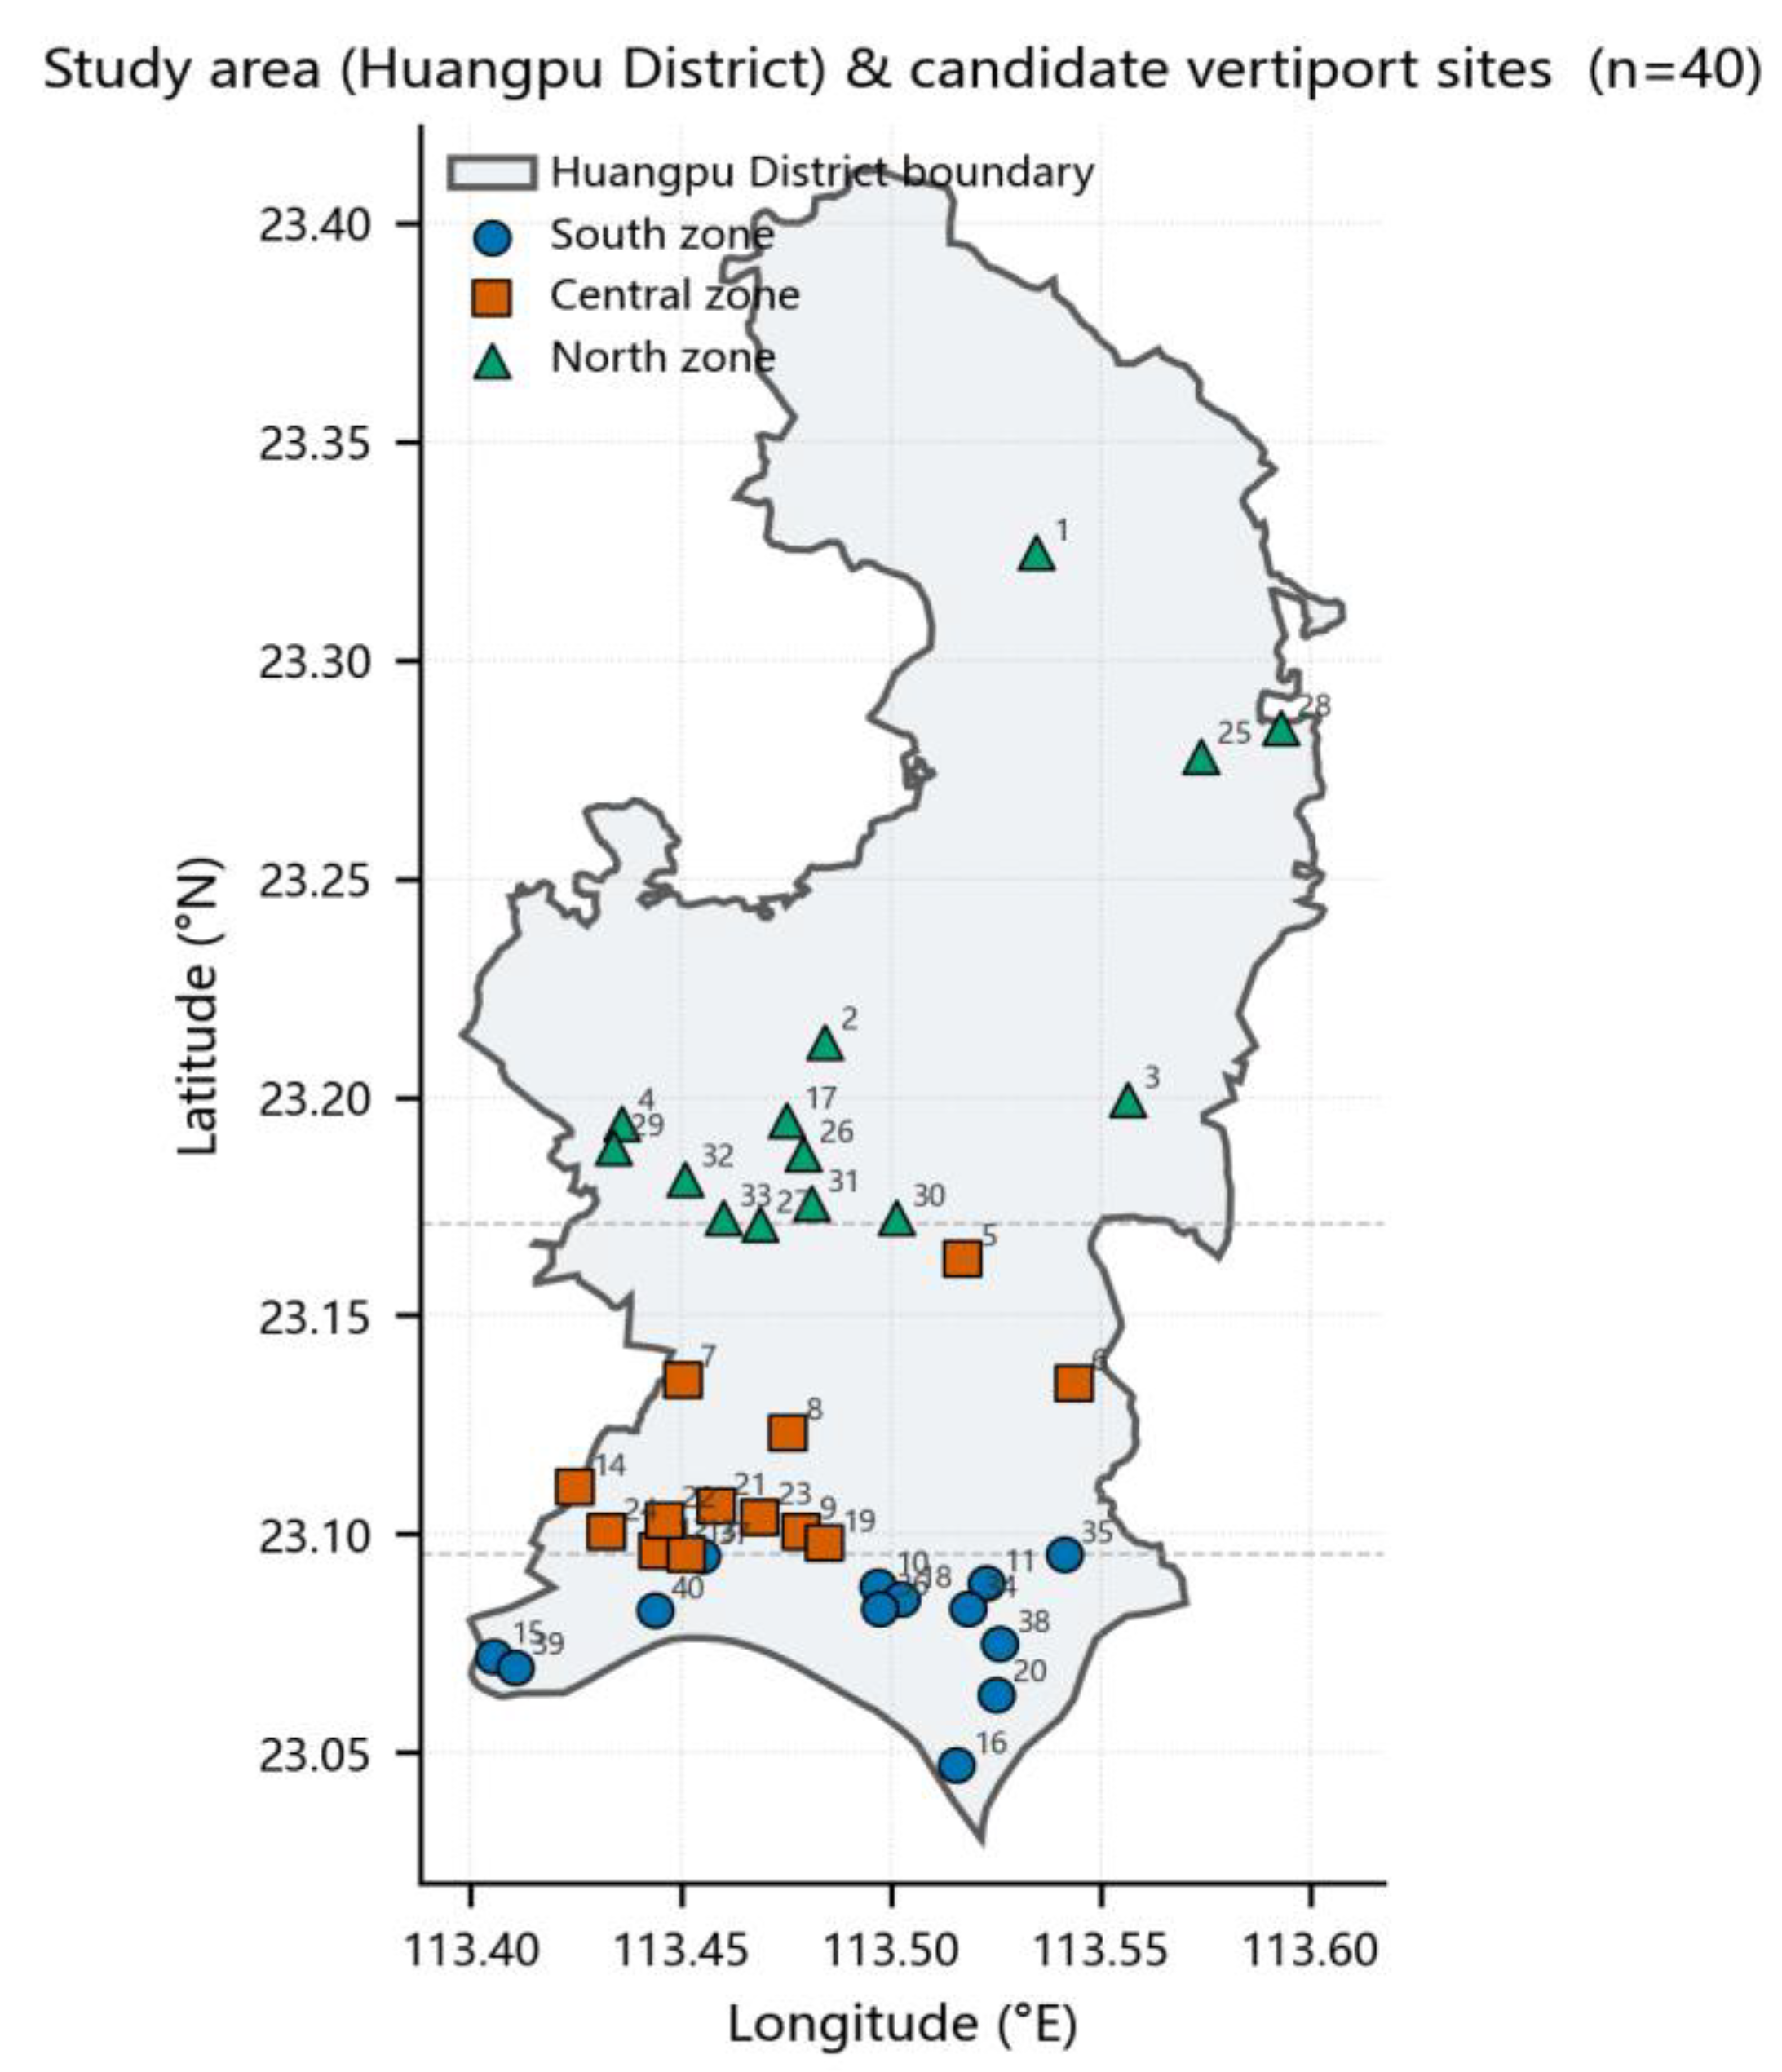
Figure 2.
Heat distribution of low-altitude travel demand at morning, off-peak, and evening peaks.
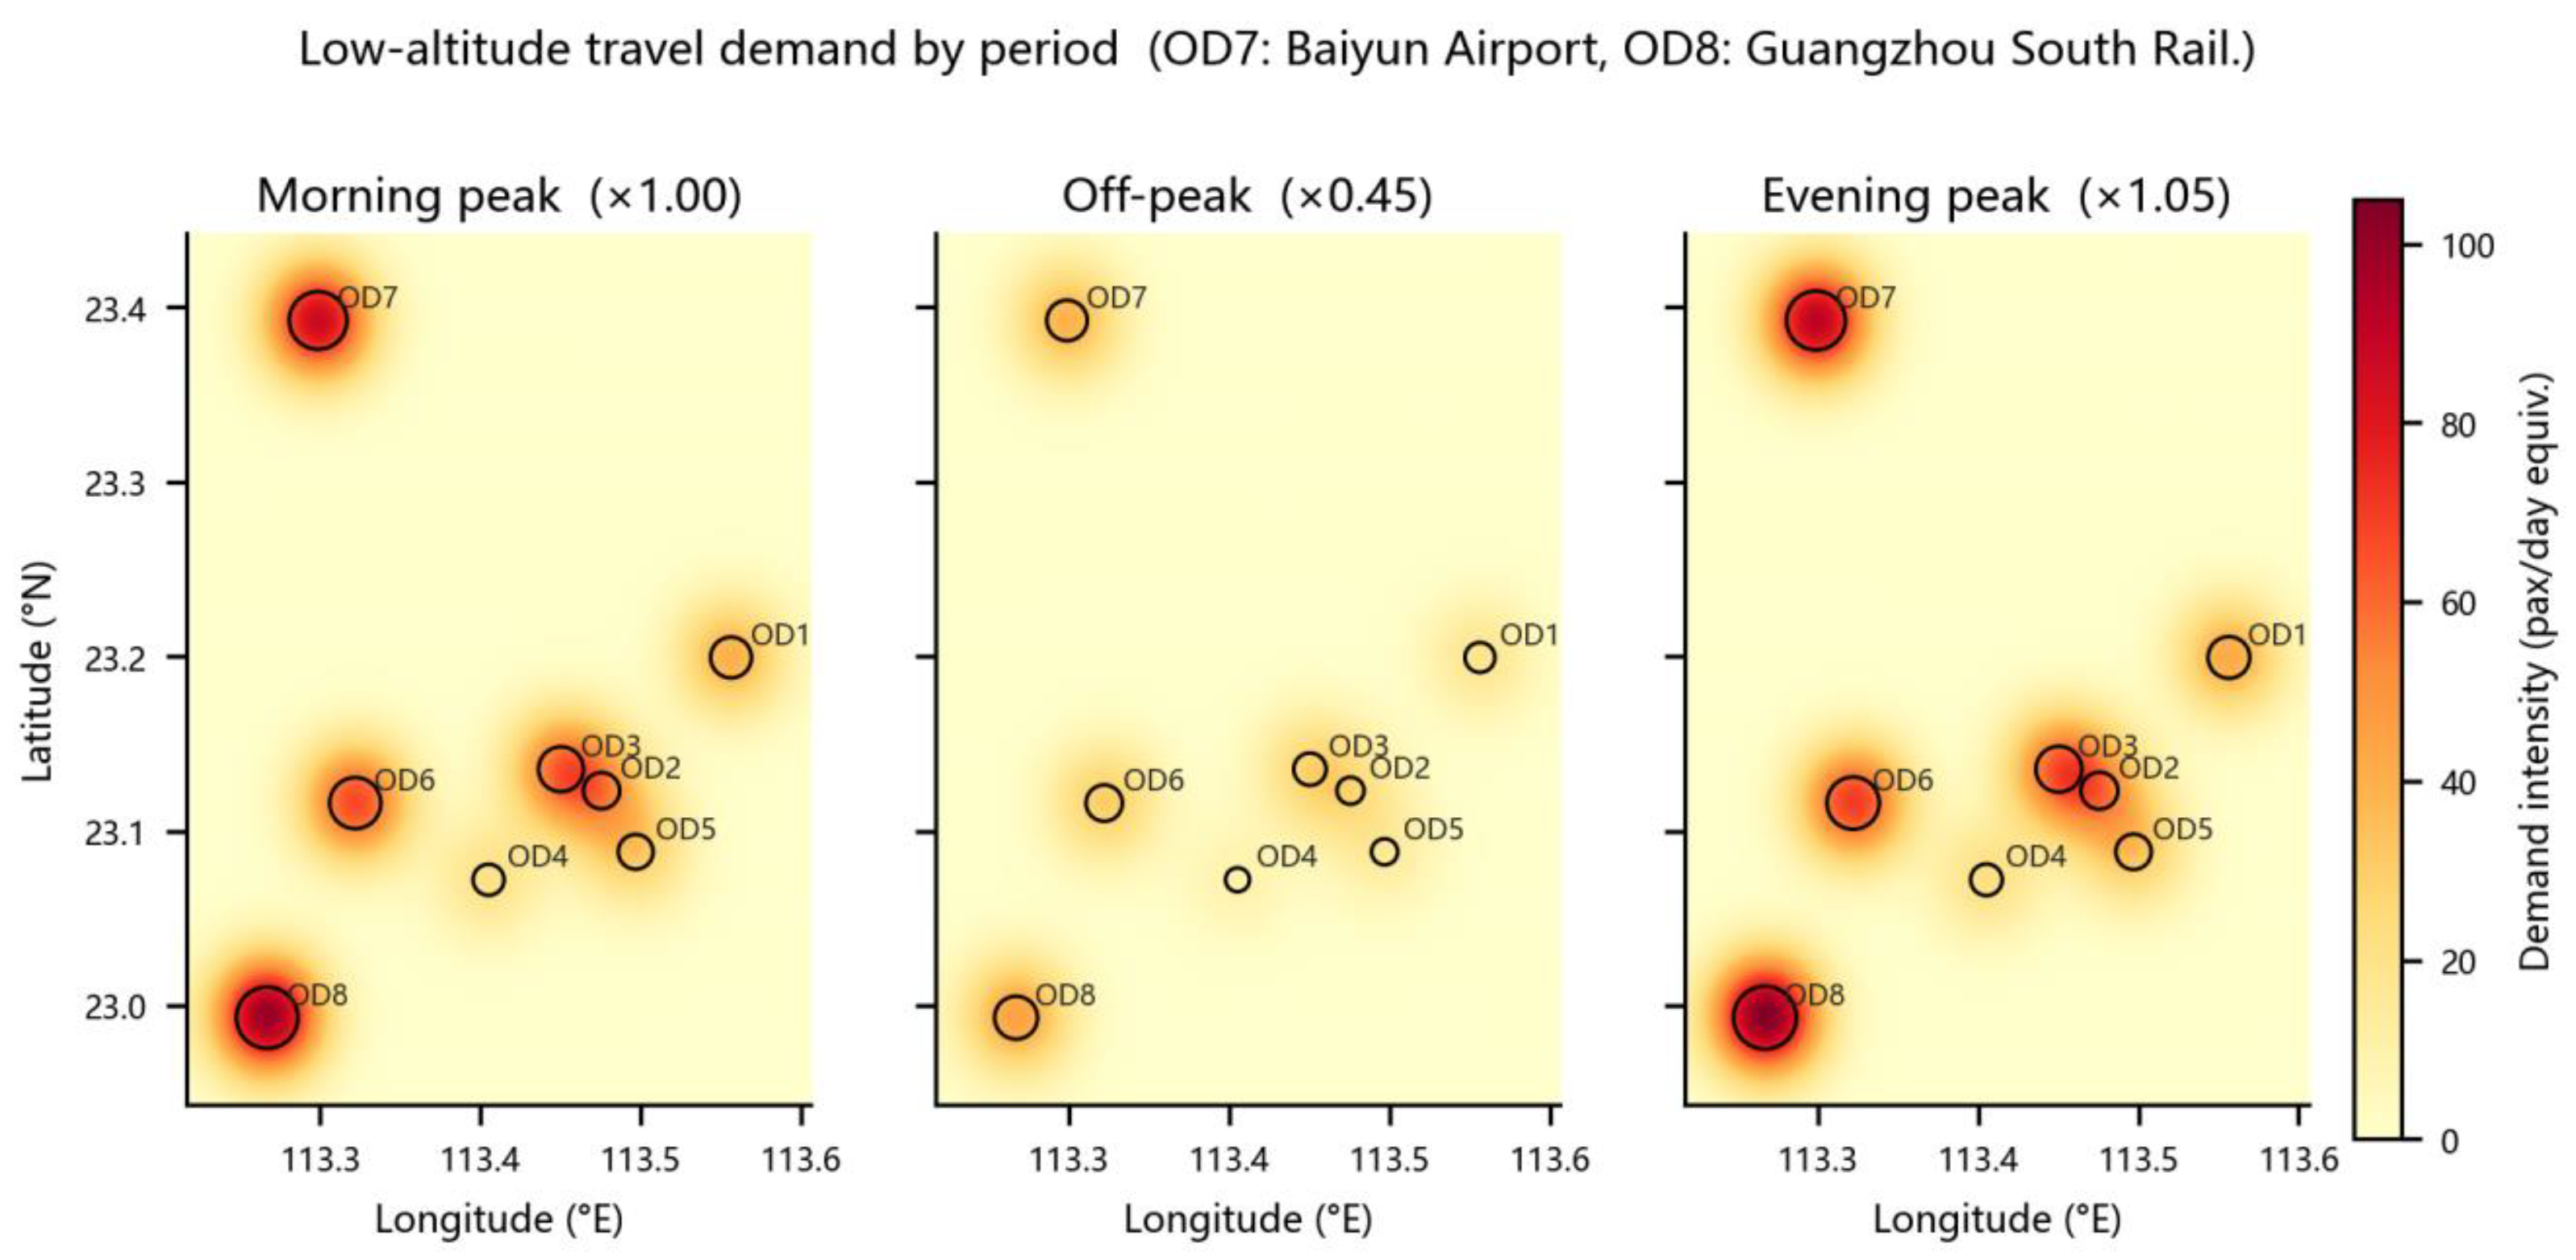
Figure 3.
Comparison of hypervolume (HV) convergence curves of the four algorithms.
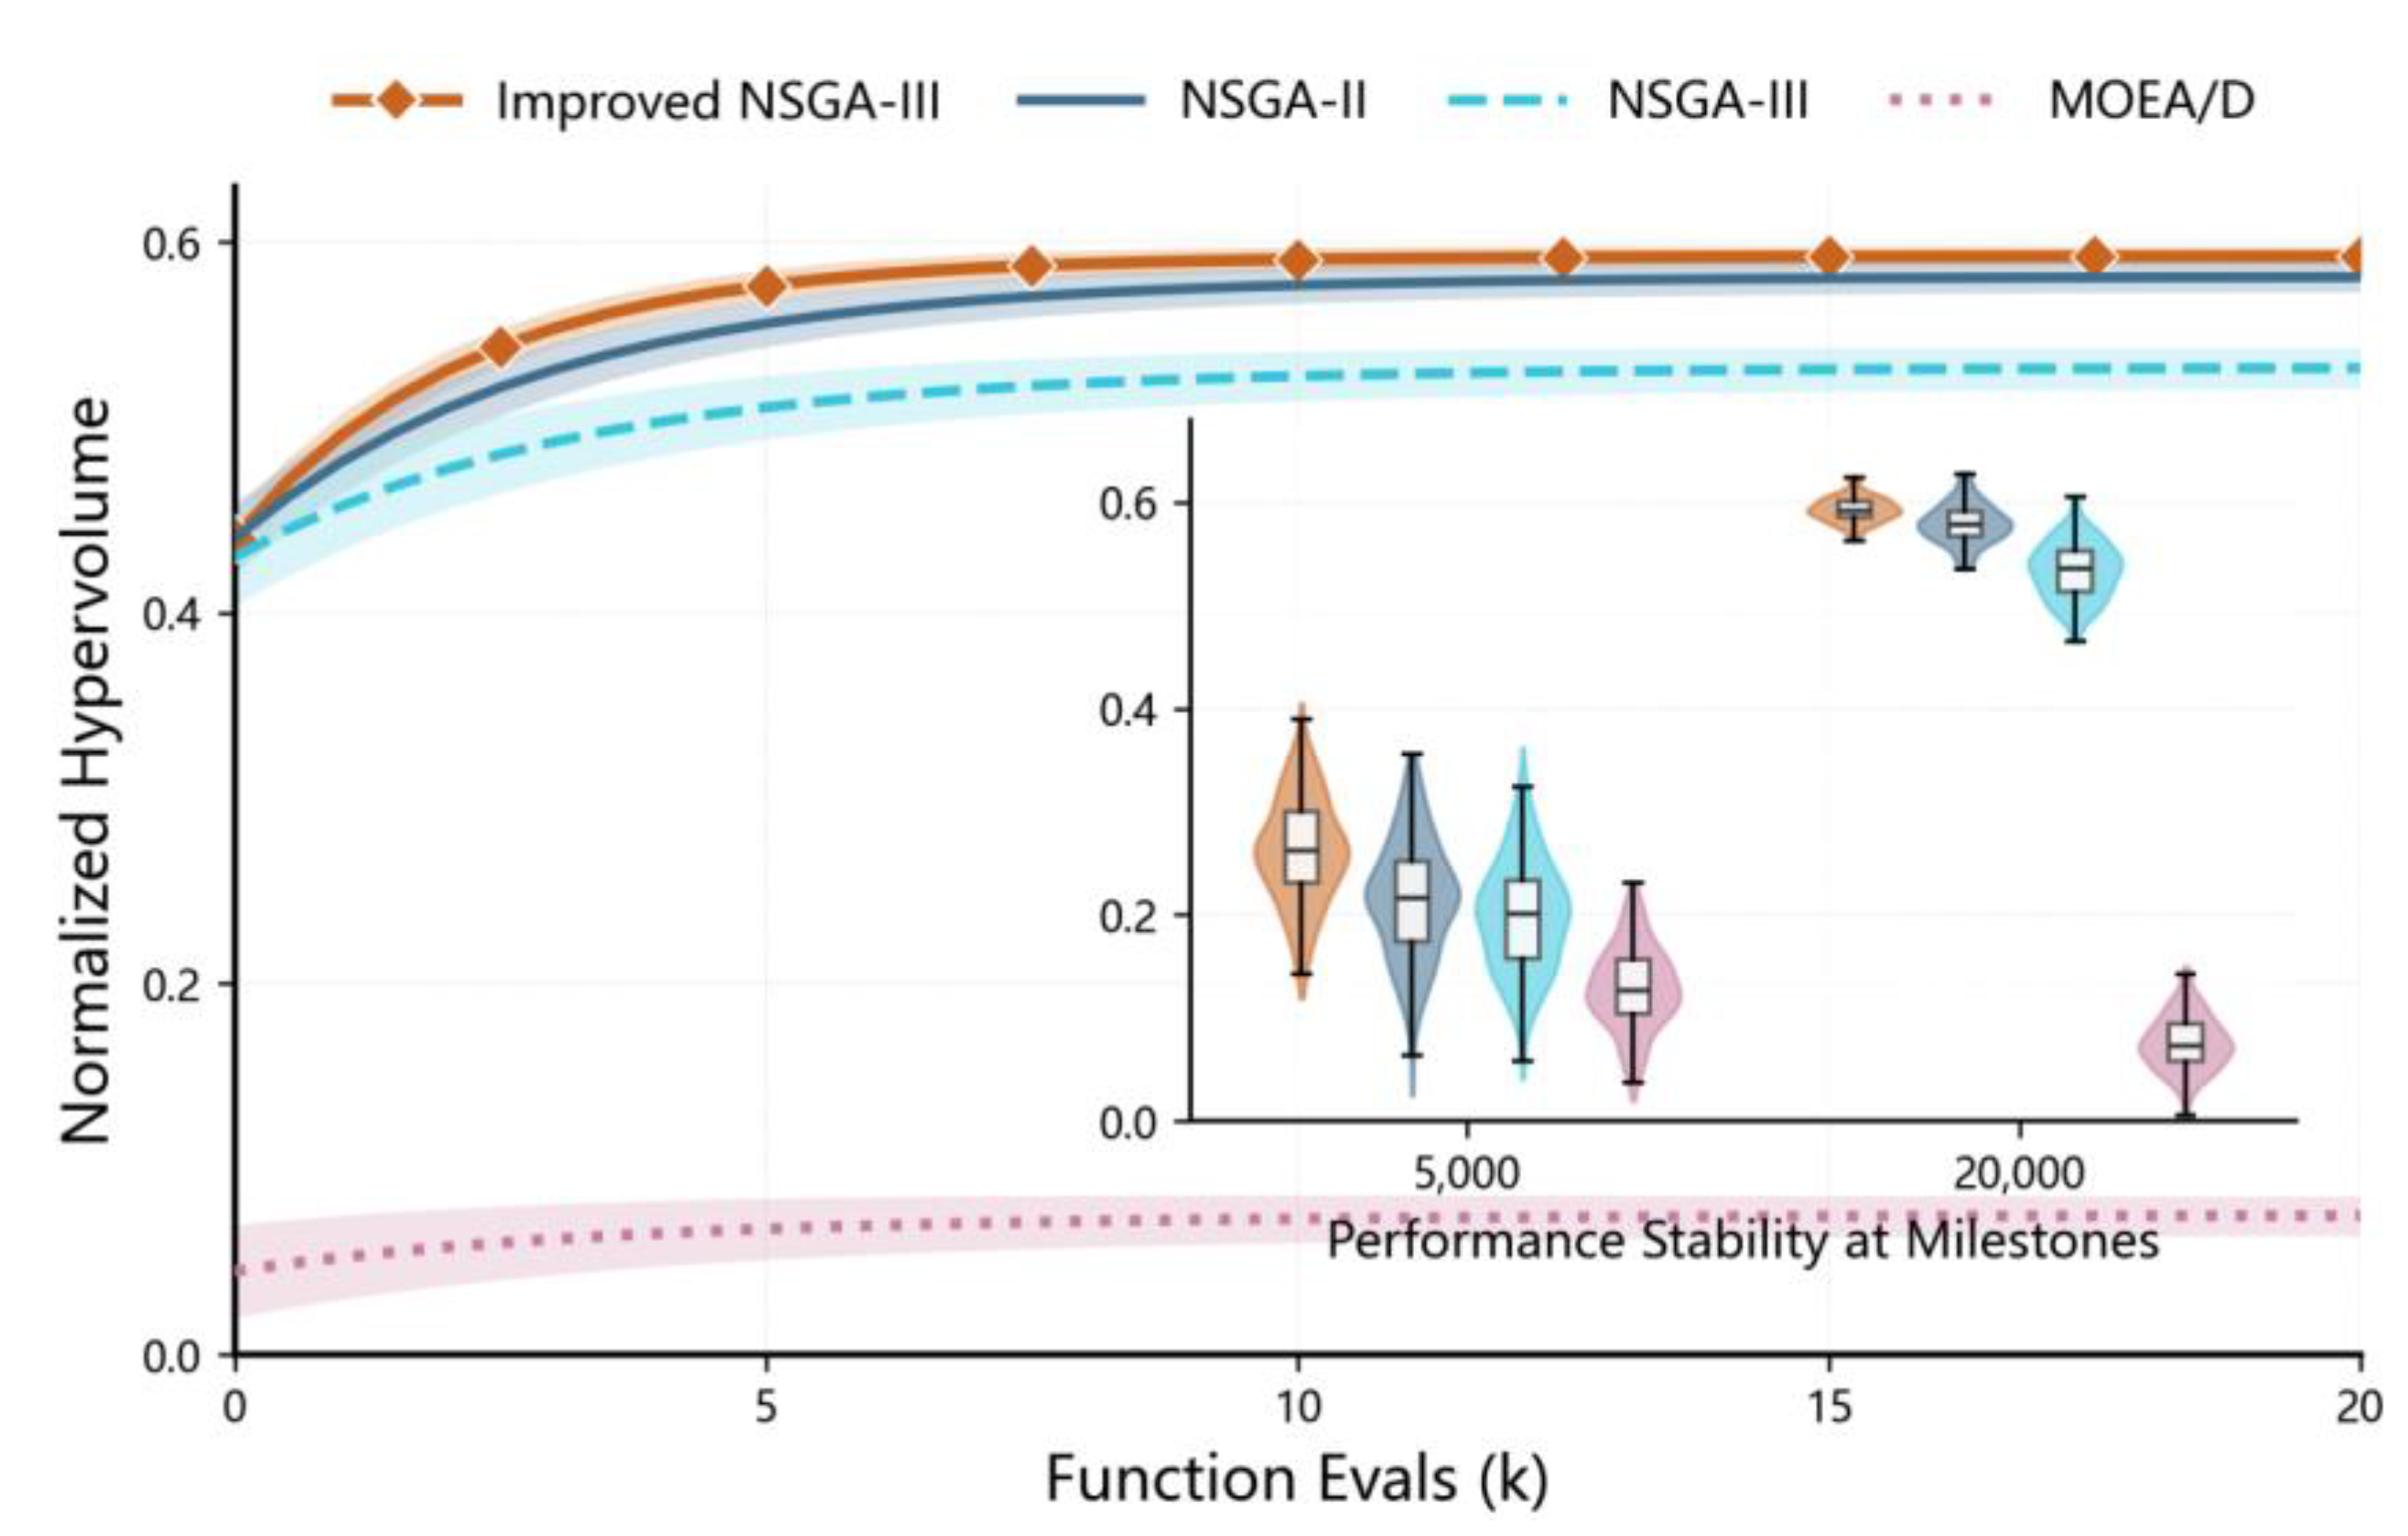
Figure 4.
Comparison of the spatial distribution of representative layout schemes.
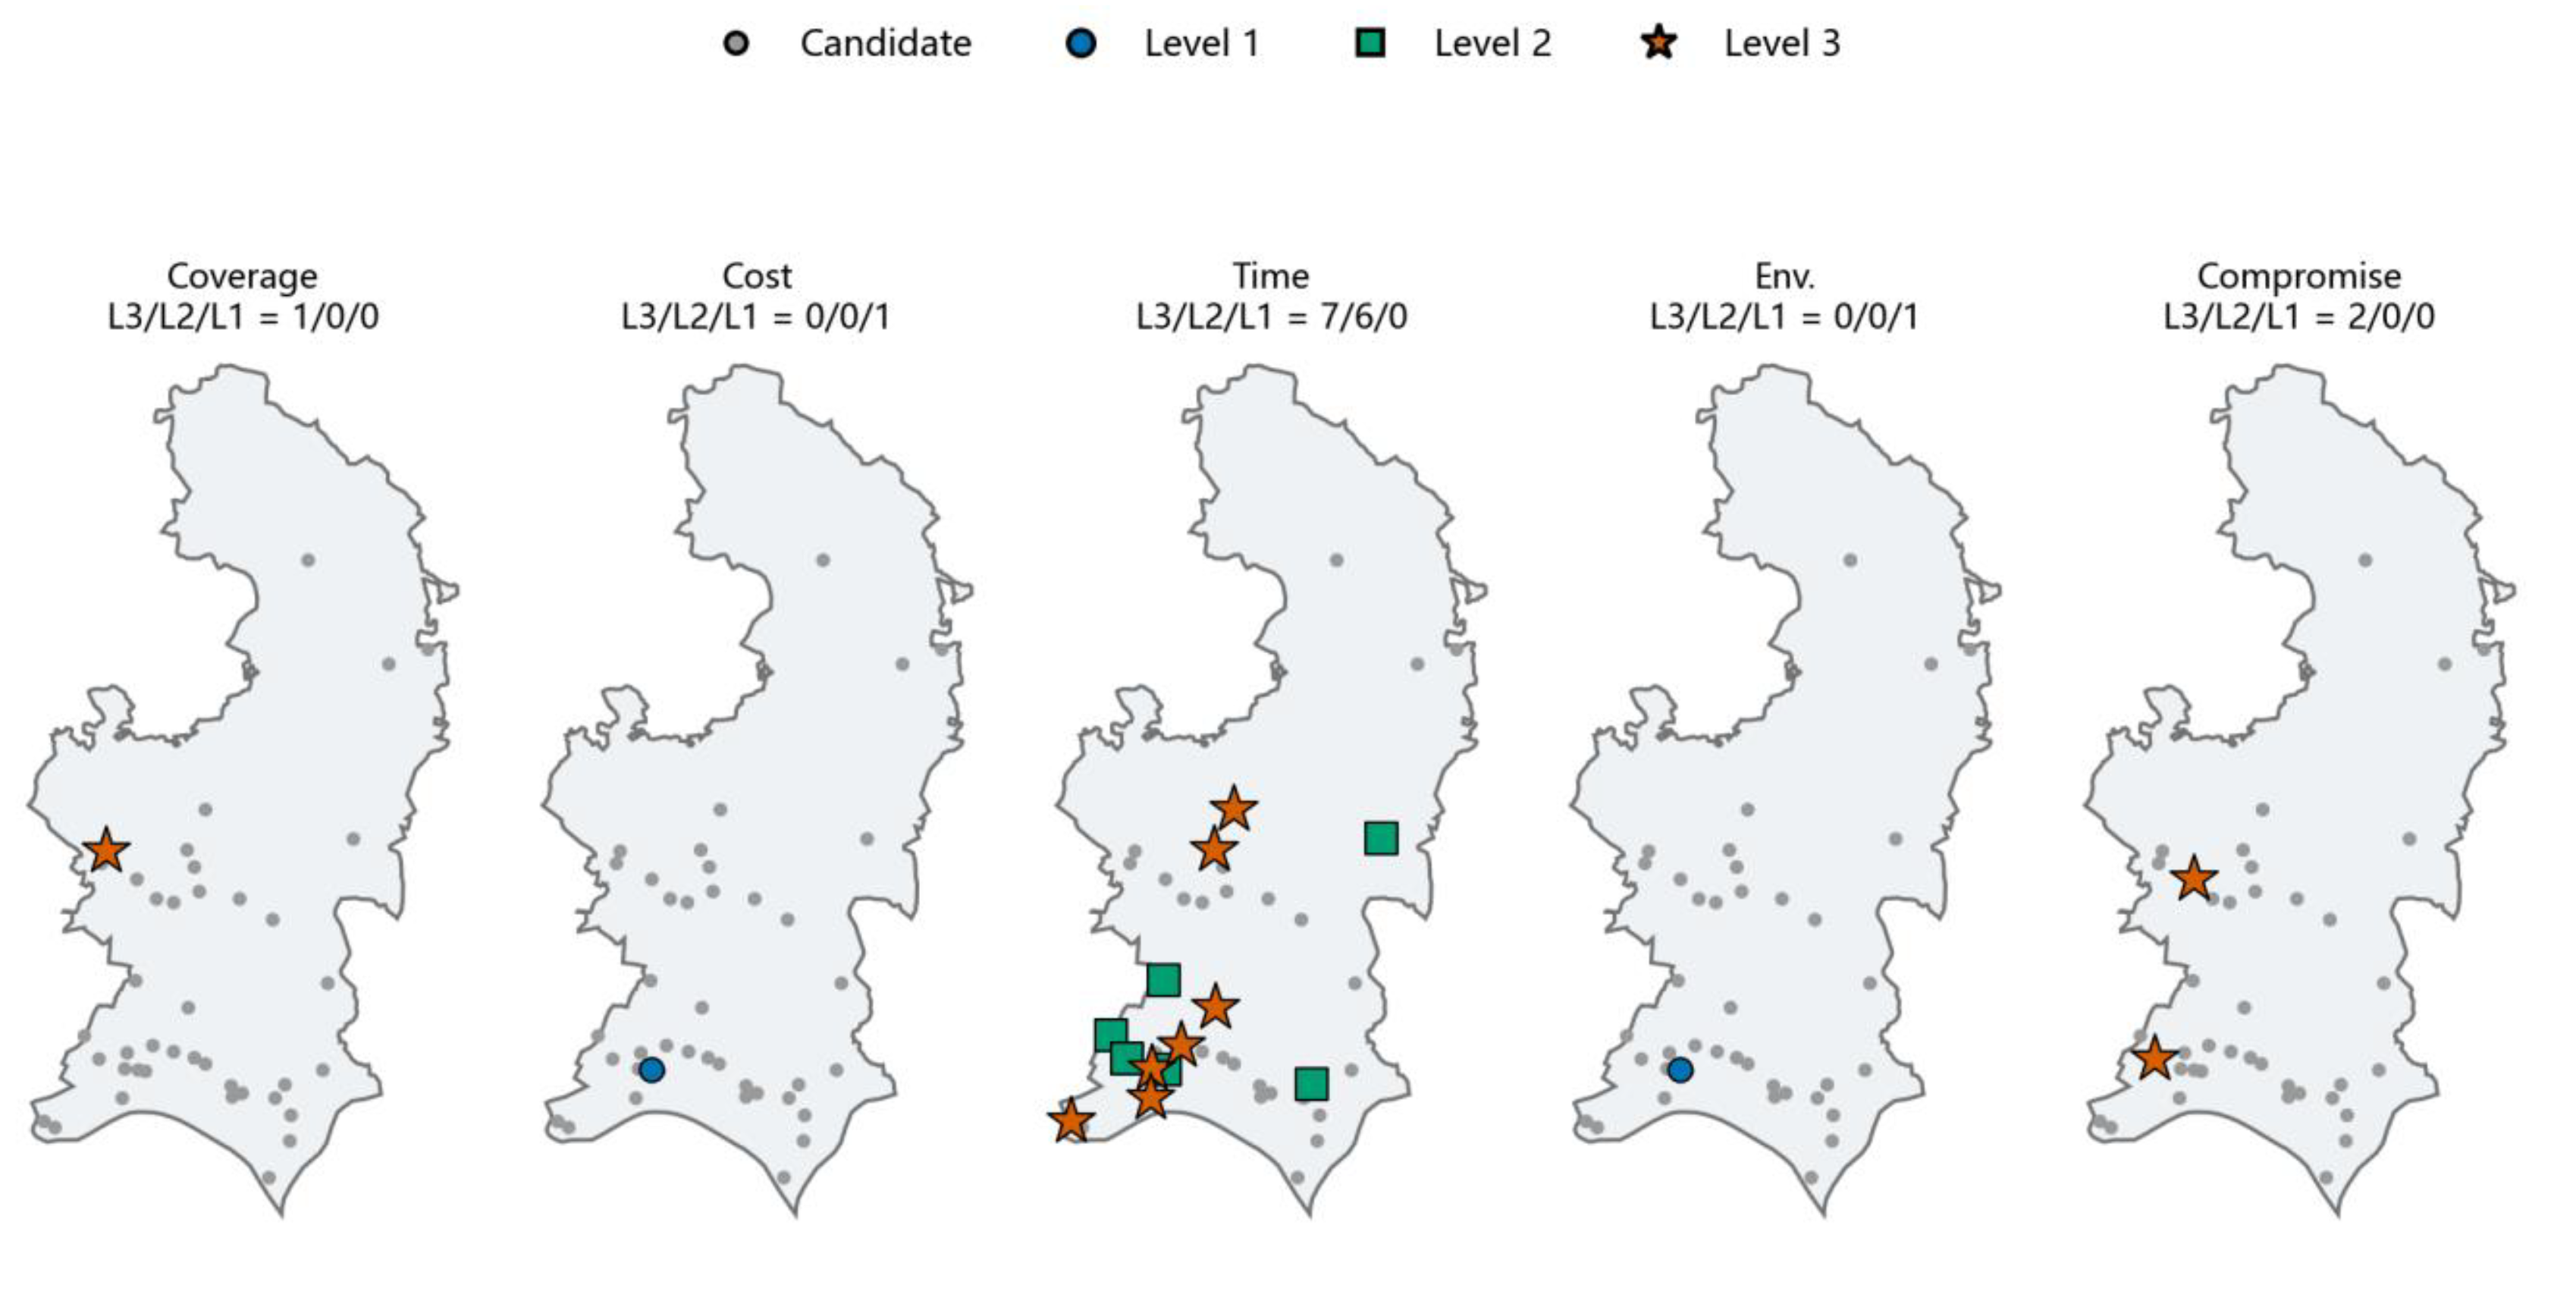
Figure 5.
Parallel-coordinates plot of the Pareto non-dominated solution set.
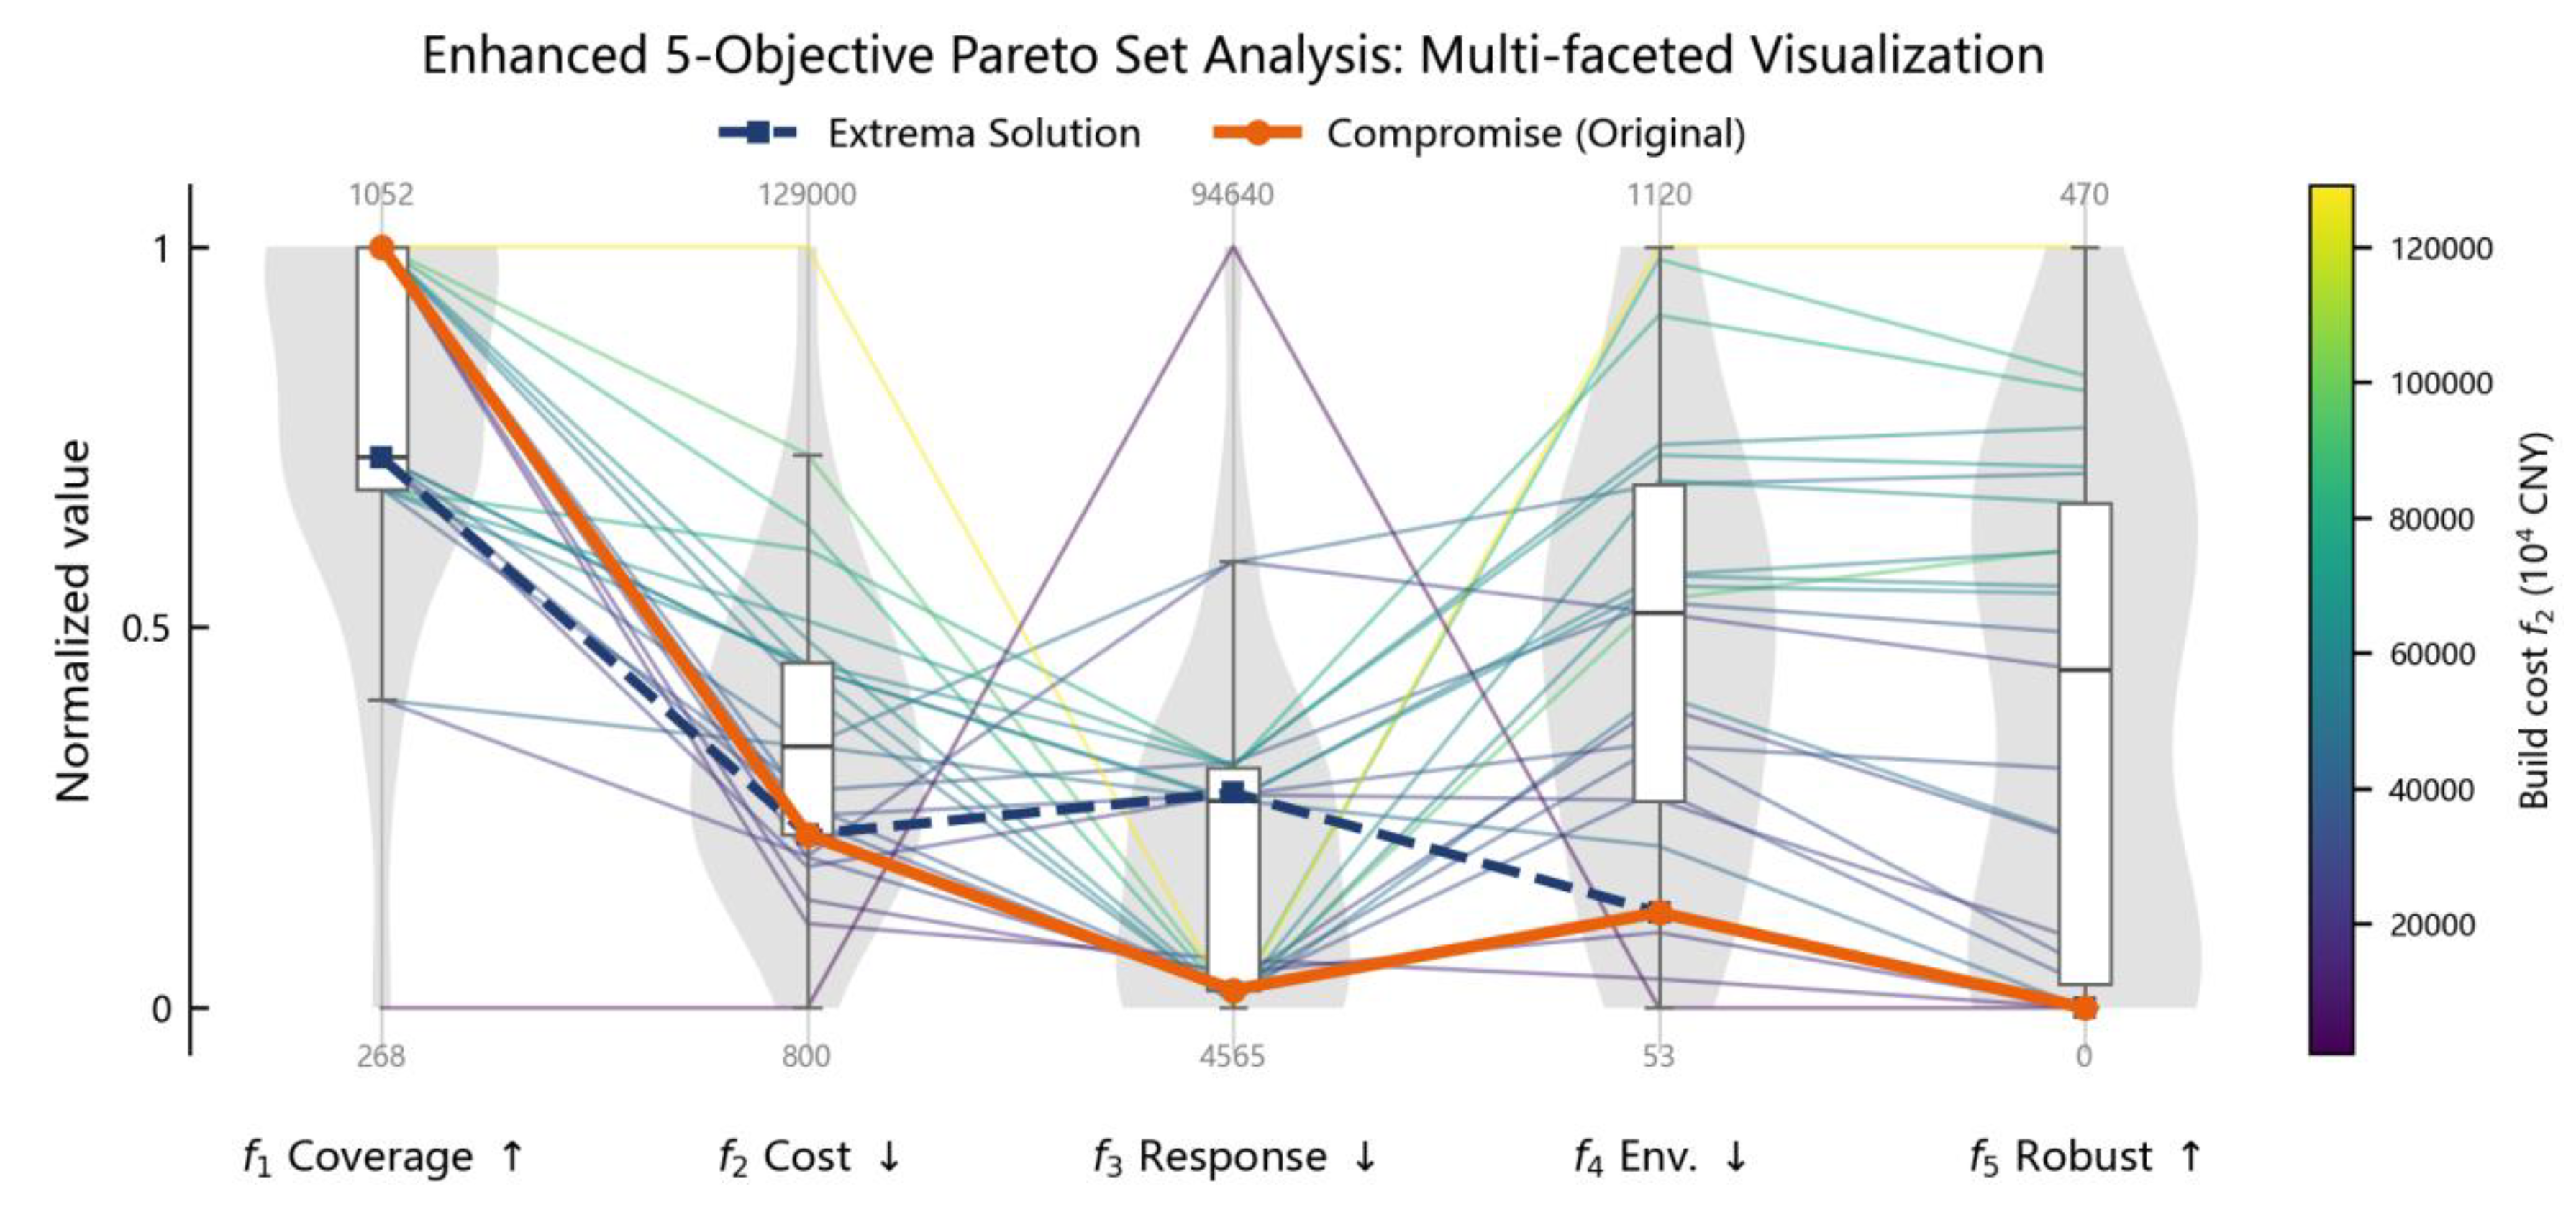
Figure 6.
Evolution curves of core metrics with budget scale.
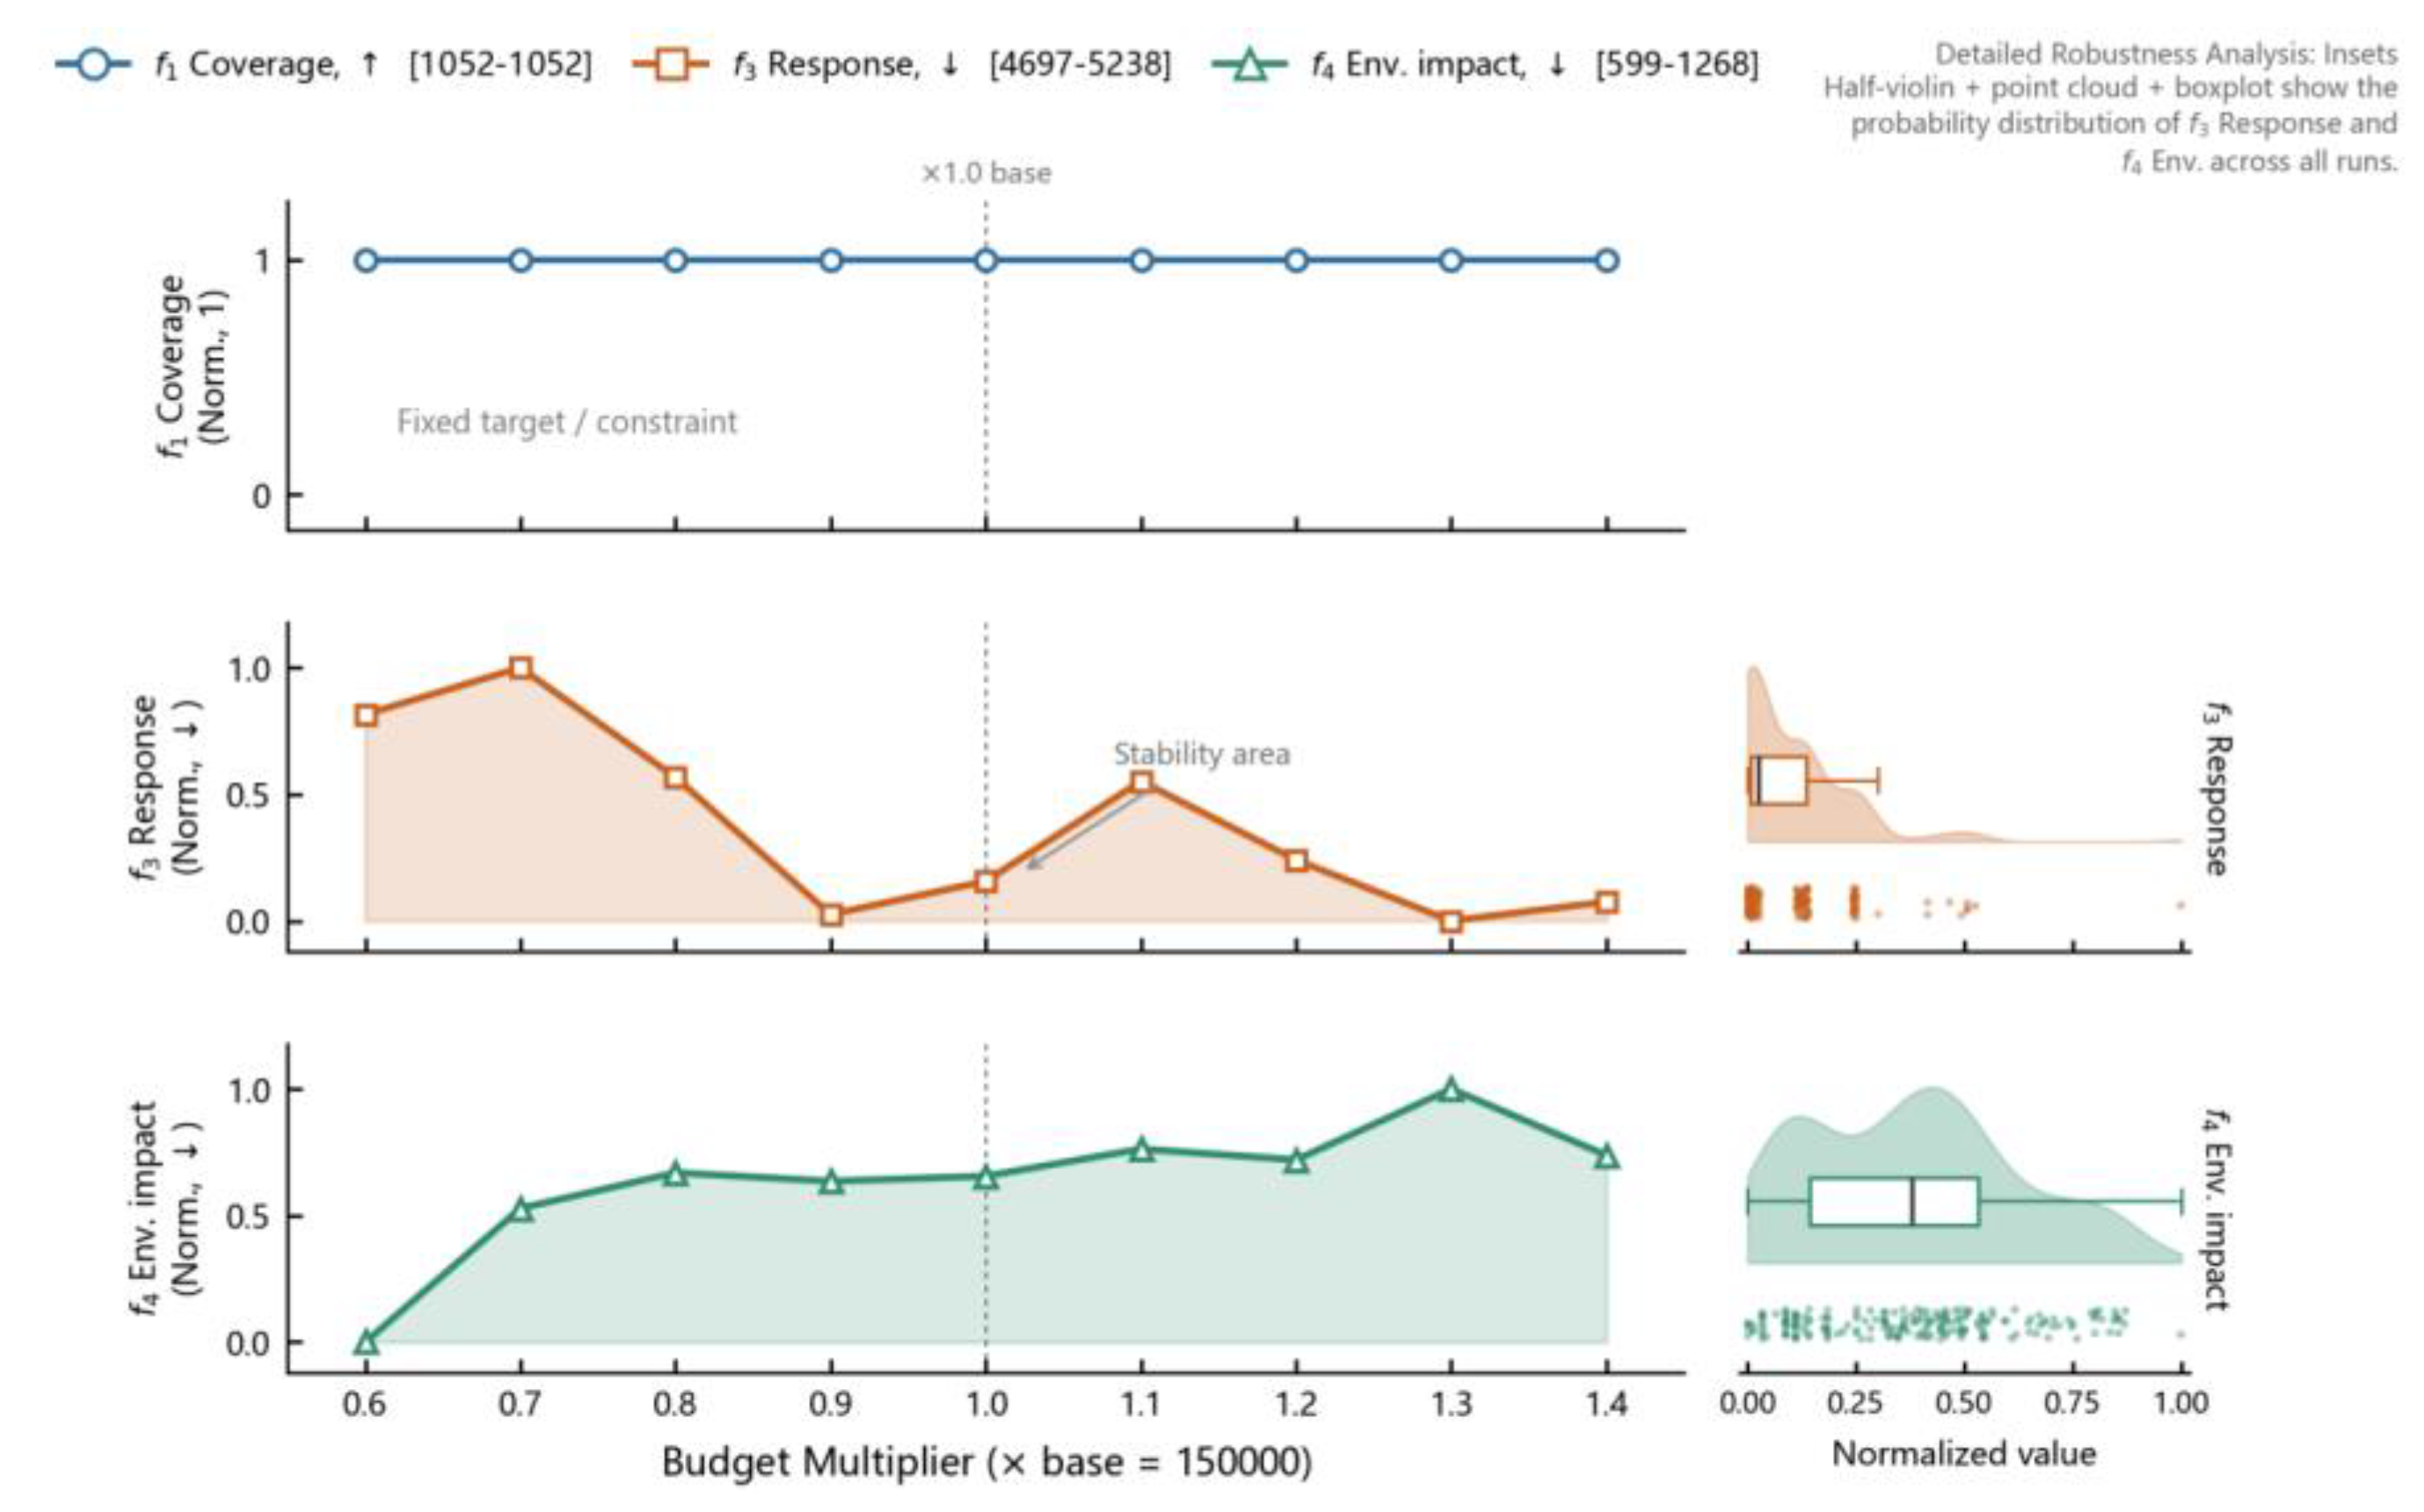
Figure 7.
Variation in the number of vertiports of each grade with construction cost.
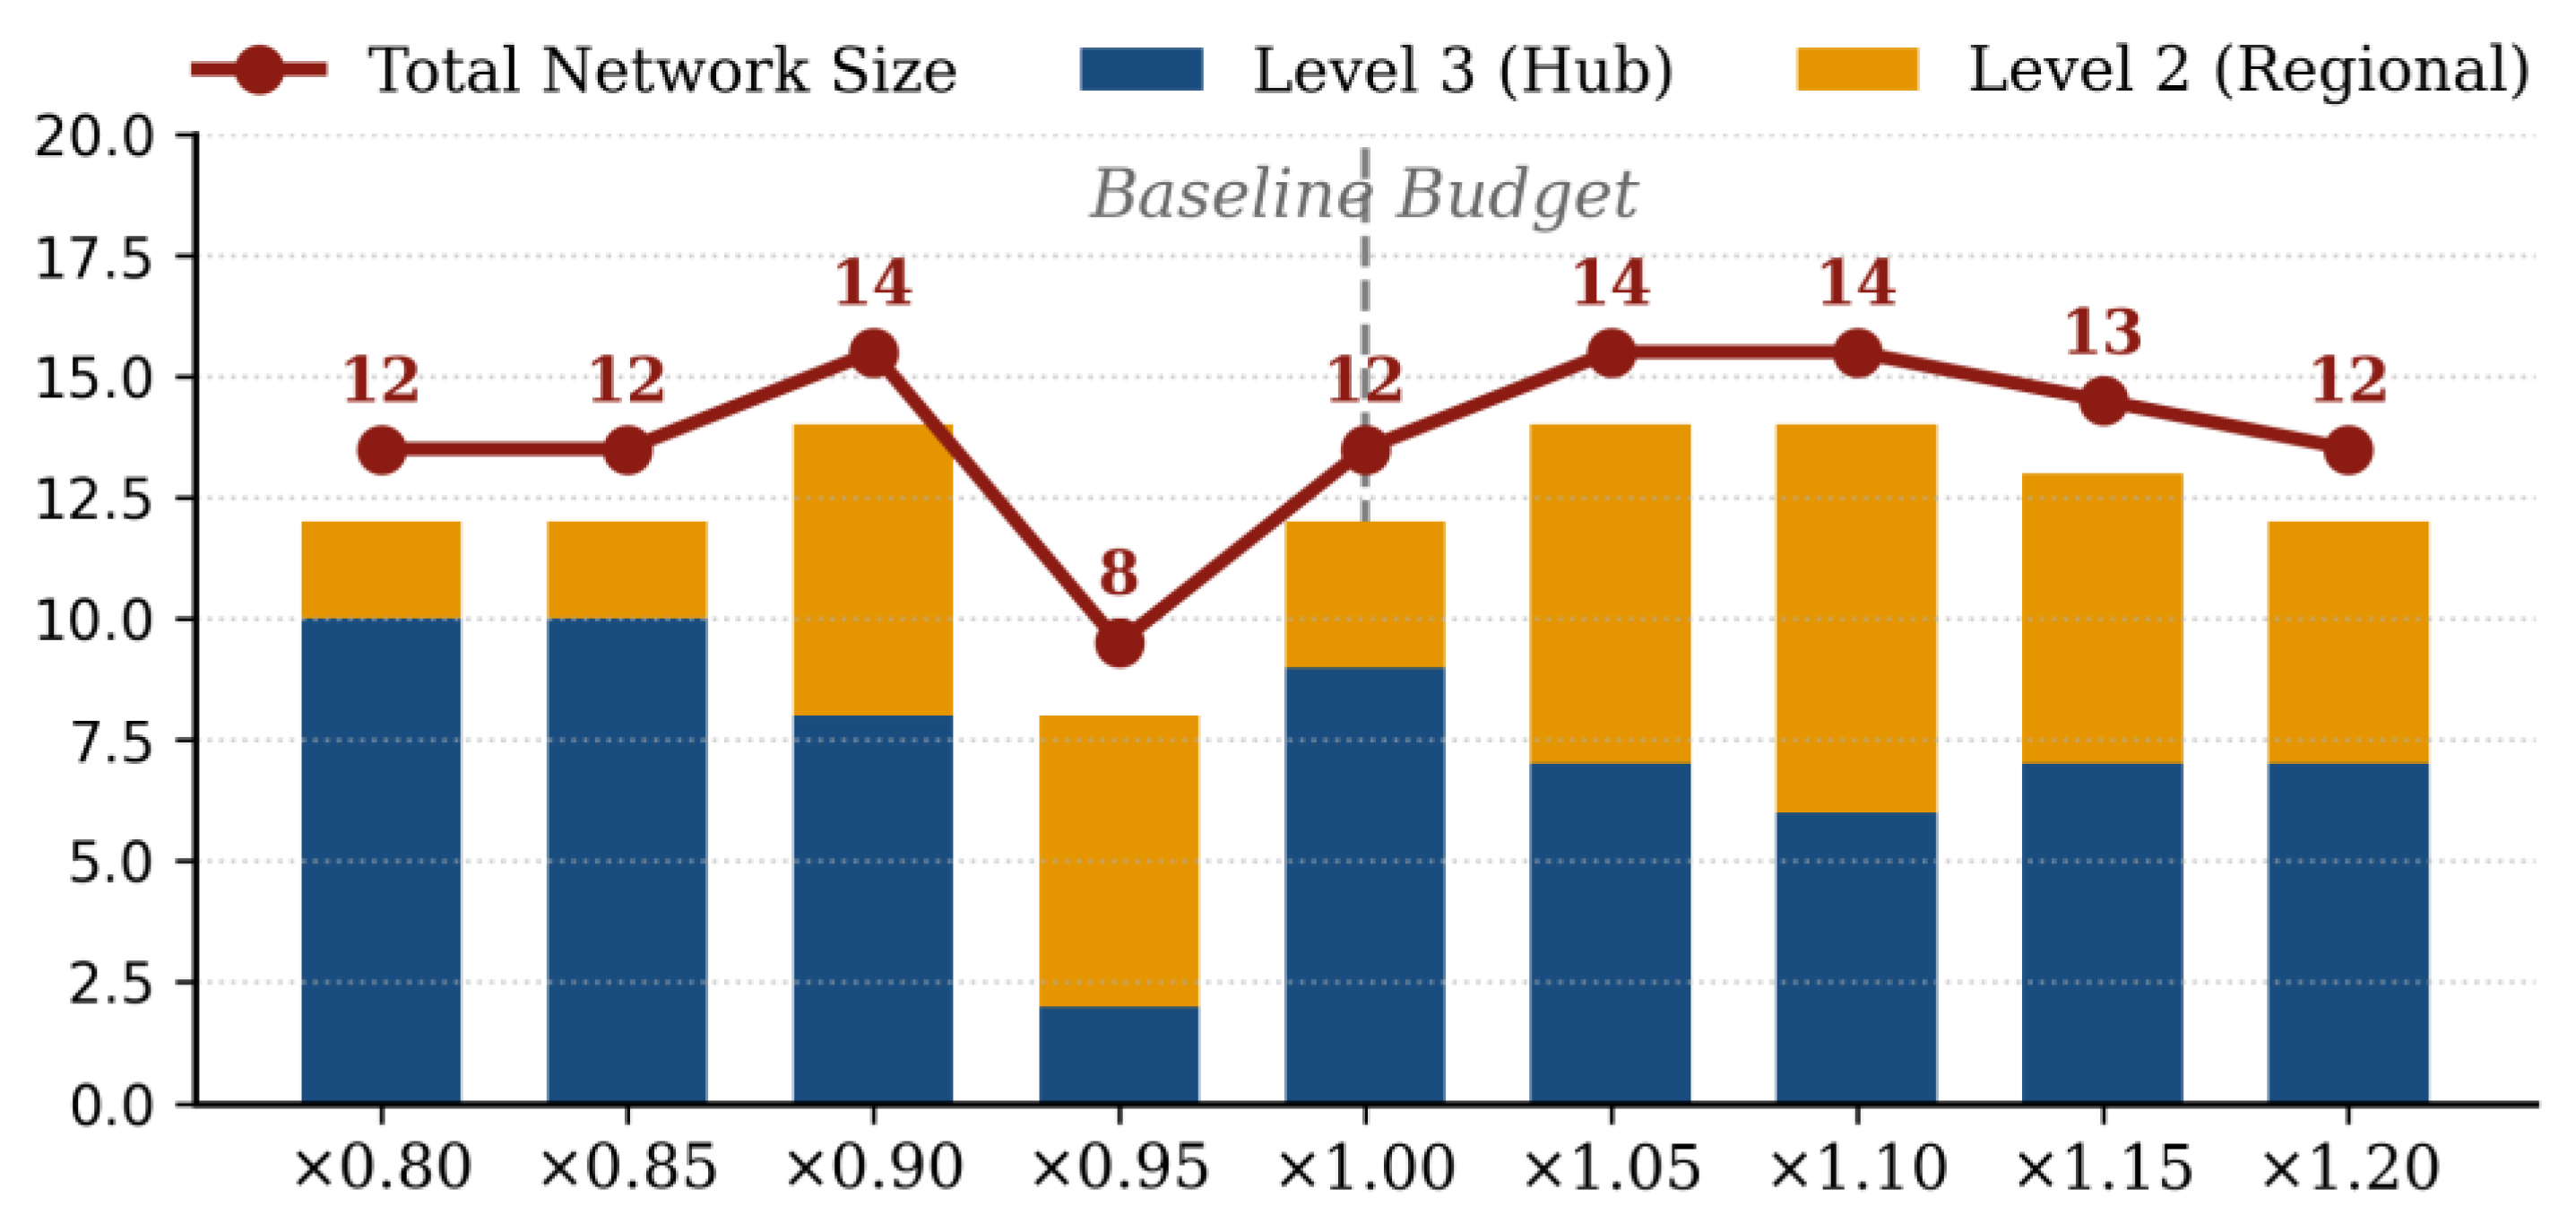
Figure 8.
Trade-off curve between service coverage and social negative impact.
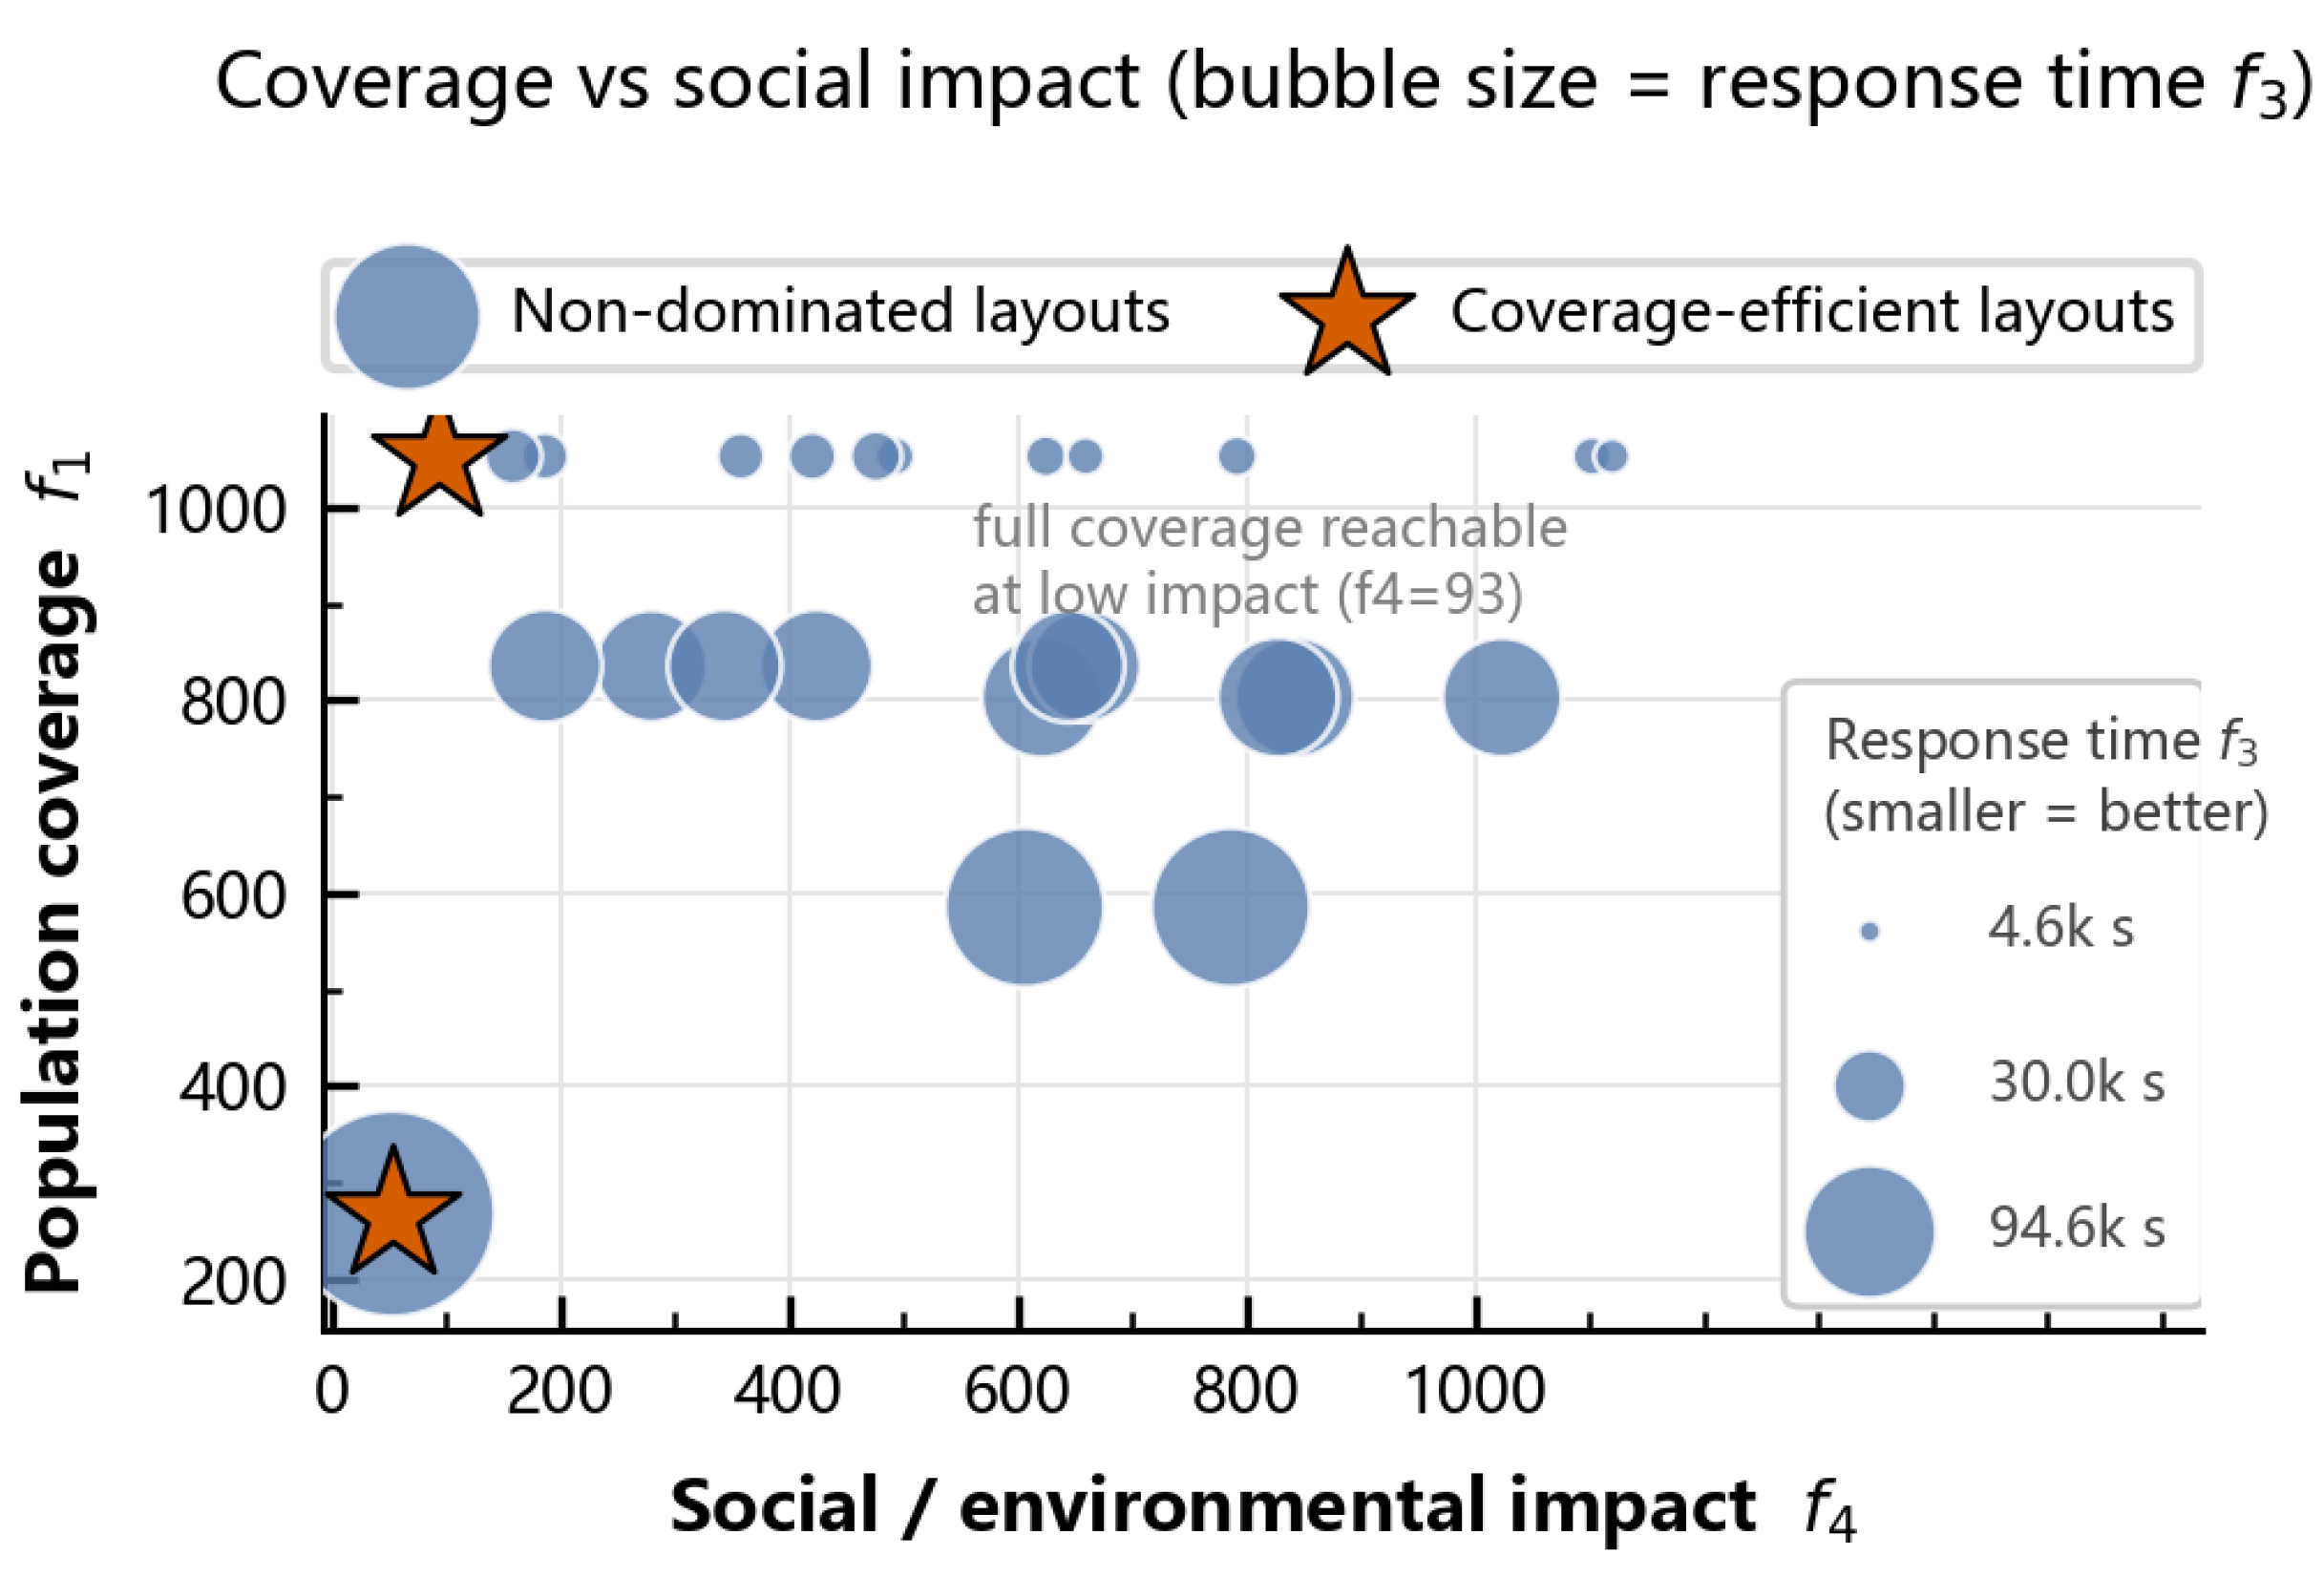
Figure 9.
Evolution of robust reliability and nominal coverage with e, and the price-of-robustness curve.
Figure 9.
Evolution of robust reliability and nominal coverage with e, and the price-of-robustness curve.
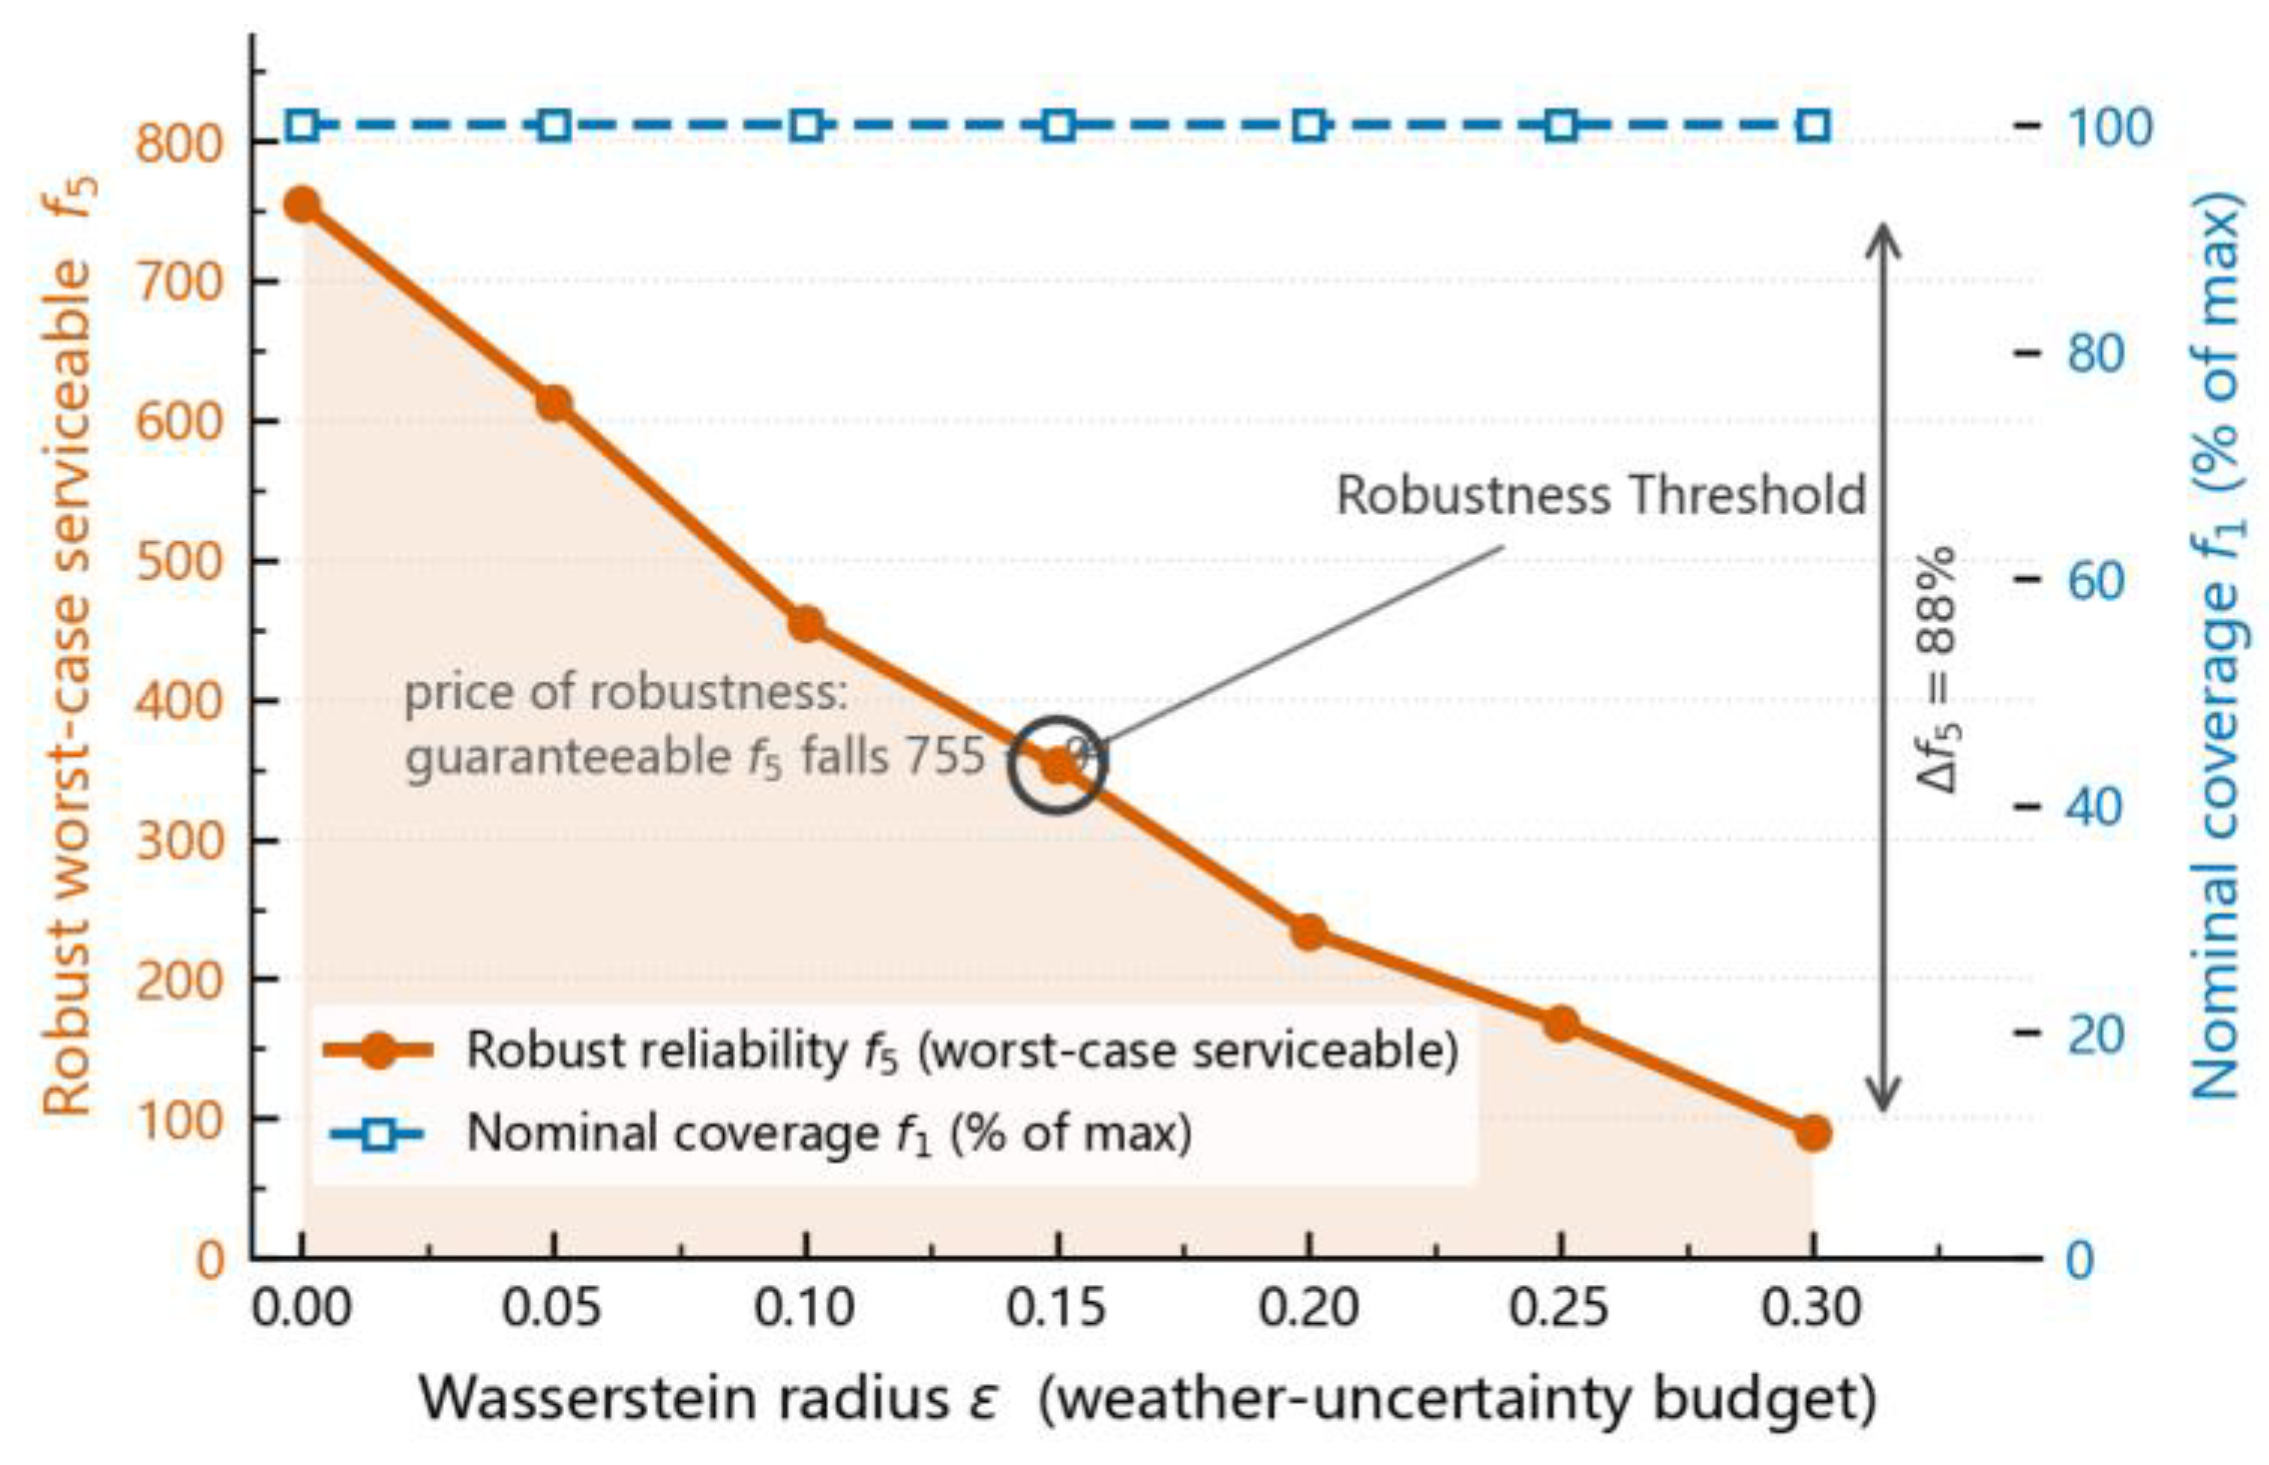
Figure 10.
Evolution of captured demand, queuing load, and layout form with demand elasticity theta.
Figure 10.
Evolution of captured demand, queuing load, and layout form with demand elasticity theta.
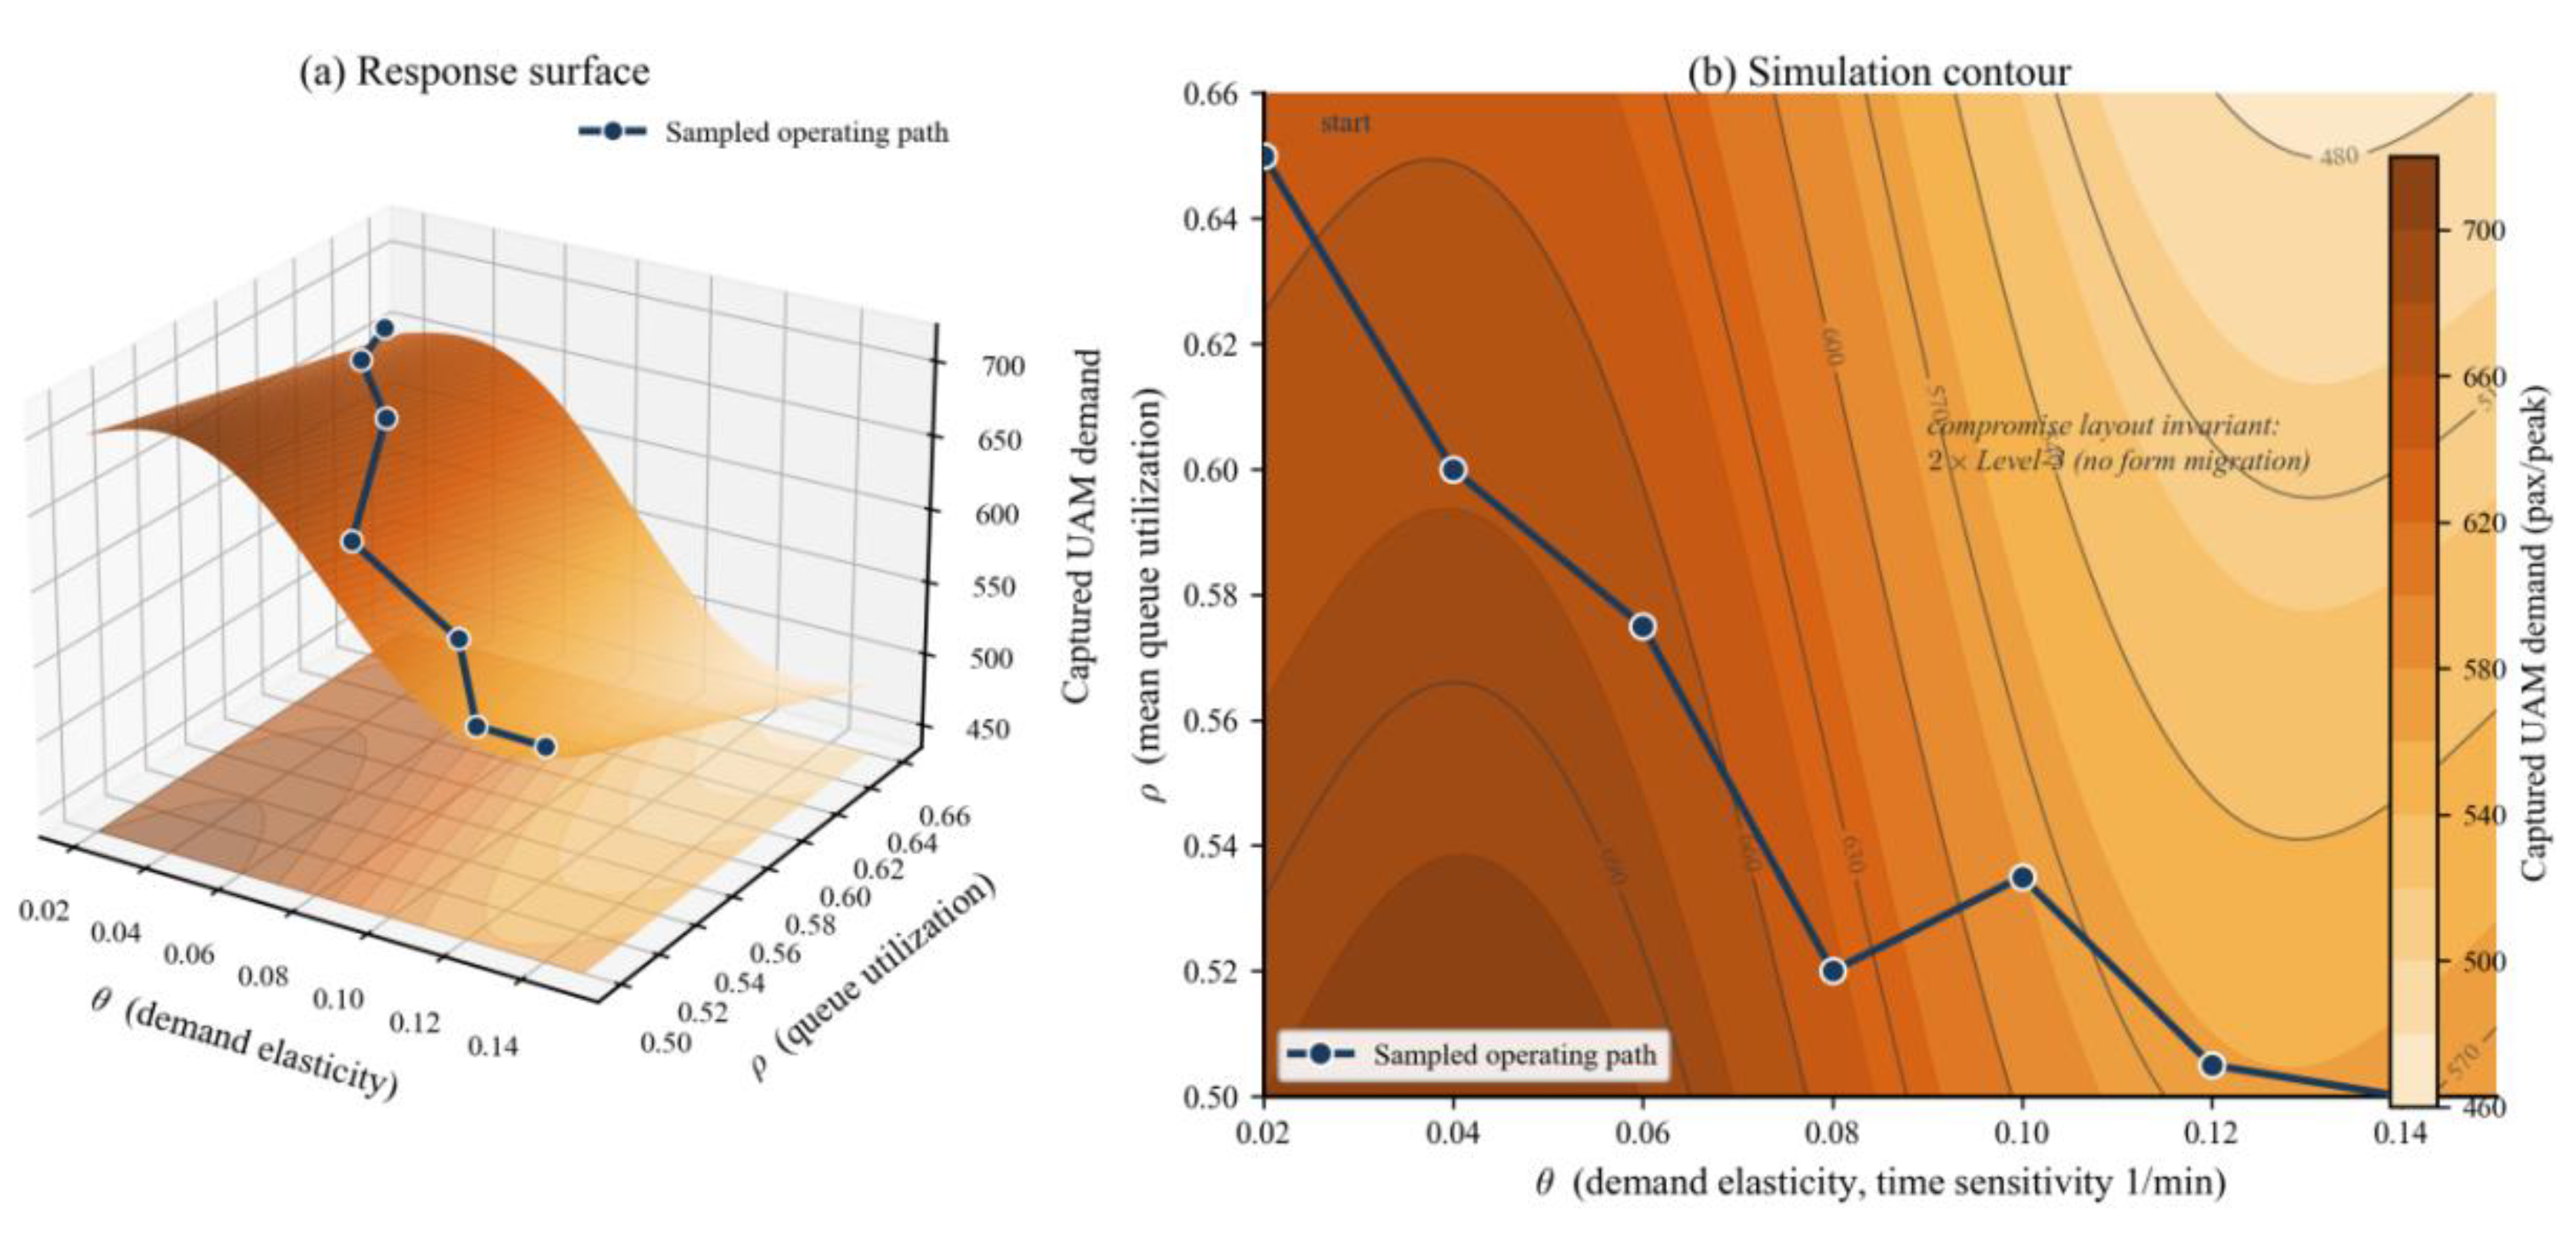

Table 1.
Main notation and definitions.
| Symbol | Definition |
| V, D, N | Candidate site set, demand point set, sensitive point set |
| T (t)、L (ℓ) | Function type set {traf, emer, med, gov} and type index t; capacity level set {1,2,3} and grade index l |
| yᵢ | Whether site i is built (0/1) |
| z{i,t,ℓ} | Whether site i is built as type t, grade l (0/1) |
| x{ik} | Whether demand point k is served by site i (0/1) |
| bₖ | Whether demand point k is covered (0/1) |
| qₖ, dₖ | Population weight and potential OD demand of point k |
| d̂ₖ | Endogenous demand captured by the UAM system |
| λᵢ, ρᵢ | Arrival rate and queuing utilization of site i |
| cₜ,ℓ, μₜ,ℓ | Number of servers (FATO/stands) and unit service rate of type t grade l |
| Wᵢ | M/M/c queuing waiting delay at site i |
| Rₜ,ℓ | Service radius of type t grade l |
| τᵢₖ, τₖᵍ | UAM door-to-door generalized time via site i; generalized time of the ground mode |
| θ | Traveler time sensitivity (demand elasticity coefficient) |
| Pᵢₖ | Logit probability of a traveler choosing site i |
| ξᵢ | Availability of site i under weather disturbance (0/1) |
| ε | Wasserstein radius (weather uncertainty budget) |
| κ | Maximum number of sites allowed to fail simultaneously, ceil(e|V|) |
| sᵢ | Service volume of site i |
| cost{i,t,ℓ} | Cost of building site i as type t grade l |
| B, m | Budget upper bound; upper bound on the number of built sites |
| dᵢₖ | Distance from site i to demand point k |
| riskᵢ, σₙ | Risk score of site i; sensitivity of sensitive point n |
| φₜ,ℓ, β | Noise disturbance factor; spatial attenuation factor |
| area{t,ℓ} | Minimum land requirement of type t grade l |
Table 2.
Main parameter settings of the model and algorithm.
| Category | Parameter | Symbol | Baseline value | Basis |
| Algorithm | Population size | N | 160 | Greater than 126 reference points; balances computation cost of the 40-site case |
| Reference-point division per dimension | p | 4 (H=126) | Das-Dennis method, six-objective reference-point division | |
| Maximum number of evaluations | — | 20000 | 40-site case implementation baseline; extendable to 50,000 | |
| Number of independent runs | — | 10 | Runnable baseline for the pure-Python implementation; extendable to 30 for statistical tests | |
| Crossover/mutation probability | Pc/Pm | 0.9/0.1 (adaptive) | NSGA-series baseline | |
| Evaluation acceleration | — | Caching + vectorization; Kriging extendable | Reduces repeated fixed-point evaluation and radius-check overhead | |
| Capacity | Number of servers (grade 1/2/3) | ct,ℓ | 1/2/4 | FAA EB-105, EASA PTS-VPT-DSN |
| Service rate (grade 1/2/3) | μt,ℓ | 10/12/15 movements/h | Back-calculated from 4-6 min FATO occupancy per movement | |
| Service radius (grade 1/2/3) | Rt,ℓ | 5/15/30 km | Graded service range + Huangpu District scale | |
| eVTOL cruise speed | — | 160 km/h | Median of Joby/EHang/Volocopter | |
| Cost | Construction cost (grade 1/2/3) | costt,ℓ | 8/40/150 million CNY | Graded estimate for retrofit/new-build types |
| Annual O&M cost | — | 6% of construction cost per year | Empirical ratio for transport infrastructure O&M | |
| Budget upper bound | B | 1.5 billion CNY | Scenario setting (swept 0.6-1.4x in Section 5.5.1) | |
| Upper bound on number of built sites | m | 15 | Construction-scale constraint under 40 candidate sites | |
| Environment | Noise source level (grade 1/2/3) | φt,ℓ | 68/72/76 dBA | Measured eVTOL take-off/landing noise range |
| Noise attenuation | β | 6 dBA per distance doubling | Geometric spreading law of a point source | |
| Sensitive-point noise threshold | — | 55 day / 45 night dBA | Class-1 acoustic-environment quality level | |
| Sensitivity weight (hospital/school/residence) | σn | 1.0/0.9/0.7 | Vulnerability grading to disturbance | |
| Behavior | Time sensitivity | θ | 0.05 (1/min) | Magnitude of the time coefficient in mode choice (swept in Section 5.5.5) |
| Fare coefficient | βc | 0.15 min/CNY | Back-calculated from value of time VOT ~= 40 CNY/h | |
| UAM fare | — | 30 CNY + 8 CNY/km | Premium-access low-range assumption | |
| Robust | Wasserstein radius | ε | 0.10 | Allows about 10% of sites to fail (swept 0-0.3 in Section 5.5.4) |
| Grounding meteorological threshold | — | Crosswind > 12 m/s or visibility < 1.5 km | Conservative setting of eVTOL airworthiness operating limits | |
| Fixed-point convergence tolerance | ελ | 1e-3 | Conventional numerical-iteration tolerance |
Table 3.
Comparison of performance metrics of the four algorithms (mean +/- standard deviation).
| Algorithm | HV | IGD+ | Spacing | Running time/s |
| Classical NSGA-II | 0.581±0.019 | 0.040±0.007 | 0.066±0.006 | 205±8 |
| MOEA/D | 0.075±0.025 | 0.426±0.055 | 0.016±0.018 | 14±1 |
| Standard NSGA-III | 0.532±0.026 | 0.063±0.010 | 0.195±0.043 | 206±8 |
| Improved NSGA-III | 0.592±0.013 | 0.058±0.004 | 0.238±0.030 | 135±8 |
Table 4.
Ablation experiment results.
| Model configuration | Nominal coverage f1 | Actual response time f3 | Robust reliability f5 | Survivable serviceable volume (n-1) |
| Full model | 1052.5 | 6773.0 | 0.0 | 224.2 |
| Without demand endogeneity | 1052.5 | 6952.7 | 0.0 | 281.6 |
| Without queuing delay | 1052.5 | 6698.0 | 0.0 | 282.8 |
| Without distributional robustness | 1052.5 | 8754.0 | 0.0 | 138.0 |
Table 5.
five-objective quantitative comparison of representative layout schemes.
| Scheme | Grade 3/2/1 count | Population coverage f1 | Construction cost f2 | Response time f3 | Environmental impact f4 | Robust reliability f5 |
| Coverage-oriented | 1/0/0 | 1052.5 | 15000 | 10319.2 | 93.2 | 0.0 |
| Cost-oriented | 0/0/1 | 267.5 | 800 | 94639.9 | 52.6 | 0.0 |
| Timeliness-oriented | 7/6/0 | 1052.5 | 129000 | 4565.4 | 1120.0 | 469.9 |
| Environment-oriented | 0/0/1 | 267.5 | 800 | 94639.9 | 52.6 | 0.0 |
| Compromise | 2/0/0 | 1052.5 | 30000 | 6698.0 | 186.4 | 0.0 |
Disclaimer/Publisher’s Note: The statements, opinions and data contained in all publications are solely those of the individual author(s) and contributor(s) and not of MDPI and/or the editor(s). MDPI and/or the editor(s) disclaim responsibility for any injury to people or property resulting from any ideas, methods, instructions or products referred to in the content. |
© 2026 by the authors. Licensee MDPI, Basel, Switzerland. This article is an open access article distributed under the terms and conditions of the Creative Commons Attribution (CC BY) license.
Copyright: This open access article is published under a Creative Commons CC BY 4.0 license, which permit the free download, distribution, and reuse, provided that the author and preprint are cited in any reuse.