

Submitted:
12 July 2026
Posted:
21 July 2026
You are already at the latest version
Abstract
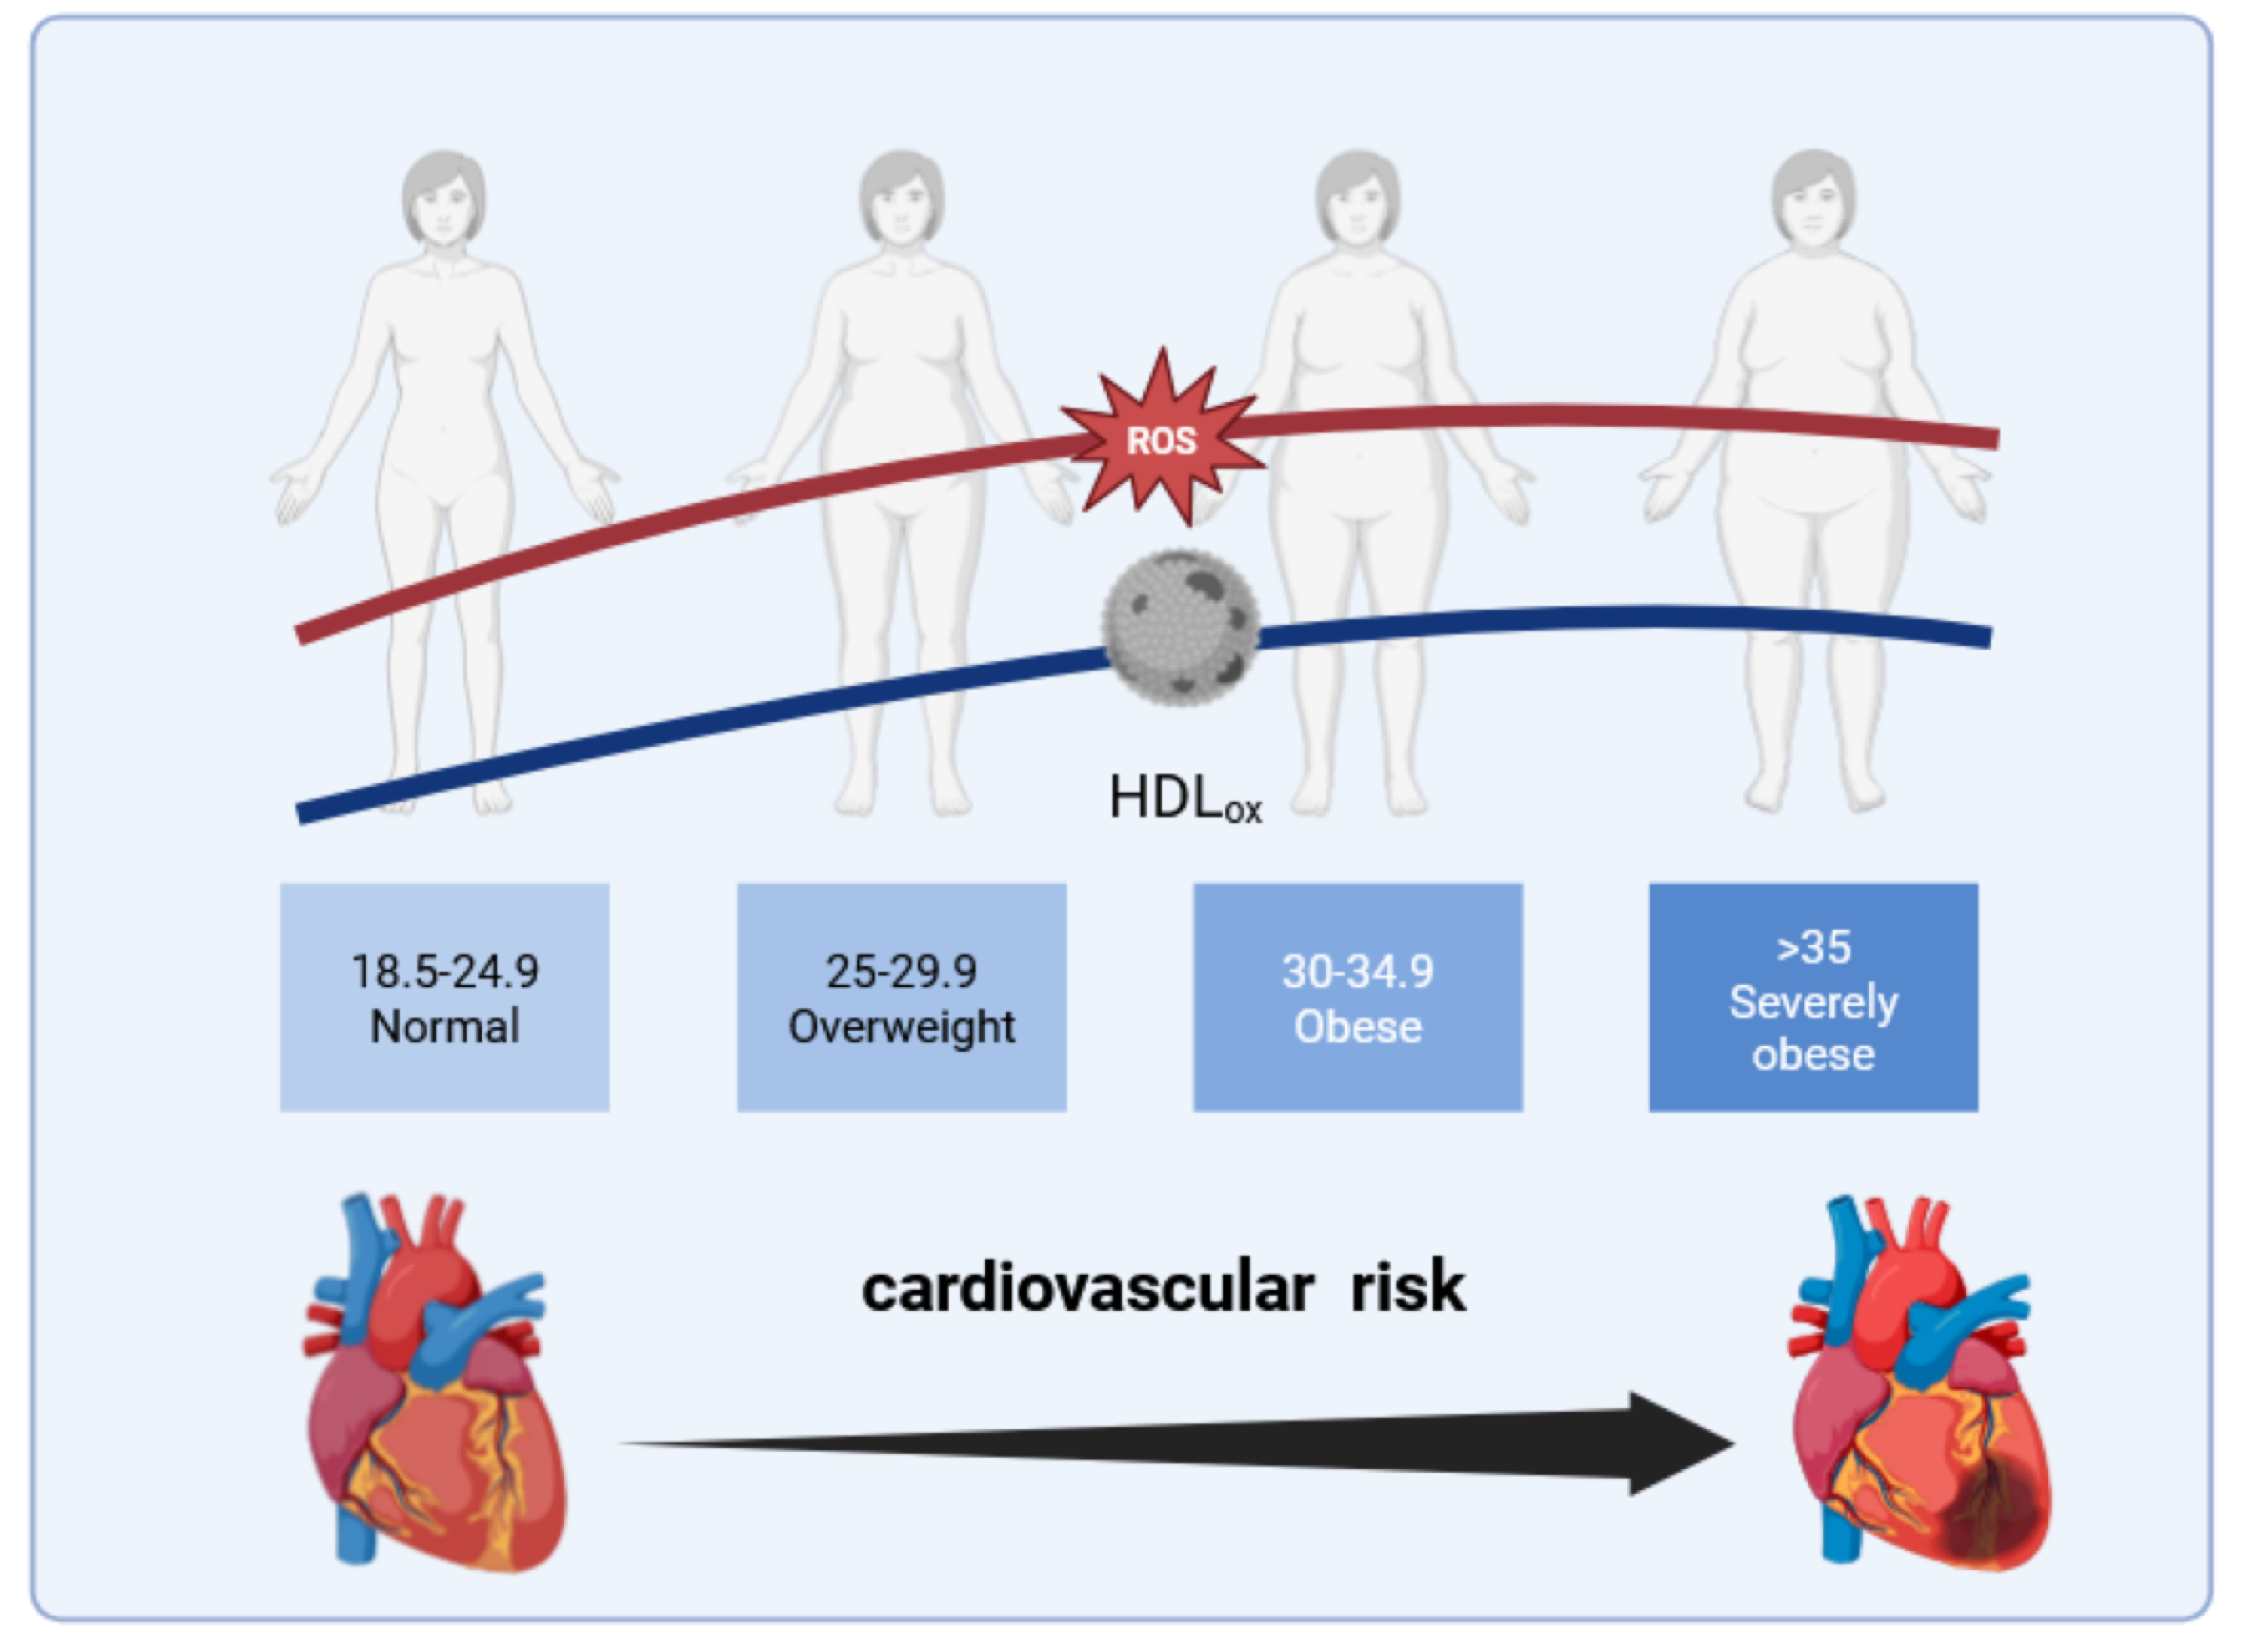
Background: Obesity, commonly defined by body mass index (BMI), promotes cardiovascular disease through chronic inflammation and oxidative stress, which impair high-density lipoprotein (HDL) function and favor oxidative modification. Oxidized HDL (HDLox) may link adiposity to cardiovascular risk. However, the association between BMI and HDLox across the adiposity spectrum remains unclear. We therefore examined this relationship in a Coronary-Suspected Cohort. Methods: This study included 1,227 consecutive patients undergoing elective coronary angiography. Participants were stratified into five predefined BMI categories. HDLox was quantified using a validated fluorometric assay assessing HDL lipid peroxide content. Associations between BMI and HDLox were analyzed using univariable and multivariable linear regression across the full BMI range and within a restricted BMI interval (15–35 kg/m²). Results: HDLox levels were significantly higher in overweight and obese individuals compared with normal-weight participants (p = 0.002 and p < 0.001). HDLox increased from normal weight to obesity class I (BMI 30–34.9 kg/m²) and plateaued at higher BMI levels, indicating a non-linear relationship. In the overall cohort, BMI showed a weak but significant association with HDLox (β = 0.064, p = 0.024). Within the restricted BMI interval, the association was more pronounced (β = 0.158, p < 0.001). In multivariable models, BMI, high-sensitivity C-reactive protein, and male sex remained independently associated with HDLox, whereas traditional cardiovascular risk factors were not. Conclusions: HDL oxidation increases early during weight gain and may represent a functional marker linking adiposity-related inflammation and oxidative stress to cardiovascular vulnerability.
Keywords:
oxidized HDL
; cardiometabolic function
; oxidative stress
; acute coronary syndrome
; HDL function
1. Introduction
Obesity has emerged as one of the most prevalent and consequential risk factors for cardiovascular disease worldwide [1,2]. Its contribution to atherosclerosis, coronary artery disease, and heart failure extends beyond the accumulation of excess body weight and encompasses profound metabolic, inflammatory, and vascular alterations [3,4,5,6]. In contemporary cardiology cohorts, obesity frequently coexists with multiple cardiometabolic comorbidities, creating a state of sustained physiological stress that accelerates cardiovascular disease development and progression.
A defining feature of obesity is chronic, low-grade inflammation [4]. Adipose tissue is recognized as an active endocrine organ that secretes pro-inflammatory cytokines, adipokines, and chemokines, thereby promoting systemic inflammation [3,7]. This inflammatory milieu is closely linked to increased oxidative stress, driven by enhanced production of reactive oxygen species and impaired antioxidant defenses. Together, chronic inflammation and oxidative stress represent central mechanisms through which obesity contributes to endothelial dysfunction, impaired vascular repair, and adverse cardiovascular remodeling [4,8]. However, how these systemic disturbances relate to measurable cardiovascular markers remains under investigation.
Lipid metabolism is profoundly altered in obesity, traditionally characterized by hypertriglyceridaemia, reduced high-density lipoprotein cholesterol (HDL-C), and qualitative changes in lipoprotein composition [9,10,11]. Increasing evidence suggests that the cardiovascular relevance of lipoproteins extends beyond their circulating concentrations and depends critically on their functional properties. In this context, HDL plays a particularly important role [12,13]. In addition to its established function in reverse cholesterol transport, HDL exerts anti-inflammatory, anti-oxidative, and endothelial-protective effects, thereby contributing to vascular homeostasis and repair [14,15,16,17,18]. For these reasons, HDL has been conceptualized as a “repair molecule” that counterbalances inflammation- and oxidation-induced vascular injury. Importantly, HDL is highly susceptible to modification under conditions of metabolic stress. Chronic inflammation and oxidative stress can alter HDL structure and composition, leading to impaired anti-oxidative capacity and loss of anti-inflammatory function [19,20]. Oxidative modification of HDL transforms the particle into a dysfunctional form, commonly referred to as oxidized HDL (HDLox) [19,21,22]. HDLox exhibits reduced protective properties and may even acquire pro-inflammatory characteristics, thereby potentially contributing to vascular dysfunction rather than preventing it [19,20]. As such, oxidized HDL serves as an integrative marker of oxidative stress, inflammation, and altered lipoprotein biology. In this context, we have previously demonstrated that oxidized HDL is associated with a broader state of cardiometabolic dysfunction characterized by vascular inflammation, impaired antioxidant defense, and endothelial dysfunction, as reflected by increased adhesion molecule expression, reduced paraoxonase-1 activity, and disrupted nitric oxide bioavailability [23]. Consistent with these mechanistic associations, elevated levels of HDLox have been linked to coronary artery disease and acute coronary syndromes, heart failure with preserved ejection fraction, and atrial fibrillation [24,25,26].
Obesity establishes a pro-inflammatory and pro-oxidative systemic milieu that promotes oxidative modification of HDL particles. Experimental studies and clinical investigations have provided initial evidence that obesity is associated with impaired HDL function [27,28]. Notably, Davidson and colleagues demonstrated higher levels of oxidized HDL in obese individuals, supporting the notion that excess adiposity is associated with HDL oxidative modification [29]. While this study provided important mechanistic insight, its limited sample size precluded a detailed evaluation of the relationship between body mass index (BMI) and HDL oxidation across the full spectrum of adiposity.
Specifically, it remains unclear whether HDL oxidation increases proportionally across the entire BMI spectrum, whether threshold effects exist, or whether HDL dysfunction already emerges in the pre-obese ranged. It is unclear whether the association between obesity and HDL oxidation follows a linear, dose-dependent pattern across increasing BMI categories or whether HDL oxidation occurs predominantly beyond certain thresholds of adiposity. The relationship between BMI and oxidized HDL has not been systematically examined in large clinical cohorts with substantial cardiometabolic burden, such as those undergoing evaluation for suspected coronary artery disease.
Therefore, the present study investigated the relationship between body mass index and oxidized HDL levels in a large real-world cardiology population. By stratifying participants into established BMI categories ranging from normal weight to severe obesity, we aimed to characterize the distribution of HDLox across increasing degrees of adiposity.
2. Methods
2.1. Study
This analysis was performed at the University Hospital of Brandenburg using data from an established clinical cohort [24]. Adult patients were consecutively enrolled at the time of elective coronary angiography between 2017 and 2019, based solely on routine clinical indications. Participants were referred for angiographic evaluation due to known or suspected coronary artery disease, irrespective of study participation. Patient recruitment and inclusion/exclusion criteria have been detailed in earlier publications [24,25]. Patients were stratified into five predefined body mass index (BMI) categories: normal weight (BMI <25 kg/m²), overweight (BMI 25–29.9 kg/m²), obesity class I (BMI 30–34.9 kg/m²), obesity class II (BMI 35–39.9 kg/m²), and obesity class III (BMI ≥40 kg/m²).
Patients were excluded if they had a history of malignant disease, evidence of acute infection, diagnosed rheumatic or inflammatory disorders, or were younger than 18 years. Only individuals meeting all eligibility criteria were included in the present analysis.
All participants provided written informed consent. The study was approved by the local ethics committees of the Medical Association of Brandenburg (Nr. AS69bB/2016) and the Ruhr University of Bochum (Nr. 15-5279) in accordance with the Declaration of Helsinki. The data supporting the findings of this study are available from the corresponding author upon reasonable request.
2.2. Biomarker and Laboratory Assessment
Fasting blood samples were collected before any procedures in the elective patients. Isolated serum from blood samples was cryopreserved (-80℃). Grossly hemolyzed serum was excluded from further analysis.
Standard clinical assays in the central laboratory unit of the university hospitals obtained laboratory parameters. High-sensitivity C-reactive protein (hs-CRP) was measured using the Roche Tina-Quant CRP (Latex) kit (Roche Diagnostics, Basel, Switzerland). According to the manufacturer's instructions, the lipoprotein-associated Phospholipase A2 (Lp-PLA2) determined by Diasys Lp-PLA2 activity reagent (Diasys Diagnostic Systems, Germany).
2.3. Assessment of Lipid Peroxide Content of HDL (HDLox)
HDLox levels in serum were measured using a modified version of a validated fluorometric biochemical cell-free assay. This method detects HDL lipid peroxide content by tracking the oxidation of the fluorochrome Amplex Red [30,31]. Initially, polyethylene glycol (PEG) precipitation was used to deplete apolipoprotein B (ApoB) from serum. After adding 50 μl of ApoB-depleted serum to each well of a 96-well plate in duplicate, 0.075 units of horseradish peroxidase (HRP) plus 50 µM Amplex Red reagent were applied to each well to reach the total volume of 100 µl. HRP catalyses the reaction between Amplex Red and resorufin when it is coupled with endogenous peroxides. After 1 hour of incubation, a Spark 10M microplate reader (Tecan, Austria) was utilized to determine the fluorescence of resorufin at 535/590 nm wavelengths. To normalize and minimize experimental variability across each plate, ApoB-depleted sera from 10 healthy volunteers (who were not participants in the study) were employed as experimental controls. Mean fluorescence from each sample was normalized by the mean fluorescent readout of the pooled control and HDL-C using the following calculation: “normalized” oxidized HDL (nHDLox) = [HDLox_sample × 47 (mg/dl)]/[HDLox_control × HDL-C sample (mg/dl)], where 47 mg/dl represents HDL-C of the pooled serum control. Samples were analyzed after the recruitment of the last patient. The intra-assay coefficient of variation (CV) was 6.7%. The inter-assay CV was 3.7%. All laboratory measurements were performed in Brandenburg, Germany.
2.4. Statistical Analysis
Initial analyses evaluated the association between BMI and HDLox across the full BMI spectrum using univariable linear regression, treating BMI as a continuous variable. In addition, HDLox levels were descriptively compared across predefined BMI categories to capture potential threshold effects and clinically relevant strata, including normal weight (BMI <25 kg/m²), pre-obesity (BMI 25–29.9 kg/m²), and obesity (BMI ≥30 kg/m²). This stratified approach allowed assessment of early changes in HDL oxidation already in the pre-obese range.
Data distribution was assessed using the Shapiro–Wilk test. When normality was not rejected (p > 0.10), group comparisons were performed using Student’s t-test for two groups or one-way ANOVA for three or more groups. In cases of non-normal distribution, the Mann–Whitney U test was applied for two-group comparisons and the Kruskal–Wallis test for comparisons involving more than two groups. Continuous variables are presented as median with interquartile range, unless stated otherwise. Categorical variables were compared using the χ² test or Fisher’s exact test, as appropriate.
Visual inspection of scatterplots and regression diagnostics indicated a non-linear relationship between BMI and HDLox, characterized by an increase in HDLox at lower BMI values followed by a plateau at higher levels of adiposity. Based on this observation, a secondary restricted-range analysis was performed, limiting the sample to individuals with BMI between 15 and 35 kg/m². This range was selected a priori to reflect a biologically plausible window in which increasing adiposity is most likely to translate into incremental oxidative modification of HDL. Within this restricted BMI range, univariable and multivariable linear regression analyses were conducted to assess the presence and robustness of linear associations between BMI and HDLox.
The restricted-range analysis was performed as a sensitivity and exploratory approach to further characterize the observed non-linear association and was interpreted in conjunction with the primary analyses across the full BMI spectrum. Results from this analysis were not considered confirmatory but were used to support biological plausibility and guide interpretation of the main findings.
All p-values are two-sided, and values <0.05 were considered statistically significant. Statistical analyses were conducted using GraphPad Prism version 8 (GraphPad Software, San Diego, CA, USA).
3. Results
3.1. Demographic Characteristics of Study Candidates
The study population comprised 1,277 individuals stratified into five predefined BMI categories: normal weight (BMI <25 kg/m²), overweight (BMI 25–29.9 kg/m²), obesity class I (BMI 30–34.9 kg/m²), obesity class II (BMI 35–39.9 kg/m²), and obesity class III (BMI ≥40 kg/m²). The majority of participants were classified as overweight or moderately obese, whereas individuals with severe obesity constituted a smaller proportion of the cohort (Table 1 and Table 2).
Across increasing BMI categories, a clear gradient in the prevalence of cardiometabolic comorbidities was observed. Already in the pre-obese range, male sex (OR 1.75, 95% CI 1.28–2.38; p = 0.001), hypertension (OR 1.56, 95% CI 1.07–2.25; p = 0.021), diabetes mellitus (OR 1.61, 95% CI 1.12–2.34; p = 0.010), and coronary artery disease (OR 1.62, 95% CI 1.20–2.18; p = 0.002) were significantly more prevalent compared with normal-weight individuals. These associations were further accentuated in obese participants (BMI ≥30 kg/m²), with markedly higher odds for hypertension (OR 2.11, 95% CI 1.42–3.13; p <0.001) and diabetes mellitus (OR 2.10, 95% CI 1.45–3.04; p <0.001). In contrast, the prevalence of current smoking, hyperlipidaemia, chronic kidney disease, and stroke did not differ significantly across BMI categories (all p >0.3). Atrial fibrillation showed a numerical increase with higher BMI but did not reach statistical significance (OR 1.40, 95% CI 0.97–2.02; p = 0.088). Median age was comparable across BMI strata, with a tendency toward slightly younger age in individuals with severe obesity. Details can be found in Table 1 and Table 2.
3.2. Laboratory Parameters and Metabolic Profile
Laboratory analyses revealed distinct obesity-related metabolic and inflammatory patterns. Markers of glycaemic metabolism, including fasting glucose and HbA1c, increased progressively across BMI categories, demonstrating a clear relationship (p < 0.001 for trend), consistent with the rising prevalence of diabetes mellitus. Lipid profiles showed characteristic obesity-associated alterations: HDL cholesterol levels declined significantly with increasing BMI (p < 0.001), whereas triglyceride concentrations increased stepwise across BMI strata (p < 0.001). In contrast, total cholesterol and LDL cholesterol levels did not differ significantly between BMI categories (both p > 0.10), and lipoprotein(a) concentrations showed no consistent association with BMI (p > 0.20).
Inflammatory burden, reflected by high-sensitivity C-reactive protein, increased across BMI categories, indicating progressively enhanced low-grade inflammation with higher adiposity (p < 0.001). Renal function, assessed by estimated glomerular filtration rate, exhibited only modest variation across BMI strata (p > 0.05), consistent with the largely stable prevalence of chronic kidney disease observed in the clinical analyses. For details, please see Table 1 and Table 2.
Overall, stratification by BMI revealed a progressive accumulation of cardiometabolic risk factors, inflammatory burden, and adverse lipid characteristics with increasing adiposity.
3.3. Antioxidant HDL Function in Relation to BMI
As shown in Table 1, HDLox levels were significantly higher in individuals with pre-obesity (BMI 25–29.9 kg/m², p = 0.002) and obesity (BMI ≥ 30 kg/m², p < 0.001) compared with normal-weight participants (BMI < 25 kg/m²). HDLox concentrations differed significantly across predefined BMI categories (Table 2 and Figure 1). Median HDLox values increased from the normal-weight group to the overweight group and reached their highest levels in individuals with obesity class I (BMI 30–34.9 kg/m²). This increase was already evident within the pre-obese range. In contrast, no further stepwise increase was observed in higher obesity classes; HDLox levels in obesity class II and class III remained elevated but were comparable to those in obesity class I, indicating a plateau at higher degrees of adiposity.
Across the entire cohort, the association between BMI and HDLox was non-linear, characterized by an increase at lower BMI levels followed by a plateau at higher BMI values (Table 2 and Figure 2). Accordingly, univariable linear regression across the full BMI spectrum showed only a weak, but statistically significant, association between BMI and HDLox (β = 0.064, p = 0.024; R² = 0.004). Given the apparent plateau beyond a BMI of approximately 35 kg/m², a secondary restricted-range analysis was performed in participants with BMI between 15 and 35 kg/m². Within this biologically relevant range, BMI was linearly associated with HDLox (β = 0.158, p < 0.001), indicating a stronger relationship between adiposity and HDL oxidation at lower to moderate BMI levels.
3.4. HDLox in Metabolically and Inflammation-Focused Models
In the overall cohort, a multivariable linear regression model incorporating markers of adiposity, inflammation, and metabolic burden identified several independent determinants of HDLox. Higher BMI remained significantly associated with increased HDLox levels (β = 0.150, p = 0.002), alongside systemic inflammation reflected by hsCRP (β = 0.131, p = 0.004) and male sex (β = 0.202, p < 0.001). Glycaemic burden, assessed by HbA1c, was also independently associated with HDLox (β = 0.103, p = 0.033), although with a smaller effect size. In contrast, age (p = 0.222) and the presence of coronary artery disease (p = 0.206) were not independently associated with HDLox.
Given the non-linear association observed in univariable analyses, a restricted multivariable model was additionally performed in participants with BMI < 35 kg/m². Within this range, the association between adiposity and HDL oxidation became more pronounced. BMI remained independently associated with HDLox (β = 0.169, p = 0.001), together with hsCRP (β = 0.144, p = 0.004) and male sex (β = 0.225, p < 0.001). In contrast, HbA1c (p = 0.156), age (p = 0.324), hypertension, and coronary artery disease (all p > 0.4) were not independently associated with HDLox. Collectively, these findings indicate that HDL oxidation in the lower-to-moderate adiposity range is primarily driven by adiposity-related inflammatory stress rather than by established cardiovascular disease or advanced metabolic derangement.
3.5. Cardiovascular Risk Factor Model
In a multivariable linear regression model incorporating established cardiovascular risk factors in the overall cohort, BMI (β = 0.113, p = 0.007) and male sex (β = 0.195, p < 0.001) remained independently associated with higher HDLox levels. LDL cholesterol showed an inverse association with HDLox (β = –0.114, p = 0.006). In contrast, age, hypertension, smoking status, HbA1c, and the presence of coronary artery disease were not independently associated with HDLox. Overall, this cardiovascular risk factor–based model showed limited explanatory performance, indicating that traditional cardiovascular risk factors capture only a small proportion of the determinants of HDL oxidation.
A similar pattern was observed in a cardiovascular risk factor model restricted to participants with BMI < 35 kg/m². BMI (β = 0.126, p = 0.004) and male sex (β = 0.228, p < 0.001) remained independently associated with HDLox, while LDL cholesterol again showed an inverse association (β = –0.120, p = 0.007). Other cardiovascular risk factors, including age, hypertension, smoking status, HbA1c, and coronary artery disease, were not independently related to HDLox, underscoring the limited ability of classical cardiovascular risk profiles to explain HDL oxidation.
3.6. HDLox in Relation to BMI and Coronary Artery Disease (CAD)
As shown in Figure 3A–B, HDLox levels were higher in individuals with CAD compared with those without CAD within both the pre-obese (BMI 25–29.9 kg/m²) and obese (BMI ≥30 kg/m²) categories. In Figure 3B, linear regression analyses demonstrated a significant positive association between BMI and HDLox within the CAD group, whereas this association was weaker and not consistently significant in individuals without CAD. Despite statistical significance, the proportion of variance explained by BMI was low, as reflected by small R² values. Across the entire BMI spectrum, HDLox increased from normal weight to pre-obesity and obesity, with a plateau observed at higher BMI levels. These findings indicate that within CAD patients, higher BMI is associated with increased HDL oxidation, although the overall strength of this association remains modest.
3.7. Subgroup-Analysis Pre-Obesity (BMI 25–29.9 kg/m²)
Within the pre-obese range, HDLox levels were significantly elevated compared with normal weight but remained lower than those observed in manifest obesity (Table 1 and Table 2). In univariable linear regression restricted to participants with pre-obesity, BMI was positively associated with HDLox (standardized β = 0.098, p = 0.006), indicating that even modest increases in BMI within this range were accompanied by higher HDL oxidation.
In a metabolically and inflammatory-focused multivariable model restricted to pre-obese individuals, systemic inflammation and metabolic burden emerged as the dominant determinants of HDLox. Higher hsCRP (β = 0.327, p < 0.001), elevated HbA1c (β = 0.194, p = 0.001), and male sex (β = 0.156, p = 0.008) were independently associated with increased HDLox levels, whereas BMI showed only a positive but non-significant trend after adjustment (β = 0.100, p = 0.076). Age and coronary artery disease were not independently associated with HDLox.
In contrast, a cardiovascular risk factor–based model in the pre-obese subgroup identified male sex (β = 0.199, p < 0.001) and HbA1c (β = 0.145, p = 0.011) as independent predictors of HDLox, while BMI was not independently associated after adjustment. Coronary artery disease showed an inverse association with HDLox (β = –0.158, p = 0.010), and LDL cholesterol demonstrated a borderline inverse association. Overall, these findings indicate that in the pre-obese state, HDL oxidation is more closely linked to early metabolic and inflammatory alterations than to adiposity per se or to traditional cardiovascular risk factors.
4. Discussion
In this large clinical cohort, we demonstrate that dysfunctional, oxidized HDL is closely linked to adiposity and systemic inflammation, while being only partially explained by traditional cardiovascular risk factors. Our findings reveal a non-linear relationship between BMI and HDL oxidation. Notably, HDLox levels are already elevated in individuals classified as overweight (BMI 25–29.9 kg/m²), increase further with moderate obesity (BMI 30–34.9 kg/m²), and subsequently plateau at higher BMI levels. This pattern indicates a critical window during which HDL dysfunction emerges early in the course of weight gain and does not increase proportionally with more advanced stages of obesity.
Across the full BMI spectrum, univariable analyses showed only a weak linear association between BMI and HDLox. However, restriction to biologically relevant BMI ranges uncovered a more distinct relationship. In individuals with BMI below 35 kg/m², BMI was robustly and independently associated with HDLox, suggesting that increasing adiposity exerts its strongest impact on HDL function at early to moderate stages of weight gain. This plateau may reflect a ceiling effect in oxidative modification capacity, beyond which additional adiposity no longer translates into proportionally higher lipid peroxidation of HDL particles.
HDL is increasingly recognized not merely as a cholesterol carrier but as a dynamic functional particle whose antioxidative, anti-inflammatory, and vasoprotective properties depend on its structural integrity [14,15,16,17,18]. Obesity-associated chronic low-grade inflammation and oxidative stress induce qualitative remodeling of HDL particles, including triglyceride enrichment, altered apolipoprotein composition, and displacement of protective enzymes such as paraoxonase-1 (PON-1) [9,28,29,32]. changes impair antioxidant capacity and increase susceptibility to oxidative modification. Importantly, such functional impairment may occur despite relatively preserved HDL cholesterol levels, underscoring the dissociation between HDL quantity and HDL quality [33].
Expanding adipose tissue actively interacts with circulating lipoproteins and modulates cholesterol flux, as demonstrated in experimental models [34]. Early adipocyte hypertrophy is accompanied by inflammatory activation and increased production of reactive oxygen species [39,40,41,42,43,44,45]. Within this pro-oxidative milieu, structurally remodeled HDL particles become more vulnerable to lipid peroxidation, consistent with the elevated HDLox levels observed in our cohort and prior mechanistic work linking HDL oxidation to reduced antioxidant capacity [32,33,34,35,36].
In the presence of adiposity-associated low-grade inflammation and oxidative stress, such structurally and functionally altered HDL particles may be particularly prone to oxidation, consistent with the elevated HDLox levels observed in our cohort [32].
A particularly important finding of the present study is that HDL oxidation is already significantly increased in the pre-obese range, indicating that qualitative HDL dysfunction emerges early during weight gain. This observation is biologically plausible in light of adipose tissue biology at early stages of adiposity expansion [35,36]. Pre-obesity should not be regarded as a metabolically neutral state, as even modest increases in fat mass are accompanied by early adipocyte hypertrophy, altered adipokine secretion, and the initiation of low-grade inflammatory processes within adipose tissue [36,37,38,39,40,41]. Experimental and translational studies have demonstrated that early adipose tissue expansion is associated with macrophage infiltration and increased release of proinflammatory cytokines and reactive oxygen species, well before overt obesity or clinically apparent metabolic disease develops [42]. These early inflammatory and oxidative signals create a systemic environment capable of directly affecting circulating lipoproteins.
Across all metabolically focused regression models conducted in our study, systemic inflammation emerged as a central determinant of HDL oxidation. hsCRP consistently showed independent associations with HDLox in both the overall cohort and BMI-restricted analyses, underscoring the close interplay between low-grade inflammation and HDL dysfunction. In the pre-obese subgroup, markers of early metabolic stress - particularly HbA1c - were strongly associated with HDLox, whereas BMI itself lost independent significance after adjustment. This pattern suggests that, at early stages of adiposity, metabolic and inflammatory pathways mediate the adverse effects of weight gain on HDL quality before overt obesity is established. This interpretation is further supported by experimental and proteomic studies demonstrating that inflammatory and metabolic stress remodel HDL composition and function early during weight gain, impairing cholesterol efflux capacity and antioxidant properties prior to the development of overt obesity or dyslipidaemia [43,44].
Experimental evidence from diet-induced obesity models further indicates that pro-inflammatory, immune-driven remodeling of the HDL proteome occurs early during weight gain, preceding the development of hepatic steatosis, dyslipidaemia, and overt metabolic dysfunction [42]. Collectively, these findings highlight the time-dependent nature of cardiometabolic alterations and position HDL oxidation as an early marker of adiposity-related metabolic and inflammatory stress. Their relationship with clinically manifest cardiovascular disease is therefore of particular interest.
Notably, the association between BMI and HDLox reached statistical significance within the CAD subgroup (Figure 3B), this finding reflects an unadjusted within-group relationship rather than an independent effect of CAD. In multivariable analyses, CAD itself was not independently associated with HDLox, suggesting that the observed association is driven by shared underlying mechanisms such as inflammation and metabolic dysregulation. Importantly, this does not contradict previous studies [24,26], which demonstrated higher HDLox levels in patients with CAD. Rather, the present findings extend these observations by indicating that elevated HDLox in CAD likely reflects the accumulation of upstream cardiometabolic and inflammatory processes that characterize both obesity and atherosclerotic disease. Thus, HDL oxidation appears to be more closely linked to the underlying pathophysiological milieu than to the presence of clinically manifest CAD itself, supporting its role as an early and integrative marker of cardiometabolic risk.
Taken together, our findings suggest that oxidized HDL may not merely act as a passive marker of adiposity-related metabolic and inflammatory stress but could also contribute to obesity-related cardiovascular dysfunction. The early increase of HDL oxidation in the pre-obese range, its non-linear behavior across BMI categories, and its close association with systemic inflammation indicate that qualitative HDL dysfunction emerges early during weight gain. Importantly, oxidative modification of HDL not only reflects inflammatory stress but also leads to a loss of its intrinsic antioxidative, anti-inflammatory, and vasoprotective properties. As a consequence, HDL may lose its physiological repair and protective functions and acquire potentially harmful characteristics, thereby amplifying metabolic and vascular injury as already shown in prior research [24,25,26]. The limited explanatory contribution of traditional cardiovascular risk factors further underscores that HDL oxidation captures a distinct biological process that precedes overt obesity and manifest atherosclerotic disease. This dual role of HDLox—as both an early indicator and a potential mediator of adiposity-related cardiometabolic dysfunction—has important implications for risk stratification and therapeutic targeting, emphasizing the need to move beyond static lipid concentrations toward functional assessments of HDL biology.
5. Limitations
Several limitations of this study should be acknowledged. First, the observational and cross-sectional design precludes causal inference. While our findings demonstrate robust associations between adiposity, systemic inflammation, and HDL oxidation, we cannot determine whether HDL oxidation is a cause or a consequence of metabolic and inflammatory stress. Second, HDL oxidation was assessed using a single functional assay, which captures an important aspect of HDL quality but does not comprehensively reflect the full spectrum of HDL functionality. Third, although we adjusted for multiple metabolic and cardiovascular covariates, residual confounding cannot be excluded. In particular, detailed measures of body fat distribution, such as visceral adiposity or ectopic fat depots, were not available and may have provided a more precise assessment of adiposity-related inflammatory burden than BMI alone. Although patients with overt inflammatory diseases were excluded, medication use (e.g., statins and anti-inflammatory agents) may influence HDL oxidation and could therefore represent a source of residual confounding. Fourth, the study cohort consisted of patients undergoing coronary angiography, which may limit generalizability to the broader population. However, this well-characterized clinical cohort also represents individuals at increased cardiometabolic risk, in whom early alterations in HDL function are of particular relevance. Finally, an additional limitation relates to the sex distribution of the study population. The cohort consisted predominantly of male participants, reflecting the clinical referral pattern of patients undergoing coronary angiography for suspected coronary artery disease. As sex-specific differences in HDL composition and function have been reported, the generalizability of our findings to female populations may be limited.
6. Conclusions
The investigation of oxidized HDL in the context of adiposity and inflammation provides new insights into the relationship between obesity and cardiovascular health. Our study indicates that HDL oxidation is closely related to adiposity and systemic inflammation, emerging in the pre-obese range and stabilizing at higher BMI levels. This pattern suggests that HDL dysfunction acts as an early contributor of obesity-driven metabolic disturbances, primarily due to inflammatory and metabolic stress rather than traditional cardiovascular risk factors
These findings support a shift from purely quantitative HDL measures toward functional assessments of HDL quality. While HDL structure and function are largely preserved in metabolically healthy individuals, adipocyte hypertrophy and insulin resistance promote qualitative HDL remodeling and increased susceptibility to oxidation. These findings suggest that functional assessment of HDL quality may provide incremental biological insight beyond HDL-C levels and traditional cardiovascular risk factors, particularly in individuals at early stages of adiposity.
The pre-obese state emerges as a particularly relevant stage, as elevated HDL oxidation precedes manifest obesity, underscoring the potential value of early interventions targeting inflammation and metabolic dysregulation to preserve HDL function. Traditional cardiovascular risk factors show limited ability to explain HDL oxidation, suggesting that HDL quality captures distinct biological processes beyond standard risk assessment. Overall, these insights emphasize the importance of early detection and functional evaluation of HDL in individuals with increasing adiposity.
Funding
This research was supported by grants from Brandenburg Medical School Theodor Fontane and from the BIOX Stiftung (to NP). This research received partial support from NIH grants R01AG059501 (to TK). This research was also supported by the European Union's Horizon 2020 research and innovation program under grant agreement number 739593 (to NH), Deutsche Forschungsgemeinschaft HA 7512/2-4 and HA 7512/2-1 (to NH) and Innovation Forum program of the Medical Faculty number IF-023-22 and IF-034-22 (to NH an IEB). IEB obtained support from the German Heart Foundation, Else-Kröner-Fresenius foundation, and Hector Foundation.
Acknowledgments
We thank Saskia Steinbeiss, Linda Scharow, Rhea Müller and Monique Jaensch for their technical support and patient care.
Data Availability Statement
The data supporting the findings of this study can be obtained from the corresponding author upon reasonable request.
Conflicts of Interest disclosure
The HDLox assay is associated with the patent PCT/US2015/018147 (to TK). The co-authors declare no conflict of interest.
Ethics approval statement
All participants provided written informed consent. The study received approval from the local ethics committees of the Medical Association of Brandenburg (Nr. AS69bB/2016) and of the Ruhr University of Bochum (Nr. 15-5279) in compliance with the Declaration of Helsinki.
Clinical trial registration
DRKS00014037.
Non-standard Abbreviations and Acronyms
BMI: body mass index
CAD: coronary artery disease
CVD: cardiovascular disease
HDL: high-density lipoprotein
HDLox: HDL-lipid peroxide content
nHDLox: normalized HDL-lipid peroxide content
HFpEF: Heart Failure with preserved Ejection Fraction
IL-6: Interleukin-6
LDL: Low-Density Lipoprotein
LDLox: oxidized Low-Density Lipoprotein
NO: Nitric Oxide
PON-1: Paraoxonase-1
VCAM-1: Vascular Cell Adhesion Molecule 1
References
- Collaborators GBDCoD (2018) Global, regional, and national age-sex-specific mortality for 282 causes of death in 195 countries and territories, 1980-2017: a systematic analysis for the Global Burden of Disease Study 2017. Lancet 392:1736–1788. [CrossRef]
- Powell-Wiley TM, Poirier P, Burke LE, Despres JP, Gordon-Larsen P, Lavie CJ, Lear SA, Ndumele CE, Neeland IJ, Sanders P, St-Onge MP, American Heart Association Council on L, Cardiometabolic H, Council on C, Stroke N, Council on Clinical C, Council on E, Prevention and Stroke C (2021) Obesity and Cardiovascular Disease: A Scientific Statement From the American Heart Association. Circulation 143:e984–e1010. [CrossRef]
- Bray GA (2004) Medical consequences of obesity. J Clin Endocrinol Metab 89:2583–9. [CrossRef]
- Hotamisligil GS (2006) Inflammation and metabolic disorders. Nature 444:860–7. [CrossRef]
- Lavie CJ, Milani RV and Ventura HO (2009) Obesity and cardiovascular disease: risk factor, paradox, and impact of weight loss. J Am Coll Cardiol 53:1925–32. [CrossRef]
- Wilson PW, D'Agostino RB, Sullivan L, Parise H and Kannel WB (2002) Overweight and obesity as determinants of cardiovascular risk: the Framingham experience. Arch Intern Med 162:1867–72. [CrossRef]
- Tilg H, Ianiro G, Gasbarrini A and Adolph TE (2025) Adipokines: masterminds of metabolic inflammation. Nat Rev Immunol 25:250–265. [CrossRef]
- Madamanchi NR, Vendrov A and Runge MS (2005) Oxidative stress and vascular disease. Arterioscler Thromb Vasc Biol 25:29–38. [CrossRef]
- Davidson WS, Heink A, Sexmith H, Dolan LM, Gordon SM, Otvos JD, Melchior JT, Elder DA, Khoury J, Geh E and Shah AS (2017) Obesity is associated with an altered HDL subspecies profile among adolescents with metabolic disease. J Lipid Res 58:1916–1923. [CrossRef]
- Bays HE, Toth PP, Kris-Etherton PM, Abate N, Aronne LJ, Brown WV, Gonzalez-Campoy JM, Jones SR, Kumar R, La Forge R and Samuel VT (2013) Obesity, adiposity, and dyslipidemia: a consensus statement from the National Lipid Association. J Clin Lipidol 7:304–83. [CrossRef]
- Nguyen NT, Magno CP, Lane KT, Hinojosa MW and Lane JS (2008) Association of hypertension, diabetes, dyslipidemia, and metabolic syndrome with obesity: findings from the National Health and Nutrition Examination Survey, 1999 to 2004. J Am Coll Surg 207:928–34. [CrossRef]
- Navab M, Reddy ST, Van Lenten BJ and Fogelman AM (2011) HDL and cardiovascular disease: atherogenic and atheroprotective mechanisms. Nat Rev Cardiol 8:222–32. [CrossRef]
- Mody P, Joshi PH, Khera A, Ayers CR and Rohatgi A (2016) Beyond Coronary Calcification, Family History, and C-Reactive Protein: Cholesterol Efflux Capacity and Cardiovascular Risk Prediction. J Am Coll Cardiol 67:2480–7. [CrossRef]
- Navab M, Yu R, Gharavi N, Huang W, Ezra N, Lotfizadeh A, Anantharamaiah GM, Alipour N, Van Lenten BJ, Reddy ST and Marelli D (2007) High-density lipoprotein: antioxidant and anti-inflammatory properties. Curr Atheroscler Rep 9:244–8. [CrossRef]
- Rosenson RS, Brewer HB, Jr., Davidson WS, Fayad ZA, Fuster V, Goldstein J, Hellerstein M, Jiang XC, Phillips MC, Rader DJ, Remaley AT, Rothblat GH, Tall AR and Yvan-Charvet L (2012) Cholesterol efflux and atheroprotection: advancing the concept of reverse cholesterol transport. Circulation 125:1905–19. [CrossRef]
- Mineo C, Yuhanna IS, Quon MJ and Shaul PW (2003) High density lipoprotein-induced endothelial nitric-oxide synthase activation is mediated by Akt and MAP kinases. J Biol Chem 278:9142–9. [CrossRef]
- Seetharam D, Mineo C, Gormley AK, Gibson LL, Vongpatanasin W, Chambliss KL, Hahner LD, Cummings ML, Kitchens RL, Marcel YL, Rader DJ and Shaul PW (2006) High-density lipoprotein promotes endothelial cell migration and reendothelialization via scavenger receptor-B type I. Circ Res 98:63–72. [CrossRef]
- Yvan-Charvet L, Welch C, Pagler TA, Ranalletta M, Lamkanfi M, Han S, Ishibashi M, Li R, Wang N and Tall AR (2008) Increased inflammatory gene expression in ABC transporter-deficient macrophages: free cholesterol accumulation, increased signaling via toll-like receptors, and neutrophil infiltration of atherosclerotic lesions. Circulation 118:1837–47. [CrossRef]
- Undurti A, Huang Y, Lupica JA, Smith JD, DiDonato JA and Hazen SL (2009) Modification of high density lipoprotein by myeloperoxidase generates a pro-inflammatory particle. J Biol Chem 284:30825–35. [CrossRef]
- Van Lenten BJ, Hama SY, de Beer FC, Stafforini DM, McIntyre TM, Prescott SM, La Du BN, Fogelman AM and Navab M (1995) Anti-inflammatory HDL becomes pro-inflammatory during the acute phase response. Loss of protective effect of HDL against LDL oxidation in aortic wall cell cocultures. J Clin Invest 96:2758–67. [CrossRef]
- Navab M, Ananthramaiah GM, Reddy ST, Van Lenten BJ, Ansell BJ, Fonarow GC, Vahabzadeh K, Hama S, Hough G, Kamranpour N, Berliner JA, Lusis AJ and Fogelman AM (2004) The oxidation hypothesis of atherogenesis: the role of oxidized phospholipids and HDL. J Lipid Res 45:993–1007. [CrossRef]
- Kelesidis T, Currier JS, Huynh D, Meriwether D, Charles-Schoeman C, Reddy ST, Fogelman AM, Navab M and Yang OO (2011) A biochemical fluorometric method for assessing the oxidative properties of HDL. J Lipid Res 52:2341–2351. [CrossRef]
- Sasko B, Pagonas N, Christ M, Wintrich J, Ritter O, Ukena C, Sultana I, Delalat S, El-Battrawy I, Kelesidis T and Hamdani N (2025) Oxidized high-density lipoprotein associates with cardiometabolic dysfunction in coronary artery disease and acute coronary syndrome. J Intern Med 298:464–477. [CrossRef]
- Sasko B, Scharow L, Mueller R, Jaensch M, Dammermann W, Seibert FS, Hillmeister P, Buschmann I, Christ M, Ritter O, Hamdani N, Ukena C, Westhoff TH, Kelesidis T and Pagonas N (2025) Reduced high-density lipoprotein antioxidant function in patients with coronary artery disease and acute coronary syndrome. JCI Insight 10. [CrossRef]
- Pagonas N, Mueller R, Weiland L, Jaensch M, Dammermann W, Seibert FS, Hillmeister P, Buschmann I, Christ M, Ritter O, Westhoff TH, Sasko B and Kelesidis T (2024) Oxidized high-density lipoprotein associates with atrial fibrillation. Heart Rhythm 21:362–369. [CrossRef]
- Sasko B, Kelesidis T, Kostin S, Scharow L, Mueller R, Jaensch M, Wintrich J, Christ M, Ritter O, Ukena C and Pagonas N (2026) Reduced antioxidant high-density lipoprotein function in heart failure with preserved ejection fraction. Clin Res Cardiol 115:232–240. [CrossRef]
- de Lima-Junior JC, Virginio VWM, Moura FA, Bertolami A, Bertolami M, Coelho-Filho OR, Zanotti I, Nadruz W, de Faria EC, de Carvalho LSF and Sposito AC (2020) Excess weight mediates changes in HDL pool that reduce cholesterol efflux capacity and increase antioxidant activity. Nutr Metab Cardiovasc Dis 30:254–264. [CrossRef]
- Stadler JT, Lackner S, Morkl S, Trakaki A, Scharnagl H, Borenich A, Wonisch W, Mangge H, Zelzer S, Meier-Allard N, Holasek SJ and Marsche G (2021) Obesity Affects HDL Metabolism, Composition and Subclass Distribution. Biomedicines 9. [CrossRef]
- Davidson WS, Inge TH, Sexmith H, Heink A, Elder D, Hui DY, Melchior JT, Kelesidis T and Shah AS (2017) Weight loss surgery in adolescents corrects high-density lipoprotein subspecies and their function. Int J Obes (Lond) 41:83–89. [CrossRef]
- Kelesidis T, Roberts CK, Huynh D, Martinez-Maza O, Currier JS, Reddy ST and Yang OO (2014) A high throughput biochemical fluorometric method for measuring lipid peroxidation in HDL. PLoS One 9:e111716. [CrossRef]
- Sen Roy S, Nguyen HCX, Angelovich TA, Hearps AC, Huynh D, Jaworowski A and Kelesidis T (2017) Cell-free Biochemical Fluorometric Enzymatic Assay for High-throughput Measurement of Lipid Peroxidation in High Density Lipoprotein. J Vis Exp. [CrossRef]
- Sasahara T, Nestel P, Fidge N and Sviridov D (1998) Cholesterol transport between cells and high density lipoprotein subfractions from obese and lean subjects. J Lipid Res 39:544–54.
- Ferretti G, Bacchetti T, Masciangelo S and Bicchiega V (2010) HDL-paraoxonase and membrane lipid peroxidation: a comparison between healthy and obese subjects. Obesity (Silver Spring) 18:1079–84. [CrossRef]
- Zhang Y, McGillicuddy FC, Hinkle CC, O'Neill S, Glick JM, Rothblat GH and Reilly MP (2010) Adipocyte modulation of high-density lipoprotein cholesterol. Circulation 121:1347–55. [CrossRef]
- Fuster JJ, Ouchi N, Gokce N and Walsh K (2016) Obesity-Induced Changes in Adipose Tissue Microenvironment and Their Impact on Cardiovascular Disease. Circ Res 118:1786–807. [CrossRef]
- Skurk T, Alberti-Huber C, Herder C and Hauner H (2007) Relationship between adipocyte size and adipokine expression and secretion. J Clin Endocrinol Metab 92:1023–33. [CrossRef]
- Visser M, Bouter LM, McQuillan GM, Wener MH and Harris TB (1999) Elevated C-reactive protein levels in overweight and obese adults. JAMA 282:2131–5. [CrossRef]
- Ellulu MS, Patimah I, Khaza'ai H, Rahmat A and Abed Y (2017) Obesity and inflammation: the linking mechanism and the complications. Arch Med Sci 13:851–863. [CrossRef]
- Nguyen XM, Lane J, Smith BR and Nguyen NT (2009) Changes in inflammatory biomarkers across weight classes in a representative US population: a link between obesity and inflammation. J Gastrointest Surg 13:1205–12. [CrossRef]
- Bacchetti T, Morresi C, Simonetti O and Ferretti G (2024) Effect of Diet on HDL in Obesity. Molecules 29. [CrossRef]
- Warnberg J, Moreno LA, Mesana MI, Marcos A and group A (2004) Inflammatory mediators in overweight and obese Spanish adolescents. The AVENA Study. Int J Obes Relat Metab Disord 28 Suppl 3:S59–63. [CrossRef]
- Sadana P, Lin L, Aghayev M, Ilchenko S and Kasumov T (2020) Early Pro-Inflammatory Remodeling of HDL Proteome in a Model of Diet-Induced Obesity: (2)H(2)O-Metabolic Labeling-Based Kinetic Approach. Int J Mol Sci 21. [CrossRef]
- Vaisar T, Tang C, Babenko I, Hutchins P, Wimberger J, Suffredini AF and Heinecke JW (2015) Inflammatory remodeling of the HDL proteome impairs cholesterol efflux capacity. J Lipid Res 56:1519–30. [CrossRef]
- Ronsein GE and Vaisar T (2017) Inflammation, remodeling, and other factors affecting HDL cholesterol efflux. Curr Opin Lipidol 28:52–59. [CrossRef]
Figure 1.
Distribution of oxidized HDL (HDLox) across predefined BMI categories in the study cohort. HDLox levels increased from normal weight to overweight and obesity class I, indicating early HDL oxidation during weight gain. At higher BMI categories, HDLox levels remained elevated but did not increase further, suggesting a plateau of HDL oxidation at more advanced stages of obesity. Data are presented as median with interquartile range. Statistical comparisons between groups were performed using the Kruskal–Wallis test with post-hoc pairwise comparisons where appropriate.
Figure 1.
Distribution of oxidized HDL (HDLox) across predefined BMI categories in the study cohort. HDLox levels increased from normal weight to overweight and obesity class I, indicating early HDL oxidation during weight gain. At higher BMI categories, HDLox levels remained elevated but did not increase further, suggesting a plateau of HDL oxidation at more advanced stages of obesity. Data are presented as median with interquartile range. Statistical comparisons between groups were performed using the Kruskal–Wallis test with post-hoc pairwise comparisons where appropriate.
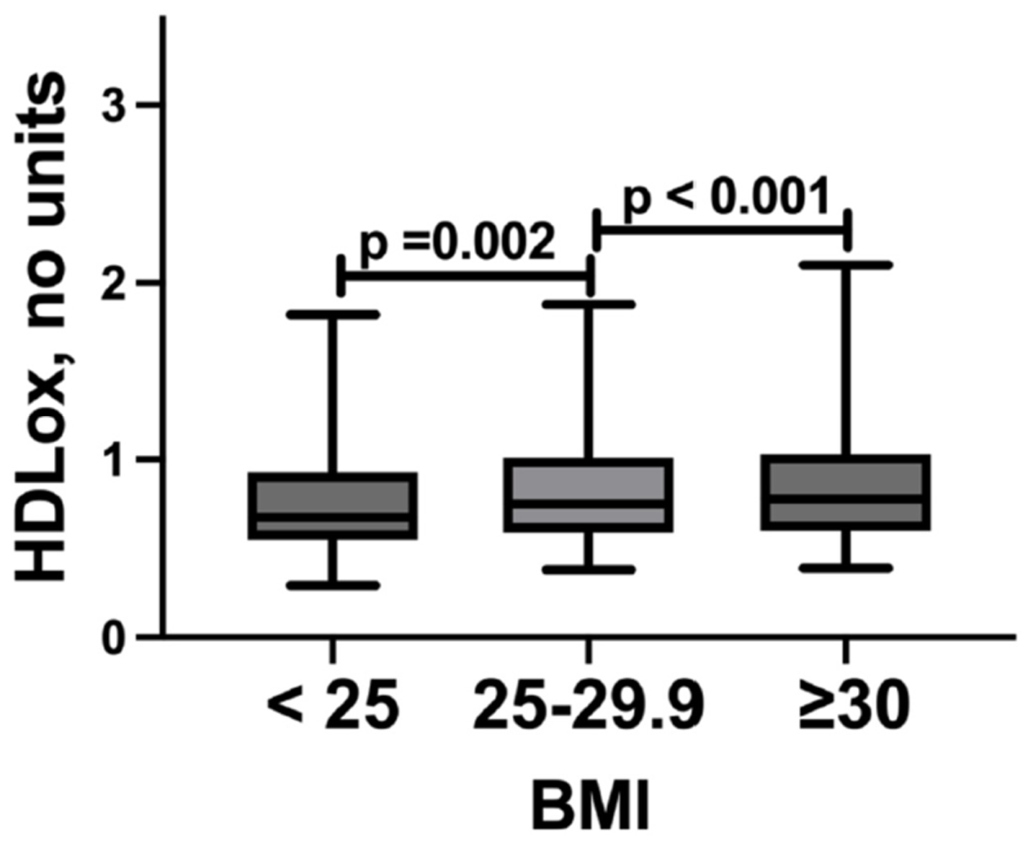
Figure 2.
Relationship between body mass index (BMI) and oxidized HDL (HDLox). (A) Scatterplot depicting HDL lipid peroxide content (HDLox; no unit) plotted against BMI (kg/m²) in the overall cohort (n = 1,277). The solid line represents the fitted univariable linear regression (HDLox = 0.69 + 5.46 × 10⁻³ × BMI), with the 95% confidence interval indicated by the flanking lines. The linear model explained only a small proportion of variance (R² = 0.004), consistent with a weak overall linear association across the full BMI spectrum. (B) Scatterplot illustrating the association between BMI and HDLox within the restricted BMI range of 15–35 kg/m² (n = 1,080). The solid line represents the fitted univariable linear regression model (HDLox = 0.24 + 0.02 × BMI), with flanking lines indicating the 95% confidence interval. Within this biologically relevant BMI range, the linear association was more pronounced compared with the full cohort analysis (R² = 0.025), reflecting a stronger relationship between increasing adiposity and HDL oxidation before the plateau observed at higher BMI levels.
Figure 2.
Relationship between body mass index (BMI) and oxidized HDL (HDLox). (A) Scatterplot depicting HDL lipid peroxide content (HDLox; no unit) plotted against BMI (kg/m²) in the overall cohort (n = 1,277). The solid line represents the fitted univariable linear regression (HDLox = 0.69 + 5.46 × 10⁻³ × BMI), with the 95% confidence interval indicated by the flanking lines. The linear model explained only a small proportion of variance (R² = 0.004), consistent with a weak overall linear association across the full BMI spectrum. (B) Scatterplot illustrating the association between BMI and HDLox within the restricted BMI range of 15–35 kg/m² (n = 1,080). The solid line represents the fitted univariable linear regression model (HDLox = 0.24 + 0.02 × BMI), with flanking lines indicating the 95% confidence interval. Within this biologically relevant BMI range, the linear association was more pronounced compared with the full cohort analysis (R² = 0.025), reflecting a stronger relationship between increasing adiposity and HDL oxidation before the plateau observed at higher BMI levels.
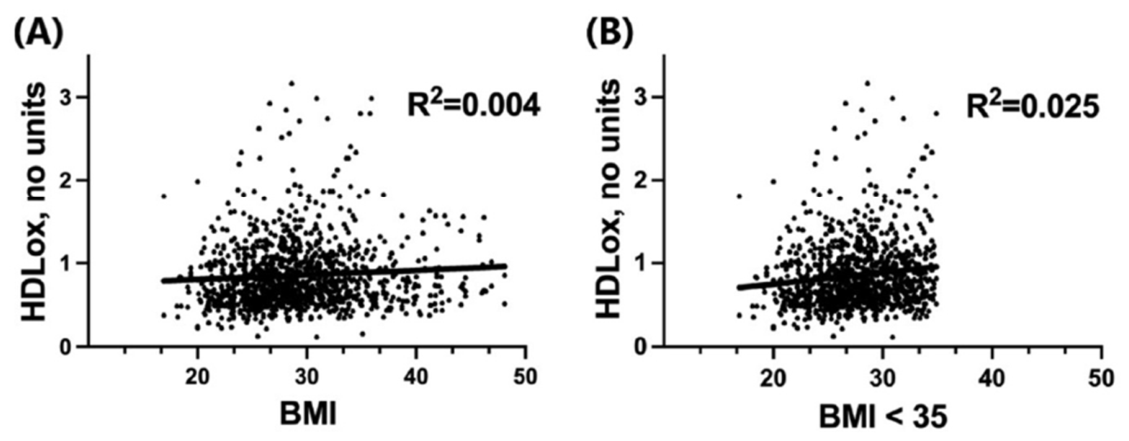
Figure 3.
Relationship between body mass index (BMI), oxidized HDL (HDLox), and coronary artery disease (CAD). (A) Distribution of HDLox levels across BMI categories stratified by the presence or absence of CAD. Within both the pre-obese (BMI 25–29.9 kg/m²) and obese (BMI ≥30 kg/m²) groups, individuals with CAD exhibited higher HDLox levels compared with those without CAD. Data are presented as median with interquartile range. Group comparisons were performed using non-parametric tests as appropriate. (B) Scatterplots illustrating the association between BMI and HDLox stratified by CAD status. Separate univariable linear regression lines are shown for individuals with and without CAD, with shaded areas indicating 95% confidence intervals. A significant positive association between BMI and HDLox was observed within the CAD subgroup, whereas the association was weaker in individuals without CAD. The proportion of explained variance was low in both groups, as reflected by small R² values.
Figure 3.
Relationship between body mass index (BMI), oxidized HDL (HDLox), and coronary artery disease (CAD). (A) Distribution of HDLox levels across BMI categories stratified by the presence or absence of CAD. Within both the pre-obese (BMI 25–29.9 kg/m²) and obese (BMI ≥30 kg/m²) groups, individuals with CAD exhibited higher HDLox levels compared with those without CAD. Data are presented as median with interquartile range. Group comparisons were performed using non-parametric tests as appropriate. (B) Scatterplots illustrating the association between BMI and HDLox stratified by CAD status. Separate univariable linear regression lines are shown for individuals with and without CAD, with shaded areas indicating 95% confidence intervals. A significant positive association between BMI and HDLox was observed within the CAD subgroup, whereas the association was weaker in individuals without CAD. The proportion of explained variance was low in both groups, as reflected by small R² values.
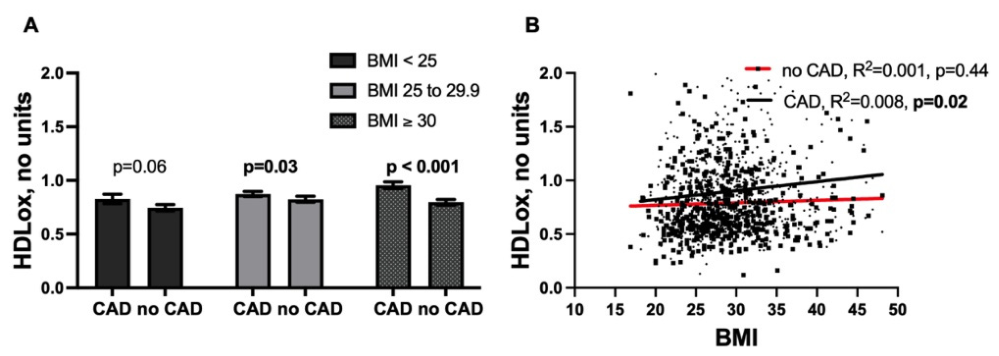

Table 1.
Baseline characteristics of all participants. Data are presented as median (interquartile range) for continuous variables and number (percentage) for categorical variables. Participants were categorized into three groups: no obesity (BMI <25 kg/m²), pre-obesity (BMI 25–29.9 kg/m²), and obesity (BMI ≥30 kg/m²). p-value¹ refers to comparisons between no obesity and pre-obesity, and p-value² refers to comparisons between no obesity and obesity. BMI, body mass index; CAD, coronary artery disease; CKD, chronic kidney disease; HLP, hyperlipidaemia; HDL, high-density lipoprotein cholesterol; LDL, low-density lipoprotein cholesterol; nHDLox, normalized HDL oxidation; HbA1c, glycated hemoglobin; NT-proBNP, N-terminal pro–B-type natriuretic peptide; eGFR, estimated glomerular filtration rate; hsCRP, high-sensitivity C-reactive protein.
Table 1.
Baseline characteristics of all participants. Data are presented as median (interquartile range) for continuous variables and number (percentage) for categorical variables. Participants were categorized into three groups: no obesity (BMI <25 kg/m²), pre-obesity (BMI 25–29.9 kg/m²), and obesity (BMI ≥30 kg/m²). p-value¹ refers to comparisons between no obesity and pre-obesity, and p-value² refers to comparisons between no obesity and obesity. BMI, body mass index; CAD, coronary artery disease; CKD, chronic kidney disease; HLP, hyperlipidaemia; HDL, high-density lipoprotein cholesterol; LDL, low-density lipoprotein cholesterol; nHDLox, normalized HDL oxidation; HbA1c, glycated hemoglobin; NT-proBNP, N-terminal pro–B-type natriuretic peptide; eGFR, estimated glomerular filtration rate; hsCRP, high-sensitivity C-reactive protein.
|
No obesity (BMI <25) |
Pre-obesity (BMI 25 - 29.9) |
Obesity (BMI ≥30) |
p-value1 | p-value2 | |
| N | 257 | 520 | 455 | ||
| Age, years | 68 (58-76) | 68 (59-76) | 66 (58-75) | 0.52 | 0.9 |
| Male, no (%) | 143 (56) | 357 (69) | 286 (63) | 0.001 | 0.02 |
| Hypertension, no (%) | 195 (76) | 432 (83) | 391 (86) | 0.021 | <0.001 |
| Diabetes, no (%) | 49 (19) | 143 (28) | 149 (33) | 0.01 | <0.001 |
| Current smoking, no (%) | 79 (31) | 151 (29) | 124 (27) | 0.6 | 0.38 |
| HLP, no (%) | 187 (73) | 378 (73) | 337 (74) | 0.99 | 0.65 |
| CKD, no (%) | 67 (26) | 137 (26) | 118 (26) | 0.95 | 0.96 |
| Atrial fibrillation, no (%) | 53 (21) | 117 (22) | 105 (23) | 0.55 | 0.088 |
| Stroke, no (%) | 20 (8) | 42 (8) | 36 (8) | 0.9 | 0.92 |
| CAD, no (%) | 132 (51) | 328 (63) | 268 (59) | 0.002 | 0.1 |
| BMI, kg/m2 | 23 (21-24) | 27 (26-29) | 33 (31-36) | <0.001 | <0.001 |
| nHDLox, no unit | 0.67 (0.54-0.93) | 0.75 (0.59-1.0) | 0.78 (0.6 -1.03) | 0.002 | <0.001 |
| HDL, mg/dl | 57 (45-68) | 49 (41-61) | 47 (39-59) | <0.001 | <0.001 |
| LDL, mg/dl | 110 (84-141) | 111 (86-143) | 111 (86-138) | 0.86 | 0.9 |
| Cholesterol, mg/dl | 187 (156-218) | 182 (152-216) | 181 (153-211) | 0.38 | 0.24 |
| Triglyceride, mg/dl | 112 (82-149) | 120 (90-175) | 132 (99-191) | <0.01 | <0.001 |
| Lipoprotein a, mmol/l | 19 (7-81) | 14 (7-46) | 12 (6-68) | 0.4 | 0.1 |
| HbA1c, mmol/mol | 5.5 (5.3-6.0) | 5.7 (5.4-6.3) | 5.9 (5.5-6.8) | <0.001 | <0.001 |
| NTproBNP, pg/ml | 219 (84-754) | 240 (88-696) | 176 (79-698) | 0.83 | 0.24 |
| eGFR | 77 (58-89) | 74 (60-89) | 74 (58-90) | 0.82 | 0.9 |
| Albumin mg/g Creatinin | 4 (2-15) | 4 (2-13) | 7 (2-24) | 0.81 | 0.02 |
| hsCRP | 0.07 (0.00 – 0.47) | 0.1 (0-0.61) | 0.13 (0.00-0.91) | 0.36 | 0.02 |
| Glucose | 90 (83-103) | 101 (88-121) | 106 (92-146) | <0.001 | <0.001 |
Table 2.
Baseline characteristics of all participants, stratified according to BMI. Data are presented as median (interquartile range) or number (%). Statistical tests and abbreviations are as described in Table 1.
Table 2.
Baseline characteristics of all participants, stratified according to BMI. Data are presented as median (interquartile range) or number (%). Statistical tests and abbreviations are as described in Table 1.
| BMI <25 | BMI 25-29.9 | BMI 30-34.9 | BMI 35-39.9 | BMI ≥ 40 | |
| N | 257 | 520 | 303 | 93 | 54 |
| Age, years | 68 (58-76) | 68 (59-76) | 66 (58-75) | 67 (61-73) | 63 (54-71) |
| Male, no (%) | 143 (56) | 357 (69) | 207 (67) | 51 (55) | 28 (52) |
| Hypertension, no (%) | 195 (76) | 432 (83) | 263 (85) | 81 (87) | 47 (87) |
| Diabetes, no (%) | 49 (19) | 143 (28) | 94 (31) | 38 (41) | 17 (32) |
| Current smoking, no (%) | 79 (31) | 151 (29) | 81 (26) | 25 (27) | 18 (33) |
| HLP, no (%) | 187 (73) | 378 (73) | 224 (74) | 72 (77) | 38 (70) |
| CKD, no (%) | 67 (26) | 137 (26) | 76 (25) | 27 (29) | 15 (28) |
| Atrial fibrillation, no (%) | 53 (21) | 117 (22) | 74 (24) | 24 (26) | 22 (41) |
| Statins, no (%) | 147 (57) | 330 (64) | 189 (61) | 58 (62) | 32 (59) |
| CAD, no (%) | 132 (51) | 328 (63) | 183 (60) | 54 (58) | 24 (44) |
| BMI, kg/m2 | 23 (21-24) | 27 (26-29) | 32 (30-33) | 37 (35-28) | 42 (41-45) |
| nHDLox, no unit | 0.67 (0.54-0.93) | 0.75 (0.59-1.0) | 0.79 (0.6-1.06) | 0.73 (0.55-0.95) | 0.73 (0.61-1.03) |
| HDL, mg/dl | 57 (45-68) | 49 (41-61) | 47 (39-58) | 49 (39-62) | 44 (37-59) |
| LDL, mg/dl | 110 (84-141) | 111 (86-143) | 112 (86-140) | 104 (85-127) | 114 (85-141) |
| Cholesterol, mg/dl | 187 (156-218) | 182 (152-216) | 184 (154-210) | 175 (152-213) | 186 (150-215) |
| Triglyceride, mg/dl | 112 (82-149) | 120 (90-175) | 132 (98-191) | 126 (95-174) | 155 (111-217) |
| Lipoprotein a, mmol/l | 19 (7-81) | 14 (7-46) | 14 (6-43) | 9 (5-82) | 10 (7.5-121) |
| HbA1c, mmol/mol | 5.5 (5.3-6.0) | 5.7 (5.4-6.3) | 5.8 (5.5-6.5) | 6.1 (5.7-7.9) | 6.0 (5.6-6.4) |
| NTproBNP, pg/ml | 219 (84-754) | 240 (88-696) | 169 (80-537) | 239 (78-783) | 251 (62-1326) |
| eGFR | 77 (58-89) | 74 (60-89) | 74 (57-90) | 71 (55-87) | 83 (63-94) |
| Albumin mg/g Creatinin | 4 (2-15) | 4 (2-13) | 7 (2-24) | 4 (2-18) | 10 (2-35) |
| hsCRP | 0.07 (0.00 – 0.47) | 0.1 (0-0.61) | 0.1 (0-0.87) | 0.3 (0-0.79) | 0.2 (0.03-1) |
| Glucose | 90 (83-103) | 101 (88-121) | 103 (90-128) | 121 (97-205) | 114 (99-160) |
Disclaimer/Publisher’s Note: The statements, opinions and data contained in all publications are solely those of the individual author(s) and contributor(s) and not of MDPI and/or the editor(s). MDPI and/or the editor(s) disclaim responsibility for any injury to people or property resulting from any ideas, methods, instructions or products referred to in the content. |
© 2026 by the authors. Licensee MDPI, Basel, Switzerland. This article is an open access article distributed under the terms and conditions of the Creative Commons Attribution (CC BY) license (http://creativecommons.org/licenses/by/4.0/).
Copyright: This open access article is published under a Creative Commons CC BY 4.0 license, which permit the free download, distribution, and reuse, provided that the author and preprint are cited in any reuse.