

Submitted:
20 July 2026
Posted:
21 July 2026
You are already at the latest version
Abstract
Multivariate time-series anomaly detection is important for server monitoring, industrial
systems, and intelligent operation and maintenance. Existing point-wise and point-adjusted
metrics often fail to show whether an anomalous segment is detected early enough for
intervention. This paper proposes a lightweight dual-score enhancement for Anomaly
Transformer. The method retains the original multiplicative anomaly score and adds
window-normalized reconstruction error and association discrepancy terms, so weak devi-
ations near anomaly onsets become more visible without changing the backbone network
or using additional labels. Experiments are conducted on four public multivariate bench-
marks, namelySMD,PSM,SMAP,andMSL,underthreerandomseeds. Comparedwiththe
original Anomaly Transformer score, the proposed early-warning union mode improves
Raw Event Recall by 0.3435, 0.2408, 0.0995, and 0.0278 on SMD, PSM, SMAP, and MSL,
respectively, and reduces mean detection delay by 53.66%, 49.97%, 52.69%, and 39.74%.
Additional range- and proximity-aware metrics further show that the score-level enhance-
ment improves segment coverage and early-warning behavior, while AUPRC remains
dataset-dependent. The results indicate that association-discrepancy score enhancement
is a practical complement to existing Transformer-based anomaly detectors when early
warning is more important than point-wise matching alone.
Keywords:
multivariate time series
; anomaly detection
; Anomaly Transformer
; association discrepancy
; early warning
; event-level evaluation
1. Introduction
Multivariate time-series anomaly detection is a key task in server monitoring, cyber-physical systems, industrial safety, and intelligent operation and maintenance [1,2,3,4]. Modern monitoring platforms collect correlated variables such as CPU utilization, network traffic, memory usage, disk input/output, and status indicators. Faults, attacks, or performance degradation often appear as continuous abnormal segments or association changes rather than isolated points.
Deep models have improved anomaly detection by learning nonlinear temporal and cross-variable patterns [11,12,13,14,15,16,17,18,19,20]. Among them, Anomaly Transformer is relevant because it uses association discrepancy between learned series associations and prior associations as an anomaly-related signal [21]. This mechanism can reflect not only large reconstruction errors but also disruptions in temporal association.
Despite these advances, evaluation remains a practical challenge. Point-wise precision, recall, and F1 require exact alignment between predictions and labels. Point adjustment, which is widely used in time-series anomaly detection, marks an anomalous segment as correctly detected once at least one point inside the segment is hit [21,22]. This protocol improves comparability with prior work, but it may hide late alarms. In early-warning applications, a method that detects an anomaly near the end of its segment is less useful than one that fires near the beginning.
This paper addresses this issue from the score-construction perspective. Instead of redesigning the backbone, we propose a lightweight association-discrepancy-enhanced dual-score module for Anomaly Transformer. The module keeps the original multiplicative score and adds two window-normalized terms: reconstruction error and association discrepancy. Reconstruction error reflects numerical deviation, while association discrepancy reflects structural mismatch; combining them at the score level strengthens early responses to weak abnormal signals.
The main contributions are as follows:
- A dual-score enhancement module is proposed for Anomaly Transformer. It combines the original score, reconstruction deviation, and association discrepancy without extra supervision.
- An early-warning-oriented evaluation is used, including PA-P, PA-R, PA-F1, event-level precision, event-level recall, mean detection delay, partial-hit score, AUPRC, Affiliation-F1, PATE-style F1, Range-AUC, and VUS-style metrics.
- Experiments on SMD, PSM, SMAP, and MSL show that the proposed method consistently improves event recall and reduces detection delay, while AUPRC and point-adjusted scores reveal the expected trade-off between early warning and point-wise precision.
2. Related Work
2.1. Multivariate Time-Series Anomaly Detection
Anomaly detection has been extensively studied in data mining and machine learning [1,4]. Time-series anomaly detection is more difficult because observations are temporally dependent and anomalies often cover intervals rather than individual samples [2,3]. Classical one-class or density-based methods, including One-Class SVM, support vector data description, local outlier factor, and Isolation Forest, provide useful baselines but are limited in high-dimensional temporal dependency modeling [26,27,28,31].
Deep learning methods learn temporal representations directly from data. LSTM encoder–decoder models, dynamic thresholding, prediction models, stochastic models, signature-matrix methods, adversarial models, mixture models, and memory-augmented autoencoders have been used for anomaly detection [11,12,13,14,15,16,17,23,24,25]. Graph-based methods further emphasize cross-variable dependency modeling [18,19,32].
2.2. Transformer Models and Evaluation Protocols
Transformer models have become important in sequence and time-series modeling since the introduction of self-attention [5]. Informer, Autoformer, TimesNet, Temporal Fusion Transformer, PatchTST, and DeepAR-related forecasting models show the effectiveness of attention and temporal representation learning [6,7,8,9,10,29,30]. For anomaly detection, TranAD applies Transformer networks to multivariate sequences [20], while Anomaly Transformer introduces association discrepancy for anomaly scoring [21].
Evaluation protocols are equally important. Point-adjusted F1 is useful for segment-level hit assessment, but it does not directly measure how early the first alarm occurs [21,22]. Recent studies further point out that range-aware, proximity-aware, and volume-based criteria are needed for continuous time-series anomalies [33,34,35,36]. For monitoring systems, event-level recall, detection delay, partial-hit, AUPRC, Affiliation-style F1, PATE-style F1, Range-AUC, and VUS-style scores provide a more informative view of early-warning performance. This paper therefore reports both conventional PA metrics and early-warning-oriented metrics.
3. Materials and Methods
3.1. Problem Definition
Let a multivariate time series be
where T is the sequence length and C is the number of variables. In unsupervised anomaly detection, only normal training data are used to learn the model. During testing, each time point receives an anomaly score , and a binary prediction is obtained by
where is the threshold.
The model uses sliding windows. For window length w, the input ending at time t is
In the SMD experiments, and , so each batch has the shape .
3.2. Base Score and Enhanced Dual Score
Anomaly Transformer reconstructs the input window and produces attention association matrices. Let be the reconstruction of . The reconstruction error is
Let and denote the learned series association and the normalized prior association at layer ℓ. The association discrepancy is computed by a symmetric KL form:
The original multiplicative score is
To strengthen early abnormal responses, the proposed method normalizes both and inside the current window. For a quantity , window normalization is
where and are the window mean and standard deviation, and prevents numerical instability. The enhanced score is
where controls the contribution of association discrepancy. The main experiments use .
3.3. Relation to Anomaly Transformer
The proposed method does not replace Anomaly Transformer. It uses the same trained backbone, the same reconstruction output, and the same association matrices. The difference lies in the construction and use of the anomaly score. The original Anomaly Transformer score multiplies reconstruction error by a softmax-transformed association-discrepancy term. This is effective for point-wise scoring, but weak onset deviations may still be suppressed when the multiplicative term is small. The proposed dual-score module explicitly re-injects the local standardized reconstruction error and association discrepancy into the final score. Therefore, the contribution is a post-training, score-level early-warning enhancement rather than a new network architecture. This design is useful in deployment scenarios where retraining or changing the backbone is costly, but the alarm policy can be adjusted.
3.4. Union Early-Warning Mode and Thresholding
For high-recall warning scenarios, this paper also uses a union mode:
This mode usually improves anomalous segment coverage and reduces delay, but may reduce precision.
To keep the protocol consistent with Anomaly Transformer, the threshold is selected by an anomaly-ratio rule:
The SMD experiments use . In union mode, the base and enhanced scores are thresholded separately.
3.5. Workflow
Figure 1 summarizes the method. The input series is segmented into sliding windows and passed into Anomaly Transformer. Reconstruction output and association matrices are then used to compute , , , and . The final prediction is obtained by thresholding the selected score or by using union mode.
4. Experiments
4.1. Dataset and Settings
The experiments use four public multivariate time-series anomaly detection benchmarks: SMD, PSM, SMAP, and MSL. SMD is a server monitoring benchmark released with OmniAnomaly [14]. SMAP and MSL are spacecraft telemetry benchmarks [12]. PSM is a server-machine monitoring benchmark commonly used in the Anomaly Transformer protocol [21]. These datasets cover different domains and variable dimensions, which helps evaluate whether the score-level enhancement generalizes beyond a single benchmark.

Table 1.
Datasets used in the revised experiments.
| Dataset | Domain | Variables | Anomaly ratio used for thresholding |
|---|---|---|---|
| SMD | Server monitoring | 38 | 0.5 |
| PSM | Server monitoring | 25 | 1.0 |
| SMAP | Spacecraft telemetry | 25 | 1.0 |
| MSL | Spacecraft telemetry | 55 | 1.0 |
The compared methods are the original Anomaly Transformer score, the proposed dual-score module, and the union early-warning mode. All methods use the same Anomaly Transformer backbone. The batch size is 256, the learning rate is , the maximum number of epochs is 10, early-stopping patience is 3, and the score temperature is 50.0. The window length is 100. Main results are averaged over seeds 2025, 2026, and 2027. For SMD, the sampling interval is approximately one minute, so one delay step corresponds to about one minute; for the other datasets, delay is reported in benchmark time steps.
4.2. Evaluation Metrics
Point-level precision, recall, and F1 are
PA-P, PA-R, and PA-F1 are computed after point adjustment. For event-level evaluation, let be the set of ground-truth anomalous segments and be the set of predicted anomalous segments:
For a detected anomalous segment , the delay is . The mean delay and partial-hit score are
AUPRC measures the area under the precision–recall curve of anomaly scores.
To address reviewer concerns about range- and proximity-aware evaluation, we additionally report Affiliation-style F1, PATE-style F1, Range-AUC, and VUS-style metrics [33,34,35,36]. Affiliation-style precision and recall evaluate the overlap between predicted ranges and ground-truth ranges rather than isolated points. PATE-style F1 gives partial credit to predictions close to an anomalous range, so near-boundary early alarms are not treated the same as distant false alarms. Range-PR-AUC and Range-ROC-AUC integrate range-aware precision–recall and ROC behavior over thresholds. VUS-style scores further average range-AUC values over different tolerance buffer sizes. These metrics are reported as supplementary evidence because the main goal of this paper is early warning rather than only point-wise matching.
4.3. Main Results
Table 2 reports the main results. The proposed method improves early-warning behavior on all four datasets. Compared with the baseline, the union mode increases Raw Event Recall by 0.3435, 0.2408, 0.0995, and 0.0278 on SMD, PSM, SMAP, and MSL, respectively. The corresponding mean-delay reductions are 53.66%, 49.97%, 52.69%, and 39.74%. Dual-score alone is especially effective on SMD and also improves event-level behavior on PSM. On SMAP and MSL, union mode is more robust because it preserves baseline hits while adding enhanced-score hits. AUPRC is dataset-dependent: it improves clearly on SMD, but does not improve on every dataset. Therefore, the main advantage of the proposed method should be interpreted as early-warning improvement rather than universal point-wise ranking improvement.
4.4. Range- and Proximity-Aware Metrics
Table 3 reports supplementary range- and proximity-aware metrics. The enhanced scores improve Range-AUC and VUS-style scores on all datasets because the raw score distribution becomes more sensitive to anomalous regions. Union mode changes the binary prediction but uses the same enhanced score for threshold-swept metrics; therefore, its Range-AUC and VUS values are close to those of dual-score.
4.5. Parameter Sensitivity
Table 4 reports the sensitivity of on SMD and PSM. On SMD, a larger value such as gives the lowest delay and the highest event recall. On PSM, however, larger values increase delay substantially, while –0.3 gives a better early-warning trade-off. Therefore, is used as the main cross-dataset setting because it is stable across both datasets rather than over-tuned to SMD.
4.6. Case-Style Early-Warning Visualization
Figure 2 provides a compact visual comparison of the early-warning effect. The union mode improves event recall and reduces delay on all four datasets. This visual result is consistent with Table 2: the method sacrifices some point-adjusted precision in several datasets, but it detects more anomalous segments and triggers alarms earlier.
5. Discussion
The results show that PA-F1 and early-warning metrics can lead to different interpretations. The baseline often obtains strong PA-F1 because point adjustment rewards any hit inside an anomaly range. However, this does not guarantee that the alarm appears early. In contrast, the proposed score-level enhancement is designed to improve raw event coverage and reduce first-hit delay. This explains why union mode improves Event-R and Delay on all four datasets, even when PA-F1 or AUPRC does not always improve.
The method is lightweight because it uses reconstruction error and association discrepancy already produced by Anomaly Transformer and changes only the anomaly score. It is therefore different from architectural methods that redesign patch encoders, memory modules, graph structures, or online adaptation mechanisms. The benefit is deployment simplicity: an existing trained backbone can be reused, and only the score construction and alarm policy need to be modified.
There are still limitations. First, the threshold follows the fixed anomaly-ratio protocol used in Anomaly Transformer to maintain benchmark comparability. This does not fully address distribution shift in streaming environments. Second, the range- and proximity-aware metrics used here are dependency-free implementations for supplementary analysis; future work should also integrate official benchmark toolkits when available. Third, union mode increases recall by design and may introduce more false alarms. In practice, it should be selected for risk-sensitive scenarios where early warning is more valuable than maximum point-wise precision.
6. Conclusions
This paper proposed a dual-score association-discrepancy enhancement for early-warning multivariate time-series anomaly detection. By combining the original Anomaly Transformer score with normalized reconstruction error and association discrepancy, the method improves early abnormal responses without additional supervision or backbone modification. Experiments on SMD, PSM, SMAP, and MSL show that the union early-warning mode consistently improves Raw Event Recall and reduces mean detection delay. The improvements are especially clear on SMD and PSM, and range/proximity-aware metrics further support the early-warning benefit. AUPRC shows dataset-dependent behavior, indicating that early-warning performance and point-wise ranking performance should be analyzed separately. These results support score-level enhancement as a practical complement to Transformer-based anomaly detectors in early-warning scenarios.
Author Contributions
Conceptualization, Z.X. and L.Y.; methodology, Z.X.; software, Z.X.; validation, Z.X.; formal analysis, Z.X.; investigation, Z.X.; data curation, Z.X.; writing—original draft preparation, Z.X.; writing—review and editing, L.Y. and W.C.; visualization, Z.X.; supervision, L.Y. and W.C. All authors have read and agreed to the published version of the manuscript.
Funding
This research received no external funding.
Institutional Review Board Statement
Not applicable.
Informed Consent Statement
Not applicable.
Data Availability Statement
The SMD, PSM, SMAP, and MSL datasets analyzed in this study are publicly available from the sources cited in the manuscript and from the benchmark releases used by Anomaly Transformer. The implementation files and experiment scripts used to reproduce the reported results are available at https://github.com/zhipengxiang774-sudo/dual-score-anomaly-detection.
Acknowledgments
Not applicable.
Conflicts of Interest
The authors declare no conflicts of interest.
Abbreviations
The following abbreviations are used in this manuscript:
| AUPRC | Area under the precision–recall curve |
| MTS | Multivariate time series |
| PA | Point adjustment |
| PATE | Proximity-aware time-series anomaly evaluation |
| PSM | Pooled server metrics |
| SMD | Server Machine Dataset |
| SMAP | Soil Moisture Active Passive |
| VUS | Volume under the surface |
References
- Chandola, V.; Banerjee, A.; Kumar, V. Anomaly detection: A survey. ACM Comput. Surv. 2009, 41, 1–58. [Google Scholar] [CrossRef]
- Blazquez-Garcia, A.; Conde, A.; Mori, U.; Lozano, J.A. A review on outlier/anomaly detection in time series data. ACM Comput. Surv. 2021, 54, 1–33. [Google Scholar] [CrossRef]
- Braei, M.; Wagner, S. Anomaly detection in univariate time-series: A survey on the state-of-the-art. arXiv 2020, arXiv:2004.00433. [Google Scholar]
- Pang, G.; Shen, C.; Cao, L.; Hengel, A.V.D. Deep learning for anomaly detection: A review. ACM Comput. Surv. 2021, 54, 1–38. [Google Scholar] [CrossRef]
- Vaswani, A.; Shazeer, N.; Parmar, N.; Uszkoreit, J.; Jones, L.; Gomez, A.N.; Kaiser, L.; Polosukhin, I. Attention is all you need. In Advances in Neural Information Processing Systems; Curran Associates: Red Hook, NY, USA, 2017. [Google Scholar]
- Zhou, H.; Zhang, S.; Peng, J.; Zhang, S.; Li, J.; Xiong, H.; Zhang, W. Informer: Beyond efficient transformer for long sequence time-series forecasting. Proceedings AAAI Conf. Artif. Intell.>, Virtual 2021, Volume 35, 11106–11115. [Google Scholar] [CrossRef]
- Wu, H.; Xu, J.; Wang, J.; Long, M. Autoformer: Decomposition transformers with auto-correlation for long-term series forecasting. In Advances in Neural Information Processing Systems; Curran Associates: Red Hook, NY, USA, 2021. [Google Scholar]
- Wu, H.; Hu, T.; Liu, Y.; Zhou, H.; Wang, J.; Long, M. TimesNet: Temporal 2D-variation modeling for general time series analysis. In Proceedings of the International Conference on Learning Representations, Kigali, Rwanda, 1–5 May 2023. [Google Scholar]
- Lai, G.; Chang, W.C.; Yang, Y.; Liu, H. Modeling long- and short-term temporal patterns with deep neural networks. In Proceedings of the 41st International ACM SIGIR Conference on Research and Development in Information Retrieval, Ann Arbor, MI, USA, 8–12 July 2018; pp. 95–104. [Google Scholar]
- Lim, B.; Arik, S.O.; Loeff, N.; Pfister, T. Temporal fusion transformers for interpretable multi-horizon time series forecasting. Int. J. Forecast. 2021, 37, 1748–1764. [Google Scholar] [CrossRef]
- Malhotra, P.; Vig, L.; Shroff, G.; Agarwal, P. LSTM-based encoder-decoder for multi-sensor anomaly detection. arXiv 2016, arXiv:1607.00148. [Google Scholar]
- Hundman, K.; Constantinou, V.; Laporte, C.; Colwell, I.; Soderstrom, T. Detecting spacecraft anomalies using LSTMs and nonparametric dynamic thresholding. In Proceedings of the 24th ACM SIGKDD International Conference on Knowledge Discovery and Data Mining, London, UK, 19–23 August 2018; pp. 387–395. [Google Scholar]
- Munir, M.; Siddiqui, S.A.; Dengel, A.; Ahmed, S. DeepAnT: A deep learning approach for unsupervised anomaly detection in time series. IEEE Access 2019, 7, 1991–2005. [Google Scholar] [CrossRef]
- Su, Y.; Zhao, Y.; Niu, C.; Liu, R.; Sun, W.; Pei, D. Robust anomaly detection for multivariate time series through stochastic recurrent neural network. In Proceedings of the 25th ACM SIGKDD International Conference on Knowledge Discovery and Data Mining, Anchorage, AK, USA, 4–8 August 2019; pp. 2828–2837. [Google Scholar]
- Zhang, C.; Song, D.; Chen, Y.; Feng, X.; Lumezanu, C.; Cheng, W.; Ni, J.; Zong, B.; Chen, H.; Chawla, N.V. A deep neural network for unsupervised anomaly detection and diagnosis in multivariate time series data. In Proceedings of the AAAI Conference on Artificial Intelligence, Honolulu, HI, USA, 27 January–1 February 2019; Volume 33, pp. 1409–1416. [Google Scholar]
- Audibert, J.; Michiardi, P.; Guyard, F.; Marti, S.; Zuluaga, M.A. USAD: Unsupervised anomaly detection on multivariate time series. In Proceedings of the 26th ACM SIGKDD International Conference on Knowledge Discovery and Data Mining Workshops, Virtual, 23–27 August 2020. [Google Scholar]
- Li, D.; Chen, D.; Shi, L.; Jin, B.; Goh, J.; Ng, S.K. MAD-GAN: Multivariate anomaly detection for time series data with generative adversarial networks. In Artificial Neural Networks and Machine Learning – ICANN 2019; Springer: Cham, Switzerland, 2019; pp. 703–716. [Google Scholar]
- Zhao, H.; Wang, Y.; Duan, J.; Huang, C.; Cao, D.; Tong, Y.; Xu, B.; Bai, J.; Tong, J.; Zhang, Q. Multivariate time-series anomaly detection via graph attention network. In Proceedings of the IEEE International Conference on Data Mining, Sorrento, Italy, 17–20 November 2020; pp. 841–850. [Google Scholar]
- Deng, A.; Hooi, B. Graph neural network-based anomaly detection in multivariate time series. Proceedings of the AAAI Conference on Artificial Intelligence 2021, Volume 35, 4027–4035. [Google Scholar] [CrossRef]
- Tuli, S.; Casale, G.; Jennings, N.R. TranAD: Deep transformer networks for anomaly detection in multivariate time series data. Proc. VLDB Endow. 2022, 15, 1201–1214. [Google Scholar] [CrossRef]
- Xu, J.; Wu, H.; Wang, J.; Long, M. Anomaly Transformer: Time series anomaly detection with association discrepancy. In Proceedings of the International Conference on Learning Representations, Virtual, 25–29 April 2022. [Google Scholar]
- Xu, H.; Chen, W.; Zhao, N.; Li, Z.; Bu, J.; Li, Z.; Liu, Y.; Zhao, Y.; Pei, D.; Feng, Y.; et al. Unsupervised anomaly detection via variational auto-encoder for seasonal KPIs in web applications. In Proceedings of the 2018 World Wide Web Conference, Lyon, France, 23–27 April 2018; pp. 187–196. [Google Scholar]
- Zong, B.; Song, Q.; Min, M.R.; Cheng, W.; Lumezanu, C.; Cho, D.; Chen, H. Deep autoencoding Gaussian mixture model for unsupervised anomaly detection. In Proceedings of the International Conference on Learning Representations, Vancouver, BC, Canada, 30 April–3 May 2018. [Google Scholar]
- Gong, D.; Liu, L.; Le, V.; Saha, B.; Mansour, M.R.; Venkatesh, S.; Hengel, A.V.D. Memorizing normality to detect anomaly: Memory-augmented deep autoencoder for unsupervised anomaly detection. In Proceedings of the IEEE/CVF International Conference on Computer Vision, Seoul, Republic of Korea, 27 October–2 November 2019; pp. 1705–1714. [Google Scholar]
- Zhou, B.; Liu, S.; Hooi, B.; Cheng, X.; Ye, J. BeatGAN: Anomalous rhythm detection using adversarially generated time series. In Proceedings of the Twenty-Eighth International Joint Conference on Artificial Intelligence, Macao, China, 10–16 August 2019; pp. 4433–4439. [Google Scholar]
- Scholkopf, B.; Platt, J.C.; Shawe-Taylor, J.; Smola, A.J.; Williamson, R.C. Estimating the support of a high-dimensional distribution. Neural Comput. 2001, 13, 1443–1471. [Google Scholar] [CrossRef] [PubMed]
- Breunig, M.M.; Kriegel, H.P.; Ng, R.T.; Sander, J. LOF: Identifying density-based local outliers. In Proceedings of the ACM SIGMOD International Conference on Management of Data, Dallas, TX, USA, 15–18 May 2000; pp. 93–104. [Google Scholar]
- Liu, F.T.; Ting, K.M.; Zhou, Z.H. Isolation forest. In Proceedings of the IEEE International Conference on Data Mining, Pisa, Italy, 15–19 December 2008; pp. 413–422. [Google Scholar]
- Nie, Y.; Nguyen, N.H.; Sinthong, P.; Kalagnanam, J. A time series is worth 64 words: Long-term forecasting with transformers. In Proceedings of the International Conference on Learning Representations, Kigali, Rwanda, 1–5 May 2023. [Google Scholar]
- Salinas, D.; Flunkert, V.; Gasthaus, J.; Januschowski, T. DeepAR: Probabilistic forecasting with autoregressive recurrent networks. Int. J. Forecast. 2020, 36, 1181–1191. [Google Scholar] [CrossRef]
- Tax, D.M.J.; Duin, R.P.W. Support vector data description. Mach. Learn. 2004, 54, 45–66. [Google Scholar] [CrossRef]
- Chen, Z.; Chen, D.; Zhang, X.; Yuan, Z.; Cheng, X. Learning graph structures with transformer for multivariate time-series anomaly detection in IoT. IEEE Internet Things J. 2022, 9, 9179–9189. [Google Scholar] [CrossRef]
- Tatbul, N.; Lee, T.J.; Zdonik, S.; Alam, M.; Gottschlich, J. Precision and recall for time series. In Advances in Neural Information Processing Systems; Curran Associates: Red Hook, NY, USA, 2018. [Google Scholar]
- Huet, A.; Navarro, J.M.; Rossi, D. Local evaluation of time series anomaly detection algorithms. In Proceedings of the 28th ACM SIGKDD Conference on Knowledge Discovery and Data Mining, Washington, DC, USA, 14–18 August 2022; pp. 635–645. [Google Scholar]
- Paparrizos, J.; Boniol, P.; Palpanas, T.; Tsay, R.S.; Elmore, A.; Franklin, M.J. Volume under the surface: A new accuracy evaluation measure for time-series anomaly detection. Proc. VLDB Endow. 2022, 15, 2774–2787. [Google Scholar] [CrossRef]
- Ghorbani, R.; Reinders, M.J.T.; Tax, D.M.J. PATE: Proximity-aware time series anomaly evaluation. In Proceedings of the 30th ACM SIGKDD Conference on Knowledge Discovery and Data Mining, Barcelona, Spain, 25–29 August 2024; pp. 872–883. [Google Scholar]
Figure 1.
Workflow of the proposed dual-score anomaly detection method.
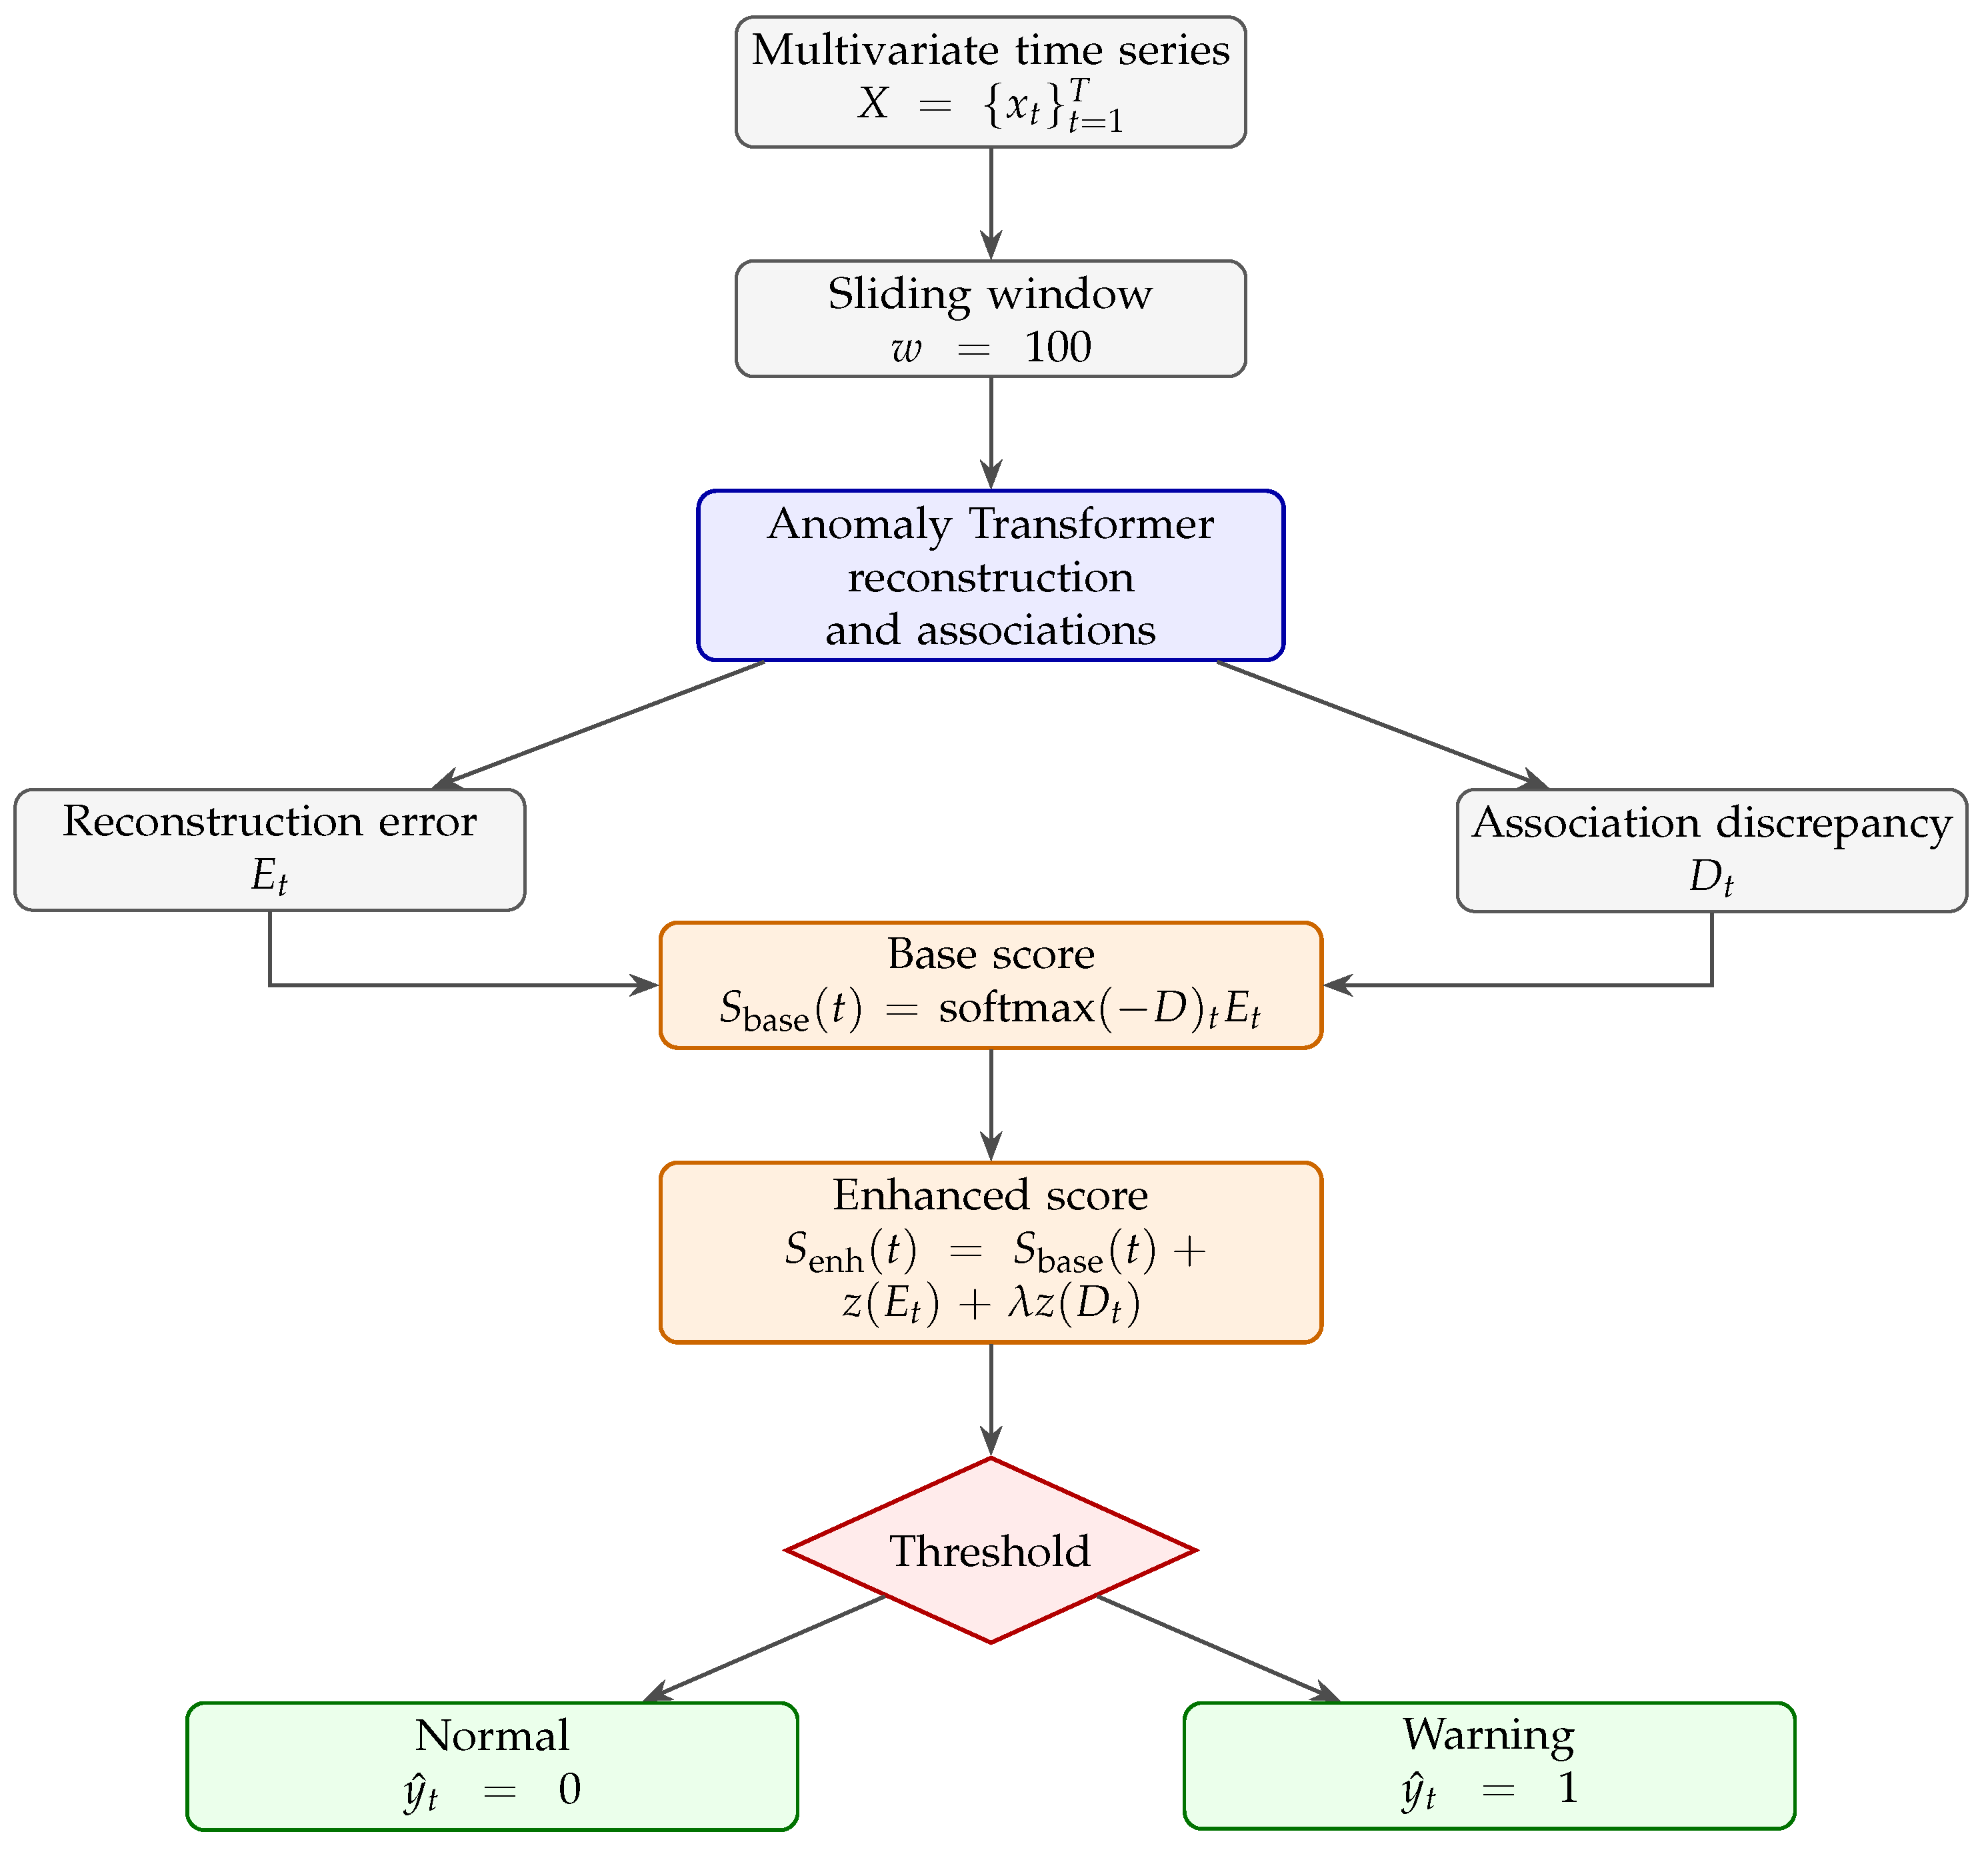
Figure 2.
Case-style visualization of the union early-warning effect compared with the original Anomaly Transformer score.
Figure 2.
Case-style visualization of the union early-warning effect compared with the original Anomaly Transformer score.
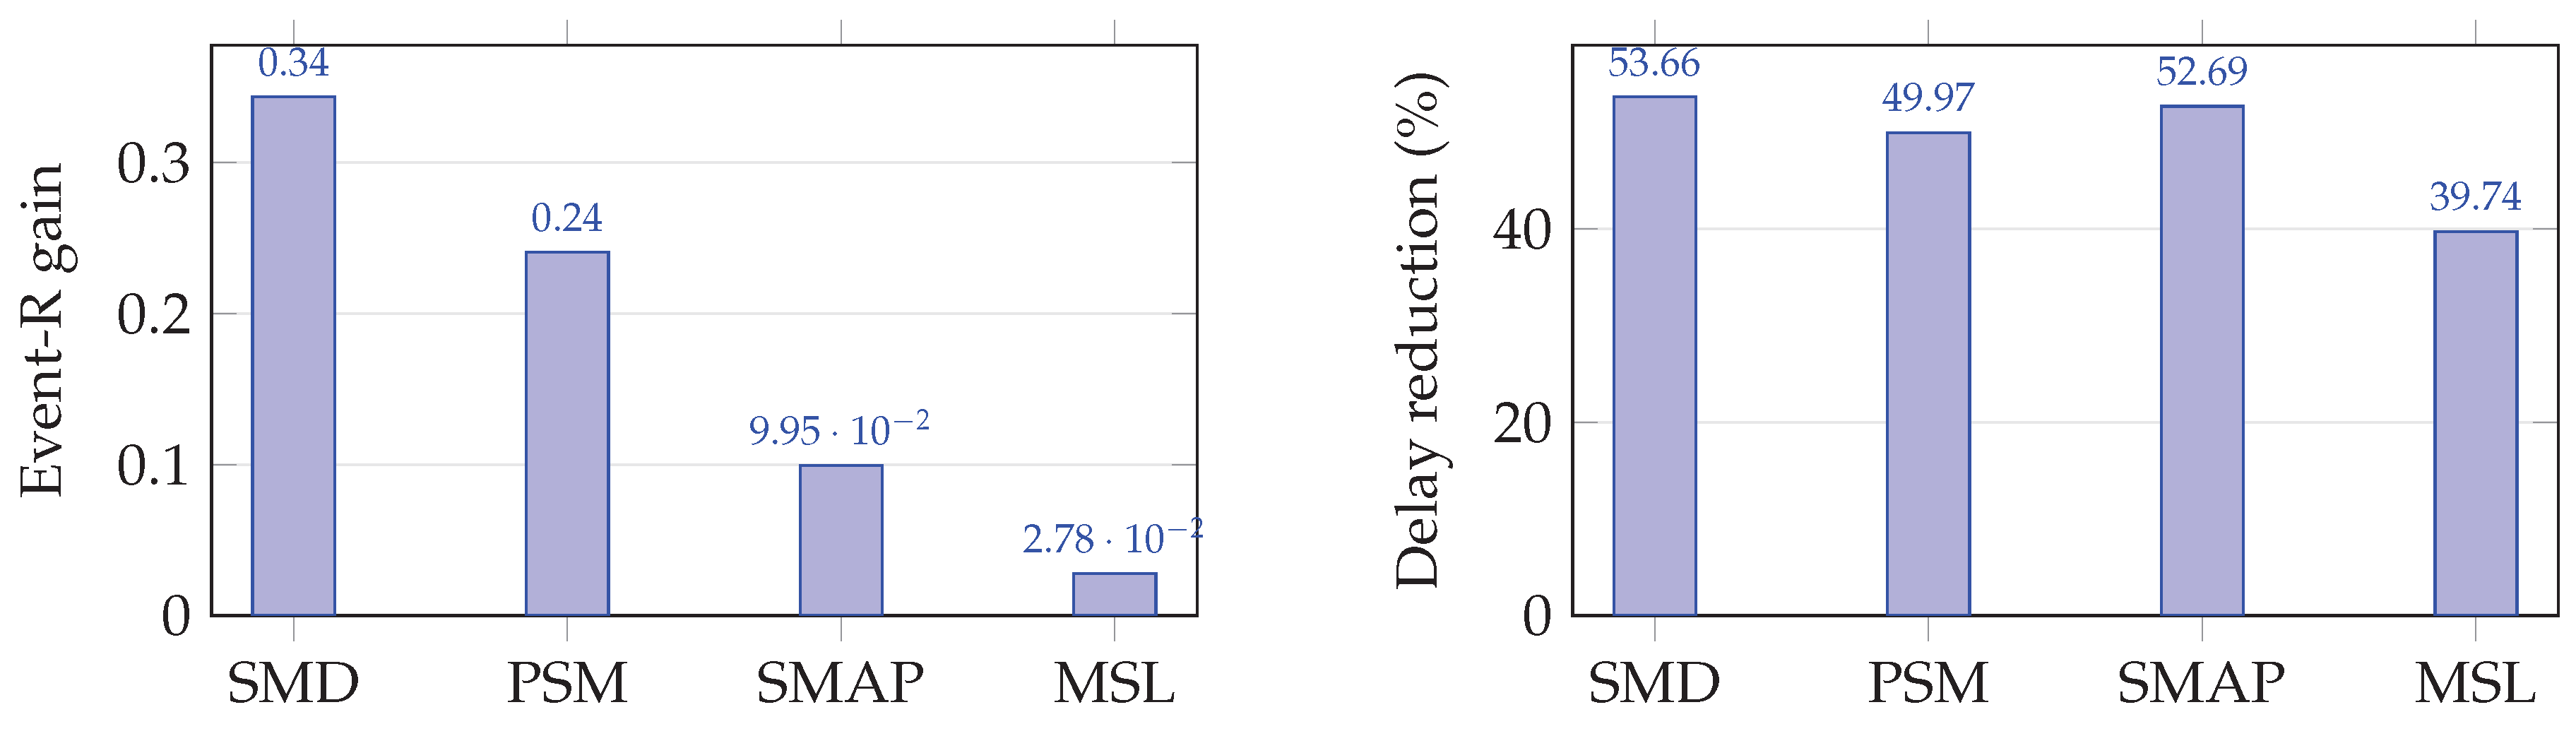
Table 2.
Main results over three random seeds. PA-F1 is computed after point adjustment; Event-R, Delay, Partial-hit, and AUPRC are computed from raw predictions and scores.
Table 2.
Main results over three random seeds. PA-F1 is computed after point adjustment; Event-R, Delay, Partial-hit, and AUPRC are computed from raw predictions and scores.
| Dataset | Method | PA-F1 | Event-R | Delay | Partial-hit | AUPRC |
|---|---|---|---|---|---|---|
| SMD | Anomaly Transformer | 0.9054 ± 0.0074 | 0.5372 ± 0.0463 | 27.5537 ± 4.7035 | 0.4046 ± 0.0417 | 0.0377 ± 0.0027 |
| SMD | Dual-score | 0.8980 ± 0.0004 | 0.8063 ± 0.0047 | 17.8413 ± 0.7491 | 0.6776 ± 0.0044 | 0.0493 ± 0.0010 |
| SMD | Union | 0.8919 ± 0.0050 | 0.8807 ± 0.0053 | 12.7672 ± 1.6362 | 0.7472 ± 0.0033 | 0.0493 ± 0.0010 |
| PSM | Anomaly Transformer | 0.9768 ± 0.0016 | 0.4120 ± 0.0289 | 38.4931 ± 6.0384 | 0.3428 ± 0.0276 | 0.3022 ± 0.0262 |
| PSM | Dual-score | 0.9865 ± 0.0006 | 0.6157 ± 0.0212 | 44.1442 ± 14.2018 | 0.4912 ± 0.0153 | 0.2852 ± 0.0015 |
| PSM | Union | 0.9750 ± 0.0003 | 0.6528 ± 0.0139 | 19.2584 ± 3.9200 | 0.5485 ± 0.0187 | 0.2852 ± 0.0015 |
| SMAP | Anomaly Transformer | 0.9625 ± 0.0013 | 0.8557 ± 0.0173 | 62.5876 ± 38.3737 | 0.6973 ± 0.0072 | 0.1714 ± 0.0040 |
| SMAP | Dual-score | 0.9616 ± 0.0021 | 0.8060 ± 0.0448 | 61.0551 ± 15.8508 | 0.6593 ± 0.0355 | 0.1333 ± 0.0023 |
| SMAP | Union | 0.9384 ± 0.0013 | 0.9552 ± 0.0149 | 29.6113 ± 3.3213 | 0.7967 ± 0.0112 | 0.1333 ± 0.0023 |
| MSL | Anomaly Transformer | 0.9420 ± 0.0059 | 0.7963 ± 0.0320 | 44.1198 ± 8.6378 | 0.6231 ± 0.0114 | 0.1287 ± 0.0135 |
| MSL | Dual-score | 0.9192 ± 0.0141 | 0.7407 ± 0.0425 | 36.0215 ± 7.8508 | 0.5976 ± 0.0407 | 0.1050 ± 0.0011 |
| MSL | Union | 0.9091 ± 0.0048 | 0.8241 ± 0.0320 | 26.5858 ± 2.5587 | 0.6931 ± 0.0122 | 0.1050 ± 0.0011 |
Table 3.
Range- and proximity-aware supplementary results over three random seeds.
| Dataset | Method | Aff-F1 | PATE-F1 | Range-PR-AUC | Range-ROC-AUC | VUS-ROC |
|---|---|---|---|---|---|---|
| SMD | Anomaly Transformer | 0.0661 ± 0.0078 | 0.2032 ± 0.0045 | 0.0130 ± 0.0006 | 0.0805 ± 0.0154 | 0.0574 ± 0.0131 |
| SMD | Dual-score | 0.1259 ± 0.0005 | 0.2207 ± 0.0039 | 0.0320 ± 0.0007 | 0.4353 ± 0.0056 | 0.3358 ± 0.0034 |
| SMD | Union | 0.1215 ± 0.0025 | 0.2154 ± 0.0051 | 0.0320 ± 0.0007 | 0.4353 ± 0.0056 | 0.3358 ± 0.0034 |
| PSM | Anomaly Transformer | 0.0797 ± 0.0115 | 0.4125 ± 0.0063 | 0.0424 ± 0.0124 | 0.0144 ± 0.0099 | 0.0105 ± 0.0083 |
| PSM | Dual-score | 0.2108 ± 0.0111 | 0.4450 ± 0.0268 | 0.2363 ± 0.0060 | 0.4706 ± 0.0157 | 0.3365 ± 0.0064 |
| PSM | Union | 0.2151 ± 0.0134 | 0.4483 ± 0.0156 | 0.2363 ± 0.0060 | 0.4705 ± 0.0155 | 0.3365 ± 0.0064 |
| SMAP | Anomaly Transformer | 0.0152 ± 0.0025 | 0.2678 ± 0.0244 | 0.0090 ± 0.0066 | 0.0066 ± 0.0086 | 0.0042 ± 0.0056 |
| SMAP | Dual-score | 0.0119 ± 0.0028 | 0.2759 ± 0.0085 | 0.1248 ± 0.0093 | 0.1960 ± 0.0143 | 0.1400 ± 0.0112 |
| SMAP | Union | 0.0201 ± 0.0016 | 0.2745 ± 0.0083 | 0.1248 ± 0.0093 | 0.1960 ± 0.0143 | 0.1400 ± 0.0112 |
| MSL | Anomaly Transformer | 0.0119 ± 0.0018 | 0.3619 ± 0.0064 | 0.0043 ± 0.0006 | 0.0031 ± 0.0015 | 0.0026 ± 0.0015 |
| MSL | Dual-score | 0.0119 ± 0.0015 | 0.3715 ± 0.0101 | 0.0945 ± 0.0106 | 0.2630 ± 0.0070 | 0.1910 ± 0.0065 |
| MSL | Union | 0.0164 ± 0.0025 | 0.3655 ± 0.0059 | 0.0945 ± 0.0106 | 0.2630 ± 0.0070 | 0.1910 ± 0.0065 |
Table 4.
Sensitivity of the discrepancy weight .
| Dataset | Raw F1 | Event-R | Event-F1 | Delay | Partial-hit | |
|---|---|---|---|---|---|---|
| SMD | 0.1 | 0.0278 | 0.7920 | 0.2078 | 18.1622 | 0.6679 |
| SMD | 0.2 | 0.0281 | 0.7951 | 0.2082 | 18.2923 | 0.6680 |
| SMD | 0.3 | 0.0285 | 0.8073 | 0.2109 | 18.3939 | 0.6759 |
| SMD | 0.5 | 0.0292 | 0.8073 | 0.2120 | 17.3598 | 0.6758 |
| SMD | 0.7 | 0.0305 | 0.8165 | 0.2139 | 14.4981 | 0.6870 |
| SMD | 1.0 | 0.0319 | 0.7982 | 0.2173 | 16.2567 | 0.6697 |
| PSM | 0.1 | 0.0181 | 0.5694 | 0.4559 | 24.5366 | 0.4659 |
| PSM | 0.2 | 0.0178 | 0.5694 | 0.4517 | 24.4146 | 0.4631 |
| PSM | 0.3 | 0.0177 | 0.5694 | 0.4503 | 24.7317 | 0.4610 |
| PSM | 0.5 | 0.0170 | 0.5833 | 0.4488 | 33.3333 | 0.4694 |
| PSM | 0.7 | 0.0168 | 0.5694 | 0.4377 | 38.9024 | 0.4500 |
| PSM | 1.0 | 0.0169 | 0.5694 | 0.4331 | 47.8537 | 0.4490 |
Disclaimer/Publisher’s Note: The statements, opinions and data contained in all publications are solely those of the individual author(s) and contributor(s) and not of MDPI and/or the editor(s). MDPI and/or the editor(s) disclaim responsibility for any injury to people or property resulting from any ideas, methods, instructions or products referred to in the content. |
© 2026 by the authors. Licensee MDPI, Basel, Switzerland. This article is an open access article distributed under the terms and conditions of the Creative Commons Attribution (CC BY) license (http://creativecommons.org/licenses/by/4.0/).
Copyright: This open access article is published under a Creative Commons CC BY 4.0 license, which permit the free download, distribution, and reuse, provided that the author and preprint are cited in any reuse.


