

Submitted:
20 July 2026
Posted:
21 July 2026
You are already at the latest version
Abstract
Background: Preventing mobility-related loss of independence (LoI) is a critical public health priority. While the drivers of LoI are complex, this study examines how personal, social, and environmental factors influence these outcomes to identify actionable preven-tive targets. We applied the International Classification of Functioning, Disability, and Health (ICF) framework to treat ethnicity as a dynamic social determinant.
Methods: Using 2023 National Health and Aging Trends Study (NHATS) data (n=7,106), conducted path analyses among non-Hispanic (NH) White, NH Black, and Hispanic old-er adults. We assessed associations between health conditions, body function, physical performance, social participation, and environmental factors.
Results: The ICF-based model explained 36.6% - 38.2% of LoI variance. While physical performance was the strongest direct predictor of independence across all groups, indirect pathways varied. Social participation restrictions significantly accelerated LoI among NH White and Black adults.
For Hispanic adults, limited English proficiency acted as a critical structural barrier im-peding body function and physical performance. Additionally, Additionally, shared liv-ing arrangements among NH Black participants were negatively associated with physical performance. By gender, only NH White females exhibited associations with better physi-cal and social outcomes.
Conclusions: Pathways to LoI are deeply mediated by group-specific structural factors. To effectively prevent functional decline, healthcare policies must move beyond generic ser-vices toward culturally responsive interventions. Prioritizing targeted lifestyle behav-iors—specifically social engagement for NH Black populations and linguistic accessibility for Hispanic adults—is essential to reduce health inequities and proactively preserve in-dependence.
Keywords:
loss of independence
; environment
; social participation
; physical performance
; reduced inequalities
; good health and well-being
1. Introduction
Disability in later life is a significant contributor to loss of independence (LoI), posing challenges both nationally and individually [1]. Currently, 61 million Americans live with at least one disability, including 41% of those aged 65 and older [2,3,4]. As individuals age, the prevalence of disability increases—from 35% at age 65 to 46% at age 75 and older [5,6]. Combined with rising life expectancy, this trend presents a substantial public health concern [1]. Mobility disability is the most common type, affecting approximately 26% of older adults [3,7]. It is a primary contributor to LoI and disproportionately impacts those of advanced age, women, individuals below the poverty line, Latinx populations, and those living alone [1,3,5]. Women, in particular, experience more limitations in daily activities and are more likely than men to lose independence as they age [8,9]. Over the past decade, the average duration of dependency in women has increased from 10.4 to 10.9 years [10,11]. Understanding racial and ethnic disparities in disability remains complex and inconclusive -especially when controlling for socioeconomic factors [12]. Non-Hispanic (N-H) Blacks and American Indian/Alaska Natives experience higher prevalence of various disability than other groups [3,12]. To date, there is still limited research on LoI disparities among Hispanics and Asian Americans.
Although functional decline and late-life disability are complex and multidimensional, they are partially preventable and modifiable [8,13]. Reflecting this shift, healthcare systems in developed countries have moved beyond illness-focused care to emphasize prevention and the promotion of functioning in older adults with chronic conditions [14,15]. To guide this broader approach, the World Health Organization’s International Classification of Functioning, Disability and Health (ICF) model provides a standardized, holistic framework for understanding disability and functioning, emphasizing a holistic approach [16,17,18]. The model integrates physical, psychological, social, and environmental factors as they influence individuals’ daily functioning [16,19]. Widely used in developed countries, the ICF has demonstrated efficacy in guiding comprehensive care plans and rehabilitation strategies that extend beyond traditional medical assessments [20,21].
In the U.S., national efforts to reduce disability have aligned with this framework through initiatives such as Healthy People 2010, which promotes a holistic view of well-being [1,17,22,23]. Federal agencies have also adopted standardized methods to assess disability, including self-reported measures across six functional domains [24,25]. A key initiative, the National Health and Aging Trends Study (NHATS), was launched to collect longitudinal data on a nationally representative sample of Medicare beneficiaries aged 65 and older. NHATS integrates core principles of the ICF model in its design [26]. While several recent studies have applied the ICF model using NHATS data [27,28,29,30], few have examined a comprehensive approach to understanding how older adults maintain independence within this framework. A more integrated application of the ICF is needed to fully capture the multifactorial nature of independence in late-life.
To address gaps in both research and preventive healthcare, this study applies the ICF model to data from the NHATS to identify predictors of loss of independence (LoI) among multiethnic older adults living independently in the U.S. Specifically, it aims to: (1) examine how impaired body function, physical performance, and restricted social participation contribute to LoI; and (2) assess whether these factors mediate the effects of gender, health condition, living arrangements, and English proficiency on LoI among non-Hispanic (N-H) White, NH Black, and Hispanic groups. Findings may inform the development of culturally responsive, function-focused interventions to support independence and reduce disparities in aging populations.
2. Materials and Methods
Study Design: The proposed research employs a population-based cross-sectional design to investigate risk factors predicting the loss of independent life under the ICF theoretical framework. Figure 1 illustrates a comprehensive approach that considers health condition, body function and structure, physical performance, social participation, and environmental factors in accordance with the ICF model.
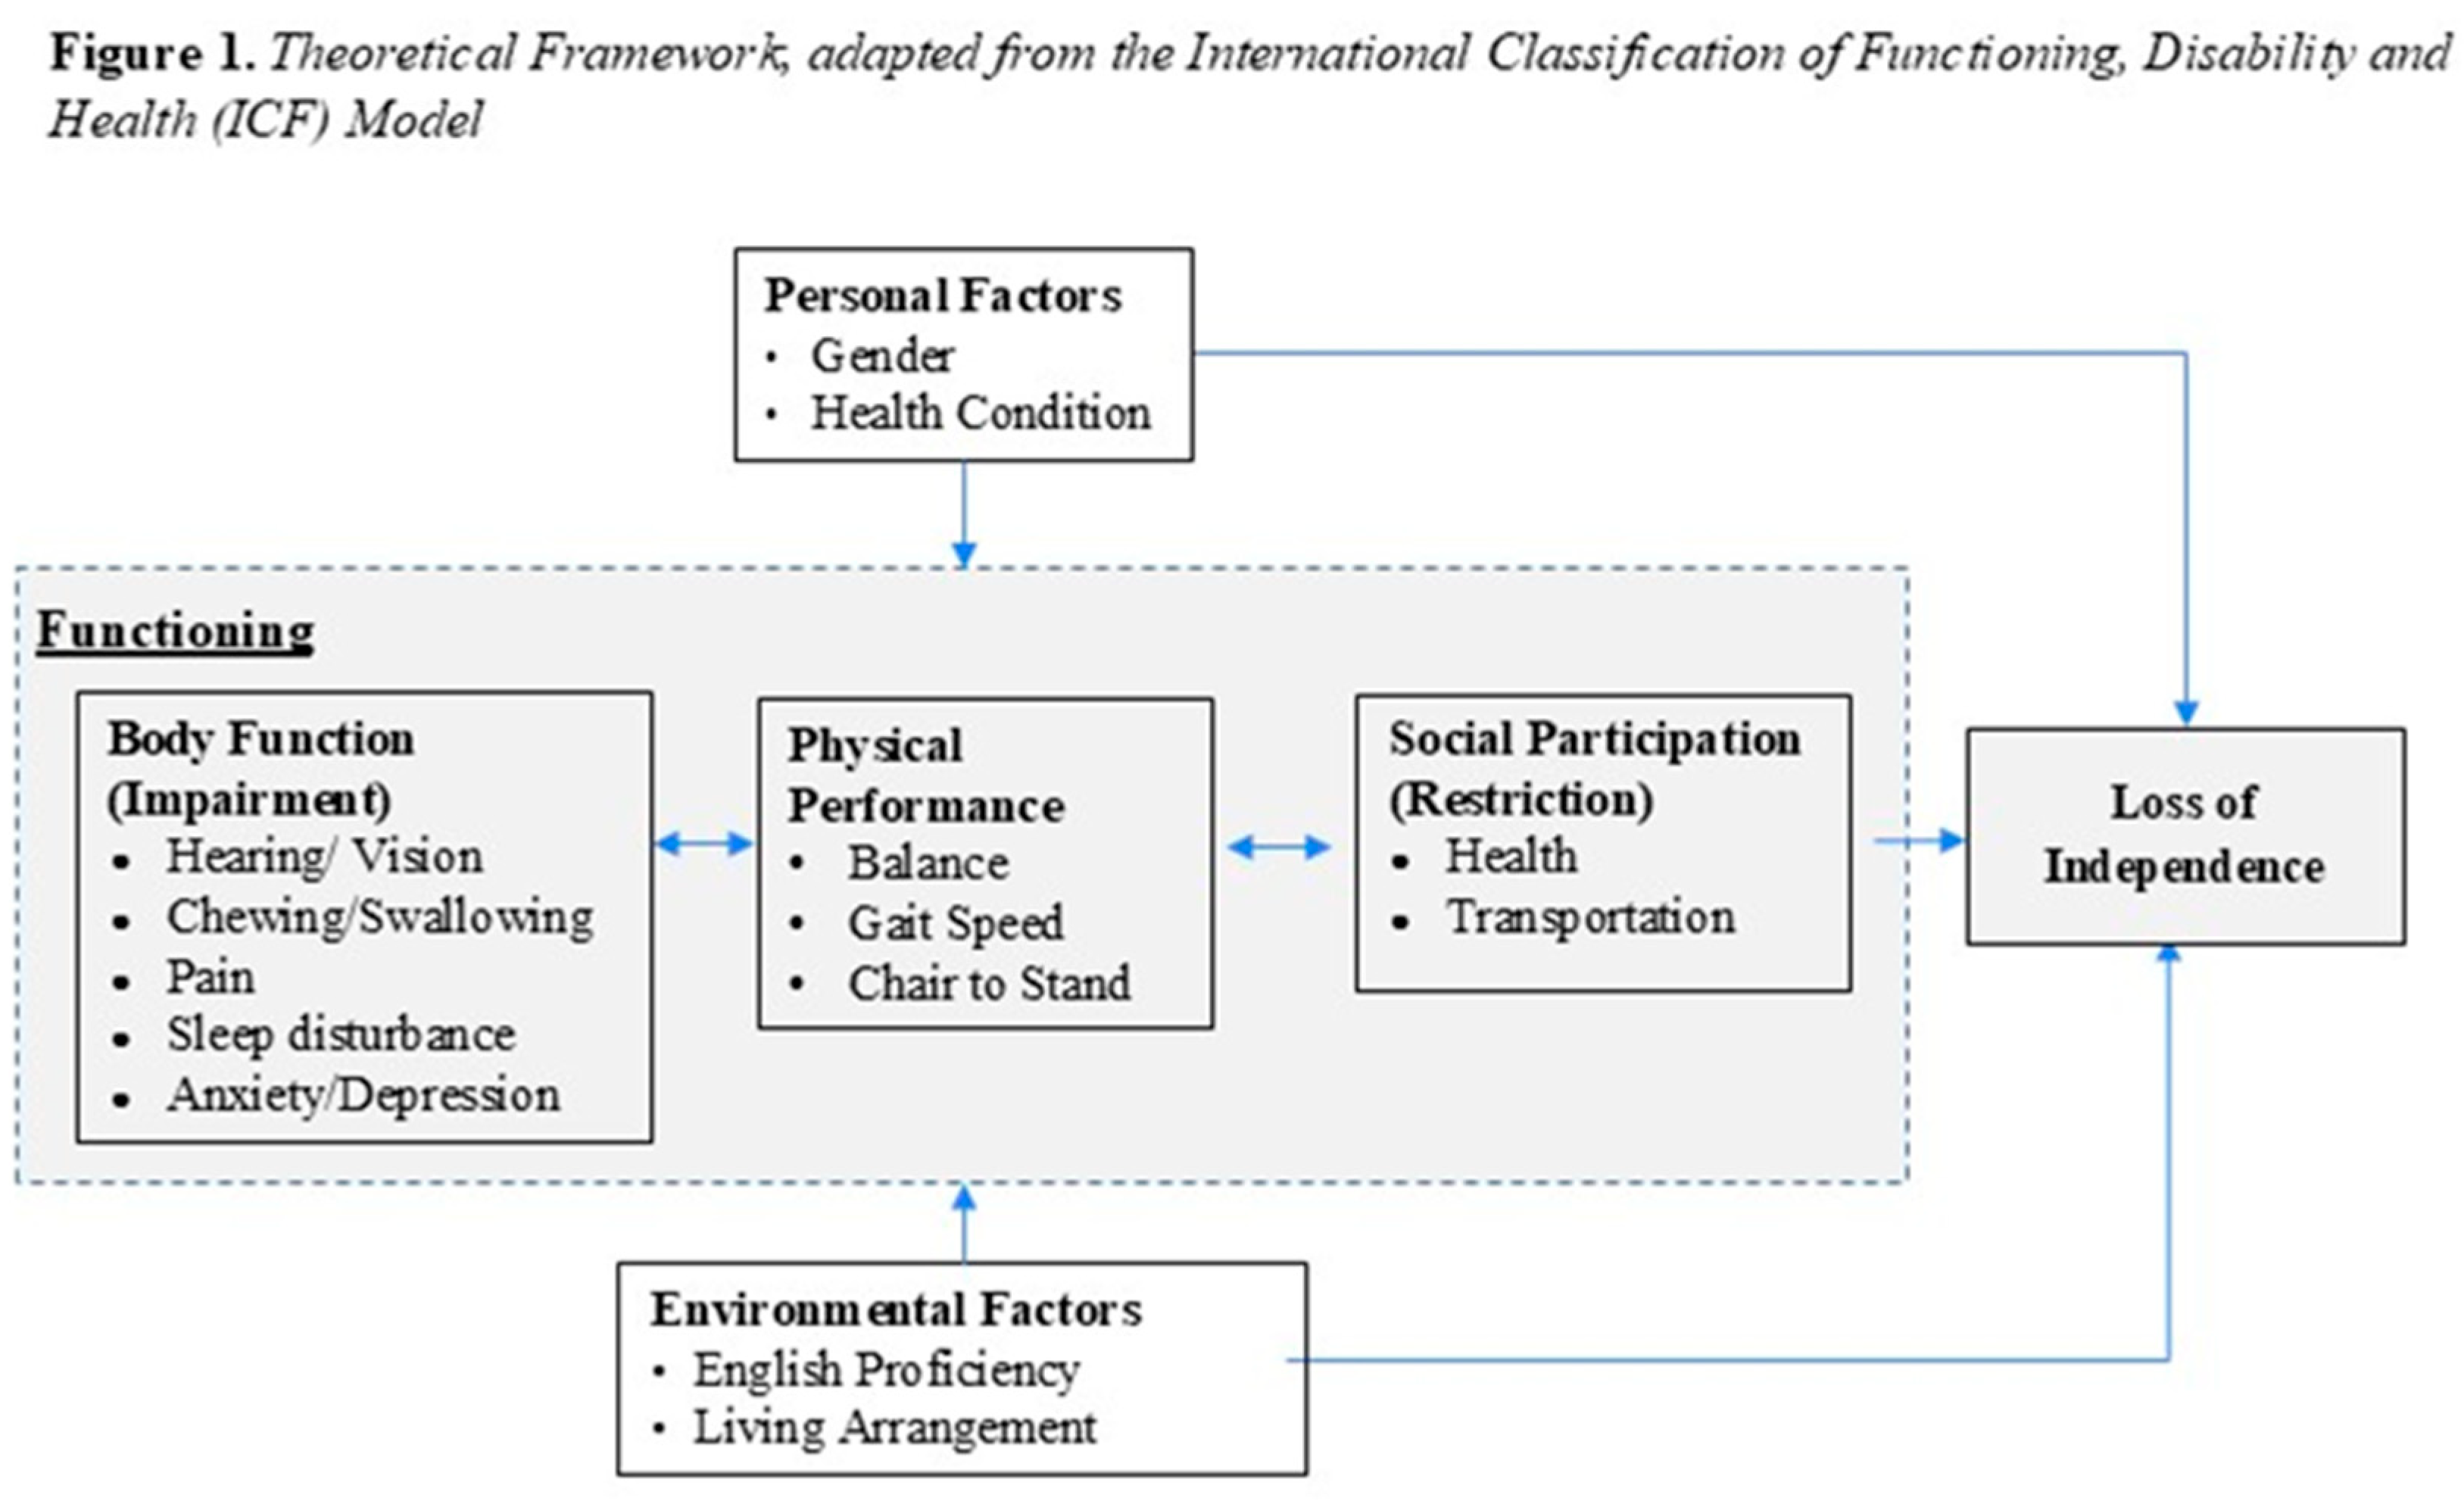
Data Description: NHATS includes a nationally representative sample of Medicare beneficiaries aged 65 and older residing in the contiguous United States. It employs a stratified, multistage sampling design based on geographic clusters and unequal probability selection. The dataset is unbiased and robust due to its rigorous sampling methodology and consistent annual data collection, ensuring comprehensive and representative insights into the health and functioning of older adults [31]. This study utilized Round 13, NHATS Sample Person (SP) data files. Inclusion Criteria: Participants included individuals who responded on their own behalf. Nursing home residents were excluded to ensure the focus remained on those living independently in community settings.
Sample: We used data from Round 13 (2023) of the NHATS, a longitudinal study initiated in 2011. Although participants were enrolled across multiple waves, our analytic sample was based on data collected in 2023. Of the original 8,597 participants in Round 13, we excluded 1,491 cases due to missing data on key variables, including system wide measures, LoI, physical performance, English proficiency, and those who identified as racial/ethnic groups other than NH White, NH Black, or Hispanic. The final analytic sample consisted of 7,106 participants, categorized into in three racial/ethnic groups: NH White, NH Black, and Hispanic. All continuous variables were coded so that higher values indicate poorer status (e.g., impaired body function, lower social participation, poorer health conditions, and lower English proficiency), with the exception of physical performance, where higher scores indicate better performance.
Outcome measure: Loss of Independence (LoI) was assessed by using the Vulnerable Elders Survey-13 (VES-13), a tool designed to identify community-dwelling older individuals at risk of functional decline or mortality within two years [32]. The 13-item questionnaire aligns with NHATS variables and assesses age, self-rated health, difficulty in physical capacity (6 items), and difficulty in physical performance (5 items). Age was classified into three groups (young-, middle- and old-old) assigning a score of “0” for age < 75, “1” for 75-84, and “3” for 85 or older. Self-rated health offered five options: poor, fair, good, very good, or excellent. Those reporting poor or fair received 1 point, while all others received 0 points. Difficulties in physical capacity were assessed through six self-reported activities: kneeling, carrying, reaching, grasping, walking 3 blocks, and lifting a heavy object. Each reported difficulty received 1 point, and total scores were categorized as 0, 1, or 2 points (with 2 points representing difficulty in two or more activities marked as ‘yes’). Difficulties in physical performance were evaluated using five items related to independent functioning: shopping, handling finances, mobility, laundry, and showering. If participants reported difficulty in any activity, they were assigned 4 points. The VES-13 total score ranges from 0 to 10 with higher scores indicating an increased risk of health vulnerability. A cut off score of 6 or higher indicates a high risk of functional vulnerability [33,34]. Previous studies have reported VES-13 sensitivity ranging from 67% to 91% and specificity from 59% to 79% [32,35].
Personal factors: This domain includes demographics and selected health conditions. Demographic variables include gender (man and woman), race and ethnicity (White, Asian, Black or Hispanic). The health conditions domain includes self-rated health, number of chronic diseases, number of falls and fractures, and number of hospitalizations in the past 12 months. Chronic diseases are based on 10 medical diagnoses (heart attack, heart disease, high blood pressure, arthritis, osteoporosis, diabetes, lung disease, stroke, dementia/Alzheimer’s disease, cancer) [26]. Responses are binary (yes/no), with total scores categorized as light comorbidity (0-2 conditions) or severe comorbidity (3 or more conditions).
A history of falls, fractures and hospitalizations in the past year was recorded. Responses were binary (yes/no), summed into a 0-4 score, with higher values indicating increased health risk.
Impaired body function: This domain assessed limitations using NHATS data, focusing on sensory deficits, pain, fatigue, and mental health during the last month. Sensory function assessed difficulties with hearing, vision, and chewing/swallowing, including the use of assistive devices. Responses are ‘yes’ (1) or ‘no’ (0) with total scores ranging 0-3. Pain was measured using the question: ‘Is the person bothered by pain and does it limit their activities? (yes=1, no=0). Sleep quality measured participant report in difficulty falling asleep (taking more than 30 minutes) most nights/every night (1) vs. less frequently (0). Depression and Anxiety was assessed using the Patient Health Questionnaire (PHQ-4), a validated screening tool combining PHQ-2 (depressive symptoms) [36,37] and Generalized Anxiety Disorder Screener (GAD-2) [24,31]. Responses range from 0 (not at all) to 3 (nearly every day) per item, with total scores ranging 0-12. A cut-off score of ≥ 3 indicates probable depression or anxiety (yes=1, no=0).
Physical performance was assessed using the Short Physical Performance Battery (SPPB), a widely used measure of mobility and physical function in older adults [38,39]. The SPPB includes standing balance, gait speed and sit-to-stand test and is measured on a 12-point scale with higher numbers indicating better performance.
Standing balance was assessed using three progressively different feet positions (side-by-side, semi-tandem, and tandem). Participants who maintained a full tandem stance for 10 seconds and completed other tasks scored 4 points [40]. Gait speed was measured as the time taken to complete a 3-meter walk at a usual pace and then converted to the speed meter per second. Scores range from 0 to 4 with higher scores indicating better (faster) performance [41]. Sit-to-stand from a chair measured time taken to stand from a chair five times [42,43]. Each task is scored out of 4, with a total SPPB score from the three tests ranging 0 to 12. Lower scores indicate higher odds of mobility-related disability. An alternative lower extremity performance score classified into three groups with poor performance (1), moderate (2), and good performance (3) [44].
Social participation restriction in NHATS was characterized by limitations on engaging in social activities in the past month due to health or transportation issues. Respondents reported whether they experience limited social engagement due to health issues of 7 types and/or transportation barriers in 4 activities. Responses were binary (yes/no). Each variable of the total 11 barriers was summed (0-11 point) and then updated the sum between 0 to 7 as the case of sum score higher than 7 was few.
Environmental factors were assessed through Living arrangement (living alone, with spouse and/or other, or with only others) and Limited English proficiency, evaluated using two self-reported items on understanding and speaking English, with responses categorized as ‘very well/well’ and ‘not well.’
Data Management and Statistical Analysis
All variables utilizing the ICF framework underwent rigorous data verification to ensure accuracy and consistency. Collinearity and normality were assessed prior to analysis. To ensure valid and generalizable results, the analyses accounted for the NHATS complex sampling design, incorporating strata, clusters, and sampling weights. Subsequently, we conducted a comprehensive descriptive analysis on the entire sample, followed by separate analysis stratified by race/ethnicity to account for potential variations observed across different demographic groups. In descriptive statistics, we calculated means, standard deviations, and percentages as weighted and frequencies as the actual numbers of participants (unweighted) to understand how much data the estimates are based on.
To explain the comprehensive ICF model, we applied a path analysis by using the Mplus 8.11 program [45], which is widely used for modeling relationships among observed and latent variables, and for testing complex statistical models. Before conducting the path analysis, all preliminary analyses were conducted using SAS 9.4 [46]. We tested whether the associations between the predictor variables and LoI varied by racial/ethnic group. Using interaction terms between race/ethnicity and each predictor, we found evidence of effect modification. Based on this finding, we proceeded with separate path analyses stratified by racial/ethnic group. Prior to model estimation, we assessed the distributional properties of the continuous variables within each racial/ethnic group. Normality tests - Shapiro-Wilk [47], Kolmogorov–Smirnov [48], Cramer–von Mises [49], and Anderson–Darling [50] - indicated that the continuous variables were not normally distributed. As a result, we used the robust maximum likelihood estimator (MLR) in Mplus, which provides standard errors and model fit statistics that are robust to non-normality (Supplementary Table 1). To handle missing data, we conducted a complete case analysis within each group, excluding all cases with missing values on any predictor variables from the final dataset. We also evaluated multicollinearity among predictors within each racial/ethnic group by examining bivariate correlations and calculating the variance inflation factor (VIF) for each predictor. All VIF values ranged from 1.0 to 1.7, well below the commonly used threshold of 5, indicating no evidence of problematic multicollinearity.
3. Results
3.1. Study Population
Table 1 summarizes the descriptive statistics of the study population. Demographics: The sample (n = 7106) was predominantly female (55.0%), aged 65-74 (52.2%), and identified as NH White (82.2%).
Loss of Independence (LoI): The overall mean score for LoI, measured by the Vulnerable Elders Survey (VES-13), was 3.87 (on a 0–10 scale), presenting moderate vulnerability. Statistically significant disparities were observed across ethnic groups (p < .001): Hispanic participants exhibited the highest risk (4.60), followed by NH Black (4.08) and NH White groups (3.77). Health conditions & Body(physical) function: Participants reported an average of 0.92 chronic conditions and 2.46 functional impairments across six domains. Notably, differences between racial and ethnic groups for these specific variables were not statistically significant (p = .19 and p = .51, respectively).
Physical performance: On a 12-point objective scale, the overall average score was 8.47 (SE = .09). NH White participants demonstrated significantly better performance (8.75, SE = .10), than both Hispanic (7.32, SE = .17) and NH Black participants (7.12, SE = .14; p < .001). This suggest that the determinants of LoI disparities may lie in functional execution rather than simple disease prevalence.
Social participation: Based on 11 health- and transportation- related restriction items, NH Black participants reported the highest average restriction score (0.82, SE = .05; p = .050), warranting inclusion in the path model as a theoretical mediator.
3.2. Model Testing and Estimation
Path analysis was conducted separately for each race/ethnic group using a four-step process to address the methodological complexities inherent in multi-cultural functional health. Step 1. Model Specification: The initial hypothesized model (Figure 2) defined directional relationships among ICF domains —including health conditions, body function, physical performance, and social participation— resulting in 33 free parameters for estimation. Step 2. Model Estimation and Fit Assessment: The model was initially treated as a saturated model. For each racial/ethnic group, we fitted several plausible models by varying predictors with direct paths to LoI while maintaining a consistent structure for indirect paths. We specified directional paths from body function to physical performance, body function to social participation, and physical performance to social participation. Step 3. Statistical Rigor: All models were estimated using the robust maximum likelihood estimator (MLR) to account for potential non-normality in the data. Model fit was evaluated using the Satorra–Bentler scaled chi-square difference test (TRd), the standardized root mean square residual (SRMR), the root mean square error of approximation (RMSEA), and the comparative fit index (CFI) [51,52,53,54]. Step 4. Final Model selection: Final model selection was guided by both theoretical relevance to the ICF framework and empirical fit criteria: (a) RMSEA < .06 and SRMR < .10, or (b) SRMR < .10 and CFI > .96 [51]. For all three ethnic/racial groups, the initial models with 33 estimated parameters were retained as they provided the optimal balance theoretical coherence and statistical fit, explaining significant variance in LoI (NH White: 38.2%; NH Black: 37.0%; Hispanic: 36.6%), as detailed in the path coefficients below.
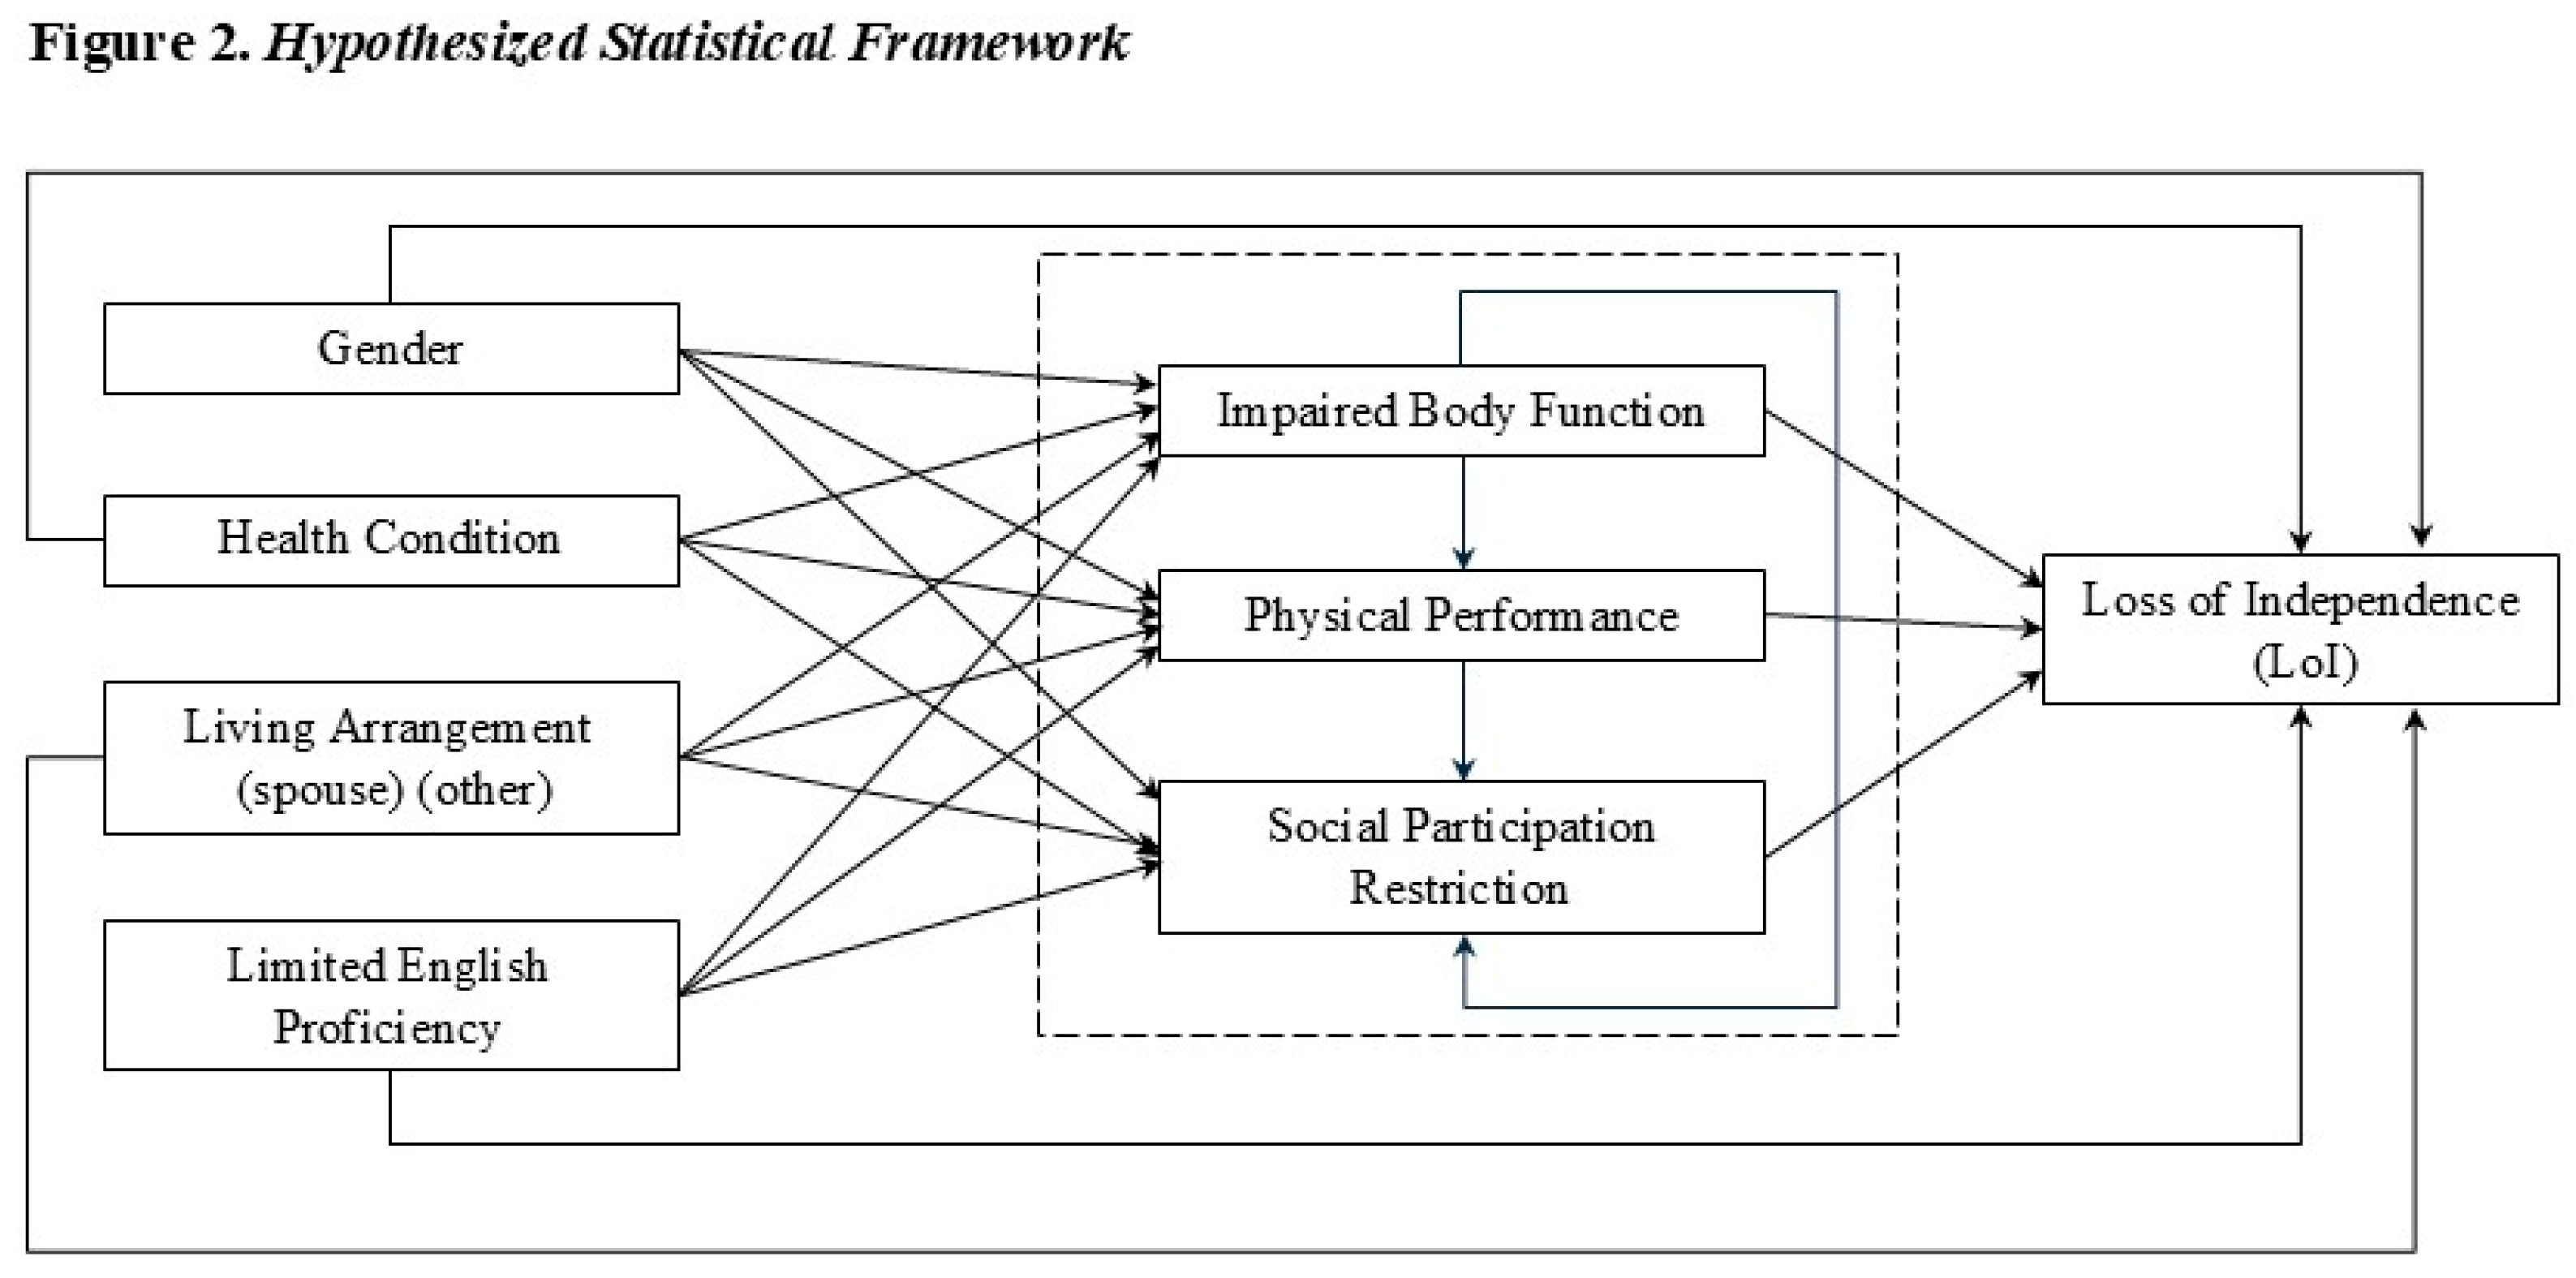
3.3. Path Analysis
- Personal predictors of LoI: Across the overall sample, LoI was significantly influenced by gender, health condition, living arrangement and English proficiency (p < .01) (Table 2; Figure 3).
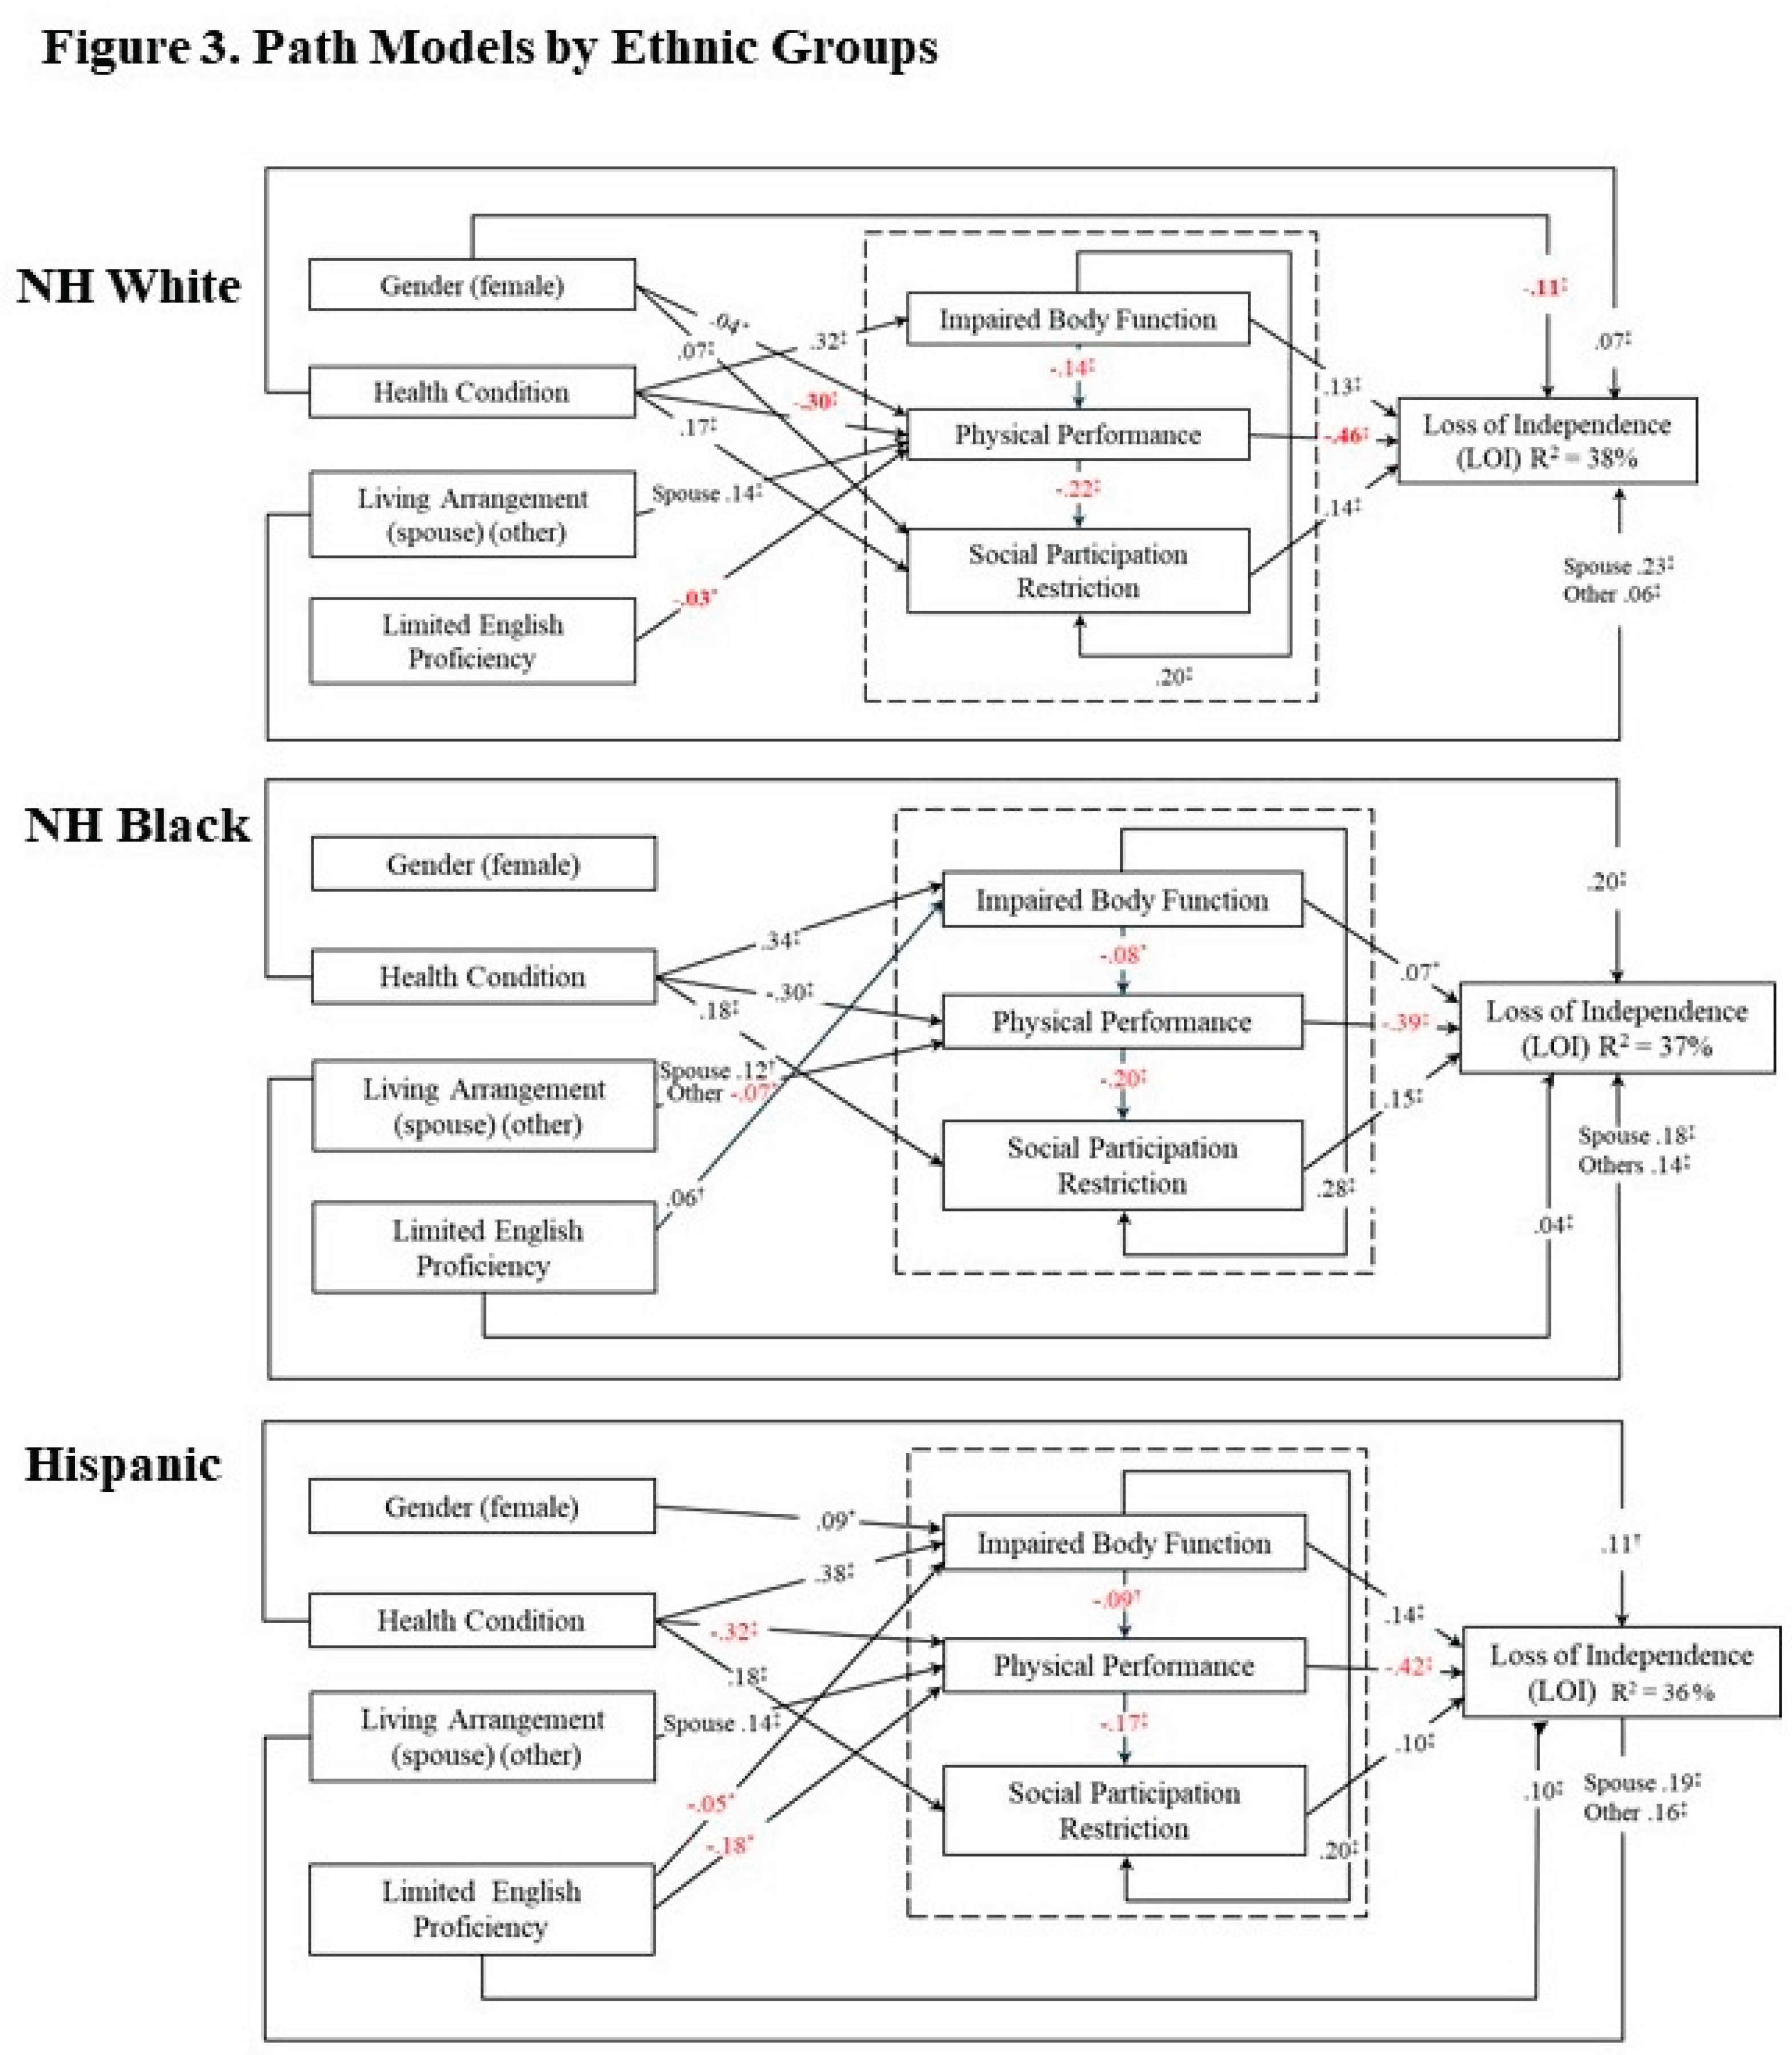
- Gender: The impact of gender on functional independence varied significantly by race and ethnicity: Only NH White women exhibited a direct association with a lower risk of LoI compared to NH White men (γ = -.11, p < .001). This group also demonstrated significant indirect protective effects mediated through improved physical performance. NH Black women did not exhibit any significant direct or indirect effect on LoI (p > .05), suggesting that the gendered experience of disability may be moderated by other structural factors in this population. Hispanic women demonstrated an indirect effect on LoI mediated specifically through limited body function (γ = .09, p < .05).
- The Role of Health conditions were directly associated with a higher risk of LoI across all three groups. Health conditions also influenced LoI indirectly by increasing impaired body function, reducing physical performance, and increasing social participation restrictions (p < .001). The strongest direct effect was observed in the NH Black group (γ = .20, p < .001, respectively), followed by the Hispanic and NH White groups (γ = .108 and γ = .074, p < 0.01, respectively). In the NH Black group, only health conditions had an indirect effect on LoI through body function limitations (γ = .024, p < .05).
- Limitations in body function had a significant direct effect on LoI across all groups (ß =.072~.137, p < .001). A serial mediation effect was also observed:poor health conditions led to body function limitations, which in turn increased LoI (γ =.04~.25, p < .05). Among subgroup differences, only Hispanic women showed an indirect association with LoI through limitations in body function (γ =.012, p < .05).
- Living arrangements: Compared to those living alone, individuals living with spouse or with others (non-family members) had a significantly higher risk of LoI across all racial/ethnic groups (γ = .18~.23, p < .001). Additionally, those living with spouse exhibited an indirect effect on LoI through lower physical performance (γ = .12~.14, p < .01).
- Limited English proficiency had a direct effect on LoI in both NH Black and Hispanic groups (γ = .04 and γ = .10, p < 0.01, respectively).
- Physical performance as a Key Mediator. Consistent with the study hypothesis, physical performance emerged as a critical determinant. Physical performance had a strong direct negative impact on LoI across all racial/ethnic groups (ß = -.39 ~ -.46, p < .001), indicating that better physical performance is the most robust predictor of maintained independence. Additionally, physical performance mediated the effects of poor health, body function limitations, and living with a spouse all groups (p < 0.01). Group-specific Indirect Pathways: Beyond the direct associations, the model revealed critical indirect pathways that differed significantly by racial and ethnic group. Among NH White, female gender showed a significant indirect protective effect on LoI, mediated by superior physical performance (γ = -.020, p < .05). In the NH Black groups, a unique social-environmental pathway emerged: Living with non-family others was indirectly associated with higher LoI through its negative impact on physical performance (γ =.027, p < .05). For the Hispanic group, limited English proficiency functioned as a significant structural barrier, increasing LoI risk indirectly through its negative association with physical performance (p < .05).
- Serial Mediation. As detailed in Table 2, path analysis confirmed a complex cascading chain of functional decline did not merely impact independence directly; they initiated a serial mediation process where increased chronic conditions led to impaired body function, which subsequently reduced objective physical performance, ultimately resulting in a higher risk of LoI (γ =.010~.021, p < .05).
- Social participation restriction had a significant direct positive effect on LoI across all racial/ethnic groups (ß =.104~.153, p < .001), indicating that greater restriction was consistently linked to a higher risk of losing independence. Health conditions had a significant indirect effect on LoI through social participation restriction across all groups (γ =.018~.027, p < .001). This confirms a pathway where poor health limits social engagement, which in turn accelerates loss of independence. Among demographic variables, only gender in the NH White women showed a significant indirect associated with LoI through social participation restriction (γ =.009, p < .001). However, living arrangement (with spouse or others) and English proficiency did not show significant indirect effects through social participation pathway (p > .05) (Table 2).
- Total Variance Explained and Factor Contributions. The final ICF-based models explained a substantial portion of the total variance in LoI across all groups: 38.2% for NH White, 37.0% for NH Black, and 36.6% for the Hispanic group (p < .001).
To understand the relative importance of these predictors, we examined the contribution of each factor to the explained variance (Table 2): Social participation restriction in all three ethnic groups accounted for the largest share of the explained variance (ranging from 20.7% to 23.8%). NH black group showed the highest contribution of social participation restriction to LoI (23.8%).
Physical performance accounted for 14.2% ~ 21% of variance, followed by body function (11% to 16.8%, p < .001). Notably, Hispanic group exhibited the greatest contributions from both physical performance (21%) and body function (16.8%) compared to the other groups, reinforcing the finding that physical determinants are particularly noticeable for this population.
4. Discussion
Theoretical Utility of the ICF Framework. Our findings provide robust empirical support for the International Classification of Functioning, Disability, and Health (ICF) framework. The model consistently explained a high proportion of variance in Loss of Independence (LoI) across all groups (36.6% to 38.2%), reinforcing the model’s utility as a holistic tool for understanding disability beyond a purely medical lens [18,19,21]. By integrating personal factors, environmental contexts, and functional performance, the ICF captures the dynamic nature of aging in a multicultural society, reflecting the core objective of the NHATS to provide a comprehensive view of late-life vulnerability [55].
The Contested Nature of Ethnicity and LoI Risk. This study identified significant racial/ethnic disparities in LoI scores, with Hispanic participants exhibiting the highest risk, followed by the NH Black and NH White participants. Interestingly, these findings contrast with some previous literature that reported higher disability prevalence among NH Black older adults [3,12]. This discrepancy highlights the “contested nature” of health disparities; it suggests that the drivers of independence are not static and may shift based on current socio-political contexts, immigration histories, and the varying effectiveness of linguistic and social support systems across different regions in the United States.
Universal vs. Group-Specific Predictors.
While physical performance emerged as the strongest direct predictor across groups with standardized estimates ranging from -0.39 to -0.46, the pathways leading to these outcomes were distinctly group-specific. Social participation restriction played a key mediating role for all groups but was most noticeable for NH Black participants (accounting for 23.8% of explained variance). This aligns with research suggesting that while the biological “cascade” of disability (Health → Body Function → Performance) is universal, the social and environmental “brakes” or “accelerants” of this process are deeply rooted in cultural and structural contexts. These findings are consistent with previous research suggesting that greater social engagement reduces the risk of functional decline [56,57]. However, the magnitude and direction of these effects varied by racial/ethnic group.
NH White group: A unique gendered pathway emerged where NH White women showed both direct and indirect protective effects against LoI through enhanced physical performance and social participation. This finding suggests that women in this cohort may navigate social networks or health-seeking behaviors more effectively than their male counterparts, aligning with studies that highlight gender-based differences in late-life independence [58,59]. Conversely, Living with a spouse was strongly associated with an increased risk of LoI (γ = .23). This potentially reflects a “dependency effect” or a dyadic dynamic where one partner’s decline accelerates the perceived vulnerability of the other. Notably, this result contrasts with research reporting greater ADL independence among women living with spouses [60].
NH Black group: Gender showed no significant direct or indirect influence on LoI, but social-environmental factors were critical. Living with others (non-family members) was uniquely associated with higher LoI through its negative impact on physical performance. This path highlights complex trade-offs in multi-cultural contexts, where shared living arrangements—often a necessity for economic or caregiving reasons—may also be markers of higher physical vulnerability.
Hispanic group: Limited English proficiency emerged as a dominant risk factor, exerting both a significant direct impact on LoI and indirect effects through impaired body function and physical performance. This suggests that language is not merely a communication tool but a primary structural determinant that mediates access to community resources, and the maintenance of physical independence [61]. These results underscore the complex, multi-dimensionality of LoI and validate the ICF framework’s utility in modeling how personal and environmental factors intersect in diverse aging contexts. Furthermore, the finding that risk factors for LoI are not uniform across groups, reinforces the need for culturally and contextually tailored interventions that consider specific structural barriers such as language accessibility, unique living arrangements, and gender roles to mitigate functional health disparities in later life. .
Methodological Challenges and Limitations: A key methodological challenge in multicultural research is the tension between generalizability and specificity. While the NHATS provides a rich, nationally representative sample, the exclusion of Asian American and Indigenous populations due to sample size constraints limits our understanding of the full American aging experience. Furthermore, the absence of recent socioeconomic data (income/wealth) in Round 13 is a significant limitation, as socioeconomic status is a critical driver of the disparities observed here. Future research must address these “missing” populations and data points to provide a truly critical policy analysis.
5. Conclusions
This study demonstrates that Loss of Independence (LoI) is a multidimensional construct influenced by an intersecting array of personal, functional, and environmental factors. While the “what” of independence (physical performance) is consistent across groups, the “how” (the pathways of gender, language, and living arrangements) is highly distinct.
For policy and practice to be effective, they must move beyond generic, “one-size-fits-all” aging services. Interventions should be culturally and linguistically responsive, prioritizing physical activity for all but focusing specifically on social engagement for NH Black populations and linguistic accessibility for Hispanic older adults. Ultimately, preventing functional decline and promoting independence in a diverse society requires addressing the structural inequities—such as language barriers and social isolation—that accelerate functional decline across racial and ethnic lines.
Supplementary Materials
The following supporting information can be downloaded at the website of this paper posted on Preprints.org.
Author Contributions
Conceptualization, Y-S Lee and SH Shin; methodology, software, validation and formal analysis, SH shin and HJ Jun; investigation, YS Lee; data curation, L Camacho & J Cruz; writing—original draft preparation, YH Lee; writing—review and editing, A Moore; visualization and supervision, YS Lee and HJ Jun.; project administration and funding acquisition, YS Lee and HJ Jun. All authors have read and agreed to the published version of the manuscript.” Please turn to the CRediT taxonomy for the term explanation. Authorship must be limited to those who have contributed substantially to the work reported.
Institutional Review Board Statement
This he study was conducted in accordance with the ethical principles of the Declaration of Helsinki, and the protocol was approved by the Institutional Review Board (Protocol code: IRB-24-0269). The analyses were based on publicly available, de-identified data from the National Health and Aging Trends Study (NHATS). The original NHATS protocols were approved by the Johns Hopkins Bloomberg School of Public Health Institutional Review Board.
Informed Consent Statement
Informed consent was obtained from all subjects involved in the original NHATS study. As this current study utilized publically available, de-identified data, additional informed consent was not applicable.
Data Availability Statement
Publicly available datasets were analyzed in this study. The data supporting these findings can be accessed through the National Health and Aging Trends Study (NHATS) repository at https://www.nhats.org/nhats.
Acknowledgments
The authors have reviewed and edited the output and take full responsibility for the content of this publication.”.
Conflicts of Interest
The authors declare no conflict of interest.
Abbreviations
The following abbreviations are used in this manuscript:
| MDPI | Multidisciplinary Digital Publishing Institute |
| DOAJ | Directory of open access journals |
| TLA | Three letter acronym |
| LD | Linear dichroism |
References
- U.S. DHHS. U.S. DHHS. The Surgeon General’s Call to Action to Improve the Health and Wellness of Persons with Disabilities. US DHHS, Office of the Surgeon General (US). Rockville (MD), 2005.
- Kraus, L.; Lauer, E.; Coleman, R.; Houtenville, A. 2017 Disability Statistics Annual Report.; University of New Hampshire: Durham, NH, 2018. [Google Scholar]
- Okoro, C. A.; Hollis, N. D.; Cyrus, A. C.; Griffin-Blake, S. Prevalence of Disabilities and Health Care Access by Disability Status and Type Among Adults - United States, 2016. MMWR Morb. Mortal. Wkly. Rep. From NLM. 2018, 67(32), 882–887. [Google Scholar] [CrossRef] [PubMed]
- U.S. Census Bureau. Disability Characteristics: 2018 ACS 1-Year Estimates Subject Tables. U.S> Census Bureau. 2020. Available online: https://data.census.gov/cedsci/table?q=S1810%3A%20DISABILITY%20CHARACTERISTICS&hidePreview=true&tid=ACSST1Y2018.S1810 (accessed on 2020 Dec. 17).
- U.S. DHHS. 2018 Profile of Older Americans. the Administration on Aging (AoA), A. f. C. L., U.S. Department of Health and Human Services (DHHS), Ed.; Administration on Aging (AoA), Administration for Community Living. U.S. Department of Health and Human Services, 2018. [Google Scholar]
- Arias, E. United States Life Tables, 2017. Natl. Vital. Stat. Rep. From NLM. 2019, 68(7), 1–66. [Google Scholar] [CrossRef] [PubMed]
- U.S. Census Bureau. Living With Disabilities: Number of Americans With a Disability. In Anniversary of Americans With Disabilities Act; US Census Bureau, 26 July.
- Freedman, V. A.; Wolf, D. A.; Spillman, B. C. Disability-Free Life Expectancy Over 30 Years: A Growing Female Disadvantage in the US Population. Am. J. Public Health From NLM. 2016, 106(6), 1079–1085. [Google Scholar] [CrossRef] [PubMed]
- Hosseinpoor, A. R.; Williams, J. S.; Jann, B.; Kowal, P.; Officer, A.; Posarac, A.; Chatterji, S. Social determinants of sex differences in disability among older adults: a multi-country decomposition analysis using the World Health Survey. Int. J. Equity Health 2012, 11, 52. [Google Scholar] [CrossRef]
- WHO. WHO. Life expectancy and Healthy life expectancy Data by country. World Health Organization, 2018. https://apps.who.int/gho/data/node.main.688?lang=en (accessed 2020 July 10). 2018. [Google Scholar]
- WHO. WHO. Life expectancy and Healthy life expectancy Data by country. World Health Organization, 2020. https://apps.who.int/gho/data/node.main.688 (accessed 2024 Jan 10). 2020. [Google Scholar]
- Goyat, R.; Vyas, A.; Sambamoorthi, U. Racial/Ethnic Disparities in Disability Prevalence. J. Racial Ethn. Health Disparities 2016, 3(4), 635–645. [Google Scholar] [CrossRef]
- Lee, J.; Lau, S.; Meijer, E.; Hu, P. Living Longer, With or Without Disability? A Global and Longitudinal Perspective. J. Gerontol. A Biol. Sci. Med. Sci. 2020, 75(1), 162–167. [Google Scholar] [CrossRef]
- Loeb, M.; Chen, L. H. Assessing injury-related movement difficulties: A method for analyzing the association between functional limitations and social participation. Disabil. Health J.;From NLM 2011, 4(2), 102–111. [Google Scholar] [CrossRef] [PubMed]
- Heerkens, Y. F.; de Weerd, M.; Huber, M.; de Brouwer, C. P. M.; van der Veen, S.; Perenboom, R. J. M.; van Gool, C. H.; Ten Napel, H.; van Bon-Martens, M.; Stallinga, H. A.; et al. Reconsideration of the scheme of the international classification of functioning, disability and health: incentives from the Netherlands for a global debate. Disabil. Rehabil. From NLM. 2018, 40(5), 603–611. [Google Scholar] [CrossRef] [PubMed]
- Organization, W. H. Organization, W. H. International Classification of Functioning, Disability and Health. 2001. https://www.who.int/classifications/icf/en/(accessed 2020 June 22).
- U.S. DHHS. Healthy People 2010 2010. [CrossRef]
- Liu, J. Y. The severity and associated factors of participation restriction among community-dwelling frail older people: an application of the International Classification of Functioning, Disability and Health (WHO-ICF). BMC Geriatr. 2017, 17(1), 43. [Google Scholar] [CrossRef]
- Maribo, T.; Petersen, K. S.; Handberg, C.; Melchiorsen, H.; Momsen, A. M.; Nielsen, C. V.; Leonardi, M.; Labriola, M. Systematic Literature Review on ICF From 2001 to 2013 in the Nordic Countries Focusing on Clinical and Rehabilitation Context. J. Clin. Med. Res. 2016, 8(1), 1–9. [Google Scholar] [CrossRef]
- McDermott, S.; Turk, M. A. Erratum to “Support for reevaluation of the international classification of functioning, disability, and health (ICF): A view from the US” [DHJO (2019) 137-138]. Disabil. Health J. From NLM. 2019, 12(3), 533. [Google Scholar] [CrossRef] [PubMed]
- Weigl, M.; Wild, H. European validation of The Comprehensive International Classification of Functioning, Disability and Health Core Set for Osteoarthritis from the perspective of patients with osteoarthritis of the knee or hip. Disabil. Rehabil. From NLM. 2018, 40(26), 3104–3112. [Google Scholar] [CrossRef] [PubMed]
- U.S. DHHS. U.S. DHHS. Older Adults in Healthy People 2020. Office of Disease Prevention and Health Promotion, U.S. Department of Health and Human Services, 2014. https://www.healthypeople.gov/2020/topics-objectives/topic/older-adults/objectives (accessed 2020 July 13). 2014. [Google Scholar]
- U.S. DHHS. U.S. DHHS. Healthy People 2030: People with Disabilities. Office of Disease Prevention and Health Promotion, U.S. Department of Health and Human Services, 2020. https://health.gov/healthypeople/objectives-and-data/browse-objectives/people-disabilities (accessed 2020 Dec. 2). 2020. [Google Scholar]
- Dorsey, R.; Graham, G.; Glied, S.; Meyers, D.; Clancy, C.; Koh, H. Implementing health reform: improved data collection and the monitoring of health disparities. In Annu Rev Public Health; From NLM, Ed.; 2014; Volume 35, pp. 123–138. [Google Scholar] [CrossRef] [PubMed]
- Pendo, E. Collecting New Data on Disability Health Inequities. Hastings Cent. Rep. 2016, 46(2), 7–8. [Google Scholar] [CrossRef]
- Freedman, V. A.; Schrack, J. A.; E., S. M. National Health and Aging Trends Study (NHATS) User Guide, Round 1-12 Final Release; Johns Hopkins University School of Public Health: Baltimore, MD, 2023. Available online: www.NHATS.org.
- Ensrud, K. E.; Schousboe, J. T.; Kats, A. M.; Taylor, B. C.; Boyd, C. M.; Langsetmo, L. Incremental Health Care Costs of Self-Reported Functional Impairments and Phenotypic Frailty in Community-Dwelling Older Adults: A Prospective Cohort Study. Ann. Intern Med. 2023, 176(4), 463–471. [Google Scholar] [CrossRef]
- Shirazi, D.; Haudenschild, C.; Lynch, D. H.; Fanous, M.; Kahkoska, A. R.; Jimenez, D.; Spangler, H.; Driesse, T.; Batsis, J. A. Obesity, multiple chronic conditions, and the relationship with physical function: Data from the national health and aging trends survey From NLM. Arch. Gerontol. Geriatr. 2023, 107, 104913. [Google Scholar] [CrossRef] [PubMed]
- Choi, N. G.; Choi, B. Y.; Marti, C. N. Changes in Older Adults’ Frequency of Going Outside between 2020 and 2021: Associations with Health Status and Environmental Factors. Clin. Gerontol. From NLM. 2023, 46(5), 745–758. [Google Scholar] [CrossRef] [PubMed]
- Liu, K.; Peng, W.; Ge, S.; Li, C.; Zheng, Y.; Huang, X.; Liu, M. Longitudinal associations of concurrent falls and fear of falling with functional limitations differ by living alone or not. Front Public Health From NLM. 2023, 11, 1007563. [Google Scholar] [CrossRef] [PubMed]
- Freedman, V. A.; Kasper, J. D. Cohort Profile: The National Health and Aging Trends Study (NHATS). Int. J. Epidemiol. From NLM Medline. 2019, 48(4), 1044–1045g. [Google Scholar] [CrossRef] [PubMed]
- Saliba, D.; Elliott, M.; Rubenstein, L. Z.; Solomon, D. H.; Young, R. T.; Kamberg, C. J.; Roth, C.; MacLean, C. H.; Shekelle, P. G.; Sloss, E. M.; et al. The Vulnerable Elders Survey: a tool for identifying vulnerable older people in the community. J. Am. Geriatr. Soc. From NLM. 2001, 49(12), 1691–1699. [Google Scholar] [CrossRef] [PubMed]
- Kroc, Ł.; Socha, K.; Sołtysik, B. K.; Cieślak-Skubel, A.; Piechocka-Wochniak, E.; et al. Validation of the Vulnerable Elders Survey-13 (VES-13) in hospitalized older patients. Eur. Geriatr. Med. 2016, 7(5), 449–453. [Google Scholar] [CrossRef]
- Wong, S. F. Management of Functional Decline in Older Adults. Singap. Fam. Physician 2012, 38(1), 8–17. [Google Scholar]
- Bongue, B.; Buisson, A.; Dupre, C.; Beland, F.; Gonthier, R.; Crawford-Achour, É. Predictive performance of four frailty screening tools in community-dwelling elderly From NLM. BMC Geriatr. 2017, 17(1), 262. [Google Scholar] [CrossRef] [PubMed]
- Kroenke, K.; Spitzer, R. L.; Williams, J. B. The Patient Health Questionnaire-2: validity of a two-item depression screener. Med. Care 2003, 41(11), 1284–1292. [Google Scholar] [CrossRef]
- Löwe, B.; Wahl, I.; Rose, M.; Spitzer, C.; Glaesmer, H.; Wingenfeld, K.; Schneider, A.; Brähler, E. A 4-item measure of depression and anxiety: validation and standardization of the Patient Health Questionnaire-4 (PHQ-4) in the general population. J. Affect Disord. From NLM. 2010, 122(1-2), 86–95. [Google Scholar] [CrossRef] [PubMed]
- Guralnik, J. M.; Simonsick, E. M.; Ferrucci, L.; Glynn, R. J.; Berkman, L. F.; Blazer, D. G.; Scherr, P. A.; Wallace, R. B. A short physical performance battery assessing lower extremity function: association with self-reported disability and prediction of mortality and nursing home admission. J. Gerontol. From NLM. 1994, 49(2), M85–94. [Google Scholar] [CrossRef] [PubMed]
- Treacy, D.; Hassett, L. The Short Physical Performance Battery From NLM. J. Physiother. 2018, 64(1), 61. [Google Scholar] [CrossRef] [PubMed]
- Guralnik, J. M.; Ferrucci, L.; Simonsick, E. M.; Salive, M. E.; Wallace, R. B. Lower-extremity function in persons over the age of 70 years as a predictor of subsequent disability. N Engl. J. Med. From NLM. 1995, 332(9), 556–561. [Google Scholar] [CrossRef] [PubMed]
- Guralnik, J. Guralnik, J. Short Physical Performance Battery Protocol and Score Sheet Guide. 2021. https://sppbguide.com/(accessed).
- Bohannon, R. W.; Wolfson, L. I.; White, W. B. Timed mobility: description of measurement, performance, and dimensionality among older adults. Disabil. Rehabil. From NLM. 2018, 40(17), 2011–2014. [Google Scholar] [CrossRef] [PubMed]
- Goldberg, A.; Chavis, M.; Watkins, J.; Wilson, T. The five-times-sit-to-stand test: validity, reliability and detectable change in older females. Aging Clin. Exp. Res. 2012, 24(4), 339–344. [Google Scholar] [CrossRef]
- Jung, H. W.; Baek, J. Y.; Jang, I. Y.; Guralnik, J. M.; Rockwood, K.; Lee, E.; Kim, D. H. Short Physical Performance Battery as a Crosswalk Between Frailty Phenotype and Deficit Accumulation Frailty Index. J. Gerontol. A Biol. Sci. Med. Sci. 2021, 76(12), 2249–2255. [Google Scholar] [CrossRef]
- Muthén, L. K.; Muthén, B. O. Mplus: Statistical Analysis with Latent Variables: User’s Guide (Version 8); Los Angeles, CA, 2017. [Google Scholar]
- SAS® 9.4 System, Version 9.4; SAS Institute Inc.: Cary, NC, 2016.
- Shapiro, S. S.; Wilk, M. B. An analysis of variance test for normality (complete samples). Biometrika 1965, 52(3/4), 591–611. [Google Scholar] [CrossRef]
- Massey, F. J. The Kolmogorov-Smirnov Test for Goodness of Fit. J. Am. Stat. Assoc. 1951, 46(253), 68–78. [Google Scholar] [CrossRef]
- Anderson, T. W. On the distribution of the two-sample Cramér–von Mises criterion. Ann. Math. Stat. 1962, 33(3), 1148–1159. [Google Scholar] [CrossRef]
- Anderson, T. W.; Darling, D. A. A test of goodness of fit. J. Am. Stat. Assoc. 1954, 49(268), 765–769. [Google Scholar] [CrossRef]
- Hu, L.; Bentler, P. M. Cutoff criteria for fit indexes in covariance structure analysis: Conventional criteria versus new alternatives. A Multidiscip. J. 1999, 6(1), 1–55. [Google Scholar] [CrossRef]
- Satorra, A.; Bentler, M. P. A scaled difference chi-square test statistic for moment structure analysis. Psychometrika 2001, 66(4), 507–514. [Google Scholar] [CrossRef]
- Steiger, J. H. Structural Model Evaluation and Modification: An Interval Estimation Approach. Multivar. Behav. Res. From NLM. 1990, 25(2), 173–180. [Google Scholar] [CrossRef] [PubMed]
- Bentler, P. M. Comparative fit indexes in structural models. Psychol. Bull. From NLM. 1990, 107(2), 238–246. [Google Scholar] [CrossRef] [PubMed]
- Freedman, V. A.; Kasper, J. D.; Cornman, J. C.; Agree, E. M.; Bandeen-Roche, K.; Mor, V.; Spillman, B. C.; Wallace, R.; Wolf, D. A. Validation of new measures of disability and functioning in the National Health and Aging Trends Study. J. Gerontol. A Biol. Sci. Med. Sci. From NLM Medline. 2011, 66(9), 1013–1021. [Google Scholar] [CrossRef] [PubMed]
- Shimizu, Y.; Suzuki, M.; Hata, Y.; Sakaki, T. The relationship between frailty and social participation: focus on subjective health. BMC Res. Notes From NLM. 2023, 16(1), 123. [Google Scholar] [CrossRef] [PubMed]
- Sone, T.; Nakaya, N.; Sugawara, Y.; Matsuyama, S.; Tsuji, I. Effect of social participation on the association between frailty and disability. Arch. Gerontol. Geriatr. 2023, 110, 104989. [Google Scholar] [CrossRef] [PubMed]
- Kodama, S.; Hoshi, T.; Kurimori, S. Decline in independence after three years and its association with dietary patterns and IADL-related factors in community-dwelling older people: an analysis by age stage and sex. BMC Geriatr. From NLM. 2021, 21(1), 385. [Google Scholar] [CrossRef] [PubMed]
- Okabe, T.; Suzuki, M.; Iso, N.; Tanaka, K.; Sagari, A.; Miyata, H.; Han, G.; Maruta, M.; Tabira, T.; Kawagoe, M. Long-Term Changes in Older Adults’ Independence Levels for Performing Activities of Daily Living in Care Settings: A Nine-Year Follow-Up Study From NLM. Int. J. Env. Res. Public Health 2021, 18(18). [Google Scholar] [CrossRef] [PubMed]
- Redzovic, S.; Vereijken, B.; Bonsaksen, T. Aging at home: factors associated with independence in activities of daily living among older adults in Norway-a HUNT study From NLM. Front Public Health 2023, 11, 1215417. [Google Scholar] [CrossRef] [PubMed]
- Islam, S. J.; Teruya, S.; Fine, D.; Sabogal, N.; Fils, S.; Ullah, I.; Sanchorawala, A.; Miller, E.; Gallegos, C.; de Freitas, C. Health Literacy and Physical Function among Older Black and Hispanic Individuals with Heart Failure From NLM. J. Card. Fail 2025. [Google Scholar] [CrossRef] [PubMed]

Table 1.
Characteristics of participants for overall sample and by race/ethnicity (N= 7106).
| Characteristics | Total | NH White | NH Black | Hispanic | ||||||
| n | (%) | n | (%) | n | (%) | n | (%) | P-value | ||
| Total | 7106 | (100.00) | 4393 | (82.22) | 1392 | (8.99) | 1321 | (8.78) | ||
| Demographics | ||||||||||
| Age | <.001 | |||||||||
| 65~74 | 2460 | (52.16) | 1367 | (50.83) | 525 | (58.37) | 568 | (58.22) | ||
| 75 ~85 | 3150 | (37.08) | 2003 | (37.95) | 612 | (33.04) | 535 | (33.09) | ||
| 85+ | 1496 | (10.77) | 1023 | (11.23) | 255 | (8.59) | 218 | (8.68) | ||
| Gender | .043 | |||||||||
| Men | 3037 | (45.04) | 1928 | (45.57) | 535 | (40.68) | 574 | (44.57) | ||
| Women | 4069 | (54.96) | 2465 | (54.43) | 857 | (59.32) | 747 | (55.43) | ||
| Mean | (SE) | Mean | (SE) | Mean | (SE) | Mean | (SE) | P-value | ||
| Loss of Independence (0-10) | 3.87 | (0.05) | 3.77 | (0.06) | 4.08 | (0.08) | 4.6 | (0.11) | <.001 | |
| Health condition | ||||||||||
| Total score | (0-4) | .92 | (0.02) | .92 | (0.02) | .86 | (0.03) | .96 | (0.04) | .189 |
| Impaired body function | ||||||||||
| Total score | (0-6) | 2.46 | (0.02) | 2.45 | (0.02) | 2.48 | (0.04) | 2.5 | (0.05) | .510 |
| Physical performance | ||||||||||
| Total score | (0-12) | 8.47 | (0.09) | 8.75 | (0.10) | 7.12 | (0.14) | 7.32 | (0.17) | <.001 |
| Social participation restriction | ||||||||||
| Total score | (0-7) | .70 | (0.02) | .69 | (0.03) | .82 | (0.05) | .75 | (0.05) | .050 |
| n | (%) | n | (%) | n | (%) | n | (%) | P-value | ||
| Health condition | ||||||||||
| Medical condition | (0-2) | 3547 | (55.92) | 2221 | (56.38) | 653 | (53.67) | 673 | (53.93) | |
| (≥ 3) | 3559 | (44.08) | 2172 | (43.62) | 739 | (46.33) | 648 | (46.07) | ||
| Falls in 12 months | (0-1) | 5954 | (84.50) | 3618 | (84.11) | 1213 | (88.11) | 1123 | (84.38) | |
| (≥ 2) | 1128 | (15.50) | 753 | (15.89) | 177 | (11.89) | 198 | (15.62) | ||
| Fracture history | Yes | 834 | (14.62) | 531 | (15.17) | 111 | (9.51) | 192 | (14.68) | |
| No | 6272 | (85.38) | 3862 | (84.83) | 1281 | (90.49) | 1129 | (85.32) | ||
| Hospitalization | Yes | 1379 | (17.92) | 843 | (17.69) | 279 | (18.59) | 257 | (19.38) | |
| No | 5173 | (82.08) | 3538 | (82.31) | 1112 | (81.41) | 1063 | (80.62) | ||
| Impaired body function | ||||||||||
| Hearing aid | Yes | 1354 | (17.90) | 1133 | (20.41) | 89 | (4.73) | 132 | (7.82) | |
| No | 5750 | (82.10) | 3258 | (79.59) | 1303 | (95.27) | 1189 | (92.18) | ||
| Vision aid | Yes | 6335 | (90.45) | 4007 | (91.30) | 1211 | (87.06) | 1117 | (85.94) | |
| No | 770 | (9.55) | 385 | (8.70) | 181 | (12.94) | 204 | (14.06) | ||
| Chewing/swallowing problems | Yes | 756 | (9.44) | 449 | (9.04) | 131 | (8.71) | 176 | (13.94) | |
| No | 6346 | (90.56) | 3941 | (90.96) | 1261 | (91.29) | 1144 | (86.06) | ||
| Pain | Yes | 4061 | (56.79) | 2510 | (56.85) | 834 | (59.00) | 717 | (53.96) | |
| No | 3044 | (43.21) | 1882 | (43.15) | 558 | (41.00) | 606 | (46.04) | ||
| Sleep disturbance | Yes | 3351 | (44.81) | 1851 | (42.69) | 784 | (56.37) | 716 | (52.87) | |
| No | 3735 | (55.19) | 2529 | (57.31) | 602 | (43.63) | 604 | (47.13) | ||
| Anxiety/depression | Yes | 2044 | (26.74) | 1095 | (25.13) | 445 | (32.43) | 504 | (35.95) | |
| No | 5060 | (73.26) | 3296 | (74.87) | 947 | (67.57) | 817 | (64.05) | ||
| Environmental factors | ||||||||||
| Living arrangement | <.001 | |||||||||
| Living w/spouse or spouse & others | 3443 | (56.61) | 2335 | (59.05) | 483 | (39.70) | 625 | (51.11) | ||
| Living alone | 2274 | (29.16) | 1482 | (29.39) | 494 | (34.99) | 298 | (21.01) | ||
| Living with others only | 1389 | (14.23) | 576 | (11.56) | 415 | (25.31) | 398 | (27.87) | ||
| Limited English proficiency | <.001 | |||||||||
| Well | 6394 | (95.80) | 4380 | (99.77) | 1383 | (99.28) | 631 | (55.14) | ||
| Not well | 712 | (4.20) | 13 | (0.23) | 9 | (.72) | 690 | (44.87) | ||
Notes: Frequencies (N) are unweighted. Percentages, means, and standard errors are weighted to account for survey design and represent the target population. P values reflect a joint significance test comparing all racial/ethnic groups for each variable.
Table 2.
Standardized Effects of Predictors on Outcome variables by Racial/Ethnic Groups (N=7106).
| Predictor Variable | Outcome Variable | N-H White | N-H Black | Hispanic | ||||||||
| Est. | 95% CI | Est. | 95% CI | Est. | 95% CI | |||||||
| Direct effects | ||||||||||||
| LoI | ||||||||||||
| Female | -.108‡ | -.138, | -.078 | |||||||||
| Health condition | .074‡ | .040, | .108 | .202‡ | .139, | .264 | .110‡ | .049, | .170 | |||
| Limited English | .043‡ | .017 | .069 | .097† | .031 | .164 | ||||||
| Live w/spouse | .226‡ | .190, | .261 | .180‡ | .115, | .245 | .194‡ | .120, | .267 | |||
| Live w/other | .058‡ | .030, | .085 | .139‡ | .077, | .202 | .158‡ | .086, | .231 | |||
| Impaired body fx. | .125‡ | .097, | .153 | .072* | .011, | .133 | .137‡ | .074, | .200 | |||
| Phy performance | -.463‡ | -.502, | -.425 | -.388‡ | -.444, | -.332 | -.416‡ | -.473, | -.359 | |||
| Soc participation restriction | .135‡ | .106, | .163 | .153‡ | .109, | .197 | .104‡ | .062, | .146 | |||
| Impaired Body Function | ||||||||||||
| Female | .023 | -.014, | .060 | .064 | -.014, | .142 | .085* | .019, | .150 | |||
| Health condition | .324‡ | .286, | .361 | .340‡ | .287, | .394 | .378‡ | .312, | .443 | |||
| Limited English | .024 | -.008, | .056 | .062† | .018, | .106 | -.053* | -.105, | -.002 | |||
| Live w/spouse | -.017 | -.061, | .026 | -.021 | -.083, | .041 | -.065 | -.151, | .020 | |||
| Live w/other | .010 | -.033, | .052 | -.028 | -.098, | .042 | -.026 | -.113, | .061 | |||
| Phy performance | ||||||||||||
| Female | .043* | .005, | .080 | .063 | -.006, | .131 | -.031 | -.094, | .033 | |||
| Health condition | -.296‡ | -.327, | -.266 | -.295‡ | -.352, | -.238 | -.318‡ | -.389, | -.248 | |||
| Limited English | -.031* | -.061, | -.001 | -.031 | -.107, | .044 | -.177‡ | -.254, | -.100 | |||
| Live w/spouse | .140‡ | .104, | .175 | .120† | .042, | .199 | .140† | .057, | .224 | |||
| Live w/other | -.037 | -.080, | .007 | -.070* | -.133, | -.008 | .005 | -.068, | .078 | |||
| Impaired body function | -.140‡ | -.178, | -.103 | -.075* | -.145, | -.006 | -.085† | -.143, | -.026 | |||
| Limited Social participation | ||||||||||||
| Female | .069‡ | .039, | .100 | .048 | -.013, | .110 | .067 | -.009, | .143 | |||
| Health condition | .174‡ | .136, | .212 | .177‡ | .107, | .247 | .176‡ | .111, | .242 | |||
| Limited English | .019 | -.022, | .059 | -.016 | -.067, | .035 | .022 | -.045, | .089 | |||
| Live w/spouse | -.045 | -.091, | .002 | -.025 | -.087, | .037 | -.061 | -.142, | .019 | |||
| Live w/other | .005 | -.040, | .049 | -.031 | -.097, | .034 | .040 | -.067, | .147 | |||
| Impaired body function | .197‡ | .168, | .227 | .280‡ | .218, | .342 | .196‡ | .146, | .246 | |||
| Phy performance | -.216‡ | -.254, | -.178 | -.201‡ | -.255, | -.136 | -.170‡ | -.234, | -.106 | |||
| Indirect effects to LoI | ||||||||||||
| Impaired body function (BF) | ||||||||||||
| Female | .003 | -.002, | .007 | .005 | -.003, | .012 | .012* | .001, | .023 | |||
| Health condition | .040‡ | .030, | .051 | .024* | .003, | .046 | .052‡ | .026, | .077 | |||
| Limited English | .003 | -.001, | .007 | .004 | .000, | .009 | -.007 | -.015, | 0.00 | |||
| Live w/spouse | -.002 | -.008, | .003 | -.001 | -.006, | .003 | -.009 | -.020, | .003 | |||
| Live w/other | .001 | -.004, | .007 | -.002 | -.007, | .003 | -.004 | -.016, | .009 | |||
| Phy Performance (PP) | ||||||||||||
| Female | -.020* | -.037, | -.002 | -.024 | -.051, | .002 | .013 | -.014, | .039 | |||
| Health condition | .137‡ | .118, | .157 | .115‡ | .084, | .145 | .132‡ | .091, | .174 | |||
| Limited English | .014* | .000, | .028 | .012 | -.017, | .042 | .074‡ | .043, | .105 | |||
| Live w/spouse | -.065‡ | -.083, | -.047 | -.047† | -.079, | -.015 | -.058† | -.097, | -.020 | |||
| Live w/other | .017 | -.003, | .037 | .027* | .003, | .052 | -.002 | -.032, | .028 | |||
| Soc participation restriction (SP) | ||||||||||||
| Female | .009‡ | .005, | .014 | .007 | -.002, | .017 | .007 | -.001, | .015 | |||
| Health condition | .023‡ | .016, | .031 | .027‡ | .014, | .041 | .018‡ | .008, | .028 | |||
| Limited English | .003 | -.003, | .008 | -.002 | -.010, | .006 | .002 | -.005, | .009 | |||
| Live w/spouse | -.006 | -.013, | .001 | -.004 | -.013, | .006 | -.006 | -.015, | .002 | |||
| Live w/other | .001 | -.005, | .007 | -.005 | -.015, | .005 | .004 | -.007, | .016 | |||
| BF→PP | ||||||||||||
| Female | .001 | -.001, | .004 | .002 | -.001, | .005 | .003 | -.001, | .007 | |||
| Health condition | .021‡ | .014, | .028 | .010* | .000, | .020 | .013† | .004, | .023 | |||
| Limited English | .002 | .000, | .004 | .002 | .000, | .004 | -.002 | -.004, | .000 | |||
| Live w/spouse | -.001 | -.004, | .002 | -.001 | -.002, | .001 | -.002 | -.006, | .002 | |||
| Live w/other | .001 | -.002, | .003 | -.001 | -.003, | .001 | -.001 | -.004, | .003 | |||
| BF→SP | ||||||||||||
| Female | .001 | .000, | .002 | .003 | .000, | .006 | .002* | .000, | .003 | |||
| Health condition | .009‡ | .006, | .011 | .015‡ | .009, | .020 | .008‡ | .004, | .012 | |||
| Limited English | .001 | .000 | .001 | .003* | .001 | .005 | -.001 | -.002 | .000 | |||
| Live w/spouse | .000 | -.002, | .001 | -.001 | -.004, | .002 | -.001 | -.003, | .000 | |||
| Live w/other | .000 | -.001, | .001 | -.001 | -.004, | .002 | -.001 | -.002, | .001 | |||
| PP→SP | ||||||||||||
| Female | -.001* | -.002, | .000 | -.002 | -.004, | .000 | .001 | -.001, | .002 | |||
| Health condition | .009‡ | .006, | .011 | .009‡ | .005, | .014 | .006‡ | .003, | .009 | |||
| Limited English | .001 | .000 | .002 | .001 | -.001 | .003 | .003† | .001, | .005 | |||
| Live w/spouse | -.004‡ | -.006, | -.002 | -.004* | -.007, | -.001 | -.002* | -.005, | .000 | |||
| Live w/other | .001 | .000, | .002 | .002* | .000, | .004 | .000 | -.001, | .001 | |||
| BF→PP→SP | ||||||||||||
| Female | .000 | .000, | .000 | .000 | .000, | .000 | .000 | .000, | .000 | |||
| Health condition | .001‡ | .001, | .002 | .001 | .000, | .002 | .001* | .000, | .001 | |||
| Limited English | .000 | .000, | .000 | .000 | .000 | .000 | .000 | .000, | .000 | |||
| Live w/spouse | .000 | .000, | .000 | .000 | .000, | .000 | .000 | .000, | .000 | |||
| Live w/other | .000 | .000, | .000 | .000 | .000, | .000 | .000 | .000, | .000 | |||
| Total effects on LoI | ||||||||||||
| Female | -.115‡ | -.147, | -.083 | -.009 | -.035, | .016 | .037* | .007, | .066 | |||
| Health condition | .315‡ | .286, | .344 | .402‡ | .355, | .450 | .340‡ | .271, | .408 | |||
| Limited English | .023* | .005, | .040 | .063† | .019, | .106 | .166‡ | .104, | .228 | |||
| Live w/spouse | .147‡ | .105, | .190 | .123‡ | .055, | .190 | .114† | .036, | .191 | |||
| Live w/other | .078‡ | .038, | .119 | .160‡ | .086, | .233 | .156‡ | .071, | .240 | |||
| R2 | ||||||||||||
| LoI | .382‡ | .357, | .408 | .370‡ | .329, | .411 | .366‡ | .311, | .421 | |||
| Impaired body function | .110‡ | .087, | .134 | .129‡ | .088, | .170 | .168‡ | .121, | .215 | |||
| Phy performance | .174‡ | .149, | .200 | .142‡ | -.105, | .179 | .210‡ | .141, | .279 | |||
| Soc participation restriction | .207‡ | .182, | .233 | .238‡ | -.191, | .285 | .209‡ | .152, | .266 | |||
Note. Limited English, Limited English proficiency; Phy performance, physical performance; Soc, social; LoI, Loss of independence; CI, confidence interval. Est, Estimation.is the coefficient. *p < .05 †p < .01 ‡p < .001.
Disclaimer/Publisher’s Note: The statements, opinions and data contained in all publications are solely those of the individual author(s) and contributor(s) and not of MDPI and/or the editor(s). MDPI and/or the editor(s) disclaim responsibility for any injury to people or property resulting from any ideas, methods, instructions or products referred to in the content. |
© 2026 by the authors. Licensee MDPI, Basel, Switzerland. This article is an open access article distributed under the terms and conditions of the Creative Commons Attribution (CC BY) license (http://creativecommons.org/licenses/by/4.0/).
Copyright: This open access article is published under a Creative Commons CC BY 4.0 license, which permit the free download, distribution, and reuse, provided that the author and preprint are cited in any reuse.