
Submitted:
20 July 2026
Posted:
21 July 2026
You are already at the latest version
Abstract
Background/Objectives: Cutaneous T-cell lymphomas (CTCL), most commonly mycosis fungoides and Sézary syndrome, are rare non-Hodgkin lymphomas. Advanced disease responds poorly to current treatments, highlighting the need for new molecularly tar-geted therapies. WEE1 is a central regulator of the G2/M checkpoint and S-phase progression and has emerged as a therapeutic target in several malignancies, yet it has not been systematically explored in CTCL. Methods: We screened a library of more than 2,200 kinase inhibitors in CTCL cell lines and selected adavosertib for further study. Its effects were tested in four CTCL lines, in primary keratinocytes and fibroblasts, in patient-derived malignant CD4⁺ T cells and healthy donor CD4⁺ T cells, and in a MyLa xenograft model, using viability, apoptosis, cell-cycle, western blot, and phospho-protein array assays. Results: Adavosertib reduced viability at submicromolar IC₅₀ values (0.26–0.56 µM) across all four CTCL lines while largely sparing primary skin cells and was more active in malignant than in healthy donor CD4⁺ T cells. It induced apoptosis and cell-line-specific S-phase and/or G2/M accumulation, lowered WEE1 and phospho-CDK1 (Tyr15), and increased phospho-H2A.X. A phospho-protein array showed activation of checkpoint and stress signalling. In vivo, adavosertib slowed MyLa xenograft growth. Conclusions: These preclinical data identify WEE1 as a therapeutic target in CTCL and support further preclinical and early-phase clinical evaluation of adavosertib in this disease.
Keywords:
cutaneous T-cell lymphoma
; mycosis fungoides
; Sézary syndrome
; WEE1
; adavosertib
; AZD1775
; kinase inhibitor screen
; cell cycle
; DNA damage response
; targeted therapy
1. Introduction
Cutaneous T-cell lymphomas (CTCL) are a heterogeneous group of rare, primarily cutaneous non-Hodgkin lymphomas of mature T-cell origin[1,2]. The most frequent entities are mycosis fungoides (MF) and Sézary syndrome (SS), which are characterized by the clonal proliferation of malignant skin-homing T cells[1,3]. While early-stage disease can follow a more indolent course, advanced CTCL is associated with aggressive clinical behavior and poor prognosis, with a median survival of one to five years in stages IIB–IV [4]. Current treatment options for advanced disease include immune modulators, monoclonal antibodies, HDAC inhibitors, and chemotherapy, but responses are often incomplete and of limited duration[5,6]. Allogeneic stem-cell transplantation remains the only potentially curative option, yet is feasible only in selected patients and carries substantial risks [7]. These limitations highlight the need for new targeted therapeutic strategies in advanced CTCL[3,6,8].
Kinase signaling and cell-cycle control are increasingly recognized as relevant therapeutic targets in CTCL. Several pathways, including JAK/STAT signaling and DNA damage response pathways, have been implicated in CTCL pathogenesis and are being explored therapeutically, but the therapeutic potential of kinase inhibition in CTCL remains largely unexplored [9,10]. We therefore applied a systematic kinase inhibitor screening approach to identify compounds with antitumor activity in CTCL. From this screen, adavosertib was selected as a top candidate for further characterization.
Adavosertib is a WEE1 inhibitor. WEE1 regulates the G2/M checkpoint by phosphorylating and inhibiting CDK1, thereby preventing mitotic entry in the presence of DNA damage or incomplete DNA replication. Inhibition of WEE1 can force tumor cells to continue cell-cycle progression despite unresolved damage, leading to replication stress, checkpoint failure, and apoptotic cell death. This concept has shown promise across several solid and haematological malignancies[11,12,13]. Adavosertib is also the most clinically advanced WEE1 inhibitor and has already been evaluated in early-phase clinical studies in patients with advanced solid tumours[14]. In haematological malignancies, preclinical work has further supported WEE1 as a relevant therapeutic target, including recent data in mature T-cell leukaemias and lymphomas [15]. However, WEE1 inhibition has not yet been systematically explored in CTCL.
In the present study, we investigated the activity, selectivity, and mechanism of action of adavosertib in CTCL cell lines, patient-derived malignant T cells, and an in vivo xenograft model.
2. Materials and Methods
2.1. Cell Culture and Reagents
The SS cell line HuT78 was kindly provided by Michael U. Martin (Justus-Liebig-University Gießen, Gießen, Germany). The SS cell line SeAx and the MF cell line HH were gifts from Jan Nicolay (University Heidelberg, Heidelberg, Germany), and the MF cell line MyLa was generously provided by Jean-Philippe Merilo and Edith Chevret (University of Bordeaux, Bordeaux, France). Cell line identity was confirmed by short tandem repeat profiling of HuT78, SeAx, HH, and MyLa. All cell lines were routinely tested for mycoplasma contamination. HuT78, SeAx, HH, and MyLa cells were cultured in RPMI 1640 medium (without L-glutamine) supplemented with 1% penicillin/streptomycin, 1% L-glutamine (all from Gibco/Thermo Fisher, Waltham, MA, USA), and 7.5% fetal calf serum (FCS). Primary human keratinocytes and fibroblasts were isolated from infant foreskins of donors. Keratinocytes were maintained in DermaLife K medium (CellSystems, Troisdorf, Germany). Fibroblasts were cultured in high-glucose Dulbecco’s modified Eagle medium (Gibco/Thermo Fisher) supplemented with 1% penicillin/streptomycin, 1 mM ascorbic acid 2-phosphate (Sigma-Aldrich, St. Louis, MO, USA) and 5% FCS. All cells were maintained at 37 °C in a humidified incubator with 5% CO₂. Adavosertib was purchased from MedChemExpress (Monmouth Junction, NJ, USA).
2.2. Patient Samples
CTCL patients from University Hospital Frankfurt and Municipal Hospital Karlsruhe provided lithium–heparin anticoagulated blood samples. Sample collection was approved by the Ethics Committee of the Faculty of Medicine at University Hospital Frankfurt and by the Medical Faculty Mannheim. All participants provided written informed consent. All Sézary syndrome patients had clinically and histopathologically confirmed disease. Diagnosis and staging were performed according to ISCL/EORTC criteria. Blood involvement was defined by an expanded aberrant CD4⁺ T-cell population with a clonal T-cell receptor (TCR) gene rearrangement in peripheral blood and an increased CD4:CD8 ratio, in the context of typical clinical skin findings and compatible CTCL skin histology.
The aberrant T-cell phenotype was defined using CD7 and, where available, CD26. CD26 was not yet part of the routine diagnostic panel in Frankfurt during earlier sampling, so no clinical CD26 status is available for two patients with a CD3⁺CD4⁺CD7⁻ phenotype. CD26 was later established and was available for one Frankfurt patient with a CD3⁺CD4⁺CD7⁺CD26⁻ phenotype. The patient from Municipal Hospital Karlsruhe had a CD3⁺CD4⁺CD7⁻CD26⁻ phenotype with both markers documented.
Peripheral blood mononuclear cells (PBMCs) from Sézary syndrome patients and healthy donors were isolated by Ficoll density-gradient centrifugation. CD4⁺ T cells were purified using the MACS CD4⁺ T Cell Isolation Kit based on negative selection (Miltenyi Biotec, Bergisch Gladbach, Germany) according to the manufacturer's instructions. For the functional assays, the malignant population was further enriched by magnetic depletion of the aberrantly absent marker, using CD7 MicroBeads to deplete CD7-expressing cells in the CD7⁻ cases and CD26 MicroBeads to deplete CD26-expressing cells in the CD7⁺CD26⁻ case (Miltenyi Biotec). Aliquots of CD4⁺-enriched PBMCs and of the negatively selected fractions were analyzed by research flow cytometry including CD7 and CD26 to define and confirm the aberrant Sézary cell phenotype. Isolated cells were activated with TransAct (1:100, Miltenyi Biotec) for 48 h and cultured in RPMI 1640 supplemented with 10% heat-inactivated FBS, 2 mM glutamine, penicillin (100 U/mL), and streptomycin (100 µg/mL). The medium was further supplemented with IL-2 (10 ng/mL), IL-7 (5 ng/mL), IL-13 (10 ng/mL), and IL-15 (10 ng/mL), with all cytokines obtained from Miltenyi Biotec. Cells were maintained at 37 °C in a humidified incubator with 5% CO₂.
2.3. Kinase Inhibitor Library Screen
The MCE Kinase Inhibitor Library (HY-L009, MedChemExpress, Monmouth Junction, NJ, USA) comprising approximately 2,200 compounds was screened in a stepwise pipeline in the CTCL cell lines HuT78 and MyLa to identify compounds with antiproliferative activity while limiting unspecific cytotoxicity. Cells were seeded into 96-well plates and treated with individual compounds at 1 µM and 10 µM. After 48 h of exposure, cell viability was quantified using an MTS assay and cytotoxicty was assessed in parallel by an LDH release assay. Values for both readouts were normalized to vehicle controls (DMSO) and expressed as percent of control. In the primary screen, each compound was tested once at each concentration. Candidate hits were defined using predefined selection criteria: compounds were taken forward when they showed strong growth inhibition in the MTS assay (viability below 30% of control) while remaining below the toxicity threshold in the LDH assay (LDH signal below 120% of control), and when at least phase 1 clinical development had been reported. From the primary screen, 17 top candidates were identified based on the predefined criteria, of which 11 were confirmed as validated hits upon retesting in three independent experiments. From this set, adavosertib was selected for in-depth functional characterization and is the focus of the present study. Scatter plots were generated using Python (version 3.12) with the matplotlib (version 3.10) and pandas (version 3.0) libraries. Code was developed with the assistance of the AI language model Claude (Anthropic PBC, San Francisco, CA, USA).
2.4. Cell Viability (MTS Assay)
Cell viability was measured using the CellTiter 96® AQueous One Solution Cell Proliferation Kit (Promega, Madison, WI, USA). For this assay, 2 × 10⁴ cells per well were seeded in 96-well plates and incubated overnight. Cells were then treated for 48 hours with either DMSO vehicle or varying concentrations of adavosertib. Following treatment, MTS [3-(4,5-dimethylthiazol-2-yl)-5-(3-carboxymethoxyphenyl)-2-(4-sulfophenyl)-2H-tetrazolium] reagent was added and plates were incubated at 37 °C for 1–5 h. Absorbance at 490 nm was recorded using an Asys Expert 96 microplate reader (Deelux Labortechnik GmbH, Gödenstorf, Germany). IC₅₀ values were interpolated from the resulting dose–response curves using GraphPad Prism (Version 10.5.0).
2.5. Annexin V/7-AAD Apoptosis Assay
CTCL cells were seeded in 12-well plates and treated with either vehicle control or 2.5 µM adavosertib for 48 hours. HuT and MyLa cells were seeded at 2.5 × 10⁵ cells per well, whereas SeAx and HH cells were seeded at 5 × 10⁵ cells per well. After treatment, cells were harvested, resuspended in Annexin V binding buffer, and stained with Annexin V–FITC and 7-AAD (Miltenyi Biotec, Bergisch Gladbach, Germany) for 20 min at room temperature protected from light. Following addition of binding buffer, samples were analyzed by flow cytometry.
2.6. Cell-Cycle Analysis
CTCL cells were seeded in 12-well plates and treated with either vehicle control or 2.5 µM adavosertib for 24 hours. HuT and MyLa cells were seeded at 2.5 × 10⁵ cells per well, whereas SeAx and HH cells were seeded at 5 × 10⁵ cells per well. Following treatment, cells were harvested, resuspended in PBS, and fixed with ice-cold 70% ethanol for 60 minutes at 4 °C. After washing with PBS, cells were stained with 50 µg/mL propidium iodide (Sigma, St. Louis, MO, USA) and 5 µg/mL RNase for 30 minutes at 37 °C. The stained cells were then analyzed by flow cytometry using a fluorescence-activated cell sorter (FACS).
2.7. Caspase-3/7 Activity
Caspase-3/7 activity was quantified using the Caspase-Glo® 3/7 assay (Promega, Madison, WI, USA) according to the manufacturer’s instructions. HuT and MyLa cells were seeded at 1 × 10⁴ cells per well, and SeAx and HH cells at 2 × 10⁴ cells per well in white-bottom 96-well plates and incubated for 24 h at 37 °C under humidified conditions. Cells were then treated with 2.5 µM adavosertib for 24 hours, followed by addition of the luminogenic substrate. Luminescence was measured using a plate-reading luminometer and normalized to DMSO-treated controls.
2.8. Western Blotting
Whole-cell lysates from CTCL cells were prepared using RIPA buffer (Sigma-Aldrich, St. Louis, MO, USA) supplemented with protease and phosphatase inhibitors. Protein samples (25 µg) were mixed with SDS sample buffer, separated by sodium dodecyl sulfate-polyacrylamide gel electrophoresis (SDS-PAGE), and transferred onto nitrocellulose membranes. Membranes were blocked with 5% non-fat dry milk for 1 hour at room temperature, then incubated with primary antibodies overnight at 4 °C, followed by incubation with secondary antibodies for 1 hour at room temperature. Proteins were visualized using enhanced chemiluminescence detection systems (Thermo Fisher Scientific, Waltham, MA, USA or Cyanagen, Bologna, Italy) according to the manufacturer's instructions. GAPDH was used as loading control.
2.9. Phospho-Protein Antibody Array
The Cell Signaling Phospho Antibody Array (Full Moon Biosystems, Sunnyvale, CA, USA) is a comprehensive platform comprising 304 highly specific antibodies. MyLa cells were seeded at 2.5 × 10⁶ cells per well (6-well plate) and treated with vehicle or adavosertib (2.5 µM) for 24 h at 37 °C. The assay was performed according to the manufacturer's instructions. For protein detection, IRDye® 800CW Streptavidin (926-32230; 1 mg/mL; LI-COR Biosciences) was applied. Slides were then scanned using a LI-COR imaging system (LI-COR Odyssey DLX) and analyzed with Image Studio Software (Version 5.2.5). All signals were normalized to β-actin.
2.10. In Vivo Xenograft Model
Animal studies were performed in accordance with the German Animal Welfare Act and approved by local authorities (Landesamt für Gesundheit und Soziales, LaGeSo, Berlin, Germany) under permit number E0023/23. Female 6- to 8-week-old NOG-F mice (Taconic, Leverkusen, Germany) were injected subcutaneously with 3 × 10⁵ MyLa cells. Two experimental groups were established (n = 9 mice per group) and treatment was initiated on day 1 after tumor cell inoculation. Compounds were administered orally once daily on a 5-days-on/2-days-off schedule. Control mice received oral vehicle (5% DMSO in 30% w/v hydroxypropyl-β-cyclodextrin aqueous solution) and the treatment group received 30 mg/kg adavosertib. Tumor volume was measured by caliper three times per week and calculated using the formula V = (length × width²) / 2. Body weight was monitored in parallel with the frequency increased to daily measurements during periods of rapid tumor growth. Mice were euthanized when tumor volume reached 1.5 cm³ or upon occurrence of critical health conditions.
2.11. Statistical Analyses
Statistical analyses were performed using GraphPad Prism 10 software (GraphPad Software, San Diego, CA, USA). For comparisons between two groups in vitro, including apoptosis, caspase-3/7 activity, cell-cycle distribution, and AUC values from patient-derived cells, two-tailed unpaired t-tests were applied. For comparisons of cell viability across multiple compound concentrations, ordinary one-way ANOVA with Dunnett's multiple comparisons test was used. For the in vivo xenograft experiment, tumor volume at the experimental endpoint and AUC values were compared using one-tailed unpaired t-tests with Welch's correction. This was based on the a priori hypothesis of reduced tumor growth under adavosertib treatment, established from the in vitro data. Tumor growth over time was analyzed by two-way repeated-measures ANOVA. Data are shown as mean ± SD, and statistical significance was defined as p < 0.05.
3. Results
3.1. Kinase Inhibitor Screen Identifies Adavosertib as a Top Candidate in CTCL
To identify clinically relevant kinase inhibitors with antiproliferative activity in CTCL, we screened the MCE Kinase Inhibitor Library HY L009 comprising approximately 2,200 compounds in a stepwise pipeline using combined MTS and LDH readouts at 1 µM and 10 µM in HuT78 and MyLa cells. Compounds were taken forward when they showed strong inhibition in the MTS assay below 30% viability while remaining below the LDH toxicity threshold of 120% and when at least phase 1 clinical development had been reported. From the primary screen, 17 top candidates were identified, of which 11 were confirmed as validated hits upon retesting in three idependent experiments. From this set, adavosertib was selected as a top candidate for further functional characterization (Figure 1). The complete primary screening dataset is provided in Supplementary Data S1.
3.2. Adavosertib Reduces CTCL Cell Viability While Sparing Non-Malignant Skin Cells
We next assessed the effect of adavosertib on CTCL viability by MTS assays after 48 h treatment with increasing concentrations. Adavosertib significantly decreased viability in all four established CTCL cell lines (HuT78, MyLa, SeAx, and HH) in a dose dependent manner (Figure 2A). Nonlinear regression revealed submicromolar IC50 values across the panel, with HuT78 0.52 µM, MyLa 0.54 µM, SeAx 0.26 µM, and HH 0.56 µM, indicating broadly comparable sensitivity with slightly higher potency in SeAx (Figure 2A). In contrast, the viability of primary human fibroblasts and primary human keratinocytes was not affected across the same concentration range, suggesting that adavosertib has tumor cell–specific activity (Figure 2B).
3.3. Adavosertib Shows Higher Activity in Patient-Derived Malignant Cells than in Healthy CD4⁺ T Cells
To assess the translational relevance of our findings, patient-derived malignant CD4⁺ T cells (enriched for the aberrant CD7⁻ or CD26⁻ fraction, n = 4) and peripheral blood CD4⁺ T cells from healthy volunteers (n = 4) were treated with increasing concentrations of adavosertib for 48 h. Cell viability was quantified by MTS assay and normalized to DMSO controls. Adavosertib reduced viability of malignant cells in a concentration-dependent manner, with noticeable inter-donor variability (Figure 3A). In contrast, viability of healthy donor CD4⁺ T cells were less affected across the tested concentration range (Figure 3A, B). To compare overall drug sensitivity between groups, we calculated the area under the curve (AUC) for each individual dose–response profile. Malignant samples showed lower AUC values than healthy controls, and the mean AUC was significantly reduced in the malignant group (Figure 3C,D). Clinical characteristics of the patient cohort are provided in supplementary Table S1.
3.4. Adavosertib Triggers Apoptosis and Alters Cell-Cycle Progression in CTCL Cells
Based on the significant reduction in cell viability, we next analyzed apoptotic cell death by Annexin V/7-AAD staining. A significant increase in Annexin V-positive cells was observed in HuT78, MyLa, SeAx, and HH after 48 h of treatment with 2.5 µM adavosertib, indicating apoptosis induction (Figure 4A). To further confirm apoptosis, caspase-3/7 activity was measured. Adavosertib significantly increased caspase-3/7 activity in all four CTCL cell lines after 24 h (Figure 4B). Given the known role of WEE1 inhibition in cell-cycle control, we assessed whether adavosertib affects cell-cycle distribution. Flow-cytometric analysis of PI-stained CTCL cells was performed after 24 h of 2.5 µM adavosertib. Adavosertib induced clear cell-line-specific shifts in cell-cycle profiles (Figure 5). In HuT78 and MyLa cells, treatment led to a pronounced accumulation of cells in S phase compared with vehicle-treated controls. In SeAx cells, adavosertib increased the proportion of cells in G2/M. HH cells showed a mixed pattern with enrichment in S phase together with a relative increase in G2/M (Figure 5).
Western blot analyses were performed to investigate molecular changes associated with adavosertib treatment in HuT78 and MyLa cells across three time points (6h, 24h, 48h). Adavosertib reduced WEE1 protein levels in a time-dependent manner in both cell lines. PARP cleavage was detected, indicating induction of apoptosis. Phosphorylation of CDK1 at Tyr15 decreased under adavosertib treatment, most prominently at 24h and 48h, while total CDK1 levels remained largely unchanged. Furthermore, phosphorylation of H2A.X (Ser139) and total H2A.X levels were increased under adavosertib, consistent with DNA damage response activation (Figure 4C). Densitometric quantification of all three independent experiments is provided in Supplementary Table S2, and the original uncropped blots are shown in Supplementary File S1.
To obtain exploratory insights into signalling changes associated with adavosertib, we performed a phospho-protein antibody array in MyLa cells after 24 h exposure to 2.5 µM adavosertib (Supplementary Figure S1). Adavosertib increased phosphorylation of checkpoint kinase 2 (Chk2 Thr68), CREB (Ser133), AKT1 (Thr308), and β-catenin (Thr41/Ser45), accompanied by higher signals for proteins linked to cell-cycle control such as CDC25C and Rb (Ser807). In parallel, phosphorylation of several proteins was reduced, including PKCθ (Thr538), p90RSK (Thr359/Ser363), SHP-2 (Tyr542), and FAK (Ser910), together with changes in T-cell signalling-associated kinases such as LYN (Tyr507). Overall, the phospho-proteomic profile is consistent with activation of checkpoint and stress responses alongside attenuation of selected pro-survival signalling pathways in CTCL cells.
3.5. Adavosertib Limits CTCL Tumour Growth in a Xenograft Model
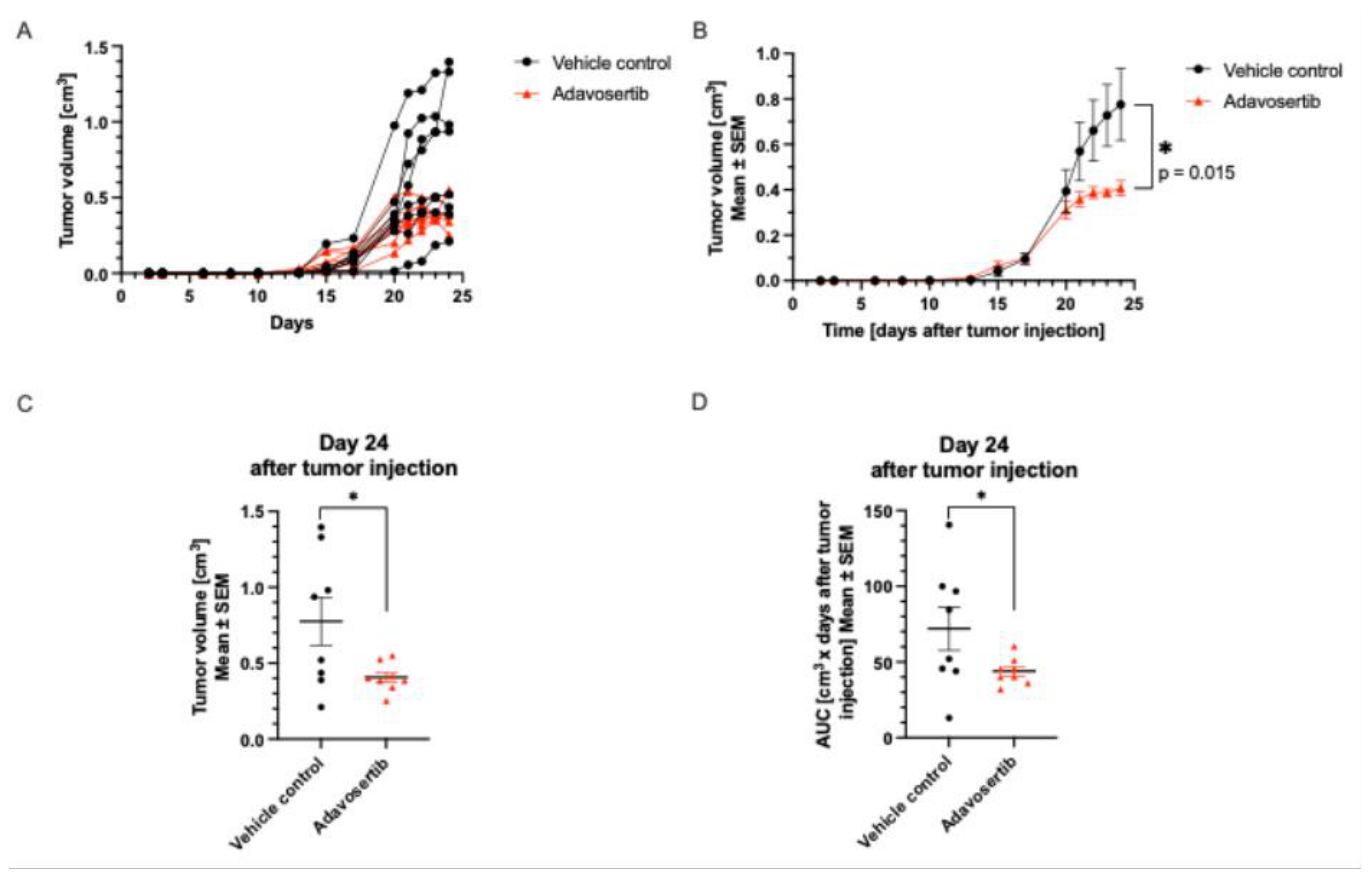
Finally, we evaluated adavosertib in vivo using a MyLa xenograft model. Adavosertib-treated mice showed significant slower tumour growth compared with vehicle controls (Figure 6A, B). At day 24 after tumour injection, tumour volumes were significantly reduced in the adavosertib group (Figure 6C), and analysis of tumour growth curves by AUC confirmed a significant treatment effect (Figure 6D). These data support in vivo antitumour activity of adavosertib in CTCL.
4. Discussion
Our study identifies the WEE1 inhibitor adavosertib as a highly active compound in CTCL models. In a stepwise screen of more than 2,000 compounds, adavosertib was selected from the set of validated hits for deeper characterisation and consistently reduced viability across multiple established CTCL cell lines at submicromolar concentrations. In contrast, primary human keratinocytes and fibroblasts showed little to no loss of viability across the same concentration range, suggesting a degree of selectivity for malignant cells in vitro. Similar effects were observed in primary samples, where patient-derived malignant T cells were more strongly affected than CD4⁺ T cells from healthy donors.
Adavosertib treatment resulted in pronounced apoptotic responses and cell-cycle alterations in CTCL cells. Annexin V/7-AAD analysis revealed an increased proportion of apoptotic cells across all CTCL cell lines, which was accompanied by enhanced caspase-3/7 activity. Consistent with these findings, PARP cleavage was detected by immunoblotting, supporting activation of caspase-dependent apoptosis.
In addition, adavosertib induced marked, cell-line-specific changes in cell-cycle distribution. HuT78 and MyLa cells accumulated predominantly in S phase after 24 h of treatment, indicating impaired progression through DNA replication. In contrast, SeAx cells showed an increased fraction in G2/M, whereas HH cells displayed a mixed phenotype with enrichment in both S phase and G2/M. Together, these patterns are consistent with the established role of WEE1 in regulating S-phase progression and the G2/M checkpoint, and support a model in which WEE1 inhibition promotes replication stress, DNA damage, and subsequent apoptotic cell death in susceptible CTCL cells.[11,12,13,16].
Mechanistically, western blot analyses provided clear support that adavosertib acts through WEE1 inhibition in CTCL cells. In HuT78 and MyLa cells, WEE1 protein levels decreased after treatment and inhibitory phosphorylation of CDK1 at Tyr15 was reduced, while total CDK1 remained largely unchanged. At the same time, phosphorylation of H2A.X and total H2A.X levels were increased under adavosertib, consistent with replication-associated stress and DNA damage. Overall, these results indicate that adavosertib impairs checkpoint control and contributes to the cell-cycle disturbances and apoptotic responses observed in our models [11,12,13]. The phospho-protein array data also support this model. After adavosertib treatment, phosphorylation of proteins related to checkpoint and stress signalling, including Chk2, CREB, CDC25C, and Rb, was increased, whereas phosphorylation of several proteins associated with proliferation and survival, such as PKCθ, p90RSK, SHP-2, FAK, and LYN, was reduced. This pattern suggests that the effects of adavosertib are not limited to the WEE1–CDK1 axis but involve broader signalling changes. Similar pathway-level effects after WEE1 inhibition have also been described in mature T-cell lymphoma models [13,15].
Our findings are in line with recent work in related mature T-cell malignancies. Schmidt et al. identified WEE1 inhibition as an effective strategy in T-cell leukemias and lymphomas and also reported selective activity in malignant cells [15]. Although CTCL is a distinct disease entity, these findings indicate that dependence on WEE1-mediated checkpoint control may represent a target in different T-cell neoplasms.
The variability we observed in primary patient samples likely reflects the molecular heterogeneity of CTCL and underscores the need for predictive biomarkers to define which patients are most likely to benefit from WEE1 inhibition [4,10,17]. TP53 status and defects in S-phase are potential determinants to explain differences in sensitivity [18,19]. From a translational point of view, adavosertib is of interest because it has already been evaluated in early-phase clinical trials in solid tumours, which provides some basis for dose finding and safety assessment in future studies[14,20,21]. Combination approaches may also be worth exploring. HDAC inhibitors are approved in CTCL and WEE1 inhibition has shown activity in combination with belinostat in myeloid malignancies such as AML and MDS[22].
Some limitations of this study should be considered. The phospho-protein array analysis was exploratory and the functional relevance of individual signaling changes remains to be clarified. In addition, although our results were consistent across several cell lines and supported by primary samples and xenograft data, CTCL is a biologically heterogeneous disease and larger patient cohorts will be needed to define which molecular subgroups are most likely to benefit from WEE1 inhibition. The xenograft model also does not fully reflect the complexity of the human tumor microenvironment. Future studies should therefore validate candidate biomarkers in additional models and patient material and further explore rational combination strategies for adavosertib in CTCL.
5. Conclusions
Our data support WEE1 inhibition as a promising strategy in CTCL. Adavosertib showed consistent antiproliferative activity in CTCL cell lines, preferential activity in patient-derived malignant cells compared with healthy CD4+ T cells and mechanistic changes consistent with replication stress, checkpoint disruption, and apoptosis. In vivo, adavosertib significantly delayed MyLa xenograft growth. Together with recent translational work in mature T-cell lymphomas, these findings provide a rationale for further preclinical and clinical evaluation of WEE1-targeted approaches in CTCL.
Supplementary Materials
The following supporting information can be downloaded at: Preprints.org, Data S1: Complete primary screening dataset of the MCE Kinase Inhibitor Library in the CTCL cell lines HuT78 and MyLa. Table S1: Clinical and immunophenotypic characteristics of the Sézary syndrome patients included in the ex vivo assays. Table S2: Densitometric quantification of the Western blots shown in Figure 4C. File S1: Original uncropped Western blot images for Figure 4C. Figure S1: Phospho-protein antibody array of adavosertib-treated CTCL cells.
Author Contributions
Conceptualization, D.Ö., S.K. and J.C.; methodology, D.Ö. and S.K.; software, D.Ö. and K.B.; validation, D.Ö., K.B., M.D. and G.R.; formal analysis, D.Ö., K.B. and M.D.; investigation, D.Ö., R.W., M.D., K.B., G.R., M.J., N.Z. and L.W.; resources, R.W., H.S., N.Z., J.P.N., S.M.P and M.J.; data curation, D.Ö., M.D., K.B. and L.W.; writing—original draft preparation, D.Ö., S.K. and J.C.; writing—review and editing, R.K., H.S., B.S., S.R.Q., M.M., J.K., J.C. and S.K.; visualization, D.Ö.; supervision, S.K. and J.C.; project administration, D.Ö.; funding acquisition, D.Ö. All authors have read and agreed to the published version of the manuscript.
Funding
This work was funded by grants from the Dr. Rolf M. Schwiete Stiftung. The funders had no role in the design of the study; in the collection, analyses, or interpretation of data; in the writing of the manuscript; or in the decision to publish the results.
Institutional Review Board Statement
The study was conducted in accordance with the Declaration of Helsinki and approved by the Ethics Committee of the Faculty of Medicine, Goethe University Frankfurt (approval numbers 19-418 for CTCL patient samples and 329/10 for healthy donor samples; approved on 8 September 2021), with the Medical Faculty Mannheim, Heidelberg University, approving on the basis of the Frankfurt vote. The animal study protocol was approved by the Landesamt für Gesundheit und Soziales (LaGeSo), Berlin, Germany (permit E0023/23) and performed in accordance with the German Animal Welfare Act.
Informed Consent Statement
Informed consent was obtained from all subjects involved in the study.
Data Availability Statement
The raw data supporting the conclusions of this article will be made available by the authors on request.
Acknowledgments
During the preparation of this study, the authors used Claude (Anthropic PBC, San Francisco, CA, USA) for the purposes of generating Python code for the visualization of the primary screening data (Figure 1). The authors have reviewed and edited the output and take full responsibility for the content of this publication.
Conflicts of Interest
The authors declare no conflicts of interest. The funders had no role in the design of the study; in the collection, analyses, or interpretation of data; in the writing of the manuscript; or in the decision to publish the results.:
Abbreviations.
The following abbreviations are used in this manuscript:
| 7-AAD | 7-aminoactinomycin D |
| ANOVA | Analysis of variance |
| AUC | area under the curve |
| CDK1 | cyclin-dependent kinase 1 |
| CTCL | cutaneous T-cell lymphoma |
| DMSO | dimethyl sulfoxide |
| DNA | deoxyribonucleic acid |
| EORTC | European Organisation for Research and Treatment of Cancer |
| FBS | fetal bovine serum |
| FCS | fetal calf serum |
| HDAC | histone deacetylase |
| IC50 | half-maximal inhibitory concentration |
| ISCL | International Society for Cutaneous Lymphomas |
| LDH | lactate dehydrogenase |
| MF | mycosis fungoides |
| MTS | 3-(4,5-dimethylthiazol-2-yl)-5-(3-carboxymethoxyphenyl)-2-(4-sulfophenyl)-2H-tetrazolium |
| PBMC | peripheral blood mononuclear cell |
| PI | propidium iodide |
| SD | standard deviation |
| SDS-PAGE | sodium dodecyl sulfate-polyacrylamide gel electrophoresis |
| SS | Sézary syndrome |
| TCR | T-cell receptor |
References
- Dummer, R.; Vermeer, M.H.; Scarisbrick, J.J.; Kim, Y.H.; Stonesifer, C.; Tensen, C.P.; Geskin, L.J.; Quaglino, P.; Ramelyte, E. Cutaneous T cell lymphoma. Nat. Rev. Dis. Prim. 2021, 7, 61. [Google Scholar] [CrossRef] [PubMed]
- Willemze, R.; Cerroni, L.; Kempf, W.; Berti, E.; Facchetti, F.; Swerdlow, S.H.; Jaffe, E.S. The 2018 update of the WHO-EORTC classification for primary cutaneous lymphomas. Blood 2019, 133, 1703–1714. [Google Scholar] [CrossRef] [PubMed]
- Hristov, A.C.; Tejasvi, T.; Wilcox, R.A. Cutaneous T-cell lymphomas: 2023 update on diagnosis, risk-stratification, and management. Am. J. Hematol. 2023, 98, 193–209. [Google Scholar] [CrossRef] [PubMed]
- Scarisbrick, J.J.; Prince, H.M.; Vermeer, M.H.; Quaglino, P.; Horwitz, S.; Porcu, P.; Stadler, R.; Wood, G.S.; Beylot-Barry, M.; Pham-Ledard, A.; et al. Cutaneous Lymphoma International Consortium Study of Outcome in Advanced Stages of Mycosis Fungoides and Sézary Syndrome: Effect of Specific Prognostic Markers on Survival and Development of a Prognostic Model. J. Clin. Oncol. 2015, 33, 3766–3773. [Google Scholar] [CrossRef] [PubMed]
- Bagot, M. Therapeutic advances for cutaneous T-cell lymphoma. Br. J. Dermatol. 2025, 193, 11–15. [Google Scholar] [CrossRef] [PubMed]
- Bakr, F.S.; Whittaker, S.J. Advances in the understanding and treatment of Cutaneous T-cell Lymphoma. Front Oncol. 2022, 12, 1043254. [Google Scholar] [CrossRef] [PubMed]
- de Masson, A.; Beylot-Barry, M.; Ram-Wolff, C.; Mear, J.B.; Dalle, S.; d'Incan, M.; Ingen-Housz-Oro, S.; Orvain, C.; Abraham, J.; Dereure, O.; et al. Allogeneic transplantation in advanced cutaneous T-cell lymphomas (CUTALLO): a propensity score matched controlled prospective study. Lancet 2023, 401, 1941–1950. [Google Scholar] [CrossRef] [PubMed]
- Latzka, J.; Assaf, C.; Bagot, M.; Cozzio, A.; Dummer, R.; Guenova, E.; Gniadecki, R.; Hodak, E.; Jonak, C.; Klemke, C.D.; et al. EORTC consensus recommendations for the treatment of mycosis fungoides/Sézary syndrome - Update 2023. Eur. J. Cancer 2023, 195, 113343. [Google Scholar] [CrossRef] [PubMed]
- Kashyap, A.; Dai, J.; Ni, X. Therapeutic Targeting of the Janus Kinase/Signal Transducer and Activator of Transcription Pathway in Cutaneous T-Cell Lymphoma. Cancers 2025, 17. [Google Scholar] [CrossRef] [PubMed]
- Tensen, C.P.; Quint, K.D.; Vermeer, M.H. Genetic and epigenetic insights into cutaneous T-cell lymphoma. Blood 2022, 139, 15–33. [Google Scholar] [CrossRef] [PubMed]
- Bukhari, A.B.; Chan, G.K.; Gamper, A.M. Targeting the DNA Damage Response for Cancer Therapy by Inhibiting the Kinase Wee1. Front Oncol. 2022, 12, 828684. [Google Scholar] [CrossRef] [PubMed]
- Geenen, J.J.J.; Schellens, J.H.M. Molecular Pathways: Targeting the Protein Kinase Wee1 in Cancer. Clin. Cancer Res. 2017, 23, 4540–4544. [Google Scholar] [CrossRef] [PubMed]
- Zhang, C.; Peng, K.; Liu, Q.; Huang, Q.; Liu, T. Adavosertib and beyond: Biomarkers, drug combination and toxicity of WEE1 inhibitors. Crit. Rev. Oncol. Hematol. 2024, 193, 104233. [Google Scholar] [CrossRef] [PubMed]
- Takebe, N.; Naqash, A.R.; O'Sullivan Coyne, G.; Kummar, S.; Do, K.; Bruns, A.; Juwara, L.; Zlott, J.; Rubinstein, L.; Piekarz, R.; et al. Safety, Antitumor Activity, and Biomarker Analysis in a Phase I Trial of the Once-daily Wee1 Inhibitor Adavosertib (AZD1775) in Patients with Advanced Solid Tumors. Clin. Cancer Res. 2021, 27, 3834–3844. [Google Scholar] [CrossRef] [PubMed]
- Schmidt, N.; Kornrumpf, K.; Ries, L.; Markus, K.; Ksionsko, N.A.M.; Mazzeo, P.; Lohrberg, M.; Sitte, M.; Salinas, G.; Braun, T.; et al. Discovery of molecularly-informed therapeutic strategies for mature T-cell leukemias and lymphomas. Blood Adv. 2025, 9, 5327–5340. [Google Scholar] [CrossRef] [PubMed]
- Ghelli Luserna di Rorà, A.; Cerchione, C.; Martinelli, G.; Simonetti, G. A WEE1 family business: regulation of mitosis, cancer progression, and therapeutic target. J. Hematol. Oncol. 2020, 13, 126. [Google Scholar] [CrossRef] [PubMed]
- Park, J.; Daniels, J.; Wartewig, T.; Ringbloom, K.G.; Martinez-Escala, M.E.; Choi, S.; Thomas, J.J.; Doukas, P.G.; Yang, J.; Snowden, C.; et al. Integrated genomic analyses of cutaneous T-cell lymphomas reveal the molecular bases for disease heterogeneity. Blood 2021, 138, 1225–1236. [Google Scholar] [CrossRef] [PubMed]
- Heijink, A.M.; Blomen, V.A.; Bisteau, X.; Degener, F.; Matsushita, F.Y.; Kaldis, P.; Foijer, F.; van Vugt, M.A. A haploid genetic screen identifies the G1/S regulatory machinery as a determinant of Wee1 inhibitor sensitivity. Proc. Natl. Acad. Sci. U S A 2015, 112, 15160–15165. [Google Scholar] [CrossRef] [PubMed]
- Wang, Z.; Li, W.; Li, F.; Xiao, R. An update of predictive biomarkers related to WEE1 inhibition in cancer therapy. J. Cancer Res. Clin. Oncol. 2024, 150, 13. [Google Scholar] [CrossRef] [PubMed]
- Falchook, G.S.; Sachdev, J.; Imedio, E.R.; Kumar, S.; Mugundu, G.M.; Jenkins, S.; Chmielecki, J.; Jones, S.; Spigel, D.R.; Johnson, M. A phase Ib study of adavosertib, a selective Wee1 inhibitor, in patients with locally advanced or metastatic solid tumors. Invest New Drugs 2023, 41, 493–502. [Google Scholar] [CrossRef] [PubMed]
- Lheureux, S.; Cristea, M.C.; Bruce, J.P.; Garg, S.; Cabanero, M.; Mantia-Smaldone, G.; Olawaiye, A.B.; Ellard, S.L.; Weberpals, J.I.; Wahner Hendrickson, A.E.; et al. Adavosertib plus gemcitabine for platinum-resistant or platinum-refractory recurrent ovarian cancer: a double-blind, randomised, placebo-controlled, phase 2 trial. Lancet 2021, 397, 281–292. [Google Scholar] [CrossRef] [PubMed]
- Shafer, D.; Kagan, A.B.; Rudek, M.A.; Kmieciak, M.; Tombes, M.B.; Shrader, E.; Bandyopadhyay, D.; Hudson, D.; Sankala, H.; Weir, C.; et al. Phase 1 study of belinostat and adavosertib in patients with relapsed or refractory myeloid malignancies. Cancer Chemother. Pharmacol. 2023, 91, 281–290. [Google Scholar] [CrossRef] [PubMed]
Figure 1.
Primary kinase inhibitor screen identifies adavosertib as a top candidate in CTCL. Scatter plots showing cell viability (MTS assay, y-axis) versus cell toxicity (LDH release assay, x-axis) for approximately 2,200 compounds from the MCE Kinase Inhibitor Library (HY-L009) tested at 10 µM (top) and 1 µM (bottom) in HuT78 (left) and MyLa (right) CTCL cell lines. Each dot represents one compound, colour-coded by clinical development stage. Black dots indicate the 17 top candidates fulfilling predefined hit criteria (viability < 30% and LDH < 120% of control, clinical development ≥ Phase 1) and red-ringed black dots indicate the 11 validated hits confirmed in three independent experiments. Dashed lines mark the viability and toxicity thresholds and the green-shaded quadrant defines the hit zone. Selected compounds are labelled and adavosertib was selected as the top candidate for further characterisation. Hit counts and the number with reported clinical development are shown in the upper right corner of each panel.
Figure 1.
Primary kinase inhibitor screen identifies adavosertib as a top candidate in CTCL. Scatter plots showing cell viability (MTS assay, y-axis) versus cell toxicity (LDH release assay, x-axis) for approximately 2,200 compounds from the MCE Kinase Inhibitor Library (HY-L009) tested at 10 µM (top) and 1 µM (bottom) in HuT78 (left) and MyLa (right) CTCL cell lines. Each dot represents one compound, colour-coded by clinical development stage. Black dots indicate the 17 top candidates fulfilling predefined hit criteria (viability < 30% and LDH < 120% of control, clinical development ≥ Phase 1) and red-ringed black dots indicate the 11 validated hits confirmed in three independent experiments. Dashed lines mark the viability and toxicity thresholds and the green-shaded quadrant defines the hit zone. Selected compounds are labelled and adavosertib was selected as the top candidate for further characterisation. Hit counts and the number with reported clinical development are shown in the upper right corner of each panel.
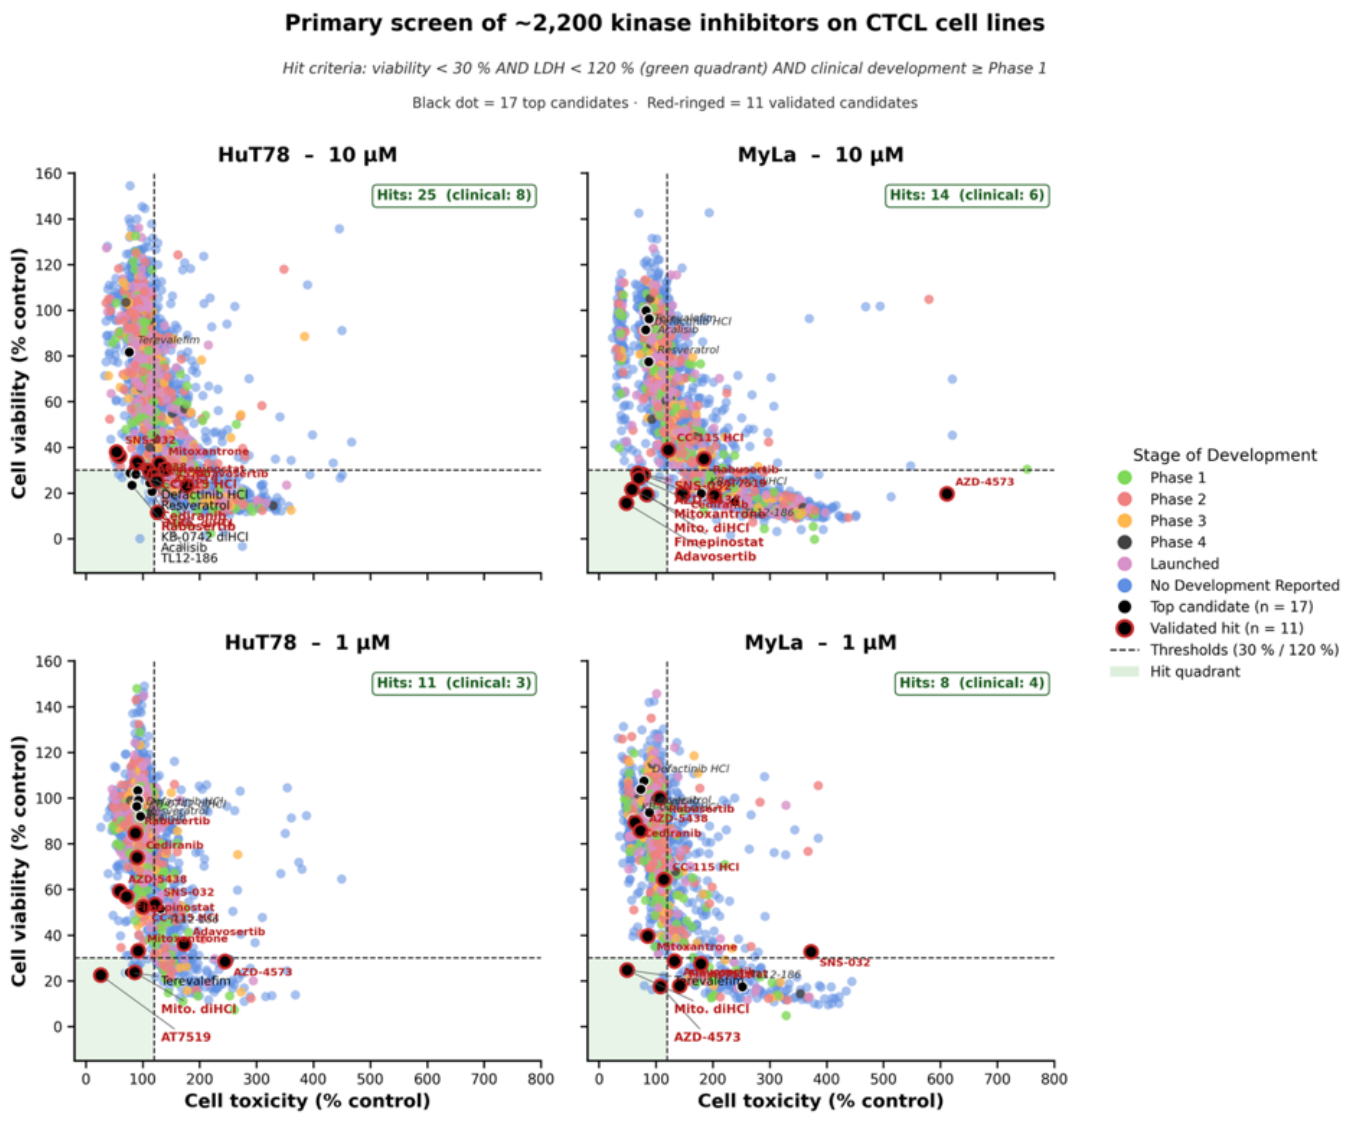
Figure 2.
Adavosertib reduces cell viability in CTCL cells while sparing noncancerous skin cells. (a) MTS assays were performed to determine the antiproliferative effect of adavosertib compared with vehicle control in CTCL cells. Cells were treated with increasing adavosertib concentrations for 48 h. Cell viability was normalized to cells treated with DMSO (untreated control). Mean values of at least n = 3 independent experiments with SD are shown. The dose–response curve was used to derive the IC₅₀ (half-maximal inhibitory concentration). (b) The antiproliferative effect of adavosertib compared with vehicle control in primary human keratinocytes and fibroblasts was assessed by MTS assays. Cells were treated for 48 h with increasing compound concentrations. Cell viability was normalized to cells treated with DMSO (untreated control). Data are shown as mean ± SD of at least n = 3 independent experiments. *p < 0.05, **p < 0.001, ***p < 0.0001, ****p < 0.0001.
Figure 2.
Adavosertib reduces cell viability in CTCL cells while sparing noncancerous skin cells. (a) MTS assays were performed to determine the antiproliferative effect of adavosertib compared with vehicle control in CTCL cells. Cells were treated with increasing adavosertib concentrations for 48 h. Cell viability was normalized to cells treated with DMSO (untreated control). Mean values of at least n = 3 independent experiments with SD are shown. The dose–response curve was used to derive the IC₅₀ (half-maximal inhibitory concentration). (b) The antiproliferative effect of adavosertib compared with vehicle control in primary human keratinocytes and fibroblasts was assessed by MTS assays. Cells were treated for 48 h with increasing compound concentrations. Cell viability was normalized to cells treated with DMSO (untreated control). Data are shown as mean ± SD of at least n = 3 independent experiments. *p < 0.05, **p < 0.001, ***p < 0.0001, ****p < 0.0001.
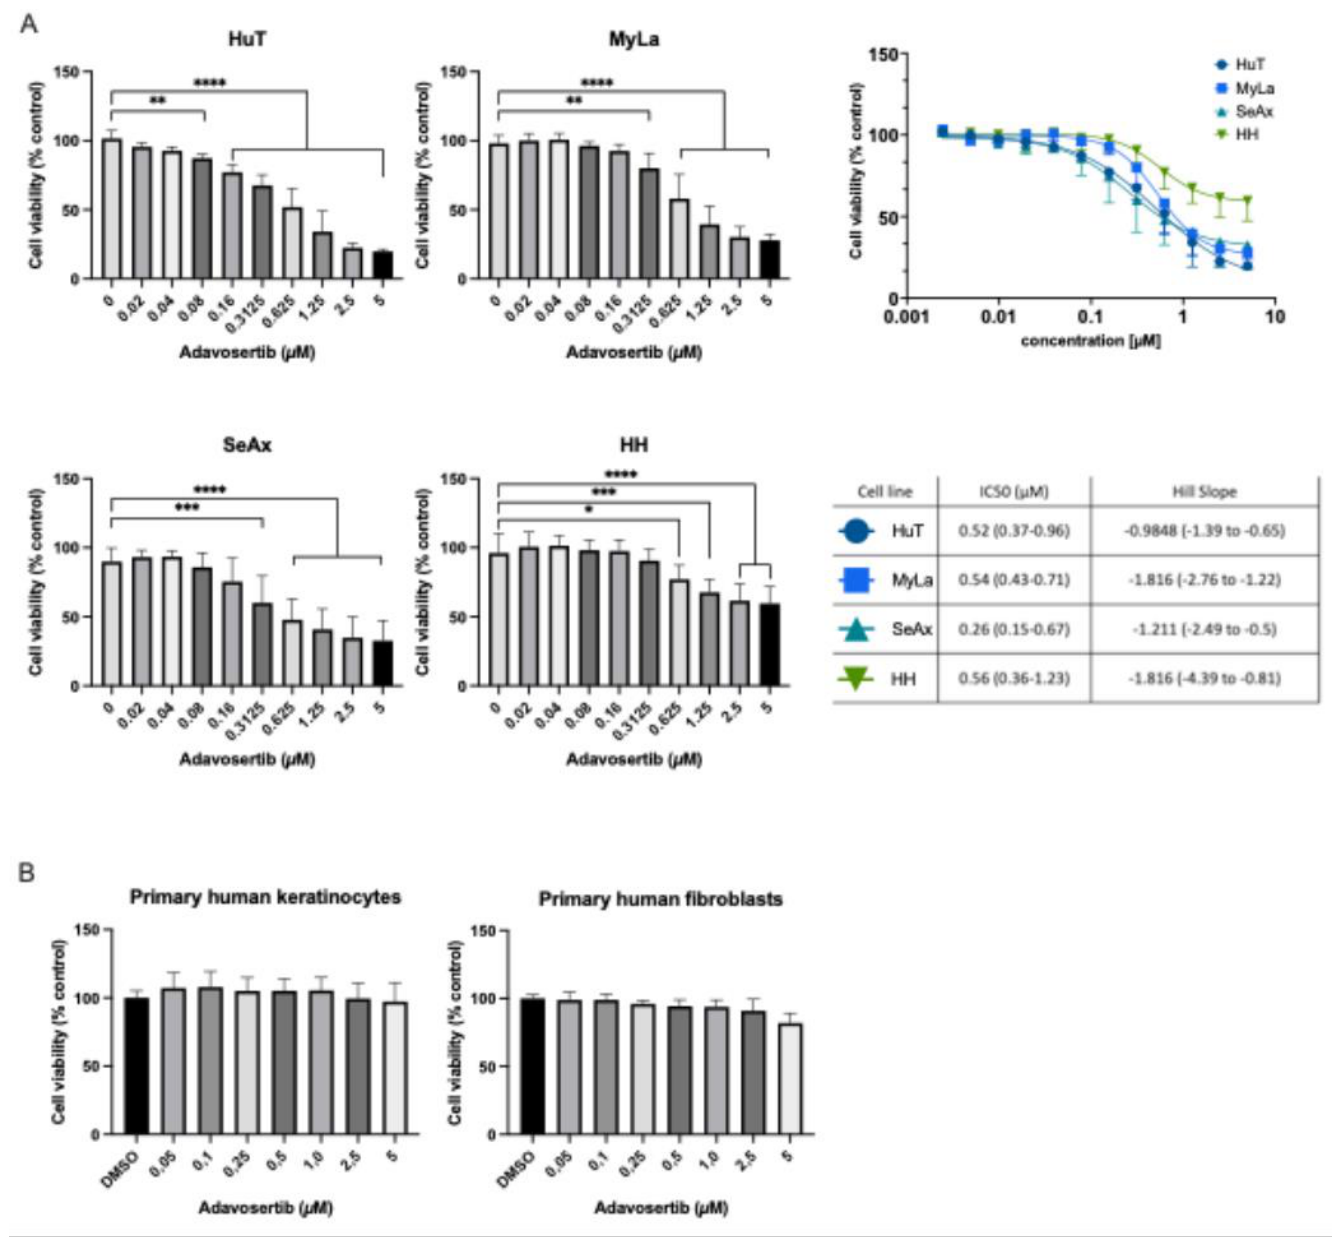
Figure 3.
Adavosertib preferentially reduces viability of patient-derived malignant CD4⁺ T cells compared with healthy donor CD4⁺ T cells. Patient-derived malignant CD4⁺CD7⁻ T cells from Sézary syndrome patients (n = 4) and peripheral blood CD4⁺ T cells from healthy donors (n = 4) were treated with increasing concentrations of adavosertib for 48 h. Cell viability was measured by MTS assay and normalized to DMSO-treated controls. (a) Individual dose–response curves for all donors. (b) Mean dose–response curves for malignant and healthy CD4⁺ T cells. (c) Area under the curve (AUC) calculated for each individual donor to quantify overall sensitivity to adavosertib across the tested concentration range. (d) Comparison of mean AUC values between malignant and healthy groups. Data are shown as mean ± SD. *p < 0.05.
Figure 3.
Adavosertib preferentially reduces viability of patient-derived malignant CD4⁺ T cells compared with healthy donor CD4⁺ T cells. Patient-derived malignant CD4⁺CD7⁻ T cells from Sézary syndrome patients (n = 4) and peripheral blood CD4⁺ T cells from healthy donors (n = 4) were treated with increasing concentrations of adavosertib for 48 h. Cell viability was measured by MTS assay and normalized to DMSO-treated controls. (a) Individual dose–response curves for all donors. (b) Mean dose–response curves for malignant and healthy CD4⁺ T cells. (c) Area under the curve (AUC) calculated for each individual donor to quantify overall sensitivity to adavosertib across the tested concentration range. (d) Comparison of mean AUC values between malignant and healthy groups. Data are shown as mean ± SD. *p < 0.05.
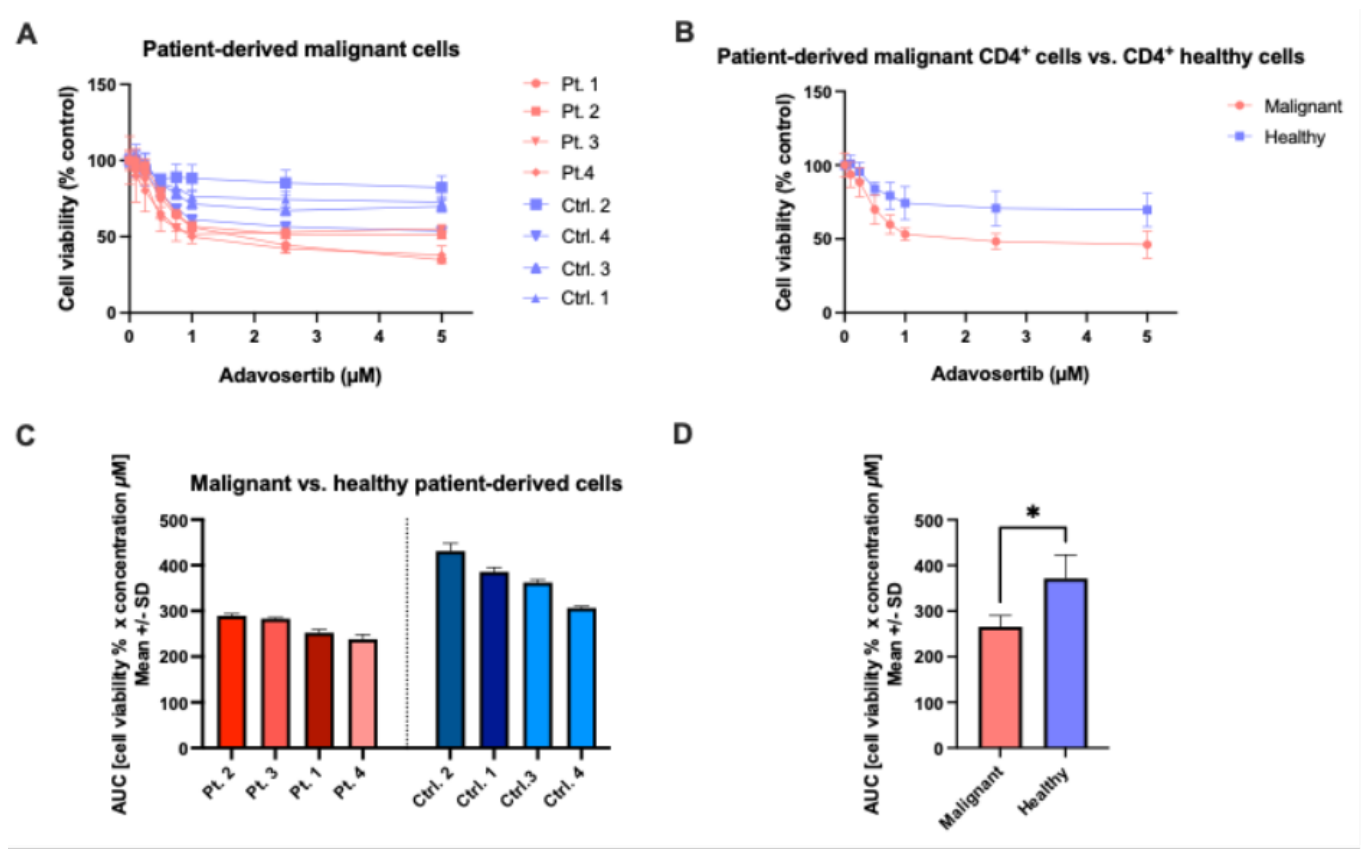
Figure 4.
Adavosertib induces apoptosis in CTCL cells. (a) CTCL cells were treated with 2.5 µM adavosertib or DMSO for 48 h, followed by staining with Annexin V–FITC and 7-AAD for 20 min. Annexin V–positive cells were quantified by flow cytometry. Representative data from n = 3 independent experiments are shown (left), and mean values of n = 3 independent experiments with SD are shown (right). (b) Caspase-3/7 activation was measured using the Caspase-Glo 3/7 assay after 24 h treatment with 2.5 µM adavosertib. Caspase activity was normalized to cells treated with DMSO (untreated control). Mean values of n = 3 independent experiments with SD are plotted. *p < 0.05, **p < 0.001, ****p < 0.0001. HuT and MyLa cells were treated with DMSO or 2.5 µM adavosertib for the indicated time periods. Protein expression levels were assessed by Western blot analysis, with GAPDH serving as a loading control. Shown is a representative blot from n = 3 independent experiments. Blots were imaged digitally. Brightness and contrast were adjusted globally for each blot to improve clarity; no individual lanes were modified or removed.
Figure 4.
Adavosertib induces apoptosis in CTCL cells. (a) CTCL cells were treated with 2.5 µM adavosertib or DMSO for 48 h, followed by staining with Annexin V–FITC and 7-AAD for 20 min. Annexin V–positive cells were quantified by flow cytometry. Representative data from n = 3 independent experiments are shown (left), and mean values of n = 3 independent experiments with SD are shown (right). (b) Caspase-3/7 activation was measured using the Caspase-Glo 3/7 assay after 24 h treatment with 2.5 µM adavosertib. Caspase activity was normalized to cells treated with DMSO (untreated control). Mean values of n = 3 independent experiments with SD are plotted. *p < 0.05, **p < 0.001, ****p < 0.0001. HuT and MyLa cells were treated with DMSO or 2.5 µM adavosertib for the indicated time periods. Protein expression levels were assessed by Western blot analysis, with GAPDH serving as a loading control. Shown is a representative blot from n = 3 independent experiments. Blots were imaged digitally. Brightness and contrast were adjusted globally for each blot to improve clarity; no individual lanes were modified or removed.
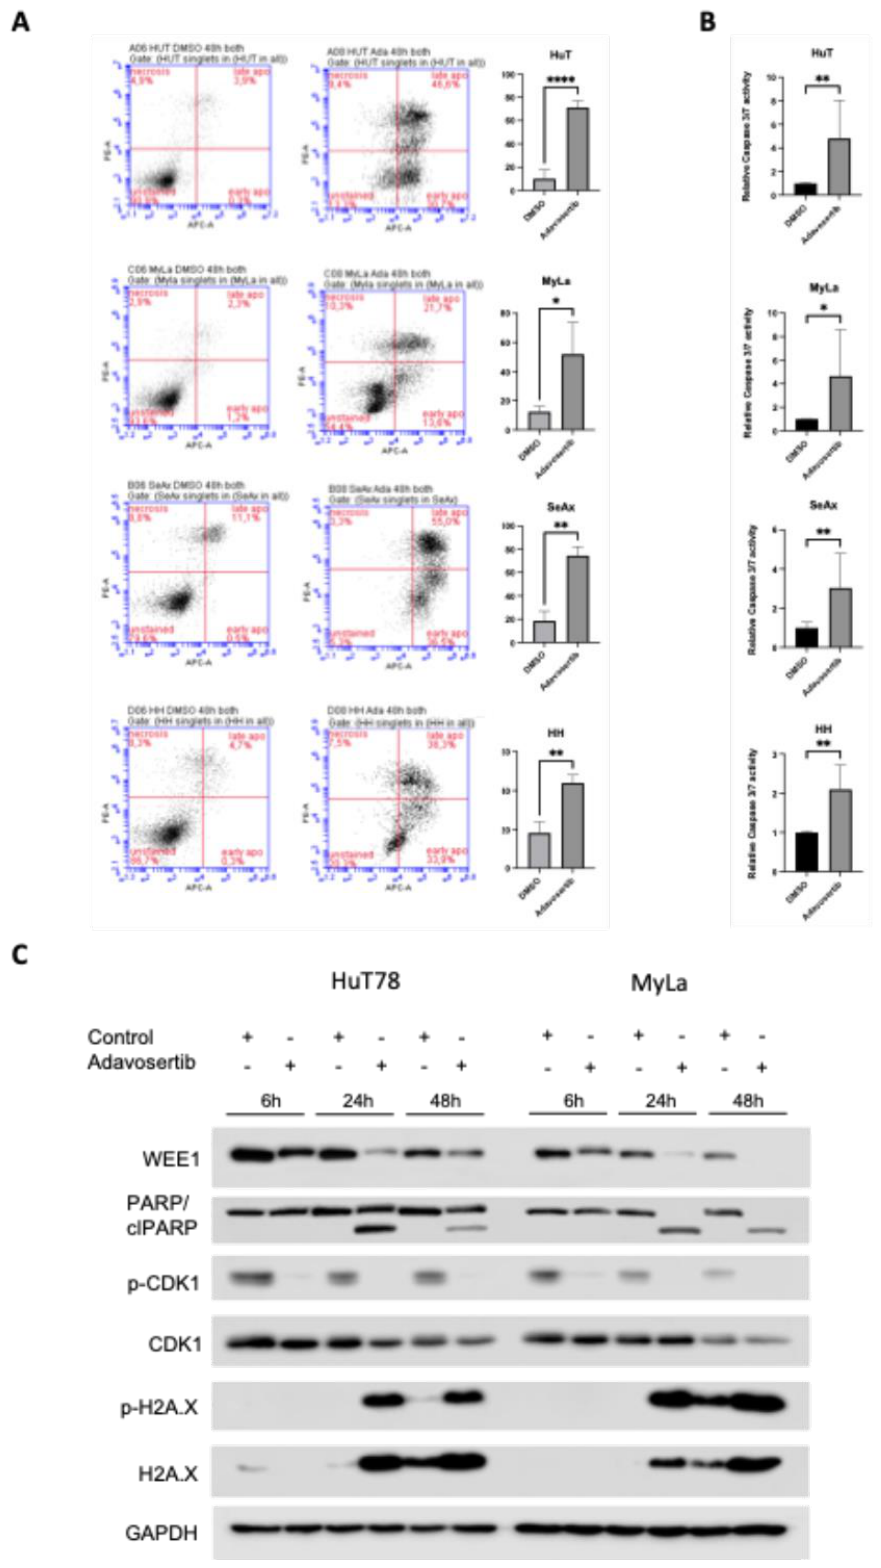
Figure 5.
Adavosertib induces cell-line-dependent changes in cell-cycle distribution in CTCL cells. HuT78, MyLa, SeAx, and HH cells were treated with vehicle control or 2.5 µM adavosertib for 24 h, fixed with 70% ethanol, and stained with propidium iodide (PI). Cell-cycle distribution was analyzed by flow cytometry. Bar graphs show mean values ± SD of n = 3 independent experiments. Representative PI histograms from one experiment are shown below each bar graph. *p < 0.05, **p < 0.01.
Figure 5.
Adavosertib induces cell-line-dependent changes in cell-cycle distribution in CTCL cells. HuT78, MyLa, SeAx, and HH cells were treated with vehicle control or 2.5 µM adavosertib for 24 h, fixed with 70% ethanol, and stained with propidium iodide (PI). Cell-cycle distribution was analyzed by flow cytometry. Bar graphs show mean values ± SD of n = 3 independent experiments. Representative PI histograms from one experiment are shown below each bar graph. *p < 0.05, **p < 0.01.
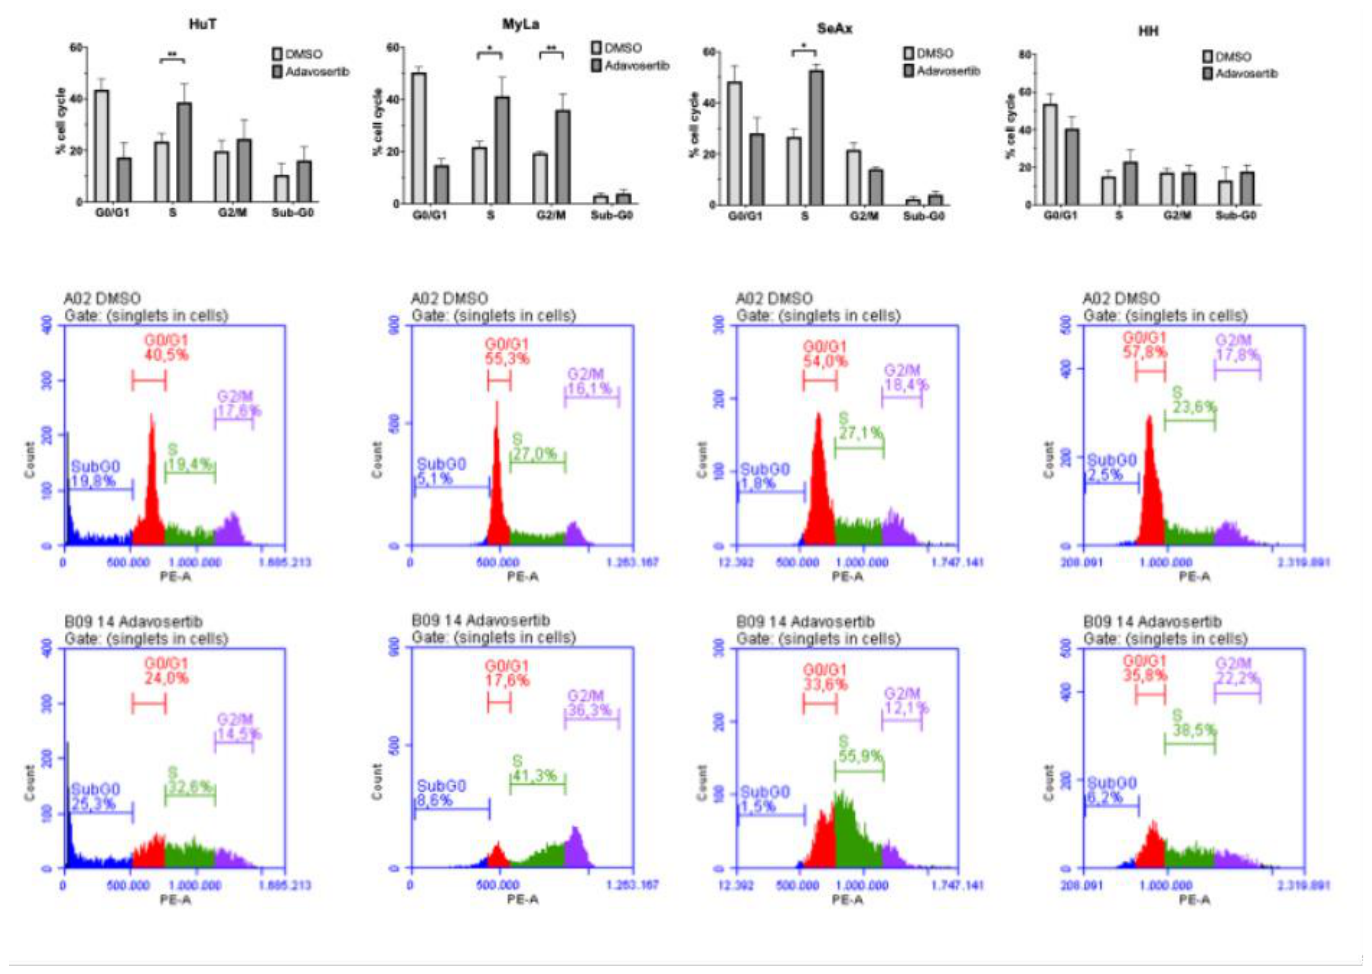
Figure 6.
Adavosertib inhibits tumor growth in a CTCL xenograft mouse model. Female 6- to 8-week-old NOG-F mice were injected subcutaneously with 3 × 10⁵ MyLa cells and treated by oral gavage starting on day 1 after cell inoculation with either vehicle or adavosertib (30 mg/kg) once daily on a 5-days-on/2-days-off schedule (n = 9 per group). (a) Individual tumor growth curves over time. (b) Mean tumor volume ± SD over time. (c) Individual and mean tumor volumes at the experimental endpoint. (d) Mean area under the curve (AUC) values summarizing overall tumor growth per treatment group. Data are shown as mean ± SD. *p < 0.05.
Figure 6.
Adavosertib inhibits tumor growth in a CTCL xenograft mouse model. Female 6- to 8-week-old NOG-F mice were injected subcutaneously with 3 × 10⁵ MyLa cells and treated by oral gavage starting on day 1 after cell inoculation with either vehicle or adavosertib (30 mg/kg) once daily on a 5-days-on/2-days-off schedule (n = 9 per group). (a) Individual tumor growth curves over time. (b) Mean tumor volume ± SD over time. (c) Individual and mean tumor volumes at the experimental endpoint. (d) Mean area under the curve (AUC) values summarizing overall tumor growth per treatment group. Data are shown as mean ± SD. *p < 0.05.
Disclaimer/Publisher’s Note: The statements, opinions and data contained in all publications are solely those of the individual author(s) and contributor(s) and not of MDPI and/or the editor(s). MDPI and/or the editor(s) disclaim responsibility for any injury to people or property resulting from any ideas, methods, instructions or products referred to in the content. |
© 2026 by the authors. Licensee MDPI, Basel, Switzerland. This article is an open access article distributed under the terms and conditions of the Creative Commons Attribution (CC BY) license (http://creativecommons.org/licenses/by/4.0/).
Copyright: This open access article is published under a Creative Commons CC BY 4.0 license, which permit the free download, distribution, and reuse, provided that the author and preprint are cited in any reuse.


