

Submitted:
17 July 2026
Posted:
21 July 2026
You are already at the latest version
Abstract
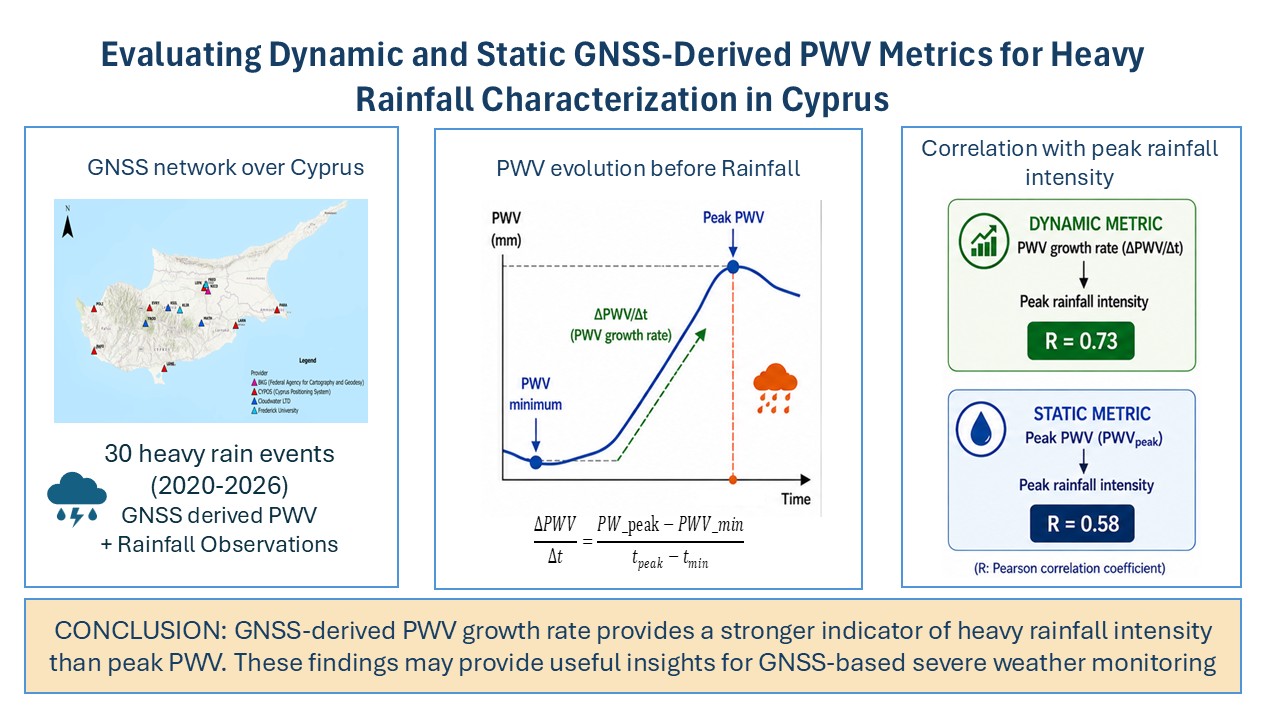
Global Navigation Satellite System (GNSS)-derived precipitable water vapour (PWV) has become an important source of atmospheric moisture information for severe weather monitoring. While previous studies have primarily relied on static GNSS-derived PWV metrics, comparatively little attention has been given to dynamic metrics capturing the temporal evolution of atmospheric moisture. This study evaluates the relationships of dynamic and static GNSS-derived PWV metrics with heavy rainfall characteristics in Cyprus using 30 events recorded between 2020 and 2026. GNSS-PWV observations from the CLOUDWATER network and collocated rainfall measurements from the Cyprus Department of Meteorology were analysed. The pre-rainfall PWV growth rate (ΔPWV/Δt) and peak PWV were compared using correlation and regression analyses. All events exhibited a distinct increase in PWV before rainfall onset, with peak PWV typically occurring immediately before or shortly after precipitation began. The PWV growth rate showed a stronger relationship with peak rainfall intensity (R = 0.73) than peak PWV (R = 0.58) and remained the only significant predictor in multiple regression analysis. Neither metric was significantly related to total rainfall accumulation or rainfall timing. These findings show that the dynamic PWV metric provide a more informative characterization of heavy rainfall intensity than the static PWV metric alone.
Keywords:
GNSS-derived PWV
; PWV growth rate
; heavy rain
; rainfall intensity
; atmospheric moisture dynamics
; GNSS meteorology
; Eastern Mediterranean
1. Introduction
Heavy rainfall events are among the most significant high-impact weather phenomena in the Mediterranean region, frequently triggering flash floods, landslides, infrastructure damage, and substantial socioeconomic losses [1,2]. While precipitation is essential for regional water resources, extreme rainfall can rapidly overwhelm natural and urban drainage systems, leading to severe flooding. In the eastern Mediterranean, such events are modulated by the interaction of large-scale atmospheric circulation, moisture transport, convective instability, and complex topography [3,4]. Improving understanding of the atmospheric processes governing rainfall onset, intensity, and duration remains a key objective in regional meteorological research.
Atmospheric water vapour is a fundamental component of the hydrological cycle and the primary source of moisture for cloud formation and precipitation development. Its amount and temporal variability is associated with precipitation initiation, intensity, and duration [5,6]. Consequently, continuous monitoring of atmospheric water vapour is essential for understanding precipitation processes and improving severe weather monitoring and nowcasting capabilities. Traditionally, atmospheric water vapour observations have been obtained from radiosondes, satellite sensors, and microwave radiometers. While these systems provide valuable information, they are often limited by temporal sampling, spatial coverage, operational costs, or data availability under adverse weather conditions [7,8,9]. Over the past two decades, Global Navigation Satellite System (GNSS) meteorology has emerged as a reliable and cost-effective technique for monitoring atmospheric moisture with high temporal resolution and near-continuous availability [9,10,11,12,13]. As GNSS signals propagate through the atmosphere, they are delayed by refractivity effects in the troposphere. The wet component of this delay is directly related to atmospheric water vapour and can be converted into Precipitable Water Vapour (PWV), which represents the total integrated water vapour content within a vertical atmospheric column [14,15].
The increasing availability of continuously operating GNSS networks has enabled the retrieval of high-temporal-resolution PWV observations and extensive investigation of their relationship with precipitation. Studies across different climatic regions have shown that PWV exhibits systematic temporal variations prior to rainfall events, typically characterized by gradual or rapid increases before or during heavy precipitation onset, with reported lead times ranging from zero to more than 8 hours, with more typical the 1-3 hours’ time window [16,17,18,19,20]. Heavy precipitation is often associated with elevated or peak PWV values, followed by a rapid decrease as the system passes and atmospheric moisture is depleted [17,18,19,20,21,22].
Despite advances in numerical weather prediction, accurate precipitation forecasting remains challenging, particularly for localized convective events. Their development is strongly influenced by small-scale moisture variability that is often insufficiently resolved by conventional observing networks [23]. Consequently, the effectiveness of GNSS meteorology for nowcasting depends not only on PWV accuracy but also on the spatial density of observations. While geodetic-grade GNSS stations provide high-quality atmospheric products, network expansion still comprises high installation and maintenance costs. Recent developments in low-cost GNSS receivers offer a promising alternative for dense atmospheric monitoring networks. Studies by Oikonomou et al. [24], Marut et al. [25], and Stępniak and Paziewski [26] demonstrated that low-cost GNSS receivers can provide zenith total delay (ZTD) and PWV estimates with accuracies comparable to those obtained from geodetic-grade instruments. These findings suggest that dense networks of low-cost GNSS sensors improve the monitoring of atmospheric moisture variability and pre-convective environments. Such developments are particularly relevant for the Eastern Mediterranean, where complex topography, strong land–sea interactions, and frequent high-impact weather events create a need for high-resolution atmospheric monitoring to support improved forecasting and flash-flood early warning systems.
While several studies have examined characteristic PWV levels, peak values, lead times, and abrupt PWV increases prior to rainfall onset, these indicators primarily describe the magnitude and timing of atmospheric moisture conditions associated with precipitation. In contrast, the rate of PWV build-up (ΔPWV/Δt) has received relatively limited attention as a primary diagnostic variable in PWV–precipitation studies and has not been systematically explored in relation to rainfall characteristics. This metric directly quantifies the speed of atmospheric moistening prior to precipitation and may provide additional insight into moisture transport and convergence processes that govern rainfall development and intensity.
In this study, 30 heavy rainfall events recorded between 2020 and 2026 are analyzed to investigate relationships between pre-rainfall PWV build-up and key precipitation characteristics, including rainfall intensity, duration, total accumulation, and the lag between PWV peak and rainfall onset. The objective is to examine whether PWV growth rate is related to subsequent precipitation development and to assess its potential as an early indicator of heavy rainfall events in the Eastern Mediterranean. The study is conducted within the framework of the EuRTISS (Southeastern Europe Real-Time Severe Weather System) project, which aims to enhance GNSS-based severe weather monitoring and early-warning capabilities in the Southeastern Mediterranean.
2. Materials and Methods
2.1. Study Area and Observational Datasets
The study was conducted over Cyprus, an island located in the Eastern Mediterranean where heavy precipitation events usually arise from the interaction of synoptic-scale weather systems, mesoscale disturbances, convective processes, and complex topography [4,27,28]. The complex topography of the island, dominated by the Troodos mountain range and surrounded by warm marine and plain areas, contributes to strong spatial and temporal variability in atmospheric moisture and precipitation patterns. Such conditions make Cyprus an appropriate natural laboratory for investigating the relationship between atmospheric water vapour evolution and heavy rainfall development.
Atmospheric water vapour observations were obtained from the CLOUDWATER GNSS network, which consists of 13 continuously operating dual-frequency GNSS stations distributed across Cyprus (Figure 1 and Table 1). The network comprises both geodetic-grade and low-cost GNSS receivers, providing near-real-time atmospheric products for meteorological applications. GNSS observations are acquired at 1 s intervals, converted into 15-minute RINEX files, and automatically processed using the G-Nut/Tefnut software to estimate tropospheric parameters, including precipitable water vapour (PWV) [29,30]. PWV is retrieved from GNSS-derived atmospheric propagation delays and represents the total column water vapour content above each station. PWV observations are available at a temporal resolution of 15 min. A detailed description of the GNSS processing strategy, tropospheric delay estimation, PWV retrieval methodology, and quality-control procedures is provided in Giannadaki et al. [20].
Precipitation observations were obtained from the meteorological station network operated by the Cyprus Department of Meteorology (CY DoM). Rainfall measurements are available at a temporal resolution of 10 min and were synchronized with the GNSS-derived precipitable water vapour (GNSS-PWV) time series. For each GNSS site, the geographically nearest meteorological station (up to 2 kilometre distance) was selected to provide collocated precipitation measurements. This approach ensured spatial consistency between atmospheric moisture estimates and surface precipitation observations and reduced the influence of spatial variability on the subsequent analysis.
2.2. Heavy Rainfall Event Database
A database of 30 heavy and extreme rainfall events between 2020 and 2026 was compiled for this study. Events were categorized as heavy or extreme according to the classification criteria proposed by Giannadaki et al. [20], while the final event selection was based on availability of concurrent GNSS-derived PWV and rainfall observations, continuous PWV measurements before and during the event, and rainfall records without significant data gaps. The resulting database encompasses events from different seasons, geographical regions, and precipitation regimes, thereby providing a representative sample of heavy rainfall occurrences across Cyprus and enabling the investigation of PWV behaviour under a wide range of meteorological conditions.
2.3. Methodology
Concurrent PWV and rainfall time series were generated for the studied heavy rain events in order to investigate the temporal evolution of atmospheric moisture prior to precipitation onset. The analysis focused specifically on the pre-rainfall moisture “buildup” phase, defined as the period extending from the minimum PWV value preceding a sustained increase in atmospheric moisture to the occurrence of the peak PWV value. Although the buildup phase primarily represents moisture accumulation before rainfall initiation, peak PWV may occur either before or shortly after rainfall onset, reflecting continued moisture variability during the transition to precipitation in some events.
In this study, static PWV metrics refer to metrics that characterize the atmospheric moisture state at a given time (e.g., peak PWV), whereas dynamic PWV metrics characterize its temporal evolution prior to rainfall (e.g., PWV growth rate). For each event, five parameters describing the PWV evolution and rainfall characteristics were extracted:
- PWV_mim: The minimum PWV value recorded at the beginning of the moisture buildup phase.
- PWV_peak: The maximum PWV value recorded prior to or during the rainfall onset.
- Peak rain amount: The maximum rain value recorded during the event.
- Rainfall Duration: The elapsed time between rainfall onset and cessation.
- Time Lag: The time interval between the occurrence of PWV_peak and rainfall onset.
To quantify the rate of atmospheric moisture accumulation during the buildup phase, the PWV growth rate (ΔPWV/Δt) was calculated as
where and denote the observation times corresponding to PWV_peak and PWV_min respectively.
The PWV growth rate (ΔPWV/Δt) and PWV_peak are used as atmospheric moisture metrics characterizing the temporal evolution and the peak state of atmospheric water vapour during each event, respectively. PWV growth rate is expressed in mm h−1, while PWV_peak is expressed in mm. An example of the extracted PWV and rainfall parameters, during a heavy rain event recorded in Paphos in November 2024, is shown in Figure 2. PWV_peak represents the maximum atmospheric moisture content occurring prior to or at the time of rainfall onset, whereas the PWV growth rate (ΔPWV/Δt) quantifies the rate of atmospheric moisture increase during the pre-rainfall period.
2.4. Statistical Analysis
Statistical analyses were performed to evaluate and compare the relationships between the PWV growth rate (ΔPWV/Δt), peak atmospheric moisture content (PWV_peak), and the characteristics of the subsequent precipitation events. Both ΔPWV/Δt and PWV_peak were treated as atmospheric moisture metrics and analysed in relation to the following rainfall parameters:
- PWV_peak
- peak rainfall amount
- total rainfall accumulation
- rainfall duration
- time lag between PWV_peak and rainfall onset
In addition, the relationship between rainfall duration and the PWV-rainfall time lag was examined to assess whether the timing of peak atmospheric moisture relative to rainfall onset is associated with the persistence of precipitation events.
Pearson correlation coefficients (R) were calculated to quantify the strength and direction of the linear relationships between each atmospheric moisture metric (ΔPWV/Δt and PWV_peak) and the extracted rainfall parameters. This allowed a direct comparison of the sensitivity of dynamic (ΔPWV/Δt) and state-based (PWV_peak) moisture descriptors with respect to precipitation characteristics.
The statistical significance of the observed relationships was evaluated at the 95% confidence level (α = 0.05), and corresponding p-values were computed for all correlation coefficients. Simple and multiple linear regression analysis was subsequently applied to statistically significant relationships in order to further quantify the dependence between variables and assess the explanatory capability of both ΔPWV/Δt and PWV_peak as potential indicators of heavy rainfall characteristics. Model performance was evaluated using regression coefficients, the coefficient of determination (R2), and associated significance metrics. Overall, this statistical framework enables a systematic comparative assessment of dynamic and state-based atmospheric moisture metrics in relation to the intensity, accumulation, duration, and temporal evolution of heavy rainfall events.
3. Results and Discussion
3.1. Temporal Evolution of GNSS-Derived Precipitable Water Vapour Prior to Heavy Rainfall
The temporal evolution of atmospheric moisture preceding heavy precipitation was investigated in relation to precipitation characteristics, using a database of 30 heavy and extreme rainfall events recorded over Cyprus between 2020 and 2026. For each event, the GNSS-derived PWV_peak, PWV growth rate (ΔPWV/Δt), rainfall peak intensity, total rainfall accumulation, rainfall duration, and the time lag between PWV_peak and rainfall onset were extracted following the methodology described in Section 2.3. The complete list of analyzed events and their corresponding parameters is presented in Table 2. The analyzed events encompass a broad range of meteorological conditions, reflecting the diversity of heavy rainfall systems affecting Cyprus. PWV_peak values ranged from 13.6 to 39.7 mm, while the calculated PWV growth rates varied between 0.4 and 2.9 mm h−1, indicating substantial variability in the rate of atmospheric moistening preceding rainfall. The time lag between PWV_peak and rainfall onset ranged from 0 to 11 h, although most events exhibited considerably shorter lag times.
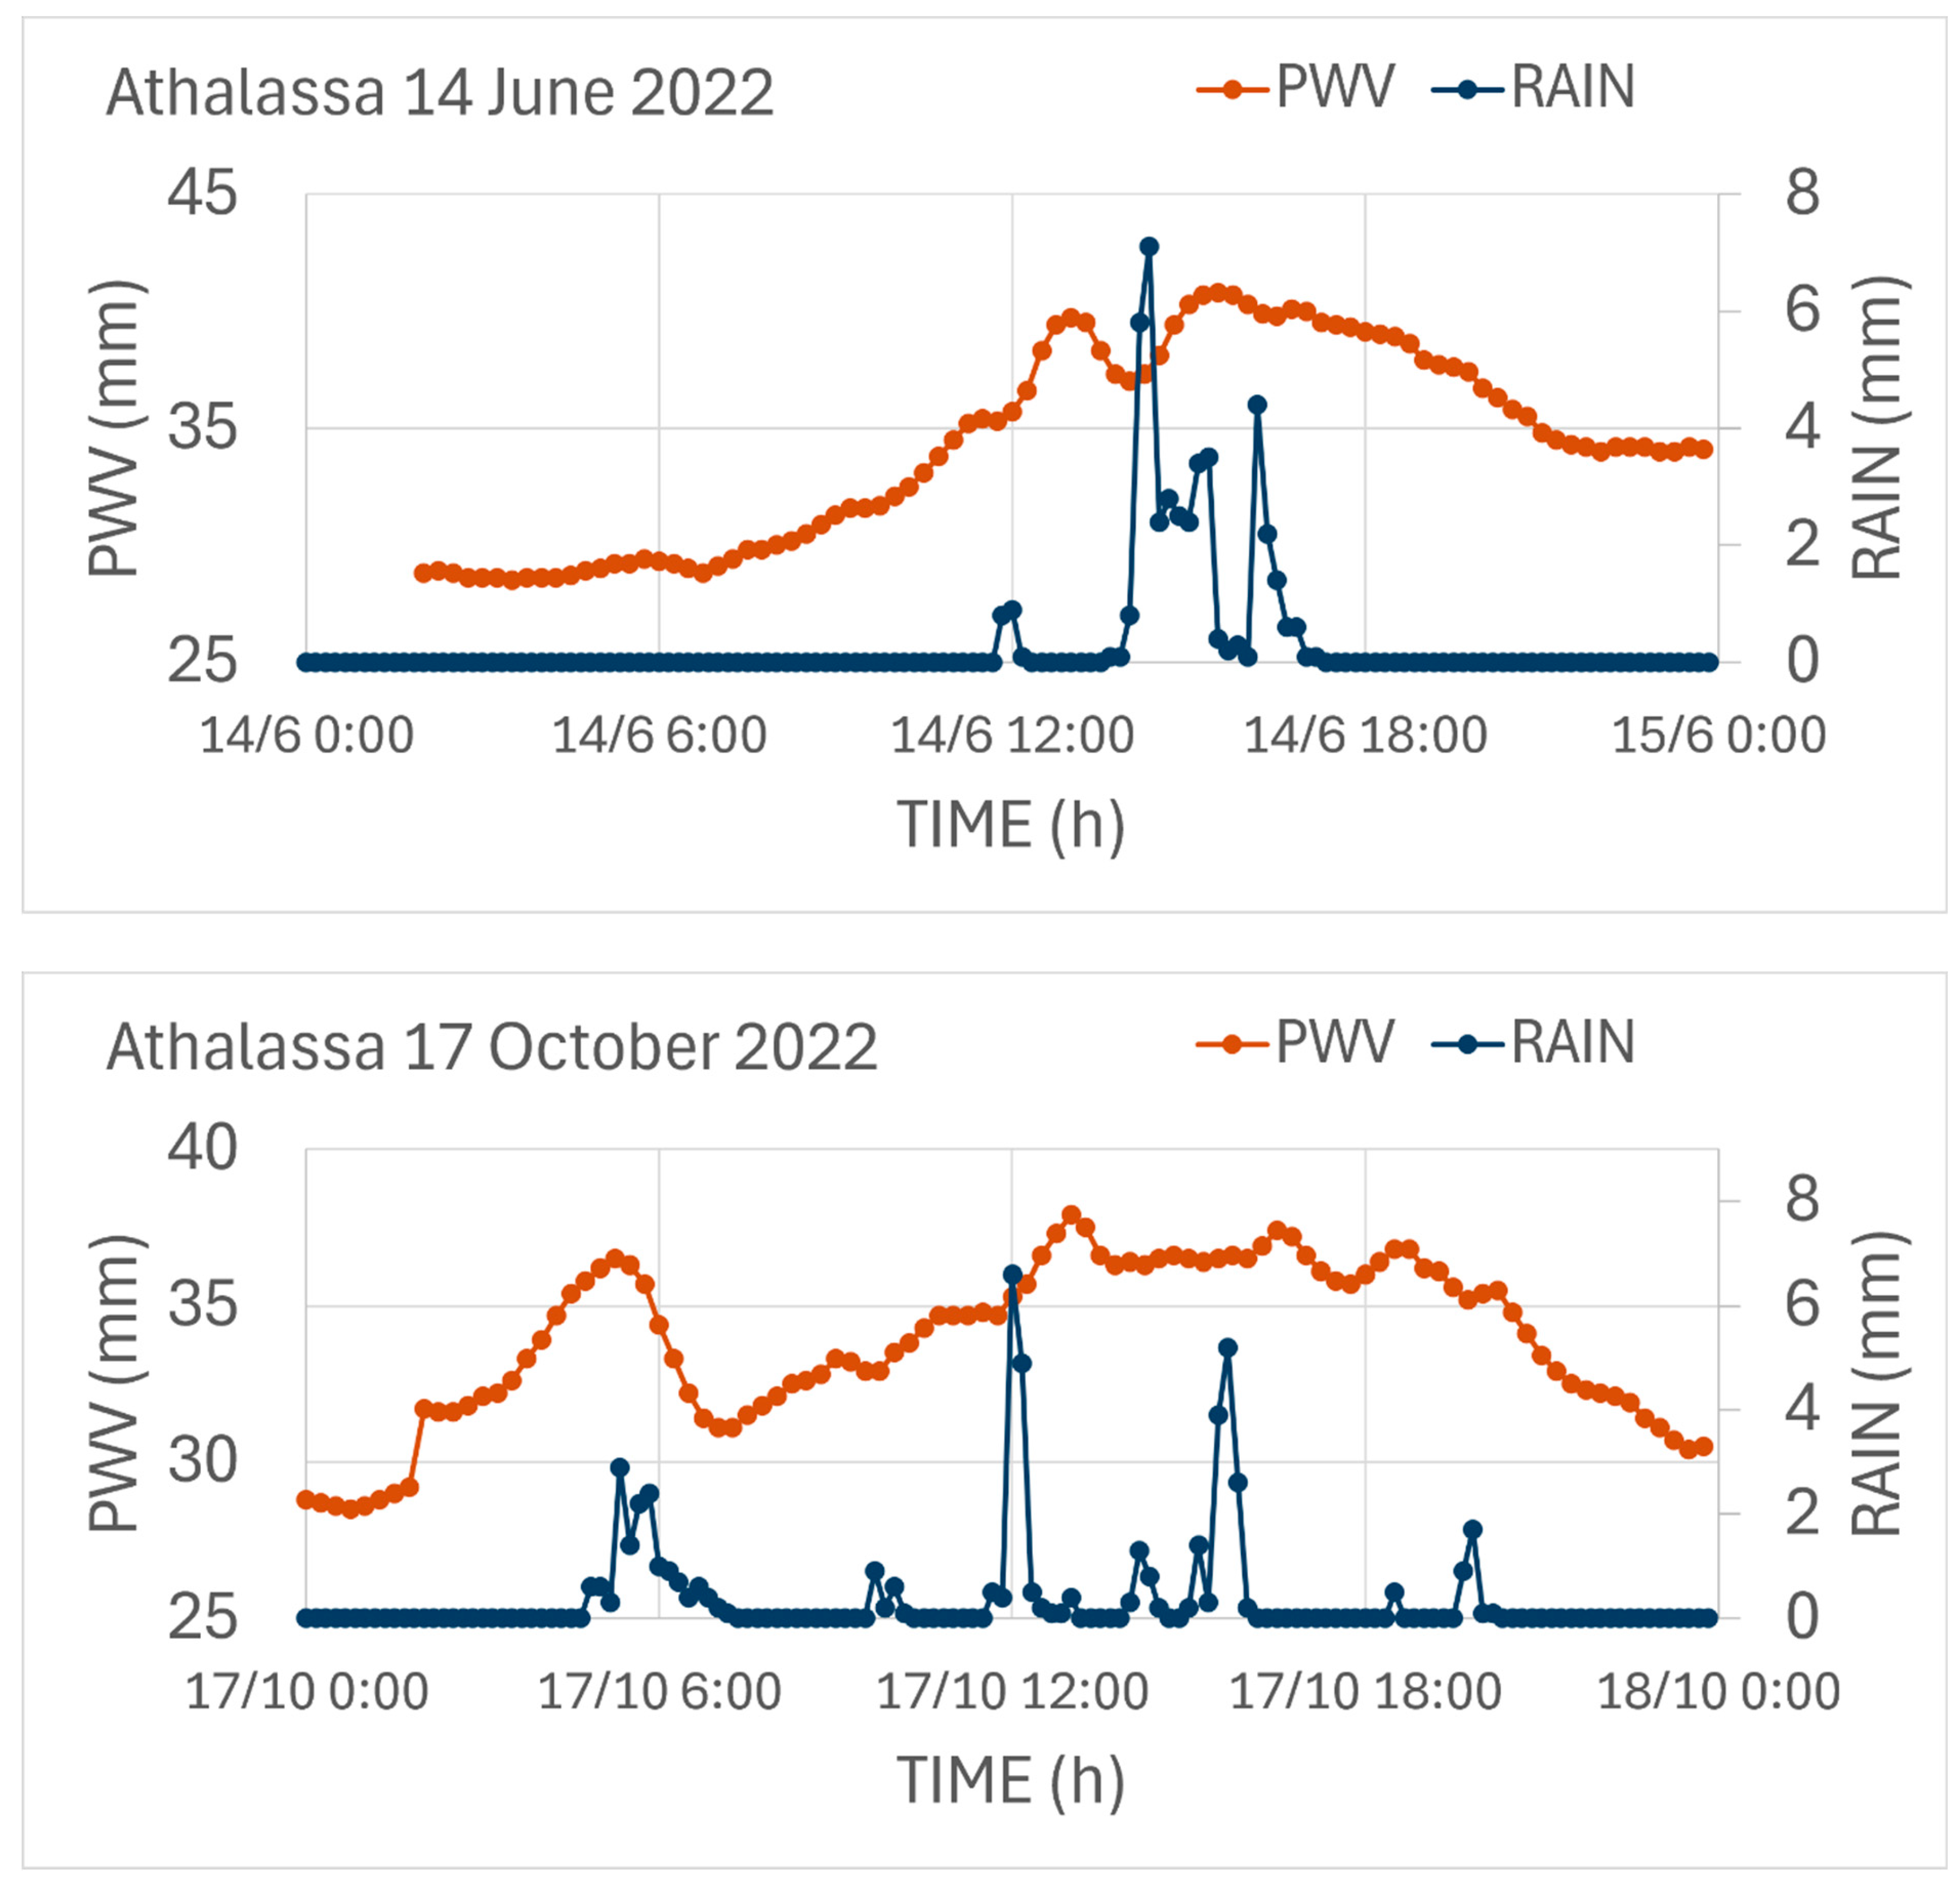
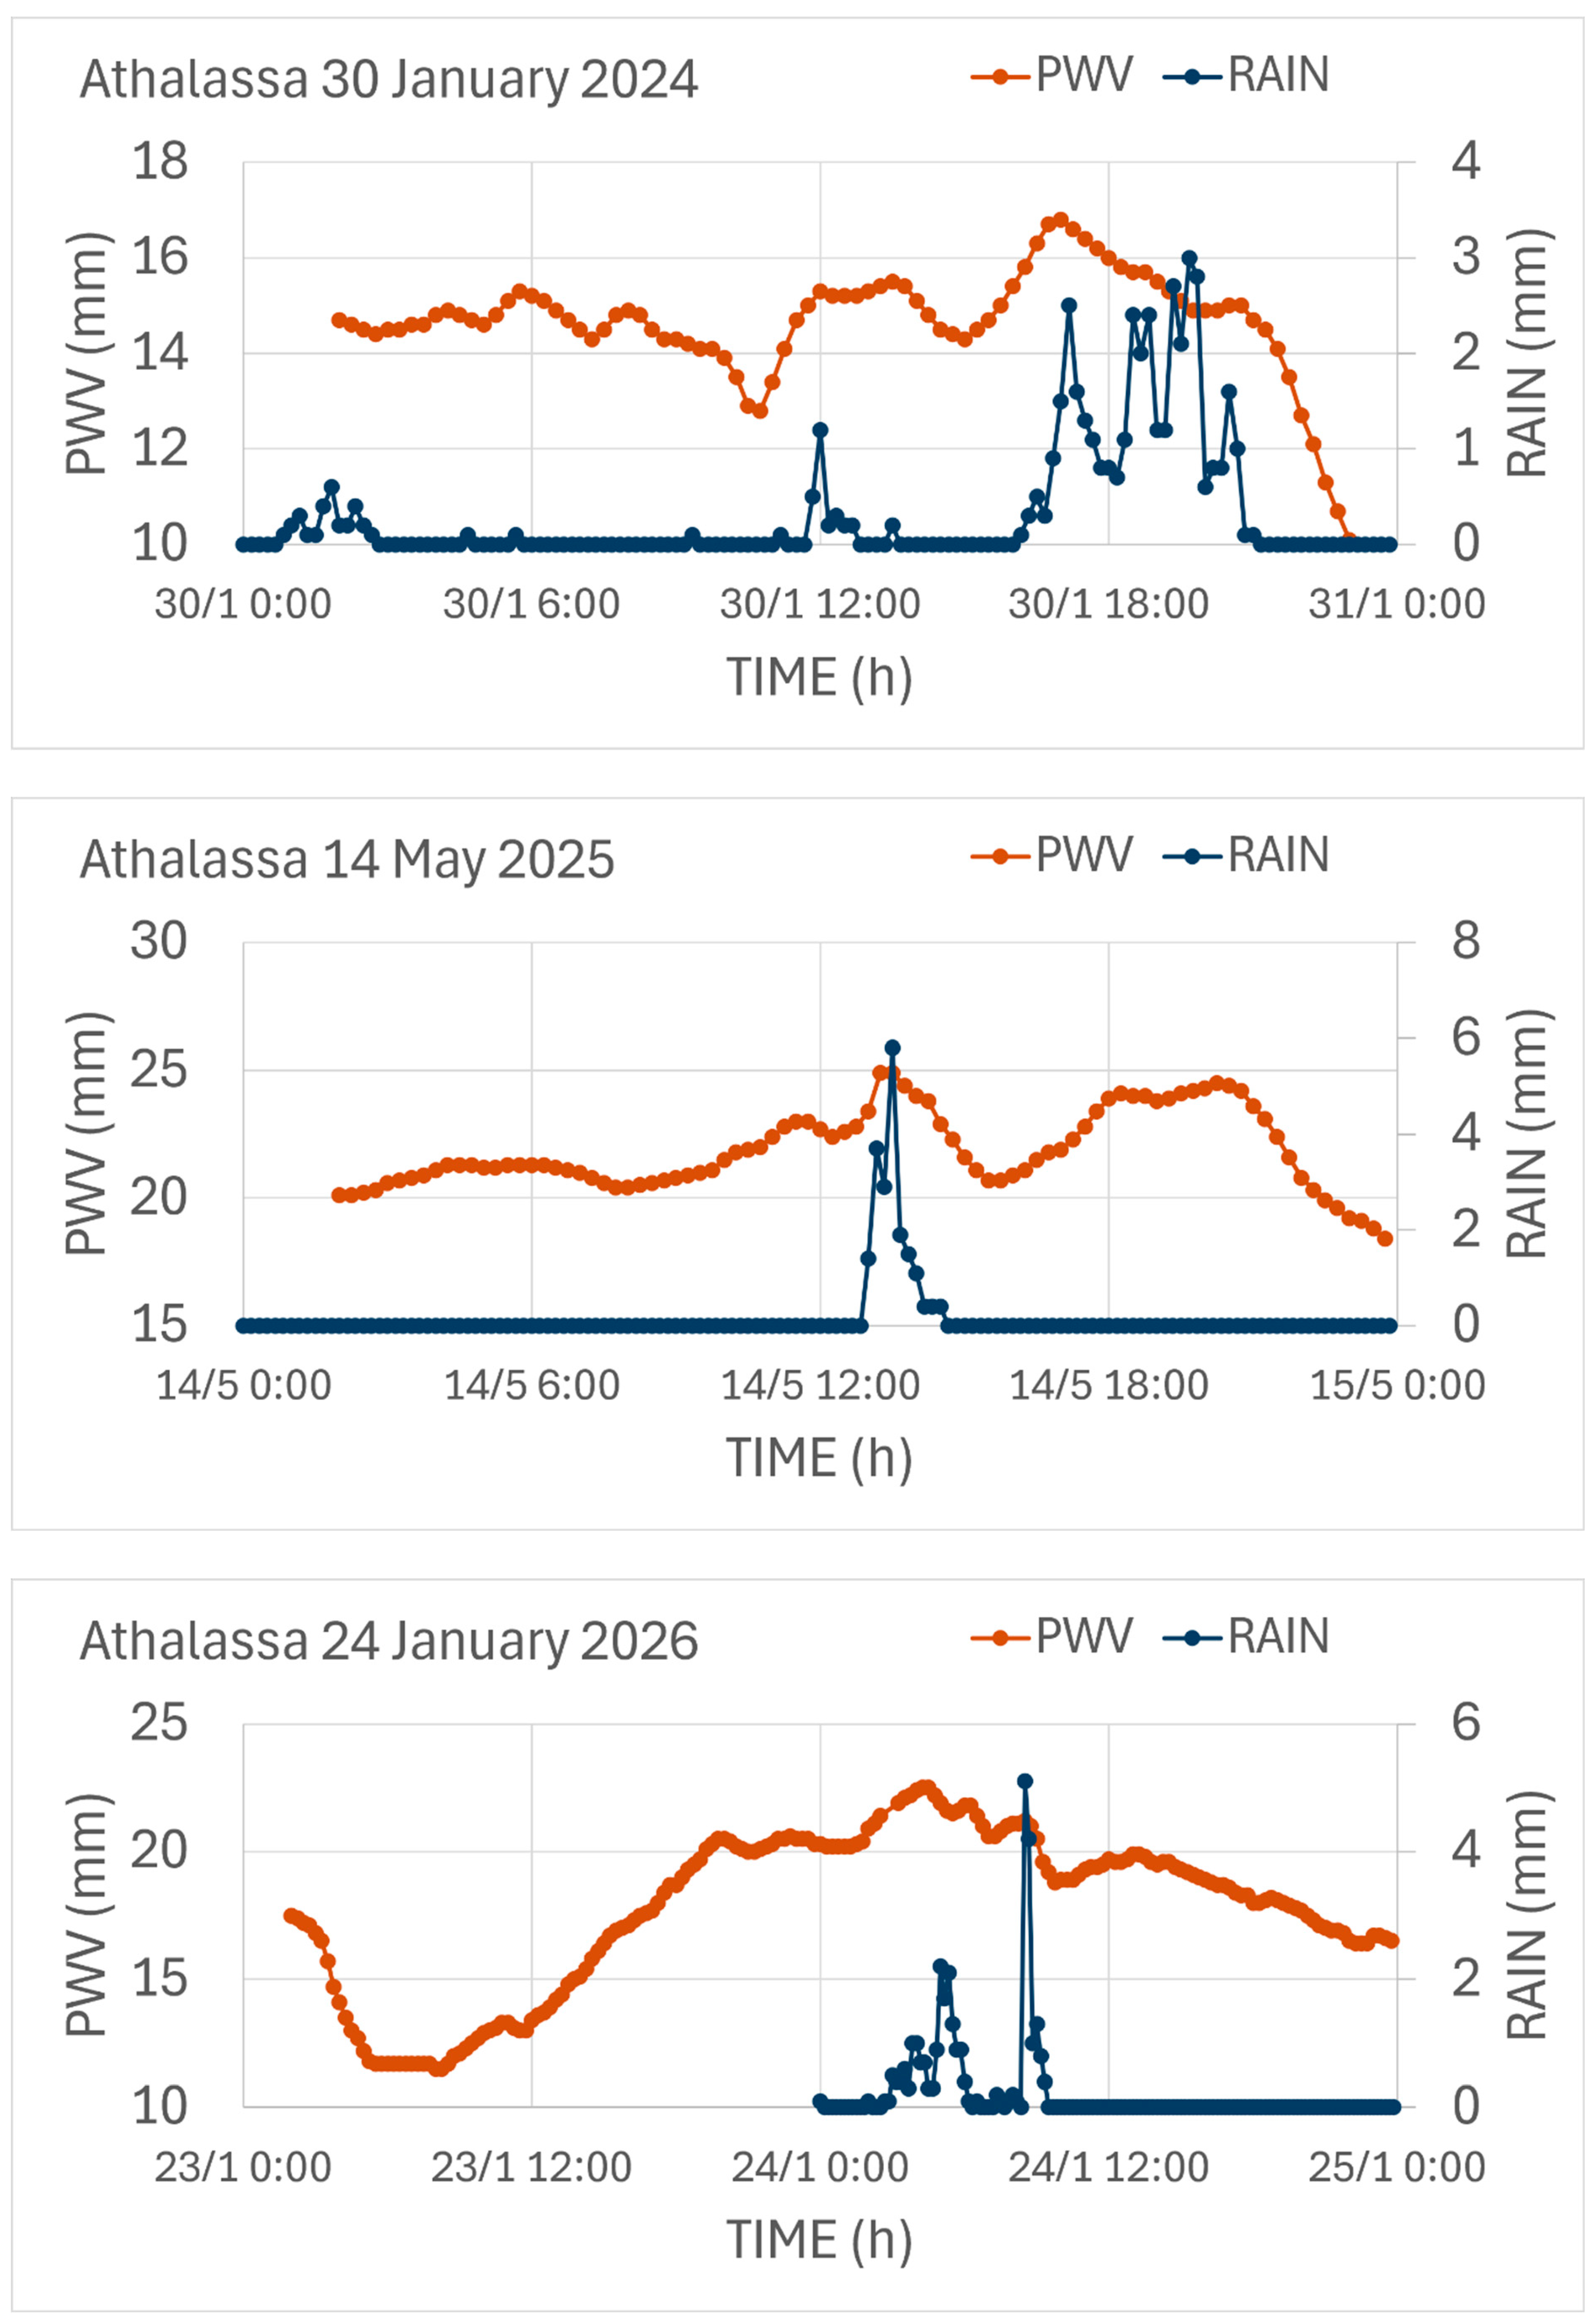
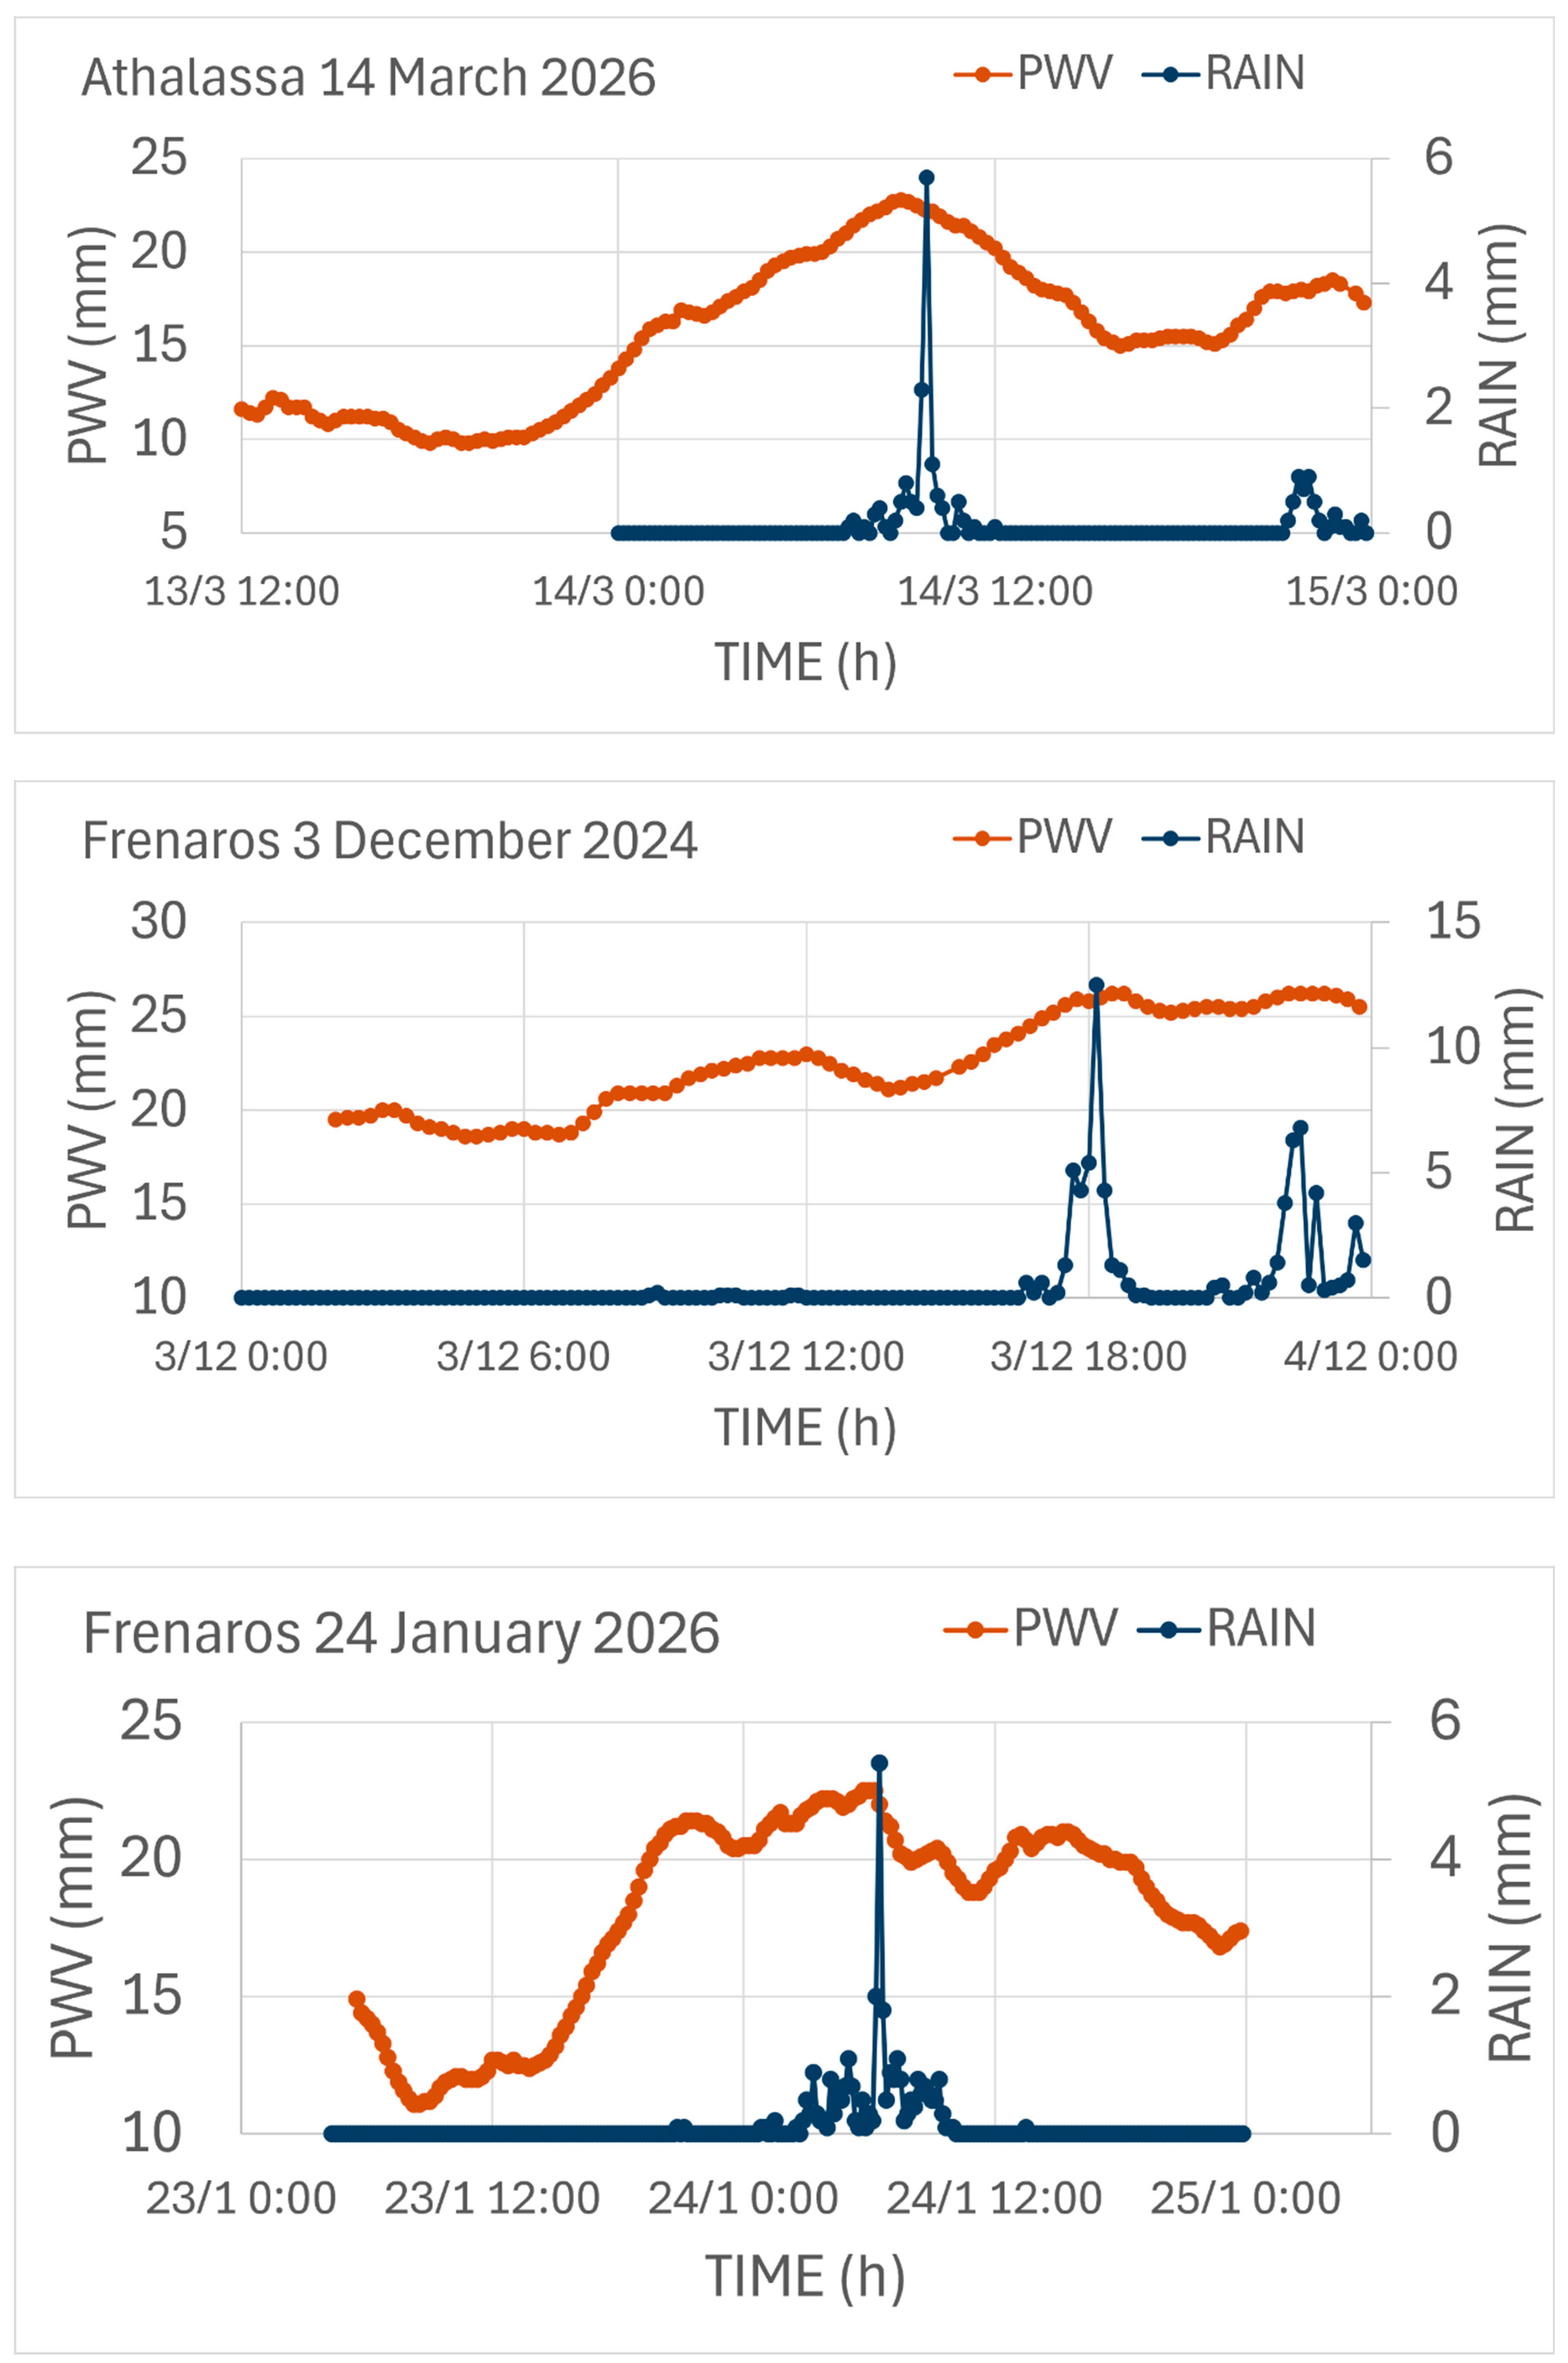
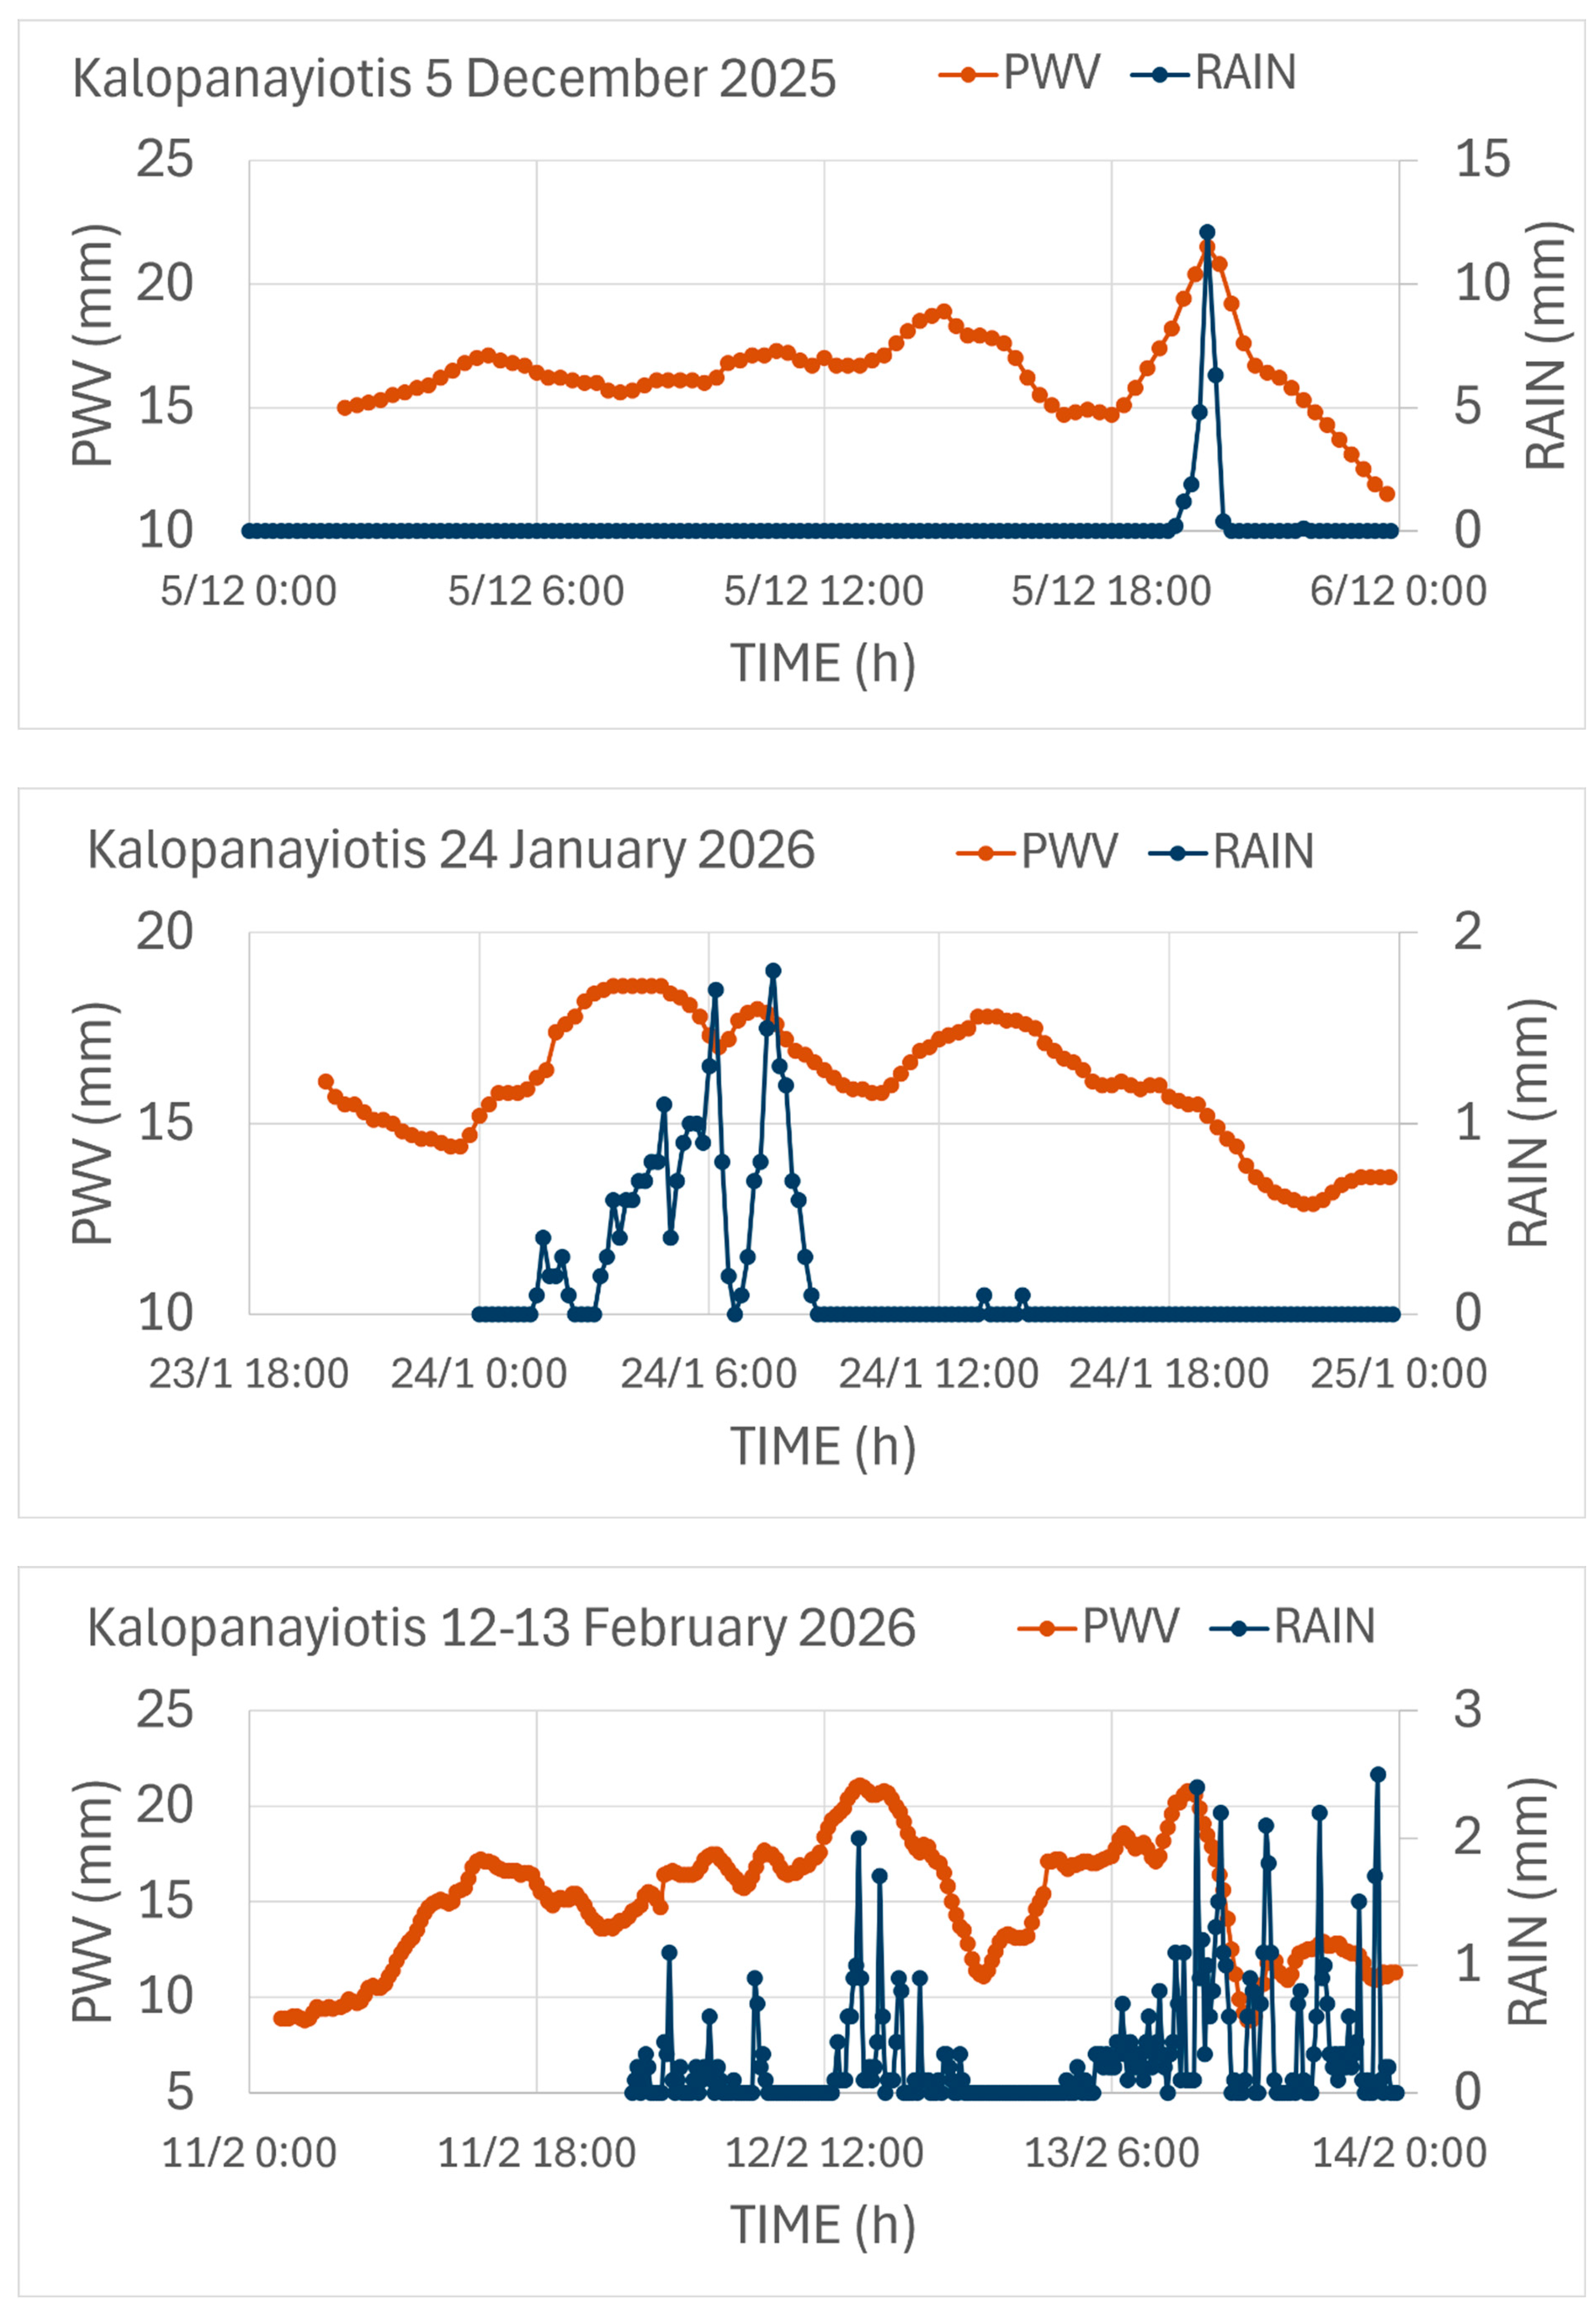
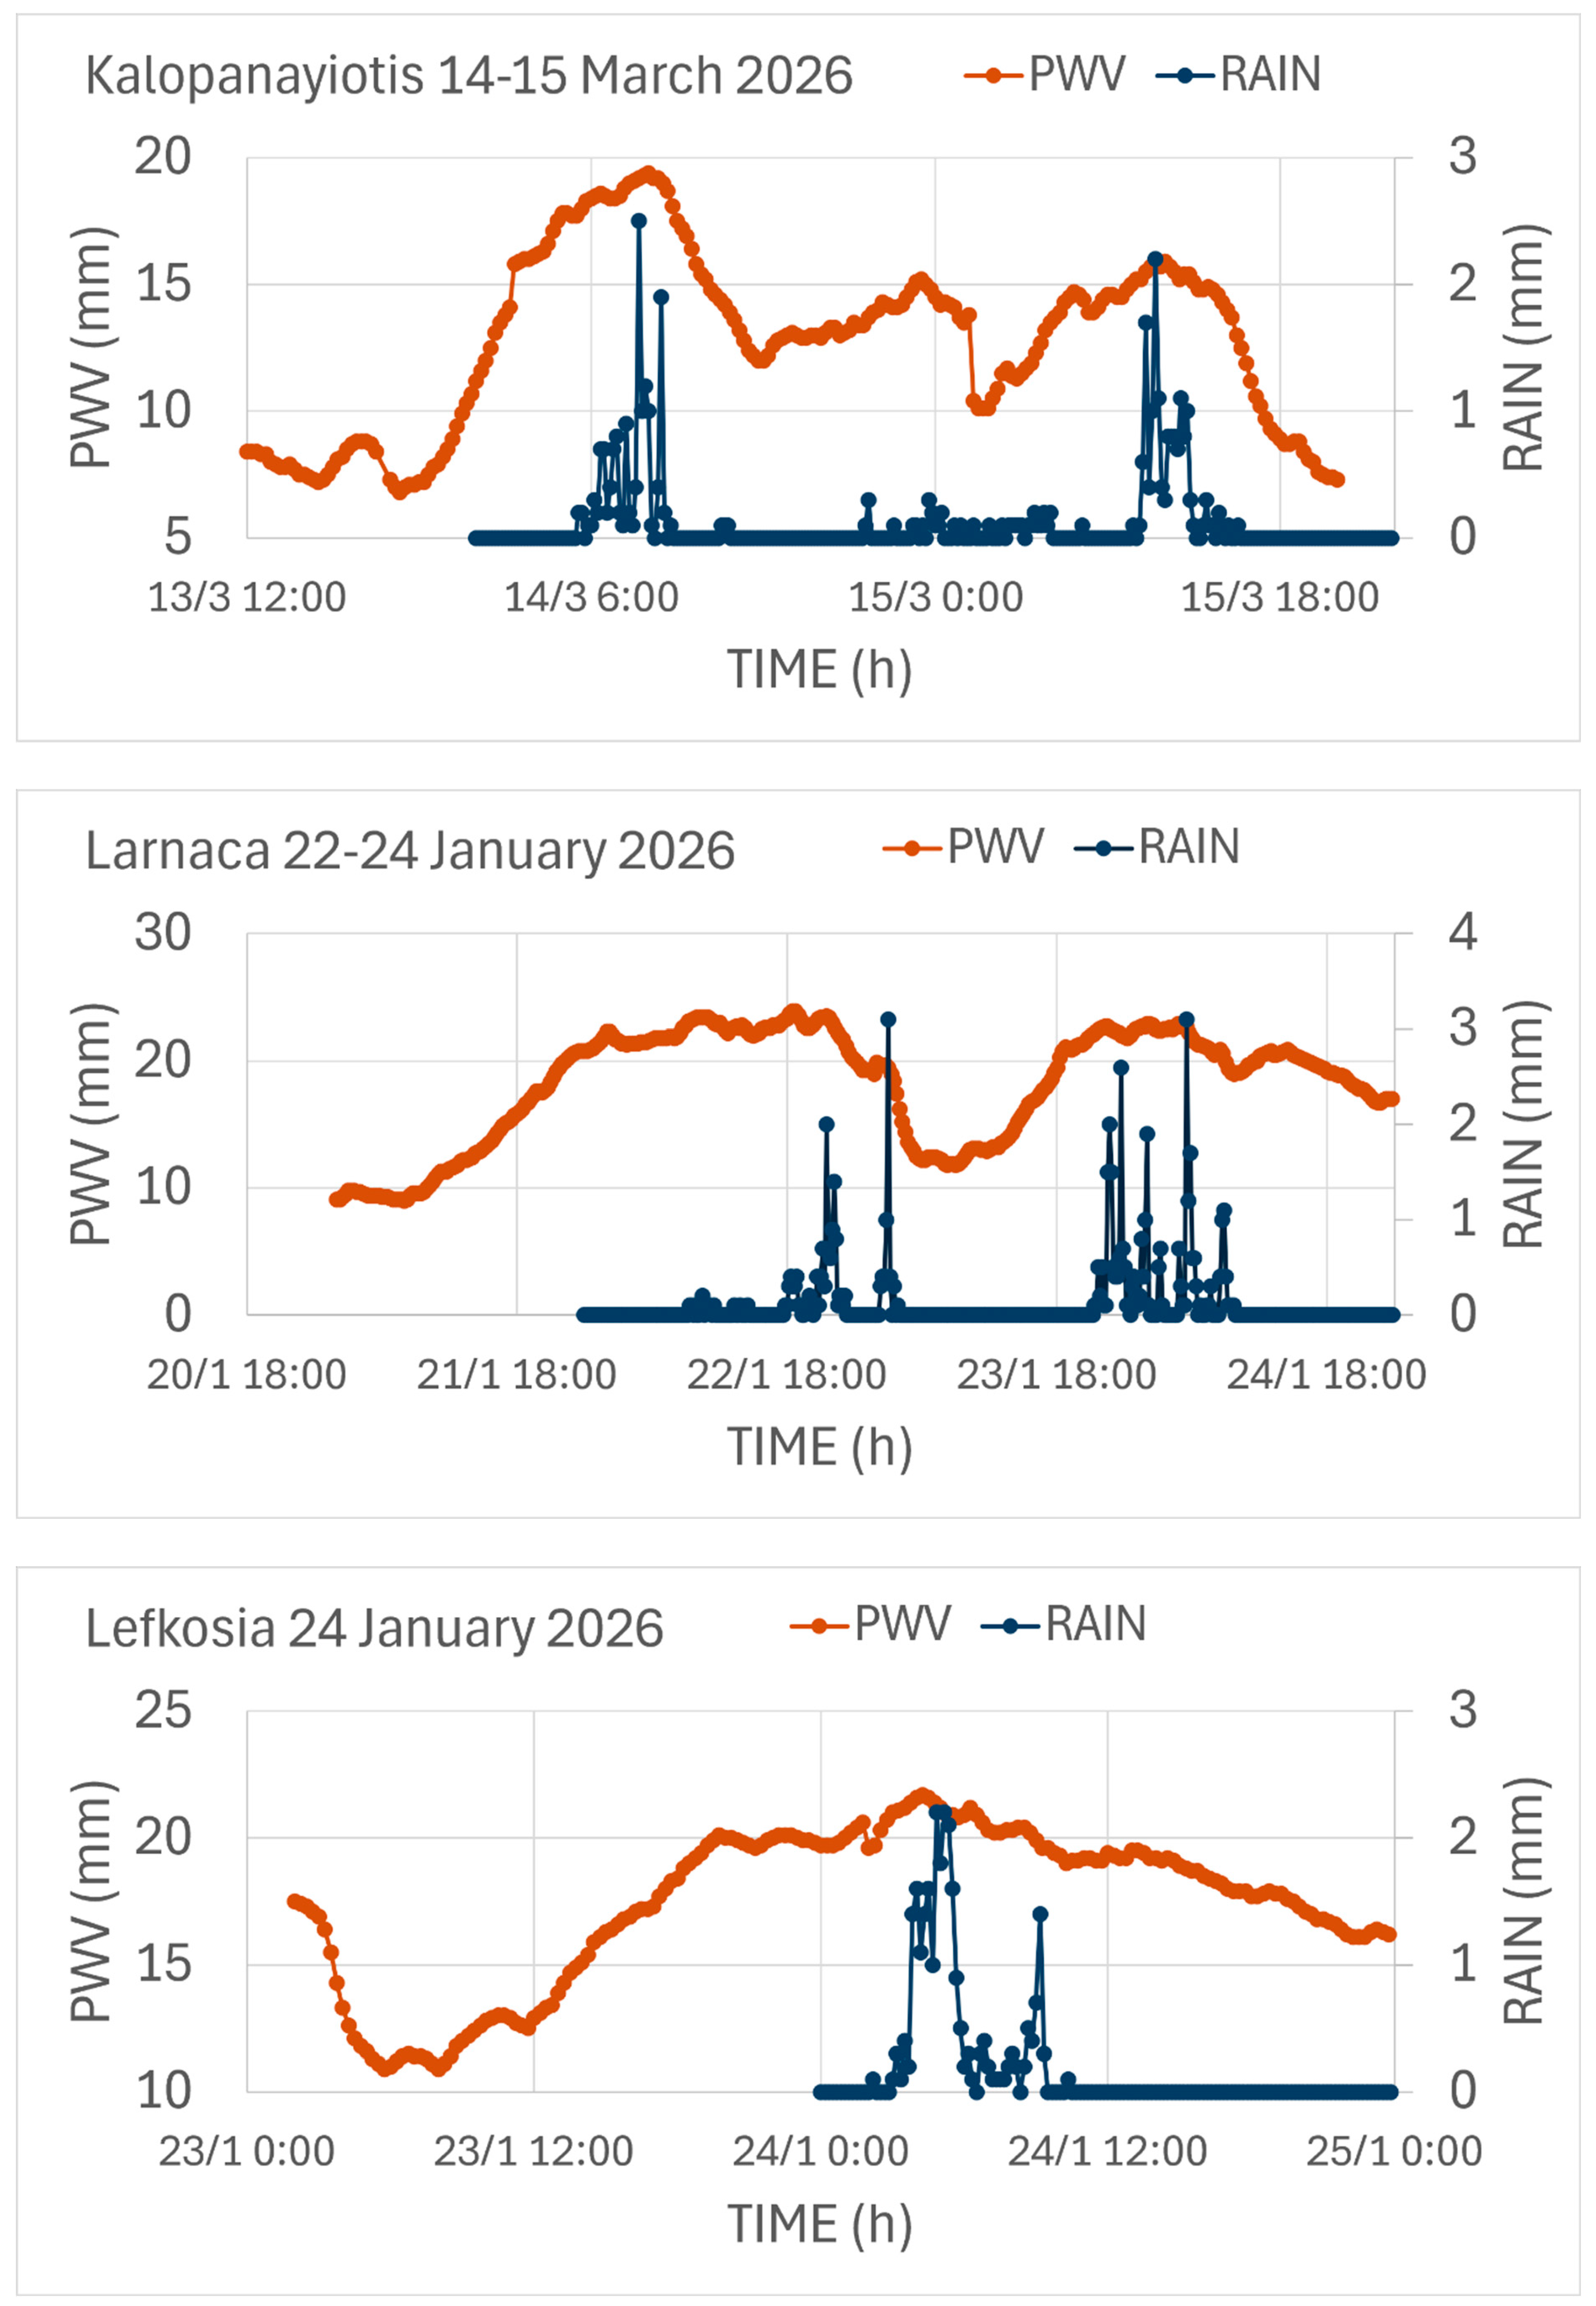
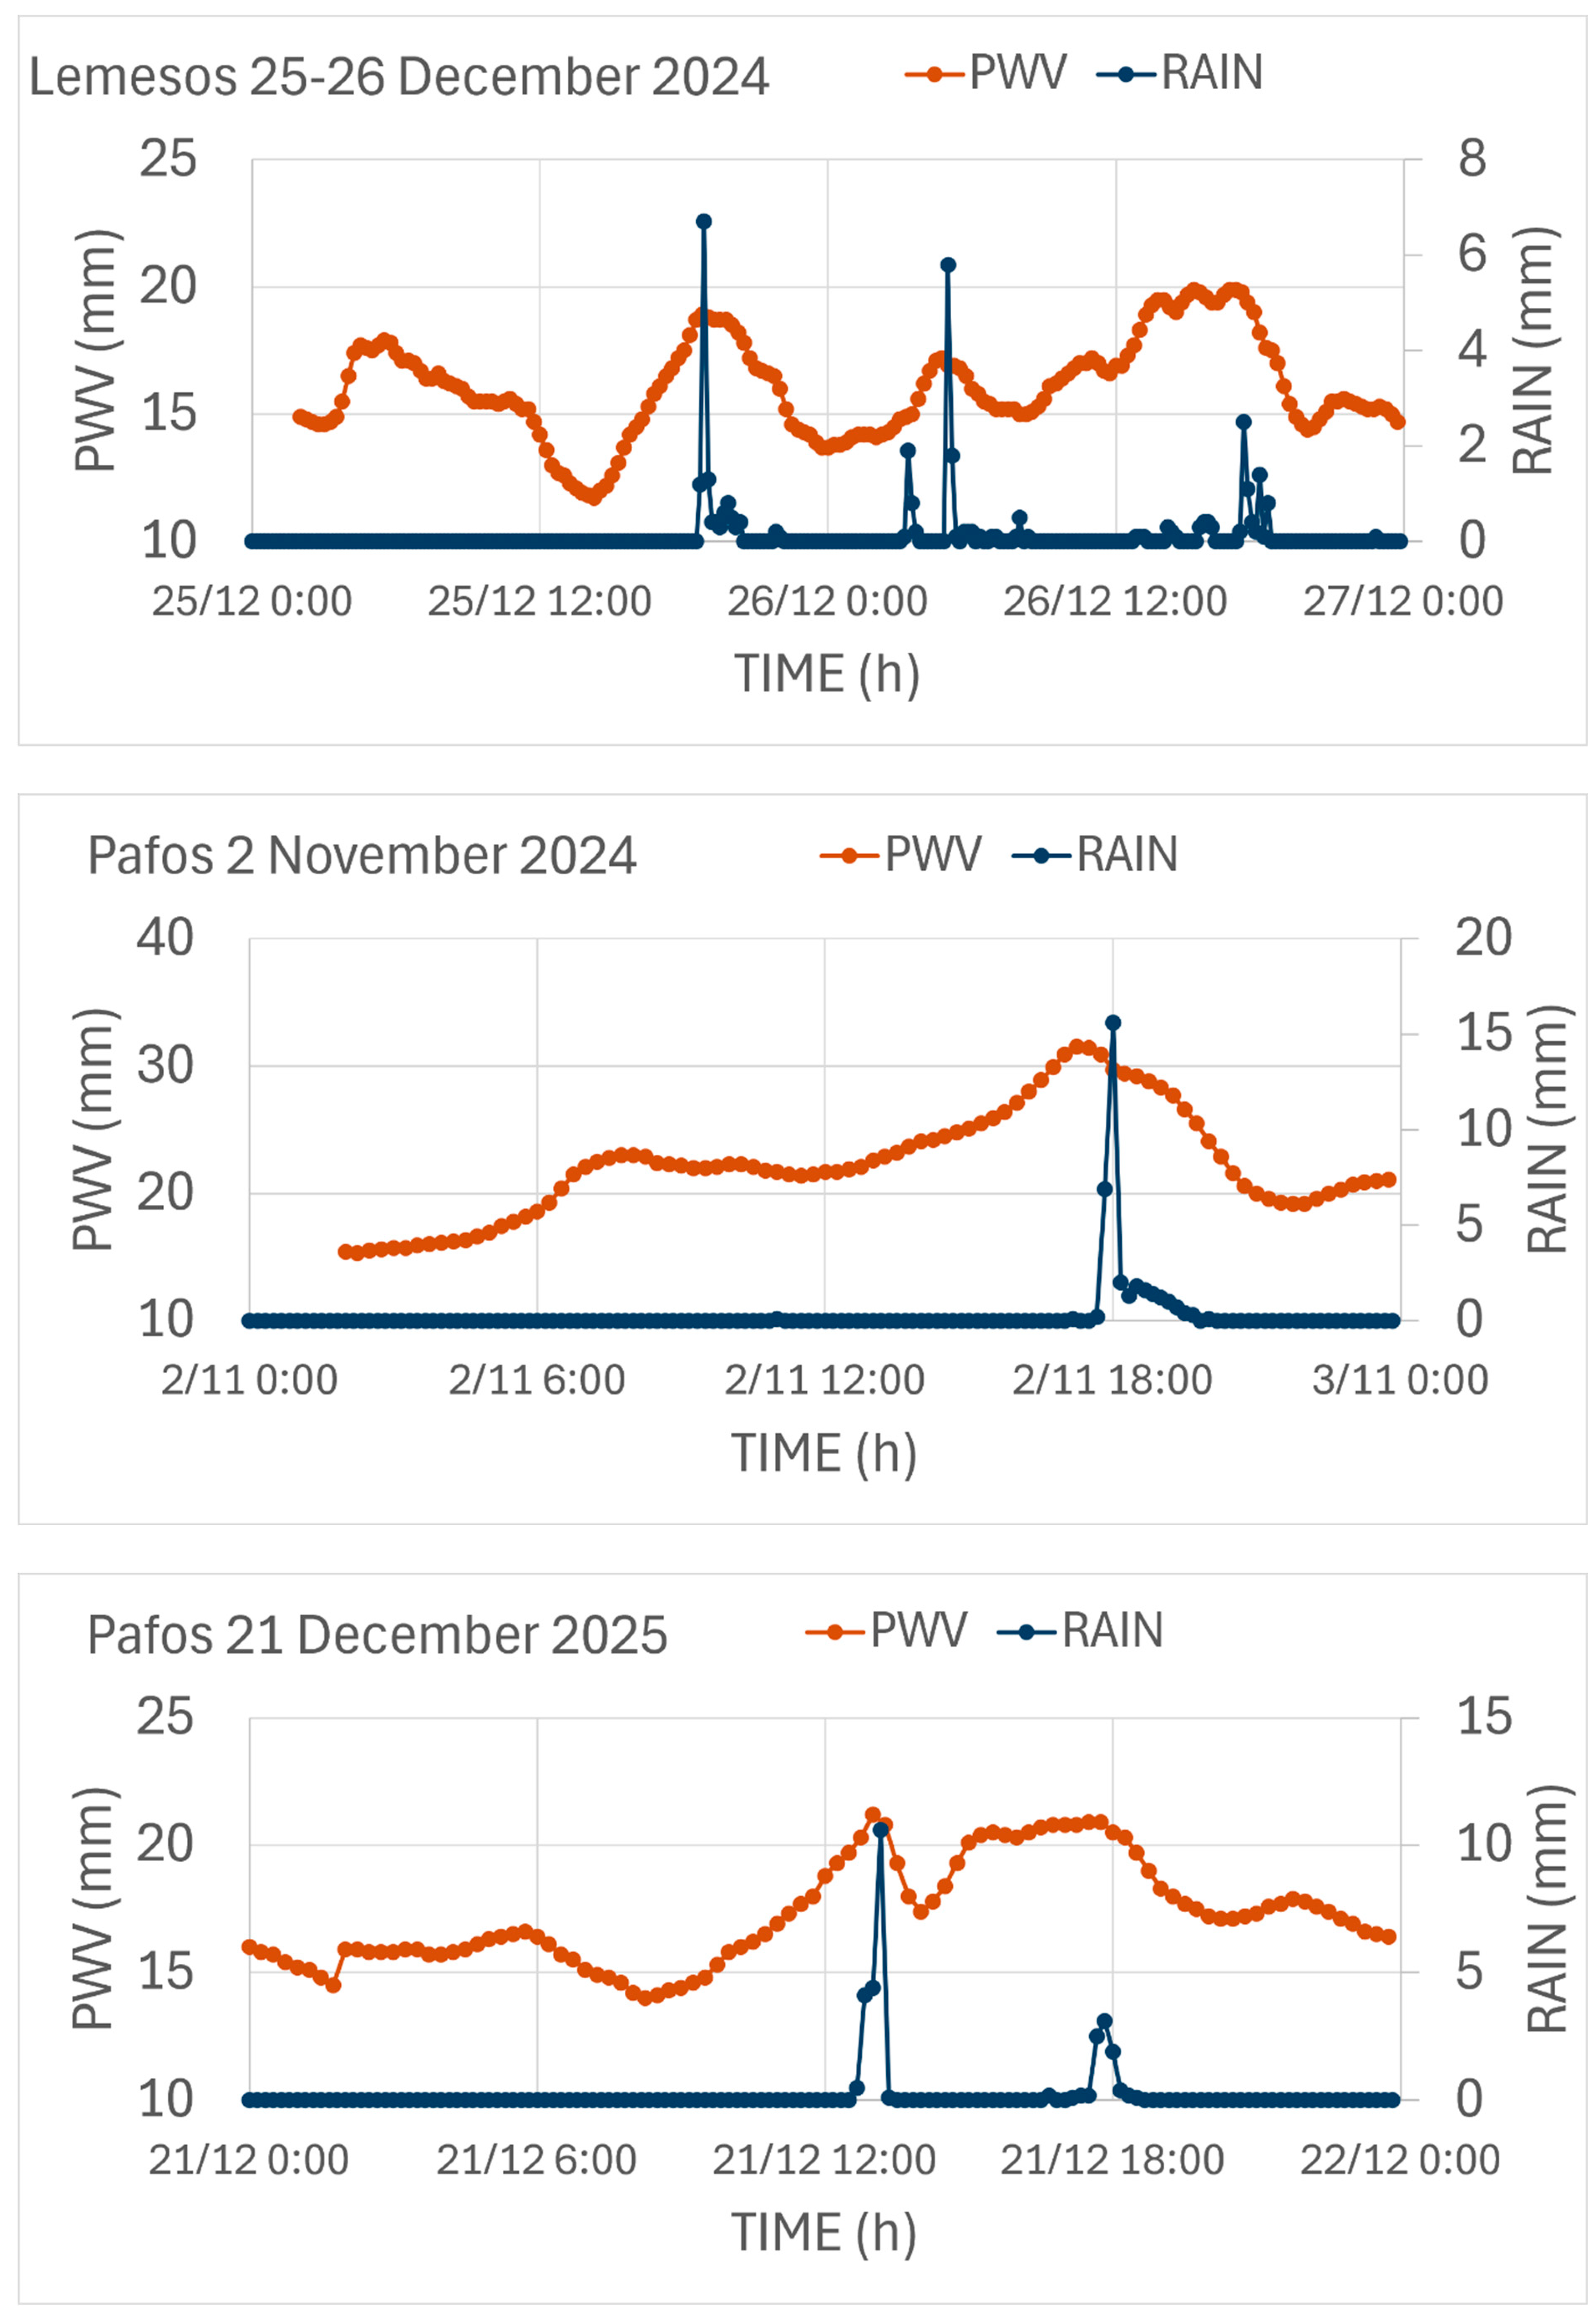
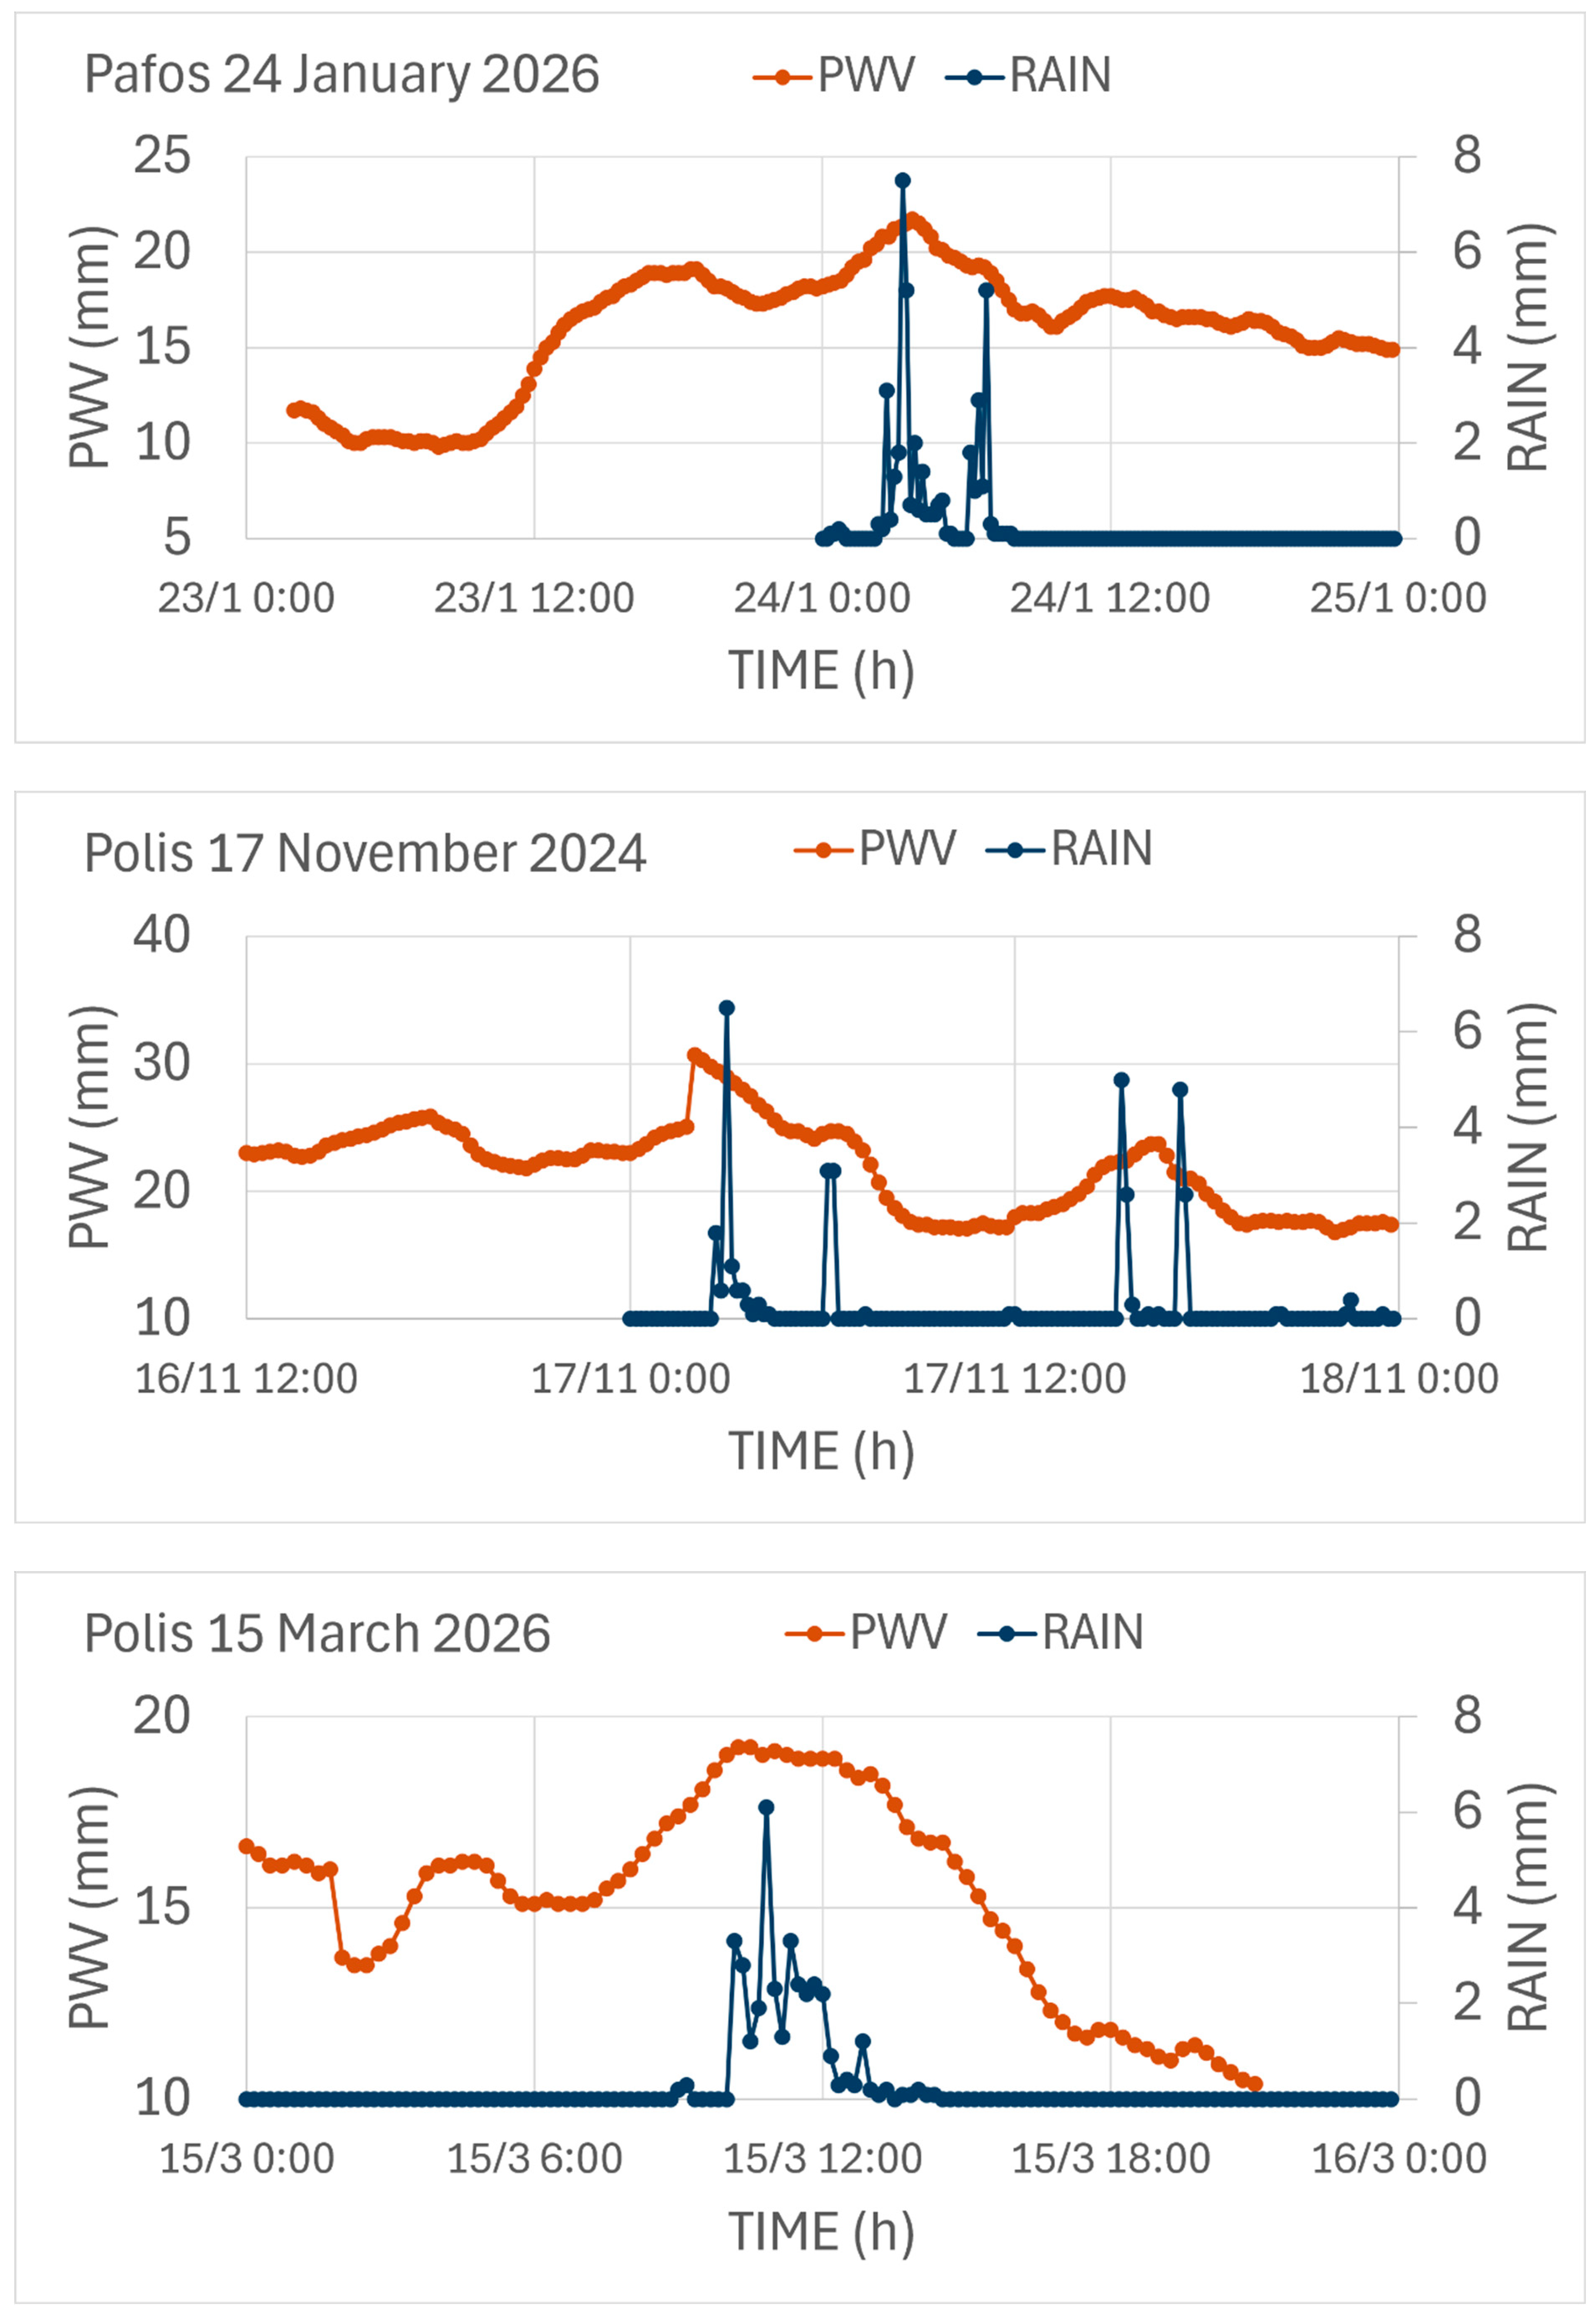
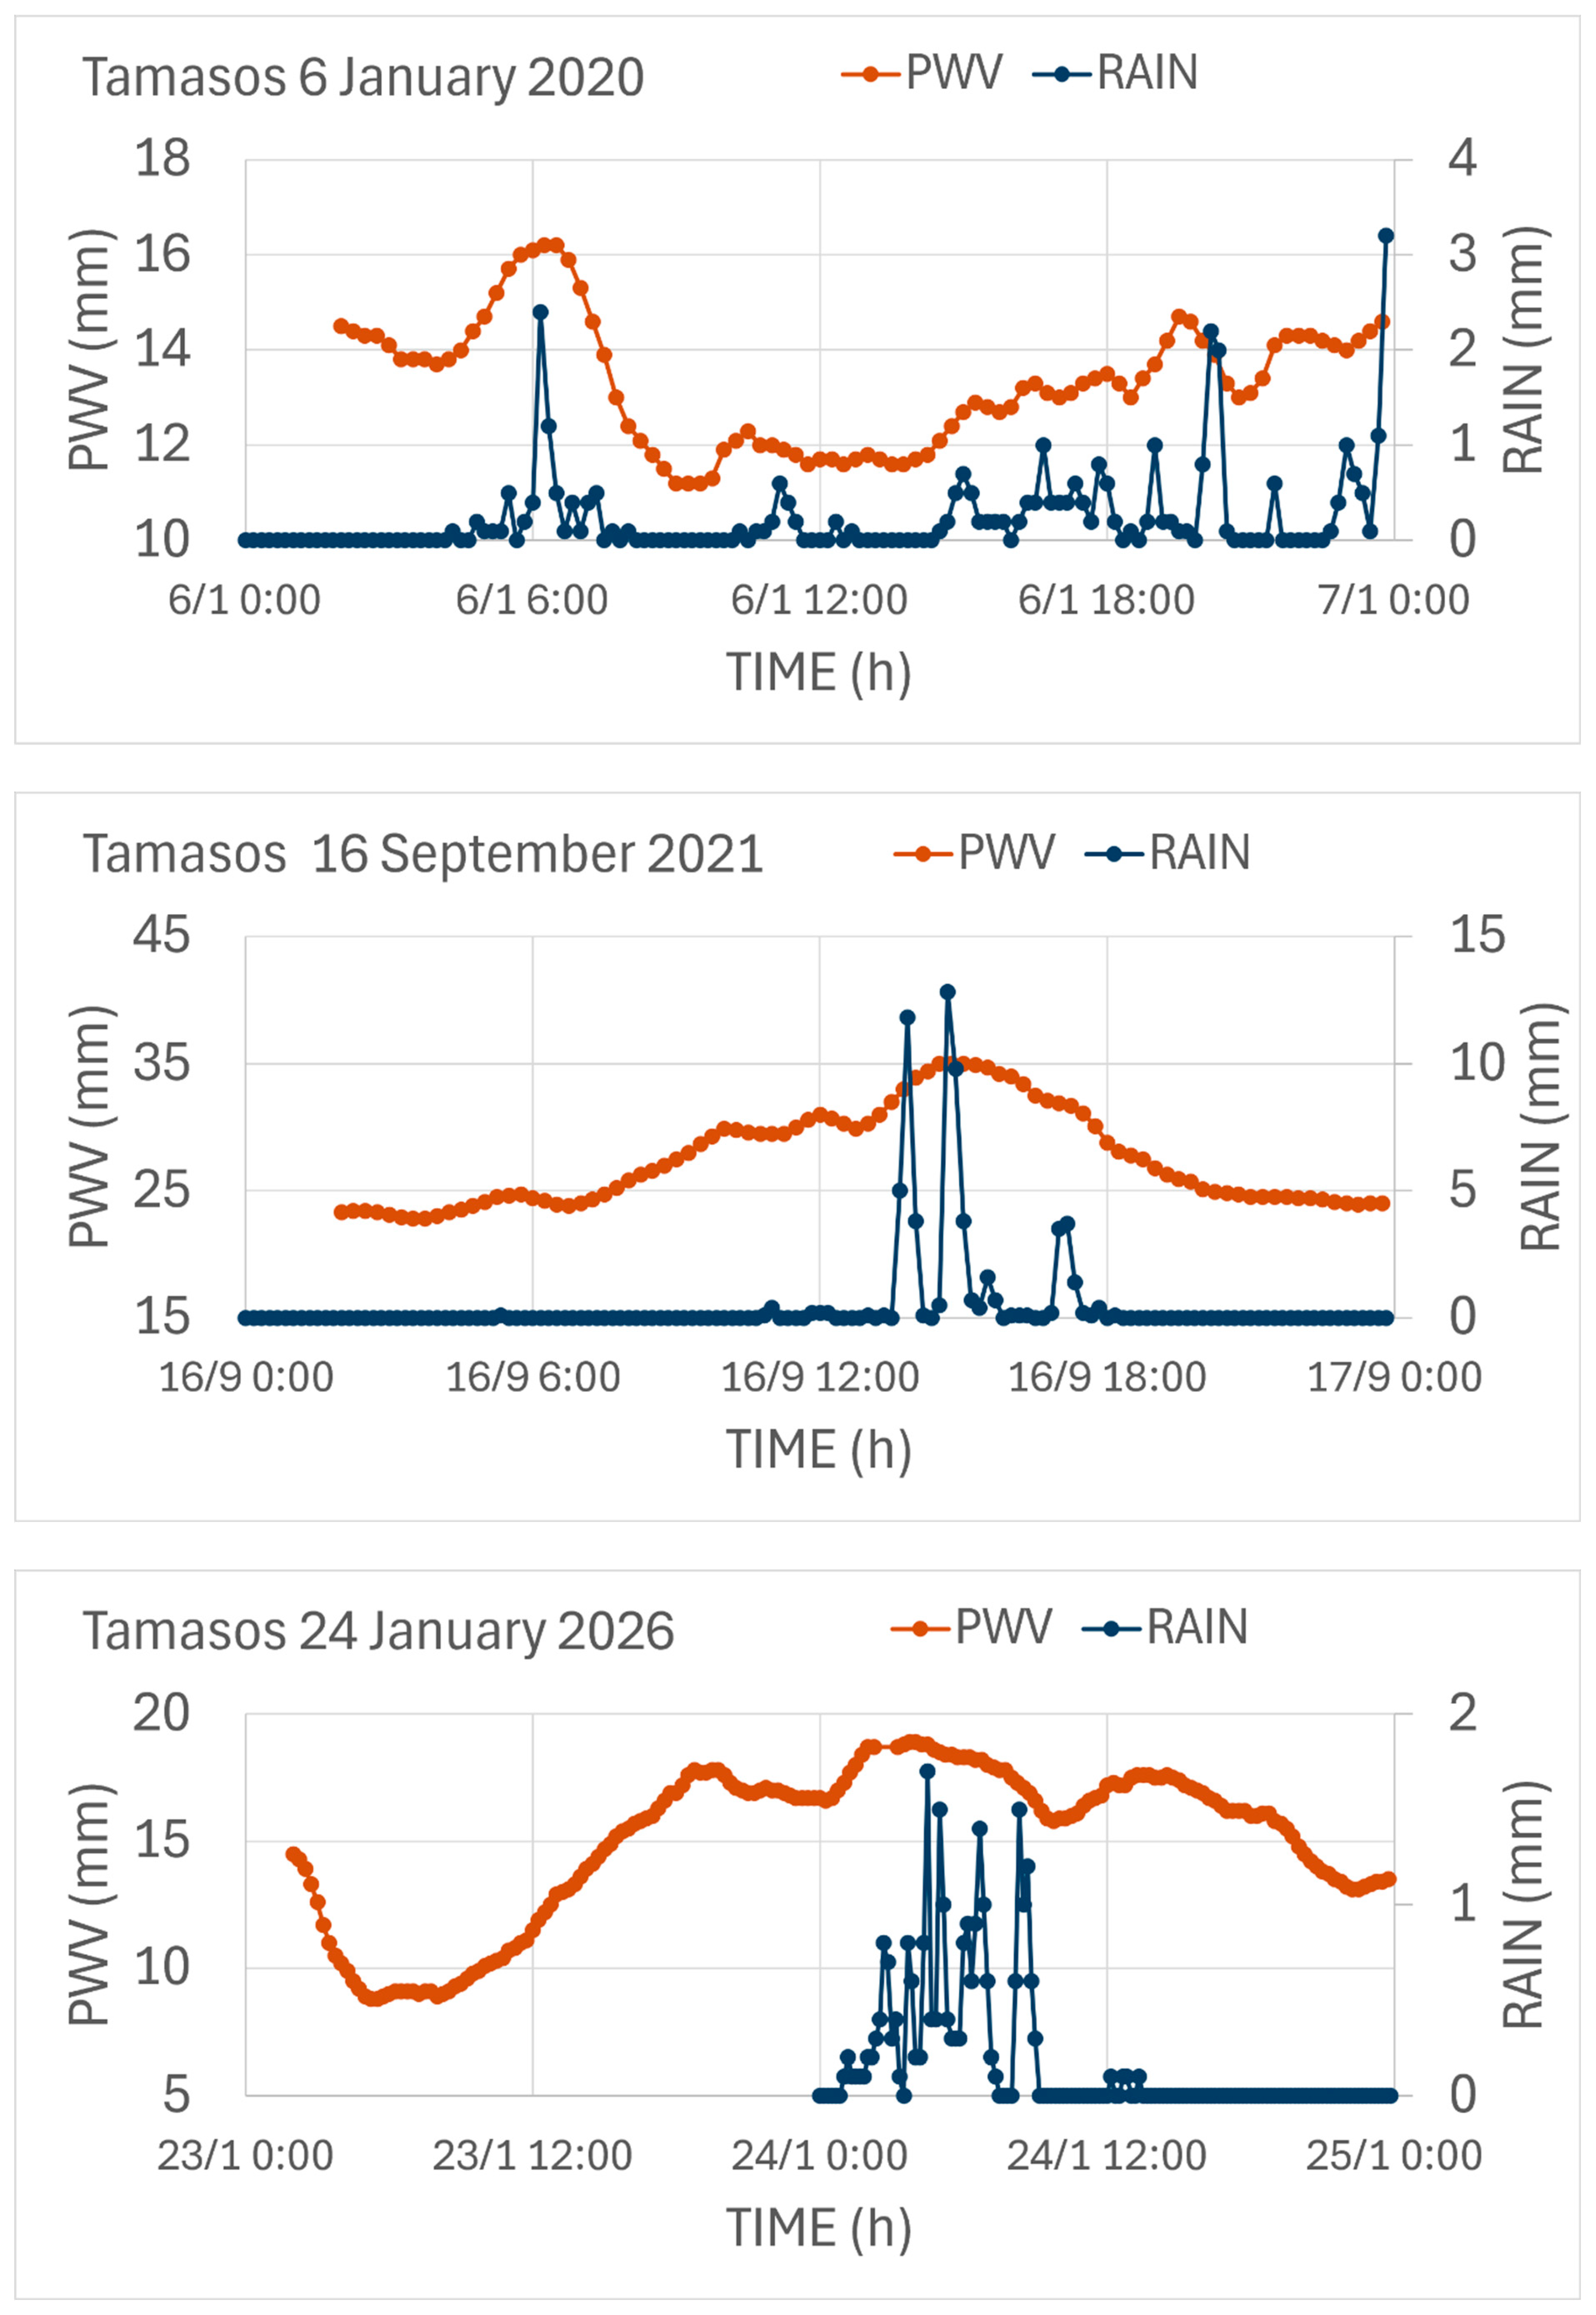
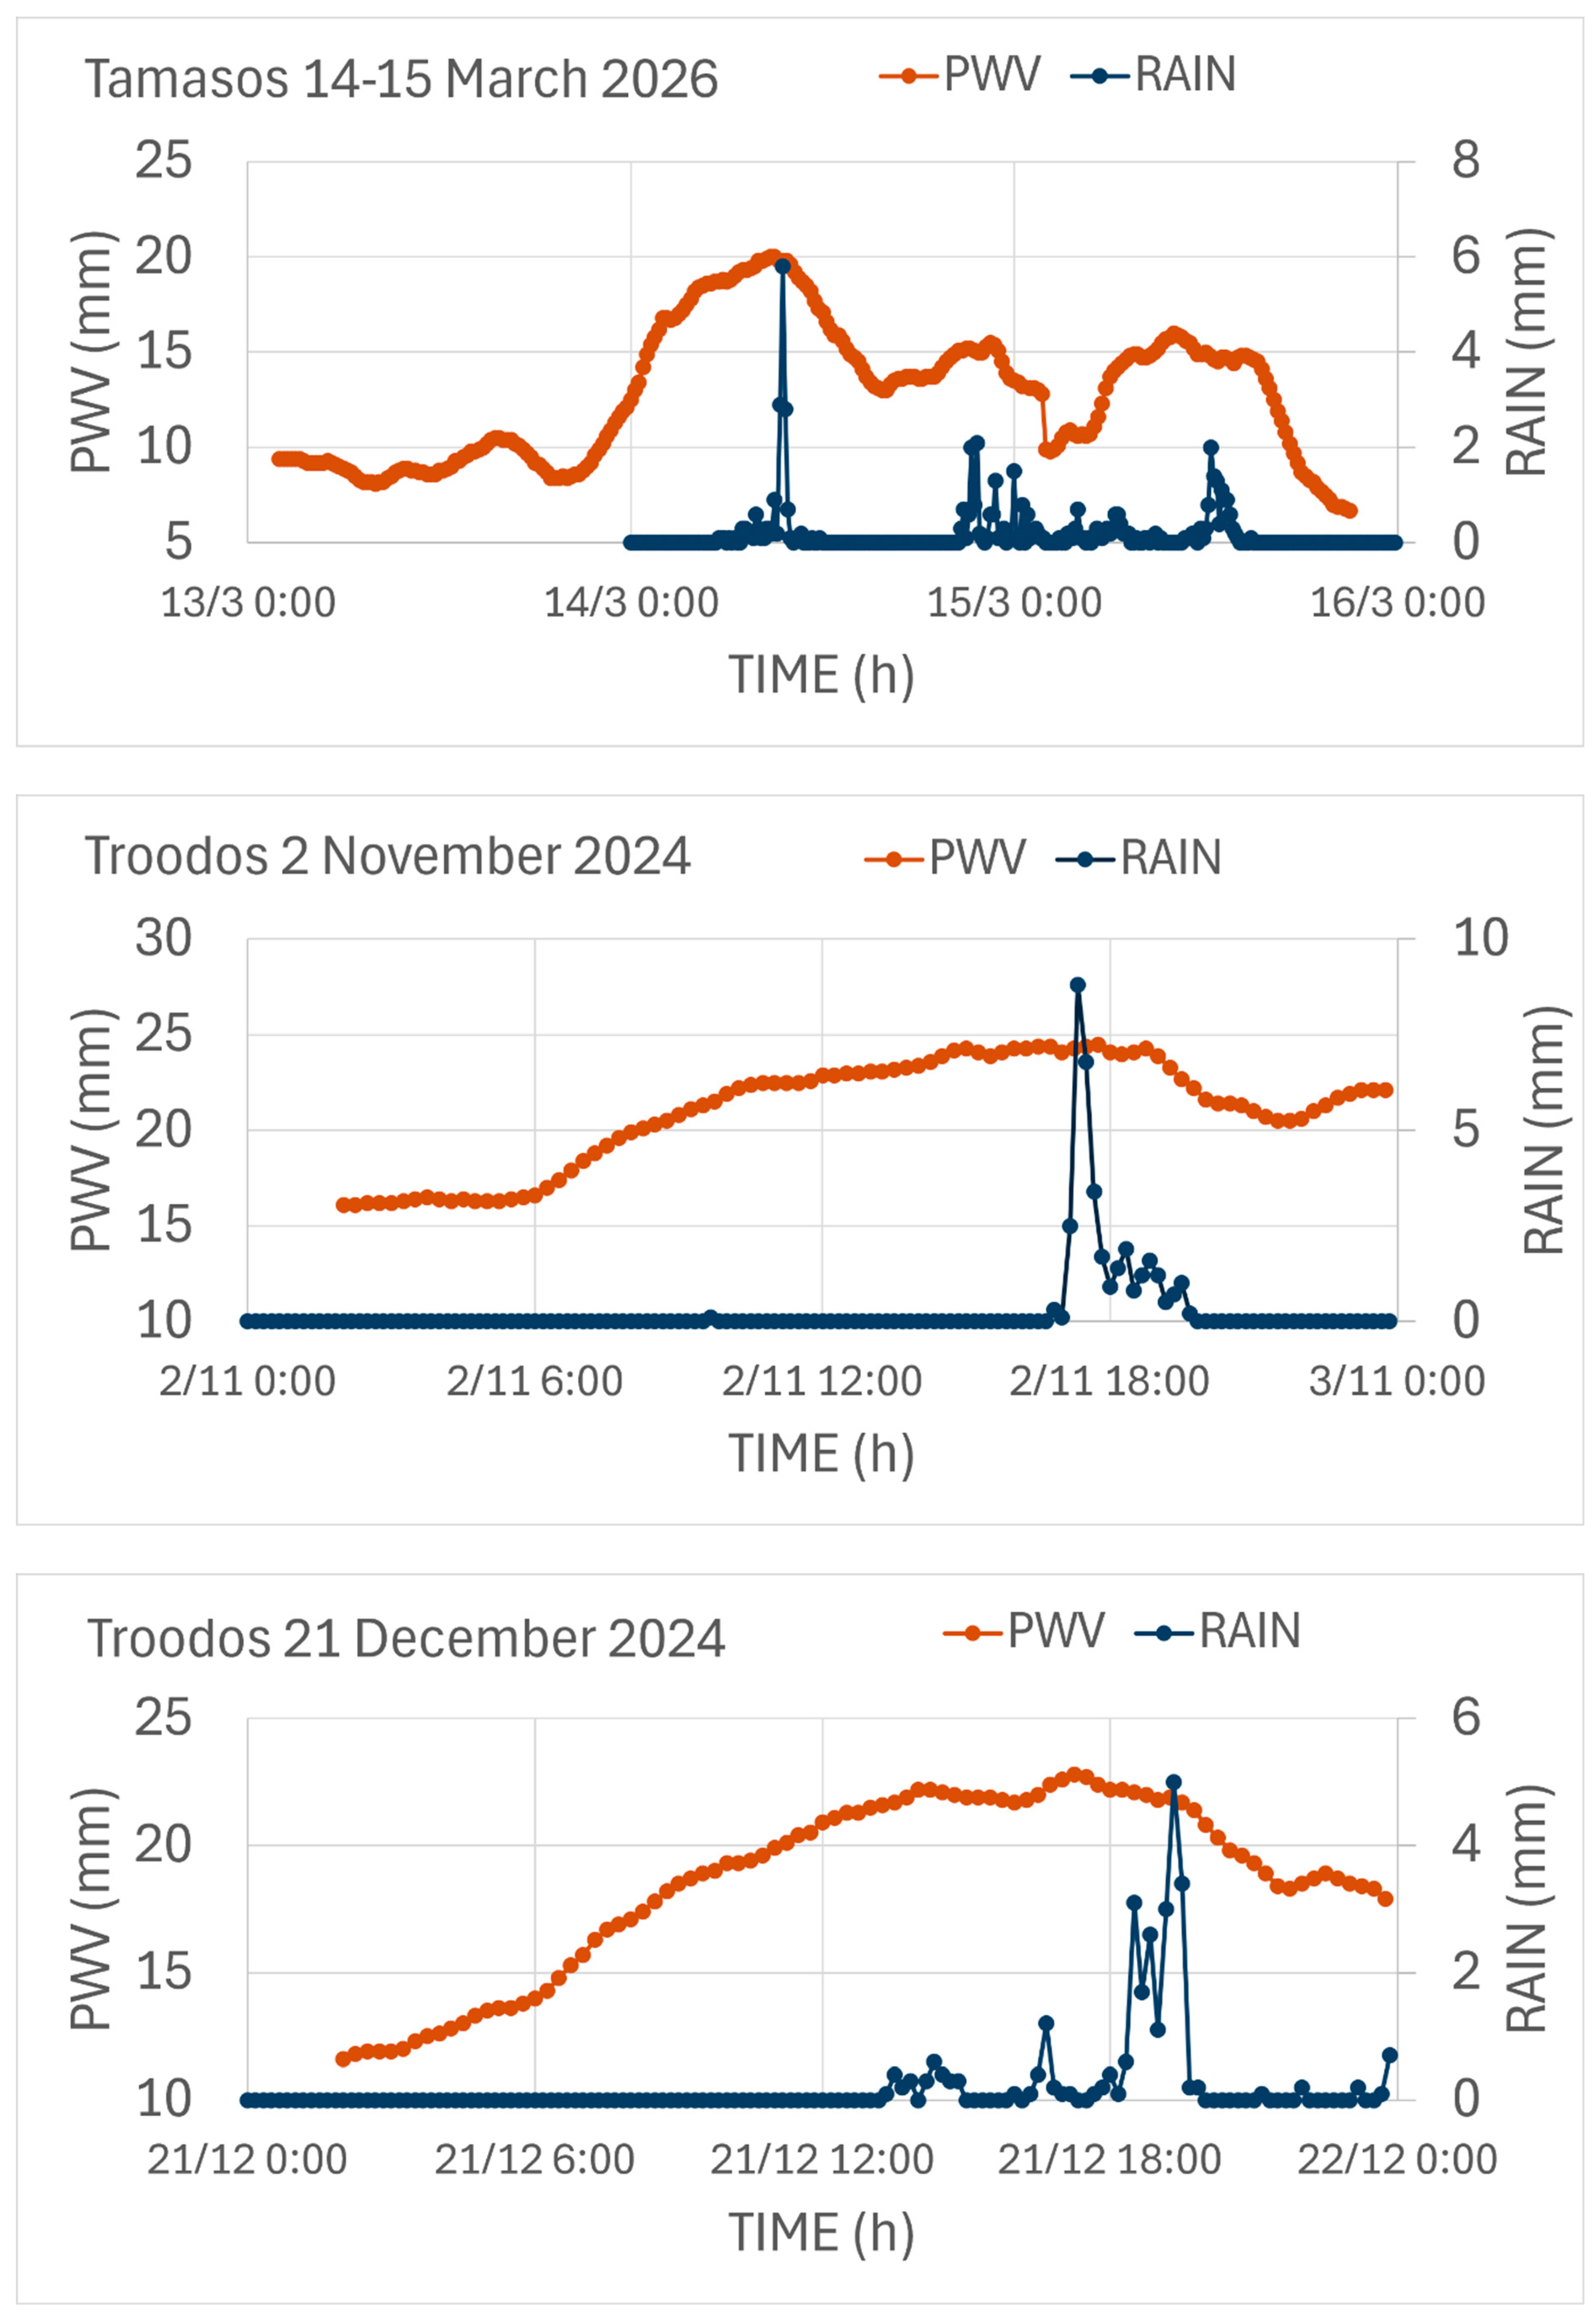
Representative GNSS-PWV and rainfall time series of flash, short and long rain events are presented in Figure 3, while the complete set of event time series is provided in the Appendix. Despite the considerable variability in rainfall characteristics, all analysed events exhibited a common temporal pattern characterized by a progressive increase in PWV prior to rainfall onset, followed by abatement shortly after rain begun in most of the events. The consistent pre-rainfall increase in PWV observed across all analysed events confirms that GNSS-derived atmospheric water vapour captures the moisture evolution preceding heavy precipitation over Cyprus. This behaviour is consistent with previous GNSS-PWV studies showing that precipitation is commonly preceded by a systematic increase in PWV across a wide range of climatic environments [18,19,20,31,32].
Although all events exhibited a similar pre-rainfall PWV evolution, the temporal characteristics of atmospheric moistening varied considerably. High-intensity, short-duration events were generally associated with higher PWV build-up rates, whereas prolonged rainfall events developed following a slower and more gradual increase in PWV. These contrasting moisture evolution patterns suggest that the dynamics of atmospheric moisture transport differ substantially among storm types. Rapid increases in PWV are likely associated with strong low-level moisture convergence, enhanced moisture advection from the surrounding Mediterranean Sea, and increasing convective instability, whereas gradual PWV increases probably reflect weaker but more persistent large-scale moisture transport associated with stratiform or frontal precipitation systems [4].
A notable feature of the analysed events was the close temporal correspondence between PWV_peak and rainfall onset. As summarized in Table 3, 27 events (90%) exhibited a time lag between 0 and 2 h, indicating that maximum atmospheric moisture was generally reached almost simultaneously with precipitation onset. Only one event showed a lag between 3 and 6 h, while two long-duration events exhibited delays exceeding 6 h. This distribution demonstrates that maximum atmospheric moisture is generally attained immediately before or shortly after precipitation begins, indicating a strong temporal coupling between moisture accumulation and rainfall initiation. Similar behaviour has been reported in previous GNSS-PWV studies, where peak atmospheric moisture frequently occurs within a few hours of heavy precipitation [17,20,21,22]. The three events exhibiting substantially longer PWV–rainfall lags were all characterized by prolonged precipitation lasting between 8 and 45 hours.
A further observation of the analysed events was that despite producing similar precipitation totals, several events exhibited markedly different patterns of pre-rainfall PWV evolution. Short-lived high intensity events generally exhibited higher PWV build-up rates, whereas long-duration events achieved comparable rainfall totals through slower PWV increases combined with sustained precipitation over many hours. From a physical perspective, PWV_peak represents the maximum amount of integrated atmospheric water vapour available immediately before rainfall development, whereas ΔPWV/Δt characterizes the efficiency with which moisture accumulates within the atmospheric column. The latter therefore provides information on the dynamics of moisture transport and convergence rather than simply the atmospheric moisture state. This distinction forms the central hypothesis of the present study: namely, that the dynamics of atmospheric moistening may provide a more informative descriptor of subsequent rainfall intensity than the magnitude of the atmospheric moisture content alone. The following sections evaluate this hypothesis quantitatively using correlation, regression, and multivariate statistical analyses.
3.2. Relationships Between PWV Dynamics and Rainfall Characteristics
The relationships between the GNSS-derived atmospheric moisture metrics and the rainfall characteristics were evaluated using Pearson correlation and simple linear regression analyses. The PWV growth rate (ΔPWV/Δt) and the peak precipitable water vapour PWV_peak were examined against peak rainfall intensity, total rainfall accumulation, rainfall duration, and the time lag between PWV_peak and rainfall onset. The complete statistical results are summarized in Table 4, while the statistically significant linear relationships are presented in Figure 4, Figure 5, Figure 6 and Figure 7.
The strongest correlation was identified between the PWV growth rate (ΔPWV/Δt) and peak rainfall intensity (R = 0.73, p < 0.00001), with a coefficient of determination of R2 = 0.54 (Figure 4). The corresponding regression analysis reveals a clear positive linear relationship, indicating that events characterized by rapid atmospheric moisture accumulation generally produced more intense rainfall. More than half of the observed variability in peak rainfall intensity is explained by the variability in the pre-rainfall PWV growth rate, highlighting the strong statistical association of atmospheric moistening dynamics on peak rainfall intensity. Events exhibiting rapid PWV buildup generally produced higher rainfall peaks, suggesting that fast atmospheric moisture accumulation is closely related to the development of intense precipitation bursts. These results support the interpretation that rapid PWV growth is characteristic of convective precipitation systems, where strong upward motion and rapid moisture convergence lead to intense rainfall generation [18,19,33].
A statistically significant positive relationship was also identified between ΔPWV/Δt and PWV_peak (R = 0.64, p = 0.00015; R2 = 0.41; Figure 5). Although events with higher pre-rainfall PWV accumulation rates generally reached higher PWV values before rainfall initiation, the relationship remained only moderate. This indicates that high atmospheric moisture content can be reached through different moisture evolution pathways, including either rapid moisture accumulation over a short period or more gradual moistening over several hours. Consequently, PWV_peak alone does not fully describe the temporal evolution of atmospheric moisture preceding rainfall.
Peak atmospheric moisture was likewise positively correlated with peak rainfall intensity (R = 0.58, p = 0.00072), confirming that larger atmospheric water vapour reservoirs generally favour the development of more intense precipitation. However, this relationship was substantially weaker than that obtained using ΔPWV/Δt (Figure 6). This difference suggests that rainfall intensity is influenced not only by the amount of moisture available immediately before precipitation, but also by the rate at which moisture is supplied to the atmospheric column during storm development. Previous GNSS-PWV studies have primarily associated heavy rainfall with elevated PWV values or PWV thresholds [18,19,21,32]. The present results indicate that incorporating the temporal rate of PWV provides a more complete description of rainfall intensity than considering PWV_peak alone.
The only other statistically significant relationship was identified between PWV_peak and rainfall duration (R = –0.39, p = 0.031; R2 = 0.15; Figure 7). The negative correlation indicates that higher PWV_peak values were generally associated with shorter rainfall events. One possible explanation is that rapidly developing convective storms efficiently convert the available atmospheric moisture into intense precipitation over relatively short periods, whereas longer-duration rainfall events are more strongly influenced by sustained moisture transport and large-scale forcing than by the initial atmospheric moisture content alone. Since the present study does not explicitly examine storm dynamics or synoptic evolution, this interpretation should be regarded as a physically plausible explanation rather than a demonstrated mechanism. This interpretation is also consistent with the temporal evolution of the long-duration events described in Section 3.1. In the three events exhibiting the largest PWV–rainfall lags, PWV_peak occurred several hours before rainfall cessation, indicating that precipitation persisted well beyond the period of maximum atmospheric water vapour. This behaviour suggests that the duration of these events cannot be explained solely by the initial atmospheric moisture conditions but likely reflects the continued influence of large-scale dynamical forcing and sustained moisture transport, processes commonly associated with long-duration Mediterranean precipitation events [4]. However, confirming these mechanisms would require complementary analyses of the synoptic environment, which are beyond the scope of the present study.
Beyond the relationships described above, neither the PWV growth rate nor PWV_peak exhibited statistically significantly correlation with total rainfall accumulation or the time lag before rainfall onset (p > 0.05). This indicates that pre-rainfall moisture conditions alone cannot predict total precipitation or its timing. Instead, total accumulation also depends on rain duration, propagation speed, wind and ongoing moisture convergence [34,35]. Similarly, the timing of PWV_peak prior to rainfall initiation is likely driven by the evolution of the weather system rather than ambient moisture levels alone.
Overall, the statistical analyses indicate that the PWV build-up rate is more strongly associated with peak rainfall intensity than the peak atmospheric moisture content immediately preceding rainfall. Among all examined relationships, ΔPWV/Δt exhibited the strongest correlation with rainfall intensity and the highest explanatory capability, whereas PWV_peak showed weaker relationships with rainfall intensity and only limited associations with the remaining rainfall characteristics. These findings support the hypothesis introduced in Section 3.1 that the rate of atmospheric moistening prior to rainfall provides a more informative description of heavy rainfall development than the maximum atmospheric moisture content alone. The extent to which both atmospheric moisture metrics jointly contribute to explaining rainfall intensity is examined in the following section using multiple linear regression.
3.3. Comparative Contribution of PWV Growth Rate and PWV_Peak to Rainfall Intensity
The correlation analyses presented in Section 3.2 demonstrated that both PWV_peak and the pre-rainfall PWV growth rate (ΔPWV/Δt) were significantly associated with peak rainfall intensity. To further investigate their combined relationship with rainfall intensity, a multiple linear regression model was developed using both atmospheric moisture metrics as explanatory variables. This analysis allows the contribution of each variable to be evaluated while both are included in the same statistical model, thereby assessing which atmospheric moisture metric exhibits the stronger statistical association with rainfall intensity.
The regression model was statistically significant (p < 0.001) and explained approximately 53% of the observed variability in peak rainfall intensity (adjusted R2 = 0.53). The standardized regression coefficients (Table 5) showed that ΔPWV/Δt remained a highly significant explanatory variable (β = 0.61, p = 0.001), whereas PWV_peak did not contribute significantly to the model (β = 0.19, p = 0.251). These results indicate that, when both atmospheric moisture metrics are considered simultaneously, only the pre-rainfall PWV growth rate remains significantly associated with peak rainfall intensity. Multicollinearity diagnostics (Tolerance = 0.59; VIF = 1.70) indicate low collinearity between predictors, suggesting that coefficient estimates are not materially inflated by shared variance, confirming the reliability of the regression coefficients. The multiple regression analysis extends the correlation results by demonstrating that the stronger relationship between ΔPWV/Δt and rainfall intensity is maintained even when PWV_peak is included in the same statistical model. This finding indicates that the temporal evolution of atmospheric moisture prior to rainfall onset provides a stronger statistical description of rainfall intensity than the magnitude of the peak atmospheric moisture content alone.
The stronger association of ΔPWV/Δt with rainfall intensity is physically plausible because the variable characterizes both the magnitude of atmospheric moisture increase and the timescale over which that increase occurs. In contrast, PWV_peak represents only the final atmospheric moisture state immediately preceding rainfall. Consequently, events reaching similar PWV_peak values may exhibit markedly different rates of atmospheric moistening and produce substantially different rainfall intensities, as demonstrated by the event-scale analyses in Section 3.1. This suggests that the evolution of atmospheric moisture build-up prior to rainfall onset provides a more complete characterization of the pre-rainfall environment associated with peak rainfall intensity.
Previous GNSS meteorology studies have mainly focused on the relationship between the magnitude of GNSS-derived PWV and heavy precipitation occurrence [19,21,31,32,36,37]. The present results indicate that incorporating information on the temporal evolution of atmospheric moisture can improve the statistical characterization of rainfall intensity beyond that obtained from PWV_peak alone. To our knowledge, this is among the first studies to demonstrate, using GNSS-derived atmospheric water vapour observations, that the pre-rainfall PWV growth rate exhibits a stronger statistical association with subsequent rainfall intensity than the corresponding peak PWV value highlighting the value of complementing static moisture metrics toward dynamic, rate-based atmospheric moisture metrics for heavy rainfall characterization
These findings have potential implications for GNSS-based rainfall monitoring and nowcasting. While PWV_peak remains a useful indicator of atmospheric moisture availability, the results suggest that monitoring the rate of atmospheric moistening prior to rainfall onset may provide additional information for identifying events with the potential to produce high rainfall intensities. Further evaluation using larger datasets, different climatic regions and complementary meteorological observations will be necessary to determine the robustness and operational applicability of this approach.
4. Conclusions
The present study investigated the relationship between dynamic and static GNSS-derived precipitable water vapour (PWV) metrics and the characteristics of heavy rainfall events over Cyprus. The results demonstrate that the temporal evolution of atmospheric moisture prior to rainfall provides a more informative characterization of rainfall intensity than the maximum PWV value alone. Although both the pre-rainfall PWV growth rate (ΔPWV/Δt) and peak atmospheric moisture (PWV_peak) were associated with peak rainfall intensity, the PWV growth rate consistently exhibited the stronger relationship and remained the only significant atmospheric moisture metric when both variables were evaluated simultaneously. In contrast, neither atmospheric moisture metric showed a significant relationship with total rainfall accumulation or the timing of rainfall onset, indicating that these rainfall characteristics are influenced by additional atmospheric processes beyond the pre-rainfall moisture conditions.
These findings demonstrate the importance of considering not only the amount of atmospheric moisture available before precipitation but also how rapidly that moisture accumulates. Whereas PWV_peak describes the atmospheric moisture state immediately preceding rainfall, the PWV growth rate characterizes the dynamics of atmospheric moistening and therefore provides complementary information on the processes associated with intense precipitation. From a broader perspective, the results highlight the value of incorporating dynamic GNSS-derived atmospheric moisture metrics alongside conventional static PWV measurements for the characterization of heavy rainfall events. Such information may enhance GNSS-based severe weather monitoring and nowcasting by providing additional insight into pre-rainfall atmospheric moisture evolution. Future work should evaluate the robustness of these relationships using larger event datasets, different climatic regions and complementary meteorological observations.
Supplementary Materials
The following supporting information can be downloaded at: Supplementary materials.zip.
Author Contributions
Conceptualization, D.G. and C.O.; methodology, D.G.; validation, D.G.; formal analysis, D.G.; investigation, D.G. and C.O.; resources, C.O. and H.H; data curation, D.G and N.A.; writing—original draft preparation, D.G.; writing—review and editing, D.G., C.O. N.A., H.H.; supervision, H.H.; project administration, C.O.; funding acquisition, C.O, H.H. All authors have read and agreed to the published version of the manuscript.
Funding
This research is conducted within EURTISS project (Project Protocol Number: BRIDGE2HORIZON//0823E/0039) in the framework of the «RESTART 2016-2020» Programmes for Research, Technological Development and Innovation (RTDI) which is co-financed by the Republic of Cyprus and the European Regional Development Fund.
Data Availability Statement
The main data that support the findings of this study are available in the supplementary material. Any additional data are available from the authors upon reasonable request. Access may be granted under appropriate data-use conditions and in accordance with applicable intellectual property rights, confidentiality obligations, and restrictions arising from ongoing funded research projects.
Conflicts of Interest
The authors declare no conflicts of interest. Author Despina Giannadaki was employed by the company CLOUDWATER LTD. The remaining authors declare that the research was conducted in the absence of any commercial or financial relationships that could be construed as a potential conflict of interest.
Abbreviations
The following abbreviations are used in this manuscript:
| CY DoM | Cyprus Department of Meteorology |
| EuRTISS | Southeastern Europe Real-Time Severe Weather System |
| GNSS | Global Navigation Satellite System |
| GNSS-PWV | Global Navigation Satellite System-derived Precipitable Water Vapour |
| PWV | Precipitable Water Vapour |
| R | Pearson correlation coefficient |
| R2 | Coefficient of determination |
| RINEX | Receiver Independent Exchange Format |
| RTDI | Research, Technological Development and Innovation |
| VIF | Variance Inflation Factor |
| ZTD | Zenith Total Delay |
Appendix A
Figure A1.
GNSS-PWV and precipitation timeseries for all analyzed heavy and extreme rain events in 2020-2026.
Figure A1.
GNSS-PWV and precipitation timeseries for all analyzed heavy and extreme rain events in 2020-2026.
References
- Ali, E.W. Cramer, J. Carnicer, E. Georgopoulou, N.J.M. Hilmi, G. Le Cozannet, and P. Lionello, 2022: Cross-Chapter Paper 4: Mediterranean Region. In Climate Change 2022: Impacts, Adaptation and Vulnerability. Contribution of Working Group II to the Sixth Assessment Report of the Intergovernmental Panel on Climate Change; Pörtner, H.-O., Roberts, D.C., Tignor, M., Poloczanska, E.S., Mintenbeck, K., Alegría, A., Craig, M., Langsdorf, S., Löschke, S., Möller, V., Okem, A., Rama, B., Eds.; Cambridge University Press: Cambridge, UK and New York, NY, USA; pp. 2233–2272. [CrossRef]
- Llasat, M. C.; Llasat-Botija, M.; Prat, M. A.; Porcú, F.; Price, C.; Mugnai, A.; Lagouvardos, K.; Kotroni, V.; Katsanos, D.; Michaelides, S.; Yair, Y.; Savvidou, K.; Nicolaides, K. High-impact floods and flash floods in Mediterranean countries: the FLASH preliminary database. Adv. Geosci. 23, 47–55. [CrossRef]
- Hochman, A.; Marra, F.; Messori, G.; Pinto, J. G.; Raveh-Rubin, S.; Yosef, Y.; Zittis, G. Extreme weather and societal impacts in the eastern Mediterranean. Earth Syst. Dynam. 13, 749–777. [CrossRef]
- Dayan, U.; Nissen, K.; Ulbrich, U. Review Article: Atmospheric conditions inducing extreme precipitation over the eastern and western Mediterranean. Nat. Hazards Earth Syst. Sci. 15, 2525–2544. [CrossRef]
- Sherwood, S. C.; Roca, R.; Weckwerth, T. M.; Andronova, N. G. Tropospheric water vapor, convection, and climate. Rev. Geophys. 2010, 48, RG2001. [Google Scholar] [CrossRef]
- Trenberth, K.E.; Dai, A.; Rasmussen, R.M.; Parsons, D.B. The Changing Character of Precipitation. Bull. Am. Meteorol. Soc. 2003, 84, 1205–1218. [Google Scholar] [CrossRef]
- Huang, L.; Mo, Z.; Xie, S.; et al. Spatiotemporal characteristics of GNSS-derived precipitable water vapor during heavy rainfall events in Guilin, China. Satell. Navig. 2 2021, 13. [Google Scholar] [CrossRef]
- Hu, H.; Yang, R.; Lee, W.; Cao, Y.; Mao, J.; Gao, L. Multi-sensor study of precipitable water vapor and atmospheric profiling from microwave radiometer, GNSS/MET, radiosonde, and ECMWF reanalysis in Beijing. J. Appl. Rem. Sens. 2020, 14((4) 044514). [Google Scholar] [CrossRef]
- Renju, R.; Raju, C. Suresh; Mathew, N.; Antony, T.; KrishnaMoorthy, K. Microwave radiometer observations of interannual water vapor variability and vertical structure over a tropical station. J. Geophys. Res. Atmos. 2015, 120, 4585–4599. [Google Scholar] [CrossRef]
- Vaquero-Martínez, J.; Antón, M.; Ortiz de Galisteo, J.P.; Román, R.; Cachorro, V.E.; Mateos, D. Comparison of integrated water vapor from GNSS and radiosounding at four GRUAN stations. Sci. Total Environ. 2019, Volume 648, Pages 1639–1648. [Google Scholar] [CrossRef] [PubMed]
- Zhao, Q.; Yao, Y.; Yao, W.; Zhang, S. GNSS-derived PWV and comparison with radiosonde and ECMWF ERA-Interim data over mainland China. J. Atmos. Sol.-Terr. Phys. 2019, Volume 182, Pages 85–92. [Google Scholar] [CrossRef]
- Zhang, Qin; Ye, Junhua; Zhang, Shuangcheng; Han, Fei. Precipitable Water Vapor Retrieval and Analysis by Multiple Data Sources: Ground-Based GNSS, Radio Occultation, Radiosonde, Microwave Satellite, and NWP Reanalysis Data. J. Sens. 2018, 2018, 3428303, 13 pages. [Google Scholar] [CrossRef]
- Guerova, G.; Jones, J.; Douša, J.; Dick, G.; de Haan, S.; Pottiaux, E.; Bock, O.; Pacione, R.; Elgered, G.; Vedel, H.; Bender, M. Review of the state of the art and future prospects of the ground-based GNSS meteorology in Europe. Atmos. Meas. Tech. 9, 5385–5406. [CrossRef]
- Xia, S.; Jin, S.; Jin, X. Estimation and Evaluation of Zenith Tropospheric Delay from Single and Multiple GNSS Observations. Remote Sens. 2023, 15, 5457. [Google Scholar] [CrossRef]
- Bevis, M.; Businger, S.; Chiswell, S.; Herring, T.A.; Anthes, R.; Rocken, C.; et al. GPS Meteorology: Mapping Zenith Wet Delays onto Precipitable Water. J. Appl. Meteorol. 1994, 33(3), 379–386. [Google Scholar] [CrossRef] [PubMed]
- Zhang, K.; Manning, T.; Wu, S.; Rohm, W.; Silcock, D.; Choy, S. Capturing the Signature of Severe Weather Events in Australia Using GPS Measurements. IEEE J. Sel. Top. Appl. Earth Obs. Remote Sen. 2015, 8, 1839–1847. [Google Scholar] [CrossRef]
- Barindelli, S.; Realini, E.; Venuti, G.; Fermi, A.; Gatti, A. Detection of water vapor time variations associated with heavy rain in northern Italy by geodetic and low-cost GNSS receivers. Earth Plan. Space 2018, 70, 28. [Google Scholar] [CrossRef]
- Sapucci, L.F.; Machado, L.; Menezes de Souza, E.; Campos, T. Global Positioning System precipitable water vapour (GPS-PWV) jumps before intense rain events: A potential application to nowcasting. Meteorol. Appl. 2018. [Google Scholar] [CrossRef]
- Li, H.; Wang, X.; Wu, S.; Zhang, K.; Chen, X.; Qiu, C.; et al. Development of an Improved Model for Prediction of Short-Term Heavy Precipitation Based on GNSS-Derived PWV. Remote Sens. 2020, 12, 4101. [Google Scholar] [CrossRef]
- Giannadaki, D.; Oikonomou, C.; Haralambous, H. Correlation of precipitable water vapor and heavy rainfall over Cyprus using GNSS sensors network. Front. Signal Process. 2025, 5, 1622256. [Google Scholar] [CrossRef]
- Ziarani, R.M.; Bookhagen, B.; Schmidt, T.; Wickert, J.; Torre, A.; Deng, Z.; et al. A Model for the Relationship between Rainfall, GNSS-Derived Integrated Water Vapour, and CAPE in the Eastern Central Andes. Remote Sens. 2021, 13(18), 3788. [Google Scholar] [CrossRef]
- Zhao, Q.; Liu, Y.; Ma, X.; Yao, W.; Yao, Y.; Li, X. An Improved Rainfall Forecasting Model Based on GNSS Observations. In IEEE Trans. Geosci. Remote Sens.; 2020. [Google Scholar]
- Bouttier, F.; Marchal, H. Probabilistic short-range forecasts of high-precipitation events: optimal decision thresholds and predictability limits. Nat. Hazards Earth Syst. Sci. 24, 2793–2816. [CrossRef]
- Oikonomou, C.; Karolos, I.A.; Bitharis, S.; Pikridas, C.; Haralambous, H. Performance of a Low-Cost Dual-Frequency GNSS Receiver for Near Real-Time Water Vapor Estimation. 2023 IEEE International Conference on Acoustics, Speech, and Signal Processing Workshops (ICASSPW), Rhodes Island, Greece, 2023; pp. 1–5. [Google Scholar] [CrossRef]
- Marut, G.; Hadas, T.; Kaplon, J.; Trzcina, E.; Rohm, W. Monitoring the Water Vapor Content at High Spatio-Temporal Resolution Using a Network of Low-Cost Multi-GNSS Receivers, 2022. In IEEE TRANSACTIONS ON GEOSCIENCE AND REMOTE SENSING; 2022; VOL. 60. [Google Scholar]
- Stępniak, K.; Paziewski, J. On the quality of tropospheric estimates from low-cost GNSS receiver data processing. Measurement 2022, 198, 111350. [Google Scholar] [CrossRef]
- Zittis, George; Bruggeman, Adriana; Camera, Corrado; Hadjinicolaou, Panos; Lelieveld, J. The added value of convection permitting simulations of extreme precipitation events over the eastern Mediterranean. Atmos. Res. 2017, 191. [Google Scholar] [CrossRef]
- Zittis, G.; Almazroui, M.; Alpert, P.; Ciais, P.; Cramer, W.; Dahdal, Y.; et al. Climate change and weather extremes in the Eastern Mediterranean and Middle East. Rev. Geophys. 2022, 60, e2021RG000762. [Google Scholar] [CrossRef]
- Václavovic, P.; Douša, J.; Györi, G. G-Nut software library – State of development and first results. Acta Geodyn. Geomater. 2014, 10, 431–436. [Google Scholar] [CrossRef]
- Douša, J.; Václavovic, P.; Zhao, L.; Kaˇcmaˇrík, M. New Adaptable All-in-One Strategy for Estimating Advanced Tropospheric Parameters and Using Real-Time Orbits and Clocks. Remote Sens. 2018, 10, 232. [Google Scholar] [CrossRef]
- Zhang, Z.; Lou, Y.; Zhang, W.; Weixing; Hong, L.; Bai, J.; et al. Correlation Analysis between Precipitation and Precipitable Water Vapor over China Based on 1999–2015 Ground-Based GPS Observations. J. Appl. Meteorol. Climatol. 2022, Volume 61(Issue 11), 1669–1683. [Google Scholar] [CrossRef]
- Campos, T. B.; Sapucci, L. F.; Eichholz, C.; Machado, L. A. T.; Adams, D. K. The sensitivity of GPS precipitable water vapor jumps to intense precipitation associated with tropical organized convective systems. Atmosphere 2023, 14, 262. [Google Scholar] [CrossRef]
- Barbarosa, A.; Wijaya, D.; Tanuwijaya, Z.; Putri, N.; Kuntjoro, W. Correlation Analysis of GNSS-Derived Precipitable Water Vapor (PWV) with Rainfall Data in Indonesia. The Second International Seminar on Earth Sciences and Technology (ISEST-2023), 2023. [Google Scholar] [CrossRef]
- Benevides, P.; Catalao, J.; Miranda, P. M. A. On the inclusion of GPS precipitable water vapour in the nowcasting of rainfall. Nat. Hazards Earth Syst. Sci. 15, 2605–2616. [CrossRef]
- Serrano-Vincenti, S.; Condom, T.; Campozano, L.; Escobar, L.A.; Walpersdorf, A.; Carchipulla-Morales, D.; Villacís, M. Harmonic Analysis of the Relationship between GNSS Precipitable Water Vapor and Heavy Rainfall over the Northwest Equatorial Coast, Andes, and Amazon Regions. Atmosphere 2022, 13, 1809. [Google Scholar] [CrossRef]
- Su, H.; Wang, Y.; Cao, Y.; Liang, H.; Zhou, L.; Mo, Z. Analysis of GNSS Precipitable Water Vapor and Its Gradients During a Rainstorm in North China in July 2023. Remote Sens. 2025, 17, 3247. [Google Scholar] [CrossRef]
- Xian, T.; Su, K.; Zhang, J.; Hu, H.; Wang, H. Precipitable Water Vapor Retrieval Based on GNSS Data and Its Application in Extreme Rainfall. Remote Sens. 2025, 17, 2301. [Google Scholar] [CrossRef]
Figure 1.
GNSS permanent stations network in Cyprus operated by CLOUDWATER LTD.
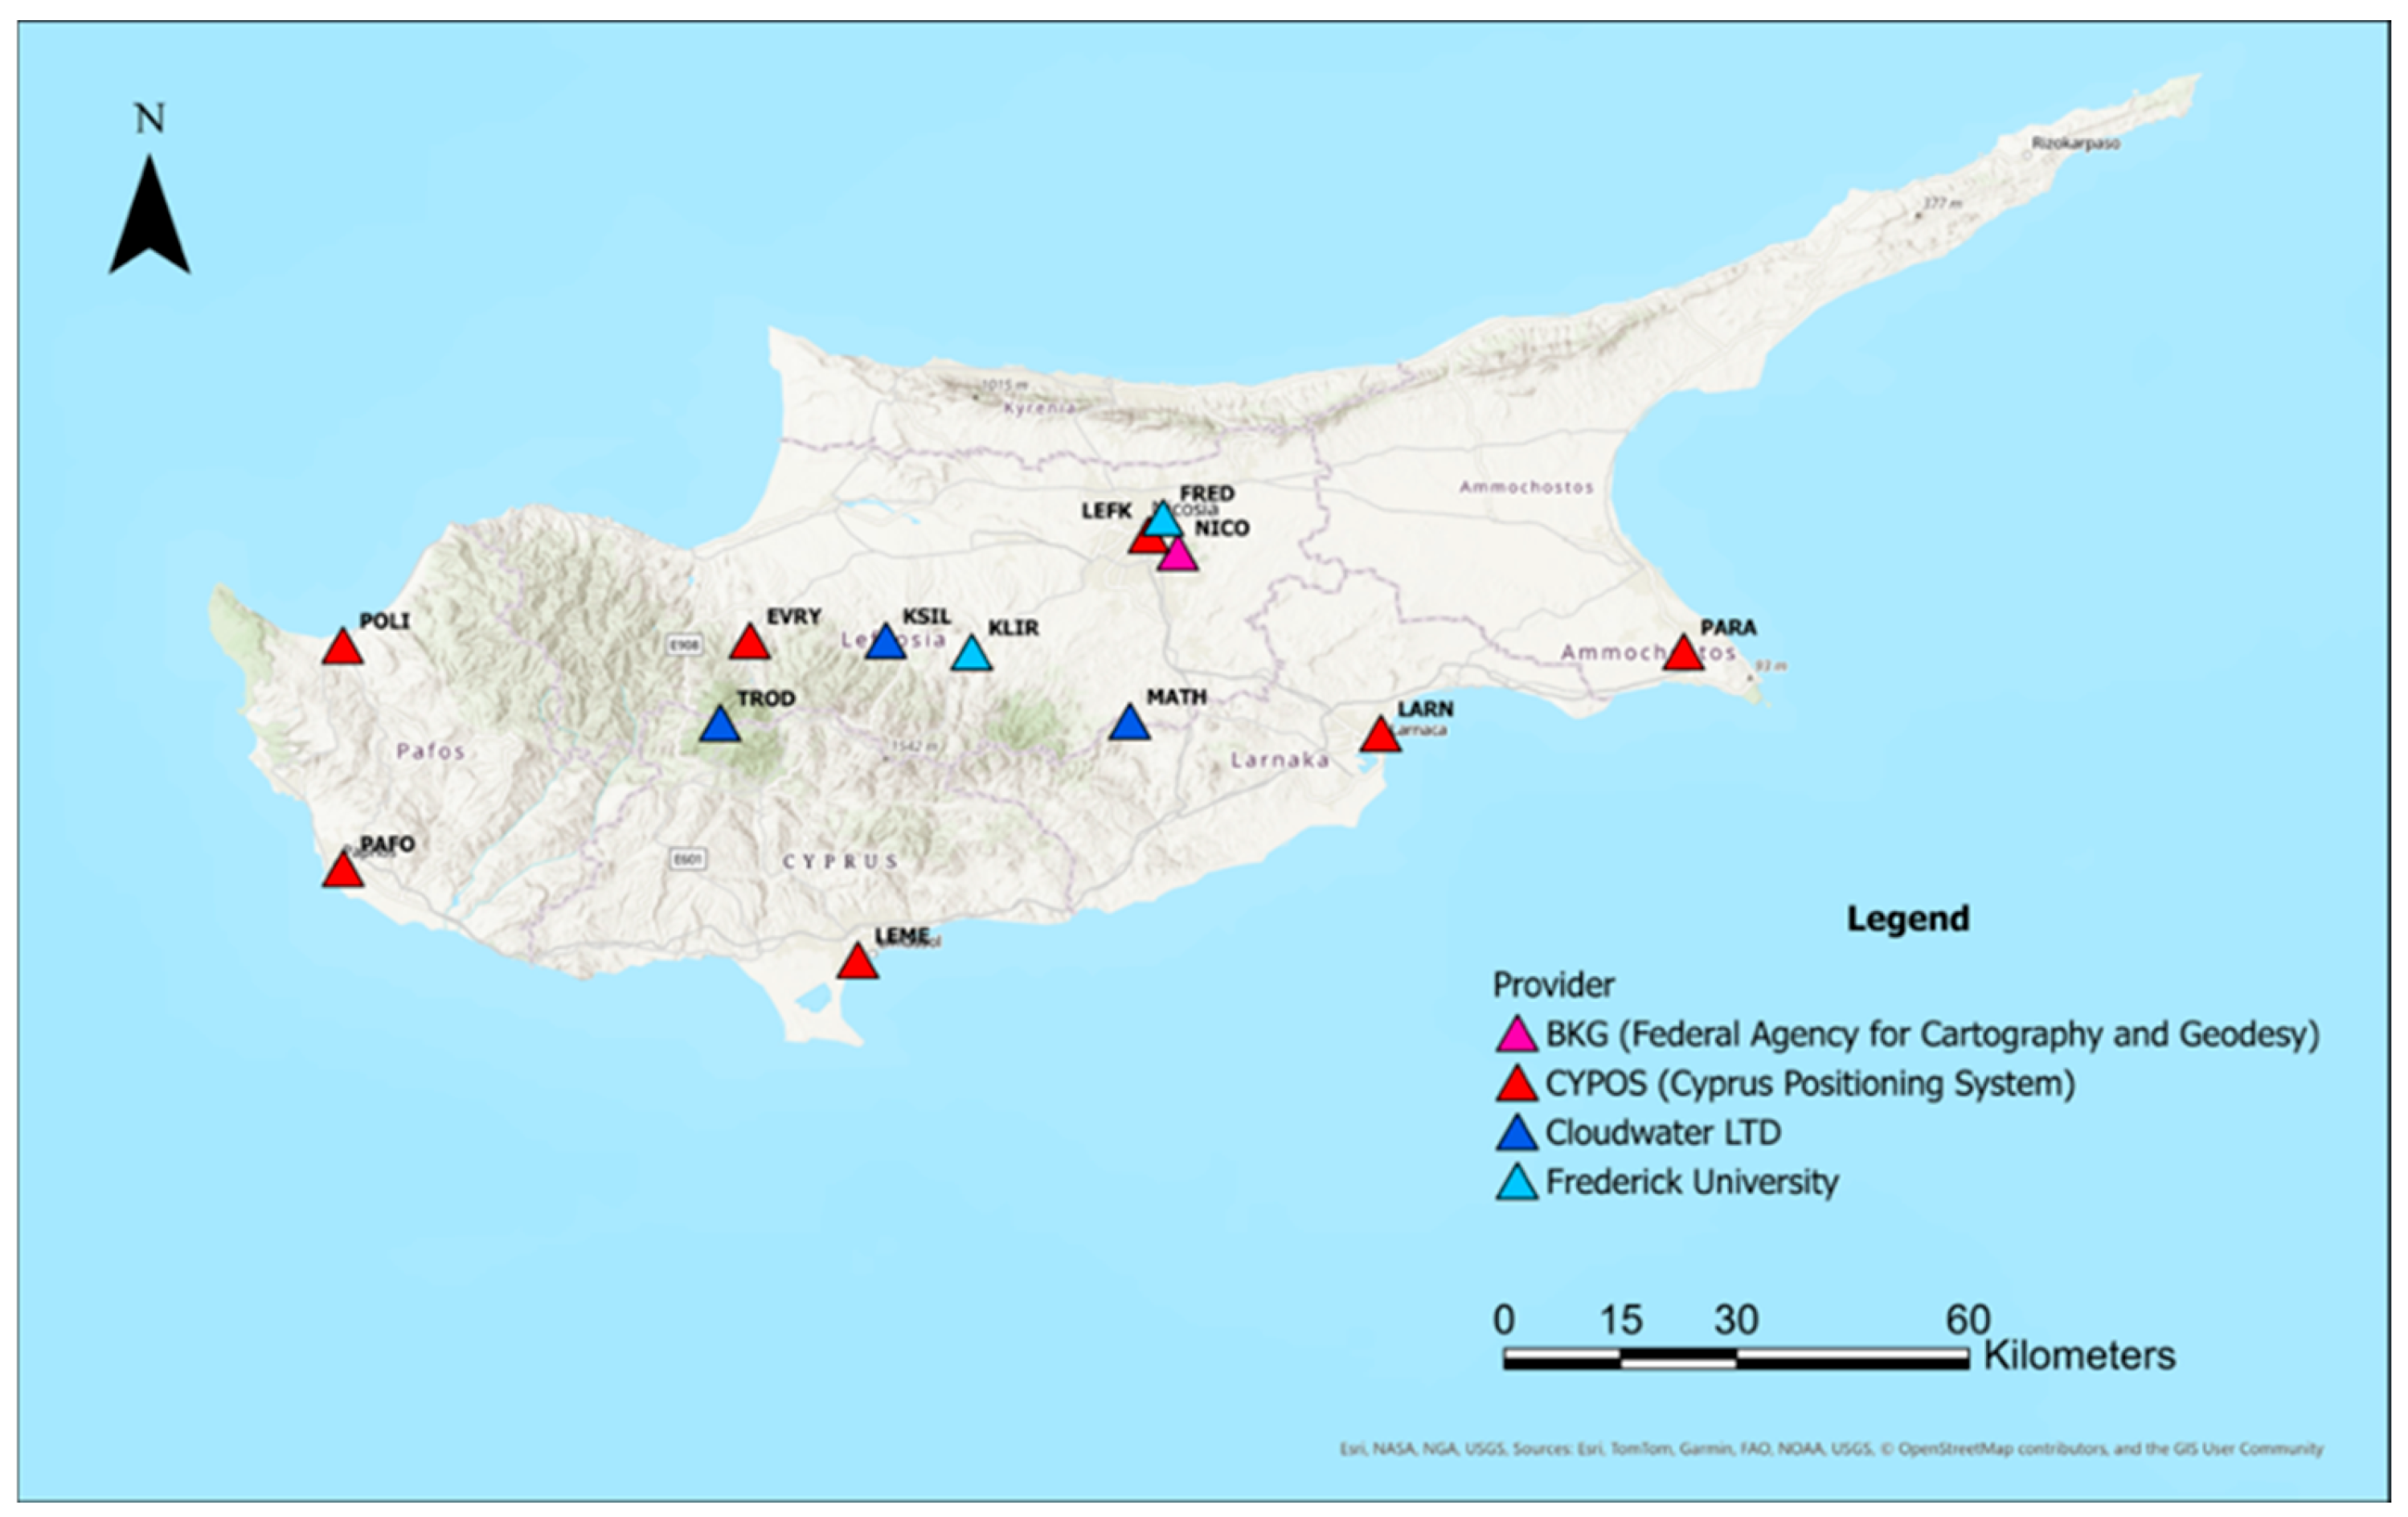
Figure 2.
GNSS-PWV and rain timeseries during the November 2024 heavy rain event in Paphos.
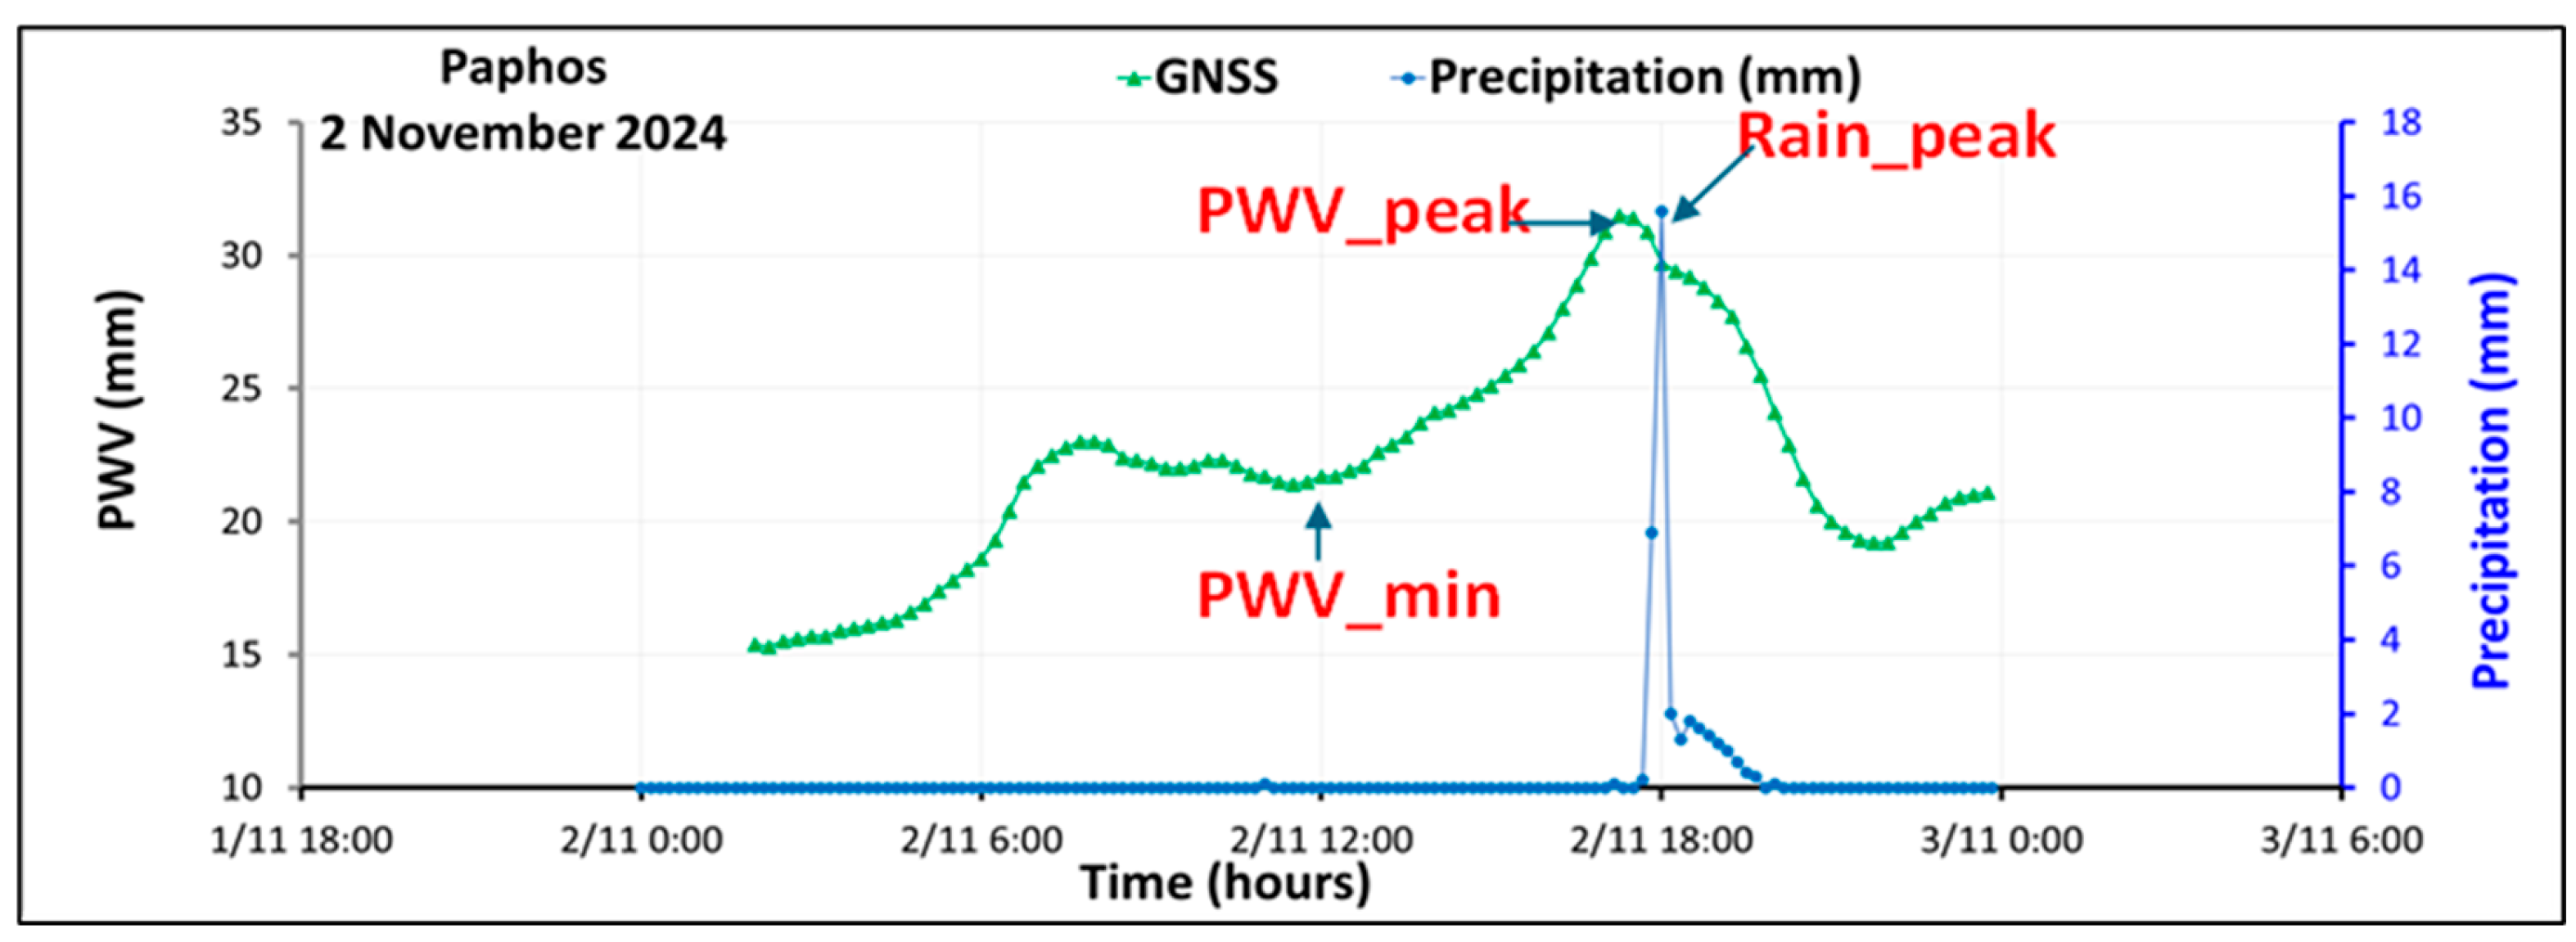
Figure 3.
GNSS-PWV and precipitation timeseries for characteristic flash, short and long rain events.
Figure 3.
GNSS-PWV and precipitation timeseries for characteristic flash, short and long rain events.
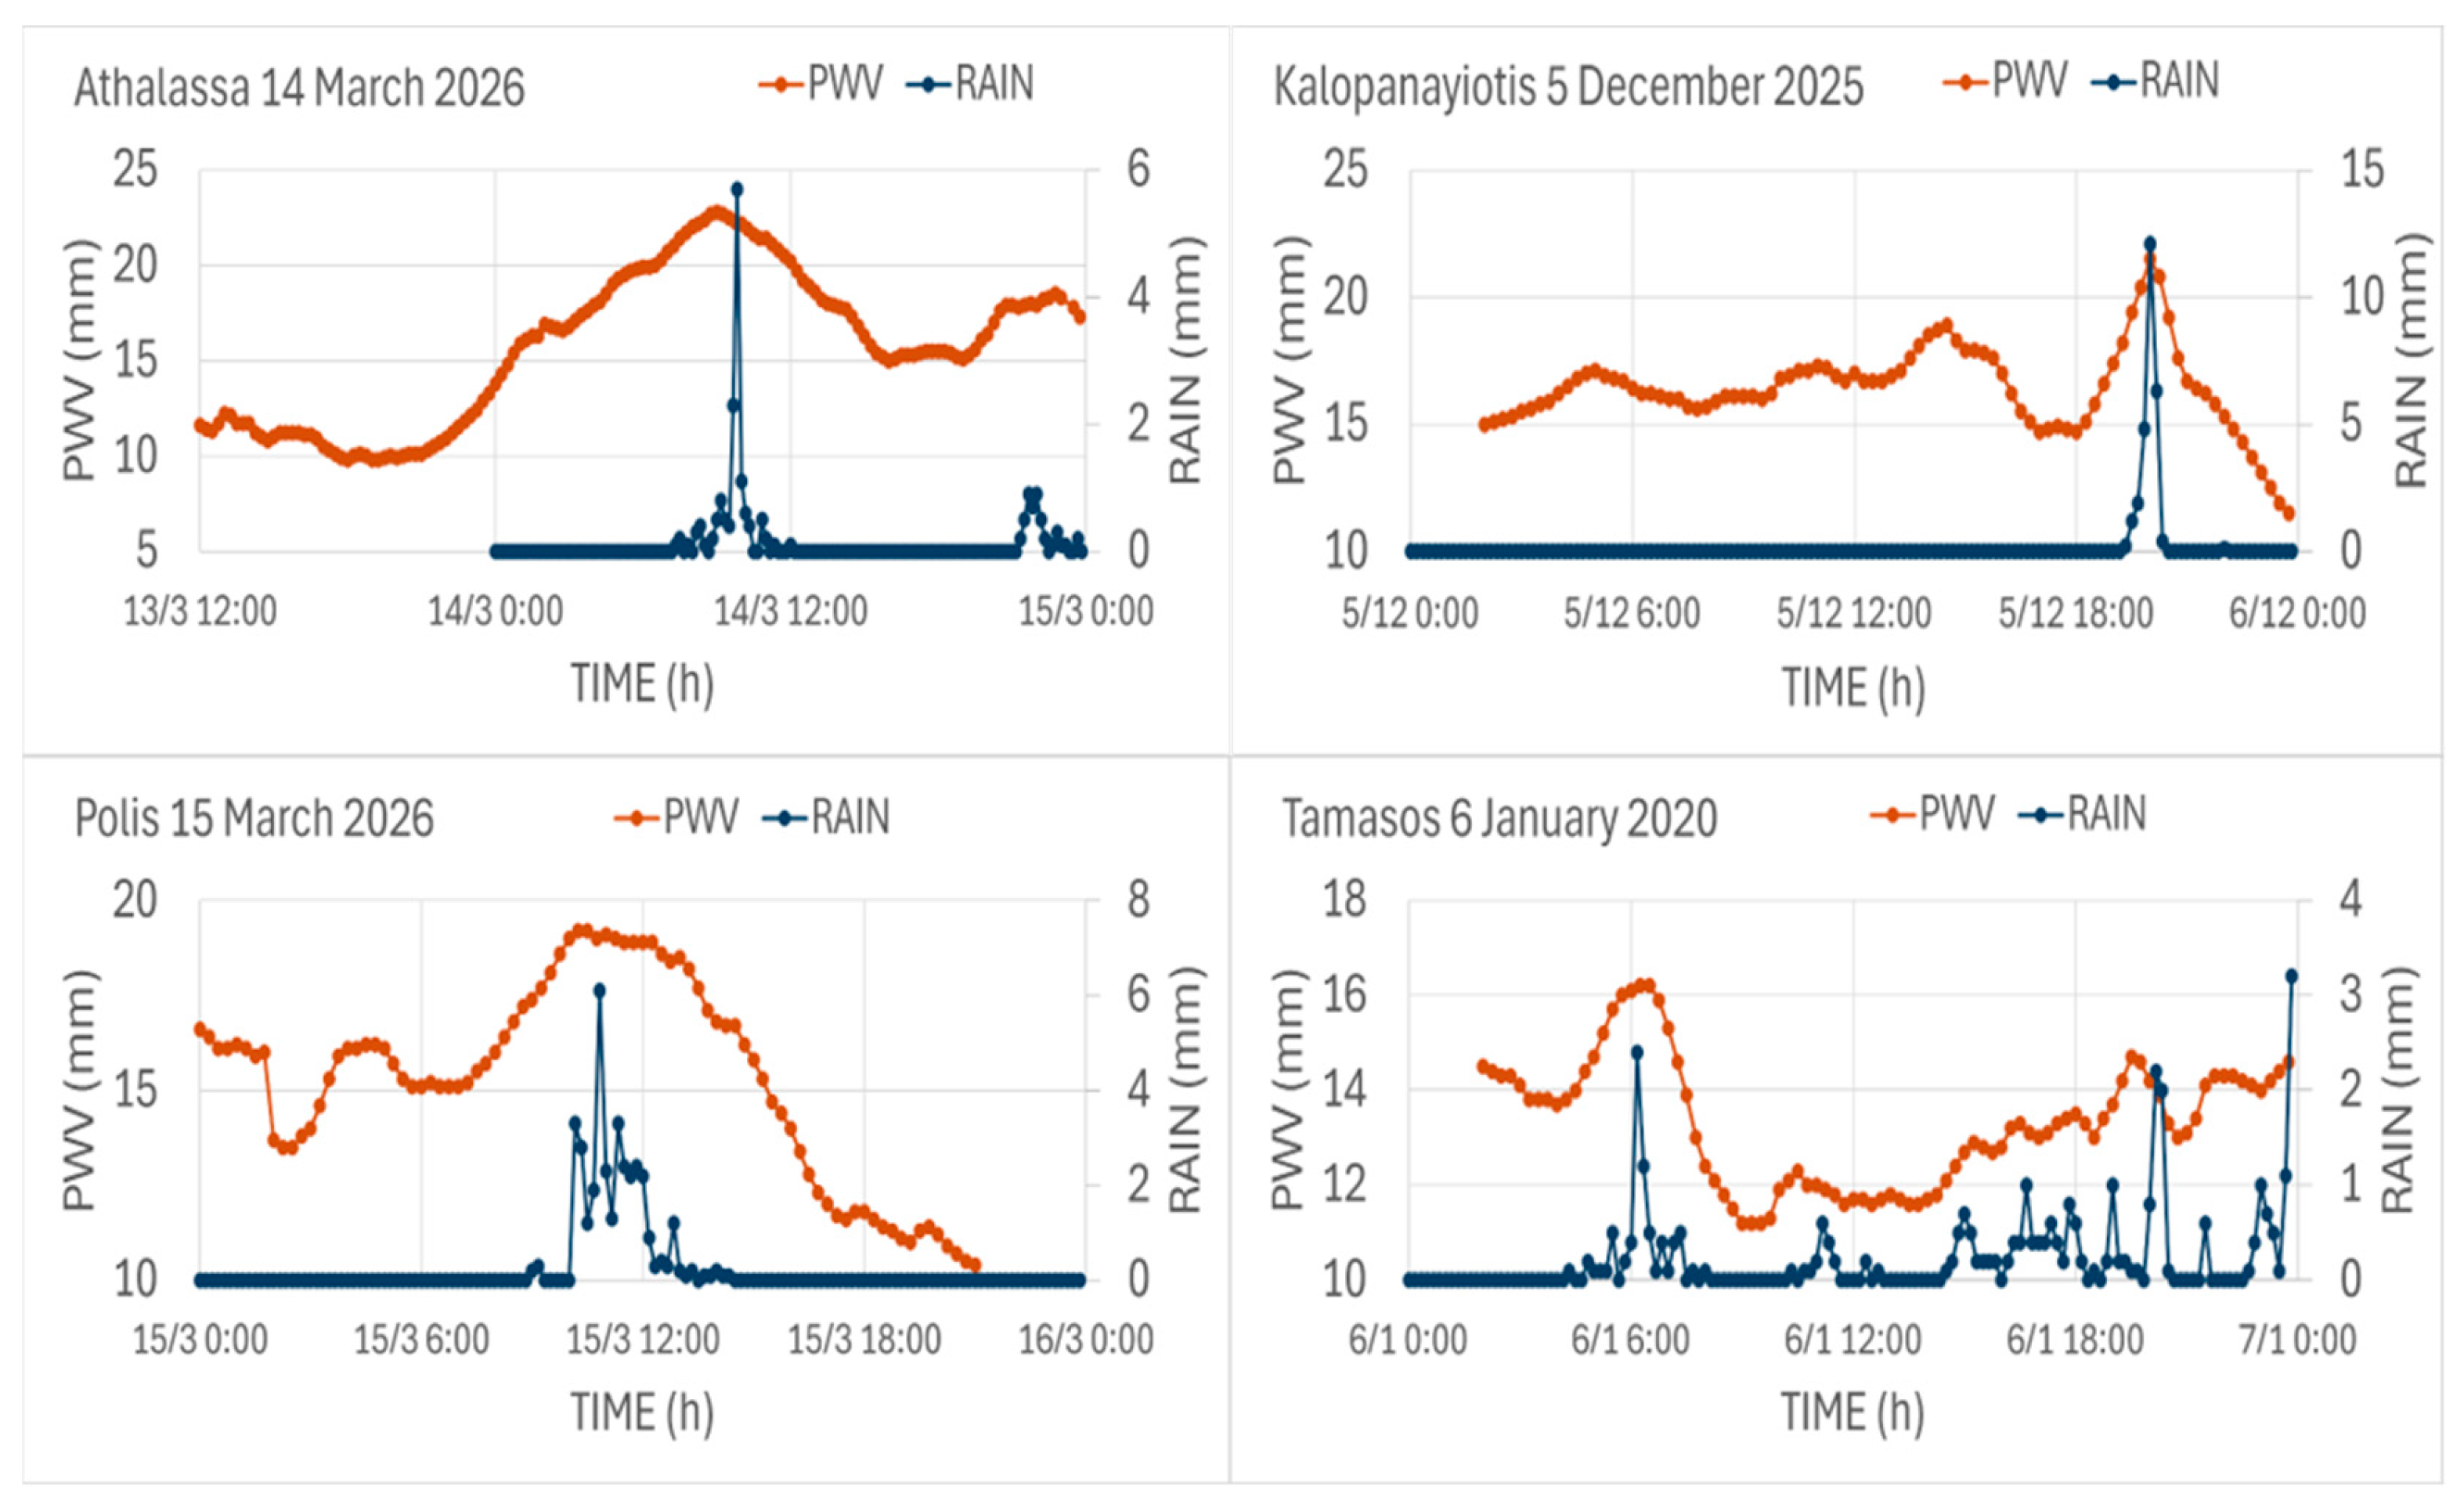
Figure 4.
Relationship between the pre-rainfall PWV growth rate (ΔPWV/Δt) and peak rainfall intensity for the 30 analysed heavy rainfall events. The solid line represents the least-squares linear regression. The regression equation and coefficient of determination (R2) are shown in the figure.
Figure 4.
Relationship between the pre-rainfall PWV growth rate (ΔPWV/Δt) and peak rainfall intensity for the 30 analysed heavy rainfall events. The solid line represents the least-squares linear regression. The regression equation and coefficient of determination (R2) are shown in the figure.
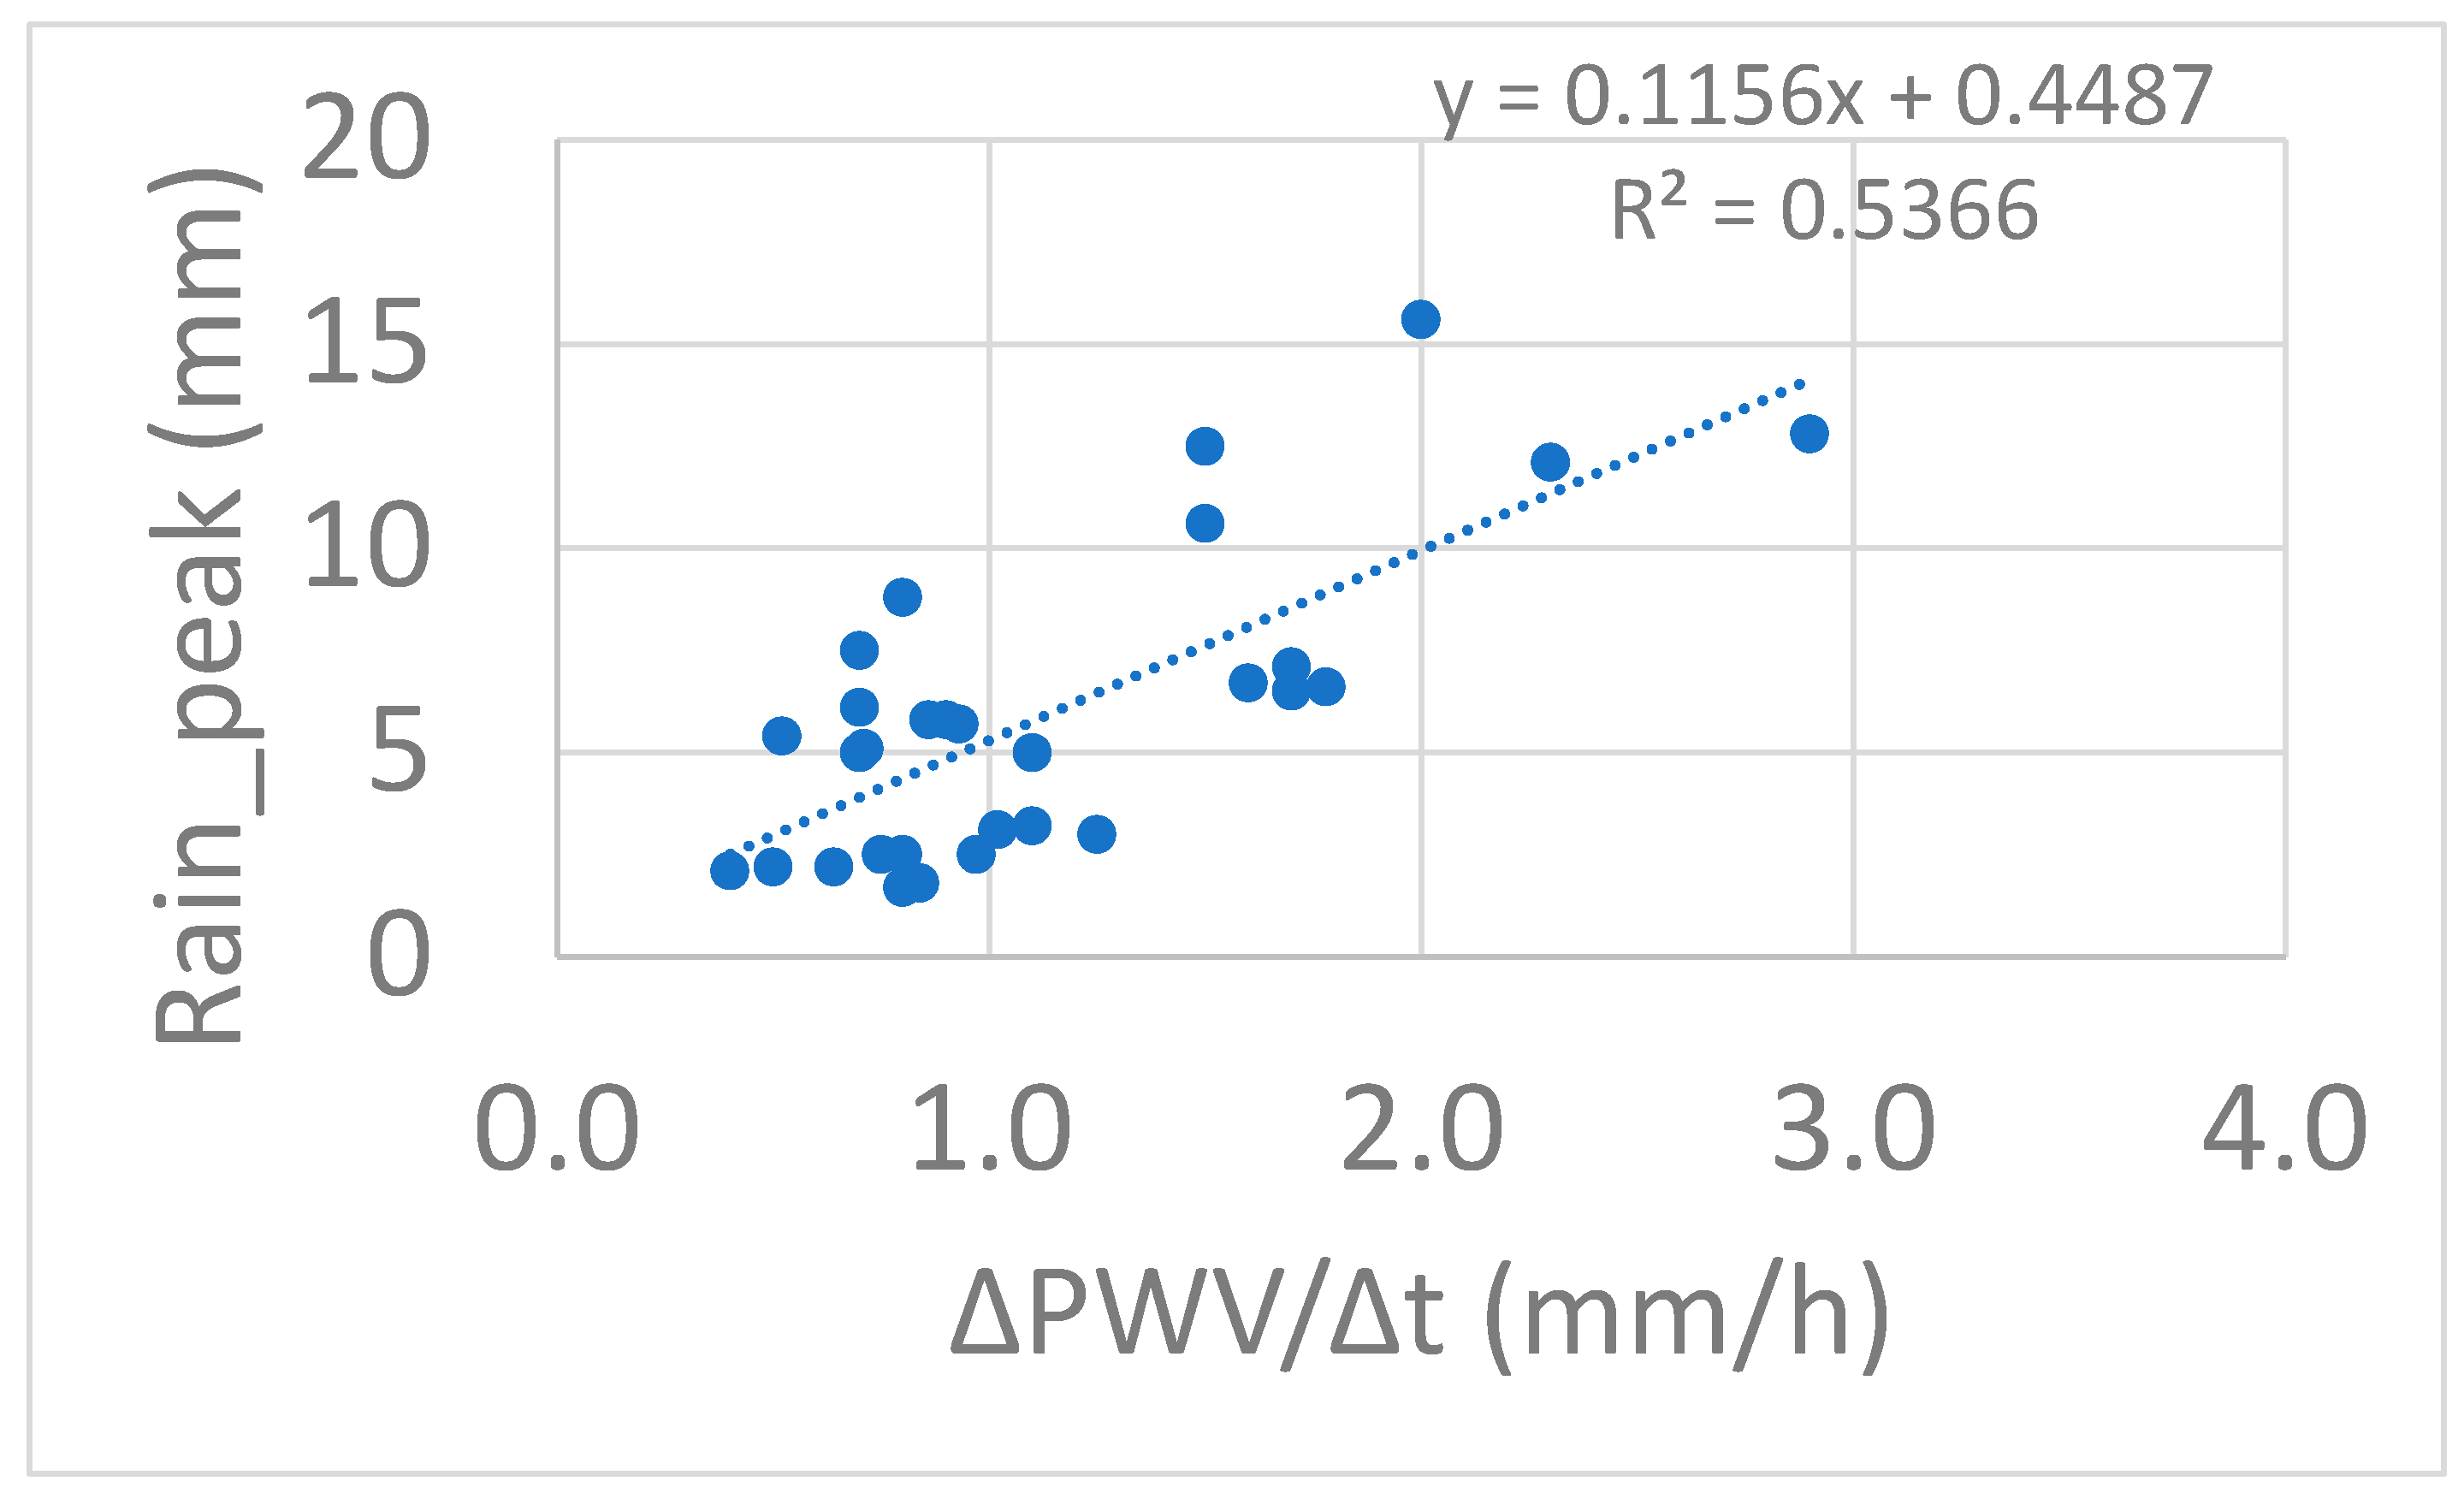
Figure 5.
Relationship between the pre-rainfall PWV growth rate (ΔPWV/Δt) and the corresponding PWV_peak value for the 30 analysed heavy rainfall events. The solid line represents the least-squares linear regression. The regression equation and coefficient of determination (R2) are shown in the figure.
Figure 5.
Relationship between the pre-rainfall PWV growth rate (ΔPWV/Δt) and the corresponding PWV_peak value for the 30 analysed heavy rainfall events. The solid line represents the least-squares linear regression. The regression equation and coefficient of determination (R2) are shown in the figure.
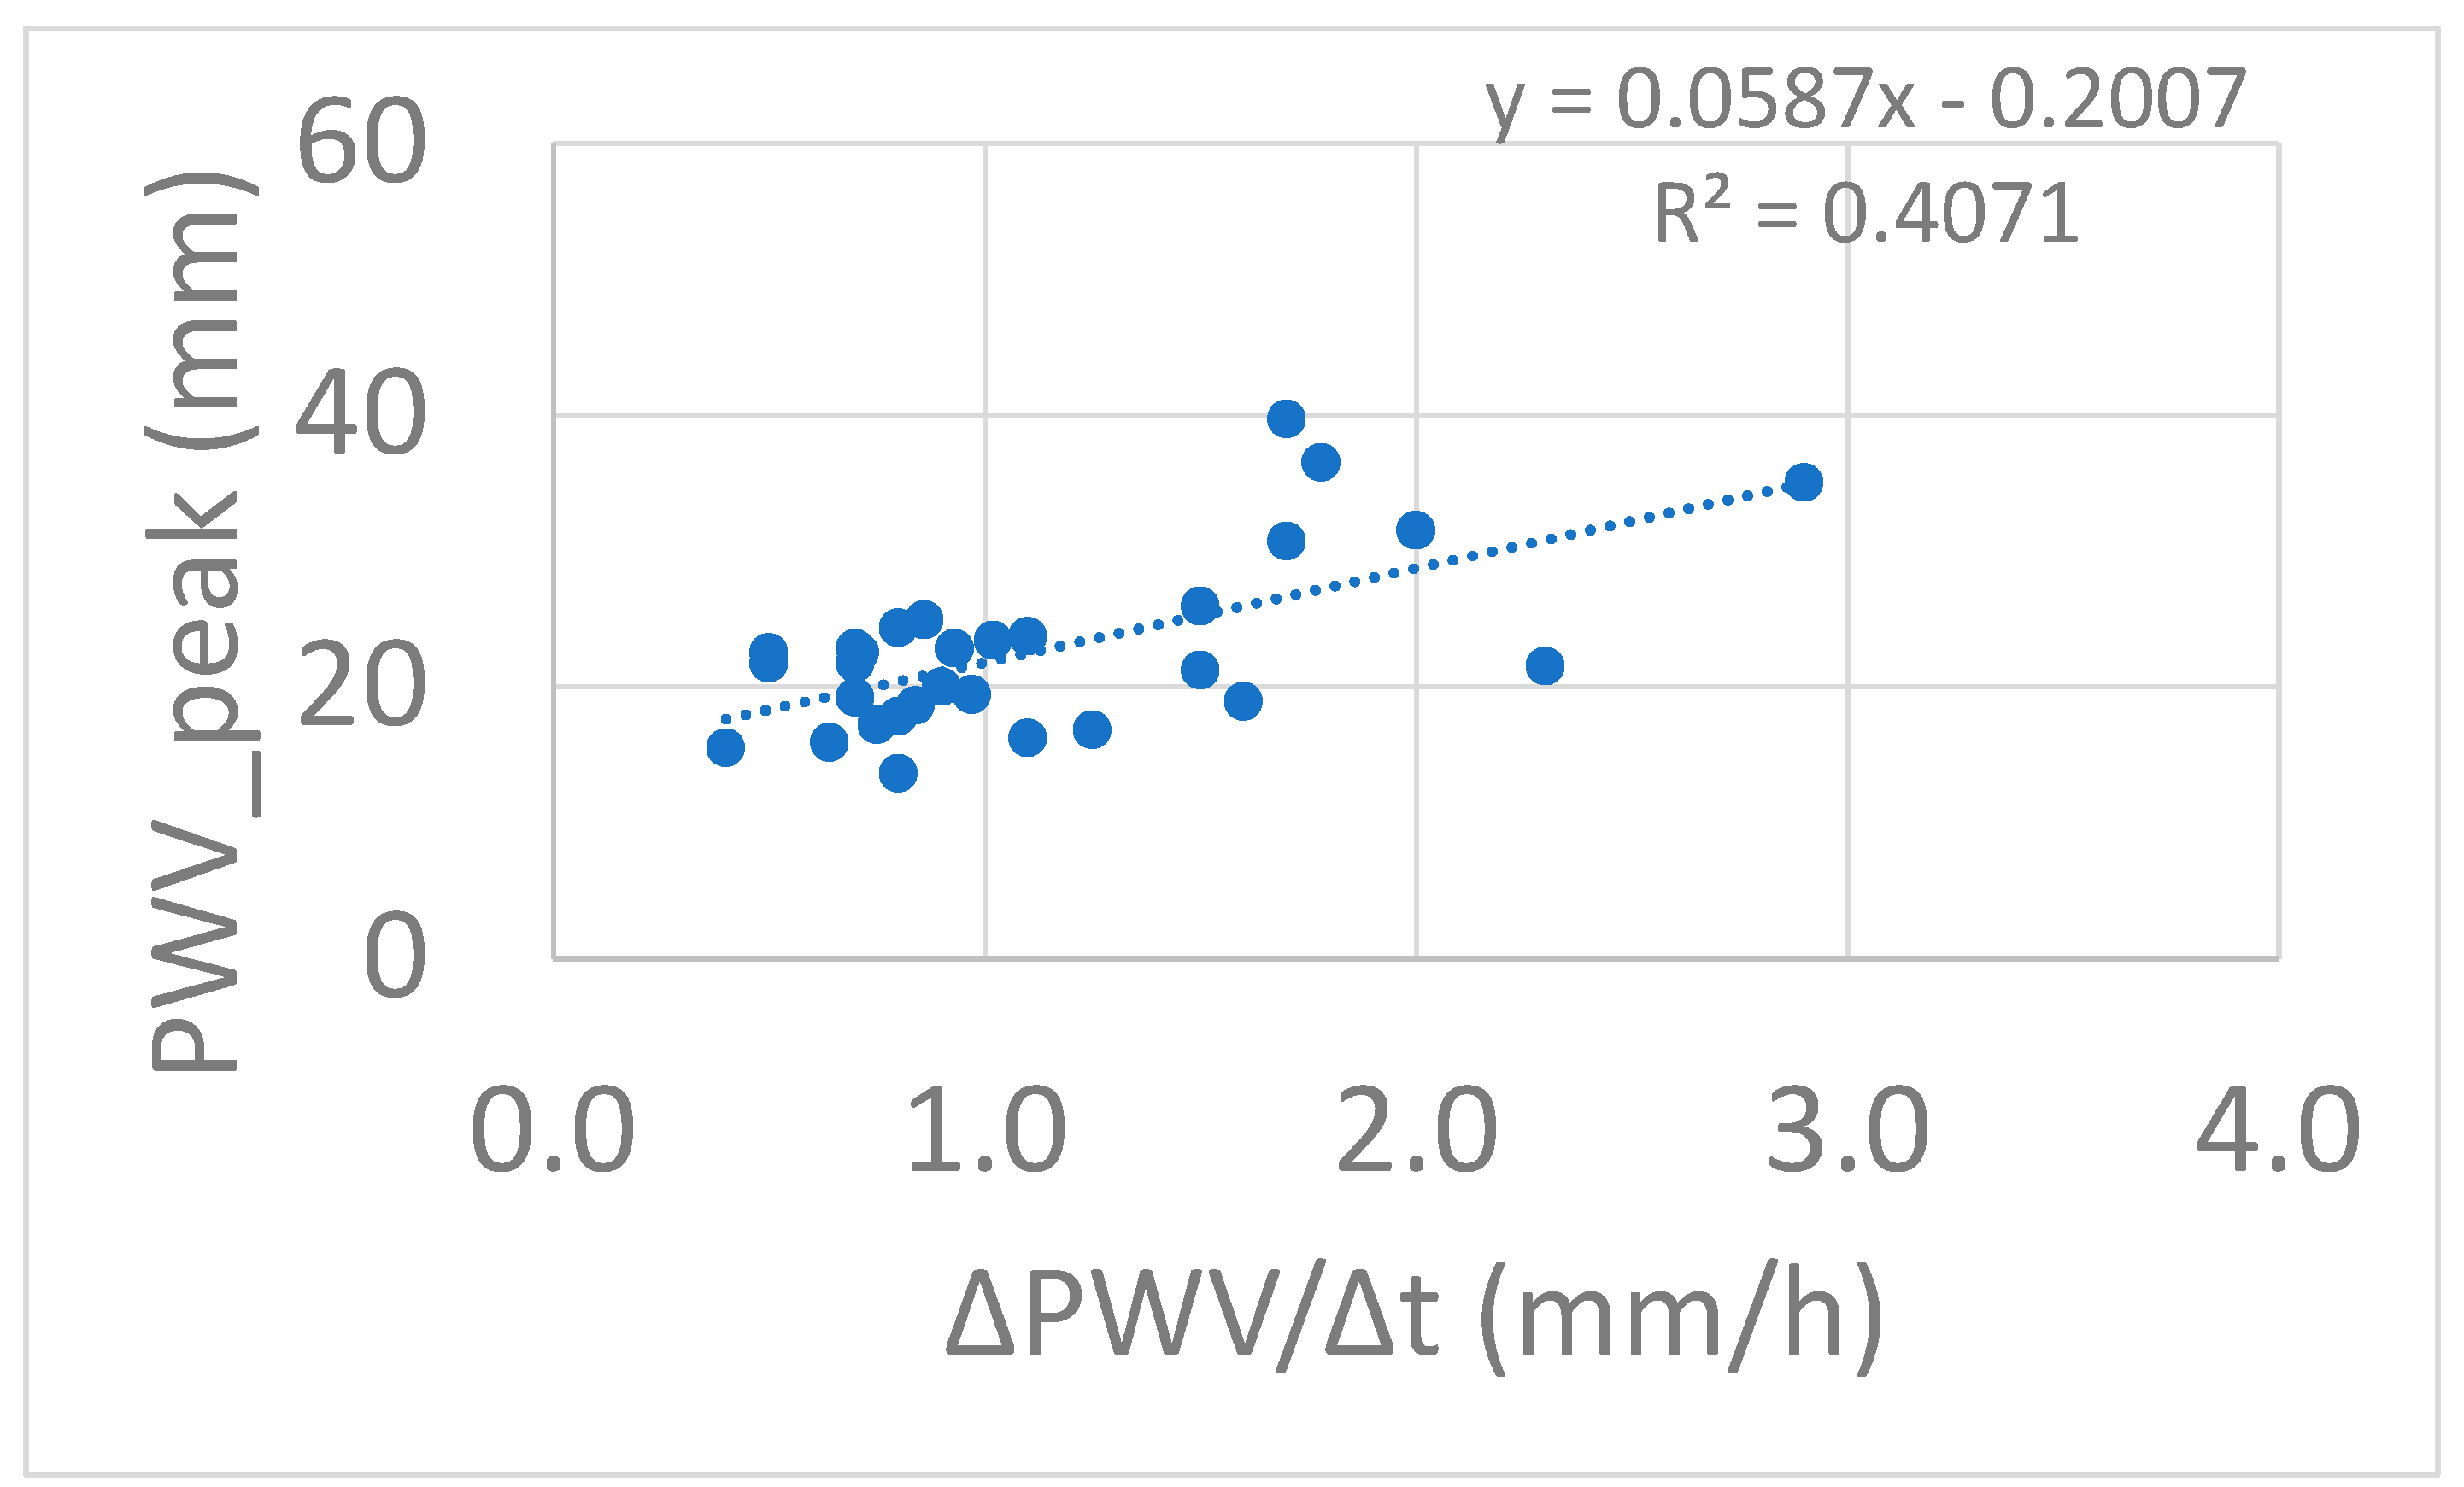
Figure 6.
Relationship between PWV_peak value and peak rainfall intensity for the 30 analysed heavy rainfall events. The solid line represents the least-squares linear regression. The regression equation and coefficient of determination (R2) are shown in the figure.
Figure 6.
Relationship between PWV_peak value and peak rainfall intensity for the 30 analysed heavy rainfall events. The solid line represents the least-squares linear regression. The regression equation and coefficient of determination (R2) are shown in the figure.
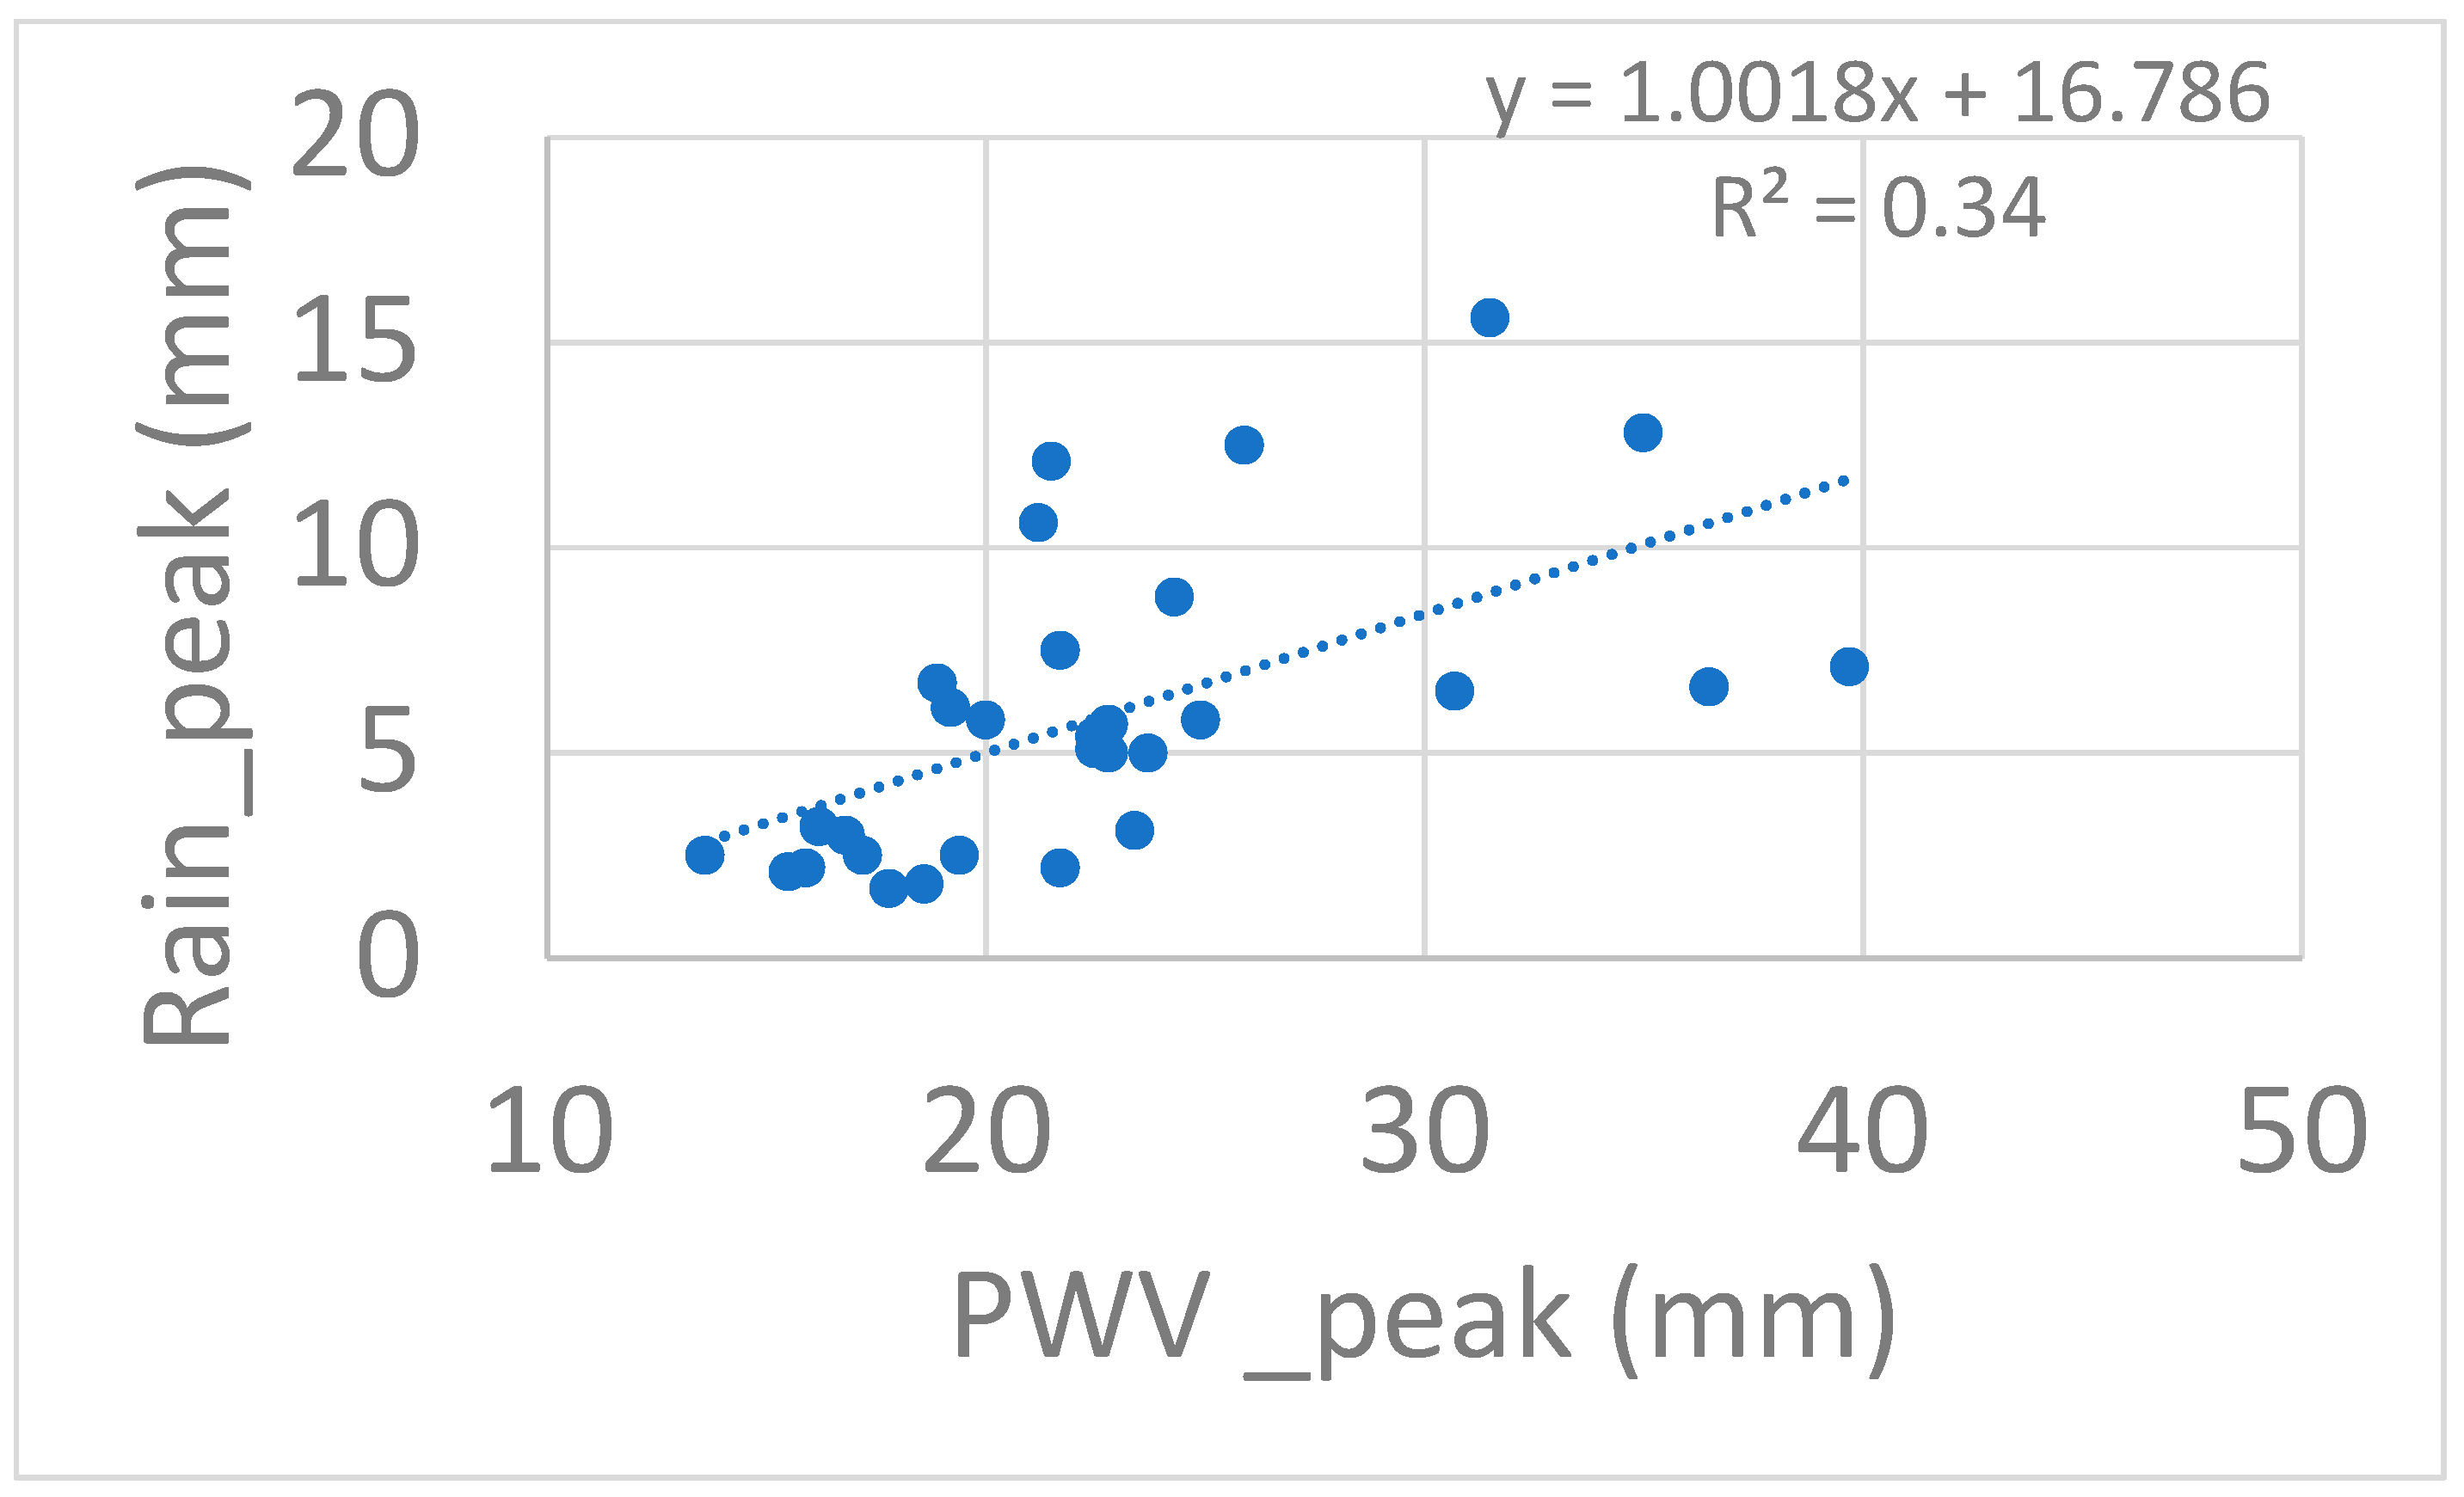
Figure 7.
Relationship between PWV_peak value and rain duration for the 30 analysed heavy rainfall events. The solid line represents the least-squares linear regression. The regression equation and coefficient of determination (R2) are shown in the figure.
Figure 7.
Relationship between PWV_peak value and rain duration for the 30 analysed heavy rainfall events. The solid line represents the least-squares linear regression. The regression equation and coefficient of determination (R2) are shown in the figure.
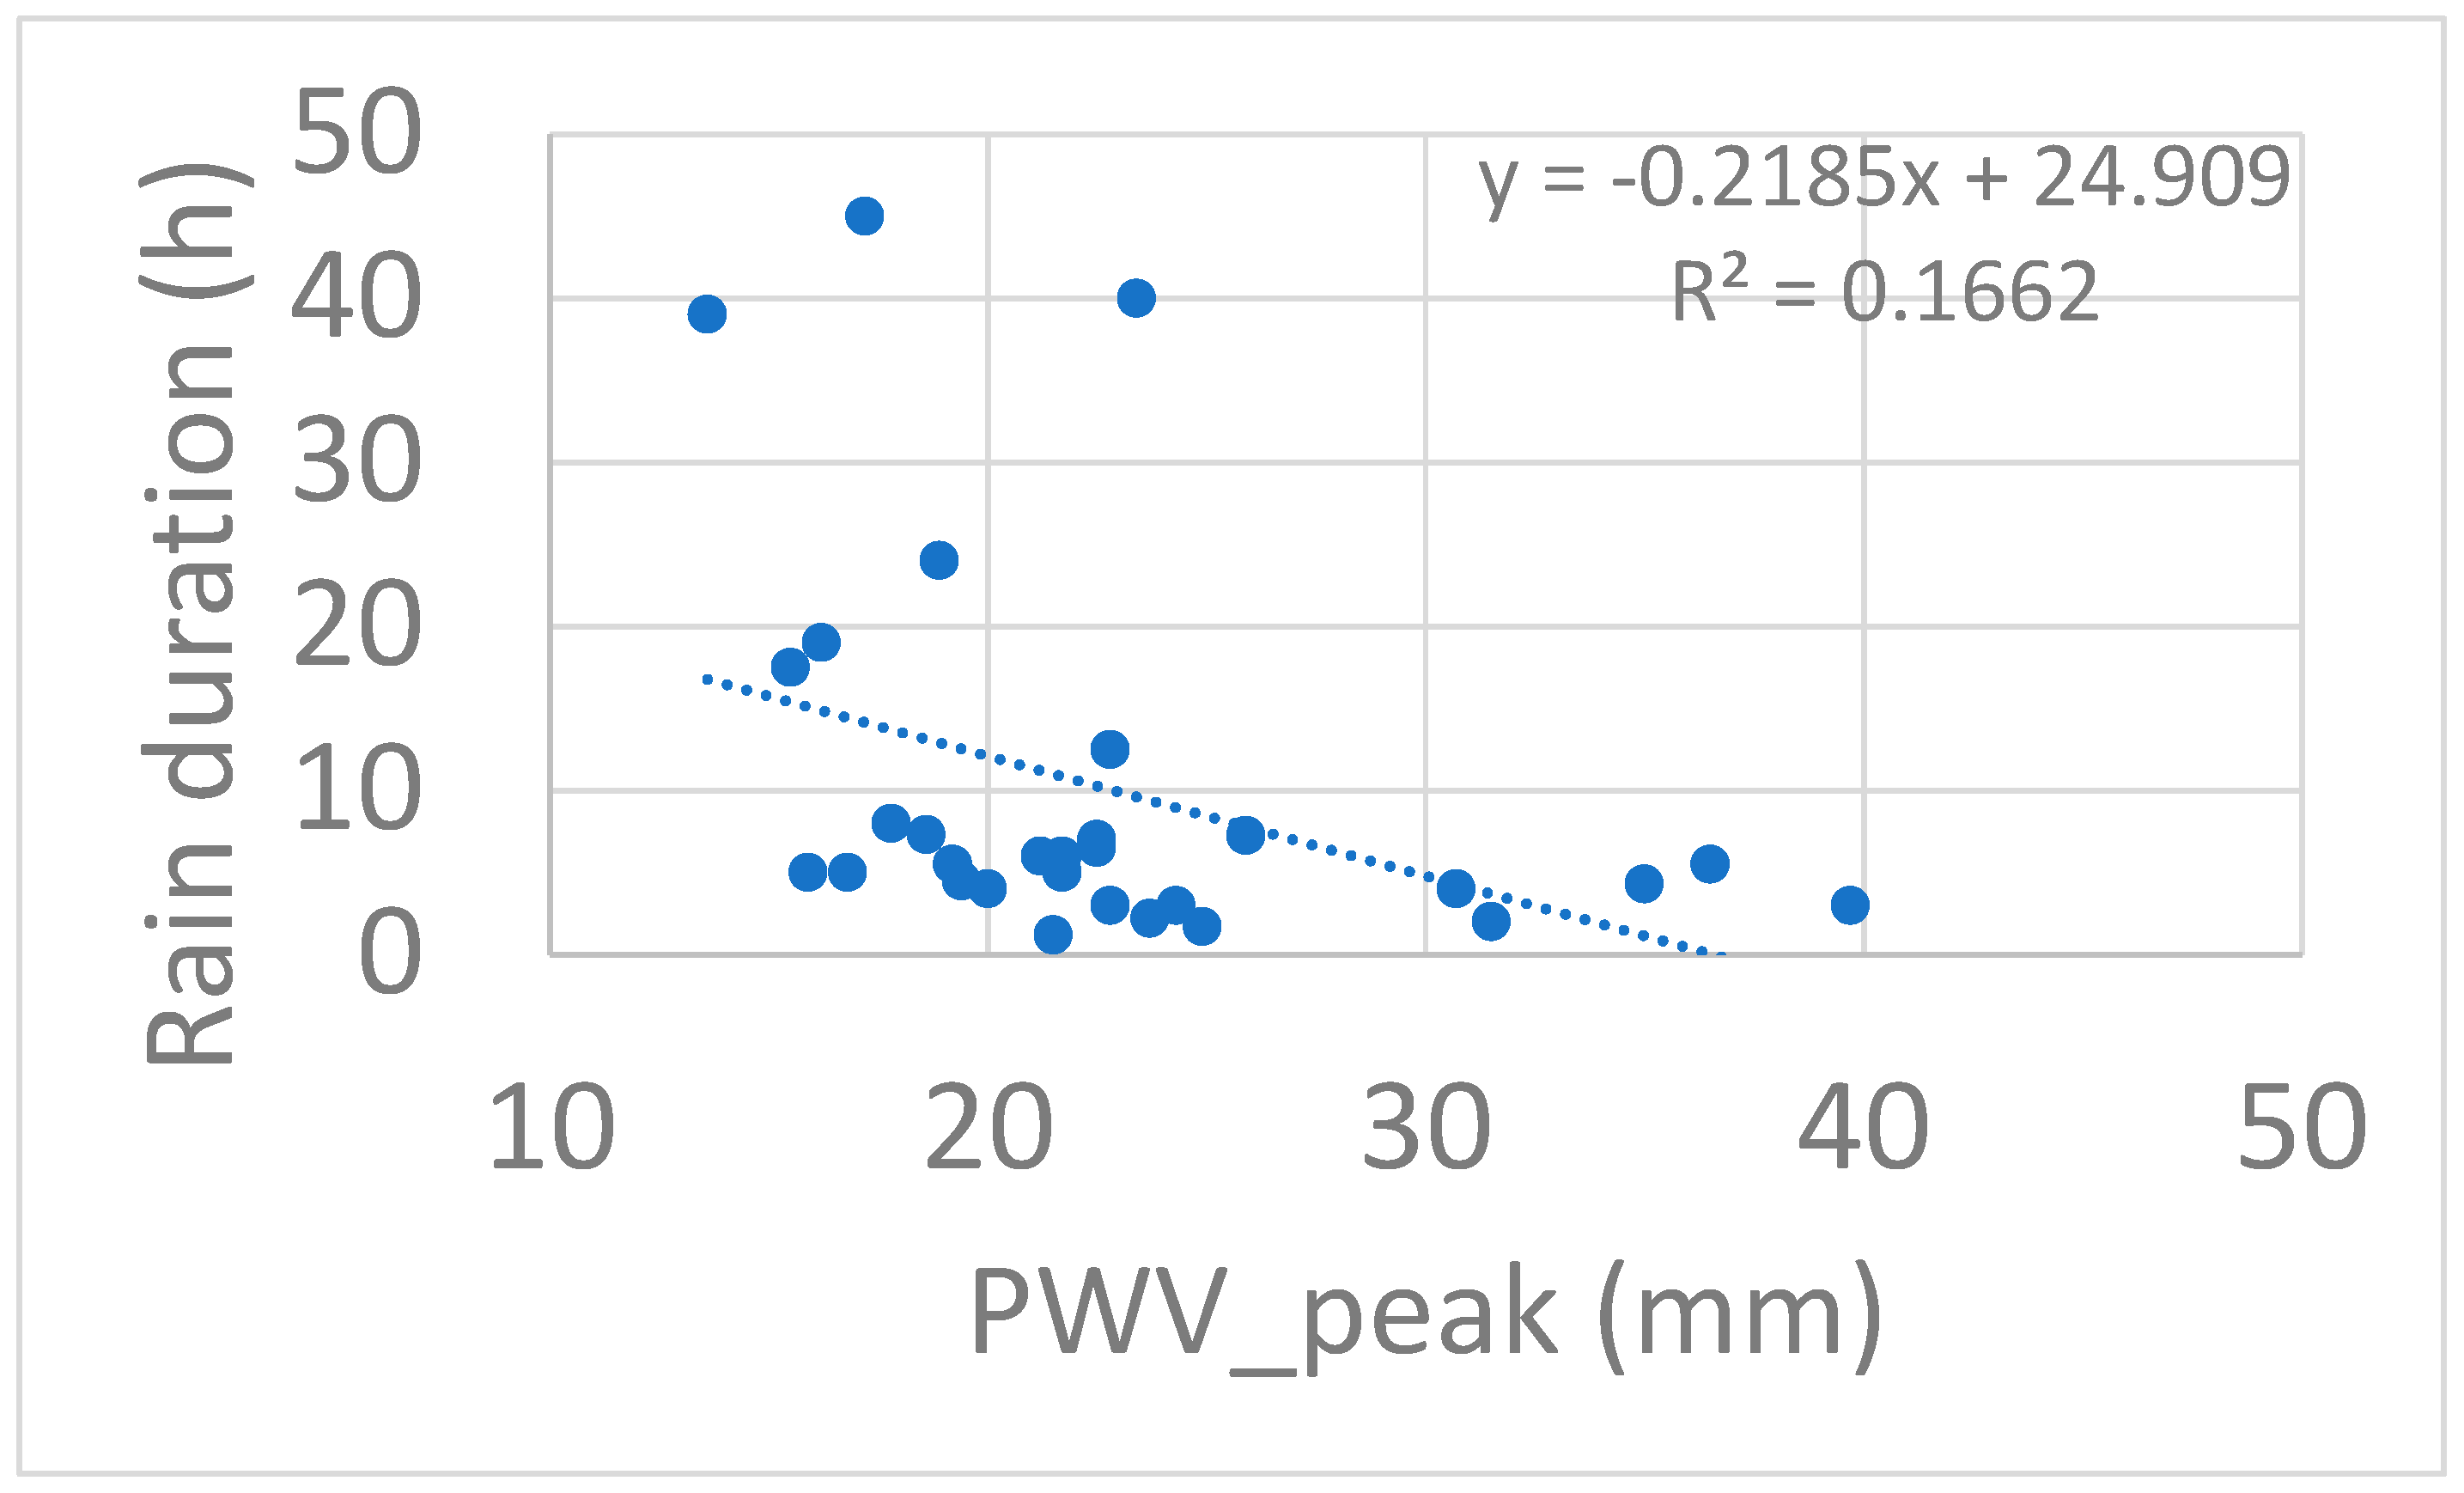

Table 1.
GNSS station network information.
| Code | Receiver Manufacturer | Receiver Type | Antenna Manufacturer | Antenna Type |
| EVRY | Leica Geosystems | LEICA GR30 | Leica Geosystems | LEIAR25 LEIT |
| FRED | Septentrio | SEPT POLARX5S | Septentrio | SEPCHOKE_B3E6 NONE |
| KLIR | Leica Geosystems | LEICA GR30 | Leica Geosystems | LEIAR20 LEIM |
| KSIL | Cloudwater Ltd. | PREWAM | ComNav | CNTAT340 NONE |
| LARN | Leica Geosystems | LEICA GR30 | Leica Geosystems | LEIAR20 LEIM |
| LEFK | Leica Geosystems | LEICA GR30 | Leica Geosystems | LEIAR20 LEIM |
| LEME | Leica Geosystems | LEICA GR30 | Leica Geosystems | LEIAR20 LEIM |
| MATH | Cloudwater Ltd. | PREWAM | ComNav | CNTAT340 NONE |
| NICO | Leica Geosystems | LEICA GR50 | Leica Geosystems | LEIAR25.R4 LEIT |
| PAFO | Leica Geosystems | LEICA GR30 | Leica Geosystems | LEIAR20 LEIM |
| PARA | Leica Geosystems | LEICA GR30 | Leica Geosystems | LEIAR20 LEIM |
| POLI | Leica Geosystems | LEICA GR30 | Leica Geosystems | LEIAR25 LEIT |
| TROD | Cloudwater Ltd. | PREWAM | ComNav | CNTAT340 NONE |
Table 2.
GNSS-PWV and rainfall parameters for the 30 heavy rain events in 2020-2026.
| Station | Date |
PWV peak (mm) |
Total Rain (mm) |
Rain peak (mm) |
Rain duration (h) |
Time lag (h) |
ΔPWV/Δt (mm/h) |
| Tamasos | 14-15 March 2026 (2) | 15.5 | 32.1 | 2.1 | 17.5 | 0.0 | 0.4 |
| Lefkosia | 24 January 2026 | 21.7 | 26.8 | 2.2 | 6 | 0.0 | 0.5 |
| Frenaros | 24 January 2026 | 22.5 | 29.2 | 5.4 | 7 | 0.0 | 0.5 |
| Kalopanayiotis | 14-15 March 2026 (2) | 15.9 | 18 | 2.2 | 5 | 0.0 | 0.6 |
| Pafos | 24 January 2026 | 21.7 | 41 | 7.5 | 5 | 0.0 | 0.7 |
| Polis | 15 March 2026 | 19.2 | 36.1 | 6.1 | 5.5 | 0.6 | 0.7 |
| Troodos | 21 December 2024 | 22.8 | 28.7 | 5 | 12.5 | 0.0 | 0.7 |
| Athalassa | 24 January 2026 | 22.5 | 30.7 | 5.1 | 6.5 | 0.0 | 0.7 |
| Kalopanayiotis | 12-13 February 2026 | 17.2 | 76.9 | 2.5 | 45 | 11.0 | 0.8 |
| Tamasos | 24 January 2026 | 17.8 | 25.1 | 1.7 | 8 | 6.0 | 0.8 |
| Troodos | 02 November 2024 | 24.3 | 35.1 | 8.8 | 3 | 2.0 | 0.8 |
| Troodos | 25-26 December 2024 | 13.6 | 41.2 | 2.5 | 39 | 0.0 | 0.8 |
| Kalopanayiotis | 24 January 2026 | 18.6 | 26.6 | 1.8 | 7.3 | 0.0 | 0.8 |
| Athalassa | 14 May 2025 | 24.9 | 20 | 5.8 | 1.7 | 0.3 | 0.9 |
| Tamasos | 14-15 March 2026 (1) | 20 | 17.5 | 5.8 | 4 | 0.0 | 0.9 |
| Athalassa | 14 March 2026 | 22.8 | 20 | 5.7 | 3 | 0.2 | 0.9 |
| Kalopanayiotis | 14-15 March 2026 (1) | 19.4 | 16.5 | 2.5 | 4.5 | 0.0 | 1.0 |
| Larnaca | 22-24 January 2026 | 23.4 | 50.9 | 3.1 | 40 | 8.0 | 1.0 |
| Polis | 17 November 2024 (2) | 23.7 | 16.6 | 5 | 2.2 | 0.0 | 1.1 |
| Tamasos | 06 January 2020 | 16.2 | 33 | 3.2 | 19 | 0.0 | 1.1 |
| Athalassa | 30 January 2024 | 16.8 | 38.3 | 3 | 5 | 0.0 | 1.3 |
| Frenaros | 03 December 2024 | 25.9 | 70.5 | 12.5 | 7.25 | 0.3 | 1.5 |
| Pafos | 21 December 2025 | 21.2 | 28.6 | 10.6 | 6 | 0.2 | 1.5 |
| Limassol | 25-26 December 2024 | 18.9 | 34.6 | 6.7 | 24 | 0.0 | 1.6 |
| Athalassa | 14 June 2022 | 39.7 | 43.1 | 7.1 | 3 | 1.3 | 1.7 |
| Polis | 17 November 2024 (1) | 30.7 | 18.3 | 6.5 | 4 | 1.0 | 1.7 |
| Athalassa | 17 October 2022 | 36.5 | 49.9 | 6.6 | 5.5 | 0.0 | 1.8 |
| Pafos | 02 November 2024 | 31.5 | 34.7 | 15.6 | 2 | 0.3 | 2.0 |
| Kalopanayiotis | 05 December 2025 | 21.5 | 27 | 12.1 | 1.2 | 0.0 | 2.3 |
| Tamasos | 16 September 2021 | 35 | 62.3 | 12.8 | 4.3 | 0.0 | 2.9 |
Table 3.
The statistical distribution of the time_lag across the dataset as categorized into three intervals.
Table 3.
The statistical distribution of the time_lag across the dataset as categorized into three intervals.
| Time_lag (h) | Number of events | % |
| 0-2 | 27 | 90 |
| 3-6 | 1 | 3 |
| >6 | 2 | 7 |
Table 4.
Linear regression and correlation metrics for PWV dynamics vs. rainfall characteristics (n=30 heavy rain events).
Table 4.
Linear regression and correlation metrics for PWV dynamics vs. rainfall characteristics (n=30 heavy rain events).
| Variable (X) | Variable (Y) | Correlation (R) | Coefficient of Determination (R2) | P-value |
Statistical Significance (significant if p<0.05) |
| PWV_rate (mm/h) | PWV_peak (mm) | 0.638 | 0.407 | 0.00015 | Highly Significant |
| Rain Peak (mm) | 0.733 | 0.537 | < 0.00001 | Highly Significant | |
| Total Rain (mm) | 0.292 | 0.085 | 0.117 | Not Significant | |
| Rain Duration (h) | -0.225 | 0.051 | 0.232 | Not Significant | |
| Time Lag (h) | -0.145 | 0.021 | 0.445 | Not Significant | |
| PWV_peak (mm) | Rain Peak (mm) | 0.583 | 0.340 | 0.00072 | Highly Significant |
| Rain Duration (h) | -0.393 | 0.155 | 0.031 | Significant | |
| Total Rain (mm) | 0.237 | 0.056 | 0.207 | Not Significant | |
| Time Lag (h) | -0.104 | 0.011 | 0.585 | Not Significant |
Table 5.
Multiple linear regression model statistics outcome for examining the relation of peak rainfall intensity with PWV_rate and PWV_peak.
Table 5.
Multiple linear regression model statistics outcome for examining the relation of peak rainfall intensity with PWV_rate and PWV_peak.
| Regression statistics summary | Multiple R=0.75; R2=0.56; Adjusted R2=0.53; Model Significance: p< 0.0001; n=30 | ||
| Diagnostic Variable | Standardized Coefficient (β) | p-value | Statistical Significance |
| PWV_rate | 0.61 | 0.001 | Highly Significant |
| PWV_peak | 0.19 | 0.251 | Not Significant (p > 0.05) |
Disclaimer/Publisher’s Note: The statements, opinions and data contained in all publications are solely those of the individual author(s) and contributor(s) and not of MDPI and/or the editor(s). MDPI and/or the editor(s) disclaim responsibility for any injury to people or property resulting from any ideas, methods, instructions or products referred to in the content. |
© 2026 by the authors. Licensee MDPI, Basel, Switzerland. This article is an open access article distributed under the terms and conditions of the Creative Commons Attribution (CC BY) license (http://creativecommons.org/licenses/by/4.0/).
Copyright: This open access article is published under a Creative Commons CC BY 4.0 license, which permit the free download, distribution, and reuse, provided that the author and preprint are cited in any reuse.


