

Submitted:
19 July 2026
Posted:
21 July 2026
You are already at the latest version
Abstract
Traditional risk stratification for acute necrotizing pancreatitis (ANP) does not account for the anatomical heterogeneity of peripancreatic inflammation. Although the subdivision of peripancreatic lesions into 13 regions based on membrane anatomy has been proposed, whether specific regions are differentially associated with distinct adverse outcomes remains unknown. Methods: This single‑center retrospective cohort study enrolled 318 ANP patients (2022–2025). Thirteen peripancreatic regions were assessed on contrast‑enhanced CT. Multivariable logistic regression and LASSO regression were used to identify independent risk factors for persistent organ failure (POF), infected pancreatic necrosis (IPN), and in‑hospital mortality. A conventional model (APACHE II, CTSI, age, BMI, necrosis grade) and a region‑augmented model were compared for predictive performance. Results: Involvement of the left anterior renal region (R3) independently increased the risk of both POF (OR=2.84) and IPN (OR=2.41). Right perirenal fat capsule involvement (R8) was independently associated with POF (OR=1.91), whereas right anterior renal region involvement (R4) specifically increased IPN risk (OR=2.13). Adding these regional indicators significantly improved model discrimination for POF (AUC 0.82 vs. 0.76, P=0.019) and IPN (AUC 0.79 vs. 0.72, P=0.031), but not for in‑hospital mortality. Conclusions: Different peripancreatic subdivisions have heterogeneous prognostic values in ANP. The left anterior renal region predicts both POF and IPN, the right perirenal fat capsule specifically predicts POF, and the right anterior renal region specifically predicts IPN. These findings provide a refined imaging basis for early risk stratification.
Keywords:
acute necrotizing pancreatitis
; peripancreatic membrane anatomy
; inflammatory lesion subdivision
; persistent organ failure
; infected pancreatic necrosis
1. Introduction
Acute necrotizing pancreatitis (ANP) accounts for 15%–20% of all acute pancreatitis cases, with a mortality rate of 15%–30%, which rises to over 30% when complicated by infected necrosis [1,2]. Despite advancements in intensive care and minimally invasive interventions improving overall prognosis, significant heterogeneity persists in the clinical outcomes among ANP patients. Some patients develop persistent organ failure (POF) or infected pancreatic necrosis (IPN) early in the disease course, whereas others experience a relatively stable clinical trajectory [3]. This variability suggests that, beyond traditional risk factors such as the extent of pancreatic necrosis and the CT severity index (CTSI) [4], unrecognized anatomical factors may modulate the extent and severity of inflammatory spread. Traditional anatomy conceptualizes the peripancreatic region as a loose space filled with adipose tissue, which inadequately explains the clinically observed, relatively fixed distribution pattern of inflammatory lesions in ANP. The development of membrane anatomy theory offers a new explanatory framework. This theory posits that the peripancreatic region is actually composed of potential spaces formed by multiple layers of embryologically derived fascial structures-including Gerota’s fascia, Treitz’s fascia, and the perirenal fat capsule [5,6]. These fascial barriers not only define anatomical boundaries but also determine the diffusion pathways of inflammatory exudate. Raptopoulos et al. [7] initially observed that pancreatic inflammatory exudate could spread along the anterior pararenal fascia into the perirenal space, and Molmenti et al. [8] further confirmed the regular extension of inflammatory material along the retroperitoneal fascial planes. Based on this theoretical framework, Liu et al. [9] subdivided peripancreatic inflammatory lesions in ANP into 13 regions and first demonstrated that the number of involved regions is an independent risk factor for poor prognosis (OR=1.388, AUC=0.747), providing a novel anatomical perspective for understanding the pathological diffusion patterns in ANP. However, a critical information loss exists in the aforementioned study. Reducing the 13 regions to a single “count” metric implicitly assumes that all regions have equivalent prognostic value. From the hierarchical perspective of membrane anatomy, different fascial spaces vary considerably in their anatomical location, adjacent structures, and barrier strength. The perirenal fascial space directly abuts the kidney, and its involvement may more readily precipitate renal impairment. The left Toldt’s fusion fascia is closely apposed to the descending mesocolon, where inflammatory lesions may be more prone to secondary infection due to enteric bacterial translocation. This implies that involvement of different regions may be associated with distinct adverse prognoses, and simply counting the number of involved regions fails to capture these differential clinical risks. At present, which regions are more strongly associated with POF, which regions are more likely to lead to IPN, and which regions indicate an increased risk of death remain unanswered questions. Therefore, this study, grounded in peripancreatic membrane anatomy theory and a retrospective analysis of clinical and imaging data from ANP patients, aims to identify key regions specifically associated with different adverse prognoses and to evaluate the incremental predictive value of regional involvement information beyond traditional risk factors, thereby providing a more refined imaging basis for early risk stratification in patients with ANP.
2. Materials and Methods
2.1. Study Population
This single-center retrospective cohort study was conducted in accordance with the Strengthening the Reporting of Observational Studies in Epidemiology (STROBE) guidelines. The study protocol was approved by the Ethics Committee of Yongzhou Central Hospital (approval number: 2026062901). Owing to the retrospective nature of the study, the committee waived the requirement for informed consent. Consecutive patients with ANP who were hospitalized at Yongzhou Central Hospital between January 2022 and December 2025 were enrolled. All patients met the diagnostic criteria of the Revised Atlanta Classification [4] and had evidence of pancreatic parenchymal and/or peripancreatic necrosis confirmed by contrast-enhanced abdominal computed tomography (CT).
Inclusion criteria: (1) age ≥ 18 years; (2) time from symptom onset to hospital admission ≤ 72 hours; (3) contrast-enhanced abdominal CT performed within 72 hours after admission; and (4) complete clinical data, including vital signs on admission, laboratory test results, and discharge outcome records.
Exclusion criteria: (1) acute exacerbation of chronic pancreatitis; (2) traumatic pancreatitis; (3) pancreatitis secondary to pancreatic malignancy; (4) pre-existing end-stage chronic organ dysfunction before the current episode, including stage 5 chronic kidney disease (on regular dialysis), Child-Pugh class C liver cirrhosis, or New York Heart Association functional class IV heart failure; and (5) prior pancreatic interventions (percutaneous catheter drainage, endoscopic retrograde cholangiopancreatography, etc.) or surgical treatment before admission.
2.2. Sample Size Estimation
The sample size was estimated using the events-per-variable (EPV) method. For clinical prediction model development, 10–15 outcome events per candidate variable are recommended [10]. This study planned to include 8–10 variables. With persistent organ failure (POF, expected incidence ~35%) as the primary outcome, the required sample size was approximately 286 patients. Accounting for a potential 10% of cases with missing data, we planned to enroll 320 patients. In-hospital mortality analysis was conducted as an exploratory aim.
2.3. Data Collection
Data were extracted from the electronic medical record system and the picture archiving and communication system of the Central Hospital of Yongzhou. Two trained researchers independently extracted the data, completed structured case report forms, and cross-checked the entries after completion.
2.3.1. Baseline Data
Demographic characteristics (age, sex, body mass index [BMI] on admission), vital signs on admission (temperature, heart rate, respiratory rate, mean arterial pressure), time from symptom onset to admission, etiology (biliary, hypertriglyceridemic, alcoholic, other), pre-existing comorbidities (hypertension, diabetes mellitus, coronary artery disease), and the Acute Physiology and Chronic Health Evaluation II (APACHE II) score [11] within 24 hours after admission (recording the worst and best values) were collected.
2.3.2. Laboratory Tests
Results of the first venous blood sample obtained within 24 hours after admission were recorded, including routine blood tests (white blood cell count, neutrophil percentage, hemoglobin, platelet count), biochemical parameters (alanine aminotransferase, aspartate aminotransferase, total bilirubin, creatinine, blood urea nitrogen, glucose, serum calcium, triglycerides, cholesterol), coagulation function (prothrombin time, activated partial thromboplastin time, international normalized ratio), and arterial blood gas analysis (oxygenation index, lactate, pH).
2.3.3. Imaging Data
Contrast-enhanced abdominal CT images acquired within 72 hours after admission were used to evaluate the CTSI [12] and involvement of the 13 peripancreatic regions. CT scans were performed using a GE Lightspeed VCT 64-model multidetector CT scanner (e.g., GE Healthcare Discovery CT750 HD or Siemens SOMATOM Definition Flash). Scanning parameters were as follows: tube voltage 120 kV, automatic tube current modulation (100–400 mA), slice thickness 1.25 mm or 2.0 mm, reconstruction thickness 2 mm, and pitch 1.0–1.5. For contrast-enhanced scanning, a non-ionic iodinated contrast agent (iopromide or iohexol, 300–370 mg I/mL) was injected via a power injector through an antecubital vein at a dose of 1.5 mL/kg body weight and an injection rate of 3–4 mL/s. Triple-phase scanning was performed with the following timings: arterial phase 25–30 s, pancreatic phase 45–50 s, and portal venous phase 70–80 s.
2.4. Predictor Variable Definitions and Measurements
2.4.1. Conventional Imaging Indicators
The extent of pancreatic necrosis was independently assessed by two radiologists based on the proportion of non-enhancing pancreatic parenchyma relative to the total pancreatic volume on contrast-enhanced CT images, categorized into three grades: <30%, 30%–50%, and >50% [12]. The CTSI [12] was calculated as the sum of the grade of pancreatic inflammation (0–4 points) and the grade of pancreatic necrosis (0–6 points), yielding a total score ranging from 0 to 10.
2.4.2. Subdivision of Inflammatory Lesions
Peripancreatic inflammatory lesions were subdivided into 13 regions according to the method established by Liu et al. [9] based on peripancreatic membrane anatomy. The anatomical boundaries, CT identification criteria, and corresponding membrane anatomy basis for each region are detailed in Table 1. Two attending radiologists, blinded to the clinical outcomes, independently interpreted all CT images. Before formal interpretation, they underwent standardized training consisting of: (1) a 2-hour lecture on the theoretical basis of membrane anatomy; (2) a 2-hour session explaining the CT identification criteria for each of the 13 regions; and (3) a reading exercise of 20 typical cases (not part of the study cohort). Before the formal reading, 20 non-study cases were randomly selected to assess inter-observer agreement, and the Kappa coefficient for each region was calculated, with a target value >0.75. For each patient in the formal study, each of the 13 regions was recorded as involved (1) or not involved (0), generating binary variables. In case of disagreement, a third radiologist (associate chief physician) arbitrated the final result.
2.5. Outcome Definitions
The following three outcomes were analyzed separately and were not combined into a composite endpoint.
2.5.1. POF
Organ function was assessed using the Sequential Organ Failure Assessment (SOFA) score [13], which includes six systems: respiratory (PaO₂/FiO₂), circulatory (mean arterial pressure or vasopressor use), renal (creatinine or urine output), hepatic (total bilirubin), coagulation (platelet count), and neurological (Glasgow Coma Scale). Each system is scored from 0 to 4. POF was defined as a score of ≥2 in any of the six systems persisting for ≥48 hours. Renal failure alone was defined as a renal SOFA score ≥2 (creatinine >1.9 mg/dL or urine output <500 mL/24 h).
2.5.2. IPN
The diagnosis of IPN was based on any of the following criteria [14]: (1) positive bacterial or fungal culture from CT-guided fine-needle aspiration; or (2) presence of gas bubbles (air sign) within necrotic foci on contrast-enhanced CT. All aspiration procedures were performed under CT or ultrasound guidance, and the specimens were sent to the Department of Microbiology of the Central Hospital of Yongzhou for aerobic, anaerobic, and fungal culture, with a culture duration of ≥5 days.
2.5.3. In-Hospital Mortality
Death from any cause during hospitalization, ascertained from death certificates or discharge records. Data on all outcomes were collected independently by two researchers who did not participate in the image interpretation. After cross-checking for consistency, the data were entered into the database. Outcome assessors were blinded to the regional involvement status.
2.6. Covariates
The following covariates were included to control for confounding bias: age (continuous, years), sex (male/female), BMI on admission (continuous, kg/m²), etiology (biliary, hypertriglyceridemic, alcoholic, other), history of diabetes mellitus (yes/no), history of hypertension (yes/no), history of coronary artery disease (yes/no), extent of pancreatic necrosis (<30%, 30%–50%, >50%), CTSI score (continuous, 0–10), and APACHE II score (continuous, 0–71). BMI was calculated as admission body weight (kg) divided by the square of height (m). The APACHE II score [5] was calculated based on the worst physiological parameters within 24 hours after admission, together with age and chronic health status.
2.7. Statistical Analysis
All statistical analyses were performed using R software (version 4.2.3). A two-sided α level of 0.05 was used, and confidence intervals (CIs) were calculated at the 95% level. Normality of continuous variables was assessed using the Kolmogorov-Smirnov test. Normally distributed continuous variables are presented as mean ± standard deviation, non-normally distributed continuous variables as median (interquartile range), and categorical variables as frequency (percentage). For key variables with missing data, complete-case analysis was applied when the missing rate was <5%, multiple imputation when the missing rate was 5%–15%, and the missing pattern was reported when the missing rate exceeded 15%. Outliers in continuous variables were either excluded after verification or retained and reported.
Twenty non-study cases were randomly selected to evaluate inter-observer agreement for regional involvement using the Kappa coefficient, with Kappa >0.75 indicating good agreement. Univariate analyses were performed separately for the outcomes of POF, IPN, and in-hospital mortality: normally distributed variables were analyzed using Student’s t-test, non-normally distributed variables using the Mann-Whitney U test, and categorical variables using the chi-square test or Fisher’s exact test. Variables with P <0.10 were entered into the least absolute shrinkage and selection operator (LASSO) regression.
LASSO regression was used for variable selection. The optimal model was determined by 10-fold cross-validation with the 1-standard error (1-SE) criterion. The stability of selected variables was validated by 500 bootstrap resamples, and variables selected in ≥70% of resamples were considered stable key variables. These stable key variables were then entered into multivariable logistic regression models to construct the conventional model (Model A) and the region-augmented model (Model B). Variables were entered using the Enter method, and multicollinearity was assessed using the variance inflation factor (VIF <5). For the low-incidence outcome (in-hospital mortality), Firth’s penalized likelihood regression was applied. Results were visualized as forest plots.
Model performance was compared using the area under the receiver operating characteristic curve (AUC), net reclassification improvement (NRI), and integrated discrimination improvement (IDI). Differences in AUC were tested using the DeLong test. The 95% CIs for NRI and IDI were calculated using 1000 bootstrap resamples. Four sensitivity analyses were performed to test the robustness of the results: (1) 500 bootstrap resamples; (2) exclusion of rarely involved regions; (3) exclusion of patients who developed early organ failure (within 48 hours); and (4) raising the SOFA score threshold for defining POF.
3. Results
3.1. Patient Selection and Baseline Characteristics
This single-center retrospective cohort study strictly followed the predefined inclusion and exclusion criteria for patient selection. During the study period, a total of 472 patients with acute pancreatitis were screened. Among them, 105 did not meet the diagnostic criteria for ANP, 29 had received interventional or surgical treatment before admission, 15 had pre-existing end-stage organ dysfunction, and 6 had incomplete clinical or imaging data. Ultimately, 318 patients with ANP were included in the statistical analysis. The patient selection process is illustrated in Figure 1.
The enrolled patients ranged in age from 19 to 78 years, with a median age of 51.00 (41.00, 62.00) years. There were 187 males (58.81%) and 131 females (41.19%). Based on the occurrence of POF during hospitalization, patients were divided into a POF group (n=102, 32.08%) and a non-POF group (n=206, 64.78%). Comparison of baseline data between the two groups showed that the POF group had significantly higher age, greater body mass index (BMI), longer time from symptom onset to admission, higher prevalence of hypertension and diabetes mellitus, and significantly higher APACHE II scores (all P<0.05). No significant differences were observed between the two groups in sex distribution, etiological composition, or prevalence of coronary artery disease (P>0.05). Detailed data are presented in Table 2.
3.2. Laboratory Parameters
Laboratory data analysis revealed that the POF group exhibited more severe systemic inflammatory responses, with significantly elevated white blood cell count and neutrophil percentage. In addition, the POF group had more pronounced renal impairment, tissue hypoperfusion, and hypocalcemia, as reflected by significantly higher levels of creatinine, blood urea nitrogen, and lactate, and significantly lower levels of serum calcium and oxygenation index. Some parameters were non-normally distributed and are presented as median (interquartile range); intergroup differences were verified using the Mann-Whitney U test, which showed trends consistent with normally distributed parameters, collectively indicating more prominent internal environment disturbances and organ damage in POF patients (Table 3).
3.3. Imaging Characteristics and Peripancreatic Regional Involvement Pattern
3.3.1. Conventional Imaging Indicators
In the overall cohort, the extent of pancreatic necrosis was <30% in 142 patients (44.65%), 30%–50% in 115 patients (36.16%), and >50% in 61 patients (19.18%). The proportion of patients with pancreatic necrosis >50% was significantly higher in the POF group than in the non-POF group (31.37% vs. 13.59%, P<0.001). The mean CTSI score for the entire cohort was 6.85±2.17. The median CTSI score in the POF group (8.00 [6.00, 9.00]) was significantly higher than that in the non-POF group (5.00 [4.00, 7.00]; Z=5.470, P<0.001), indicating more severe pancreatic and peripancreatic inflammation and necrosis in POF patients.
3.3.2. Involvement Pattern of the 13 Peripancreatic Regions
The inter-observer agreement for regional involvement between the two radiologists was good, with a Kappa value of 0.824, meeting the reliability requirement. Peripancreatic regional involvement showed a clear membrane anatomy-dependent distribution, with the pancreatic head-duodenal region (R2, 65.41%) and the lesser omental bursa region (R1, 58.18%) being the most frequently involved. The POF group exhibited a characteristic pattern of high involvement rates in the bilateral anterior renal/perirenal and lateral abdominal wall regions, with significantly higher involvement rates for regions R3, R4, R7, R8, R9, and R10, suggesting that involvement of these regions is closely associated with the development of POF. Detailed data are presented in Table 4.
3.4. Univariate and LASSO Regression for Key Variable Selection
3.4.1. Univariate Analysis
With POF as the outcome, univariate analysis identified 11 candidate variables with P<0.10: age, BMI, APACHE II score, CTSI score, pancreatic necrosis >50%, and involvement of regions R3, R4, R7, R8, R9, and R10. These variables were used as the basis for subsequent multivariable selection. Detailed data are presented in Table 5.
3.4.2. LASSO Regression for Variable Selection
To eliminate collinearity and select the optimal prognostic subset, LASSO regression combined with 10-fold cross-validation and the 1-SE criterion was performed. After internal validation with 500 bootstrap resamples, six stable key variables were finally identified: APACHE II score, CTSI score, involvement of region R3, involvement of region R4, involvement of region R7, and involvement of region R8. All had selection probabilities ≥70%, indicating good stability.
3.5. Multivariable Logistic Regression Analysis of Independent Risk Factors for Different Adverse Prognoses
Based on the LASSO selection results, multivariable logistic regression models were constructed for the outcomes of POF, IPN, and in-hospital mortality, adjusting for confounders including age, sex, and BMI. The results showed that APACHE II score, CTSI score, involvement of region R3, and involvement of region R8 were independent risk factors for POF; pancreatic necrosis >50%, involvement of region R3, and involvement of region R4 were independent risk factors for IPN; and higher APACHE II score and higher CTSI score were independent risk factors for in-hospital mortality. Firth’s penalized likelihood regression was used for the in-hospital mortality model to control for small-sample bias. Detailed data are presented in Table 6.
3.6. Predictive Performance and Incremental Value of Conventional vs. Region-Augmented Models
A conventional model (Model A: including APACHE II score, CTSI score, age, BMI, and pancreatic necrosis grade) and a region-augmented model (Model B: Model A plus key regional involvement indicators) were constructed to evaluate predictive performance. The results showed that for the outcomes of POF and IPN, Model B had a significantly higher AUC than Model A, with statistically significant differences by the DeLong test. The NRI and IDI both exceeded the threshold for clinically significant improvement, indicating that peripancreatic regional involvement information significantly improves the predictive ability of the conventional model for POF and IPN. For in-hospital mortality, the incremental value of Model B was not significant. Detailed data are presented in Table 7.
3.7. Sensitivity Analyses
The four sensitivity analyses yielded stable results. Bootstrap resampling showed that the ORs of the key variables fluctuated minimally and their 95% CIs did not cross 1. After excluding rarely involved regions, excluding patients who developed POF within 48 hours, and raising the SOFA score threshold for defining POF, involvement of regions R3, R4, and R8 remained independent risk factors for POF/IPN, and the predictive performance of Model B remained consistently superior to that of Model A, confirming the good robustness of the findings.
4. Discussion
Based on peripancreatic membrane anatomy theory, this retrospective analysis of 318 patients with ANP systematically evaluated the associations between different peripancreatic inflammatory lesion subdivisions and three adverse prognoses. The results demonstrated significant heterogeneity in the prognostic value of individual peripancreatic regions: involvement of the left anterior renal region (region R3) was a shared independent risk factor for both POF and IPN; involvement of the right perirenal fat capsule (region R8) was independently associated with POF beyond traditional risk factors; and involvement of the right anterior renal region (region R4) specifically increased the risk of IPN.
4.1. Dual Prognostic Significance of Left Anterior Renal Region Involvement and Its Anatomical Basis
This study found that involvement of region R3 independently increased the risk of both POF (OR=2.84, 95% CI: 1.58–5.12) and IPN (OR=2.41, 95% CI: 1.29–4.50), with results remaining stable across four sensitivity analyses, suggesting that region R3 occupies a special pivotal position in the pathological progression of ANP. Anatomically, region R3 corresponds to the area covered by the left Toldt’s fusion fascia. Sala et al. [15] clearly indicated in anatomical literature that the white line of Toldt represents the lateral boundary of the potential space in retroperitoneal diseases, and that inflammatory exudate in ANP can spread along this space. The Toldt fascia is anterior to the descending colon and its mesentery, posterior to the left kidney and perirenal fat capsule, and medially continuous with the pancreatic body and tail, constituting an important channel for the spread of pancreatic inflammatory exudate into the left retroperitoneal space. Xu et al. [16], based on CT images from 556 ANP patients and anatomical dissections of 10 adult cadavers, confirmed that peripancreatic fasciae and fascial spaces can be clearly identified on CT images, consistent with cadaveric anatomy. The bilateral anterior renal fasciae are continuously connected, and the pancreatic fascial spaces are divided into anterior and posterior pancreatic spaces, with a fused fascial space existing between the posterior pancreatic fascia and the anterior renal fascia [16]. That study validated the existence of peripancreatic fascial spaces as channels for inflammatory spread at the anatomical level, providing anatomical support for the association between region R3 involvement and adverse prognoses observed in the present study.
The impact of region R3 involvement on IPN can be explained from the perspective of anatomical pathways for bacterial translocation. A systematic review and meta-analysis by Wang et al. [17] including 31 observational studies found that advanced age, biliary etiology, pancreatic necrosis extent exceeding 50%, delayed resumption of enteral nutrition, and multiple organ failure were closely associated with an increased risk of IPN. During the course of ANP, intestinal motility dysfunction, microcirculatory disturbances, and ischemia-reperfusion injury lead to increased intestinal permeability, and gut microbiota dysbiosis promotes bacterial translocation, which in turn triggers infection of pancreatic and peripancreatic necrotic tissue [18]. Zhang et al. [18] used multi-omics analysis to reveal that after severe ANP, there is overgrowth of flagellated bacteria in the gut, upregulation of intestinal Toll-like receptor 5 (TLR5), enhanced acute inflammatory responses, and high expression of TLR5 on lamina propria dendritic cells, activating the intestinal flagellin-TLR5 signaling pathway and leading to intestinal barrier disruption and bacterial translocation. The anatomical particularity of region R3 involvement lies in the close apposition of the left Toldt’s fusion fascia to the descending mesocolon, which is rich in lymphoid tissue and migratory immune cells. Once inflammatory exudate opens this potential anatomical plane, a low-resistance channel from the intestinal lumen to the peripancreatic necrotic area is formed. In the present study, the incidence of IPN in patients with region R3 involvement was 38.15%, significantly higher than the 14.21% in those without involvement, clinically corroborating the above mechanism.
The association between region R3 involvement and POF can be analyzed from the perspectives of inflammatory mediator spread and local renal anatomy. The perirenal space is a retroperitoneal space located between the anterior and posterior renal fasciae, divided into multiple compartments by thin fibrous bridging septa (Kunin’s septa), and contains the kidney, adrenal gland, proximal ureter, perirenal vessels, lymphatics, and adipose tissue [19,20]. Region R3 is immediately posterior to the left kidney and renal vessels; inflammatory exudate and its contained mediators in this area can directly spread to the perirenal fat capsule through the septal system within the perirenal space, affecting renal blood flow and glomerular filtration rate. Kunin et al. [20] noted that when ANP involves the perirenal space, CT findings include thickening of the bridging septa or fat edema, and in severe cases, cellulitis or fluid collection may appear; pancreatic-derived inflammatory edema or fluid mainly enters the perirenal space by spreading through the perirenal septa or by disrupting the renal fascia. When inflammatory lesions in region R3 breach the anterior renal fascia and invade the perirenal fat capsule, inflammatory mediators gain the anatomical access to enter the systemic circulation, thereby triggering or amplifying systemic inflammatory response syndrome (SIRS), which is a core driver of POF. In the present study, patients in the POF group had significantly elevated white blood cell counts, neutrophil percentages, and lactate levels, indirectly supporting the existence of this pathway. Zhang et al. [21] found in a retrospective cohort study of 208 ANP patients that visceral adipose tissue area was an independent risk factor for predicting major adverse kidney events within 30 days in ANP patients (OR=1.01, 95% CI: 1.01–1.02, P<0.001), and patients with visceral adipose area >200 cm² had a higher requirement for renal replacement therapy (32% vs. 12%). That study revealed the mechanism by which peripancreatic fat participates in acute kidney injury from the perspective of adipose tissue, complementing the association between region R3 involvement and renal impairment identified from the fascial space perspective in the present study.
Previous work by Liu et al. [9] based on 197 ANP patients first subdivided peripancreatic inflammatory lesions into 13 regions and demonstrated that the number of involved regions is an independent risk factor for poor prognosis (OR=1.388, AUC=0.747). However, that approach reduced the 13 regions to a single count metric, implicitly assuming that all regions have equivalent prognostic value. The present study further reveals the differential prognostic significance of individual regions, confirming that involvement of the left anterior renal region has a much greater impact on prognosis than other regions, representing a substantial deepening of the work by Liu et al. [9]. In clinical practice, for ANP patients in whom CT images already show signs of region R3 involvement, clinicians should be highly vigilant about the subsequent development of IPN and POF and consider earlier initiation of more aggressive anti-infection therapy and organ function support.
4.2. Specific Association of Right Perirenal Fat Capsule Involvement with Persistent Organ Failure
This study found that involvement of region R8 was an independent risk factor for POF (OR=1.91, 95% CI: 1.08–3.37), whereas involvement of the left perirenal fat capsule (region R7), although showing a statistically significant difference in univariate analysis, did not enter the final model after LASSO and multivariable adjustment. This asymmetric phenomenon warrants in-depth exploration. Anatomically, the perirenal fat capsule is located between the anterior and posterior renal fasciae, forming a relatively closed potential space. Garrett et al. [19] noted in an anatomical review that the perirenal space is inverted cone-shaped, extending from the diaphragmatic fascia to the iliac fossa, with the anterior renal fascia being a thin layer of connective tissue and the posterior renal fascia being relatively thick; the bilateral perirenal spaces can communicate across the midline and connect with the pelvic retroperitoneal space. However, differences exist in the fascial continuity between the right and left perirenal spaces: the right perirenal space has a direct fascial continuity with the posterior wall of the pancreatic head and duodenum via the right Treitz’s fusion fascia, an anatomical connection that makes necrotizing inflammation in the pancreatic head region more likely to extend toward the right perirenal region. Mike and Kano [22] noted in an anatomical study of complete mesocolic excision in right hemicolectomy that the mesocolic fascia attaches to the parietal peritoneal fascia along the mesenteric-peritoneal interface and, cranially, attaches to the anterior pancreaticoduodenal fascia along the mesenteric-duodenopancreatic interface. The direct continuity between the right Toldt fascia and the posterior wall of the pancreatic head and duodenum provides an anatomical pathway for the spread of inflammation from the pancreatic head region to the right perirenal region.
After inflammatory exudate from the pancreatic head region spreads along this plane into the right perirenal fat capsule, it can exacerbate systemic organ dysfunction through two pathways. First, the rich lymphatic network within the perirenal space communicates directly with the thoracic duct and systemic circulation; once inflammatory mediators enter the perirenal lymphatic system, they can rapidly reach the systemic circulation, triggering or amplifying SIRS. Second, the posteromedial aspect of the right perirenal fat capsule is adjacent to the right renal hilum and the inferior vena cava; extrinsic compression or inflammatory infiltration of these vessels by inflammatory exudate can impair renal function by affecting venous return and renal perfusion. Kumar et al. [23] reported in a study of 645 ANP patients that an admission APACHE-II score ≥8 predicted severe ANP with an AUC of 0.941 (accuracy 91%), whereas the modified CTSI (mCTSI) score had an AUC of 0.787 (accuracy 73.7%); the APACHE-II score was superior to the mCTSI score in predicting IPN and death, but the mCTSI score had an advantage in assessing the need for intervention, and the two have complementary value in clinical management [24]. That study suggests that anatomical scores and systemic scores have different emphases, and the introduction of region R8 information in the present study may partially compensate for the shortcomings of conventional imaging indicators in predicting POF. The region-augmented model constructed by our team for POF achieved an AUC of 0.82, significantly higher than the conventional model’s AUC of 0.76 (DeLong test P=0.019), with an NRI of 0.33 (95% CI: 0.11–0.54), quantitatively validating the incremental predictive value of region R8 information. Xing et al. [24] developed and validated a nomogram combining pain scores and laboratory indicators for predicting POF in ANP patients, also emphasizing the importance of integrating multi-dimensional information to improve POF prediction performance. Notably, in the present study, the incidence of POF in patients with region R8 involvement was 43.14%, similar to the 44.57% in patients with region R7 involvement, but only region R8 retained statistical significance after multivariable adjustment. One possible explanation for this difference is that the right anatomical pathway is more directly associated with systemic inflammatory amplification-inflammation in the pancreatic head may enter the systemic circulation more rapidly via the right perirenal space. Another possibility is sample size limitations or unbalanced distribution of confounding factors, which await validation in larger prospective studies.
4.3. Specific Association of Right Anterior Renal Region Involvement with Infected Pancreatic Necrosis
In this study, involvement of region R4 was an independent risk factor for IPN (OR=2.13, 95% CI: 1.14–3.96) but did not enter the final model for POF. This regional specificity suggests a pathway-dependent relationship between inflammatory lesions in different anatomical regions and different complications. Region R4 corresponds to the right Toldt’s fusion fascia. Garrett et al. [19] noted in their anatomical review that the retroperitoneal space is divided into three main anatomical compartments: the anterior pararenal space, the perirenal space, and the posterior pararenal space, with the anterior pararenal space containing the pancreatic head, neck, and body, the ascending and descending colons, and the duodenum (excluding the first part). There is a fascial continuity between the right Toldt’s fascia and the anterior pancreatic head-duodenal region, constituting an important pathway for rightward extension of inflammation from the pancreatic head. Similar to the left side, involvement of the right Toldt’s fascia implies that inflammatory lesions have extended to the root of the ascending mesocolon, providing an anatomical pathway for bacterial migration from the colon to the peripancreatic necrotic tissue. However, compared with region R3, region R4 is more specifically associated with IPN than with POF. This lateral difference may arise from inherent anatomical and microecological differences between the right and left colons. The contents of the ascending colon are more liquid, with higher bacterial density and a greater proportion of facultative anaerobes; these characteristics make the risk of bacterial translocation higher after right Toldt’s fascia involvement, with easier colonization and infection formation in peripancreatic necrotic tissue. Furthermore, there is no substantive fascial barrier between the ascending mesocolon and the pancreatic head-duodenal region; the anatomical pathway for direct spread of inflammatory exudate from the pancreatic head region to the root of the ascending mesocolon is shorter, potentially further shortening the time window for progression from sterile inflammation to infected necrosis. The meta-analysis by Wang et al. [17] also indicated that an admission APACHE II score >8, persistent SIRS, and elevated levels of C-reactive protein, procalcitonin, and lipase are risk factors for IPN. The prospective cohort study by Lamichhane et al. [25] compared the value of multiple scoring systems for predicting ANP outcomes and showed that a single scoring system cannot comprehensively assess disease severity, and that integration of multi-dimensional indicators is key to improving predictive accuracy. The findings of the present study suggest that the specific distribution location of peripancreatic inflammatory lesions is also a risk dimension that cannot be ignored.
4.4. In-Hospital Mortality Is Associated Only with Traditional Severity Scores
This study did not identify any independent regional variable significantly associated with in-hospital mortality; only APACHE II score (OR=1.57, 95% CI: 1.10–2.24) and CTSI score (OR=1.36, 95% CI: 1.01–1.83) entered the final model. This negative finding defines the scope of applicability and limitations of regional information. In-hospital mortality is the most severe endpoint event in ANP, and its occurrence typically requires the accumulation of multiple unfavorable factors, including persistent POF, IPN complicated by sepsis, and multiple organ dysfunction syndrome. Regional involvement reflects the spatial distribution characteristics of inflammatory lesions, whereas mortality risk depends more on systemic factors such as the total burden of the inflammatory response, the patient’s physiological reserve, and treatment response. Kumar et al. [23] showed that the AUC of the APACHE-II score for predicting mortality was 0.947 (accuracy 83.1%), whereas the AUC of the mCTSI score for predicting mortality was only 0.790 (accuracy 67.6%). Singh et al. [26] compared the accuracy of the Ranson, Glasgow-Imrie, APACHE-II, and BISAP scores for predicting severe ANP and in-hospital mortality, confirming that the APACHE-II score outperforms other scoring systems in predicting mortality. Another study also found that a Ranson score >4 increased mortality risk 9.07-fold (P=0.038) [1]. The APACHE II score integrates age, chronic health status, and acute physiological derangements, representing the patient’s systemic physiological reserve; the CTSI score quantifies the degree of anatomical destruction of the pancreas and peripancreatic region, representing the severity of local pathology. The two collectively assess disease severity from both systemic and local dimensions, thus being superior to a single anatomical regional indicator for predicting mortality. The APACHE II score utilizes physiological derangement parameters, whereas the CTSI score analyzes anatomical abnormalities; the former provides better predictive value for the progression of multi-organ involvement. In the present study, the region-augmented model did not significantly improve predictive performance for mortality (AUC increased from 0.74 to 0.75, P=0.560). This finding does not negate the clinical value of regional information but rather suggests that its applicability should focus on the prediction of intermediate-term complications. For complications directly driven by local anatomical factors such as POF and IPN, regional information has clear incremental value; for a death outcome involving multi-system interactions and dominated by systemic factors, the independent contribution of regional information is limited. This understanding is crucial for clinicians to appropriately apply regional information: regional information helps in early identification of high-risk patients for POF and IPN but should not be used alone for direct stratification of mortality risk, which still relies on integrated scoring systems such as APACHE II and CTSI.
4.5. Limitations and Future Directions
This study has several limitations. First, although the single-center retrospective design employed strict inclusion/exclusion criteria and blinded interpretation, it cannot completely eliminate selection bias and information bias. Second, the sample size remained insufficient for the exploratory analysis of in-hospital mortality; the number of events (36 cases) only met the basic requirements for Firth’s penalized regression, potentially causing some clinically meaningful regional variables to fail to reach statistical significance. Third, although CT interpretation of peripancreatic regions was performed after standardized training and Kappa coefficients exceeded 0.75, some subjectivity remains in interpreting inflammatory lesions with ill-defined borders or those involving multiple regions simultaneously. Fourth, dynamic data on inflammatory markers were not included in this study, and the interactions between these markers and regional involvement remain unclear. Future prospective, multicenter studies are needed to further validate our findings and to explore the incremental predictive value of combining regional information with biomarkers. In addition, based on the findings of this study, early intervention studies targeting patients with involvement of regions R3, R4, and R8 could be conducted to verify whether enhanced anti-infection therapy or early organ function support improves prognosis in these high-risk patients.
5. Conclusions
In this retrospective cohort study based on peripancreatic membrane anatomy, we found that individual subdivisions of peripancreatic inflammatory lesions in acute necrotizing pancreatitis have distinct prognostic values. Involvement of the left anterior renal region (R3) was an independent risk factor for both persistent organ failure and infected pancreatic necrosis. Right perirenal fat capsule involvement (R8) independently predicted persistent organ failure, whereas right anterior renal region involvement (R4) specifically increased the risk of infected pancreatic necrosis. Adding these regional indicators to a conventional model significantly improved the prediction of persistent organ failure and infected pancreatic necrosis, but did not improve the prediction of in-hospital mortality, which remained associated with APACHE II and CTSI scores. These results suggest that peripancreatic regional involvement information can refine early risk stratification for ANP, though prospective multicenter validation is needed.
Supplementary Materials
The following supporting information can be downloaded at the website of this paper posted on Preprints.org, Figure 1: Flowchart of patient selection; Table 1: The 13 peripancreatic regions in patients with acute necrotizing pancreatitis: CT identification criteria and membrane anatomy basis; Table 2: Comparison of baseline clinical characteristics between the POF and non-POF groups; Table 3: Comparison of laboratory parameters between the POF and non-POF groups; Table 4: Comparison of involvement of the 13 peripancreatic regions between the POF and non-POF groups; Table S5: Candidate variables associated with persistent organ failure in univariate analysis; Table S6: Multivariable logistic regression analysis: independent risk factors for different adverse prognoses; Table S7: Comparison of predictive performance between conventional and region-augmented models.
Author Contributions
Conceptualization, J.H. and G.D.; methodology, J.H.; formal analysis, J.H.; investigation, J.H.; data curation, J.H.; writing—original draft preparation J.H.; writing—review and editing, G.D. All authors have read and agreed to the published version of the manuscript.
Funding
This research was funded by Health Research Project of Hunan Provincial Health Commission (grant number 20258131) and the Yongzhou Guiding Science and Technology Plan Project (grant number 2025YZ006), both awarded to Jing He.
Institutional Review Board Statement
The study was conducted in accordance with the Declaration of Helsinki, and approved by the Institutional Review Board (or Ethics Committee) of Yongzhou Central Hospital Medical Ethics Committee (protocol code 2026062901).
Informed Consent Statement
Patient consent was waived due to the retrospective nature of the study and the complete anonymization of participant information, since the risk to subjects was no more than minimal and it was logistically impossible to re-contact all eligible historical participant for individual consent.
Acknowledgments
We are grateful to the participants who so generously contributed their time to this study for no remuneration.
Conflicts of Interest
The authors declare no conflicts of interest.
Abbreviations
The following abbreviations are used in this manuscript:
| ANP | Acute necrotizing pancreatitis |
| POF | Persistent organ failure |
| IPN | Infected pancreatic necrosis |
| CT | Computed tomography |
| CTSI | CT severity index |
| mCTSI | The modified CTSI |
| APACHE II | The Acute Physiology and Chronic Health Evaluation II |
| AUC | Area Under Curve |
| OR | Odds Ratio |
| STROBE | The Strengthening the Reporting of Observational Studies in Epidemiology |
| EPV | The events-per-variable |
| LASSO | Least Absolute Shrinkage and Selection Operator |
| CIs | Confidence intervals |
| BMI | Body Mass Index |
| SOFA | The Sequential Organ Failure Assessment |
| NRI | Net reclassification improvement |
| IDI | Integrated discrimination improvement |
| TLR5 | Toll-like receptor 5 |
| SIRS | Systemic inflammatory response syndrome |
References
- Boxhoorn L, Voermans RP, Bouwense SA, et al. Acute pancreatitis. Lancet, 2020, 396(10252): 726-734.
- Heckler M, Hackert T, Hu K, et al. Severe acute pancreatitis: surgical indications and treatment. Langenbecks Arch Surg, 2021, 406(3): 521-535.
- Leppäniemi A, Tolonen M, Tarasconi A, et al. 2019 WSES guidelines for the management of severe acute pancreatitis. World J Emerg Surg, 2019, 14: 27.
- Banks PA, Bollen TL, Dervenis C, et al. Classification of acute pancreatitis-2012: revision of the Atlanta classification and definitions by international consensus. Gut, 2013, 62(1): 102-111.
- Coffey JC, Dillon M, Sehgal R, et al. Mesenteric-based surgery exploits gastrointestinal, peritoneal, mesenteric and fascial continuity from duodenojejunal flexure to the anorectal junction-a review. Dig Surg, 2015, 32(4): 291-300.
- Boekestijn B, Wasser MNJM, Mieog JSD, et al. Retroperitoneum revisited: a review of radiological literature and updated concept of retroperitoneal fascial anatomy with imaging features and correlating anatomy. Surg Radiol Anat, 2024, 46(8): 1165-1175.
- Xu YL, Ye CJ, Tan B, et al. Evaluation of inflammatory infiltration in the retroperitoneal space of acute pancreatitis using computer tomography and its correlation with clinical severity. Contrast Media Mol Imaging, 2023, 2023: 7492293.
- Molmenti EP, Balfe DM, Kanterman RY, et al. Anatomy of the retroperitoneum: observations of the distribution of pathologic fluid collections. Radiology, 1996, 200(1): 95-103.
- Liu XW, Li GG, Liu Y, et al. Preliminary study on the partitioning of inflammatory lesions in acute necrotizing pancreatitis. Chin J Hepatobiliary Surg, 2024, 30(6): 445-450.
- Riley RD, Ensor J, Snell KIE, et al. Calculating the sample size required for developing a clinical prediction model. BMJ, 2020, 368: m441.
- Capurso G, Lenti MV, Testoni SG, et al. Clinical usefulness of scoring systems to predict severe acute pancreatitis: a systematic review and meta-analysis with pre and post-test probability assessment. United European Gastroenterol J, 2023, 11(9): 825-836.
- Huang S, Liu Y, Wang Z, et al. Comparison of the predictive value of different assessment times in the severity and prognostic outcomes of CTSI in patients with acute pancreatitis: a systematic review and meta-analysis. Abdom Radiol (NY), 2025, 50(3): 1234-1243.
- Jones MR, Dettmer M, Wyncoll D, et al. The Sequential Organ Failure Assessment (SOFA) score: has the time come for an update? Crit Care, 2023, 27(1): 15.
- Le TB, Tran V, Nguyen H, et al. Application of the modified computed tomography severity index and retroperitoneal extension classification for evaluation of acute pancreatitis. Int J Gastrointest Interv, 2025, 14(2): 51-56.
- Sala MA, Leavitt J, Worsley C. White line of Toldt. Radiopaedia, 2023. [CrossRef]
- Xu M, Zhang P, Wang G, et al. Anatomical observation of adult cadavers comparing with CT images about peri-pancreatic fascia and fascial space. Egypt J Radiol Nucl Med, 2025, 56: 13.
- Wang L, Li P, Xu W, et al. Risk factors for concomitant infectious pancreatic necrosis in patients with severe acute pancreatitis: a systematic review and meta-analysis. Clin Res Hepatol Gastroenterol, 2022, 46(5): 101901.
- Zhang C, Zhang Y, Xu T, et al. Exploring the mechanism of intestinal bacterial translocation after severe acute pancreatitis: the role of Toll-like receptor 5. Gut Microbes, 2025, 17(1): 2489768.
- Garrett M, Samra NS. Anatomy, abdomen and pelvis, retroperitoneum. In: StatPearls [Internet]. Treasure Island (FL): StatPearls Publishing, 2023.
- Kunin M. Bridging septa of the perirenal space: structure, function, and clinical significance. Radiology, 1986, 158(3): 663-668.
- Zhang X, Mao W, Ke L, et al. Visceral adipose tissue area predicts major adverse kidney events in patients with acute necrotizing pancreatitis. Am J Med Sci, 2024, 369(2): 152-159.
- Mike M, Kano N. The retrocolic fascial system revisited for right hemicolectomy with complete mesocolic excision based on anatomical terminology: do we need the eponyms Toldt, Gerota, Fredet and Treitz? Surg Radiol Anat, 2023, 45(5): 567-578.
- Kumar A, Singh A, Chaudhary V, et al. Chasing clarity in acute pancreatitis: comparing computed tomography severity index and APACHE-II score in predicting severity in Indian patients. Curr Probl Diagn Radiol, 2025, 54(2): 127-133.
- Xing J, Xu J, Xu M, et al. Development and validation of a nomogram combining pain score with laboratory indicators for predicting persistent organ failure in acute pancreatitis: a retrospective cohort study. Front Med (Lausanne), 2024, 11: 1411288.
- Lamichhane S, Yadav DK, Shrestha S, et al. Role of scoring systems in prognosticating outcomes of patients with acute pancreatitis: a prospective cohort study. Cureus, 2025, 17(2): e79738.
- Aktaş AA, Topal F, Topal NB, et al. Comparison of the effectiveness of different scoring systems and biochemical markers in determining the severity and complications of acute pancreatitis. Turk J Med Sci, 2025, 55(2): 451-460.
Figure 1.
Flowchart of patient selection.
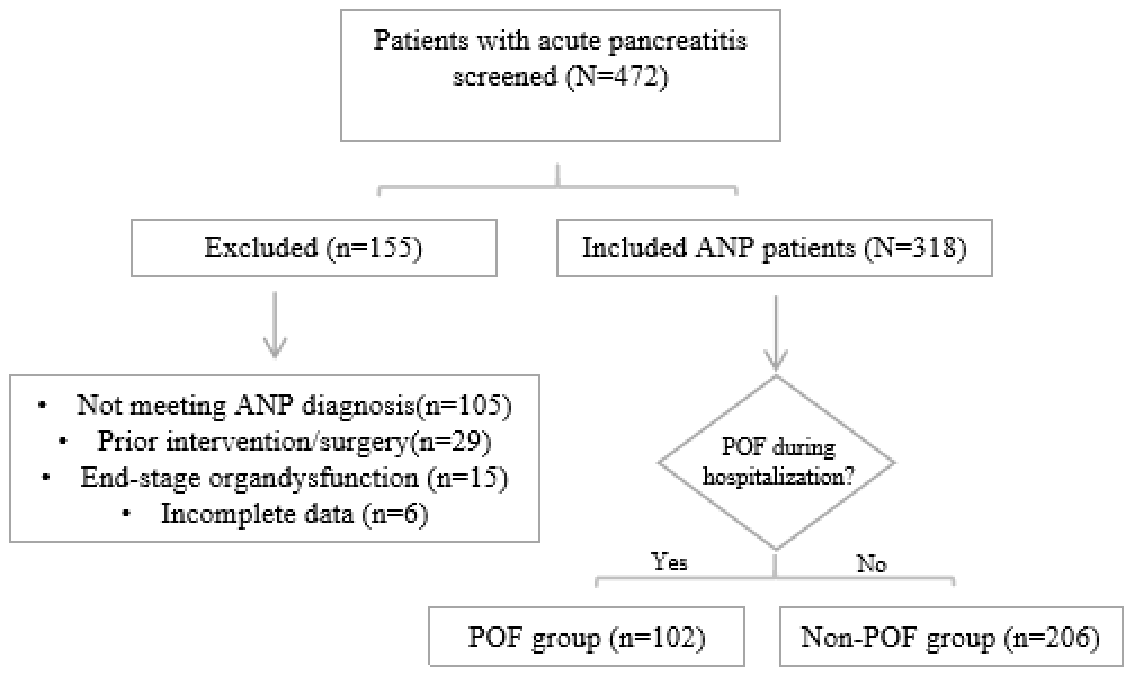

Table 1.
The 13 peripancreatic regions in patients with acute necrotizing pancreatitis: CT identification criteria and membrane anatomy basis.
Table 1.
The 13 peripancreatic regions in patients with acute necrotizing pancreatitis: CT identification criteria and membrane anatomy basis.
| Region | Region name | CT identification criteria | Membrane anatomy basis |
| R1 | Lesser omental bursa area | Hypodense or fluid collection between the lesser curvature of the stomach and the left lobe of the liver, anterior to the pancreas, with clear or indistinct borders | Toldt’s fusion fascia, gastrocolic ligament, lesser omentum |
| R2 | Pancreatic head-duodenal area | Increased density of the fat space around the pancreatic head and duodenum, with strip-like or patchy exudative shadows | Treitz’s fusion fascia, anterior pancreaticoduodenal fusion fascia |
| R3 | Left anterior renal area | Fluid or exudative changes anterior to the left kidney and posterior to the descending colon, with possible posterior displacement of the kidney | Left Toldt’s fusion fascia |
| R4 | Right anterior renal area | Fluid or exudative changes anterior to the right kidney and posterior to the ascending colon, with possible posterior displacement of the kidney | Right Toldt’s fusion fascia |
| R5 | Left posterior renal area | Fluid collection posterior to the left kidney and anterolateral to the psoas major muscle, located between the posterior renal fascia and the lateroconal fascia | Left posterior renal fascia, lateroconal fascia |
| R6 | Right posterior renal area | Fluid collection posterior to the right kidney and anterolateral to the psoas major muscle, located between the posterior renal fascia and the lateroconal fascia | Right posterior renal fascia, lateroconal fascia |
| R7 | Left perirenal fat capsule area | Increased density of the fat space outside the left renal capsule but within the renal fascia, with reticular or patchy fluid accumulation | Left anterior renal fascia, posterior renal fascia |
| R8 | Right perirenal fat capsule area | Increased density of the fat space outside the right renal capsule but within the renal fascia, with reticular or patchy fluid accumulation | Right anterior renal fascia, posterior renal fascia |
| R9 | Left lateral abdominal wall area | Fluid collection medial to the left abdominal wall muscles and anterior to the transversalis fascia | Left lateroconal fascia, transversalis fascia |
| R10 | Right lateral abdominal wall area | Fluid collection medial to the right abdominal wall muscles and anterior to the transversalis fascia | Right lateroconal fascia, transversalis fascia |
| R11 | Left pelvic sidewall area | Fluid collection in the left pelvic cavity, adjacent to the bladder or rectum, continuous superiorly with the left retroperitoneal space | Left urogenital fascia, extraperitoneal fascia |
| R12 | Right pelvic sidewall area | Fluid collection in the right pelvic cavity, adjacent to the bladder or rectum, continuous superiorly with the right retroperitoneal space | Right urogenital fascia, extraperitoneal fascia |
| R13 | Other areas | Inflammatory lesions in the free peritoneal space, paraspinal regions, mesenteric root, etc., not belonging to the above regions | - |
Table 2.
Comparison of baseline clinical characteristics between the POF and non-POF groups.
| Characteristic | Overall (n=318) | POF group (n=102) | Non-POF group (n=206) | Statistic | P value |
| Age (years) | 51.00 (41.00, 62.00) |
56.00 (45.00, 67.00) |
50.00 (40.00, 60.00) |
Z=3.120 | 0.002* |
| Sex (male/female), n | 187/131 | 65/37 | 122/84 | χ²=1.124 | 0.289 |
| BMI (kg/m²) | 25.30 (22.10, 28.50) |
26.50 (23.00, 29.80) |
24.80 (21.60, 27.90) |
Z=2.450 | 0.014* |
| Time from onset to admission (h) | 28.74±15.31 | 32.41±16.28 | 26.76±14.55 | t=3.078 | 0.002* |
| Etiology, n (%) | χ²=5.214 | 0.157 | |||
| Biliary | 145 (45.60) | 48 (47.06) | 97 (47.09) | ||
| Hypertriglyceridemic | 98 (30.82) | 35 (34.31) | 63 (30.58) | ||
| Alcoholic | 47 (14.78) | 12 (11.76) | 35 (16.99) | ||
| Other | 28 (8.81) | 7 (6.86) | 21 (10.19) | ||
| Comorbidities, n (%) | |||||
| Hypertension | 117 (36.79) | 45 (44.12) | 72 (34.95) | χ²=2.718 | 0.099 |
| Diabetes mellitus | 79 (24.84) | 32 (31.37) | 47 (22.82) | χ²=3.105 | 0.078 |
| Coronary artery disease | 34 (10.69) | 11 (10.78) | 23 (11.17) | χ²=0.012 | 0.913 |
| APACHE II score | 10.00 (7.00, 15.00) |
15.00 (11.00, 19.00) |
7.00 (5.00, 11.00) |
Z=6.980 | 0.001* |
Note: BMI, body mass index; APACHE II, Acute Physiology and Chronic Health Evaluation II; POF, persistent organ failure; P<0.05. Non-normally distributed continuous variables are presented as median (interquartile range) and were analyzed using the Mann-Whitney U test; normally distributed continuous variables are presented as mean ± standard deviation and were analyzed using Student’s t-test; categorical variables were analyzed using the chi-square test.
Table 3.
Comparison of baseline clinical characteristics between the POF and non-POF groups.
| Parameter | Overall (n=318) | POF group (n=102) | Non-POF group (n=206) | Statistic | P value |
| White blood cell count (×10⁹/L) | 13.75±4.82 | 16.89±5.11 | 12.03±3.95 | t=9.215 | 0.001* |
| Neutrophil percentage (%) | 85.27±6.91 | 89.71±5.25 | 82.87±7.04 | t=9.398 | 0.001* |
| Hemoglobin (g/L) | 125.48±18.73 | 122.21±20.22 | 127.25±17.66 | t=2.356 | 0.019* |
| Platelet count (×10⁹/L) | 189.35 (145.22, 245.78) |
172.38 (131.58, 228.91) |
198.65 (152.35, 253.18) |
Z=2.832 | 0.005* |
| Creatinine (μmol/L) | 98.54 (75.32, 135.67) |
142.41 (108.71, 196.25) |
85.15 (70.27, 112.47) |
Z=10.558 | 0.001* |
| Blood urea nitrogen (mmol/L) | 7.82±3.45 | 10.91±3.85 | 6.15±2.44 | t=11.732 | 0.001* |
| Serum calcium (mmol/L) | 2.08±0.21 | 1.94±0.23 | 2.15±0.18 | t=8.735 | 0.001* |
| Lactate (mmol/L) | 2.45 (1.78, 3.62) | 3.85 (2.92, 5.10) | 1.93 (1.55, 2.55) | Z=12.298 | 0.001* |
| Oxygenation index (mmHg) | 325.74±85.21 | 248.41±72.55 | 367.78±68.96 | t=14.257 | 0.001* |
Note: Non-normally distributed continuous variables are presented as median (interquartile range) and were analyzed using the Mann-Whitney U test; normally distributed continuous variables are presented as mean ± standard deviation and were analyzed using Student’s t-test; P<0.05.
Table 4.
Comparison of involvement of the 13 peripancreatic regions between the POF and non-POF groups.
Table 4.
Comparison of involvement of the 13 peripancreatic regions between the POF and non-POF groups.
| Region | Overall involvement rate (%) | POF group (n=102), n (%) | Non-POF group (n=206), n (%) | χ² value | P value |
| R1 Lesser omental bursa | 58.18 | 61 (59.80) | 117 (56.80) | 0.321 | 0.571 |
| R2 Pancreatic head-duodenal | 65.41 | 68 (66.67) | 129 (62.62) | 0.587 | 0.444 |
| R3 Left anterior renal | 42.45 | 79 (77.45) | 105 (50.97) | 19.900 | 0.001* |
| R4 Right anterior renal | 38.36 | 50 (49.02) | 69 (33.50) | 6.960 | 0.008* |
| R5 Left posterior renal | 31.45 | 34 (33.33) | 48 (23.30) | 3.892 | 0.048* |
| R6 Right posterior renal | 27.99 | 29 (28.43) | 54 (26.21) | 0.189 | 0.664 |
| R7 Left perirenal fat capsule | 35.53 | 41 (40.20) | 51 (24.76) | 7.800 | 0.005* |
| R8 Right perirenal fat capsule | 32.70 | 44 (43.14) | 58 (28.16) | 6.960 | 0.008* |
| R9 Left lateral abdominal wall | 24.53 | 22 (21.57) | 25 (12.14) | 4.750 | 0.029* |
| R10 Right lateral abdominal wall | 22.33 | 20 (19.61) | 23 (11.17) | 4.070 | 0.044* |
| R11 Left pelvic sidewall | 29.56 | 28 (27.45) | 47 (22.82) | 0.876 | 0.349 |
| R12 Right pelvic sidewall | 25.47 | 24 (23.53) | 49 (23.78) | 0.002 | 0.965 |
| R13 Other areas | 18.55 | 19 (18.63) | 37 (17.96) | 0.023 | 0.879 |
Note: P<0.05; regional involvement was analyzed as a binary variable using the chi-square test.
Table 5.
Candidate variables associated with persistent organ failure in univariate analysis.
| Variable | POF group (n=102) | Non-POF group (n=206) | Statistic | P value |
| Age (years) | 56.00 (45.00, 67.00) | 50.00 (40.00, 60.00) | Z=3.120 | 0.002* |
| BMI (kg/m²) | 26.50 (23.00, 29.80) | 24.80 (21.60, 27.90) | Z=2.450 | 0.014* |
| APACHE II score | 15.00 (11.00, 19.00) | 7.00 (5.00, 11.00) | Z=6.980 | 0.001* |
| CTSI score | 8.00 (6.00, 9.00) | 5.00 (4.00, 7.00) | Z=5.470 | 0.001* |
| Pancreatic necrosis >50%, n (%) | 32 (31.37) | 28 (13.59) | χ²=13.300 | 0.001* |
| Region R3 involvement, n (%) | 79 (77.45) | 105 (50.97) | χ²=19.900 | 0.001* |
| Region R4 involvement, n (%) | 50 (49.02) | 69 (33.50) | χ²=6.960 | 0.008* |
| Region R7 involvement, n (%) | 41 (40.20) | 51 (24.76) | χ²=7.800 | 0.005* |
| Region R8 involvement, n (%) | 44 (43.14) | 58 (28.16) | χ²=6.960 | 0.008* |
| Region R9 involvement, n (%) | 22 (21.57) | 25 (12.14) | χ²=4.750 | 0.029* |
| Region R10 involvement, n (%) | 20 (19.61) | 23 (11.17) | χ²=4.070 | 0.044* |
Note: Only variables with P<0.10 are listed. Non-normally distributed continuous variables are presented as median (interquartile range) and were analyzed using the Mann-Whitney U test; binary variables were analyzed using the chi-square test; P<0.05.
Table 6.
Multivariable logistic regression analysis: independent risk factors for different adverse prognoses.
Table 6.
Multivariable logistic regression analysis: independent risk factors for different adverse prognoses.
| Outcome | Variable | β coefficient | SE | Wald χ² | OR (95% CI) | P value* |
| Persistent organ failure | ||||||
| APACHE II score (per 5-point increase) |
0.36 | 0.11 | 10.71 | 1.43 (1.15–1.78) | 0.001* | |
| CTSI score (per 1-point increase) |
0.22 | 0.09 | 5.98 | 1.25 (1.05–1.49) | 0.014* | |
| Region R3 involvement (yes vs. no) | 1.04 | 0.30 | 12.01 | 2.84 (1.58–5.12) | 0.008* | |
| Region R8 involvement (yes vs. no) | 0.65 | 0.29 | 5.03 | 1.91 (1.08–3.37) | 0.026* | |
| Infected pancreatic necrosis | ||||||
| Pancreatic necrosis >50% (yes vs. no) |
1.23 | 0.35 | 12.35 | 3.42 (1.72–6.80) | 0.001* | |
| Region R3 involvement (yes vs. no) | 0.88 | 0.32 | 7.56 | 2.41 (1.29–4.50) | 0.006* | |
| Region R4 involvement (yes vs. no) | 0.75 | 0.32 | 5.49 | 2.13 (1.14–3.96) | 0.018* | |
| In-hospital mortality | ||||||
| APACHE II score (per 5-point increase) |
0.45 | 0.18 | 6.25 | 1.57 (1.10–2.24) | 0.012* | |
| CTSI score (per 1-point increase) |
0.31 | 0.15 | 4.27 | 1.36 (1.01–1.83) | 0.039* | |
Note: OR, odds ratio; CI, confidence interval; P<0.05; the in-hospital mortality model used Firth’s penalized likelihood regression; all models were adjusted for age, sex, and BMI.
Table 7.
Comparison of predictive performance between conventional and region-augmented models.
| Outcome | Model | AUC (95% CI) | DeLong test P value* | NRI (95% CI) | IDI (95% CI) |
| Persistent organ failure | |||||
| Model A (conventional) | 0.76 (0.71–0.81) | Reference | - | - | |
| Model B (augmented) | 0.82 (0.77–0.87) | 0.019* | 0.33 (0.11–0.54) | 0.07 (0.02–0.12) | |
| Infected pancreatic necrosis | |||||
| Model A (conventional) | 0.72 (0.66–0.78) | Reference | - | - | |
| Model B (augmented) | 0.79 (0.73–0.84) | 0.031* | 0.28 (0.06–0.49) | 0.06 (0.01–0.11) | |
| In-hospital mortality | |||||
| Model A (conventional) | 0.74 (0.66–0.81) | Reference | - | - | |
| Model B (augmented) | 0.75 (0.67–0.82) | 0.560 | 0.09 (–0.08 to 0.26) | 0.01 (–0.02 to 0.04) | |
Note: Model A included APACHE II score, CTSI score, age, BMI, and pancreatic necrosis grade; Model B added region R3 involvement (for POF and IPN) and region R4 or R8 involvement (for IPN and POF, respectively) to Model A. AUC, area under the curve; NRI, net reclassification improvement; IDI, integrated discrimination improvement; * P value for comparison between Model B and Model A.
Disclaimer/Publisher’s Note: The statements, opinions and data contained in all publications are solely those of the individual author(s) and contributor(s) and not of MDPI and/or the editor(s). MDPI and/or the editor(s) disclaim responsibility for any injury to people or property resulting from any ideas, methods, instructions or products referred to in the content. |
© 2026 by the authors. Licensee MDPI, Basel, Switzerland. This article is an open access article distributed under the terms and conditions of the Creative Commons Attribution (CC BY) license (http://creativecommons.org/licenses/by/4.0/).
Copyright: This open access article is published under a Creative Commons CC BY 4.0 license, which permit the free download, distribution, and reuse, provided that the author and preprint are cited in any reuse.


