

Submitted:
14 July 2026
Posted:
21 July 2026
You are already at the latest version
Abstract
Purpose: To evaluate the ability of computer vision models to detect myopia from standard colour fundus photographs and to compare their diagnostic performance with that of experienced ophthalmologists. Methods: A total of 324 retinal fundus images were labelled as myopic or non-myopic using cycloplegic subjective refraction. Images were acquired with a non-mydriatic 45° fundus camera and split into training, internal validation (80 images), and independent testing sets (50 images). YOLOv8 and YOLOv11 variants were trained for binary classification. Performance was evaluated using standard diagnostic metrics, with bootstrap confidence intervals and Holm–Bonferroni correction. Five ophthalmologists independently classified the test set, and their consensus was compared with model predictions using DeLong and McNemar tests. Results: On internal validation, YOLOv8-xl achieved the highest sensitivity (0.983) and MCC (0.646). YOLOv11 models showed greater variability, with the extra-large variant displaying degenerate behaviour. On the independent test set, YOLOv8-n achieved an AUC of 0.860 versus 0.753 for YOLOv11-s, with no significant difference (p = 0.174). Clinical consensus reached an AUC of 0.832 and did not differ from YOLOv8-n (p = 0.725). McNemar testing showed no difference between YOLOv8-n and clinicians (p = 1.000), while YOLOv11-s differed significantly (p < 0.001). Limitations include the small, class-imbalanced dataset and the limited number of ophthalmologists. Conclusions: YOLOv8 models can detect myopia from standard fundus photographs with performance comparable to experienced ophthalmologists, supporting their potential as complementary screening tools.
Keywords:
myopia
; fundus photography
; YOLO
; computer vision
; artificial intelligence
; screening tools
1. Introduction
Myopia is one of the most prevalent refractive error worldwide and represents a major public health concern. While affecting approximately 20–30% Western youth, the condition reaches epidemic proportions in East Asia, where figures exceed 70% among school-aged population [1,2,3]. A landmark systematic review and meta-analysis estimated that by 2050, nearly half the global population–approximately 4.8 billion people–is expected to be myopic, with one billion affected by high myopia [4]. Beyond simple refractive error, these high-grade forms predispose patients to vision-threatening pathologies, including retinal detachment, myopic maculopathy, glaucoma, and cataracts, ultimately imposing a profound socioeconomic burden and diminishing quality of life [4,5,6,7,8,9].
Standard clinical diagnosis relies on distance visual acuity and refractive measurement, with cycloplegic refraction remaining the gold standard to eliminate accommodative bias, especially in younger cohorts [10,11]. While essential for precise optical quantification, these methods are distinct from retinal imaging. Conventionally, colour fundus photography is reserved for monitoring structural complications—such as chorioretinal atrophy or lacquer cracks—rather than for primary diagnosis [12]. Identifying non-pathological (low-to-moderate) myopia from such images remains a formidable task for human observers, as these eyes often lack overt funduscopic abnormalities. However, subtle textural, vascular, or spatial patterns associated with myopia, though imperceptible to human eye, may still be encoded within the retinal architecture [13].
Recent advances in artificial intelligence (AI), particularly in deep learning (DL) and computer vision, have revolutionized medical imaging, enabling the automated detection of conditions such as diabetic retinopathy, glaucoma and age-related macular degeneration with expert-level accuracy [14,15,16]. While previous DL research has focused on identifying pathological myopia through lesion recognition [17,18], there is growing evidence that latent features associated with refractive status can be extracted directly from pixel data [19].
This study explores the frontier of this technology by investigating whether state-of-the-art object detection and classification frameworks can discern myopia—specifically non-pathological forms—from standard 45° fundus images. We focus on the “You Only Look Once” (YOLO) family of architectures, which offers a robust balance of efficient feature extraction and multi-scale representation. A distinctive aspect of our approach is the utilization of the Roboflow application programming interface (API) [20], a platform that democratizes AI implementation by facilitating model training and deployment for clinical researchers without extensive programming expertise.
Building upon prior benchmarks established with YOLOv8 [21], the present research further extends its investigation by evaluating the performance of the latest YOLOv11 iteration [22]. By benchmarking the best models against a panel of experienced ophthalmologists, we aim to determine if computer vision can surpass human diagnostic thresholds in the binary classification of myopia versus non-myopia based on non-apparent retinal signals, thereby serving as a viable adjunct to conventional ophthalmic assessment.
2. Materials and Methods
2.1. Study Population and Data acquisition
For this retrospective and observational study, aimed at developing and validating a supervised machine learning algorithm for binary classification, we employed the retinal fundus images dataset previously collected and described in our earlier publication [21]. A total of 338 retinal fundus images were collected from 169 Caucasian patients, aged 7-84 years, who attended an optometry and contact lens practice in Northern Italy for routine eye examinations (Supplementary Table S1) from March to August 2023. All participants were evaluated by a licensed optometrist during standard clinical visits. The examination protocol included assessment of medical history and visual complaints, measurement of distance visual acuity (unaided and best corrected), static retinoscopy, subjective refraction, slit-lamp biomicroscopy, and colour fundus photography. Refractive error was then measured under cycloplegia with the supervision of an ophthalmologist. Full study population description is available in Table S1 of the Supplementary.
All retinal images were acquired by the same experienced optometrist using a non-mydriatic Optopol REVO FC 80® fundus camera (Optopol Technology, Zawiercie, Poland; software version 11.5.0). The device is equipped with a 12.3-megapixel sensor and provides a field of view of 45 ± 5°. Image acquisition was performed in a darkened room using the central fundus photography mode, with automatic flash intensity and gain level adjustment. Fundus photographs were captured in PNG format with RGB colour encoding and subsequently exported from the device software for further analysis.
Only images of sufficient quality were included in the study and retrospectively analysed. Inclusion criteria required images to be well-centred, sharp, and free from motion blur, illumination artefacts, or obscuring media opacities. Each image was reviewed by the optometrist to ensure that key anatomical structures—including the macula, optic disc, and retinal vasculature—were clearly visible and in focus. Images that were blurred, poorly illuminated, off-centre, or affected by artefacts were excluded from the dataset.
2.2. Data Preparation
All selected fundus images were anonymized prior to analysis. Images were then divided into two datasets according to the subjective spherical equivalent refraction (SER) of each eye. SER was calculated using the standard formula:
where SF represents the spherical power and CYL the cylindrical power of the corrective lens.
In accordance with the International Myopia Institute (IMI) definition, myopia was defined as a refractive condition in which SER is ≤ −0.50 dioptres (D) [11]. Eyes with SER ≤ −0.50 D were classified as myopic, whereas eyes with SER > −0.50 D were classified as non-myopic.
Based on these criteria, 124 patients were diagnosed as myopic (74 females; mean age ± standard deviation: 26.74 ± 13.78 years), while 45 patients were classified as non-myopic (27 females; mean age ± standard deviation: 40.33 ± 17.74 years). Recruitment of non-myopic subjects proved particularly challenging, since most patients attending the clinic were myopic. This also reflects the fact that the clinic is highly specialized in myopia and myopia management, which partly explains why the mean age of the myopic group was lower than that of the non-myopic group.
After image quality assessment and SER-based classification, a total of 324 eligible fundus images were included in the final dataset, comprising 238 images from the myopic group and 86 images from the non-myopic group. Both right and left eyes were included. The mean SER of the myopic eyes was −3.19 ± 2.84 D, whereas the mean SER of the non-myopic eyes was +0.92 ± 1.32 D (Supplementary Table S1).
Written informed consent was obtained from all participants or their legal guardians prior to participation, and the study was approved by the Scientific Research Ethics Committee of the University of Latvia (nr13019-13032020), and conducted in accordance with the principles of the Declaration of Helsinki.
2.3. Dataset Splitting and Augmentation
Both YOLOv8 and YOLOv11 require annotated images to perform image-level classification tasks. Therefore, each fundus image was manually class-labelled as either myopic or non-myopic according to the SER-based classification. Annotation was performed using freely available online annotation software [20], and the labelled datasets were subsequently downloaded for model development.
To prevent data leakage and ensure fair performance evaluation, right and left eyes of the same patients were assigned to the same subset, and the dataset was first split at the image level into training, validation, and test subsets before applying any data augmentation procedures. This strategy ensured that augmented versions of the same image were confined to a single subset. All images were automatically oriented and resized to a resolution of 640 × 640 pixels, corresponding to the recommended input size for YOLO-based architectures. Data augmentation was applied exclusively to the training set to mitigate overfitting and improve generalization. Augmentation techniques included horizontal and vertical flipping, 90° clockwise and counter-clockwise rotations, and vertical inversion. After augmentation, the final dataset comprised 699 images, distributed as follows: 569 images in the training set, 80 images in the validation set, and 50 images in the test set. The batch size was set to 4 to accommodate available computational resources. Each model was trained for a maximum of 100 epochs. Early stopping was implemented such that training was terminated if no improvement in validation performance was observed for ten consecutive epochs. All experiments were conducted by an optometrist, with basic knowledge in computer programming, on a workstation equipped with an Intel® Core™ i7 processor, 64 GB RAM, and an NVIDIA® GeForce RTX™ 3070 Ti GPU with 8 GB of dedicated memory. All the steps where supervised by an experienced computer scientist to ensure correctness and methodology.
2.4. YOLOv8 and YOLOv11 Architectures and Training Details
In this study, two models from the YOLO family were employed to perform binary image-level classification of myopia from retinal fundus photographs. Although originally designed for object detection, modern YOLO implementations support classification tasks by leveraging powerful backbone networks capable of extracting hierarchical and multi-scale visual features [23].
YOLOv8 models were implemented using the Ultralytics framework [24]. Five classification variants differing in model complexity and number of parameters were evaluated, allowing analysis of the trade-off between computational efficiency and classification performance. YOLOv8 adopts a convolutional backbone with Cross Stage Partial (CSP)-inspired modules combined with a decoupled head design, which improves feature representation and training stability. This architecture enables efficient learning from relatively small datasets while maintaining strong generalization capabilities [25,26].
To extend previous findings, the present work additionally evaluated the recently introduced YOLOv11 architecture [27,28]. YOLOv11 builds upon earlier YOLO versions while incorporating architectural refinements aimed at improving feature extraction, optimization efficiency, and inference accuracy. These include improved backbone feature fusion and more effective gradient propagation, making YOLOv11 particularly suitable for fine-grained visual classification tasks. To the best of our knowledge, this is one of the first studies to apply YOLOv11 for the binary classification of myopia from fundus images.
2.5. Training Procedures
All models were trained using identical dataset splits, pre-processing steps, and augmentation strategies to ensure a fair comparison between architectures. Training was performed using supervised learning with binary cross-entropy loss, optimized via stochastic gradient descent–based methods implemented within the Ultralytics framework [20,27]. Model weights were initialized from large-scale pre-trained image datasets to enable transfer learning and accelerate convergence. Each model was trained for a maximum of 100 epochs with a batch size of 4. Early stopping was applied based on validation performance, halting training if no improvement was observed for ten consecutive epochs. Model performance was monitored using the internal validation set, and final evaluation was conducted exclusively on the independent test set (50 completely new images).
2.6. Model Explainability Analysis
To explore the image regions contributing to model predictions, Gradient-weighted Class Activation Mapping (Grad-CAM) [29] was applied to selected correctly and incorrectly classified fundus images for both YOLOv8 and YOLOv11 models on the independent test set only. Grad-CAM heat-maps were generated from the final convolutional layers of the classification backbone to visualize spatial activation patterns associated with myopia predictions. Heat-maps were qualitatively inspected to assess whether model attention converged on specific retinal anatomical structures or regions.
2.7. Colical Experts Protocol
To benchmark the performance of the deep learning models against human expertise, a panel of five experienced ophthalmologists was recruited to independently classify the retinal fundus images included in the independent test set. All participating clinicians had at least ten years of clinical experience and were primarily involved in the management of myopic patients and in medical retina practice. The same subset of colour fundus photographs used to evaluate the YOLOv8 and YOLOv11 models (i.e., the independent test set) was also used for the human expert assessment, ensuring methodological consistency and enabling a direct comparison between artificial intelligence models and human observers. Each ophthalmologist was asked to classify each image as either myopic or non-myopic based solely on visual inspection of the retinal photograph. To standardize the evaluation procedure, the images were uploaded to a Google Forms questionnaire and presented in randomized order. Each clinician accessed the questionnaire through a dedicated web link and completed the evaluation remotely using their own computer. No additional clinical information, such as refractive measurements, patient age, visual acuity, or medical history, was provided, in order to replicate the information available to the deep learning models and to avoid potential sources of bias.
All ophthalmologists were blinded to the ground-truth refractive status of the eyes and to the predictions generated by the deep learning models. No time constraints were imposed, and participants were instructed to rely exclusively on their professional judgment of retinal features potentially associated with myopia. Individual classifications were recorded automatically through the questionnaire platform and subsequently compared with the reference labels derived from subjective cycloplegic refraction, which served as the sole criterion to define the binary ground truth (myopic vs non-myopic). Importantly, ophthalmologists were not asked to estimate or infer the spherical equivalent refraction value, but only to perform a categorical classification of refractive status. Accordingly, the performance evaluation of both the human experts and the YOLO-based models was conducted exclusively at the level of binary discrimination between myopia and non-myopia.
Individual diagnostic labels were aggregated into a consensus prediction to provide an overall estimate of human diagnostic performance; a sample was classified as myopic if a majority (≥3 out of 5 experts) identified the condition. This approach reduces inter-observer variability and allows robust comparison between AI models and human observers [30].
2.8. Performance Metrics
The performance of the deep learning models and human experts was evaluated using a comprehensive set of standard metrics for binary classification. For each model and each ophthalmologist, the following measures were computed based on the confusion matrix [31]:
- Accuracy (ACC) is defined as the ratio of correct predictions to the total predictions made, as illustrated in Equation (1).
- Precision (P) assess the ratio of true positives in all positive predictions, computed using Equations (2).
- Sensitivity (S) determines the ratio of true positives in all actual positives. S measures the model’s effectiveness in identifying all instances of a class, as illustrated in Equation (3).
- Specificity (Sp) calculates the ratio of true negatives in all negative predictions, as shown in Equation (4).
- The F1 score represents the harmonic mean of P and S, providing a balanced evaluation of the model’s accuracy by taking into account false positives and negatives, as demonstrated in Equation (5).
- The receiver operating characteristic (ROC) curve is a graphical representation of a classification model’s performance across all classification thresholds. It shows the trade-off between the true positive rate (TPR) and the false positive rate (FPR). TPR is also known as recall or sensitivity (Equation (3)). The FPR is the ratio of incorrectly identified negative instances to the total actual negative instances, illustrated in Equation (6). As the classification changes, both the TPR and FPR change, and plotting them forms the ROC curve and the corresponding area under the curve (AUC), computed from the continuous probability outputs of the deep learning models.
Particular emphasis was placed on sensitivity and Matthews correlation coefficient (MCC), which provides a balanced measure of classification quality even in the presence of class imbalance and ranges from −1 (total disagreement) to +1 (perfect agreement) [32]. Sensitivity was prioritized because missing myopic cases (false negatives) may delay diagnosis and management, potentially increasing the risk of long-term ocular complications. MCC was included to provide a robust global assessment of classification performance that accounts for all four components of the confusion matrix and mitigates the influence of class imbalance. The formula for the MCC is shown in Equation (7).
The Negative predictive value (NPV) is defined as the proportion of true non-myopic cases among all images classified as non-myopic [33]. The higher the NPV, the more reliable the test is at ruling out the disease. NPV is described by the Equation (8):
For the clinical evaluation, performance metrics were computed individually for each ophthalmologist and for a clinical consensus, defined using majority voting (at least three concordant classifications out of five). For ROC analysis of the consensus, a continuous score was defined as the proportion of clinicians classifying each image as myopic.
2.9. Statistical Analysis
Statistical analyses were performed using Python (version 3.12.7) within the JupyterLab environment (version 4.2.5), employing standard scientific libraries including NumPy, pandas, SciPy, scikit-learn, and statsmodels.
For the internal validation dataset (60 myopic and 20 non-myopic eyes), and independent test set (35 myopic and 15 non-myopic eyes), point estimates and 95% confidence intervals (CIs) of all performance metrics were obtained using non-parametric bootstrap resampling with 2,000 iterations.
Pairwise comparisons between model variants in the internal validation set (YOLOv8-n, -s, -m, -l, -xl and YOLOv11-n, -s, -m, -l, -xl) were conducted using a paired bootstrap test, computing the distribution of metric differences across resamples. To control for multiple comparisons, p-values were adjusted using the Holm–Bonferroni correction, and adjusted p-values < 0.05 were considered statistically significant.
To select the best-performing model for independent testing, a composite ranking score was calculated by weighting sensitivity (40%), MCC (30%), F1-score (20%), and AUC (10%). Models were ranked for each metric, and the weighted sum of ranks was used to identify the most clinically balanced classifier.
For the independent test set, ROC curves and AUC values were computed for the selected YOLOv8 and YOLOv11 models and for the clinical consensus. Differences in AUC were assessed using DeLong’s test for correlated ROC curves, accounting for the paired nature of predictions generated on the same images. To evaluate differences at the decision level, McNemar’s test was applied to paired binary predictions between: YOLOv8 and YOLOv11, YOLOv8 and the clinical consensus, and YOLOv11 and the clinical consensus. Exact p-values were computed. All statistical tests were two-sided, and statistical significance was defined as p < 0.05 unless otherwise specified.
3. Results
3.1. Internal Validation
Overall, models demonstrated high sensitivity for the detection of myopia, indicating a strong ability to correctly identify myopic eyes. However, relevant differences were observed across architectures and model scales in terms of overall classification balance, particularly when considering specificity, F1-score, and MCC. Confusion matrices for all YOLO model variants, including TP, TN, FP, and FN values are shown in the Supplementary Materials (Figures S1 and S2).
Table 1 summarizes the performance metrics of all YOLOv8 and YOLOv11 variants on the internal validation set, reported as mean values with corresponding 95% bootstrap CIs.
Within the YOLOv8 family, overall performance generally improved with increasing model scale. The largest variant, YOLOv8-xl, achieved the highest sensitivity (0.983, 95% CI 0.950–1.000), the highest F1-score (0.922, 95% CI 0.885–0.959) and the highest MCC (0.646, 95% CI 0.434–0.829), indicating excellent detection capability combined with balanced classification performance despite the class imbalance of the dataset (see Figure S1 in the Supplementary Materials). YOLOv8-m and YOLOv8-n also showed strong performance, with MCC values exceeding 0.58 and consistently high sensitivity.
Within the YOLOv11 family, performance was more heterogeneous across model scales. YOLOv11-n achieved the best overall balance among the YOLOv11 variants (sensitivity 0.918, 95% CI 0.850–0.983; F1 score 0.909, 95% CI 0.860–0.958; MCC 0.631, 95% CI 0.420–0.829;). In contrast, YOLOv11-xl reached perfect sensitivity but exhibited extremely low specificity and an MCC of 0, reflecting near-constant classification of all cases as myopic and poor discriminative ability for non-myopic eyes (see Figure S2 in the Supplementary Materials).
Overall, while several models achieved very high sensitivity, the joint consideration of sensitivity, MCC, and F1-score identified YOLOv8-xl as the most balanced and robust model on the internal validation dataset.
3.2. Statistical Comparison Between YOLOv8 and YOLOv11
Pairwise statistical comparisons between YOLOv8 and YOLOv11 models at the same architectural scale (n, s, m, l, and xl) were performed using paired bootstrap resampling with Holm–Bonferroni correction for multiple testing. The results for the two primary outcome measures, sensitivity and MCC, are summarized in Table 2, which reports the mean performance differences (YOLOv8 − YOLOv11), corresponding 95% CIs, and adjusted p-values.
No statistically significant differences in sensitivity were observed between YOLOv8 and YOLOv11 for any model scale after correction for multiple comparisons (all adjusted p > 0.05). Similarly, no significant differences in MCC were detected for the n, s, and l variants. A larger numerical difference was observed for the m-scale models favouring YOLOv11; however, this did not remain significant after correction (adjusted p = 0.063). For the xl-scale comparison, a statistically significant result was obtained; however, this was driven by near-constant prediction behaviour of the YOLOv11-xl model, resulting in unstable MCC estimates and limiting clinical interpretability.
3.3. Intra-Family Model Comparisons
Additional pairwise bootstrap analyses were conducted to investigate performance differences among model variants within the YOLOv8 and YOLOv11 families (Supplementary Tables S2 and Table S3).
Within the YOLOv8 family, YOLOv8-xl demonstrated significantly higher sensitivity compared with YOLOv8-n and YOLOv8-l, as well as a significantly higher NPV compared with YOLOv8-l. No statistically significant advantages were observed for smaller variants after correction for multiple comparisons (Supplementary Table S2).
In contrast, greater heterogeneity was observed among YOLOv11 variants. YOLOv11-n achieved significantly higher MCC than both YOLOv11-s and YOLOv11-m. YOLOv11-xl exhibited markedly reduced specificity, precision, and MCC, consistent with near-degenerate classification behaviour. Several pairwise differences involving YOLOv11-xl remained statistically significant after Holm–Bonferroni correction (Supplementary Table S3).
Together, these findings indicate greater architectural stability for YOLOv8 across model scales and support the selection of YOLOv8-xl as the most robust model at this stage, as it achieved the most favourable trade-off between high sensitivity, MCC and F1 score. Within the YOLOv11 family, YOLOv11-s was selected as the most suitable candidate for further evaluation, as it showed the most stable overall behaviour across performance metrics while avoiding the extreme specificity–sensitivity trade-offs and unreliable classification patterns observed in other variants.
3.4. Independent Testing Phase
The independent test set consisted of 50 fundus images (35 myopic and 15 non-myopic eyes) that were not used during training or internal validation. Table 3 shows the performance metrics of all YOLOv8 and YOLOv11 variants on the independent test set, reported as mean values with corresponding 95% bootstrap CIs. AUC values with 95% CIs are reported for all YOLO models. Confusion matrices for all YOLO model variants, including TP, TN, FP, and FN values are shown in the Supplementary Materials (Figures S3 and S4).
During this phase, model selection was performed using a clinically weighted composite score integrating sensitivity, MCC, F1-score, and AUC. Using this approach, YOLOv8-n achieved the lowest composite score among YOLOv8 variants, indicating superior overall composite performance on unseen data. In contrast, YOLOv11-s consistently ranked as the best-performing variant across both internal validation and independent testing phases. Detailed composite scores for all YOLOv8 and YOLOv11 variants are reported in Supplementary Table S4. Based on these results, YOLOv8-n and YOLOv11-s were selected for further evaluation and comparison with expert ophthalmologists.
The ROC curves and AUC values for all YOLO model variants are presented in Supplementary Figure S5 and S6. On the independent dataset, YOLOv8-n achieved a ROC AUC of 0.860, whereas YOLOv11-s achieved an AUC of 0.753. ROC curves for both models are shown in Figure 1, illustrating higher sensitivity across most decision thresholds for YOLOv8-n.
To formally compare the discriminative ability of the two models, DeLong’s test for correlated ROC curves was applied. The difference in AUC between YOLOv8-n and YOLOv11-s was 0.107. This difference did not reach statistical significance (p-value = 0.1736), indicating that, although YOLOv8-n showed numerically higher discrimination, this difference cannot be considered statistically significant given the sample size.
To evaluate whether the two models differed significantly in their classification errors on the same images, a paired McNemar test was performed using binary predictions at the predefined operating threshold. The contingency table analysis yielded a McNemar statistic of 1.0 (p-value = 0.625), indicating no statistically significant difference in the pattern of misclassifications between YOLOv8-n and YOLOv11-s. These results suggest that, while YOLOv8-n demonstrated higher overall discriminative performance, both models showed comparable classification behaviour at the image level on the independent dataset.
3.5. Grad-CAM Activation Maps Interpretation
Grad-CAM analysis was performed to investigate spatial attention patterns used by YOLOv8 and YOLOv11 during prediction. In contrast to other studies [13,34], where specific regions of interest for myopia onset and myopia progression where identified, heat-maps did not consistently converge on specific localized retinal regions. Instead, activation patterns were generally diffuse across the posterior pole, without clear and reproducible focal attention areas across images or across model architectures (Supplementary Figure S7). This behaviour was observed in both correctly and incorrectly classified cases and was consistent across YOLOv8 and YOLOv11 models.
3.6. Comparison with Expert Ophthalmologists
Five experienced ophthalmologists independently classified the same 50 fundus images of the independent test dataset using visual inspection only. Performance metrics were computed for each observer and aggregated to estimate overall human diagnostic performance (Supplementary Table S5). Confusion matrices for all five ophthalmologists and the clinical consensus, including TP, TN, FP, and FN values are shown in Supplementary Figures S8. ROC curves and AUC values for all expert ophthalmologists are shown in Supplementary Figure S9.
YOLOv8-n achieved an AUC of 0.860, compared with 0.832 for the clinical consensus derived from expert annotations (Figure 2).
YOLOv11-s achieved an AUC of 0.753. ROC curve comparisons were performed between the AI models and the clinical consensus using DeLong’s test. The AUC difference between YOLOv8-n and the clinical consensus was 0.028 (p=0.725), whereas the difference between YOLOv11-s and the clinical consensus was -0.079 (p-value=0.448). No statistically significant differences in AUC were observed between either AI model and the expert consensus.
Paired McNemar tests were conducted to assess differences in classification errors between each AI model and the clinical consensus. Table 4 reports the number of discordant classification pairs, where b indicates cases correctly classified by the AI model but misclassified by the clinical consensus, and c indicates cases misclassified by the AI model but correctly classified by the clinical consensus. YOLOv8-n showed no statistically significant difference in misclassification pattern compared with the clinical consensus. In contrast, YOLOv11-s exhibited a significantly different error distribution, with a higher number of cases misclassified by the model than by the clinicians.
Overall, YOLOv8-n demonstrated the highest AUC among the evaluated models, discrimination comparable to expert ophthalmologists, and no statistically significant difference in classification errors relative to clinical consensus. YOLOv11-s, while showing acceptable sensitivity, exhibited lower discriminative performance and significantly poorer agreement with clinical decisions. A summary of diagnostic performance metrics is reported in Table 5. These findings support YOLOv8-n as the best overall performing model for myopia detection from fundus photographs in the independent testing dataset.
4. Discussion
In this study, we evaluated the ability of YOLOv8 and YOLOv11 models to detect myopia from standard colour fundus photographs and compared their diagnostic performance with that of experienced ophthalmologists.
During internal validation, YOLOv8 models demonstrated greater stability and performance consistency across architectural scales compared with YOLOv11 models. In particular, YOLOv8-xl achieved the most favourable balance between sensitivity and overall classification performance, as reflected by high MCC and F1-score values despite class imbalance in the validation dataset. When evaluated on an independent test dataset using a clinically weighted composite score integrating sensitivity, MCC, F1-score, and AUC, YOLOv8-n emerged as the best overall performing YOLOv8 variant. This finding highlights the importance of assessing model generalization on unseen data rather than relying exclusively on internal validation performance [35].
On the independent test set, YOLOv8-n achieved diagnostic discrimination comparable to expert ophthalmologists. Its AUC (0.860) did not differ significantly from the clinical consensus (0.832), and McNemar testing showed no significant difference in classification error distribution. In contrast, although YOLOv11-s represented the most stable variant within the YOLOv11 family, it demonstrated lower discriminative performance and significantly different classification behaviour compared with clinical consensus.
The clinical diagnosis of myopia is currently based on refractive error measurement, with cycloplegic refraction representing the gold standard. Retinal imaging is primarily used to detect myopia-related complications rather than to establish refractive diagnosis [10]. The present findings suggest that standard colour fundus photographs contain latent image features associated with refractive status that can be detected by deep learning models, even in the absence of overt pathological changes visible to human observers. These results supports the concept that retinal structural or vascular patterns may indirectly encode refractive characteristics [13,19,36].
Taken together, these findings suggest a potential complementary role for computer vision–based screening tools, particularly in large-scale screening programs, tele-ophthalmology workflows, and triage settings where access to cycloplegic refraction is limited.
Most previous deep learning studies in myopia have focused on detecting pathological myopia or myopic maculopathy, where structural retinal abnormalities are clearly visible [17,18]. In contrast, relatively few studies have attempted to classify refractive status directly from fundus images, particularly in non-pathological myopia. The present work extends previous literature by demonstrating that YOLO-based architectures can be adapted for refractive status classification and by providing one of the first evaluations of YOLOv11 for retinal image analysis. Importantly, this study includes direct benchmarking against experienced ophthalmologists using identical image inputs and blinded evaluation, providing clinically meaningful performance context.
Differences in performance between internal validation and independent testing highlight the importance of evaluating generalization in clinical AI applications. While larger models such as YOLOv8-xl demonstrated excellent internal validation performance, the smaller YOLOv8-n model showed superior performance on unseen data. This behaviour is consistent with established machine learning principles, whereby larger models may learn more complex representations but are also more prone to overfitting when trained on limited datasets [37], whereas more compact architectures may learn more robust and transferable feature representations [38,39]. But, this behaviour can be due to the imbalance nature of the training and testing dataset. The small dataset may result in high variance in performance metrics and limits the ability to claim broad generalizability. So, caution must be paid at this stage of the results.
Within the YOLOv11 family, performance heterogeneity across scales and the degenerate classification behaviour observed in the largest variant further emphasize the need for careful architecture selection when applying newly introduced models to clinical imaging tasks. In addition, the imbalanced dataset first, and then the small test set can be the primary driver behind the observed anomalous behaviour of YOLOv11 largest variant.
Interestingly, YOLOv11-n demonstrated numerically strong discriminative performance on the independent test dataset, achieving an AUC of approximately 0.890, compared with 0.860 for YOLOv8-n and 0.832 for the clinical consensus. Although formal statistical comparison was not performed for all possible model combinations, the substantial overlap in 95% confidence intervals across most performance metrics suggests no clear statistical evidence of performance differences between YOLOv11-n and YOLOv11-s within the limits of the current sample size. These findings indicate that the two YOLOv11 variants likely achieve comparable overall diagnostic performance, with differences primarily reflecting distinct sensitivity–specificity trade-offs (Table 3). In particular, YOLOv11-s demonstrated higher sensitivity, whereas YOLOv11-n showed more balanced discrimination across performance metrics. However, according to the clinically weighted composite, YOLOv11-s showed more stable overall performance. Nevertheless, YOLOv11-n may represent a valid alternative candidate in scenarios where discrimination performance, as reflected by AUC, is prioritized.
Grad-CAM analysis did not demonstrate consistent focal activation in specific retinal regions, with activation maps generally distributed across the posterior pole. This behaviour may reflect the intrinsic nature of the classification task. Unlike lesion detection, where pathology is spatially localized [40,41], refractive status may be associated with subtle, distributed retinal microstructural or vascular features that might not be confined to a single anatomical region. Alternatively, the absence of focal activation may reflect limitations of post-hoc explainability methods when applied to high-dimensional feature representations learned by deep neural networks. Further investigations using complementary explainability techniques or multimodal imaging may help clarify the biological correlates of AI-based refractive status prediction.
The absence of statistically significant differences between YOLOv8-n and clinical consensus in both ROC discrimination and decision-level analysis suggests that the model can approximate expert-level image-based pattern recognition. However, ophthalmologists in this study were restricted to image-only evaluation without access to refractive measurements or clinical history. Therefore, the results reflect image-based diagnostic capability rather than full clinical diagnostic performance. These findings support the potential use of AI as a decision-support tool, particularly in screening or triage scenarios.
4.1. Strenght and Limitations
Key strengths include the use of clinically defined refractive ground truth, evaluation across internal validation and independent testing datasets, statistically robust analysis using bootstrap confidence intervals and multiple comparison correction, and direct benchmarking against experienced clinicians under blinded conditions. In addition, the use of a clinically weighted composite model selection approach reflects real-world diagnostic priorities.
Several limitations should be considered. The dataset size remains small and unbalanced for deep learning applications and may limit statistical power. The study population was derived from a single geographic region, which may limit generalizability. Only colour fundus photography was evaluated, without integration of multimodal imaging or clinical metadata. Finally, although expert comparison was performed, the number of participating ophthalmologists was limited.
Future work should include external validation across multiple populations and imaging devices, integration with multimodal clinical data, and prospective studies evaluating real-world screening workflows and clinician–AI interaction.
5. Conclusions
YOLO-based deep learning models can detect myopia from standard colour fundus photographs with clinically meaningful performance. Among the evaluated models, YOLOv8-n demonstrated the best generalization performance and achieved diagnostic discrimination comparable to experienced ophthalmologists in an image-only evaluation setting.
These findings support the feasibility of computer vision–based approaches as complementary tools to conventional refractive assessment, particularly in screening and tele-ophthalmology contexts. Further validation in larger and more diverse populations is required before clinical implementation.
Supplementary Materials
The following supporting information can be downloaded at the website of this paper posted on Preprints.org, Figure S1: Confusion matrices for all YOLOv8’s variants after the internal validation phase: a. nano, b. small, c. medium, d. large, e. extra-large.; Figure S2: Confusion matrices for all YOLOv11’s variants after the internal validation phase: a. nano, b. small, c. medium, d. large, e. extra-large; Figure S3: Confusion matrices for all YOLOv8’s variants after the independent test phase: a. nano, b. small, c. medium, d. large, e. extra-large; Figure S4: Confusion matrices for all YOLOv11’s variants after the independent test phase: a. nano, b. small, c. medium, d. large, e. extra-large; Figure S5: ROC curves and AUC values for YOLOv8 model variants on the independent test dataset. The diagonal dashed line represents a random classifier. ROC: receiver operating characteristic curve; AUC: area under the ROC curve; Figure S6: ROC curves and AUC values for YOLOv11 model variants on the independent test dataset. The diagonal dashed line represents a random classifier. ROC: receiver operating characteristic curve; AUC: area under the ROC curve; Figure S7: Grad-CAM visualizations for YOLOv8-n and YOLOv11-s are compared using pairs of retinal images and their corresponding heat-maps. While YOLOv8-n correctly identified a normal eye in image a, it struggled with the myopic case in e. Both models exhibited inconsistent predictions and nearly identical heat-map patterns (b, d, f, h), suggesting limited interpretability and difficulty in differentiating between classes; Figure S8: Confusion matrices post-test for all experts ophthalmologist (from a - e) and the clinical consensus (f); Figure S9: ROC curves and AUC values for expert ophthalmologists on the independent test dataset. The diagonal dashed line represents a random classifier; Table S1: Summary description of patients’ characteristics and dataset details; Table S2: Pairwise bootstrap comparisons among YOLOv8 variants on the internal validation dataset (mean difference and 95% confidence intervals); Table S3: Pairwise bootstrap comparisons among YOLOv11 variants on the internal validation dataset (mean difference and 95% confidence intervals); Table S4: Composite ranking scores used for model selection during independent testing. YOLOv8-n and YOLOv11-s are the best performing models with the lowest composite score; Table S5: Expert ophthalmologists and calculated Consensus performance metrics on the independent test dataset.
Author Contributions
For this research, N.R. carried out the conceptualization of the research; N.R. and L.D. conducted the experiments and data analysis; N.R. wrote the draft of the article; and M.O. reviewed and edited the article. All authors have read and agreed to the published version of the manuscript.
Funding
This research received no external funding.
Institutional Review Board Statement
The study was conducted in accordance with the Declaration of Helsinki, and approved by the Scientific Research Ethics Committee of the University of Latvia on 13 March 2020, protocol number nr13019-13032020.
Informed Consent Statement
Informed consent was obtained from all subjects involved in the study.
Data Availability Statement
The image dataset created for this research is available on request.
Acknowledgments
the authors wish to express their gratitude to the anonymous ophthalmologists who volunteered their time and expertise in the classification of clinical images for this study.
Conflicts of Interest
The authors declare no conflicts of interest.
Abbreviations
The following abbreviations are used in this manuscript:
| AI | Artificial Intelligence |
| DL | Deep Learning |
| YOLO | You Only Look Once |
| PNG | Portable Network Graphics |
| RGB | Red Green Blue colour space |
| SER | Spherical Equivalent Refraction |
| CYL | Cylindrical power |
| D | Dioptre |
| IMI | International Myopia Institute |
| CSP | Cross Stage Partial |
| Grad-CAM | Gradient Weighted Class Activation Mapping |
| ACC | Accuracy |
| P | Precision |
| S | Sensitivity |
| Sp | Specificity |
| ROC | Receiver Operating Characteristic curve |
| AUC | Area Under the Curve |
| TPR | True Positive Rate |
| FPR | False Positive Rate |
| TP | True Positive |
| TN | True Negative |
| FP | False Positive |
| FN | False Negative |
| MCC | Matthew Correlation Coefficient |
| NPV | Negative Predictive Value |
| CIs | Confidence Intervals |
References
- Doyle, M.; O’Donnell, A.; Harrington, S.; O’Dwyer, V.; Moore, M. Prevalence of Clinically Significant Refractive Error in Children in Europe: Systematic Review and Meta-Analysis. PLoS ONE 2025, 20, e0335666. [Google Scholar] [CrossRef] [PubMed]
- Tsai, T.-H.; Liu, Y.-L.; Ma, I.-H.; Su, C.-C.; Lin, C.-W.; Lin, L.L.-K.; Hsiao, C.K.; Wang, I.-J. Evolution of the Prevalence of Myopia among Taiwanese Schoolchildren. Ophthalmology 2021, 128, 290–301. [Google Scholar] [CrossRef] [PubMed]
- Pan, C.; Ramamurthy, D.; Saw, S. Worldwide Prevalence and Risk Factors for Myopia. Ophthalmic Physiol. Opt. 2012, 32, 3–16. [Google Scholar] [CrossRef]
- Holden, B.A.; Fricke, T.R.; Wilson, D.A.; Jong, M.; Naidoo, K.S.; Sankaridurg, P.; Wong, T.Y.; Naduvilath, T.J.; Resnikoff, S. Global Prevalence of Myopia and High Myopia and Temporal Trends from 2000 through 2050. Ophthalmology 2016, 123, 1036–1042. [Google Scholar] [CrossRef] [PubMed]
- Flitcroft, D.I. The Complex Interactions of Retinal, Optical and Environmental Factors in Myopia Aetiology. Prog. Retin. Eye Res. 2012, 31, 622–660. [Google Scholar] [CrossRef] [PubMed]
- Ohno-Matsui, K.; Kawasaki, R.; Jonas, J.B.; Cheung, C.M.G.; Saw, S.-M.; Verhoeven, V.J.M.; Klaver, C.C.W.; Moriyama, M.; Shinohara, K.; Kawasaki, Y.; et al. International Photographic Classification and Grading System for Myopic Maculopathy. Am. J. Ophthalmol. 2015, 159, 877–883.e7. [Google Scholar] [CrossRef] [PubMed]
- Jonas, J.B.; Jonas, R.A.; Bikbov, M.M.; Wang, Y.X.; Panda-Jonas, S. Myopia: Histology, Clinical Features, and Potential Implications for the Etiology of Axial Elongation. Prog. Retin Eye Res. 2023, 96, 101156. [Google Scholar] [CrossRef] [PubMed]
- Fricke, T.R.; Jong, M.; Naidoo, K.S.; Sankaridurg, P.; Naduvilath, T.J.; Ho, S.M.; Wong, T.Y.; Resnikoff, S. Global Prevalence of Visual Impairment Associated with Myopic Macular Degeneration and Temporal Trends from 2000 through 2050: Systematic Review, Meta-Analysis and Modelling. Br. J. Ophthalmol. 2018, 102, 855–862. [Google Scholar] [CrossRef] [PubMed]
- Naidoo, K.S.; Fricke, T.R.; Frick, K.D.; Jong, M.; Naduvilath, T.J.; Resnikoff, S.; Sankaridurg, P. Potential Lost Productivity Resulting from the Global Burden of Myopia. Ophthalmology 2019, 126, 338–346. [Google Scholar] [CrossRef] [PubMed]
- Gifford, K.L.; Richdale, K.; Kang, P.; Aller, T.A.; Lam, C.S.; Liu, Y.M.; Michaud, L.; Mulder, J.; Orr, J.B.; Rose, K.A.; et al. IMI – Clinical Management Guidelines Report. Investig. Ophthalmol. Vis. Sci. 2019, 60, M184–M203. [Google Scholar] [CrossRef] [PubMed]
- Flitcroft, D.I.; He, M.; Jonas, J.B.; Jong, M.; Naidoo, K.; Ohno-Matsui, K.; Rahi, J.; Resnikoff, S.; Vitale, S.; Yannuzzi, L. IMI – Defining and Classifying Myopia: A Proposed Set of Standards for Clinical and Epidemiologic Studies. Investig. Ophthalmol. Vis. Sci. 2019, 60, M20. [Google Scholar] [CrossRef] [PubMed]
- Ohno-Matsui, K.; Wu, P.-C.; Yamashiro, K.; Vutipongsatorn, K.; Fang, Y.; Cheung, C.M.G.; Lai, T.Y.Y.; Ikuno, Y.; Cohen, S.Y.; Gaudric, A.; et al. IMI Pathologic Myopia. Invest. Ophthalmol. Vis. Sci. 2021, 62, 5. [Google Scholar] [CrossRef] [PubMed]
- Foo, L.L.; Lim, G.Y.S.; Lanca, C.; Wong, C.W.; Hoang, Q.V.; Zhang, X.J.; Yam, J.C.; Schmetterer, L.; Chia, A.; Wong, T.Y.; et al. Deep Learning System to Predict the 5-Year Risk of High Myopia Using Fundus Imaging in Children. npj Digit. Med. 2023, 6, 1–10. [Google Scholar] [CrossRef] [PubMed]
- Gulshan, V.; Peng, L.; Coram, M.; Stumpe, M.C.; Wu, D.; Narayanaswamy, A.; Venugopalan, S.; Widner, K.; Madams, T.; Cuadros, J.; et al. Development and Validation of a Deep Learning Algorithm for Detection of Diabetic Retinopathy in Retinal Fundus Photographs. JAMA 2016, 316, 2402–2410. [Google Scholar] [CrossRef] [PubMed]
- Ting, D.S.W.; Peng, L.; Varadarajan, A.V.; Keane, P.A.; Burlina, P.M.; Chiang, M.F.; Schmetterer, L.; Pasquale, L.R.; Bressler, N.M.; Webster, D.R.; et al. Deep Learning in Ophthalmology: The Technical and Clinical Considerations. Prog. Retin. Eye Res. 2019, 72, 100759. [Google Scholar] [CrossRef] [PubMed]
- Sengupta, S.; Singh, A.; Leopold, H.A.; Gulati, T.; Lakshminarayanan, V. Ophthalmic Diagnosis Using Deep Learning with Fundus Images – A Critical Review. Artif. Intell. Med. 2020, 102, 101758. [Google Scholar] [CrossRef] [PubMed]
- Li, J.; Wang, L.; Gao, Y.; Liang, Q.; Chen, L.; Sun, X.; Yang, H.; Zhao, Z.; Meng, L.; Xue, S.; et al. Automated Detection of Myopic Maculopathy from Color Fundus Photographs Using Deep Convolutional Neural Networks. Eye Vis. (Lond) 2022, 9, 13. [Google Scholar] [CrossRef] [PubMed]
- Li, M.; Liu, S.; Wang, Z.; Li, X.; Yan, Z.; Zhu, R.; Wan, Z. MyopiaDETR: End-to-End Pathological Myopia Detection Based on Transformer Using 2D Fundus Images. Front Neurosci. 2023, 17, 1130609. [Google Scholar] [CrossRef] [PubMed]
- Varadarajan, A.V.; Poplin, R.; Blumer, K.; Angermueller, C.; Ledsam, J.; Chopra, R.; Keane, P.A.; Corrado, G.S.; Peng, L.; Webster, D.R. Deep Learning for Predicting Refractive Error From Retinal Fundus Images. Investig. Ophthalmol. Vis. Sci. 2018, 59, 2861–2868. [Google Scholar] [CrossRef] [PubMed]
- Roboflow: Computer Vision Tools for Developers and Enterprises. Available online: https://roboflow.com/ (accessed on 13 June 2024).
- Rizzieri, N.; Dall’Asta, L.; Ozoliņš, M. Myopia Detection from Eye Fundus Images: New Screening Method Based on You Only Look Once Version 8. Appl. Sci. 2024, 14, 11926. [Google Scholar] [CrossRef]
- Sapkota, R.; Meng, Z.; Churuvija, M.; Du, X.; Ma, Z.; Karkee, M. Comprehensive Performance Evaluation of YOLOv12, YOLO11, YOLOv10, YOLOv9 and YOLOv8 on Detecting and Counting Fruitlet in Complex Orchard Environments 2025. [CrossRef] [PubMed]
- Sapkota, R.; Flores-Calero, M.; Qureshi, R.; Badgujar, C.; Nepal, U.; Poulose, A.; Zeno, P.; Vaddevolu, U.B.P.; Khan, S.; Shoman, M.; et al. YOLO Advances to Its Genesis: A Decadal and Comprehensive Review of the You Only Look Once (YOLO) Series. Artif. Intell. Rev. 2025, 58. [Google Scholar] [CrossRef]
- Ultralytics YOLOv8 | State-of-the-Art Vision AI. Available online: https://www.ultralytics.com/yolo (accessed on 18 June 2024).
- Terven, J.; Córdova-Esparza, D.-M.; Romero-González, J.-A. A Comprehensive Review of YOLO Architectures in Computer Vision: From YOLOv1 to YOLOv8 and YOLO-NAS. Mach. Learn. Knowl. Extr. 2023, 5, 1680–1716. [Google Scholar] [CrossRef]
- Zheng, Z.; Wang, P.; Liu, W.; Li, J.; Ye, R.; Ren, D. Distance-IoU Loss: Faster and Better Learning for Bounding Box Regression. Proc. AAAI Conf. Artif. Intell. 2020, 34, 12993–13000. [Google Scholar] [CrossRef]
- Jocher, G.; Qiu, J.; Chaurasia, A. Ultralytics YOLO 2023. [CrossRef] [PubMed]
- Ultralytics YOLO11 🚀 NUOVO. Available online: https://docs.ultralytics.com/it/models/yolo11 (accessed on 27 June 2025).
- Selvaraju, R.R.; Cogswell, M.; Das, A.; Vedantam, R.; Parikh, D.; Batra, D. Grad-CAM: Visual Explanations from Deep Networks via Gradient-Based Localization. In Proceedings of the 2017 IEEE International Conference on Computer Vision (ICCV), October 2017; pp. 618–626. [Google Scholar]
- Harris, C.R.; Millman, K.J.; Van Der Walt, S.J.; Gommers, R.; Virtanen, P.; Cournapeau, D.; Wieser, E.; Taylor, J.; Berg, S.; Smith, N.J.; et al. Array Programming with NumPy. Nature 2020, 585, 357–362. [Google Scholar] [CrossRef] [PubMed]
- Santos, C.; Aguiar, M.; Welfer, D.; Belloni, B. A New Approach for Detecting Fundus Lesions Using Image Processing and Deep Neural Network Architecture Based on YOLO Model. Sensors 2022, 22, 6441. [Google Scholar] [CrossRef] [PubMed]
- Chicco, D.; Jurman, G. The Matthews Correlation Coefficient (MCC) Should Replace the ROC AUC as the Standard Metric for Assessing Binary Classification. BioData Min. 2023, 16. [Google Scholar] [CrossRef] [PubMed]
- Monaghan, T.F.; Rahman, S.N.; Agudelo, C.W.; Wein, A.J.; Lazar, J.M.; Everaert, K.; Dmochowski, R.R. Foundational Statistical Principles in Medical Research: Sensitivity, Specificity, Positive Predictive Value, and Negative Predictive Value. Medicina 2021, 57, 503. [Google Scholar] [CrossRef] [PubMed]
- Qi, Z.; Li, T.; Chen, J.; Yam, J.C.; Wen, Y.; Huang, G.; Zhong, H.; He, M.; Zhu, D.; Dai, R.; et al. A Deep Learning System for Myopia Onset Prediction and Intervention Effectiveness Evaluation in Children. npj Digit. Med. 2024, 7, 1–10. [Google Scholar] [CrossRef] [PubMed]
- Valliani, A.A.; Gulamali, F.F.; Kwon, Y.J.; Martini, M.L.; Wang, C.; Kondziolka, D.; Chen, V.J.; Wang, W.; Costa, A.B.; Oermann, E.K. Deploying Deep Learning Models on Unseen Medical Imaging Using Adversarial Domain Adaptation. PLoS ONE 2022, 17, e0273262. [Google Scholar] [CrossRef] [PubMed]
- Kang, M.-T.; Hu, Y.; Wang, N.; Fu, J.; Zhou, A.; Liu, Y.; Meng, H.; Li, X.; Wang, S.; Chen, X.; et al. Deep Learning Prediction of Childhood Myopia Progression Using Fundus Image and Refraction Data. JAMA Netw. Open 2026, 9, e2553543–e2553543. [Google Scholar] [CrossRef] [PubMed]
- Varoquaux, G.; Cheplygina, V. Machine Learning for Medical Imaging: Methodological Failures and Recommendations for the Future. npj Digit Med. 2022, 5, 48. [Google Scholar] [CrossRef] [PubMed]
- Zech, J.R.; Badgeley, M.A.; Liu, M.; Costa, A.B.; Titano, J.J.; Oermann, E.K. Variable Generalization Performance of a Deep Learning Model to Detect Pneumonia in Chest Radiographs: A Cross-Sectional Study. PLoS Med. 2018, 15, e1002683. [Google Scholar] [CrossRef] [PubMed]
- Rice, L.; Wong, E.; Kolter, J.Z. Overfitting in Adversarially Robust Deep Learning 2020. [CrossRef] [PubMed]
- Akut, R.R. FILM: Finding the Location of Microaneurysms on the Retina. Biomed. Eng. Lett. 2019, 9, 497–506. [Google Scholar] [CrossRef] [PubMed]
- Saha, S.; Vignarajan, J.; Frost, S. A Fast and Fully Automated System for Glaucoma Detection Using Color Fundus Photographs. Sci. Rep. 2023, 13, 18408. [Google Scholar] [CrossRef] [PubMed]
Figure 1.
ROC curves and AUC values for YOLOv8-n and YOLOv11-s.
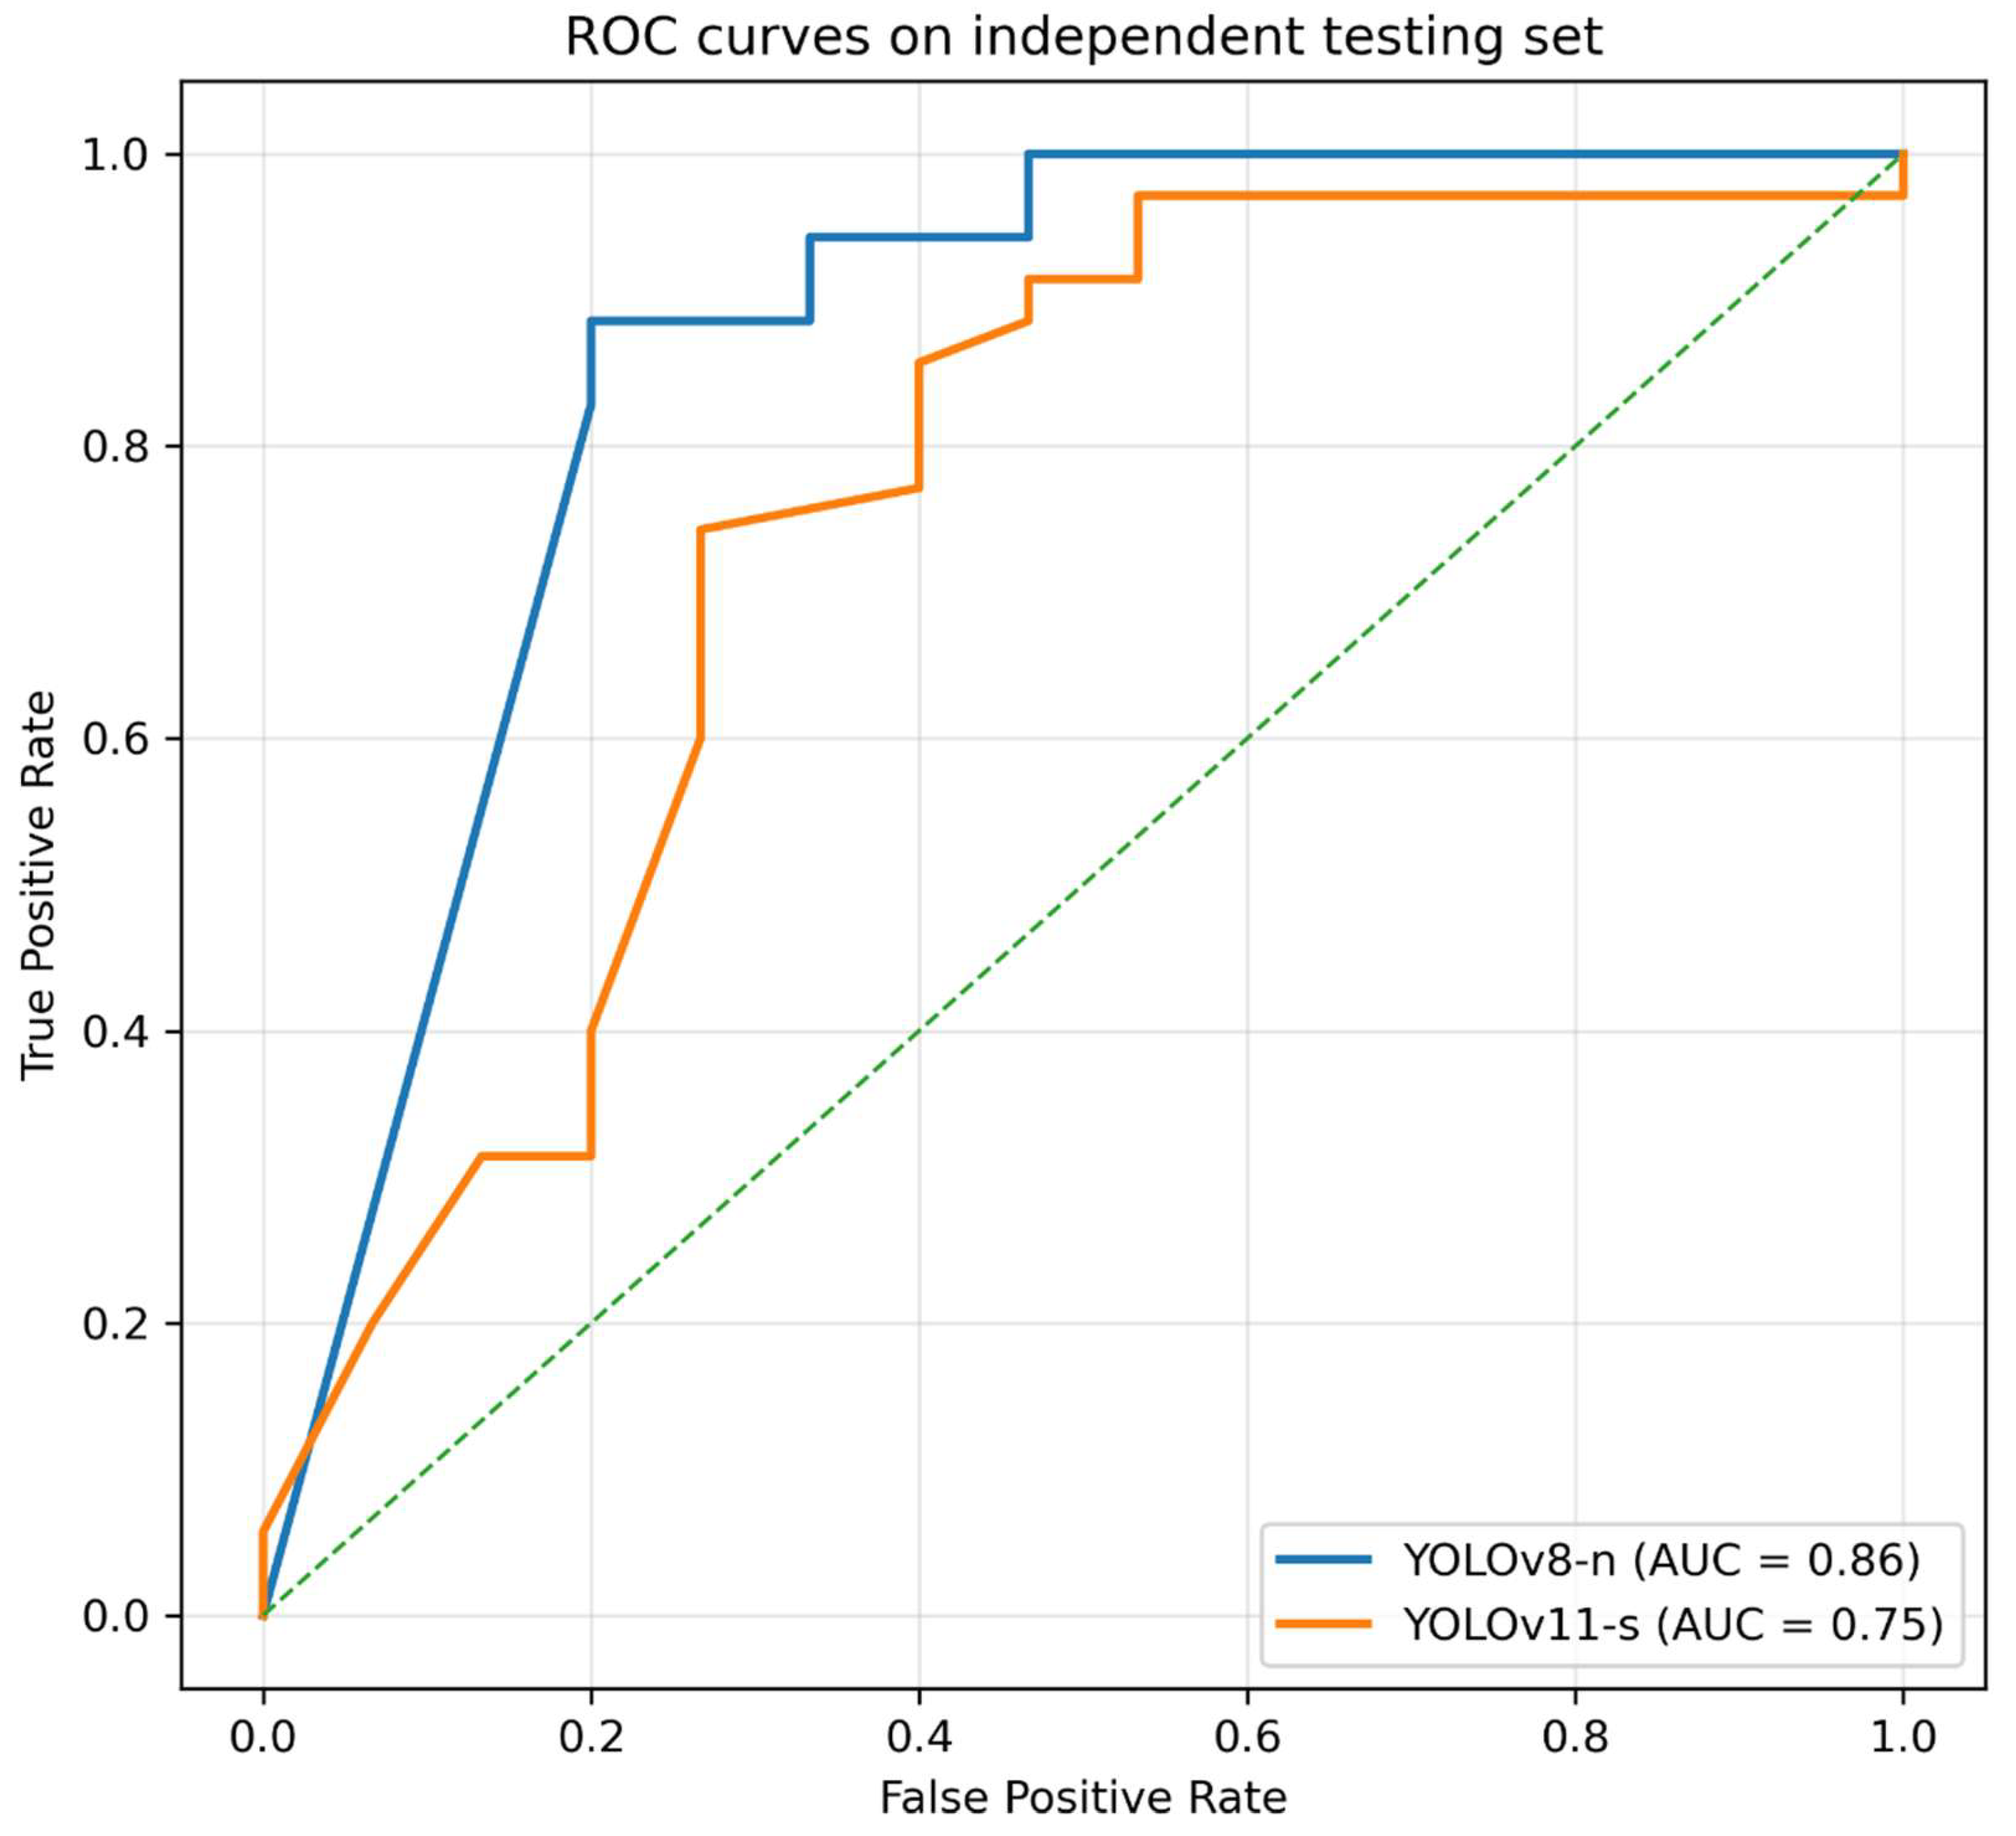
Figure 2.
ROC curves for YOLOv8 and YOLOv11 best models compared to Clinical Consensus. AUC values are depicted in the bottom right corner.
Figure 2.
ROC curves for YOLOv8 and YOLOv11 best models compared to Clinical Consensus. AUC values are depicted in the bottom right corner.
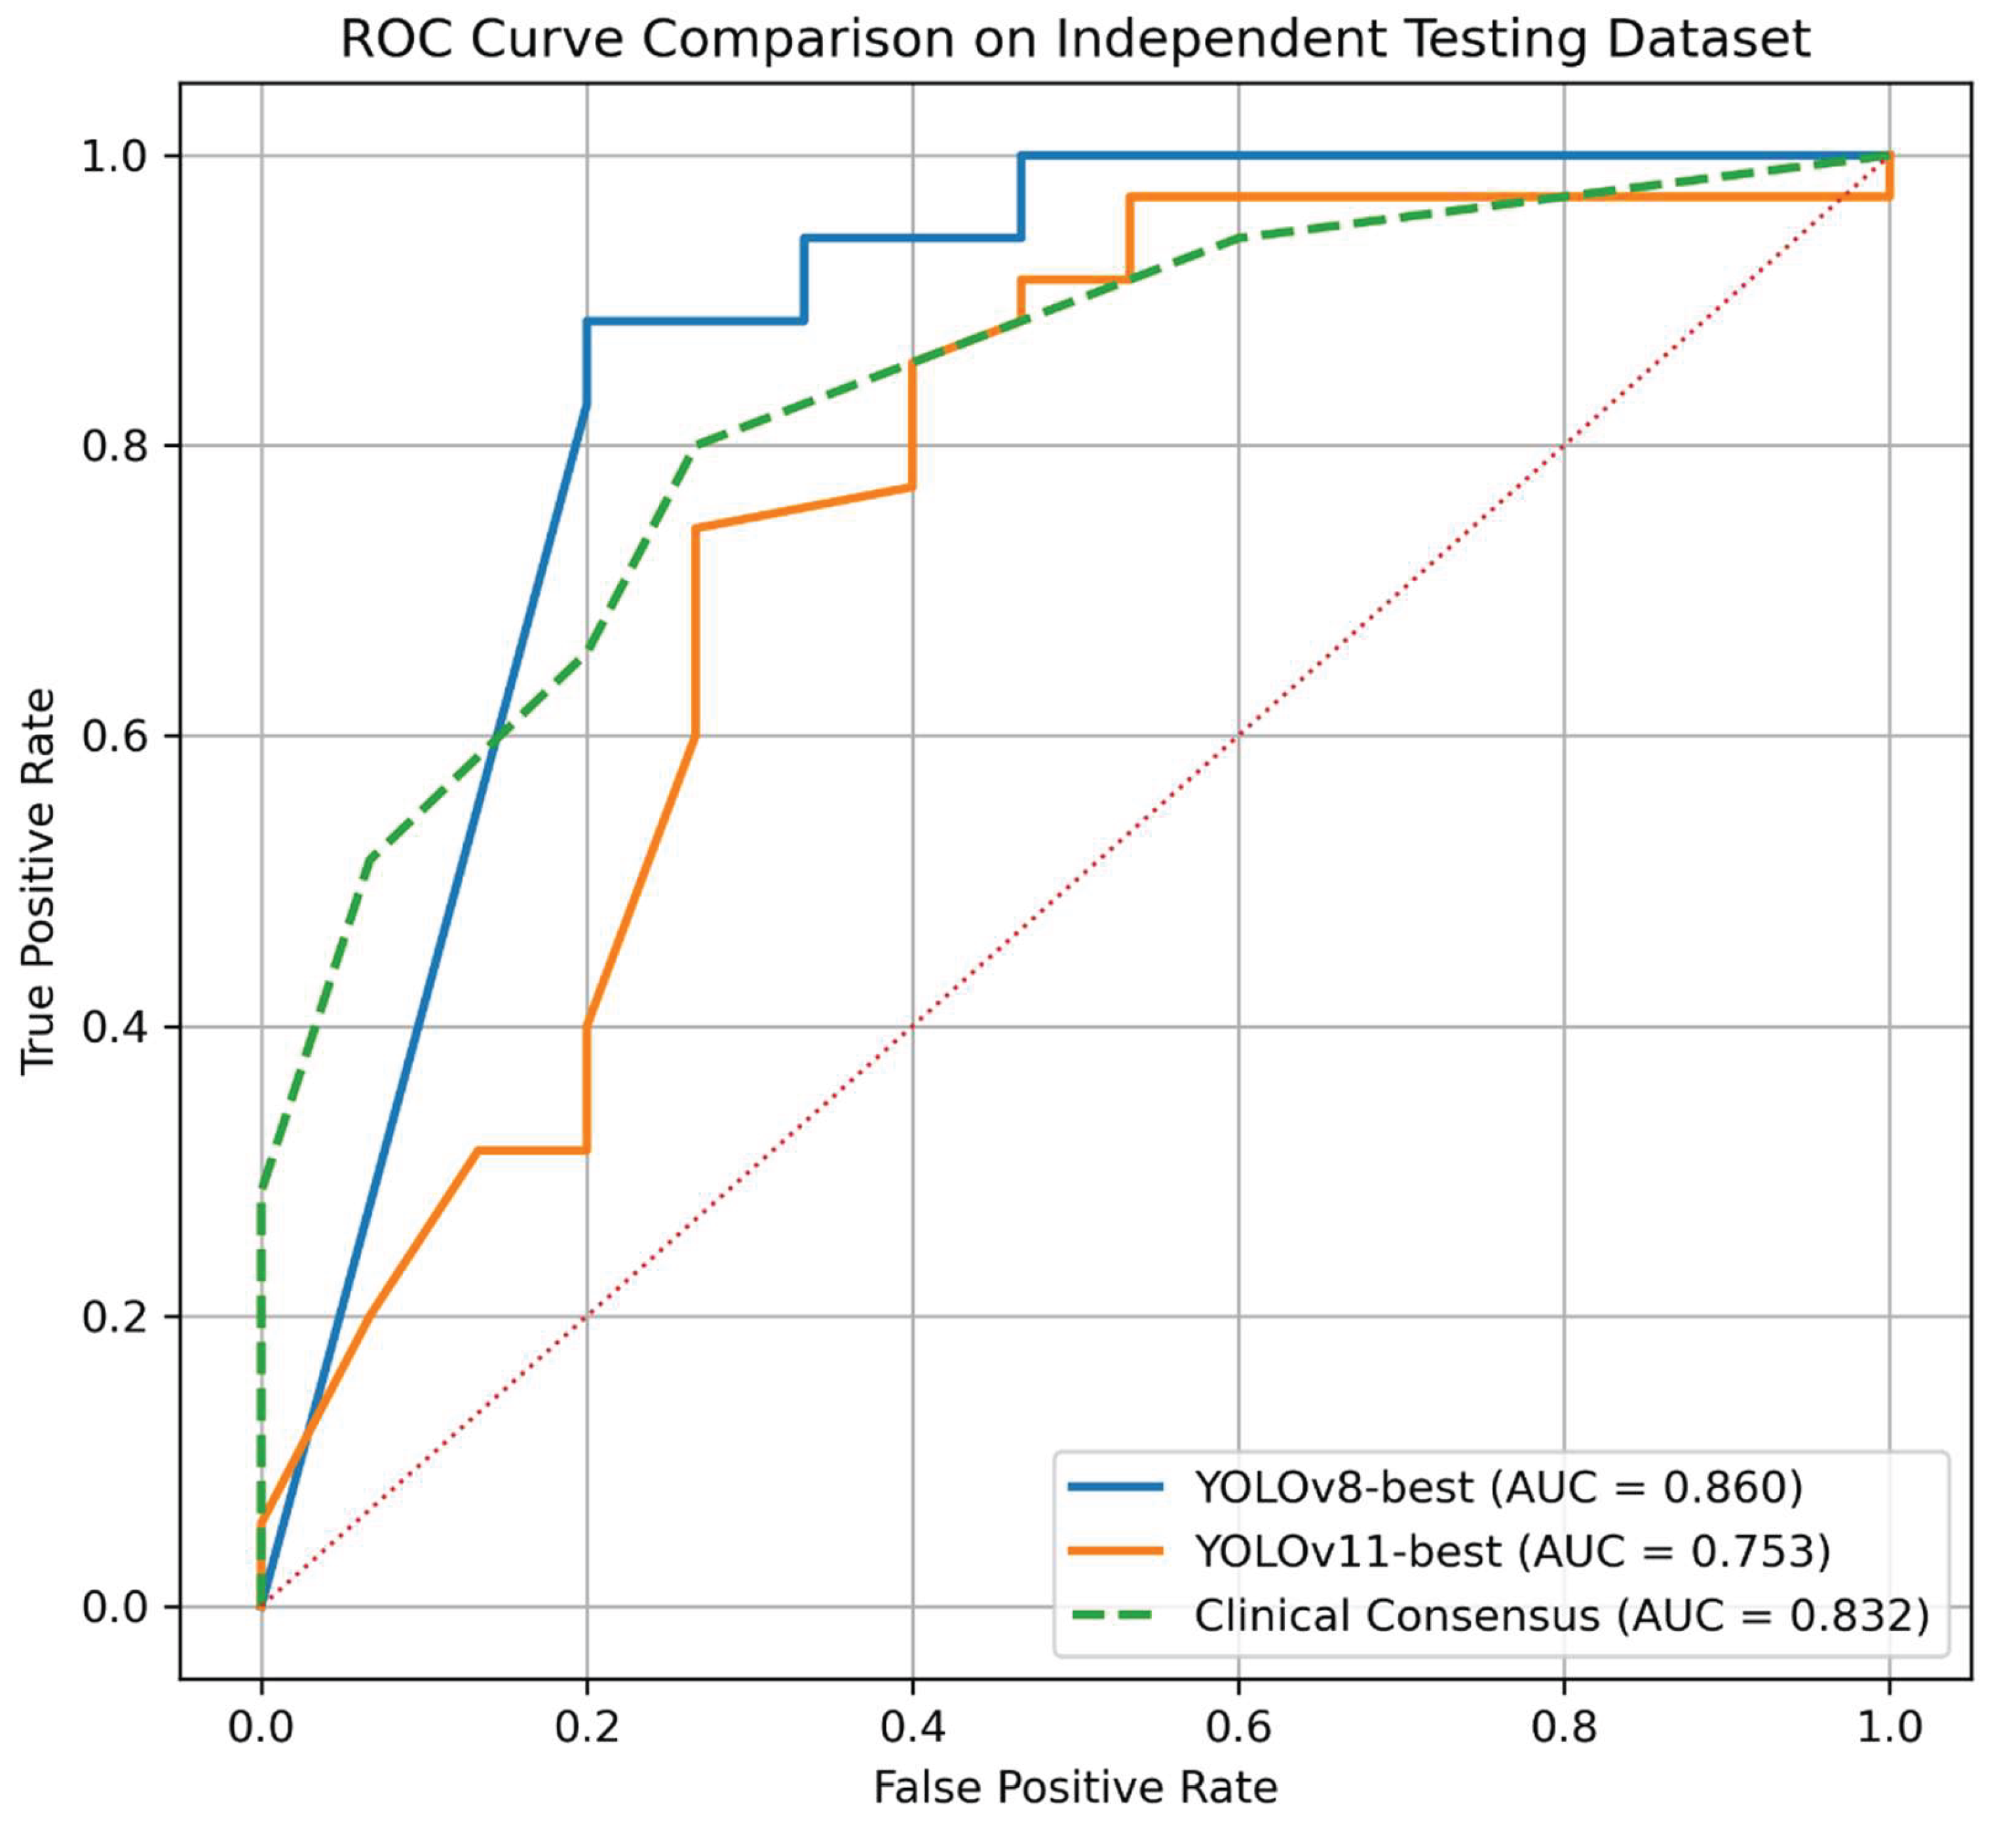

Table 1.
Performance of YOLOv8 and YOLOv11 models on the internal validation dataset (mean and 95% bootstrap CIs).
Table 1.
Performance of YOLOv8 and YOLOv11 models on the internal validation dataset (mean and 95% bootstrap CIs).
| Model | Accuracy | Sensitivity | Specificity | Precision | NPV | F1-score | MCC |
|---|---|---|---|---|---|---|---|
| YOLOv11-l | 0.812 (0.738–0.875) | 0.934 (0.867–0.983) | 0.446 (0.250–0.650) | 0.836 (0.784–0.892) | 0.698 (0.455–0.917) | 0.882 (0.833–0.923) | 0.448 (0.192–0.667) |
| YOLOv11-m | 0.787 (0.700–0.863) | 0.899 (0.817–0.967) | 0.451 (0.250–0.700) | 0.832 (0.778–0.893) | 0.605 (0.385–0.833) | 0.864 (0.809–0.913) | 0.390 (0.144–0.617) |
| YOLOv11-n | 0.863 (0.788–0.938) | 0.918 (0.850–0.983) | 0.699 (0.500–0.900) | 0.902 (0.841–0.963) | 0.745 (0.577–0.929) | 0.909 (0.860–0.958) | 0.631 (0.420–0.829) |
| YOLOv11-s | 0.799 (0.725–0.875) | 0.916 (0.833–0.983) | 0.450 (0.250–0.650) | 0.834 (0.783–0.889) | 0.647 (0.429–0.889) | 0.872 (0.820–0.919) | 0.417 (0.189–0.646) |
| YOLOv11-xl | 0.763 (0.750–0.788) | 1.000 (1.000–1.000) | 0.050 (0.000–0.150) | 0.760 (0.750–0.779) | 0.000 (0.000–0.000) | 0.863 (0.857–0.876) | 0.000 (0.000–0.000) |
| YOLOv8-l | 0.813 (0.738–0.888) | 0.884 (0.800–0.950) | 0.601 (0.400–0.800) | 0.870 (0.812–0.932) | 0.639 (0.471–0.833) | 0.876 (0.821–0.927) | 0.496 (0.267–0.705) |
| YOLOv8-m | 0.849 (0.775–0.925) | 0.916 (0.833–0.983) | 0.649 (0.450–0.850) | 0.888 (0.831–0.948) | 0.727 (0.545–0.917) | 0.901 (0.847–0.949) | 0.588 (0.372–0.794) |
| YOLOv8-n | 0.850 (0.763–0.925) | 0.882 (0.800–0.950) | 0.751 (0.550–0.950) | 0.915 (0.855–0.980) | 0.686 (0.524–0.857) | 0.898 (0.838–0.949) | 0.617 (0.420–0.800) |
| YOLOv8-s | 0.825 (0.750–0.900) | 0.933 (0.867–0.983) | 0.503 (0.300–0.700) | 0.850 (0.794–0.906) | 0.720 (0.500–0.929) | 0.889 (0.841–0.935) | 0.497 (0.243–0.722) |
| YOLOv8-xl | 0.875 (0.813–0.938) | 0.983 (0.950–1.000) | 0.550 (0.350–0.750) | 0.868 (0.814–0.923) | 0.919 (0.733–1.000) | 0.922 (0.885–0.959) | 0.646 (0.434–0.829) |
Values are reported as mean (95% CI). CIs were estimated using bootstrap resampling with 2,000 iterations.
Table 2.
Pairwise bootstrap comparison between YOLOv8 and YOLOv11 models on the internal validation dataset for sensitivity and MCC (mean difference and 95% Cis).
Table 2.
Pairwise bootstrap comparison between YOLOv8 and YOLOv11 models on the internal validation dataset for sensitivity and MCC (mean difference and 95% Cis).
| Metric | Scale | Mean difference (YOLOv8 − YOLOv11) | Adjusted p-value | Significant |
|---|---|---|---|---|
| Sensitivity | n | 0.034 (0.000–0.083) | 1.572 | No |
| Sensitivity | s | −0.016 (−0.050–0.000) | 2.205 | No |
| Sensitivity | m | −0.016 (−0.050–0.000) | 1.484 | No |
| Sensitivity | l | 0.050 (0.000–0.117) | 0.752 | No |
| Sensitivity | xl | 0.016 (0.000–0.050) | 2.936 | No |
| MCC | n | 0.014 (−0.091–0.115) | 0.827 | No |
| MCC | s | −0.076 (−0.200–0.000) | 1.715 | No |
| MCC | m | −0.198 (−0.366–−0.046) | 0.063 | No |
| MCC | l | −0.043 (−0.223–0.112) | 3.125 | No |
| MCC | xl | — | 0.000 | Yes* |
Mean differences are reported as YOLOv8 minus YOLOv11 at the same model scale. CIs were obtained using paired bootstrap resampling (2,000 iterations). P-values were adjusted for multiple comparisons using the Holm–Bonferroni method. Statistical significance was defined as adjusted p < 0.05.
Table 3.
Performance of YOLOv8 and YOLOv11 models on the independent test dataset (mean and 95% bootstrap CIs).
Table 3.
Performance of YOLOv8 and YOLOv11 models on the independent test dataset (mean and 95% bootstrap CIs).
| Model | Accuracy | Sensitivity | Specificity | Precision | NPV | F1 | MCC | AUC |
|---|---|---|---|---|---|---|---|---|
| YOLOv11-n | 0.840 (0.740 - 0.920) | 0.829 (0.694 - 0.941) | 0.867 (0.667 - 1.000) | 0.935 (0.833 - 1.000) | 0.684 (0.455 - 0.867) | 0.879 (0.784 - 0.946) | 0.656 (0.429 - 0.840) | 0.889 (0.792 - 0.961) |
| YOLOv11-s | 0.800 (0.680 - 0.900) | 0.971 (0.903 - 1.000) | 0.400 (0.154 - 0.647) | 0.791 (0.667 - 0.907) | 0.857 (0.500 - 1.000) | 0.872 (0.785 - 0.943) | 0.491 (0.202 - 0.719) | 0.753 (0.573 - 0.901) |
| YOLOv11-m | 0.780 (0.660 - 0.880) | 0.943 (0.857 - 1.000) | 0.400 (0.154 - 0.667) | 0.786 (0.652 - 0.900) | 0.75 (0.400 - 1.000) | 0.857 (0.765 - 0.929) | 0.429 (0.113 - 0.695) | 0.852 (0.722 - 0.959) |
| YOLOv11-l | 0.760 (0.640 - 0.860) | 0.943 (0.853 - 1.000) | 0.333 (0.105 - 0.579) | 0.767 (0.628 - 0.886) | 0.714 (0.333 - 1.000) | 0.846 (0.747 - 0.921) | 0.365 (0.054 - 0.626) | 0.709 (0.530 - 0.865) |
| YOLOv11-xl | 0.700 (0.560 - 0.820) | 1.000 (1.000 - 1.000) | 0.000 (0.000 - 0.000) | 0.700 (0.560 - 0.820) | 0.000 (0.000 - 0.000) | 0.824 (0.718 - 0.901) | 0.000 (0.000 - 0.000) | 0.600 (0.442 - 0.759) |
| YOLOv8-n | 0.840 (0.740 - 0.940) | 0.943 (0.853 - 1.000) | 0.600 (0.333 - 0.857) | 0.846 (0.730 - 0.949) | 0.818 (0.571 - 1.000) | 0.892 (0.806 - 0.960) | 0.601 (0.335 - 0.832) | 0.86 (0.725 - 0.969) |
| YOLOv8-s | 0.760 (0.640 - 0.880) | 0.829 (0.697 - 0.941) | 0.600 (0.333 - 0.846) | 0.829 (0.692 - 0.943) | 0.600 (0.333 - 0.833) | 0.829 (0.716 - 0.914) | 0.429 (0.134 - 0.693) | 0.778 (0.620 - 0.912) |
| YOLOv8-m | 0.800 (0.680 - 0.900) | 0.829 (0.687 - 0.946) | 0.733 (0.500 - 0.938) | 0.879 (0.750 - 0.972) | 0.647 (0.400 - 0.882) | 0.853 (0.746 - 0.935) | 0.544 (0.274 - 0.783) | 0.806 (0.653 - 0.941) |
| YOLOv8-l | 0.760 (0.640 - 0.880) | 0.857 (0.735 - 0.970) | 0.533 (0.273 - 0.800) | 0.811 (0.683 - 0.925) | 0.615 (0.333 - 0.889) | 0.833 (0.727 - 0.917) | 0.408 (0.099 - 0.669) | 0.826 (0.700 - 0.926) |
| YOLOv8-xl | 0.760 (0.640 - 0.880) | 1.000 (1.000 - 1.000) | 0.200 (0.000 - 0.429) | 0.745 (0.622 - 0.861) | 1.000 (0.000 - 1.000) | 0.854 (0.767 - 0.925) | 0.386 (0.000 - 0.593) | 0.827 (0.694 - 0.940) |
Values are reported as mean (95% CI). CIs were estimated using bootstrap resampling with 2,000 iterations.
Table 4.
Paired McNemar test results comparing YOLO models with clinical consensus on the independent test set.
Table 4.
Paired McNemar test results comparing YOLO models with clinical consensus on the independent test set.
| Comparison | b | c | McNemar | p-value |
|---|---|---|---|---|
| YOLOv8-n vs Consensus | 9 | 10 | 9.0 | 1.000 |
| YOLOv11-s vs Consensus | 0 | 35 | 0.0 | <0.001 |
b indicates cases correctly classified by the AI model but misclassified by the clinical consensus, and c indicates cases misclassified by the AI model but correctly classified by the clinical consensus. Clinical consensus, defined using majority voting (at least three concordant classifications out of five).
Table 5.
Diagnostic performance of the two selected YOLO models and expert ophthalmologists on the independent test set.
Table 5.
Diagnostic performance of the two selected YOLO models and expert ophthalmologists on the independent test set.
| Method | Sensitivity | Specificity | Precision | F1-score | MCC | AUC |
|---|---|---|---|---|---|---|
| YOLOv8-n | 0.943 | 0.600 | 0.846 | 0.892 | 0.600 | 0.860 |
| YOLOv11-s | 0.972 | 0.400 | 0.791 | 0.872 | 0.491 | 0.753 |
| Clinical consensus | 0.657 | 0.800 | 0.885 | 0.754 | 0.420 | 0.832 |
Clinical consensus, defined using majority voting (at least three concordant classifications out of five).
Disclaimer/Publisher’s Note: The statements, opinions and data contained in all publications are solely those of the individual author(s) and contributor(s) and not of MDPI and/or the editor(s). MDPI and/or the editor(s) disclaim responsibility for any injury to people or property resulting from any ideas, methods, instructions or products referred to in the content. |
© 2026 by the authors. Licensee MDPI, Basel, Switzerland. This article is an open access article distributed under the terms and conditions of the Creative Commons Attribution (CC BY) license (http://creativecommons.org/licenses/by/4.0/).
Copyright: This open access article is published under a Creative Commons CC BY 4.0 license, which permit the free download, distribution, and reuse, provided that the author and preprint are cited in any reuse.


